Article

Revealing the Spatiotemporal Changes in Land Use and Landscape Patterns and Their Effects on Ecosystem Services: A Case Study in the Western Sichuan Urban Agglomeration, China

1
College of Geography and Planning, Chengdu University of Technology, Chengdu 610059, China
2
Ministry of Education Key Laboratory for Earth System Modeling, Department of Earth System Science, Institute for Global Change Studies, Tsinghua University, Beijing 100084, China
3
School of Emergency Management, Xihua University, Chengdu 610039, China
4
School of Surveying Engineering and Environment, Henan Polytechnic Institute, Nanyang 473009, China
*
Author to whom correspondence should be addressed.
Land 2025, 14(5), 1012; https://doi.org/10.3390/land14051012
Submission received: 10 March 2025 / Revised: 22 April 2025 / Accepted: 2 May 2025 / Published: 7 May 2025

Abstract

:
Land use change significantly influences landscape pattern adjustments, thereby altering ecosystem functions and service flows, ultimately impacting ecosystem service value (ESV). However, previous studies have often examined the impacts of land use change and landscape patterns on ecosystem services from a one-dimensional perspective, overlooking the complex interactions among these factors. This study proposes a “process–structure–value” response framework and applies it to a case study of the western Sichuan urban agglomeration. Its aim is to identify the spatial and temporal characteristics of land use and landscape pattern evolution. Additionally, it quantitatively evaluates the synergistic effects of these changes on ESV evolution from 2000 to 2020 using a correlation analysis. The results show that, over the past 20 years, the study area experienced a significant expansion of construction land by 184,729.41 hm2, leading to the dispersion and fragmentation of arable land, grassland, and waters, resulting in an overall trend of fragmentation and diversification in landscape patterns. The ESV increased by CNY 2.619 billion, primarily due to the increased ESV associated with forest land and waters. This study found that the synergistic effects of land use processes and landscape pattern structures significantly enhanced ESV. The transition from construction land and arable land to forest land and waters notably improved the ESV. Meanwhile, increased landscape diversity and patch connectivity further enhanced the ecosystem service function. Furthermore, the ecological environment of the study area remained vulnerable despite the increased ESV. Overall, the results highlight the significant correlation between changes in land use processes, landscape patterns, and ESV, emphasizing the necessity of integrating the “process–structure–value” framework in future research to comprehensively assess the responses of land use and landscape patterns to ESV, providing a more comprehensive reference for land use planning and policy development.

Graphical Abstract

1. Introduction

Ecosystem services (ESs) encompass all of the benefits that humans derive from ecosystems and are commonly categorized into provisioning, regulating, supporting, and cultural services. Provisioning services include the supply of food, water, and timber, whereas regulating services involve climate regulation, water purification, and pest control. Supporting services encompass essential ecological processes such as soil formation and nutrient cycling, while cultural services offer recreational opportunities, tourism benefits, and spiritual enrichment [1]. These ESs serve as fundamental environmental prerequisites for human survival and societal development [2]. ESs are significantly influenced by changes in land use. Driven by the rapid expansion of the global economy and population growth, urbanization and the proliferation of human settlements have intensified land overuse. This has adversely affected on climate regulation, biodiversity conservation, habitat protection, and soil and water conservation [3], ultimately culminating in environmental degradation [4]. Changes in the spatial configuration of land use can induce structural alterations in landscape composition, leading to fragmentation, reduced habitat connectivity, biodiversity loss, and increased risks of migration corridor disruption and habitat degradation, thereby undermining ESs. In recent years, there has been a growing research focus on mitigating the decline of ESs [5,6,7]. Studies have suggested that optimizing land use and landscape configuration can significantly enhance the sustainable provision of ESs [8,9]. Therefore, understanding the synergistic effects of land use dynamics and landscape patterns on ESs is crucial for optimizing landscape configurations and improving the provision of ecosystem service value (ESV).
Regional land use change has garnered considerable attention in international ecological and environmental research [10,11]. Land use change serves as a key indicator of the profound impact of human activities on the natural environment. Studies have indicated that land use change is a major driver of changes in terrestrial ESV [12,13]. By altering surface physical parameters, land use change affects ecological processes and ecosystem structures, leading to substantial shifts in ESs [14,15,16]. Monetizing ESs not only reveals the effects of land use change, but also facilitates the tracking of ES dynamics, thereby providing essential feedback for landscape planning. Consequently, assessing the impacts of land use change on ESs has become a focal point in global ecological and environmental research, drawing growing scholarly attention to its influence on ESV. Research indicates that land use change primarily affects ESV through multiple dimensions, including land use type, intensity, and landscape configuration [17,18,19,20]. For example, Han et al. [21] explored the effects of land use type changes on ESV, emphasizing the redistribution of ESV among various land categories. Zhong et al. [22], employing a spatiotemporal regression model, demonstrated a significant relationship between landscape pattern indices and ESV, highlighting the positive impacts of improved landscape connectivity and increased diversity. Zhang et al. [23] examined the impact of land use changes on ESV in Ezhou City, utilizing the Markov-FLUS model to simulate future land use and ESV trajectories under various scenarios. Existing research predominantly investigates the effects of land use types or landscape configurations on ESV in isolation. However, such one-dimensional approaches often overlook the interdependencies between land use types and landscape structures, thereby limiting the ability to comprehensively understand their complex and multifaceted impacts on ESV [24,25]. A systematic framework is thus required to thoroughly investigate their interrelationships and underlying impact mechanisms. To bridge this gap, this study proposes the “process–structure–value” theoretical framework, which integrates land use processes, landscape patterns, and ESV to analyze their spatiotemporal dynamics and interdependent responses. This framework offers a novel pathway to mitigating ESV degradation, refining urban landscape planning, enhancing ecological conservation, and promoting sustainable development.
The evaluation of ESV has emerged as a primary focus in sustainable development research. The assessment methods have been progressively improved and can be broadly categorized into methods based on raw data and unitary values [20,26,27]. Raw data-based methods, including productivity methods, travel cost methods, carbon tax methods, and biophysical modeling efforts, provide valuable insights for decision-making and environmental management by calculating ESV directly from the analysis of raw data [28,29]. While these methods apply to small-scale regions or single ecosystems, their complex input parameters and assessment processes limit their applicability for large-scale and long-term dynamic valuation, thereby hindering the standardization of assessment methods [30,31]. Among these methods, the equivalent factor approach for value assessment is the most widely used [32,33]. This approach is suitable for large-scale evaluations, as it better reflects accurate ESV and more clearly identifies spatiotemporal trends in service value. Costanza et al. [1] established a classification framework and valuation system for ESs on a global scale, highlighting the importance of converting ESV into monetary units, which subsequently garnered international attention to ESV and ecological assets. In 1999, Ouyang et al. [34] conducted the first comprehensive evaluation of terrestrial ecosystem services in China. Subsequently, in 2008, Xie et al. [35] developed a unit area equivalent table for the value of TES in China by revising the research outcomes of Costanza et al. [1]. Drawing on the expertise and input of Chinese researchers and adapted to local conditions, this work assigns monetary values to the various ESs provided by China’s ecosystems. However, the applicability of ecosystem service equivalent factors can be influenced by geographic, social, and cultural contexts. The value of the same ES differs under different regional background conditions, and the generalized equivalent factor is unable to fully capture this variation [36]. To address this challenge and enhance assessment accuracy, more studies have begun to examine the specific impacts of land use change on ESV. Scholars employ case studies and refined equivalent factor methods to explore the regional heterogeneity of these effects. Recent studies [7,21,37,38,39,40] have yielded significant findings at global, national, and regional scales. Xiao et al. [27] focused on quantifying the impact of land use changes on ESV in the ecologically vulnerable Aksu River Basin located in the arid region of northwest China. Ocloo et al. [41] examined the spatial dynamics of land use and landscape patterns in Ghana, West Africa, from 1995 to 2020 and their implications for ESs. Zhang et al. [42] used adjusted value coefficients to assess ESV and quantified the critical relationship between land use change and the dynamics of ESV. Although urban agglomerations are a key scale for studying urbanization and land use change, their impact on ESs, especially in mountainous regions where human–environment conflicts are more pronounced, has received limited attention.
The Western Sichuan Urban Agglomeration (WSUA), a typical mountainous urban cluster, plays a crucial role in ecological functions; its complex topography and resource endowments exacerbate environmental pressures. As economic development and urbanization have progressed rapidly, land use patterns have undergone significant changes, resulting in increased pressure on land resources, intensified landscape fragmentation, and ecological issues such as biodiversity loss and soil erosion. These changes have not only had a profound impact on ESV, but have also exacerbated regional ecological vulnerability, thereby restricting sustainable development. In addition, the WSUA, as the economic core of Sichuan Province and a typical region experiencing rapid urbanization, serves as an important development hub in Southwest China. The conflict between urban expansion and the ecological environment is particularly evident during rapid urbanization, making the WSUA a highly representative case [43]. Hence, this study adopts the “process–structure–value” interdisciplinary evaluation framework to systematically examine how land use changes drive the evolution of landscape patterns and influence ESV from a theoretical perspective. The specific research objectives are as follows: (1) to systematically quantify the mechanisms through which land use changes in the WSUA influence the dynamic evolution of landscape patterns; (2) to assess ESV changes in the WSUA; (3) to construct a comprehensive model based on the “process–structure–value” theory and explore how land use processes and landscape patterns jointly drive the spatiotemporal dynamics of ESV; and (4) to identify key land use processes and landscape pattern characteristics that impact ESV and propose targeted strategies to enhance it. Identifying key land use and landscape pattern features that affect ESV in the WSUA will provide a theoretical basis for localized ecological restoration, construction, and management in mountainous urban agglomerations.

2. Materials and Methods
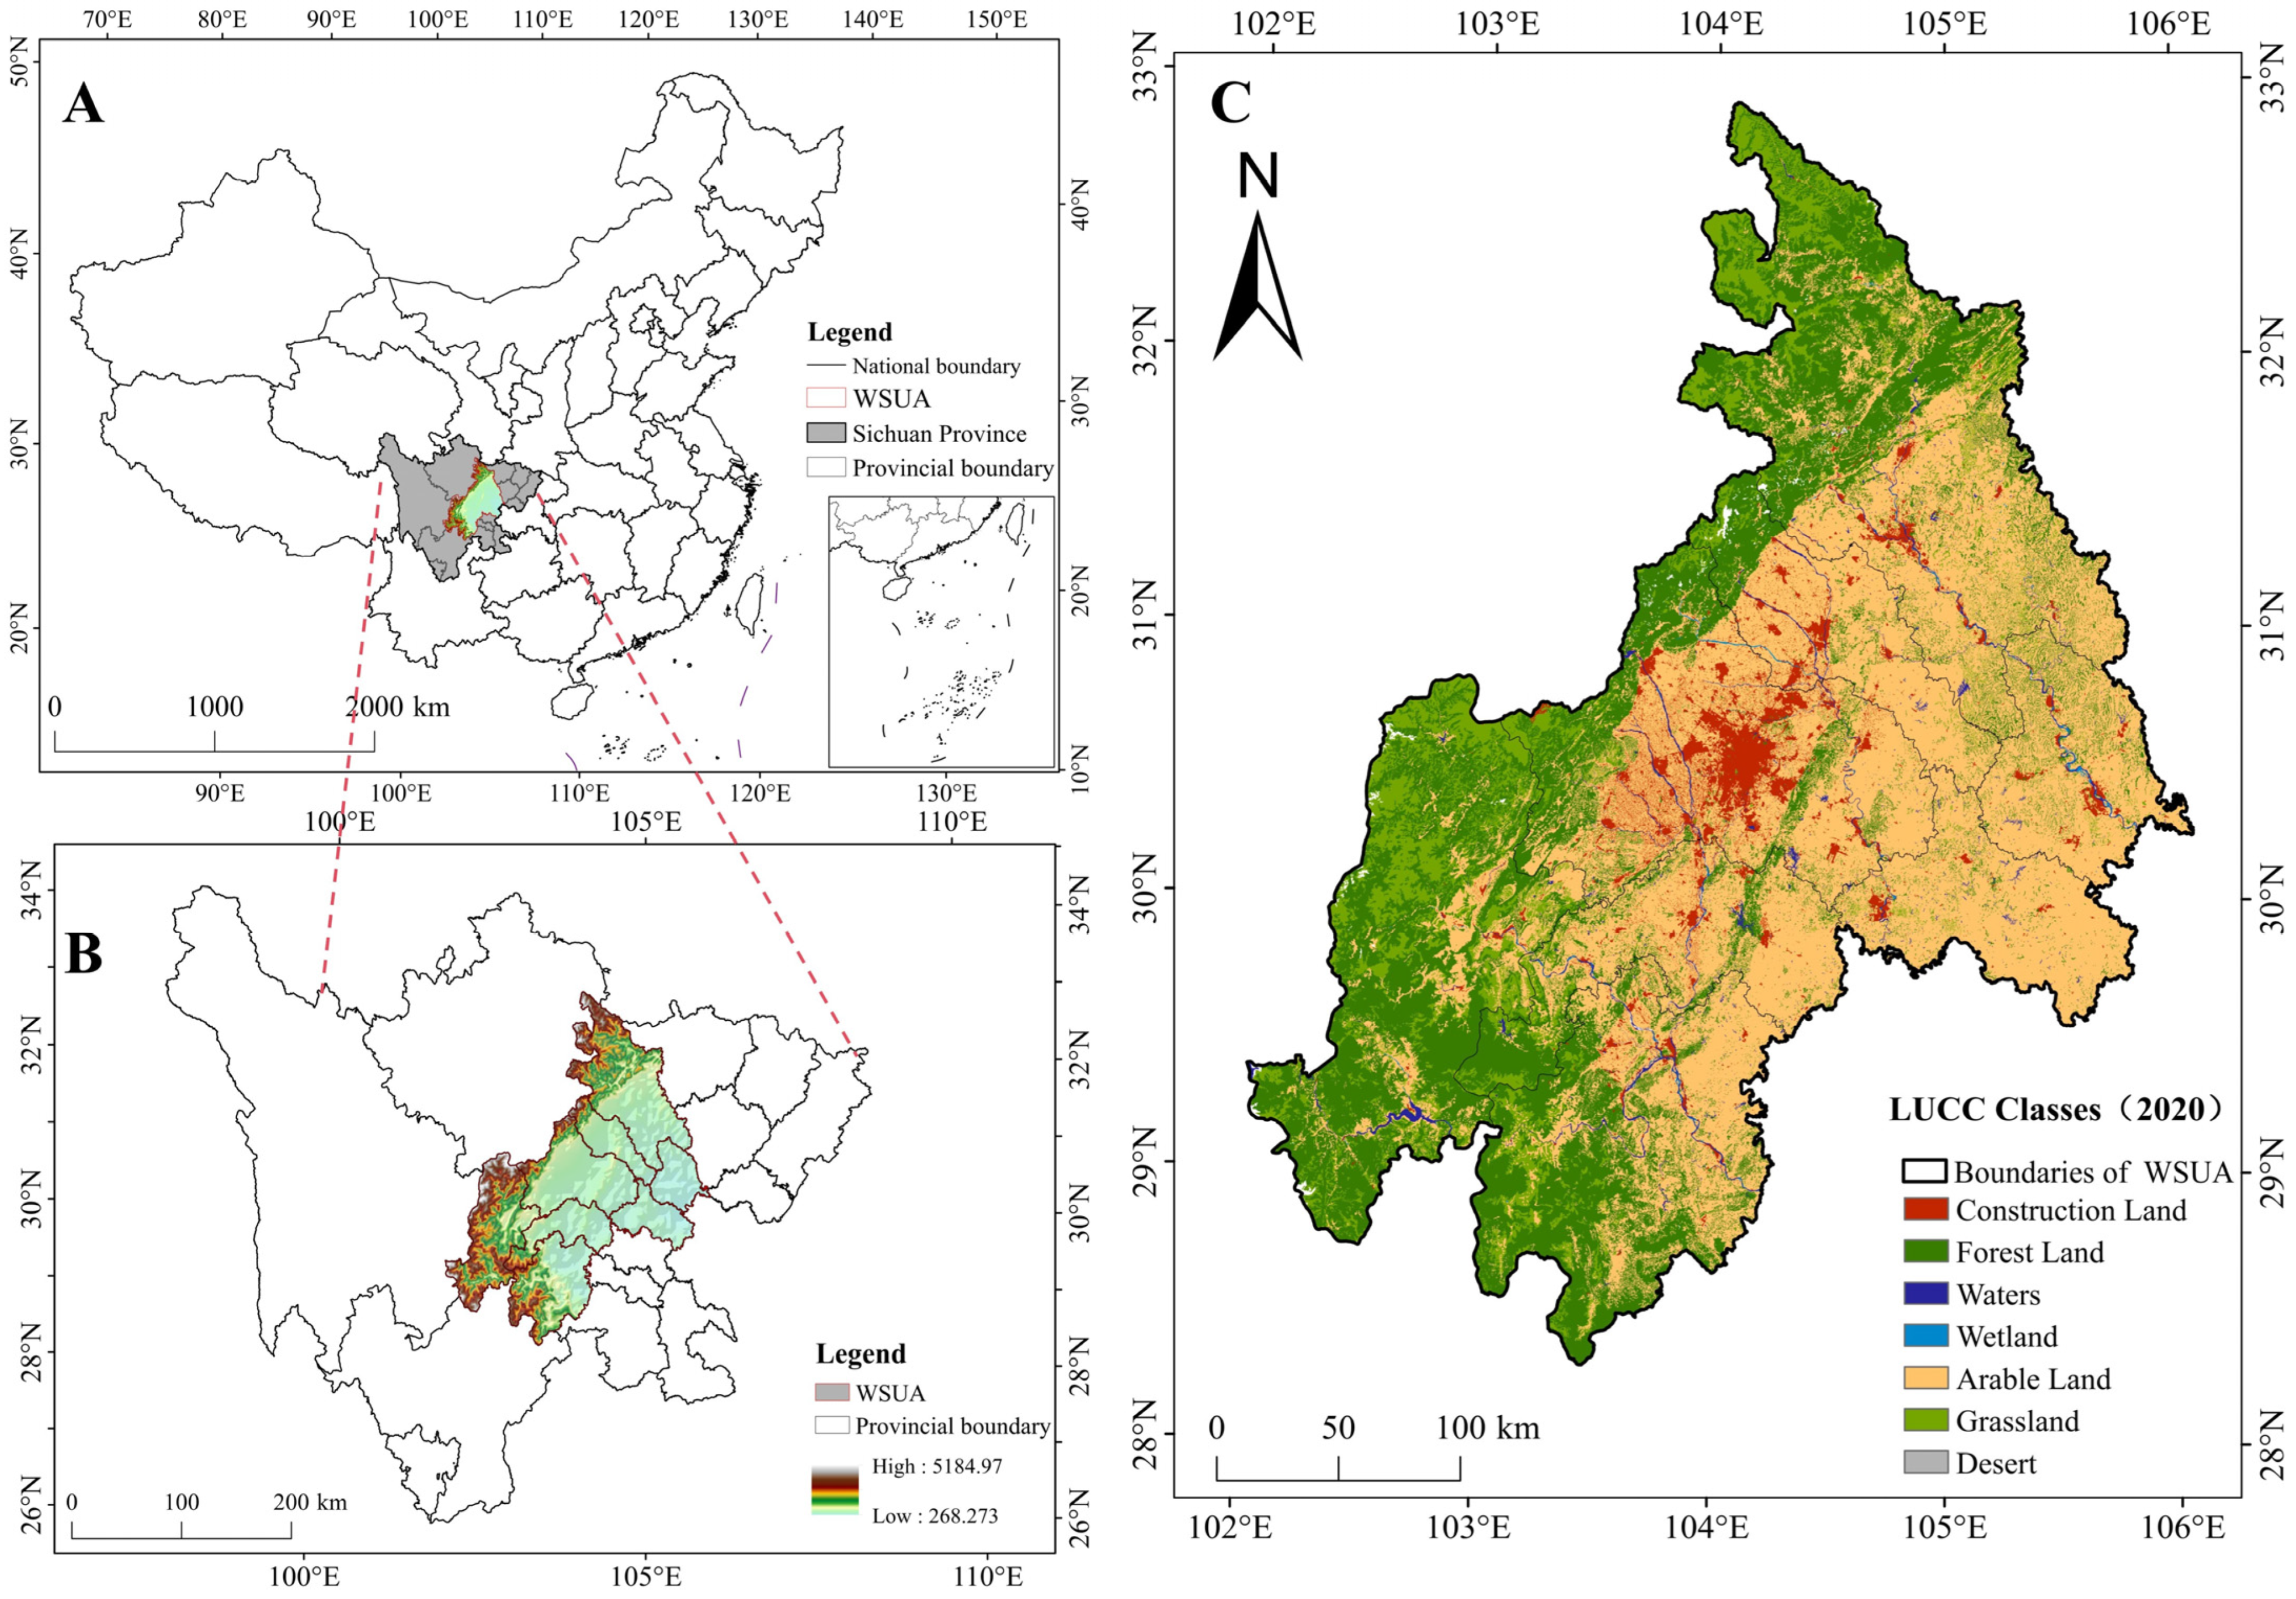
2.1. Study Area

The WSUA is located in the central and western regions of China (29°25′–33°02′ N, 102°49′–105°57′ E) and encompasses eight prefecture-level cities—Chengdu, Deyang, Meishan, Leshan, Ya’an, Ziyang, Mianyang, and Suining—covering an area of approximately 86,000 km2 (Figure 1). The topography of the WSUA is characterized by high elevations in the southwest and northwest and lower elevations in the east, with diverse terrain including plains, hills, and mountains. This varied landscape contributes to the region’s distinct geographic features and complex urban structures, while also resulting in a fragile and ecologically sensitive environment. Most of the region experiences a subtropical monsoon climate. Meanwhile, due to its higher elevation, the western region has a plateau mountainous climate. The region receives an average annual precipitation of over 1000 mm, with distinct seasons, rich water resources, and high plant biodiversity. This region serves as a crucial ecological barrier in the upper reaches of the Yangtze River and includes numerous nature reserves as well as the Giant Panda National Park. The WSUA had an average annual GDP growth rate of 13.15%, a permanent population of 41.9 million in 2020, an urbanization rate of 64.58%, and an annual urbanization growth rate of 1.52%. As a key area for ecological development and economic expansion, the WSUA is undergoing rapid economic growth and urbanization, thereby intensifying the impact of human activities on the ecosystem. This region’s distinctive geographical setting and complex terrain contribute to its high ecological sensitivity, thereby amplifying the effects of land use changes and landscape structure evolution on ESV. Thus, a comprehensive evaluation of these effects is urgently needed to optimize land use planning and support regional sustainable development.

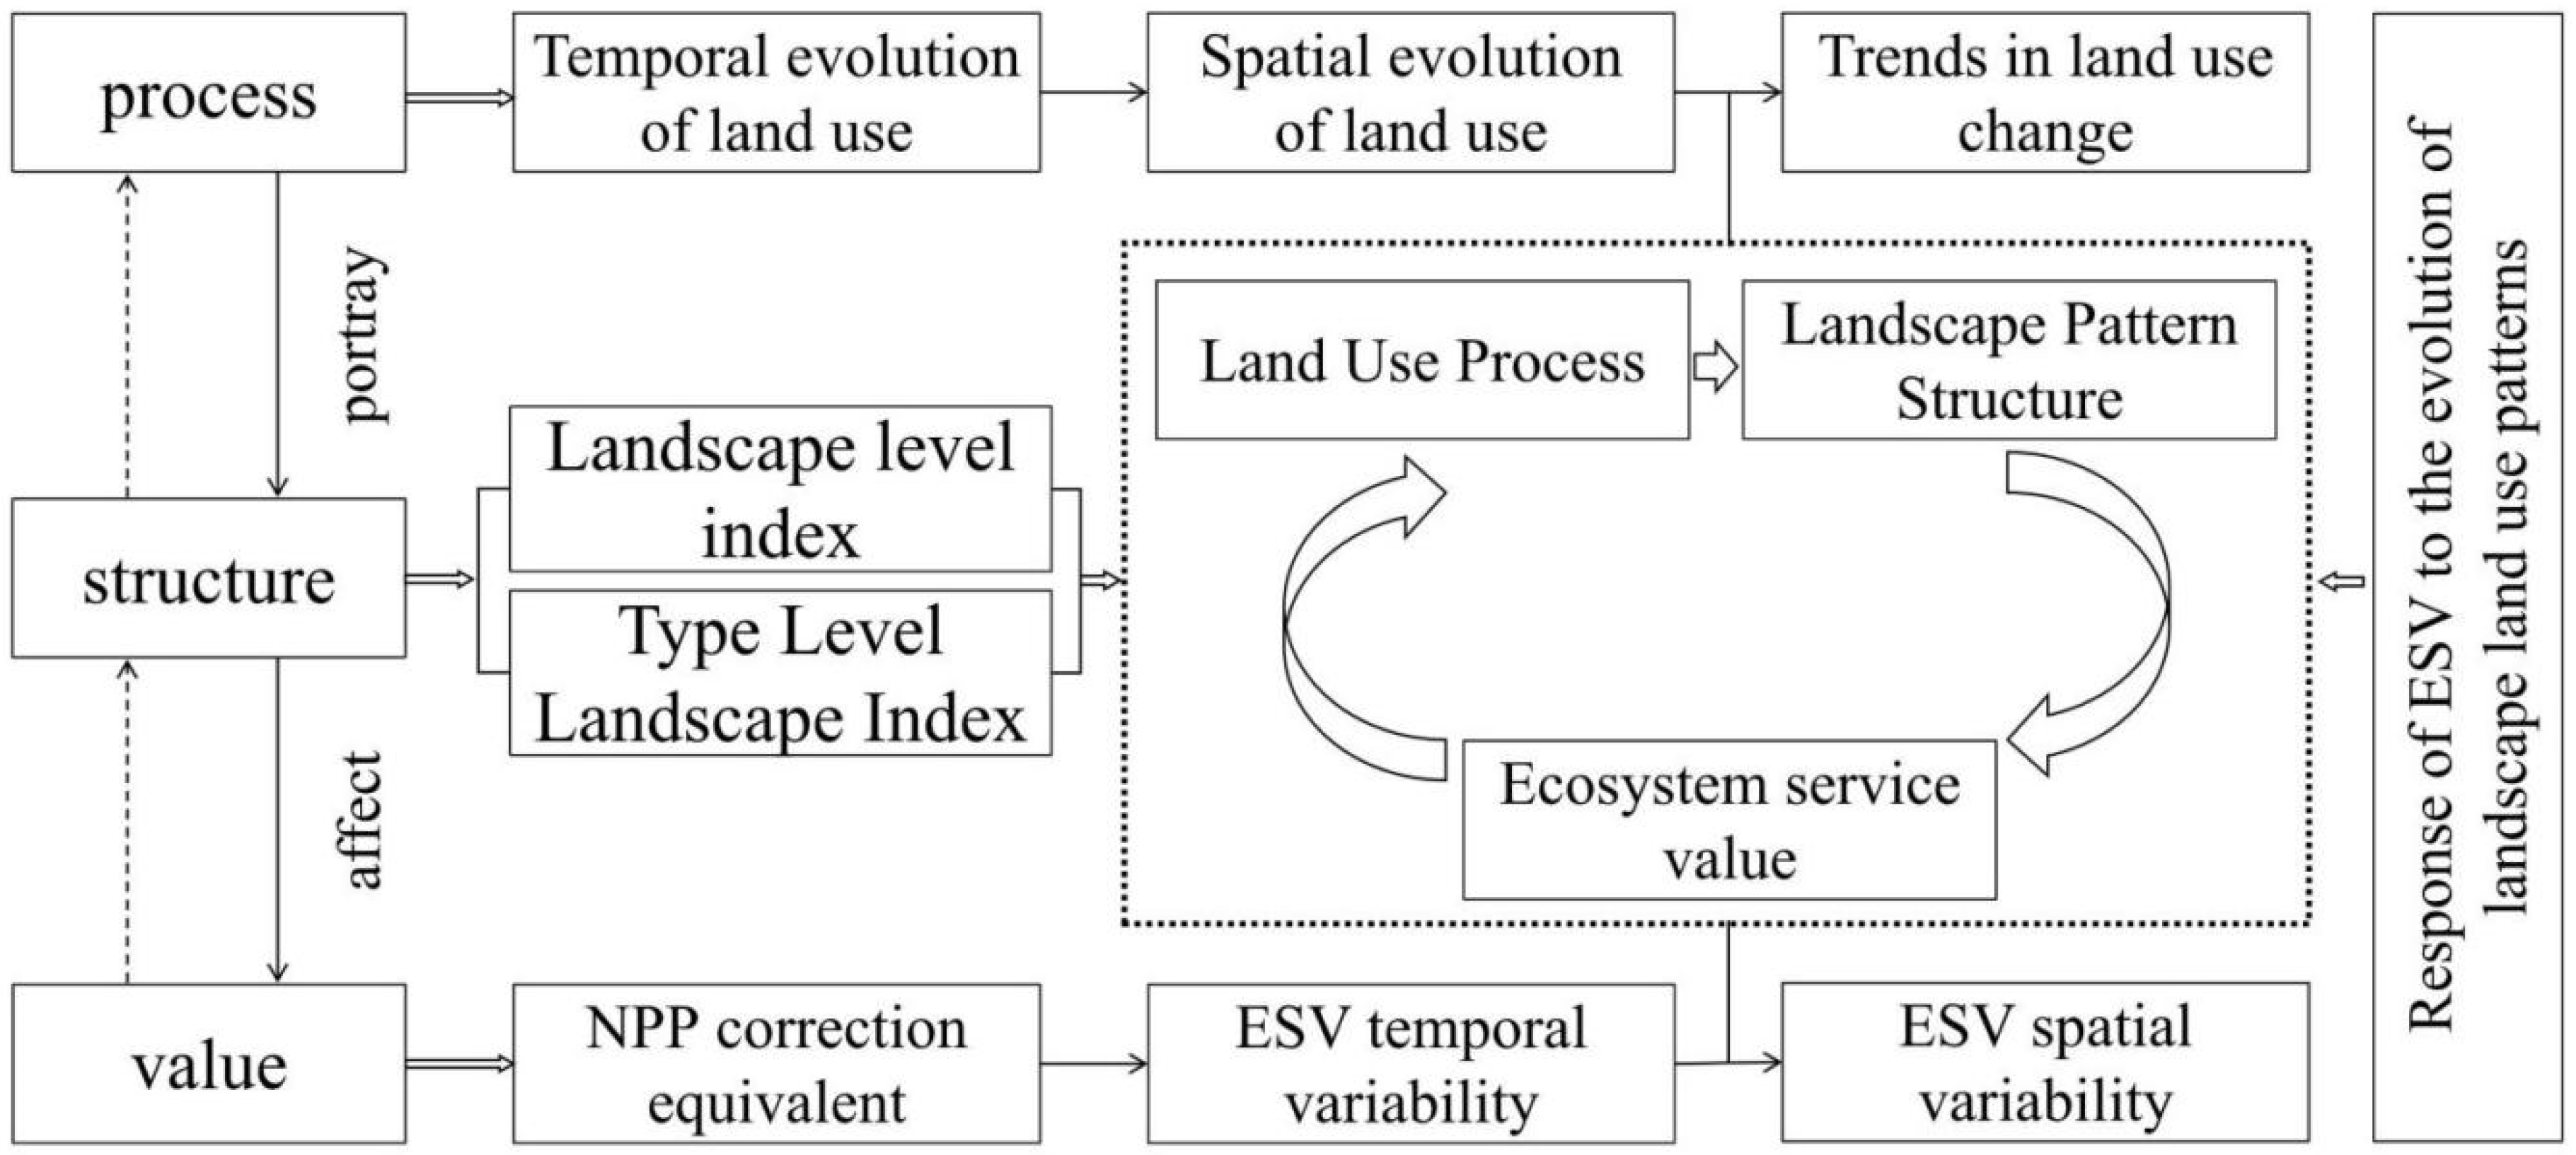
2.2. Theoretical Mechanisms

This study integrates the ecosystem service cascade paradigm proposed by Haines-Young et al. [44] with the “Pattern–Process–Service–Sustainability” framework developed by Fu et al. [45] to develop the “process–structure–value” theoretical model. This model examines how changes in land use and landscape patterns influence ESV, providing theoretical insights for addressing environmental change. The ecosystem service cascade paradigm emphasizes the hierarchical relationships between ecosystem structure, processes, functions, services, and human well-being, illustrating how natural systems provide services through ecological processes and functions, thus impacting human societies [44]. Meanwhile, the “Pattern–Process–Service–Sustainability” paradigm underscores the interdependence between landscape patterns and environmental processes, asserting that landscape patterns influence the intensity of ecological processes, which, in turn, determines ecosystem service provision. Additionally, it incorporates the sustainability of ES and socio-ecological feedback mechanisms [45,46]. Drawing on both paradigms, this model constructs a more holistic analytical framework. Firstly, this framework offers a novel perspective on human–environment interactions. Unlike traditional models, it emphasizes the temporal evolution of land systems and landscape patterns, aiming to quantify land system value, clarify land use and conservation priorities, and identify high-value areas requiring prioritization for protection. Secondly, this model builds on the cascade paradigm’s logic of transforming ecosystem functions into services and values, emphasizing the mediating role of landscape patterns in this transition. Finally, it incorporates the “Pattern–Process–Service–Sustainability” paradigm by treating land use change as a key driver of ecosystem service provision through spatiotemporal landscape pattern evolution, thereby informing land use decision-making. This model transcends the limitations of traditional unidirectional analyses by emphasizing the dynamic interconnections among these three components. It elucidates how land use change reshapes ecosystem service value through landscape pattern reconfiguration and proposes optimization strategies to enhance ecosystem sustainability.
The “process” focuses on land use changes, encompassing the dual effects of natural factors and human activities on land function. Natural processes (e.g., climate change and terrain evolution) and human processes (e.g., urbanization and agricultural expansion) jointly influence land functions, reflecting the dynamic competition and trade-offs between different land use types, particularly in the context of urban expansion, agricultural development, and ecological protection [46]. Land use processes are the key driving force behind landscape pattern adjustments, revealing the complex interaction between human activities and the natural environment. “Structure” refers to the spatial configuration and heterogeneity of landscape patterns, including connectivity, diversity, and patch size and shape [47]. Landscape structure is the spatial expression of the impact of land use processes on natural systems, and it also influences the stability, connectivity, and service capacity of ecosystems. By analyzing changes in landscape structure, we can understand the interactions between different land use types and the specific impacts of these changes on ecosystem service provision and ecological functions. “Value” refers to the measurement of ES, denoting the contribution of ecosystems to human well-being by providing goods and services and the benefits humans derive from ecosystems [48,49,50]. These benefits can be expressed in monetary units or other metrics, such as water source protection, air purification, and food provision [51]. By regulating the spatial configuration and heterogeneity of landscape patterns, land use changes significantly impact the supply and distribution of ESV. Changes in ESV, through feedback mechanisms, affect land use decisions and landscape pattern optimization, forming a dynamic coupling relationship between the “process–structure–value”. Integrating land use processes, landscape patterns, and ESV helps uncover the driving mechanisms of ecological services and key regulatory factors. The “process–structure–value” model offers a comprehensive perspective for analyzing interaction mechanisms and promoting the sustainability of ecosystem service value, thereby providing scientific support for policy development (Figure 2).
Based on the above considerations, we selected land use, landscape pattern, and ESV as representative indicators of process, structure, and value, respectively. The research framework of this study comprises three components. First, the “process” component utilizes remote sensing imagery from 2000 to 2020 and applies spatial statistical analysis and transition matrix methods in ArcGIS 10.2 to analyze land use change processes. The “structure” component is represented by landscape metrics calculated using Fragstats 4.2, including patch density (PD), mean patch size (MPS), edge density (ED), aggregation index (AI), landscape shape index (LSI), Shannon’s diversity index (SHDI), division index (DIVISION), and contagion index (CONTAG). Second, the “value” component explores the spatiotemporal evolution of ESV based on land use data from 2000 to 2020, employing a modified equivalent factor method. Finally, to capture the dynamic coupling relationships among “process–structure–value”, we developed a land use process–ESV response model (Figure 3).

2.3. Data Sources

We acquired land use data spanning five periods at five-year intervals (2000–2020) from the Resource and Environment Science Data Center (https://www.resdc.cn, accessed on 21 October 2022). The data originated from the China National Land Use and Cover Change (CNLUCC) dataset, which underwent nationwide field surveys and random-sampling-based accuracy assessments [52]. Approximately 10% of county-level administrative units were randomly sampled for accuracy assessment, thereby ensuring high data quality and reliability [53]. This dataset has been widely utilized in numerous academic studies [21,54,55,56,57]. The data were generated using the human-assisted visual interpretation of Landsat TM/ETM imagery, featuring a spatial resolution of 30 m and an accuracy rate exceeding 85%. Based on the classification system defined in “Equivalent Functions of Unit Area Services of China’s Terrestrial Ecosystems” [58], this study reclassified 25 secondary land use types into the following seven categories: arable land, forest land, grassland, waters, wetlands, construction land, and desert. Among these, given the relatively low ESV of construction land, assigning it a zero value was deemed appropriate. Meteorological data, including temperature and precipitation, were acquired from the National Meteorological Science Data Sharing Platform (http://data.cma.cn). Statistical data, including the sown area, grain yield, and grain prices, were primarily sourced from the Sichuan Statistical Yearbook, city-level statistical yearbooks, and the Compilation of National Agricultural Product Cost–Benefit Data.

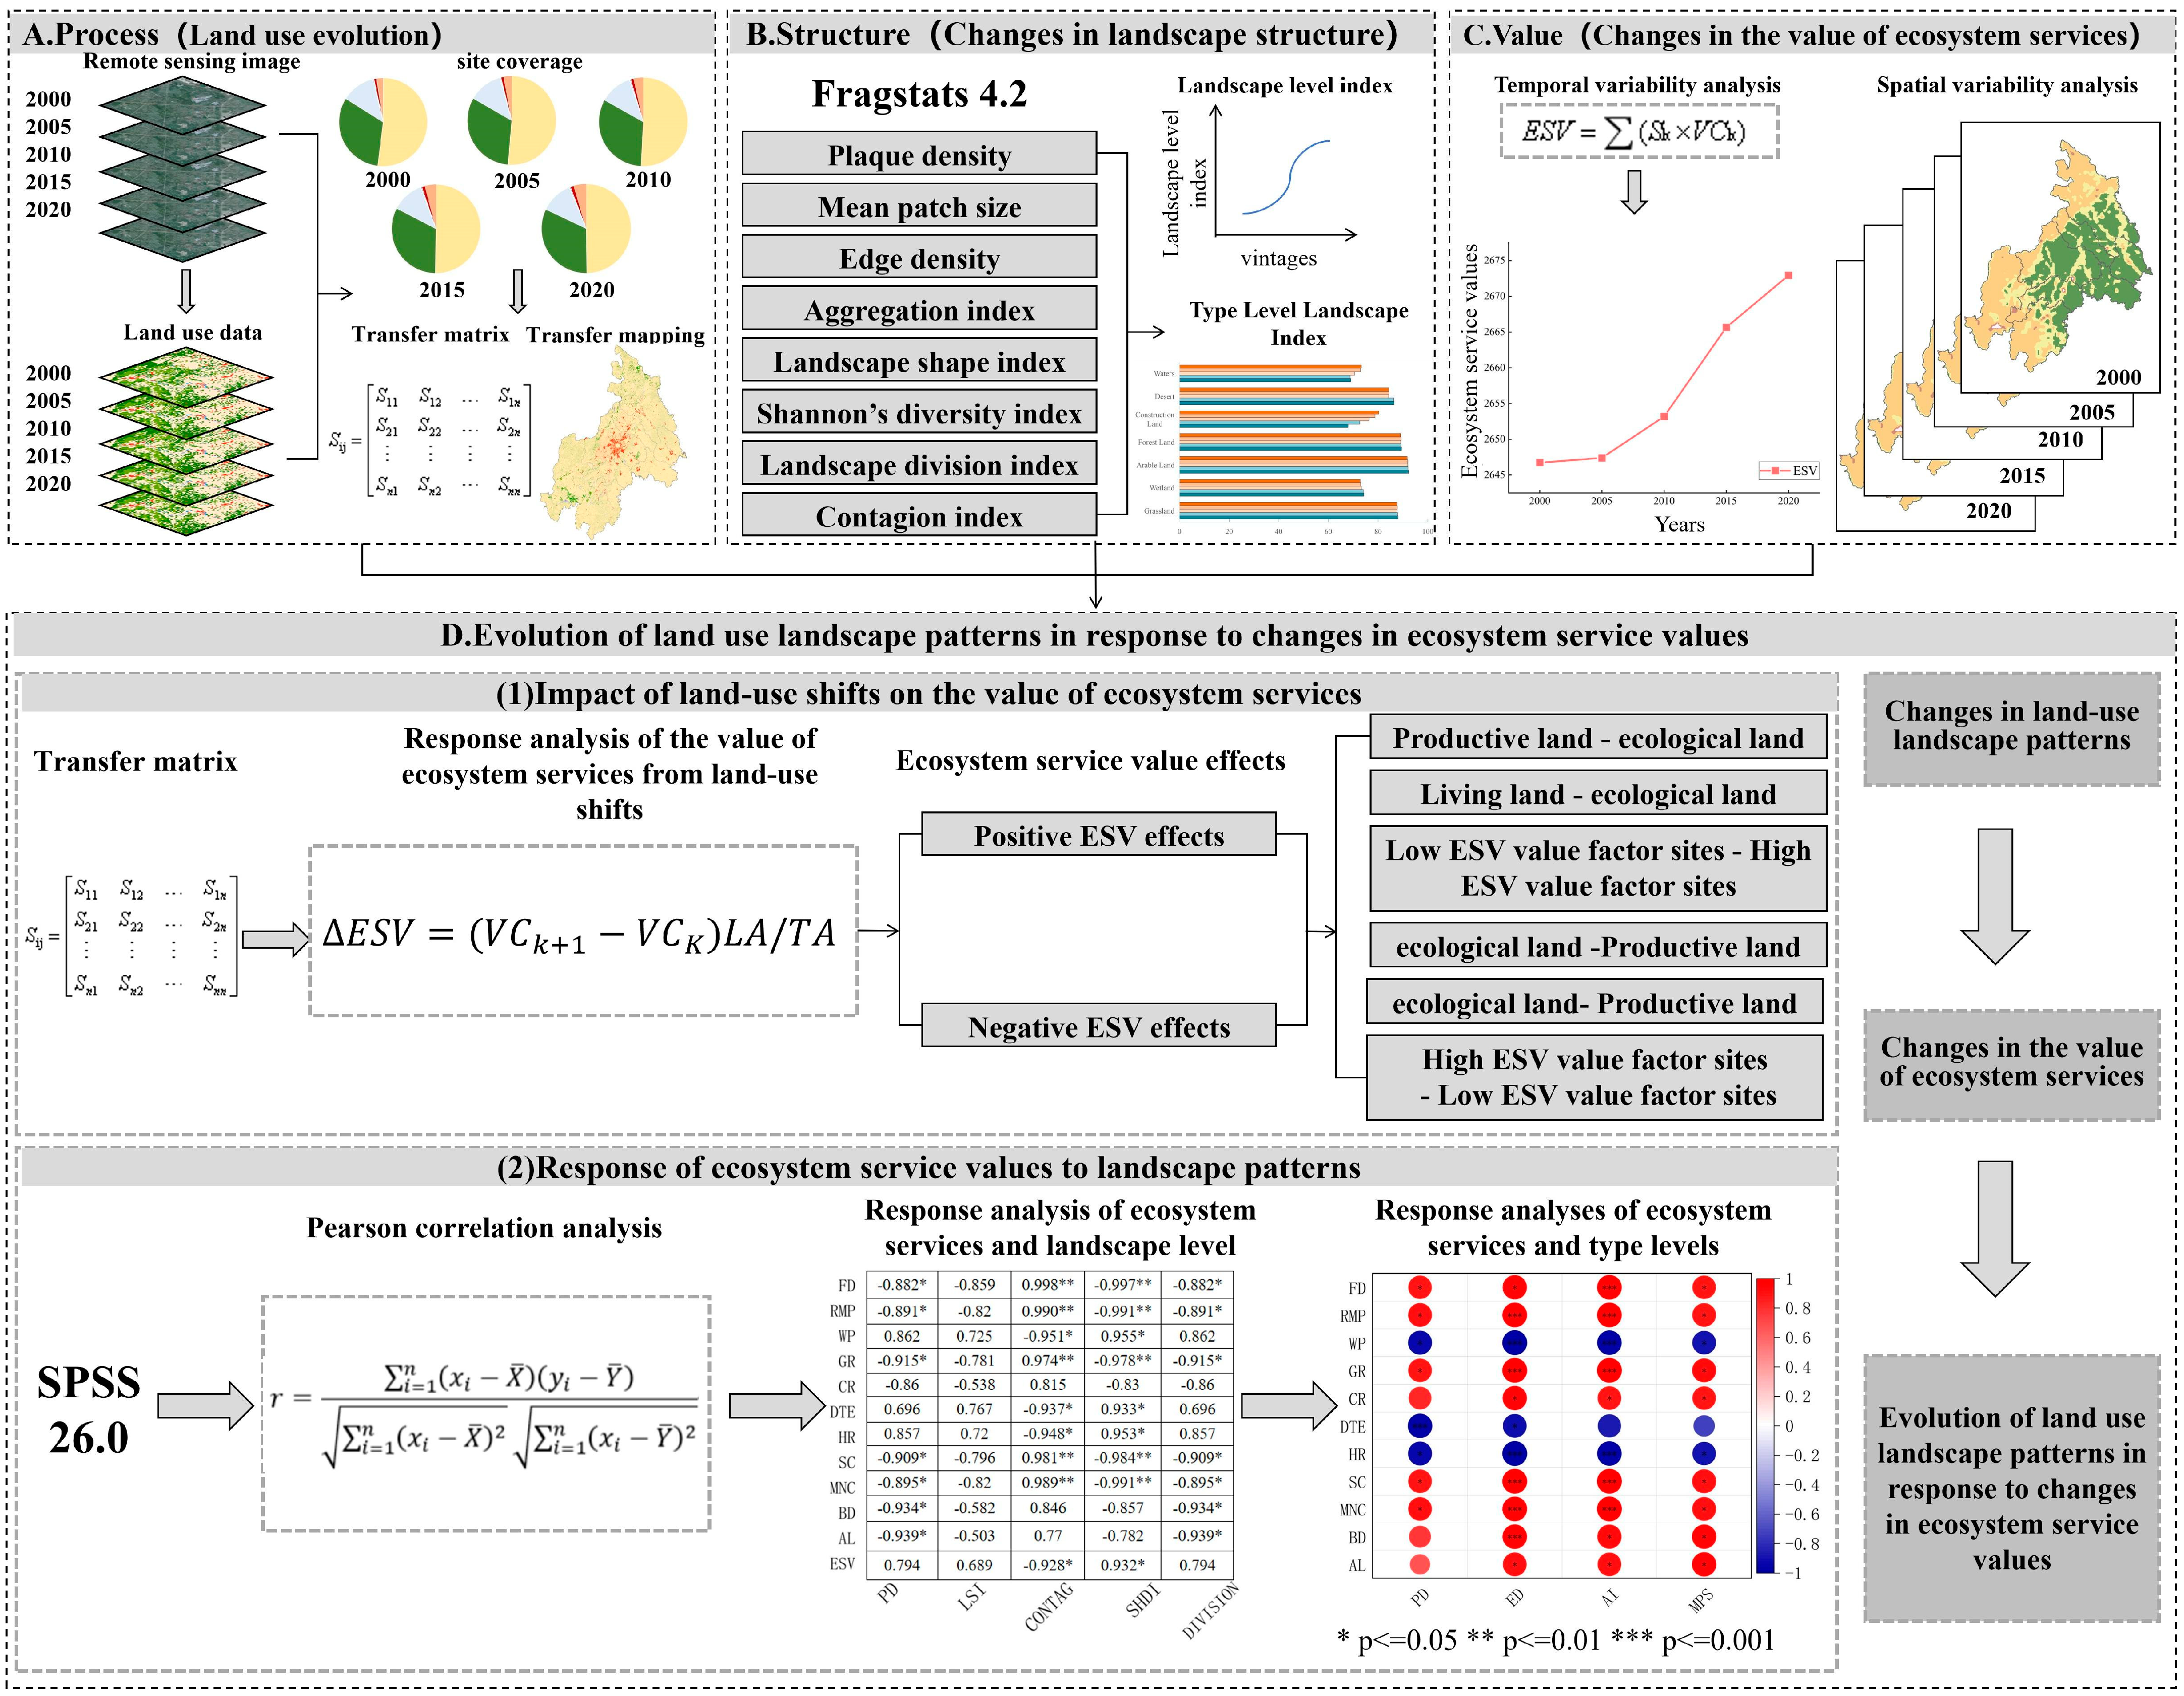
2.4. Detecting Spatial and Temporal Changes in Land Use Processes and Landscape Pattern Structures

2.4.1. Detection of Spatiotemporal Changes in Land Use Processes

This study examines the spatiotemporal dynamics of land use processes in the WSUA from 2000 to 2020, using ArcGIS 10.2 as the analytical platform. We quantified the changes in both area and proportion of seven land use types over the five time points. A land use transfer matrix was used to analyze the transitions among various land use types [59]. Subsequently, we utilized the raster calculator to identify the spatial characteristics of land use transitions between successive periods.

2.4.2. Analysis of Landscape Pattern Structures

Landscape indices capture information about landscape patterns, providing a quantitative approach to describe both the structural composition and spatial configuration [60]. This study selected two landscape scales—landscape-level indices and type-level indices—based on their distinct functions and characteristics, in consideration of the unique context and research aims of the WSUA. Landscape-level indices are typically used to evaluate the overall landscape characteristics and spatial patterns across the entire area. In contrast, type-level indices focus more on the characteristics and patterns within and among specific land use or land cover types [61]. We selected five landscape-level indices (PD, LSI, SHDI, DIVISION, CONTAG) and four type-level indices (MPS, ED, AI, PD). This study employed Fragstats 4.2 to compute the selected landscape pattern indices, with land use/land cover classification maps (typically in raster format) as input. The ecological significance of each landscape pattern index is detailed in Table A2.

2.5. Ecosystem Services Valuation

This study adopts the global ecosystem service value estimation method proposed by [1], selecting 11 types of ES, including food production (FP), raw material production (RMP), water supply (WS), gas regulation (GR), climate regulation (CR), decontamination of the environment (DTE), hydrological regulation (HR), soil conservation (SC), maintaining nutrient cycling (MNC), biodiversity (BD), and esthetic landscape (AL). The ESV assessment was conducted using the equivalent factor method, which was well-suited for large-scale ecosystem service assessments and accurately represents ESV using a standardized quantitative framework [22]. The revised “Equivalent Factor Table of Ecosystem Service Values” proposed by Xie et al. [58] was used as the basis for the calculations. Adjustments to the regional ESV were made based on biomass variations, particularly considering the extensive areas of arable and forest lands in the WSUA. Net primary productivity (NPP) was used as a proxy for biomass, and the ESV equivalent factors were calibrated accordingly. The method for estimating NPP was based on the formulas provided in [62,63]. The improved methodology more accurately captures the unique ecological characteristics of the region, ensuring that the estimations better align with local conditions.
The revised model for ESV was as follows:
N P P = 3000 × 1 e 0.0009695 ( V 20 )
V = 1.05 p r e 1 + 1 + 1.05 p r e / L 2
L = 3000 + 25 T m p + 0.05 T m p 3
λ = N P P s i t e N P P r e f e r e n c e
E k = λ × E 0 k
where Net Primary Productivity (NPP) is measured in tons per hectare (t/ha). Annual evapotranspiration is denoted as V for long-term averages, both expressed in millimeters (mm). Similarly, Pre indicates annual precipitation (mm), and Tmp represents the mean annual temperature (°C). λ is the regional correction coefficient for ecosystem service equivalence(ESE); NPPreference denotes the national average NPP, expressed in kilograms per square meter (kg/m2) of carbon (C); NPPsite represents the average NPP in the WSUA, also in kg/m2 (C); Ek is the regionally adjusted ESE for the kth ecosystem type; and E0k is the national average of ESE of the kth ecosystem type, where k = 1, 2, …, 11.
According to the study, the economic value of one unit of the equivalent factor of ESV was equal to 1/7 of the average market value of grain produced nationwide that year [58]. To account for monetary inflation, this study used the average grain price in the WSUA for 2020 (2.81 CNY/kg) as the baseline for calculations, resulting in an economic value of 2030.01 CNY/hm2 for a single equivalent factor of ESV within the WSUA. The information above was used to determine the ecosystem value coefficients associated with the different land use types in the WSUA (Table A3).
The ESV of the WSUA was computed using the following formula:
E S V = S k × V C k
where ESV denotes ecosystem service value (RMB); Sk is the area of k land use types (hm2); and VCk is the ecosystem service value coefficient of the adjusted k land use types [CNY·hm−2·a−1].
A grid-based approach was employed to analyze the spatial variations in ESV across five time periods (2000, 2005, 2010, 2015, and 2020). Drawing on the extensive literature on grid-based land use studies [64,65,66] and considering the potential influence of the Modifiable Areal Unit Problem (MAUP), the study adopted established practices for selecting grid scales, while taking into account the region’s complex geomorphology and significant ecological heterogeneity. Several commonly used grid resolutions were initially selected, including 500 m × 500 m, 1 km × 1 km, 3 km × 3 km, 5 km × 5 km, and 10 km × 10 km. To identify the most appropriate spatial analysis unit, land use change data for the WSUA were used to compare spatial characteristics and their temporal evolution across different grid resolutions. The results indicated that the spatial patterns of land use dynamics and ESV were largely consistent across different scales. However, the 5 km × 5 km grid resolution struck an optimal balance between spatial detail and regional representativeness, making it well-suited to the spatial structure of the region, which is characterized by small- to medium-scale mountainous settlements. Accordingly, a 5 km × 5 km grid was generated using ArcGIS 10.2, from which seven land use types were extracted. The ESV for each grid cell was calculated using the equivalent value coefficient method in combination with the raster calculator. The grids were converted into both raster and point formats, and Kriging interpolation was applied to visualize the spatial distribution of ESV.
To assess the reliability of the ESV coefficients in the WSUA, this study employed the sensitivity coefficient (CS) commonly used in economics [67]. A CS greater than 1 indicates that the ESV is elastic with respect to VC, implying the low accuracy of VC; conversely, if CS is less than 1, it suggests that the ESV is inelastic with respect to VC, and that VC is more accurate, making the ESV assessment more reliable. A higher CS value indicates greater sensitivity of ESV to changes in the VC of a given landscape type, suggesting a more substantial contribution to the overall ESV.

2.6. Construction of the Response of ESV to Land Use Processes and Landscape Pattern Structure

2.6.1. Calculations of the Response of ESV to Land Use Processes

The dynamic evolution of ESV during land use conversion can be classified into two forms: ESV improvement and ESV degradation. The corresponding calculation formula is given as follows:
E S V = ( V C k + 1 V C K ) L A / T A
where E S V denotes the dynamic impact of ESV resulting from land use transfers. It refers to the flow of ecological values that occur as a result of land use transfers, where the transformation of one land use type to another leads to a rise or decline in ESV within a given area. V C K and V C k + 1   represent the ecological value coefficients of the land use types at the beginning and end of the transfer, respectively. LA refers to the area affected by the land use change, while TA represents the total area of the region.

2.6.2. Calculations of the Response of ESV to Landscape Pattern Structure

The Pearson correlation coefficient is a commonly used statistical measure for assessing the strength of the linear relationship between two independent continuous numerical variables. Before performing the analysis, a Shapiro–Wilk test should be conducted to assess whether the data follow a normal distribution, ensuring the validity of the Pearson correlation analysis [68]. A two-tailed t-test is then conducted to evaluate the statistical significance of the correlation between landscape pattern indices and ESV over time. If the correlation coefficient is statistically significant (p < 0.05), the correlation is deemed meaningful. A statistically significant negative correlation coefficient suggests a trade-off relationship, whereas a positive correlation implies a synergistic effect [69]. Data analysis was conducted using the Statistical Package for the Social Sciences (SPSS) 26.0 to quantify the impact of landscape pattern changes on ESV. Correlation heatmaps were generated using Origin 2021 to visually illustrate their dynamic relationship.

3. Results

3.1. Analysis of Land Use Processes and Landscape Pattern Structures Changes

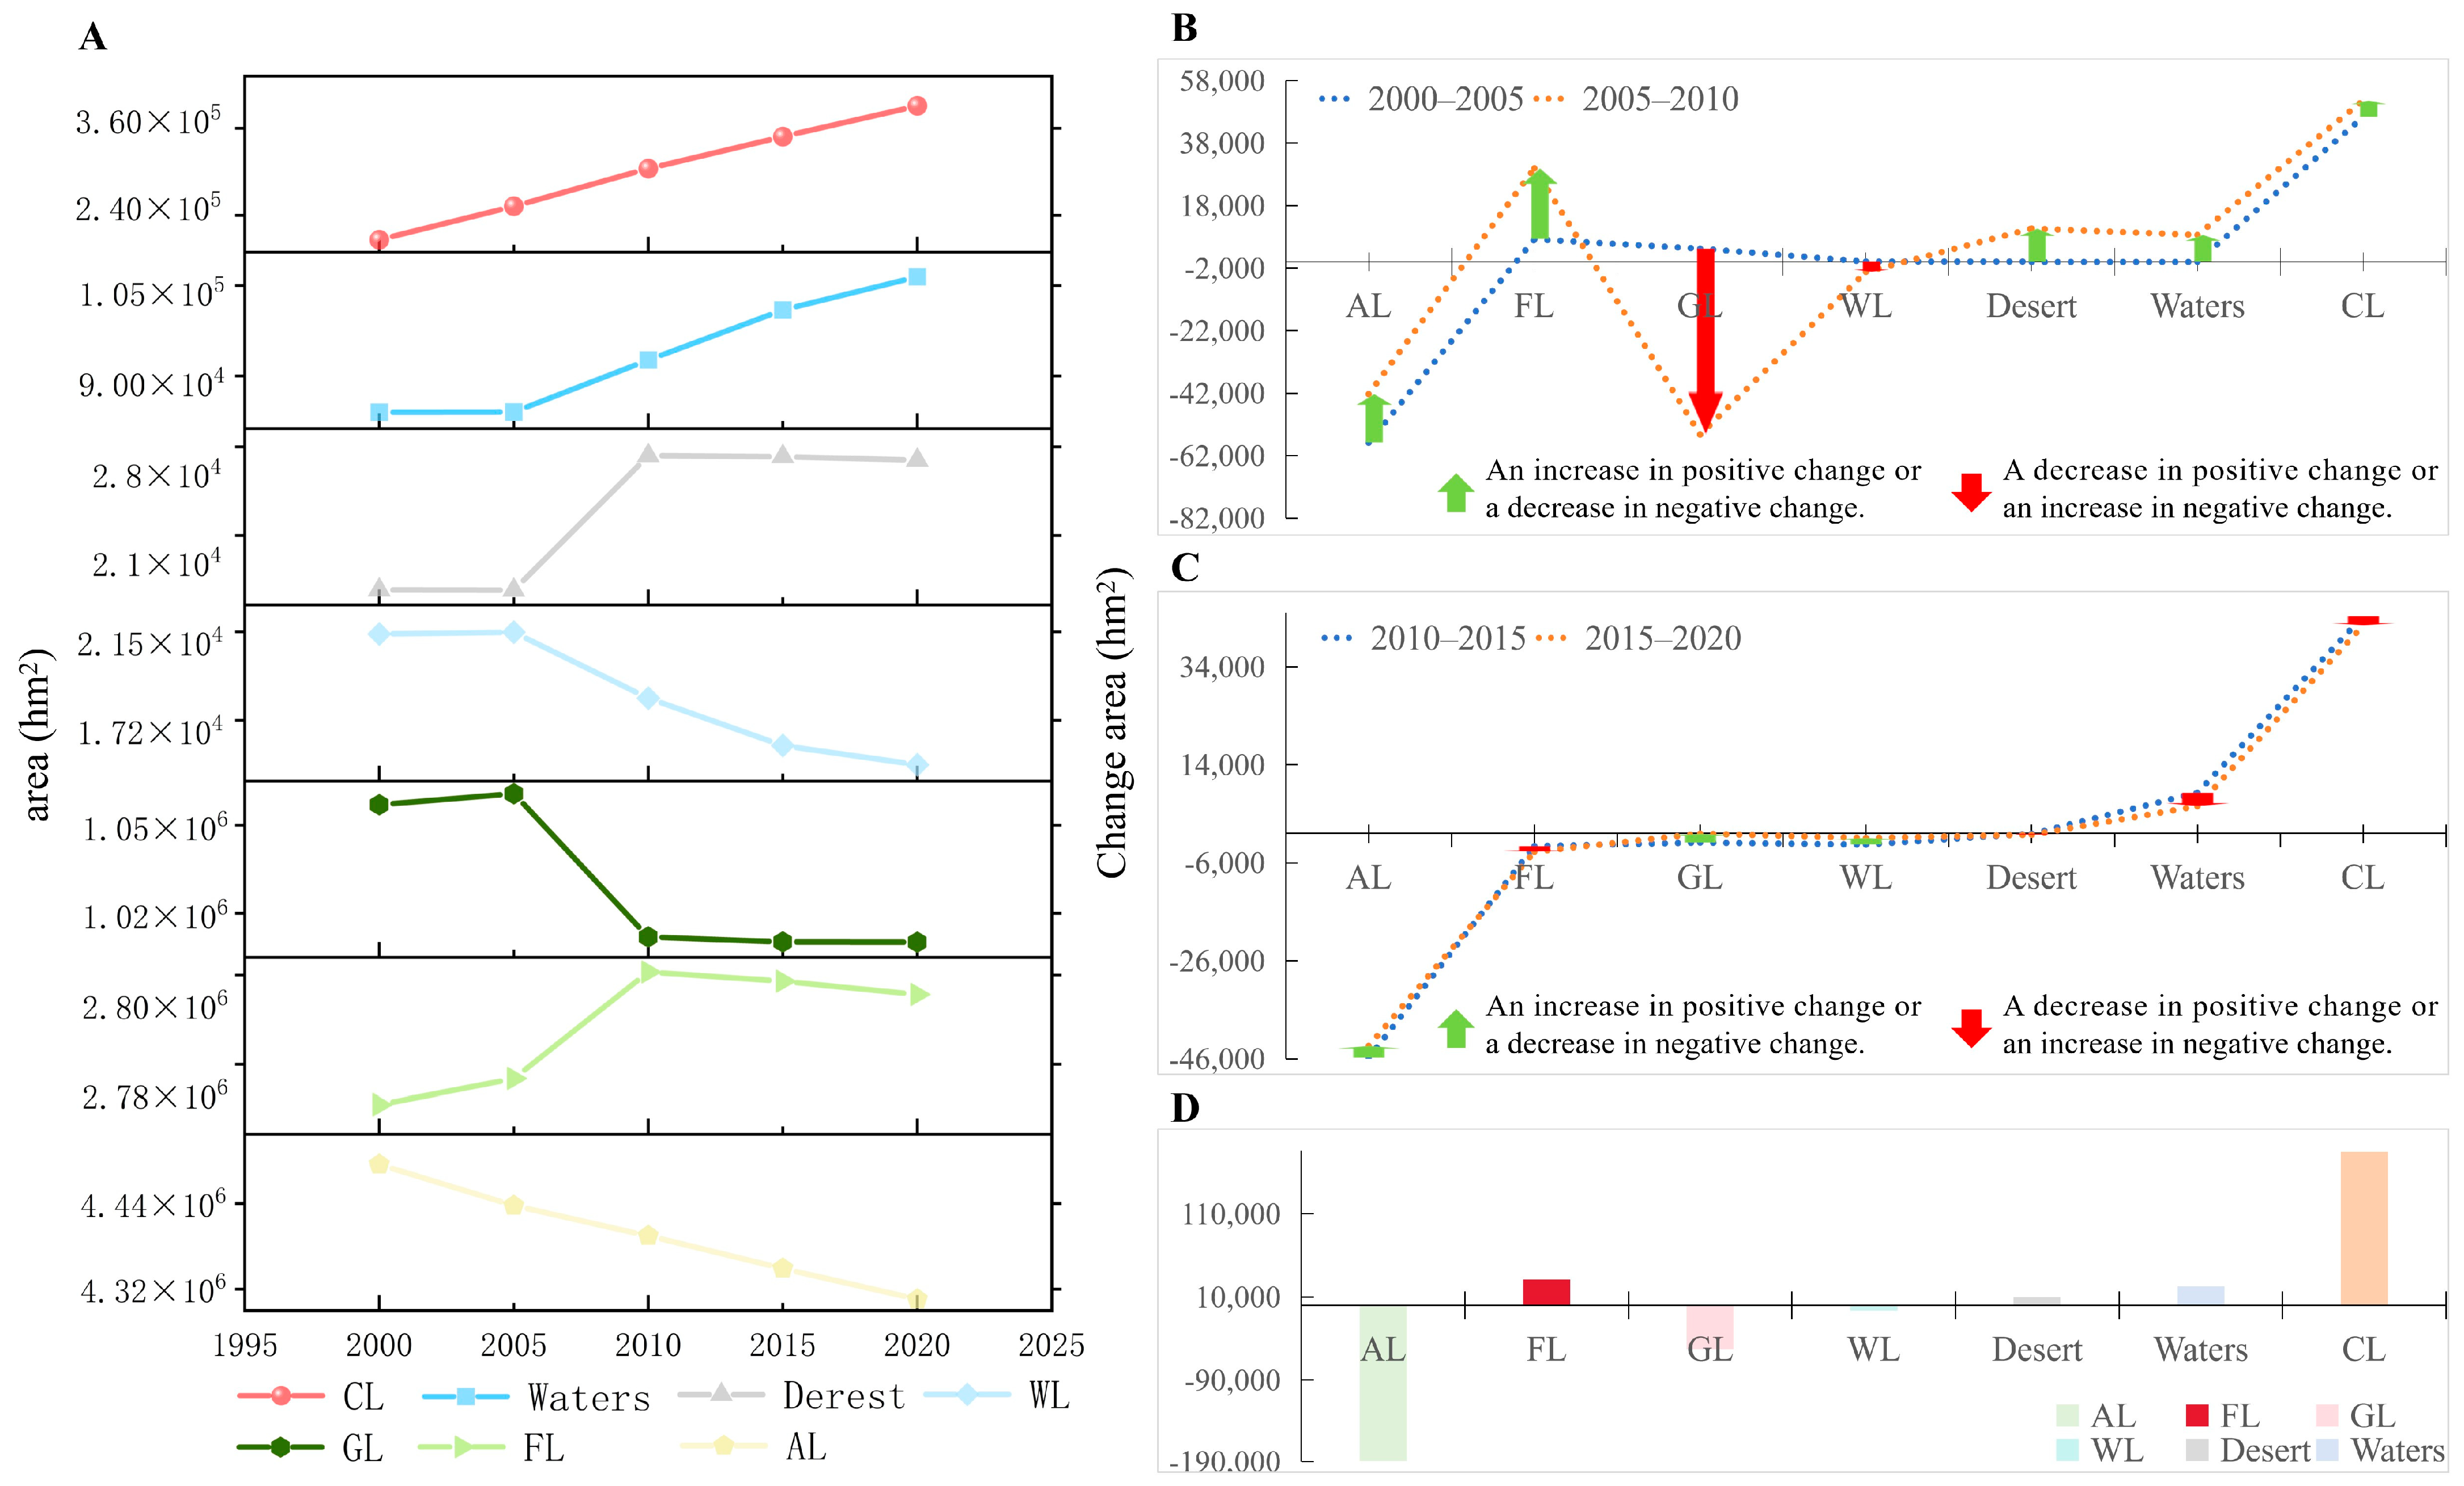
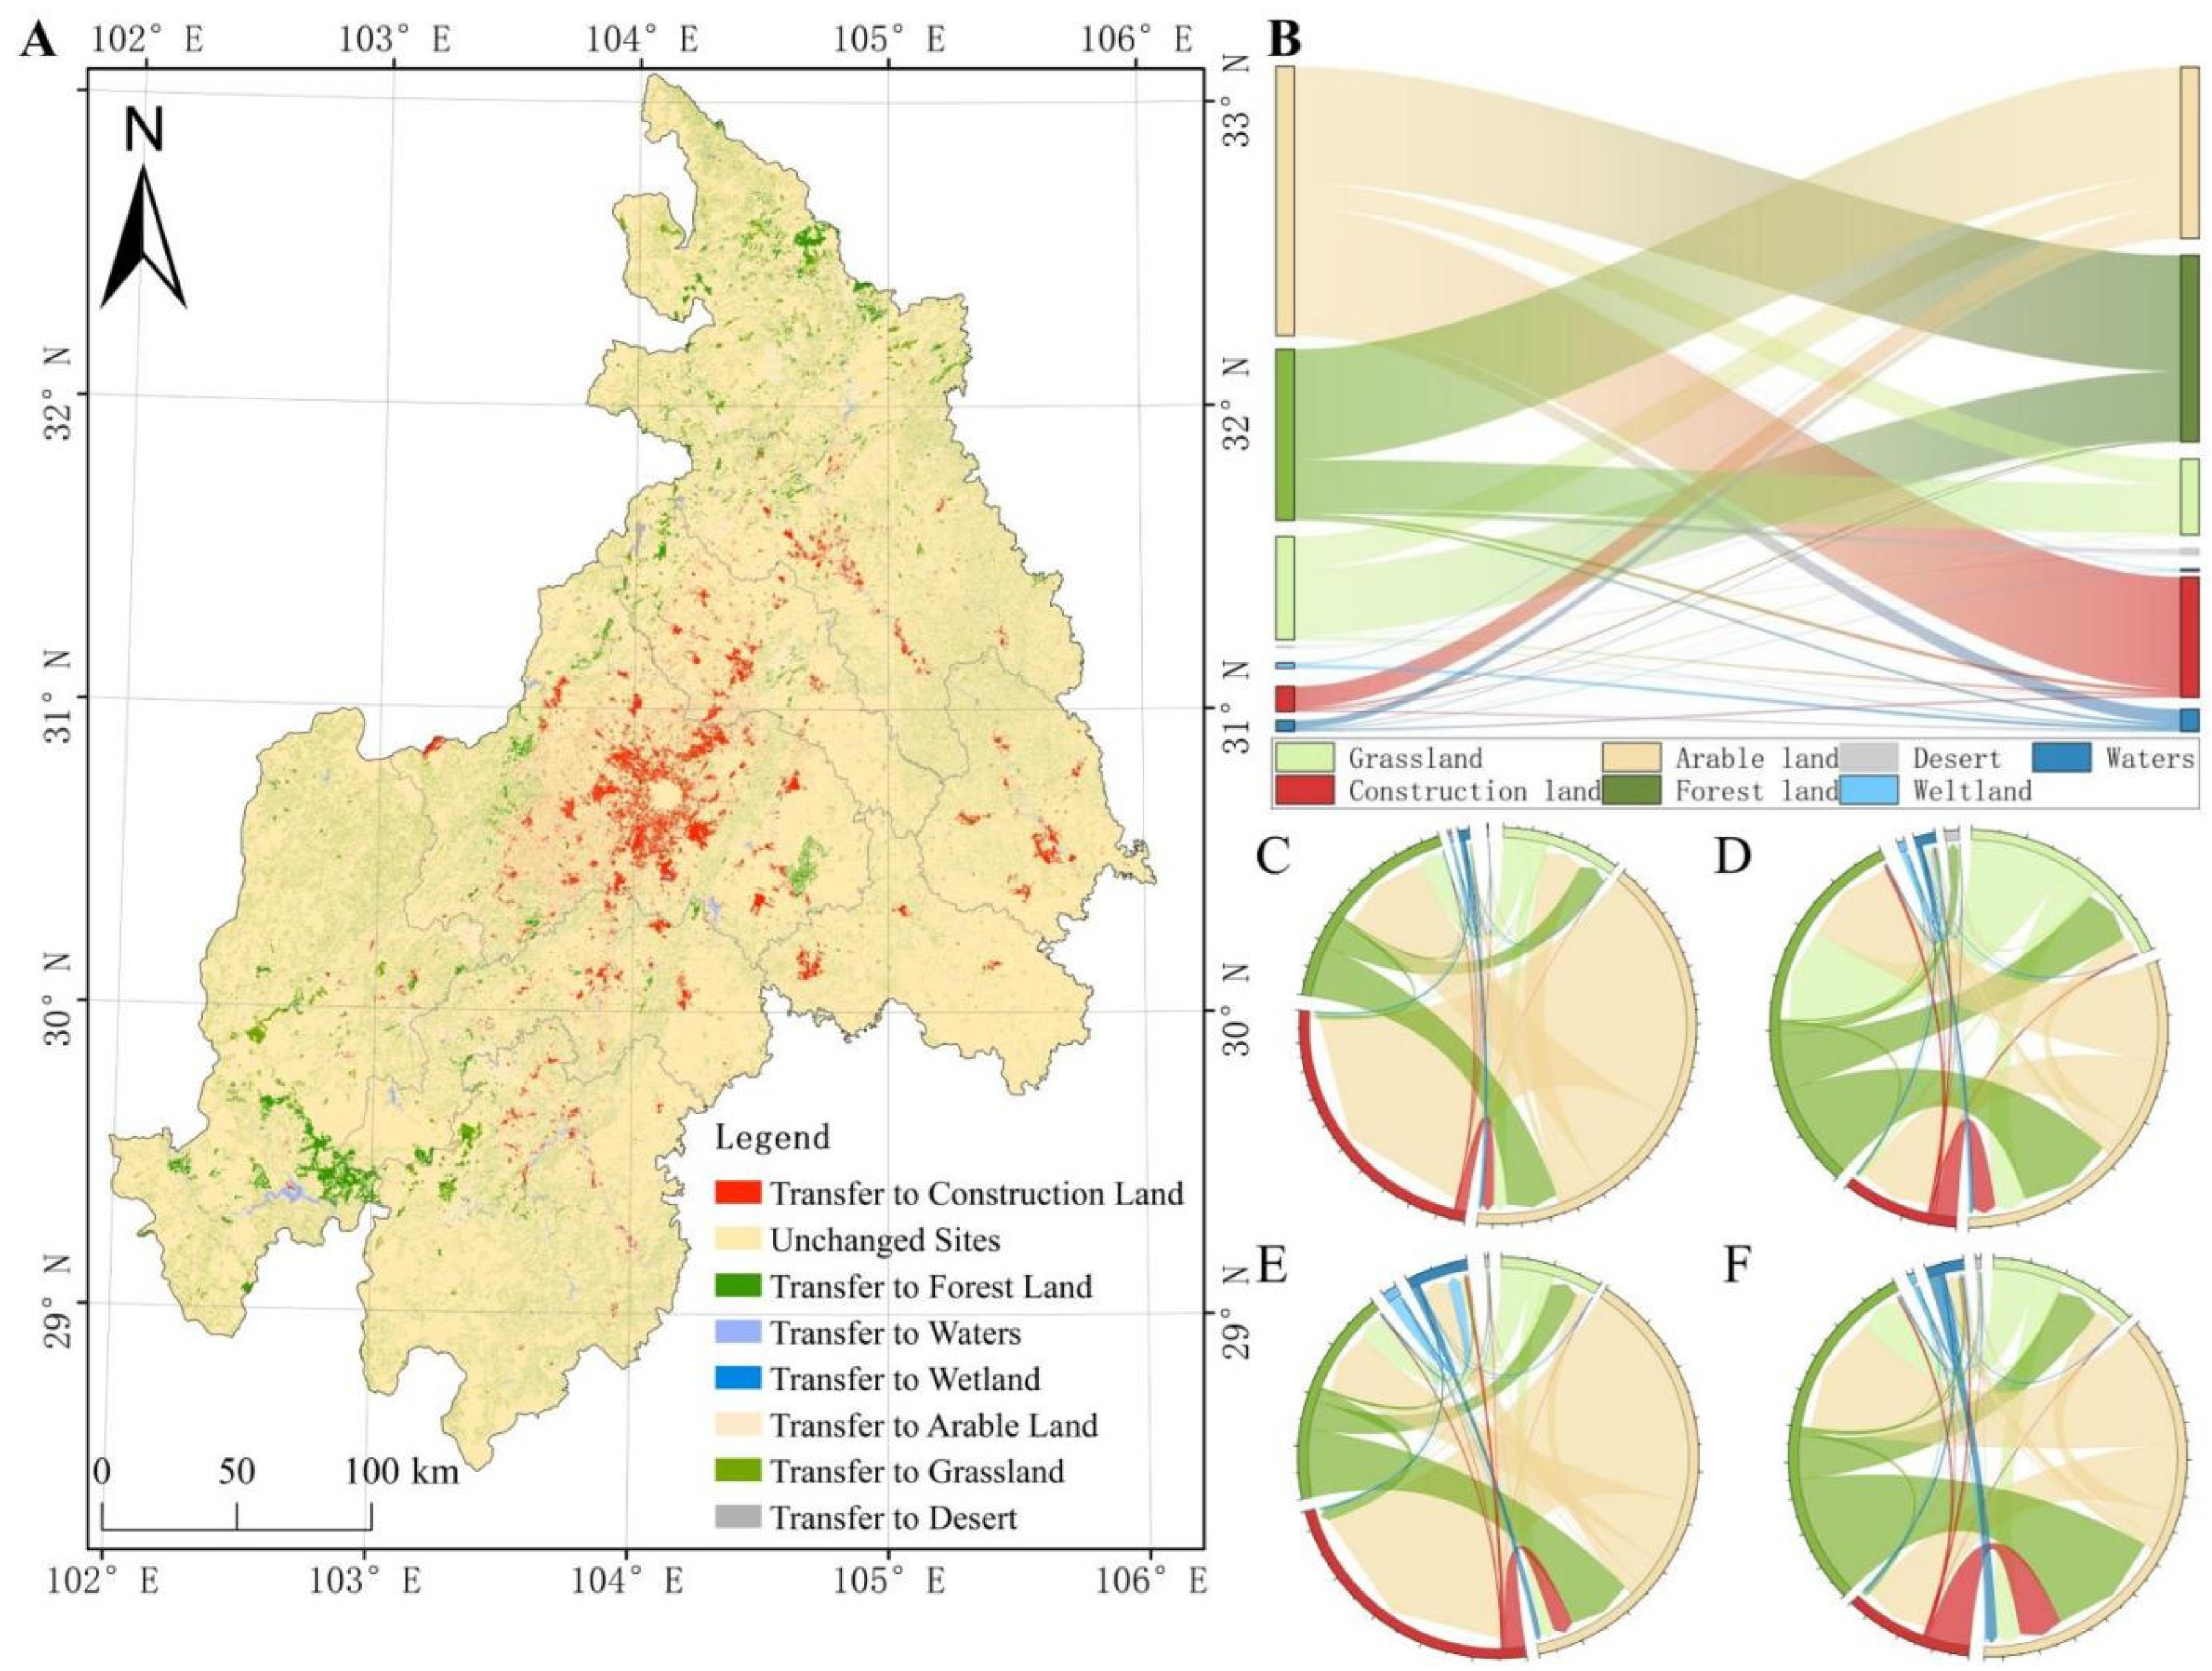
3.1.1. Characteristics of Spatiotemporal Changes in Land Use Processes

Land use changes in the WSUA followed a trend characterized by “four increases and three decreases”, with construction land experiencing the most substantial increase and arable land showing the most significant decrease from 2000 and 2020. The areas of construction land (184,729.41 hm2), forest land (30,816.45 hm2), waters (22,487.22 hm2), and desert (10,261.89 hm2) showed an increasing trend, whereas arable land (189,336.69 hm2), grassland (52,986.96 hm2), and wetland (6339.87 hm2) exhibited a decreasing trend. Land use changes were most significant between 2000 and 2010, after which the rate of change slowed down. Specifically, construction land steadily increased over the past two decades, with the most substantial increase of 51,612.39 hm2 occurring between 2005 and 2010, followed by a gradual decline in the growth rate after 2010. Conversely, the area of arable land decreased less since 2005. In addition, arable land was widespread in the WSUA, while forest land and grassland were distributed in the northwest and southwest. The study area revealed a distinct trend of construction land expansion, with expansion characteristics in Chengdu being particularly noteworthy. This expansion manifested as outward growth towards the urban fringe and adjacent counties, thereby forming a peripheral urban expansion zone (Figure 4 and Figure A1).
Throughout the research period, arable land in the WSUA exhibited the largest transfer area, showing significant reciprocal transfer trends between arable and forest land, with some arable land being converted into construction land. In terms of outflows, arable land accounted for the largest area transferred (522,002.88 hm2), with the majority transitioning to forest land (225,857.97 hm2) and construction land (217,843.02 hm2), constituting 85% of the total outflow area. For inflows, the largest area transferred was forest land (362,600.55 hm2), followed by arable land (332,793.36 hm2) and construction land (217,843.02 hm2). Forest and construction land inflows primarily originated from arable land, accounting for 62.29% and 93.20% of each inflow, respectively. Moreover, land use changes were most intense during the periods 2005–2010 and 2015–2020, characterized by a significant reciprocal transfer between arable land and forest land alongside a notable shift in arable land to construction land. Between 2005 and 2010, the largest outflow was from arable land (193,158.27 hm2), primarily directed towards forest land (92,990.43 hm2) and construction land (72,276.3 hm2). The outflow of forest land was also significant, totaling 160,683.75 hm2, primarily directed towards arable land (93,227.76 hm2) and grassland (53,906.31 hm2). From 2015 to 2020, substantial outflows from arable and forest land continued. Furthermore, the inflow of construction land primarily occurred in the peripheries and suburbs near city centers, while forest land inflows were concentrated in mountainous and hilly areas. In contrast, the inflow of arable land was more widespread, encompassing suburbs and adjacent counties, industrial parks, economic development zones, and emerging cities and new districts, such as Pengzhou, Qionglai, Mianyang, Meishan, Ya’an, and Deyang (Figure 5).

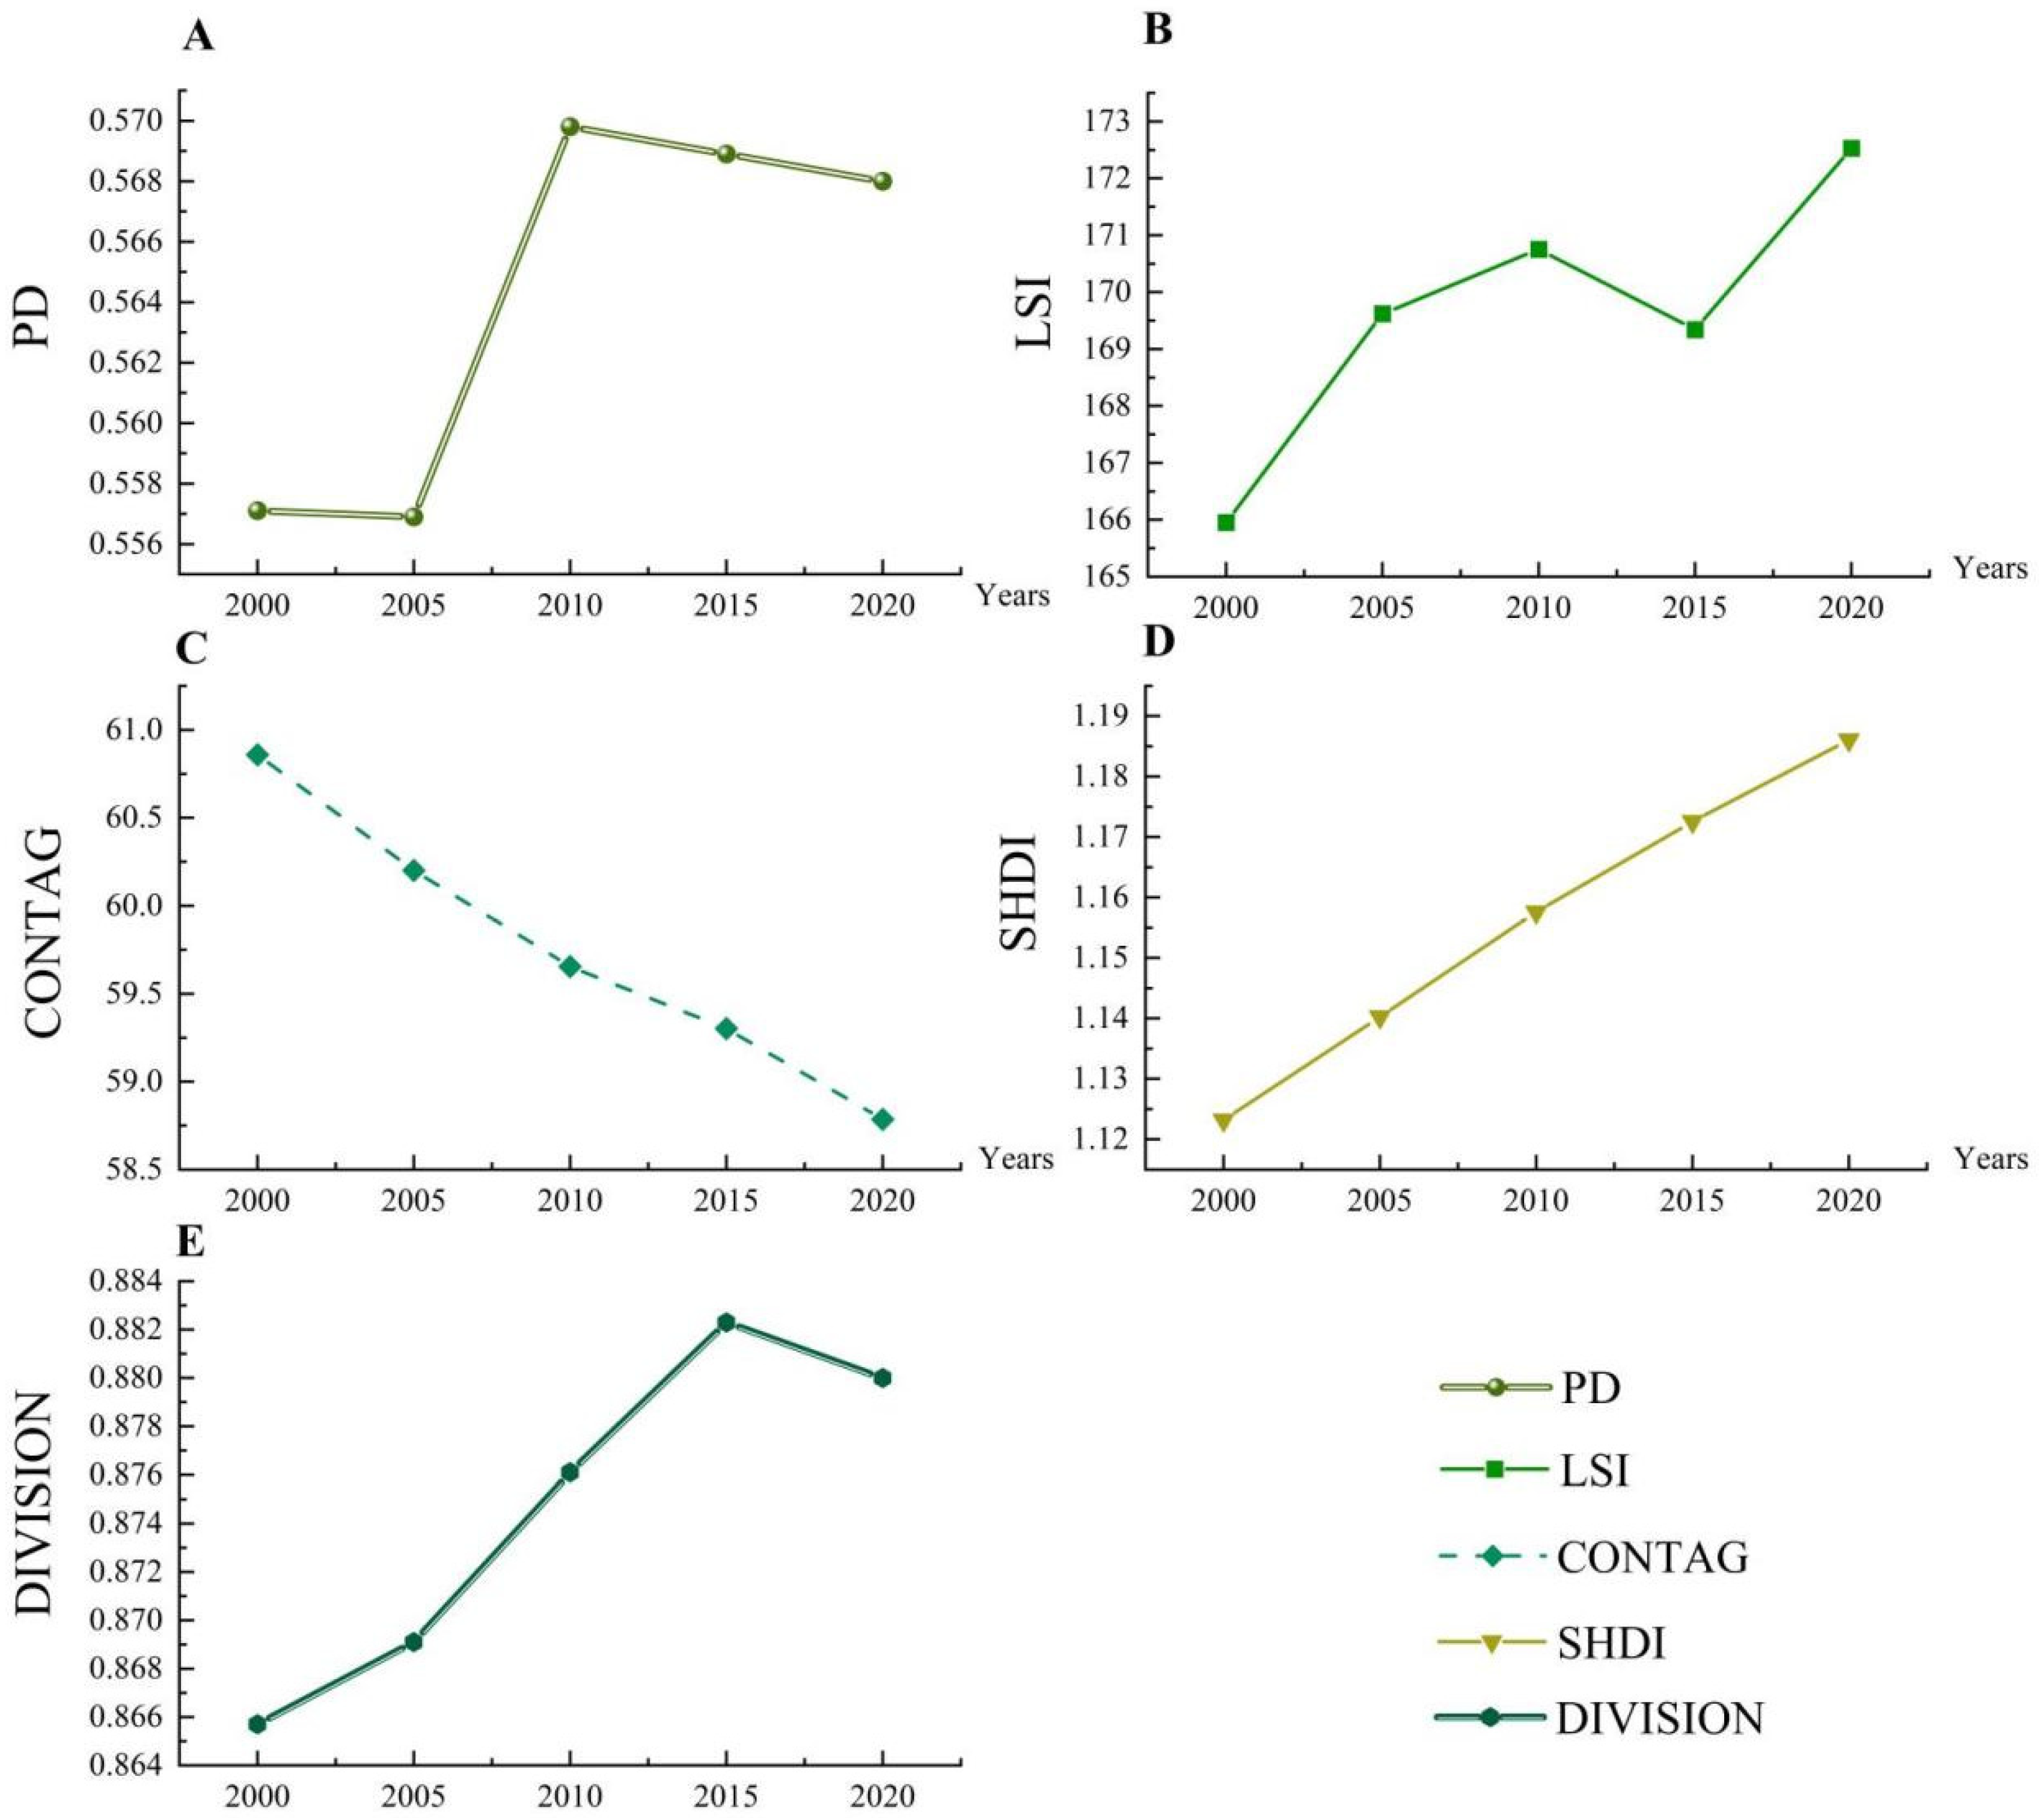
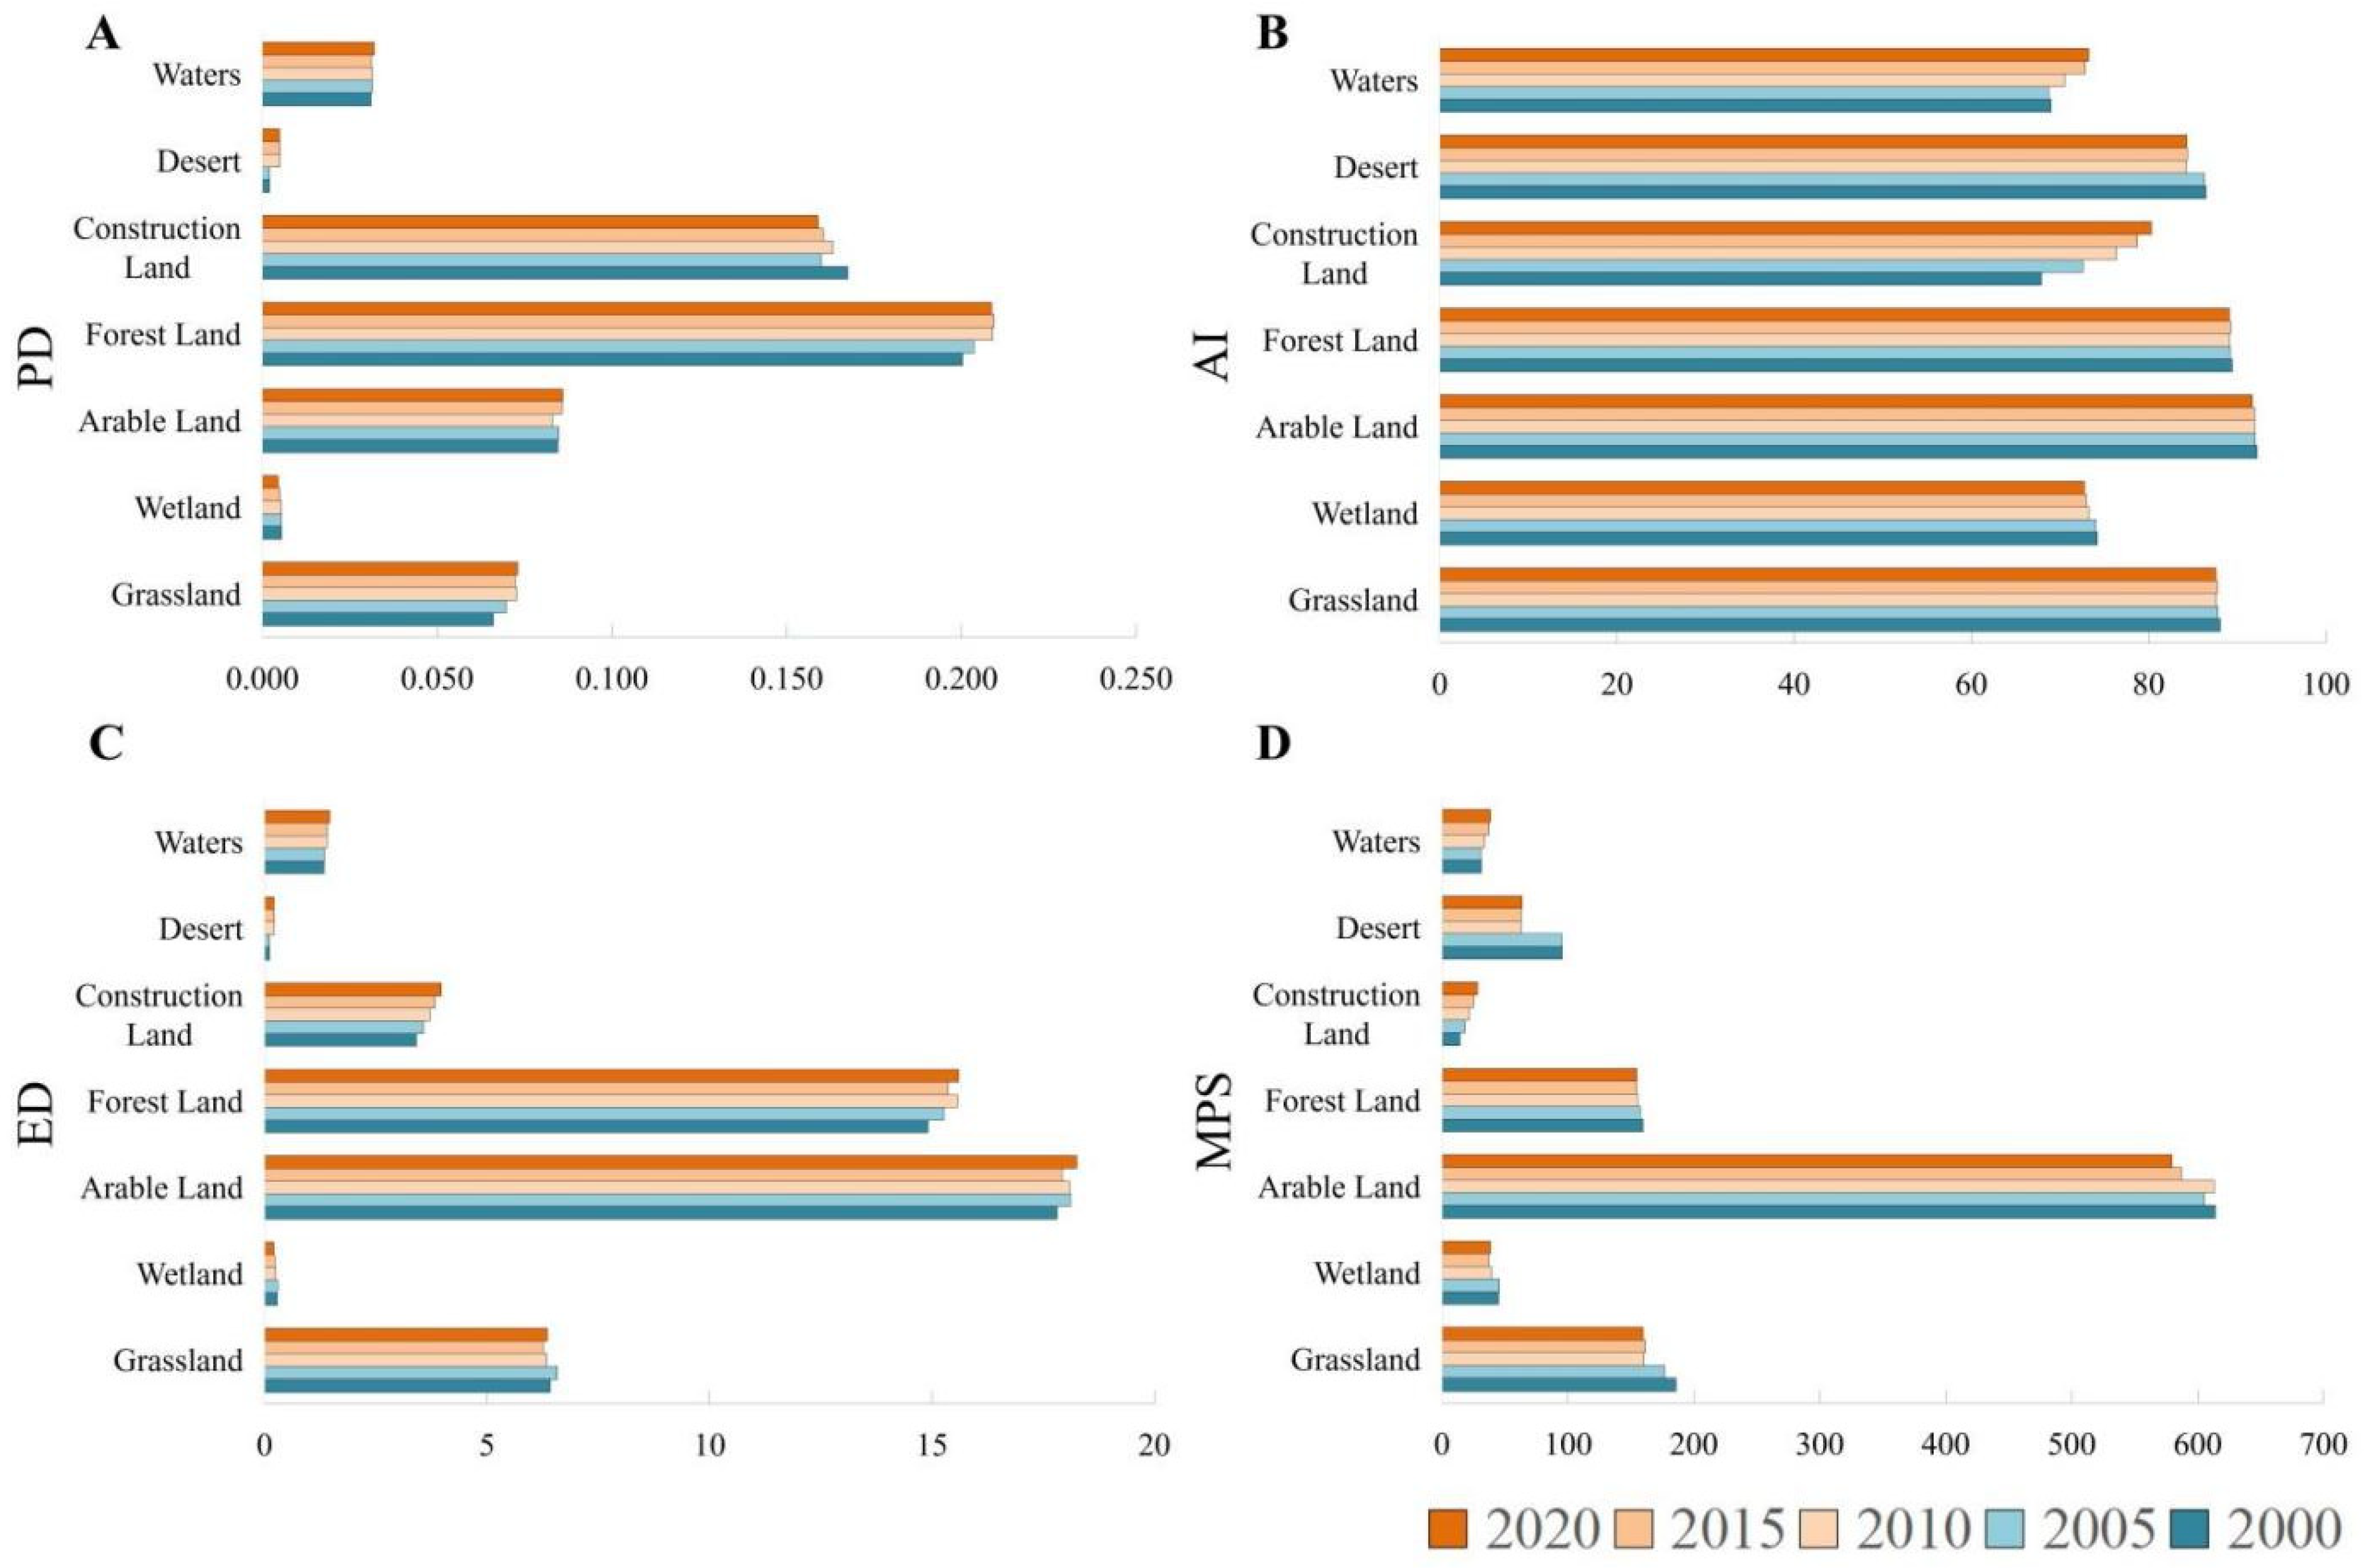
3.1.2. Characteristics of Structural Changes in Landscape Patterns

Landscape-level indices revealed that, over the past 20 years, the overall landscape of the WSUA has undergone significant fragmentation, characterized by irregular landscape patches and high fragmentation levels. This led to the formation of numerous small patches, thereby diminishing landscape connectivity; however, the patches exhibited diverse characteristics. Throughout the study period, CONTAG consistently declined, while SHDI consistently increased. PD demonstrated an overall increasing trend, peaking in 2010 before it began to decline. DIVISION exhibited a steady increase, peaking in 2015, and subsequently began to decline. LSI exhibited a significant upward trend between 2000 and 2010, followed by a decline in 2015, and then peaking in 2020 (Figure 6).
At the type level, over the past 20 years, arable land, forest land, grassland, and desert have become increasingly fragmented and dispersed, illustrating a fragmentation trend. Meanwhile, the edges of construction land continuously extended, enhancing overall integrity and increasing aggregation. Water distribution became more complex and diverse, with abundant water bodies maintaining a high level of aggregation. Wetland patches have become more concentrated and contiguous, resulting in weakened edge effects and an increase in the overall scale. The highest ED, MPS, and AI values were observed in arable land, forest land, and grassland. This indicated that arable land, forest land, and grassland were the primary land use types in the study area, with these three landscape types being fragmented into several large patches. PD peaked in forest land and showed an increasing trend, whereas the PD of construction land significantly decreased. Significant growth in MPS and AI was noted in construction land, indicating the rapid expansion and aggregation of this land type. Desert and grassland were the land types that experienced the most substantial reduction in MPS, indicating their high vulnerability to human encroachment, which exacerbated their fragmentation (Figure 7).

3.2. Spatial and Temporal Changes in ESV

3.2.1. Temporal Variability Analysis

From 2000 to 2020, the ESV in the study area increased by CNY 2.619 billion, primarily due to significant contributions from forest land and waters (Figure 8). The contribution rates of ESV in the study area were ranked as follows: forest land > grassland > arable land > waters > wetland > desert. The primary components included forest land, grassland, arable land, and waters, collectively accounting for over 99% of the total. Notably, forest land exhibited the highest contribution rate to ESV, surpassing 56%. Over the study period, the ESV of forest lands and waters continued to rise, with a significant increase after 2005. In contrast, grasslands, arable lands, wetlands, and deserts exhibited declining trends, particularly with grasslands and wetlands experiencing sharp decreases in ESV after 2005.
Over the study period, the ESV in the study area was ranked as follows: Regulatory Services (RS) > Support Services (SS_support) > Supply Service (SS_supply) > Cultural Service (CS) (Table A4). Specifically, CR, HR, SC, GR, BD, and DTE made significant contributions, accounting for 25%, 18%, 11%, 10%, 9%, and over 7%, respectively, and together represented more than 83% of the total ESV. During this period, the ESV for HR and WS increased significantly by 8.31% and 7.35%, respectively. However, the ESV of FP decreased by CNY 388 million, mainly due to the continued reduction in arable land area.

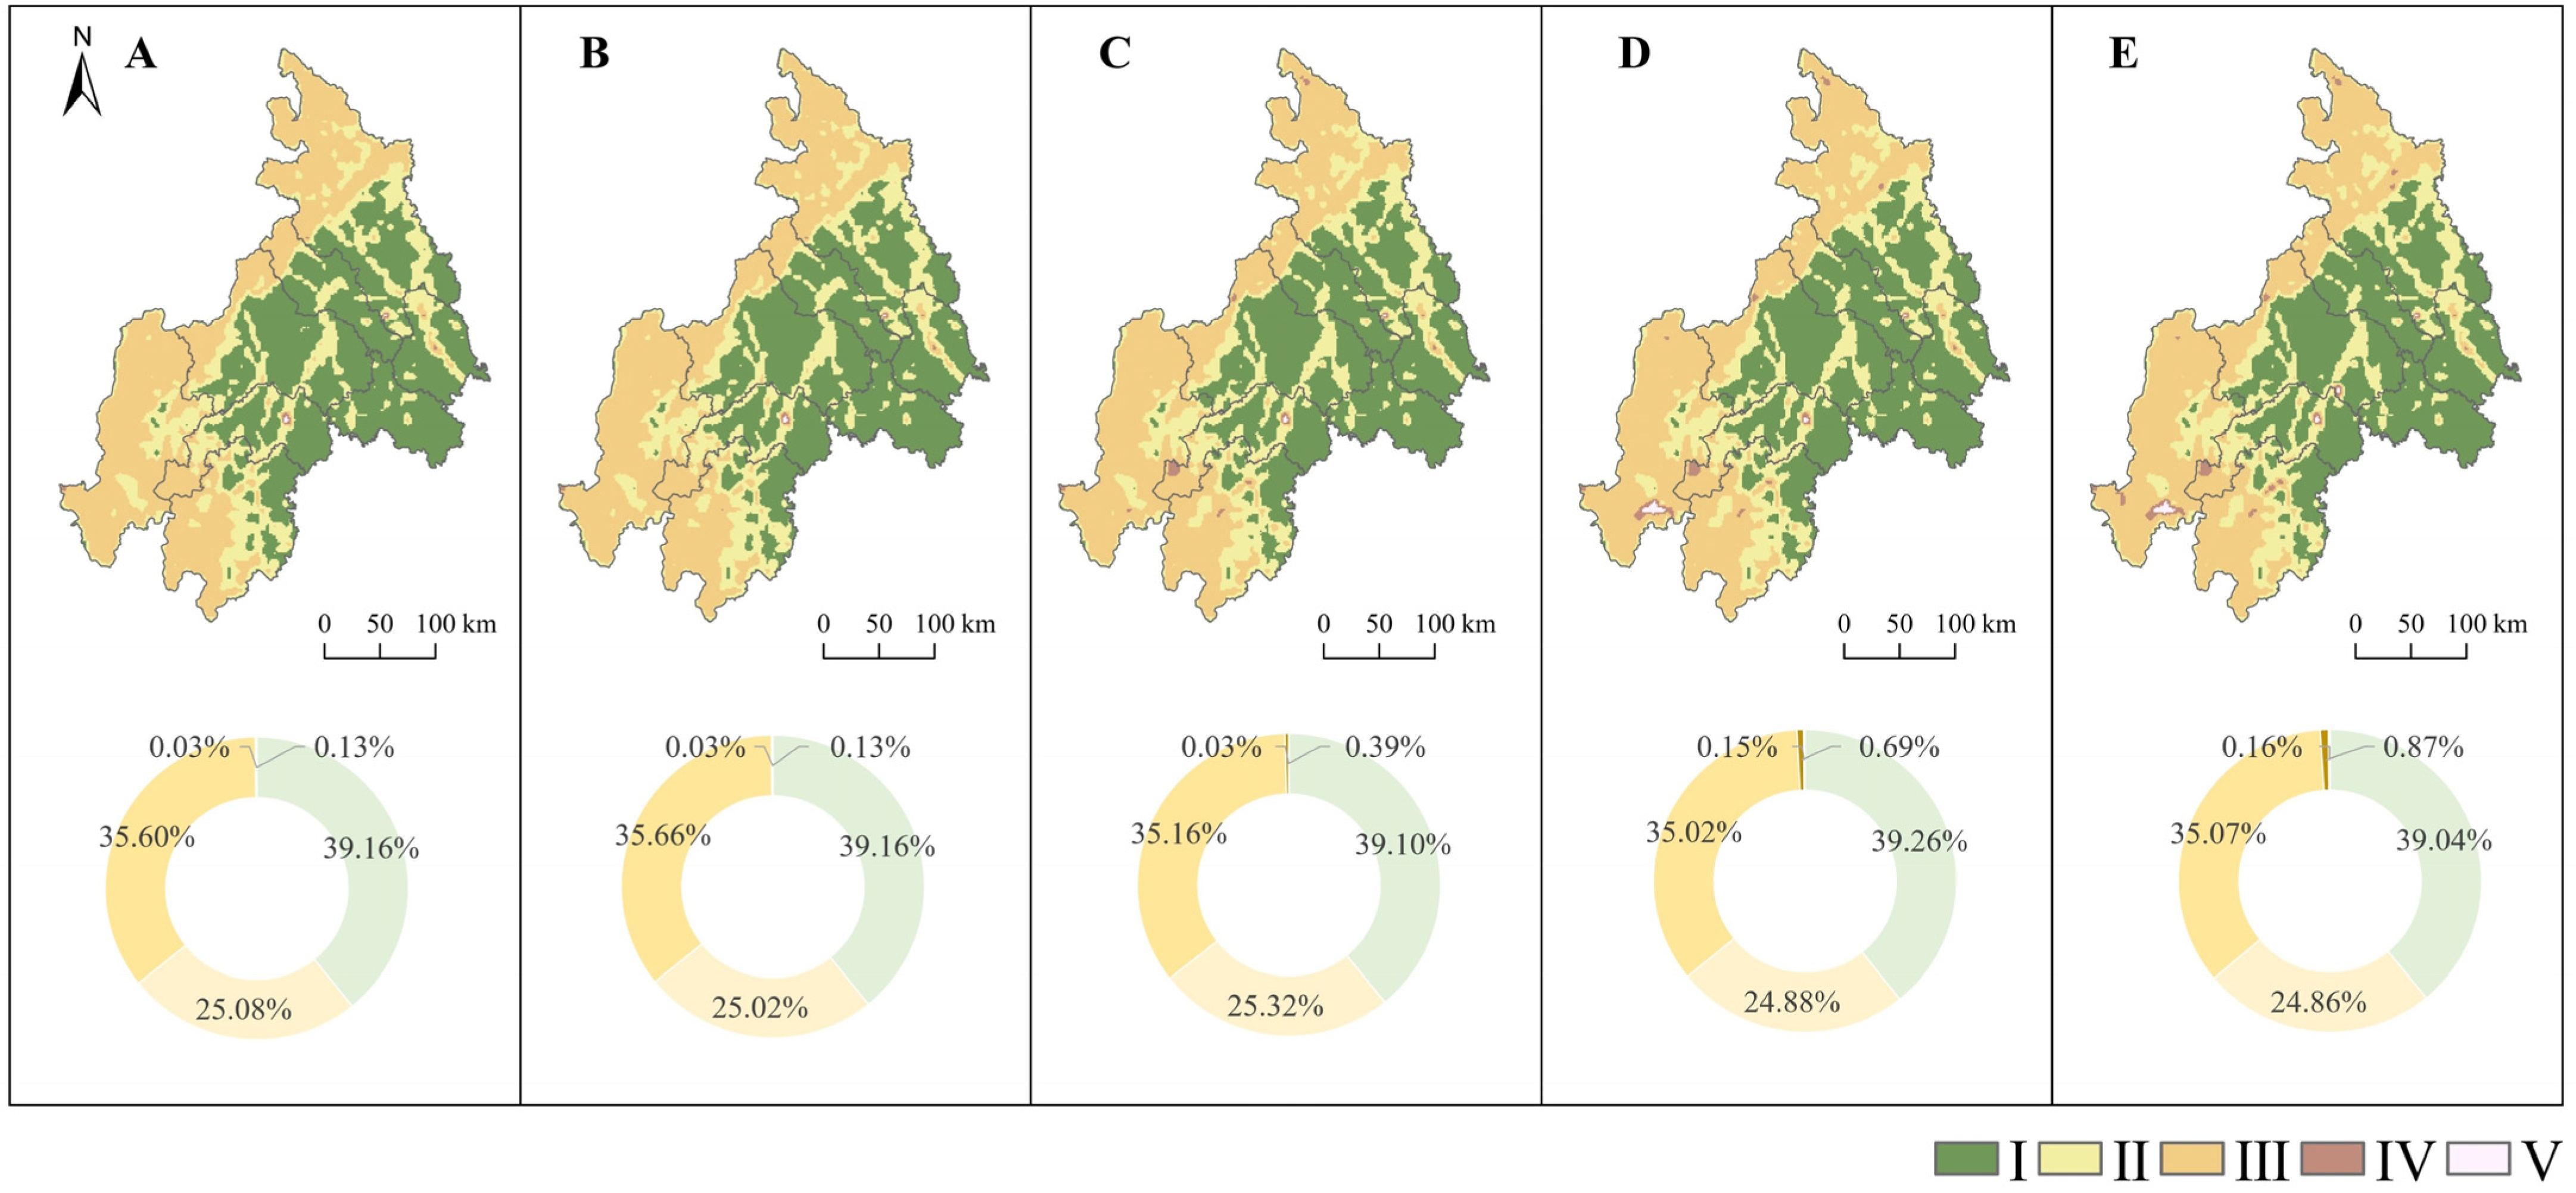
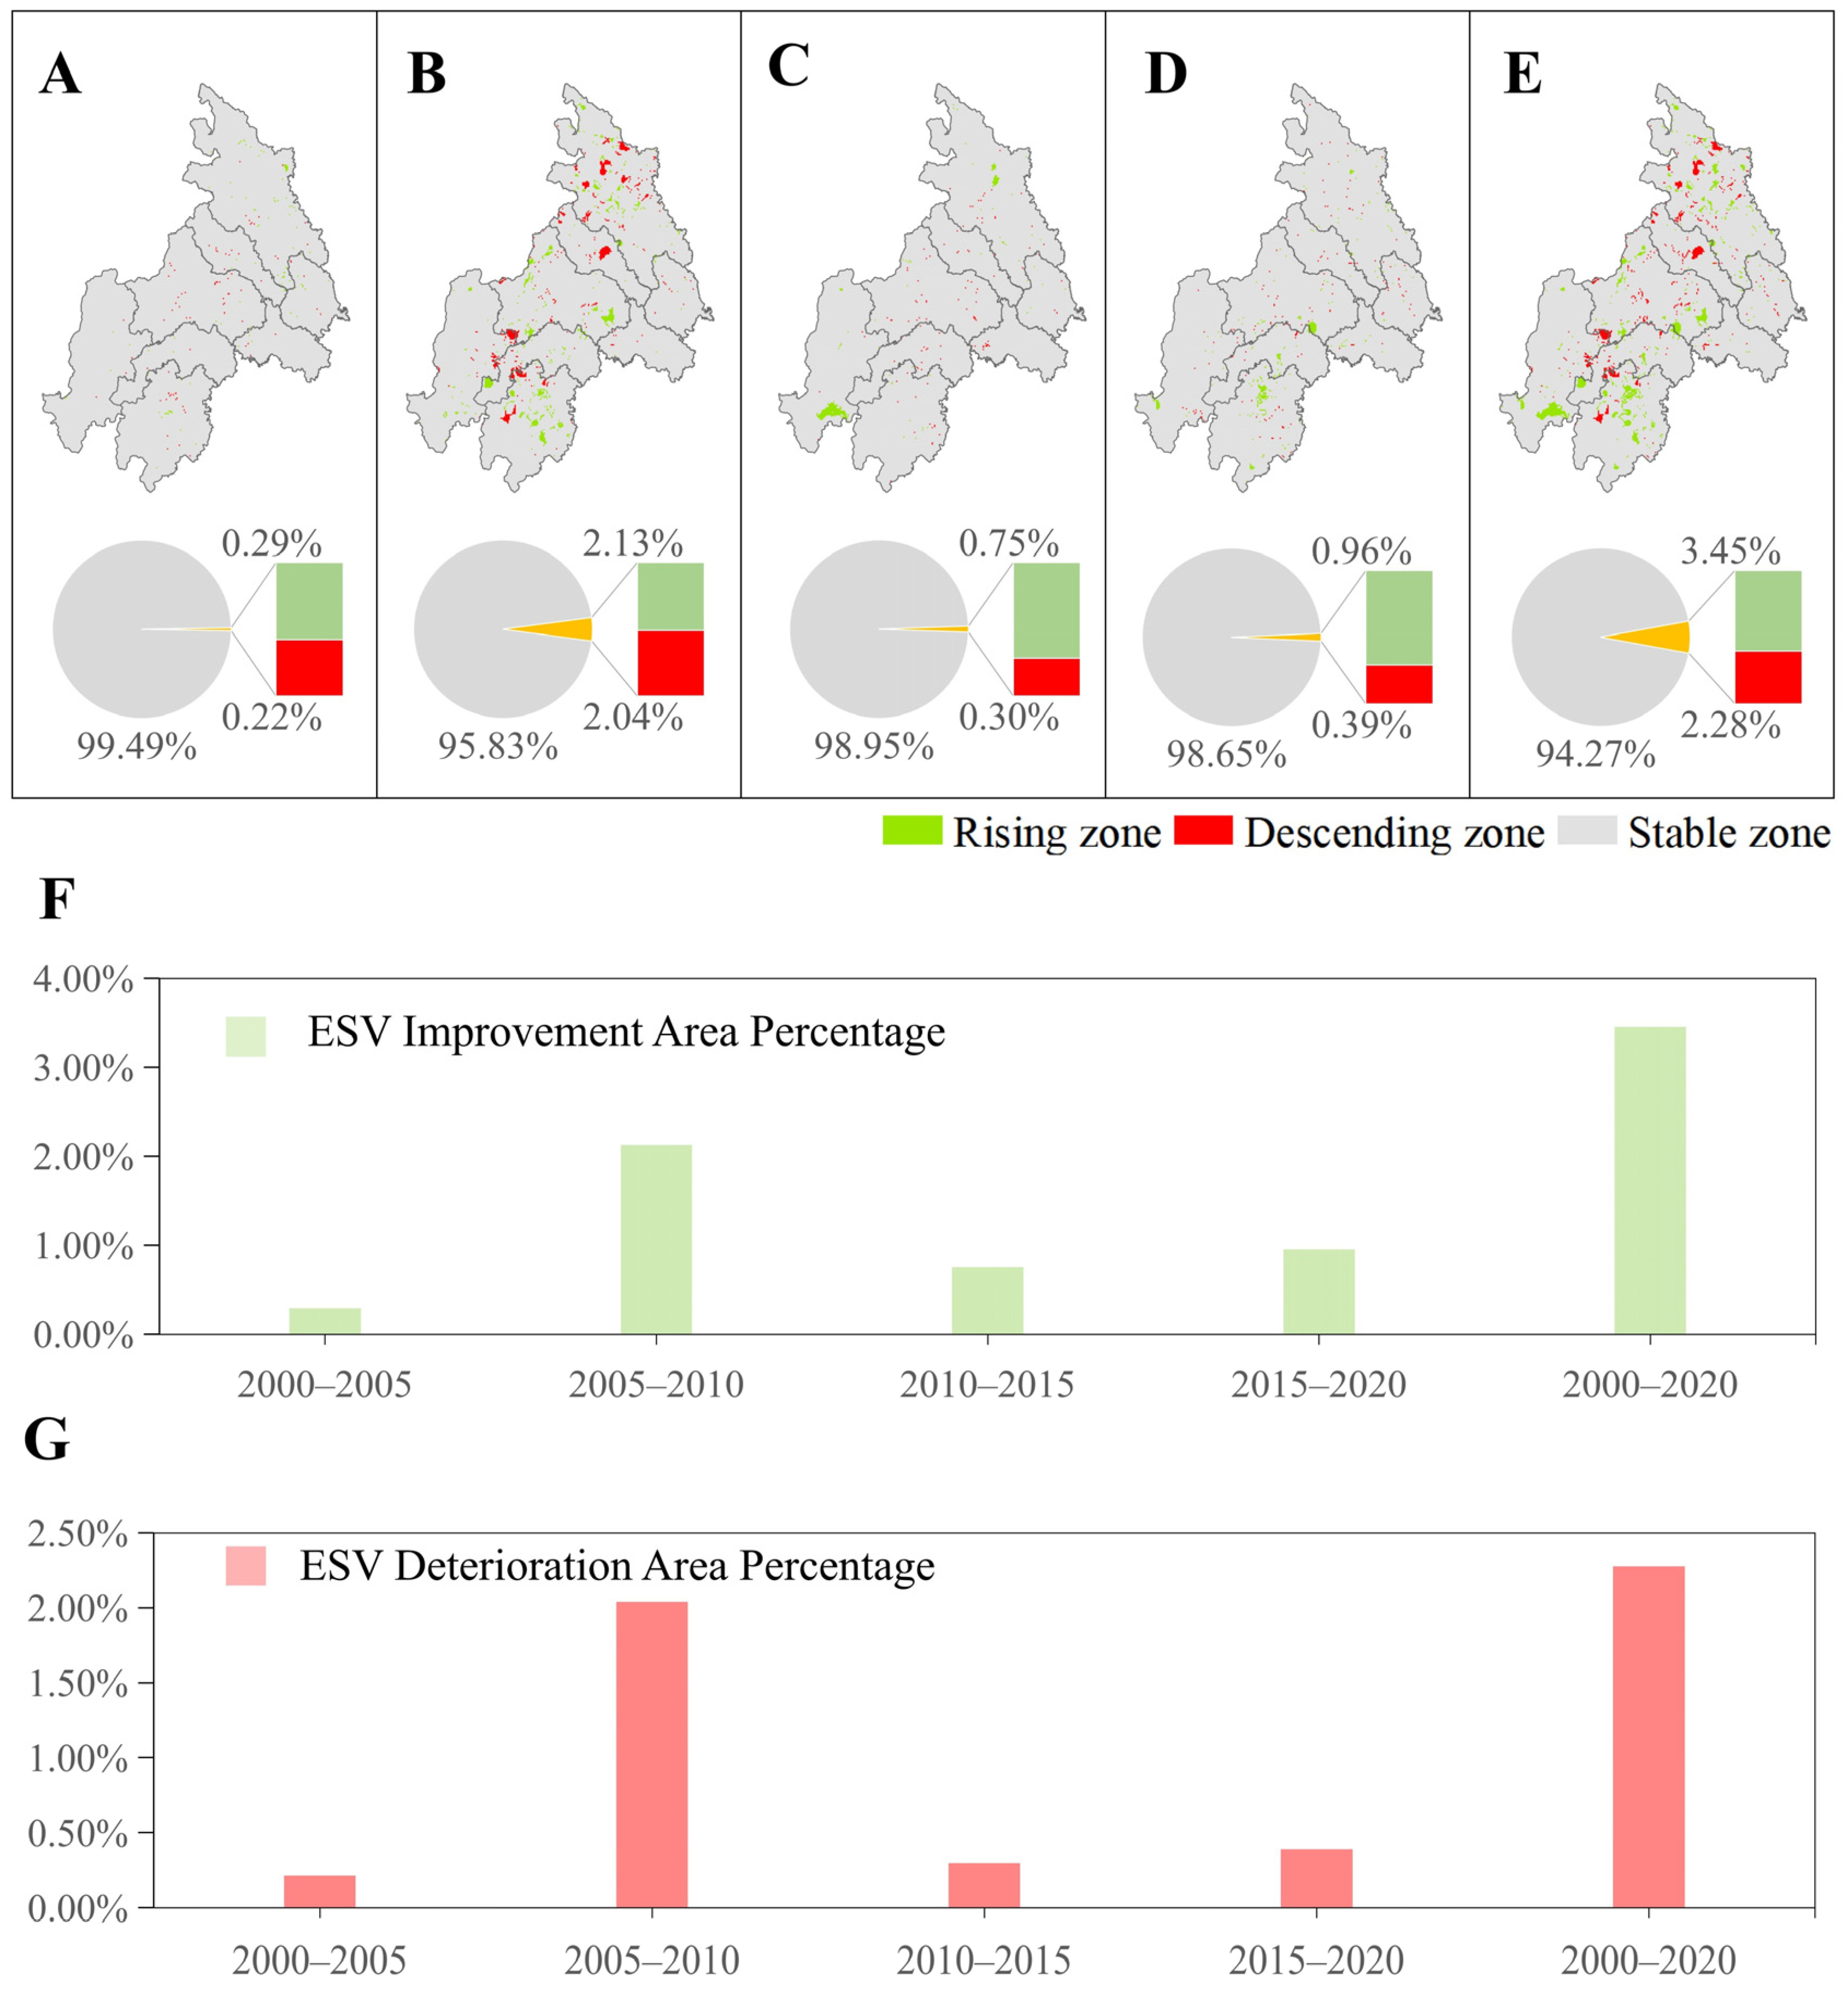
3.2.2. Spatial Variability Analysis

In terms of spatial distribution, the ESV in the WSUA from 2000 to 2020 showed significant variation, with higher values generally observed in the northern, western, and southern edges, gradually decreasing toward the east (Figure 9). Areas with high ESVs were mainly distributed in the northern and southwestern mountainous regions, as well as along river corridors encompassing Ya’an, Leshan, northwestern Chengdu, and northwestern Mianyang, corresponding to the presence of forests and rivers. Areas with moderate ESVs were located in the eastern part of the WSUA and along riverbanks, which correlated with the distribution of grasslands. Low ESVs were observed in the eastern and central parts of the study region, as well as in the central areas of each city, which coincided with urban development zones.
From 2000 to 2020, the spatial dynamics of ESV across the WSUA remained largely stable, with areas of improvement and degradation accounting for only 3.45% and 2.28%, respectively (Figure 10). Over the past two decades, ESV improvements were detected across all cities, particularly in Mianyang, Chengdu, Ya’an, and Leshan, with improvements mainly concentrated in river and lake regions such as the Dadu River, Minjiang River, Fujiang River, Sancha Lake, Wawu Mountain, and Longcanggou National Park, as well as in agricultural and ecological conservation zones along these waters. These regions overlapped with areas where arable land was converted to forest, grassland, and waters, likely driven by ecological protection policies and natural recovery processes. Initiatives such as reforestation and wetland restoration have improved vegetation cover and enhanced water retention capacity. Between 2000 and 2020, ESV degradation primarily occurred in peri-urban areas and expanding rural settlements, particularly in the hilly to plain transition zones of Ya’an and Mianyang. These regions coincided with areas that experienced both the conversion of arable land to construction land and the transformation of forest and grassland into arable land. This trend was likely driven by urbanization and agricultural expansion, as the encroachment of arable land on forests and grasslands weakened ecosystem service capacity. In contrast, the expansion of construction land further accelerated the decline in ESV. Specifically, over the five periods from 2000 to 2020, both areas of ESV improvement and degradation showed an upward trend; however, the proportion of improvement consistently exceeded that of degradation. Notably, the most significant changes in ESV occurred between 2005 and 2010.

3.2.3. Sensitivity Analysis of ESV

From 2000 to 2020, the sensitivity indices of ESV for all landscape types in the WSUA remained consistently below 1. The sensitivity ranking was as follows: forest land > grass land > arable land > waters > wetland > desert. Forest land exhibited the highest sensitivity, maintaining a value consistently above 0.56. The sensitivity of grassland, arable land, and waters was also relatively high, each exceeding 0.08. Over the 20 year period, the sensitivity of forest land and waters increased, rising from 0.56532 to 0.56602 and from 0.08291 to 0.10408, respectively. In contrast, the sensitivity of arable land and grassland showed a downward trend, decreasing by 0.00816 and 0.01088, respectively (Table 1).

3.3. The Response of ESV to Changes in Land Use Processes and Landscape Pattern Structures

3.3.1. Impact of Land Use Processes on the ESV

(1)
Impact of land use area on the ESV
The correlation analysis between various ESV components and different land use types revealed that land use composition and changes in the study area had a significant influence on ESV. The arable land area showed significant positive correlations with FD, RMP, GR, SC, and MNC, as well as significant negative correlations with WS, DTE, and HR. The grassland area exhibited significant positive correlations with RMP, GR, CR, SC, MNC, BD, and AL. The wetland area was significantly positively associated with most ESV components, except for a significant negative correlation with WS and HR. The desert area exhibited significant negative correlations with RMP, GR, SC, MNC, BD, and AL. The water body area was significantly negatively correlated with FD, RMP, GsR, CR, SC, MNC, and BD, and was significantly positively correlated with WS, DTE, and HR (Table A5).
(2)
The effects of land use transitions on the ESV
The conversion of ecological land during urbanization had a significant impact on ESV. Over the past two decades, transitions that led to an increase in ESV primarily fell into two categories. The first category involved conversion from residential and productive land to ecological land, with dominant transformations from arable and construction land to forests, grasslands, and water bodies accounting for more than 80.09%. The second category included transitions between different types of ecological land, particularly from land types with lower ecosystem service coefficients to those with higher ones, such as grasslands transitioning to water bodies and wetlands, which accounted for over 15.17%. The main types of transitions resulting in a decline in ESV can also be classified into two categories. The first involved the conversion of ecological land to residential and productive land, particularly grasslands and water bodies being converted into arable land, as well as arable and ecological lands being transformed into construction land, accounting for 81.45%. The second category involved transitions from ecological lands with high ESV coefficients to those with lower ones, representing 5.25% (Table A6).

3.3.2. Response of ESV to Landscape Pattern Structures

(1)
Landscape level indices impacts on ESV
A more fragmented landscape pattern was associated with higher total ESV. Total ESV showed a strong positive correlation with SHDI and a strong negative correlation with CONTAG. Specifically, strong correlations were observed among landscape metrics (PD, DIVISION, SHDI, CONTAG) and various ecosystem service functions. PD and DIVISION exhibited significant negative correlations with FP, RMP, GR, MNC, BD, and AL. Conversely, CONTAG was significantly positively correlated with FP, RMP, GR, and SC, but negatively correlated with WS, DTE, and HR. Similarly, SHDI was positively correlated with WS, HR, and DTE, but negatively correlated with FP, RMP, GR, SC, and also DTE (Figure 11).
(2)
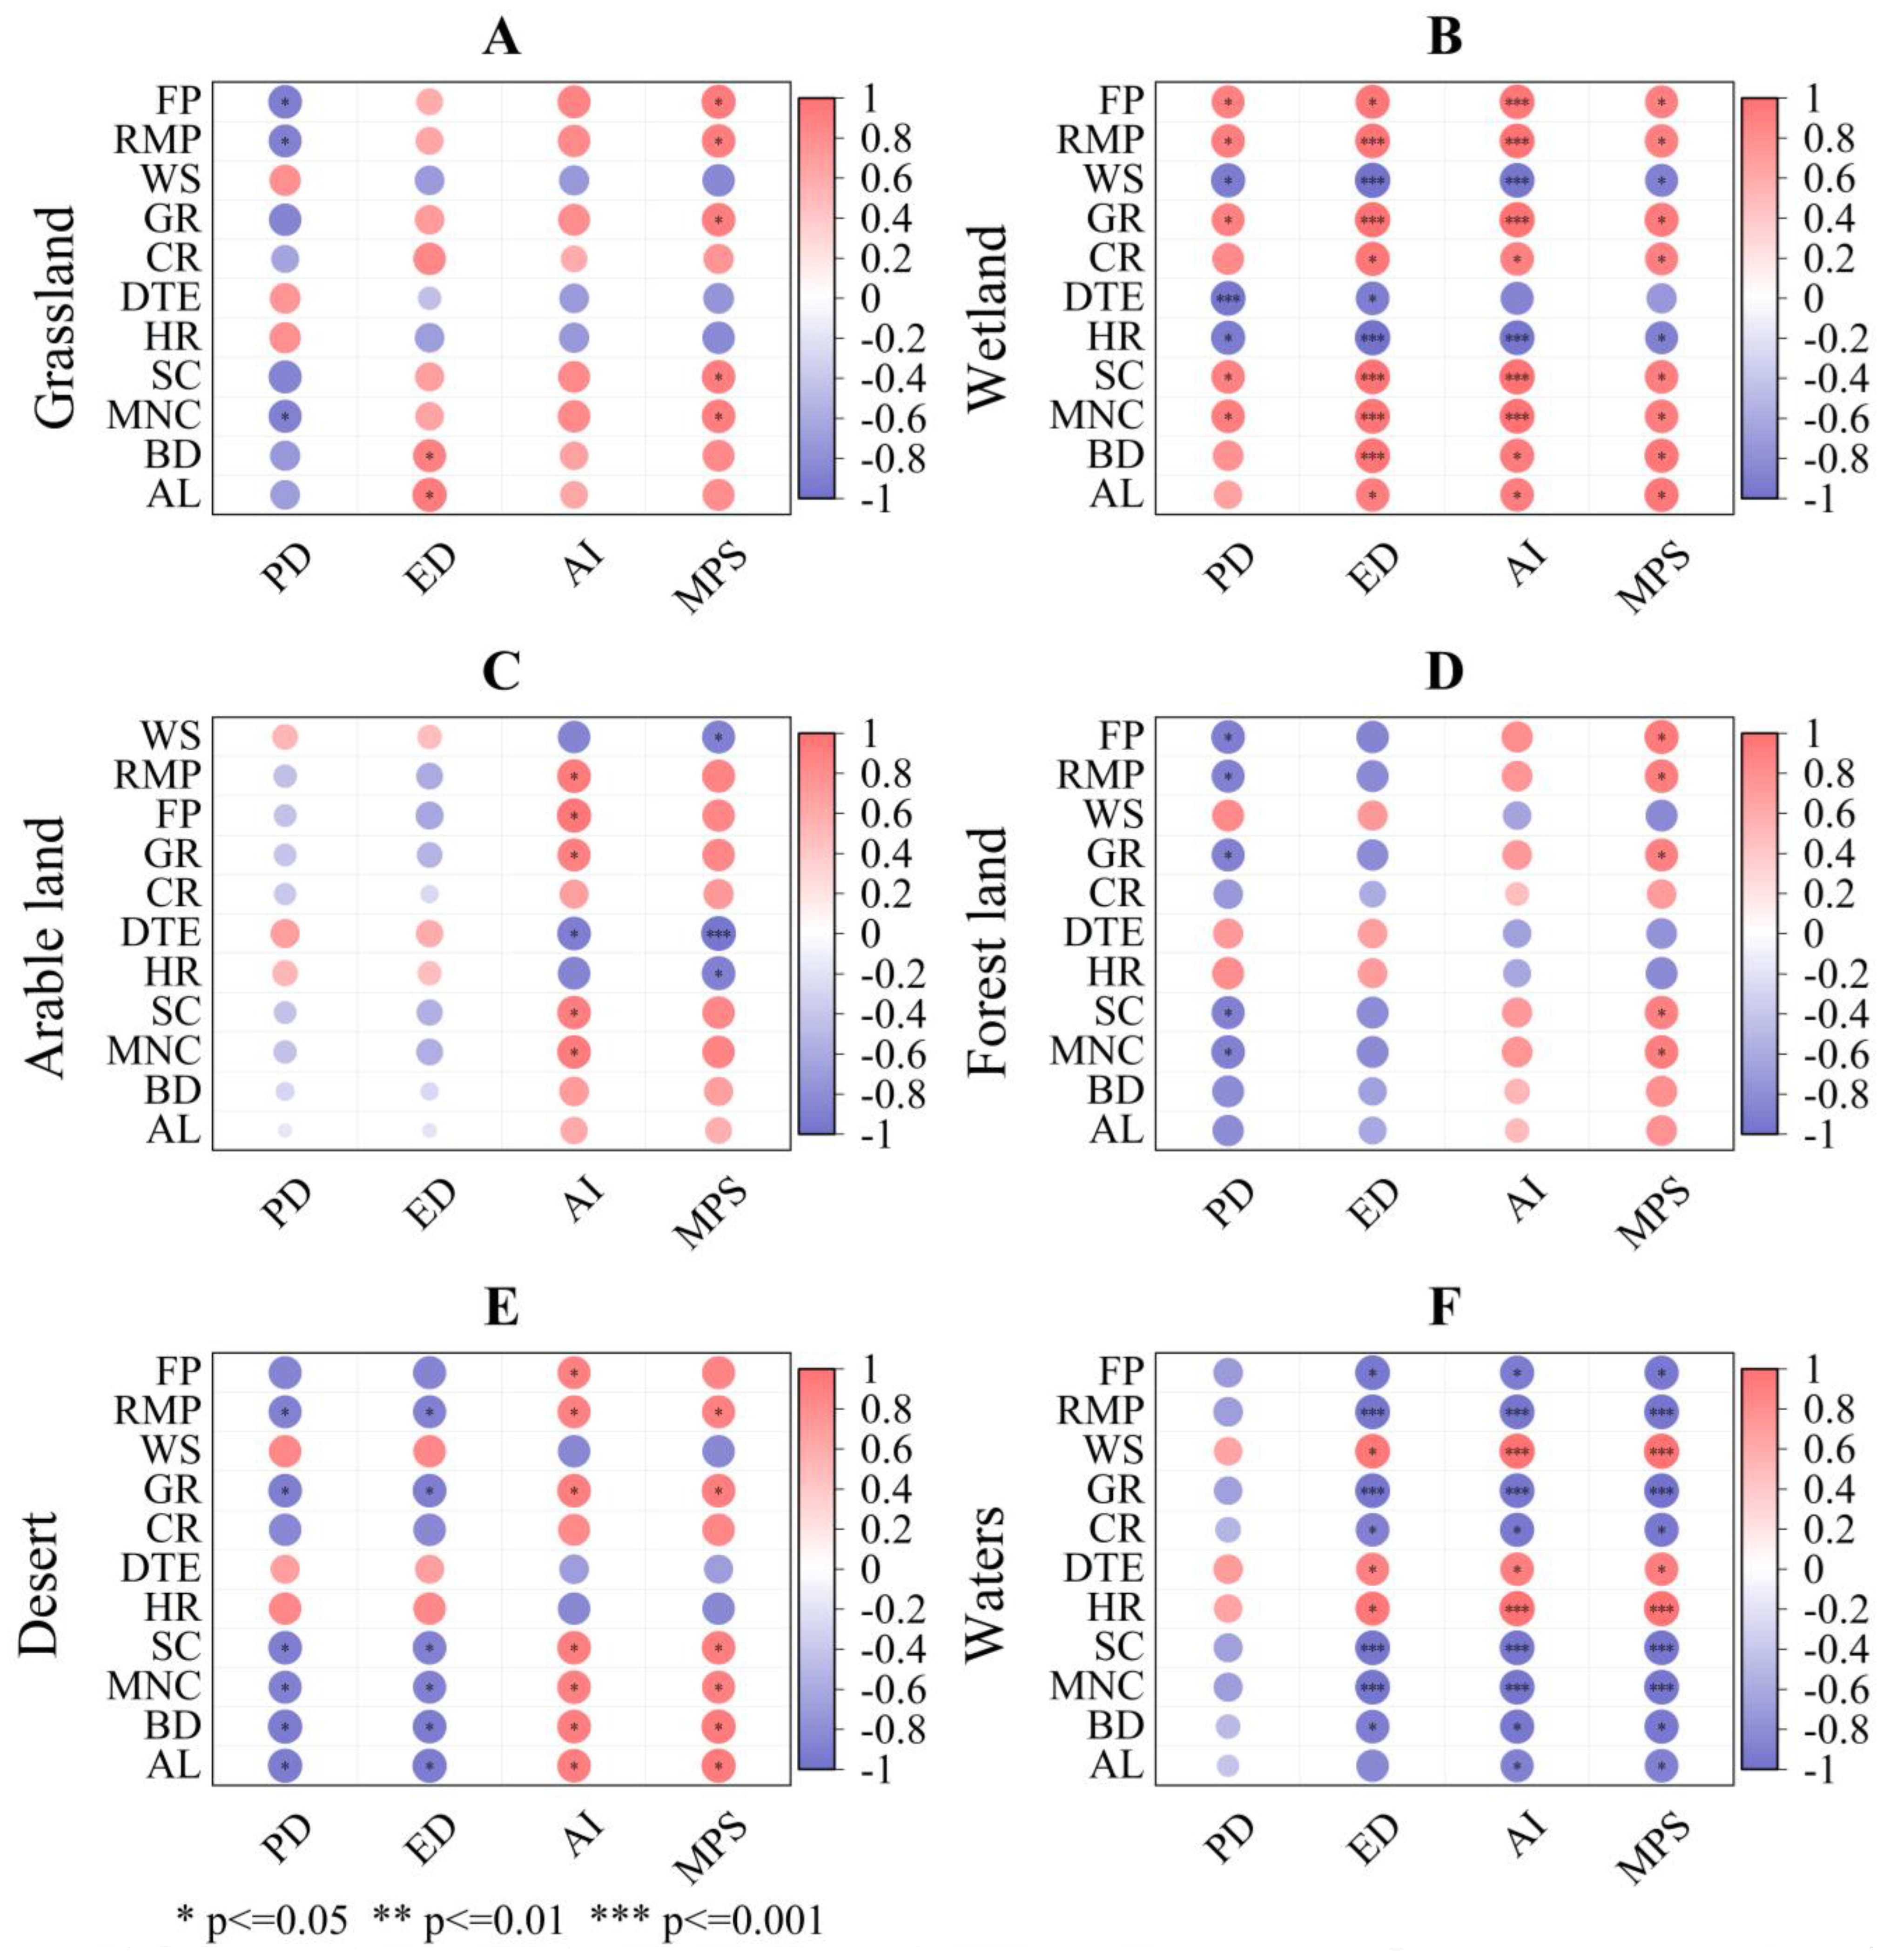
Impact of landscape type level indices on ESV
The findings indicate that the increased connectivity of similar landscape patches is crucial for enhancing ESs, especially in ecological lands. The MPS of forests and grasslands was strongly positively correlated with various ecosystem service functions, including FP, RMP, GR, SC, and MNC. The AI of arable land was significantly positively correlated with FP, RMP, GR, SC, and MNC, but significantly negatively correlated with DTE. The PD and ED of deserts were significantly negatively correlated with RMP, GR, SC, MNC, BD, and AL. The ED and AI of waters were significantly positively correlated with HR, WS, and DTE. The PD, ED, AI, and MPS of wetlands were significantly positively correlated with FP, RMP, GR, SC, and MNC (Figure 12).

4. Discussion

4.1. Land Use Processes Lead to Structural Changes in Landscape Patterns

Land use change research aims to identify the trends, underlying drivers, and consequences of land use over defined time periods [41]. In the context of rapid urbanization and policy incentives, land use in the WSUA has undergone frequent and complex transformations over the past two decades. A “four increases and three decreases” pattern emerged, characterized by the most significant expansion of construction land and the largest loss of arable land. A notable trend of conversion between arable land and forest land was also observed. On one hand, policies such as the Implementation Opinions on Several Policy Measures for Western Development accelerated urban expansion, leading to the encroachment of construction land on arable land. On the other hand, ecological policies—including the Regulations on Returning Farmland to Forests, Sichuan’s Water Pollution Control Action Plan, and farmland protection measures—facilitated the conversion of arable land into forests and water bodies, with some forest land being reverting to agricultural use. This interplay illustrates the growing tension between agricultural production and ecological conservation. Notably, after 2005, the decline in arable and grassland areas slowed, likely due to the implementation of a series of land protection and ecological restoration policies, such as the National Grain Production Development Plan (2006–2020) and the 11th Five-Year Plan for Livestock Development (Table A1). After 2010, the expansion of construction land slowed due to stricter national land use planning, improved land management, and Sichuan’s initiatives to coordinate industrialization and urbanization. These measures included optimizing spatial layout, restricting land quotas, and reinforcing approval procedures. Additionally, under the combined influence of ecological protection policies, new urbanization strategies, and macroeconomic regulation, the overall expansion of construction land has been effectively controlled, while still ensuring land allocation for key infrastructure projects [43].
Amidst rapid urbanization, land use changes profoundly impacted landscape patterns [70]. The accelerated urbanization of the WSUA propelled the expansion of construction land, making it a primary driver of landscape fragmentation. Urbanization directly increased landscape diversity while simultaneously exacerbating habitat fragmentation, progressively raising the isolation level among different regions within the urban agglomeration. Notably, the outward expansion of construction land in the central urban areas encroached upon large arable land areas, leading to fragmentation and scattering, further impacting the integrity of ecological lands such as forests, grasslands, and waters. This expansion trend was especially pronounced in 2005, particularly in the central region of the study area, where construction land density markedly increased, likely linked to rapid urbanization and large-scale infrastructure projects. The chaotic growth in the initial phase of this expansion diminished the overall integrity and connectivity of the natural landscape, worsening the extent of landscape fragmentation. Notably, with the involvement of planning management and ecological restoration, the trend of landscape fragmentation showed signs of alleviation by 2010. The execution of more scientifically informed land use planning and ecological restoration initiatives, along with a deceleration in urbanization, resulted in a more orderly distribution of landscape patches, balancing human impacts on landscape patterns and decreasing fragmentation. This suggests that effective land use planning and management are crucial for maintaining landscape stability and conserving the ecological environment. The primary influence of land use changes in the WSUA on landscape patterns is reflected in the fragmentation and division caused by rapid urbanization and construction land expansion. Nevertheless, effective land use planning and management can mitigate landscape fragmentation trends, thereby preserving the integrity and stability of ecosystems.

4.2. ESV Responds to Changes in Land Use Processes and the Structure of Landscape Patterns

Human activities are one of the primary drivers of land use change [70,71,72]. These activities are shaped and regulated by policies, which, in turn, can be influenced and modified by human actions [73,74]. An analysis of the impact of land use changes on ESV shows that the region has experienced rapid urbanization, with a significant expansion of construction lands. However, the total ESV increased by CNY 2.619 billion, with a notable rise, particularly between 2010 and 2020. This finding contrasts with existing studies suggesting that the rapid expansion of construction lands leads to a decline in ESV [75,76]. This indicates that the impact of land use changes on ESV varies across regions due to differences in land use planning and management, land use changes, and ecosystem service types influenced by economic and policy factors.
The Chinese government has made significant efforts to implement ecological protection initiatives [77,78,79]. However, due to the complexity of land systems and regional disparities in natural resource availability and economic development, governments at all levels face multiple challenges and varying demands when formulating and implementing land policies [80,81]. Policies that emphasize ecological restoration and management in land use planning play a vital role in maintaining and enhancing ecosystem service value (ESV). For instance, Guo et al. [82] found that the Environmental Protection Red Line policy safeguarded ecological land from land use changes, thereby enhancing ESs. Similarly, Yu et al. [83] found that environmental compensation effectively promoted the growth of ESV in the Xin’an River Basin. This study further confirms that the impact of policies on ESV varies significantly across different regions. The conversion of arable land and construction land to ecological land types—such as forests, grasslands, and water bodies—within the study area resulted in a CNY 2.218 billion increase in ESV. These ESV gains were predominantly located in areas where cropland was converted into forests, grasslands, and water bodies, with a spatial overlap of 40.9% between zones of ESV increase and these types of land conversions. These findings suggest that state-led ecological protection policies—such as the Grain-to-Green Program, ecological redline regulations, and compensation mechanisms—have played a critical role in enhancing ESV. Therefore, amid rapid urbanization, it is essential to comprehensively consider ecological, economic, and social factors in land use planning, implement ecologically prioritized land use policies, and strengthen the protection of ecological lands—including forests, grasslands, wetlands, and water bodies—to promote ESV growth. By contrast, under land use policies that prioritize economic development, ESV in many regions tends to decline, especially when ecological land is reduced. For example, Cao et al. [84] found that land-driven urbanization in China led to substantial losses in the ESV of wetlands. Similarly, Liu et al. and Duan et al. [19,85] reported that the reduction in ecological land areas—such as forests, grasslands, and wetlands—caused a notable decline in ESV. This study revealed that ESV declines were predominantly concentrated in the peripheral zones of urban and rural settlements, with a high spatial overlap (75.33%) between ESV reduction areas and the conversion of forests and grasslands into arable land, as well as arable land into construction land. This phenomenon is closely associated with rapid urbanization, especially during periods when government policies prioritized economic development, with the expansion of construction land as the main driver. The peripheral zones of urban and rural settlements typically serve as transitional areas between arable land and ecological land. As urban expansion continues, large areas of arable land are converted into construction land. Meanwhile, the arable land occupation compensation policy has caused forests and grasslands to be converted into cropland to compensate for farmland loss, significantly weakening ecosystem service functions. These findings indicate that policy regulations are a key driver of land use changes, particularly by influencing the extent of ecological land, thereby altering the supply of ES. Well-designed ecological protection policies and effective land management strategies can enhance ESV, whereas insufficient policy support may accelerate ecosystem degradation (Figure A3).
Landscape patterns refer to the spatial arrangement and organization of different land use types within a geographic area. Changes in these patterns are key indicators of land use transformation and significantly influence ecosystem structure and processes, thereby directly affecting ESs [86,87,88]. In the WSUA, the expansion of construction land has encroached upon arable and forest lands, leading to greater fragmentation, increased landscape diversity, and reduced connectivity—yet, paradoxically, ESV has significantly increased. However, previous studies have shown that higher fragmentation levels are often linked to lower ESV. For example, Biswas et al. [89] reported that fragmentation in Jangipur significantly reduced regional ESV, while Hou et al. [90] observed similar negative effects in Xi’an. These disparities suggest that the impacts of landscape fragmentation on ES is spatially context-dependent and multifaceted, potentially mediated by land use type, fragmentation scale, and local ecological characteristics. Therefore, more in-depth studies that account for regional heterogeneity are urgently needed. Interestingly, some studies have identified positive ecological outcomes under certain fragmentation conditions. For instance, Zhu et al. [65] found that, in the farmland-dominated region of Nanchang, higher fragmentation increased landscape diversity, which in turn promoted ecosystem functions and enhanced overall ESV. Our findings in WSUA corroborate these observations, suggesting that landscape fragmentation can, under certain conditions, enhance ESV. This may be attributed to the fragmentation of large arable land patches caused by land expansion, creating a heterogeneous mosaic of forests, water bodies, grasslands, arable lands, and construction lands. Such complexity enhances ecological diversity and creates diverse land use interfaces, which can increase provision, regulation, and support for ESs. Additionally, the region’s pronounced topographic variation and geomorphic complexity may interact with fragmentation to increase spatial heterogeneity, supporting a wide range of ecosystems—such as forests, grasslands, and wetlands—at different elevations and across various terrain types. This ecological diversity fosters functional complementarity and strengthens ecosystem processes such as water conservation and soil retention, ultimately contributing to the optimization of ESV in the WSUA.
Research on the correlation between ES and type-level relationships can demonstrate the effect of landscape aggregation and fragmentation on ESV [65]. Studies have shown that human activities increase the fragmentation and dispersion of arable land, forests, grasslands, and deserts while construction land aggregation rises. As a dominant landscape type, arable land shows more significant benefits with higher aggregation, supporting large-scale agricultural management, improving food production efficiency, and enhancing the service value of food and raw material production. Furthermore, the greater the aggregation of ecological lands, such as forests, grasslands, waters, and wetlands, the greater the resulting ESV. In summary, the aggregation and fragmentation of different landscapes have far-reaching effects on ESV. As human activities continually transform land use patterns, proper planning and management of various land types, mainly arable and ecological lands, are crucial for ensuring and enhancing ESV. Therefore, the WSUA should adopt a well-designed land use strategy, promoting the aggregation of ecological lands and focusing on protecting forests, grasslands, waters, and wetlands. This approach will enhance functionality in water resource management, food production, and nature conservation, achieving a harmonious balance between ecological protection and socio-economic development.
This study found that the ESV of the WSUA increased by CNY 26.19 billion, directly supporting the development of the regional green economy by enhancing the capacity for ecological product provision (e.g., water source conservation and carbon sinks) while also creating pathways for value transformation in emerging industries, such as environmental compensation and ecotourism. This increase supports the development of green industries in the WSUA, including the growth of ecological tourism and carbon trading markets, driving the transformation of the local economy and promoting green growth. The improved environmental environment has enhanced residents’ quality of life while generating new opportunities for ecological compensation and green employment, fostering sustainable development within the regional society. Notably, this increase in value arises from the unique “process–structure–value” coupling mechanism: in the context of land use changes driven by human activities and ecological policies (process), the conversion of farmland into forests, grasslands, and water bodies reshapes the landscape’s heterogeneity (structure). Enhancing patch diversity and connectivity within the landscape pattern promotes the synergistic effects of various ecosystem elements, ultimately driving the improvement of ESV (value). Unlike traditional research that focuses solely on the direct impact of land use changes or landscape pattern evolution on ESV, the framework proposed in this study systematically reveals the cascading transmission mechanism between land use process changes, landscape pattern evolution, and ESV changes [44,45]. It explores how land use changes, by influencing landscape structure changes, further drive the increase in ESV, which feeds back into land use decisions. The case of WSUA demonstrates that, although the expansion of built-up land exacerbates landscape fragmentation, positive ESV growth can still be achieved by scientifically guiding the spatial aggregation of ecological land (e.g., improving forest patch connectivity). In subsequent sections, this provides a theoretical foundation for developing “process–structure synergy optimization” land policies.

4.3. Suggestions for Optimizing ESV in the WSUA

Drawing from the above analysis, the ESV of the study area exhibits specific vulnerabilities. Therefore, several recommendations are proposed to optimize policies, offering guidance for tailoring urban agglomerations’ land use and landscape structure to local conditions (Figure A2).
(1)
To ensure the long-term ecological sustainability of the WSUA, it is crucial to accurately designate ecological priority protection zones, optimize green space planning, promote the multifunctional ecological use of farmland, and implement a region-specific ecological compensation mechanism. In regions where ESV is steadily improving, priority ecological protection zones should be designated by the Technical Guidelines for Ecological Red Line Delineation. Core areas where ESV has shown a sustained and substantial increase, such as the Ya’an section of the Dadu River, should be established as permanent conservation zones with stringent development limitations. Meanwhile, areas with steady ESV growth potential, such as the upper Minjiang River reforestation belt, can facilitate the growth of environmentally friendly industries. Furthermore, a coordinated “core ecological protection zone–urban ecological buffer belt” system should be implemented, establishing a 100–300 m-wide buffer around ESV-enhancing areas while strictly regulating development intensity. For arable land bordering protected areas, “ecological conservation-oriented farming” should be adopted. Regions such as Ya’an and Meishan could implement the “wetland farm + ecological picking garden” model to establish a mutually beneficial balance between conservation and development. A “performance-driven” ecological compensation system should be established to support these initiatives. Provincial financial resources should be allocated for ESV improvement, with a tiered compensation structure applied to regions within protected zones that exhibit sustained ESV growth. Compensation standards should align with the Sichuan Provincial Watershed Horizontal Ecological Protection Compensation Incentive Policy Implementation Plan and be adjusted dynamically based on the annual ESV variation rate.
(2)
Based on the sensitivity and spatial distribution of ESV, ecological restoration zones should be strategically delineated along urban fringes to create a well-connected ecological network that integrates mountains, rivers, forests, farmlands, lakes, and grasslands. Sensitivity analysis revealed that forestland exhibited the most pronounced response to ESV variations, underscoring its essential regulatory and conservation functions. Therefore, restoring forest ecosystems should be prioritized to preserve both their integrity and connectivity. It is recommended that ecological restoration zones be established in areas experiencing significant ecosystem degradation—such as regions with declining ESV and fragmented forests—particularly along urban fringe areas impacted by expansion. These zones should enhance the stability and connectivity of ecological networks by integrating habitat patches and restoring ecological corridors. Priority should be given to water source protection and wetland restoration projects to rehabilitate aquatic ecosystems and enhance water quality regulation. The development of the Minjiang–Dadu River ecological corridor with wetland restoration and ecological shoreline transformation will promote connectivity within the upper Yangtze River aquatic ecosystems and help regulate regional hydrological processes. A green corridor linking Longquan Mountain and the Tuojiang River should be established based on a mountain–river ecological coupling framework. This initiative will restore natural riparian zones along the Tuojiang River, reconnect fragmented mixed forests in Longquan Mountain, and establish ecological buffer zones in peri-urban areas, forming a continuous landscape-scale ecological network. Furthermore, “forest–grassland” ecological corridors should be created on the urban periphery. For instance, a biodiversity corridor connecting the Longmen and Qionglai Mountains should be delineated with habitat identification, ecological corridor restoration, and disturbance regulation. This would help sustain the genetic exchange of endangered species, such as the giant panda, preserve upstream water sources of the Yangtze River, and mitigate ecological fragmentation caused by urban expansion in the WSUA.
(3)
To optimize ecological networks and multifunctional landscape management, it is essential to integrate current land use patterns, economic development levels, and policy directives by implementing a regionally differentiated and category-specific strategy. In the biodiversity core zone of Longmenshan-Qionglai Mountain, natural restoration should be prioritized, with strict development controls. In the core area of the WSUA, existing land resources should be revitalized with urban renewal and the redevelopment of inefficient land use (e.g., old factories and urban villages). The transit-oriented development model should be promoted, prioritizing high-density development around high-speed rail and metro hubs. Adopting the “ecological function zone and permeable green infrastructure” approach in city centers is advisable. For instance, Chengdu’s central district should maintain a green coverage rate of over 20%, with main road green belts measuring no less than 30 m in width. Furthermore, implementing “green roofs and rain gardens” should be encouraged to strengthen ecological connectivity. In the low-mountain ecological forestry zone of Longquanshan, an east–west ecological buffer zone should be established to expand mixed forests, promote suburban recreational green corridors, and limit high-density development, thereby curbing urban sprawl, enhancing ES, and mitigating soil erosion. In the eastern hilly farmland protection area, a “field–forest–pond” integrated ecological network should be developed, the rice-fish farming model should be promoted, and spatial flexibility for urban expansion should be preserved to achieve farmland protection, non-point source pollution mitigation, and urban-rural coordinated development. The “government–market–community” model should be adopted, integrating financial subsidies, ecological compensation, and public–private partnership mechanisms to secure financial sustainability. Public engagement, environmental education, and community co-construction should be promoted to foster public acceptance and advance sustainable development.
Furthermore, the potential impacts of current land use processes and landscape pattern evolution on future ESV should be examined. This study reveals that landscape fragmentation generally increased from 2000 to 2020; however, the diversity and heterogeneity of landscape types significantly improved, contributing to the overall increase in ESV. ESV notably increased in areas where forests and water bodies expanded, indicating that moderate fragmentation, diversified configurations, and the expansion of ecological land have somewhat optimized the structure of ES. However, if urban expansion and the occupation of arable land continue in the future, they may further reduce the connectivity of core ecological patches, intensify the fragmentation of ecological land patterns, and undermine the stability, supply, and regulatory functions of ecological networks. The risk of functional degradation due to “disordered fragmentation” should be carefully monitored. In contrast, ecological restoration, the expansion of blue-green spaces, and the enhancement of patch integration and boundary optimization are expected to improve the spatiotemporal stability of ESV. It is recommended to incorporate land use simulation and scenario prediction models into spatial planning, integrate remote sensing monitoring with ecosystem simulation, develop dynamic ESV evolution models, and enhance the foresight and adaptability of land management. This approach would support the development of a “simulation–response–optimization” framework, continuously improving ecosystem service functions.

4.4. Limitations

This study builds upon theories from landscape ecology, geography, and urban planning and adopts the “process–structure–value” framework to examine the interrelationships among land use processes, landscape patterns, and ESV in the WSUA. However, several limitations should be considered. A Pearson correlation analysis was employed to quantify the relationships between land use change, landscape structure, and ESV. While the results suggest that ESV is primarily influenced by dominant ecological landscape types, with distinct regional disparities, these relationships are not strictly causal. Instead, they reflect complex interactions among multiple factors, underscoring the need for a deeper investigation into their underlying mechanisms. Additionally, measurement errors, scale effects, and sampling biases may influence the robustness of the findings. Future research should interpret correlation results cautiously, incorporate multi-source data and diverse methodological approaches to validate the outcomes, and consider developing a complex network model linking the three dimensions. Such efforts could strengthen the theoretical foundation of the “process–structure–value” framework and enhance its practical relevance. Furthermore, the influence of landscape metrics on ESV may differ across spatial scales. This study did not perform a multi-scale landscape analysis, which limits insights into scale-dependent effects. Future studies should integrate multi-scale metrics to better understand the sensitivity and spatial responses of ESV to changes in landscape patterns. Finally, this research did not include land use simulation models to assess future changes. Integrating landscape-driven models—such as the Land Patch, Cellular Automata (LP–CA) approach—could help simulate ESV dynamics under alternative land use scenarios, providing stronger support for spatial planning and ecological conservation. Although the CNLUCC dataset used in this study offers relatively high classification accuracy, the region’s complex terrain may introduce uncertainties. Combining high-resolution remote sensing data with field observations in future research would help improve the accuracy of fine-scale analyses. Despite these limitations, this study presents a valuable case that can inform land use planning and ecosystem management in mountainous urban agglomerations.

5. Conclusions

This study evaluates changes in land use and landscape patterns in the WSUA and investigates the relationship among land use processes, landscape pattern structure, and ESV. The results demonstrate that, in the context of rapid urbanization, policy regulations and human activities in the WSUA have significantly driven the dynamic evolution of land use processes, resulting in profound changes in landscape patterns. Over the past two decades, influenced by policies such as “Grain for Green” and farmland protection, as well as human activities, construction land has significantly expanded, and a dramatic trend in land transfer between arable land and forest land has emerged, leading to significant fragmentation of forests, grasslands, arable lands, and waters. Nevertheless, landscape heterogeneity has improved, and the overall structure has become increasingly complex. Furthermore, the ESV of the WSUA has increased by CNY 2.619 billion, with forests and grasslands being the primary contributors to ESV, while waters play a significant role in the dynamic changes in ESV. Simultaneously, HR and WS account for a substantial proportion of the service value, approximately 40%. The ESV is higher in the study area’s northern, western, and southern regions, decreasing towards the east, with areas of increased ESV concentrated primarily in ecological restoration zones, such as those involved in “Grain for Green” and “lake restoration”. Further analysis shows that the synergistic effects of land use processes and landscape structure are critical factors in enhancing the ESV of the WSUA. The transition from human-dominated construction land and arable land to nature-dominated forests and waters has significantly increased the ESV. Simultaneously, the increase in landscape diversity has a significant positive effect on overall ESV, and the enhancement of connectivity between similar landscape patches plays a crucial role in the functioning of ESs. However, despite the improvement in ESV, the ecological environment of the WSUA remains vulnerable. To balance economic development and ecological protection, based on the “process–structure–value” model, this study suggests measures for the WSUA, such as establishing environmental protection zones, promoting rational urban expansion, and developing ecological restoration areas. This aims to encourage policymakers to prioritize the protection of environmental functions when planning mountainous urban agglomerations and to guide the spatial arrangement of construction land and arable land development, providing decision-making support for regional sustainable development.
This study constructs a “process–structure–value” response framework to systematically reveal the synergistic impacts of land use and landscape pattern changes on ESV, providing new theoretical support for integrated assessments. Building on this foundation, future research should prioritize the development of new tools and frameworks to optimize ESV evaluation, strengthen ecological management and planning systems, and offer scientific guidance for land use strategies. These tools should enable the monitoring of long-term dynamics in land use and landscape patterns, along with their impacts on ESV, by leveraging data-driven approaches to improve the accuracy of land management. In the short term, integrating remote sensing with big data analytics can enhance the evaluation of land use processes, landscape evolution, and ecosystem service interactions, while supporting the formulation of policies focused on optimizing ecological functions and ensuring the sustainable provision of ESV. In the long term, efforts should focus on institutionalizing this framework and establishing a governance model rooted in legal and planning systems, engaging government agencies, research institutions, and social organizations to ensure the effective implementation of environmentally sustainable land management.

Author Contributions

J.W. (Jing Wang): Conceptualization, Methodology, Software, Visualization, Writing—original draft; P.P.: Conceptualization, Supervision, Writing—review and editing, Funding acquisition; T.L.: Supervision, Writing—review and editing, Conceptualization; J.W. (Juan Wang): Writing—review and editing; S.Z.: Writing—review and editing; P.N.: Writing—review and editing, Funding acquisition. All authors have read and agreed to the published version of the manuscript.

Funding

This research was supported by the Special Project of Orchid Survey of National Forestry and Grassland Administration (contract No. 2019073015); Henan Province 2023 Science and Technology Development Plan Science and Technology Research Project (Project No: 23210232027); Spatial and temporal characteristics and influencing factors of the distribution of giant panda’s staple bamboo based on the ecological and geological environmental information system (2024NSFSC0355).

Data Availability Statement

The raw data in this paper are available from 10.6084/m9.figshare.27321711.

Acknowledgments

We thank the anonymous reviewers and the editor for their valuable comments and suggestions, which contributed to improving this work.

Conflicts of Interest

The authors declare no competing interests.

Appendix A. Appendix Tables

Table A1. Time series of Chinese policies related to the research findings.
TimePolicyMeasuresMainly Affects the Type UsedRelated Research Results
1998–2020Decision of the People’s Government of Sichuan Province on Implementing the Natural Forest Resources Protection ProjectTake resolute measures to stop the logging of natural forests, strengthen forest resource management, and promote the construction of ecological public welfare forests.Forest landIncrease in forest land from 2000 to 2020.
2001Implementation Opinions on Several Policy Measures for Western DevelopmentImprove the approval efficiency of construction land, reduce approval procedures, and promptly provide and ensure land for economic development, infrastructure, and industrial parks as the demand for land increases.Construction landExplosive increase in construction land.
2002Regulations on Returning Farmland to ForestsFarmland with a slope greater than 25 degrees should be converted back to forests or grasslands, with corresponding subsidies provided.Arable land, forest land, grass landFrom 2005 to 2010, the most converted land was arable land, with the majority being transferred to forest land (92,990.43 hm2).
2006—2020National Grain Production Development Plan (2006–2020)Implement the strictest farmland protection system, adopt practical and feasible measures, encourage farmers to plant grain and local governments to focus on grain production, and stabilize the grain sowing area at a reasonable level.Arable landAfter 2005, the rate of decline in arable land slowed down.
200611th Five-Year Plan for Livestock DevelopmentStrengthen grassland construction and environmental protection and promote the harmonious development of animal husbandry and grassland ecology.Grass landAfter 2005, the rate of decline in grassland slowed down.
2006Notice on Strengthening Land Regulation IssuesClarify the responsibilities for land management and arable land protection and prohibit the unauthorized conversion of agricultural land into construction land.Arable landAfter 2005, the rate of decline in arable land slowed down.
2008Special Plan for Ecological Restoration in the Post-Wenchuan Earthquake Recovery and ReconstructionProtecting natural forests, converting farmland to forests, converting grazing land to grassland, closing mountains for forest restoration, afforestation, and comprehensive watershed management, with ecological restoration projects implemented in the upper reaches of the Min River, Jialing River, Fu River, and Bailong River basins.Forest landThe restoration of forest land in Mianyang and the northwest of Chengdu aligns with the distribution of high-value and increasing ESV areas.
2009–2020Development Plan for the Chengdu Plain Urban AgglomerationIncrease forest coverage and strictly control development in the western mountainous areas.Forest land, construction landFrom 2000 to 2020, the forest area increased, and the high-value ESV areas were primarily distributed in the northern and southwestern mountainous regions.
2011Opinions on Accelerating the Interactive Development of New-Type Industrialization and New-Type UrbanizationCoordinate the spatial layout of urban and rural development, make reasonable use of natural resources such as land and water, and protect the natural ecological environment.Construction landAfter 2010, the expansion of construction land slowed down.
2016Sichuan’s Water Pollution Control Action PlanStrictly manage the urban planning blue line and ensure that a certain proportion of water area is retained within the urban planning area. New projects must not unlawfully occupy urban wetlands, rivers, lakes, or other water bodies.Waters, wetlandFrom 2000 to 2020, the area of water bodies increased.
2017–2020Sichuan Province “13th Five-Year” Ecological Protection and Construction PlanFocus on protecting forests, grasslands, farmland, wetlands, and river ecosystems.Forest land, grass land, waters, arable landFrom 2015 to 2020, ESV significantly increased.
2018Sichuan Province Ecological Protection Red Line PlanThe distribution pattern of ecological protection red lines in Sichuan Province is ‘Four Axes and Nine Cores’. The ‘Four Axes’ refer to the Daba Mountains, the lower reaches of the Jinsha River’s arid river valley, the southeastern Sichuan mountains, and the hilly areas within the basin, which are distributed in a belt-like shape. The ‘Nine Cores’ refer to the Ruoergai Wetland (Yellow River Source), the Yalong River Source, the Dadu River Source, as well as the Daxue Mountain, Shaluo Mountain, Min Mountain, Qionglai Mountain, Liangshan-Xiangling, and Jinping Mountain, which are concentrated and distributed in large areas, with water systems and mountain ranges serving as their framework.Forest land, grass land, waters, desertESV improvement areas are distributed across various cities, mainly in Mianyang, Chengdu, Ya’an, and Leshan. These areas are primarily located in river and lake regions such as the Dadu River, Min River, Fu River, and Sancha Lake, as well as in some agricultural areas along the rivers. They overlap with areas where cropland has been converted into forest, grassland, and water bodies.
Table A2. Selected landscape pattern indexes.
Landscape Pattern IndexLandscape LevelFormulaEcological Meaning
PDCategory/Landscape P D = N A
A is the overall landscape area and N represents the quantity of landscape plates.
The overall patch count in the landscape indicates its heterogeneity and fragmentation. A larger value corresponds to a higher degree of fragmentation.
MPSCategory M P S = A N × 10 6
A is the overall landscape area and N is the number of landscape plates.
The mean area of a specific patch type indicates landscape heterogeneity.
EDCategory E D = E A × 10 6
E denotes the cumulative length of all patch boundaries within the landscape and A is the overall landscape area.
Reflects the degree of landscape fragmentation: the larger the value, the greater the landscape fragmentation.
AICategory A I = g i i m a x g i i
gii represents the count of neighboring patches of the same landscape type.
Reflects the degree of aggregation of plaques: the larger the value, the more concentrated the plaques.
LSILandscape L S I = 0.25 E A
E denotes the cumulative length of all patch boundaries within the landscape and A is the overall landscape area.
Reflects the shape characteristics of patches within the landscape, with larger values indicating more complex types and shapes and more separated patches.
SHDILandscape S H D I = i = 1 N p i ln ( p i )
Pi is the area proportion of a landscape patch type i.
Reflecting the diversity and richness of landscape types, a decrease implies that particular landscape types are beginning to dominate or increase their coverage in the landscape.
DIVISIONLandscape D I V I S I O N = 1 j = 1 N a j T A 2
TA is the total area of the region; aj is the area of the jth patch of a given landscape type.
It indicates the extent of landscape fragmentation: the closer to 1, the more fragmented the landscape is.
CONTAGLandscape C O N T A G = 1 + i = 1 m j = 1 n P ij ln ( P i j ) 2 ln ( m )
Pij signifies the likelihood that two randomly chosen neighboring patches are of types i and j. Here, m denotes the total number of patch types.
It reflects the extent of aggregation among patch types, with larger values indicating that the landscape consists of a few clustered large patches with better connectivity.
Table A3. Ecosystem value coefficients for land use types in the WSUA.
Category ICategory IIArable LandForest LandGrasslandWeltlandDesertWatersConstruction Land
Supply service
(SS_supply)
FP2103.22 767.06 940.27 1261.93 0.00 1979.51 0
RMP989.75 1756.81 1385.65 1237.19 0.00 569.11 0
WS40.60 751.10 629.30 5257.73 0.00 16,828.81 0
Regulatory services
(RS)
GR1657.84 5814.80 4874.53 4701.33 49.49 1905.27 0
CR890.78 17,394.90 12,891.53 8907.77 0.00 5666.33 0
DTE247.44 4924.02 4255.94 8907.77 247.44 13,732.82 0
HR548.10 7125.35 7754.65 49,187.22 60.90 207,548.57 0
Support Services
(SS_support)
SC2090.91 5805.84 4872.03 4689.33 40.60 1887.91 0
MNC296.93 544.36 445.39 445.39 0.00 173.21 0
BD321.67 6433.39 5394.15 19,473.38 49.49 6309.67 0
Cultural service
(CS)
AL148.46 2820.80 2375.41 11,703.83 24.74 4676.58 0
Table A4. Changes in the value of individual ESVs in the WSUA, 2000–2020 (108 RMB).
Ecosystem ServicesESV/(108 RMB)2000–2020 ESV
(108 RMB)
Rate of Change/%
Category ICategory II20002005201020152020
SS_supplyFP127.66126.54125.49124.62123.78−3.88−3.04%
RMP108.50108.12107.47106.96106.48−2.02−1.86%
WS44.5244.5945.7446.9647.803.277.35%
RSGR289.61289.28287.64286.69285.81−3.79−1.31%
CR664.36665.65663.56662.72661.91−2.45−0.37%
DTE205.89206.29206.23206.85207.231.340.65%
HR488.76489.41503.34518.84529.3640.618.31%
SS_supportSC308.78308.20306.38305.23304.16−4.62−1.50%
MNC33.3633.2533.0432.8932.74−0.62−1.86%
BD259.02259.54258.28257.94257.72−1.30−0.50%
CSAL116.29116.52116.02115.96115.94−0.36−0.31%
Table A5. Correlation analysis of ESV and land use types. * p <= 0.05; ** p <= 0.01.
Land SpaceFPRMPWSGRCRDTEHRSCMNCBDAL
Arable land0.999 **0.993 **−0.962 **0.977 **0.825−0.955 *−0.960 **0.984 **0.992 **0.8490.767
Forest land−0.851−0.8410.782−0.856−0.7430.6360.775−0.854−0.846−0.846−0.858
Grassland0.8770.891 *−0.8720.920 *0.883 *−0.698−0.8670.912 *0.896 *0.951 *0.957 *
Weltland0.959 **0.980 **−0.990 **0.993 **0.948 *−0.899 *−0.989 **0.989 **0.981 **0.964 **0.913 *
Desert−0.873−0.880 *0.851−0.906 *−0.8510.6810.845−0.900 *−0.886 *−0.929 *−0.937 *
Waters−0.961 **−0.984 **1.000 **−0.991 **−0.945 *0.934 *0.999 **−0.989 **−0.984 **−0.943 *−0.875
Table A6. Changes in and contribution of major land use types to the improvement and deterioration of regional ESV, 2000–2020 (108 RMB).
PeriodPositive ESV EffectsNegative ESV Effects
Land Use TransfersESV ContributionPercentageLand Use TransfersESV ContributionPercentage
2000
–2020
Grassland–Forest land125.87 4.54%Grassland–Arable land253.47 10.28%
Grassland–Weltland0.92 0.03%Grassland–Desert10.36 0.42%
Grassland–Waters63.04 2.28%Grassland–Construction land23.38 0.95%
Arable land–Grassland205.75 7.43%Arable land–Desert0.97 0.04%
Arable land–Forest land1169.99 42.24%Arable land–Construction land235.14 9.54%
Arable land–Weltland24.40 0.88%Desert–Construction land0.00 0.00%
Arable land–Waters774.71 27.97%Forest land–Grassland91.25 3.70%
Desert–Grassland5.36 0.19%Forest land–Arable land1110.94 45.06%
Desert–Arable land0.17 0.01%Forest land–Desert60.78 2.47%
Desert–Forest land5.58 0.20%Forest land–Construction land45.22 1.83%
Desert–Weltland0.43 0.02%Weltland–Grassland0.35 0.01%
Desert–Waters14.53 0.52%Weltland–Arable land33.60 1.36%
Construction land–Grassland10.87 0.39%Weltland–Desert0.12 0.00%
Construction land–Arable land44.59 1.61%Weltland–Construction land11.44 0.46%
Construction land–Desert0.00 0.00%Weltland–Forest land1.14 0.05%
Construction land–Forest land20.23 0.73%Waters–Grassland11.44 0.46%
Construction land–Weltland2.20 0.08%Waters–Arable land408.81 16.58%
Construction land–Waters67.71 2.44%Waters–Desert6.74 0.27%
Forest land–Weltland1.95 0.07%Waters–Construction land101.65 4.12%
Forest land–Waters124.89 4.51%Waters–Forest land38.31 1.55%
Weltland–Waters106.50 3.85%Waters–Weltland20.54 0.83%
Total value2769.70 100.00%total value2465.66 100.00%

Appendix B. Appendix Figures

Figure A1. Changes in the spatial pattern of current land use in WSUA from 2000–2020. (A) Land use distribution of WSUA in 2000. (B) Land use distribution of WSUA in 2005. (C) Land use distribution of WSUA in 2010. (D) Land use distribution of WSUA in 2015. (E) Land use distribution of WSUA in 2020. (a) Typical area of construction land expansion. (b) Typical area of ecological land change.
Land 14 01012 g0a1
Figure A2. Ecological Planning Strategy for WSUA.
Land 14 01012 g0a2
Figure A3. Overlay and proportion analysis of land use transfer map and ESV spatial change map.
Land 14 01012 g0a3

References

  1. Costanza, R.; Hannon, B.; Limburg, K.; Naeem, S.; O’Neill, R.V.; Raskin, R.G.; Sutton, P. The Value of the World’s Ecosystem Services and Natural Capital. Nature 1997, 387, 253–260. [Google Scholar] [CrossRef]
  2. Balvanera, P.; Quijas, S.; Karp, D.S.; Ash, N.; Bennett, E.M.; Boumans, R.; Brown, C.; Chan, K.M.A.; Chaplin-Kramer, R.; Halpern, B.S.; et al. Ecosystem Services. In The GEO Handbook on Biodiversity Observation Networks; Walters, M., Scholes, R.J., Eds.; Springer International Publishing: Cham, Switzerland, 2017; pp. 39–78. ISBN 978-3-319-27288-7. [Google Scholar]
  3. Yu, B. Ecological Effects of New-Type Urbanization in China. Renew. Sustain. Energy Rev. 2021, 135, 110239. [Google Scholar] [CrossRef]
  4. Zang, S.; Wu, C.; Liu, H.; Na, X. Impact of Urbanization on Natural Ecosystem Service Values: A Comparative Study. Environ. Monit. Assess. 2011, 179, 575–588. [Google Scholar] [CrossRef] [PubMed]
  5. Li, J.; Chen, X.; De Maeyer, P.; Van de Voorde, T.; Li, Y. Ecological Security Warning in Central Asia: Integrating Ecosystem Services Protection under SSPs-RCPs Scenarios. Sci. Total Environ. 2024, 912, 168698. [Google Scholar] [CrossRef] [PubMed]
  6. Yu, C.; Zhang, Z.; Jeppesen, E.; Gao, Y.; Liu, Y.; Liu, Y.; Lu, Q.; Wang, C.; Sun, X. Assessment of the Effectiveness of China’s Protected Areas in Enhancing Ecosystem Services. Ecosyst. Serv. 2024, 65, 101588. [Google Scholar] [CrossRef]
  7. Hasan, S.S.; Zhen, L.; Miah, M.G.; Ahamed, T.; Samie, A. Impact of Land Use Change on Ecosystem Services: A Review. Environ. Dev. 2020, 34, 100527. [Google Scholar] [CrossRef]
  8. Mohammadyari, F.; Tavakoli, M.; Zarandian, A.; Abdollahi, S. Optimization Land Use Based on Multi-Scenario Simulation of Ecosystem Service for Sustainable Landscape Planning in a Mixed Urban—Forest Watershed. Ecol. Model. 2023, 483, 110440. [Google Scholar] [CrossRef]
  9. Luo, Y.; Guo, X.; Lü, Y.; Zhang, L.; Li, T. Combining Spatiotemporal Interactions of Ecosystem Services with Land Patterns and Processes Can Benefit Sensible Landscape Management in Dryland Regions. Sci. Total Environ. 2024, 909, 168485. [Google Scholar] [CrossRef] [PubMed]
  10. Gomes, E.; Inácio, M.; Bogdzevič, K.; Kalinauskas, M.; Karnauskaitė, D.; Pereira, P. Future Land-Use Changes and Its Impacts on Terrestrial Ecosystem Services: A Review. Sci. Total Environ. 2021, 781, 146716. [Google Scholar] [CrossRef]
  11. Kong, X.; Fu, M.; Zhao, X.; Wang, J.; Jiang, P. Ecological Effects of Land-Use Change on Two Sides of the Hu Huanyong Line in China. Land Use Policy 2022, 113, 105895. [Google Scholar] [CrossRef]
  12. Fang, L.; Wang, L.; Chen, W.; Sun, J.; Cao, Q.; Wang, S.; Wang, L. Identifying the Impacts of Natural and Human Factors on Ecosystem Service in the Yangtze and Yellow River Basins. J. Clean. Prod. 2021, 314, 127995. [Google Scholar] [CrossRef]
  13. Yang, Y.; Qin, T.; Yan, D.; Liu, S.; Feng, J.; Wang, Q.; Liu, H.; Gao, H. Analysis of the Evolution of Ecosystem Service Value and Its Driving Factors in the Yellow River Source Area, China. Ecol. Indic. 2024, 158, 111344. [Google Scholar] [CrossRef]
  14. Adelisardou, F.; Jafari, H.R.; Malekmohammadi, B.; Minkina, T.; Zhao, W.; Karbassi, A. Impacts of Land Use and Land Cover Change on the Interactions among Multiple Soil-Dependent Ecosystem Services (Case Study: Jiroft Plain, Iran). Environ. Geochem. Health 2021, 43, 3977–3996. [Google Scholar] [CrossRef] [PubMed]
  15. Pereira, P.; Inacio, M.; Kalinauskas, M.; Bogdzevič, K.; Bogunovic, I.; Zhao, W. Chapter 1—Land-Use Changes and Ecosystem Services. In Mapping and Forecasting Land Use; Pereira, P., Gomes, E., Rocha, J., Eds.; Elsevier: Amsterdam, The Netherlands, 2022; pp. 1–27. ISBN 978-0-323-90947-1. [Google Scholar]
  16. Hysa, A.; Löwe, R.; Geist, J. Ecosystem Services Potential Is Declining across European Capital Metropolitan Areas. Sci. Rep. 2024, 14, 8903. [Google Scholar] [CrossRef] [PubMed]
  17. Zheng, H.; Peng, J.; Qiu, S.; Xu, Z.; Zhou, F.; Xia, P.; Adalibieke, W. Distinguishing the Impacts of Land Use Change in Intensity and Type on Ecosystem Services Trade-Offs. J. Environ. Manag. 2022, 316, 115206. [Google Scholar] [CrossRef] [PubMed]
  18. Fu, B.; Zhang, L.; Xu, Z.; Zhao, Y.; Wei, Y.; Skinner, D. Ecosystem Services in Changing Land Use. J. Soils Sediments 2015, 15, 833–843. [Google Scholar] [CrossRef]
  19. Duan, X.; Chen, Y.; Wang, L.; Zheng, G.; Liang, T. The Impact of Land Use and Land Cover Changes on the Landscape Pattern and Ecosystem Service Value in Sanjiangyuan Region of the Qinghai-Tibet Plateau. J. Environ. Manag. 2023, 325, 116539. [Google Scholar] [CrossRef] [PubMed]
  20. Schirpke, U.; Tscholl, S.; Tasser, E. Spatio-Temporal Changes in Ecosystem Service Values: Effects of Land-Use Changes from Past to Future (1860–2100). J. Environ. Manag. 2020, 272, 111068. [Google Scholar] [CrossRef]
  21. Han, L.; Li, Y.; Ge, Z.; Fang, F.; Gao, L.; Zhang, J.; Du, Z.; Cui, L. Study on the Spatial and Temporal Evolution of Ecosystem Service Value Based on Land Use Change in Xi’an City. Sci. Rep. 2025, 15, 66. [Google Scholar] [CrossRef] [PubMed]
  22. Zhong, M. Impact of Landscape Patterns on Ecosystem Services in China: A Case Study of the Central Plains Urban Agglomeration. Front. Environ. Sci. 2024, 12, 1285679. [Google Scholar] [CrossRef]
  23. Zhang, M.; Chen, E.; Zhang, C.; Liu, C.; Li, J. Multi-Scenario Simulation of Land Use Change and Ecosystem Service Value Based on the Markov–FLUS Model in Ezhou City, China. Sustainability 2024, 16, 6237. [Google Scholar] [CrossRef]
  24. Turner, M.G.; Gardner, R.H. (Eds.) Landscape Disturbance Dynamics. In Landscape Ecology in Theory and Practice: Pattern and Process; Springer: New York, NY, USA, 2015; pp. 175–228. ISBN 978-1-4939-2794-4. [Google Scholar]
  25. Millennium Ecosystem Assessment. Millennium Ecosystem Assessment; Millennium Ecosystem Assessment: Washington, DC, USA, 2001; Volume 2. [Google Scholar]
  26. Chan, K.M.A.; Satterfield, T. The Maturation of Ecosystem Services: Social and Policy Research Expands, but Whither Biophysically Informed Valuation? People Nat. 2020, 2, 1021–1060. [Google Scholar] [CrossRef]
  27. Xiao, J.; Zhang, Y.; Xu, H. Response of Ecosystem Service Values to Land Use Change, 2002–2021. Ecol. Indic. 2024, 160, 111947. [Google Scholar] [CrossRef]
  28. Duan, L.; Yang, S.; Xiang, M.; Li, W.; Li, J. Spatiotemporal Evolution and Driving Factors of Ecosystem Service Value in the Upper Minjiang River of China. Sci. Rep. 2024, 14, 23398. [Google Scholar] [CrossRef] [PubMed]
  29. Ratanakuakangwan, S.; Morita, H. An Efficient Energy Planning Model Optimizing Cost, Emission, and Social Impact with Different Carbon Tax Scenarios. Appl. Energy 2022, 325, 119792. [Google Scholar] [CrossRef]
  30. Häyhä, T.; Franzese, P.P. Ecosystem Services Assessment: A Review under an Ecological-Economic and Systems Perspective. Ecol. Model. 2014, 289, 124–132. [Google Scholar] [CrossRef]
  31. Zhang, B.; Li, W.; Xie, G. Ecosystem Services Research in China: Progress and Perspective. Ecol. Econ. 2010, 69, 1389–1395. [Google Scholar] [CrossRef]
  32. Chen, H. Land Use Trade-Offs Associated with Protected Areas in China: Current State, Existing Evaluation Methods, and Future Application of Ecosystem Service Valuation. Sci. Total Environ. 2020, 711, 134688. [Google Scholar] [CrossRef]
  33. Meraj, G.; Singh, S.K.; Kanga, S.; Islam, M.N. Modeling on Comparison of Ecosystem Services Concepts, Tools, Methods and Their Ecological-Economic Implications: A Review. Model. Earth Syst. Environ. 2022, 8, 15–34. [Google Scholar] [CrossRef]
  34. Ouyang, Z.Y.; Wang, X.K.; Miao, H. A primary study On Chinese terrestrial ecosystem services and their ecological-economic values. Acta Ecol. Sin. 1999, 19, 607–613. [Google Scholar]
  35. Xie, G.D.; Zhen, L.; Lu, C.X.; Xiao, Y.; Chen, C. An expert knowledge-based approach to the valorization of ecosystem services. J. Nat. Resour. 2008, 23, 911–919. [Google Scholar]
  36. Pan, N.; Guan, Q.; Wang, Q.; Sun, Y.; Li, H.; Ma, Y. Spatial Differentiation and Driving Mechanisms in Ecosystem Service Value of Arid Region: A Case Study in the Middle and Lower Reaches of Shule River Basin, NW China. J. Clean. Prod. 2021, 319, 128718. [Google Scholar] [CrossRef]
  37. Kusi, K.K.; Khattabi, A.; Mhammdi, N. Analyzing the Impact of Land Use Change on Ecosystem Service Value in the Main Watersheds of Morocco. Environ. Dev. Sustain. 2023, 25, 2688–2715. [Google Scholar] [CrossRef]
  38. Mendoza-González, G.; Martínez, M.L.; Lithgow, D.; Pérez-Maqueo, O.; Simonin, P. Land Use Change and Its Effects on the Value of Ecosystem Services along the Coast of the Gulf of Mexico. Ecol. Econ. 2012, 82, 23–32. [Google Scholar] [CrossRef]
  39. Roy, S.K.; Alam, M.T.; Mojumder, P.; Mondal, I.; Kafy, A.-A.; Dutta, M.; Ferdous, M.N.; Al Mamun, M.A.; Mahtab, S.B. Dynamic Assessment and Prediction of Land Use Alterations Influence on Ecosystem Service Value: A Pathway to Environmental Sustainability. Environ. Sustain. Indic. 2024, 21, 100319. [Google Scholar] [CrossRef]
  40. Ersoy Tonyaloğlu, E. Future Land Use/Land Cover and Its Impacts on Ecosystem Services: Case of Aydın, Turkey. Int. J. Environ. Sci. Technol. 2025, 22, 4601–4617. [Google Scholar] [CrossRef]
  41. Ocloo, M.D.; Huang, X.; Fan, M.; Ou, W. Study on the Spatial Changes in Land Use and Landscape Patterns and Their Effects on Ecosystem Services in Ghana, West Africa. Environ. Dev. 2024, 49, 100947. [Google Scholar] [CrossRef]
  42. Zhang, J.; Qu, M.; Wang, C.; Zhao, J.; Cao, Y. Quantifying Landscape Pattern and Ecosystem Service Value Changes: A Case Study at the County Level in the Chinese Loess Plateau. Glob. Ecol. Conserv. 2020, 23, e01110. [Google Scholar] [CrossRef]
  43. Hou, L.; Liu, T.; Wang, J.; Chen, X.; Du, Z.; Xu, S.; Yu, L. Land Disturbance Tempo-Spatial Dynamics in Mountainous Urban Agglomeration and Its Driving Forces: A Case Study of West Sichuan Urban Agglomeration, China. Ecol. Indic. 2023, 154, 110569. [Google Scholar] [CrossRef]
  44. Haines-Young, R.; Potschin, M. The Links between Biodiversity, Ecosystem Services and Human Well-Being. In Ecosystem Ecology: A New Synthesis; Frid, C.L.J., Raffaelli, D.G., Eds.; Ecological Reviews; Cambridge University Press: Cambridge, UK, 2010; pp. 110–139. ISBN 978-0-521-51349-4. [Google Scholar]
  45. Fu, B.; Liu, Y.; Zhao, W.; Wu, J. The Emerging “Pattern-Process-Service-Sustainability” Paradigm in Landscape Ecology. Landsc. Ecol. 2025, 40, 54. [Google Scholar] [CrossRef]
  46. Fu, B.; Wu, X.; Wang, Z.; Wu, X.; Wang, S. Coupling Human and Natural Systems for Sustainability: Experience from China’s Loess Plateau. Earth Syst. Dyn. 2022, 13, 795–808. [Google Scholar] [CrossRef]
  47. Liang, X.; Jin, X.; Ren, J.; Gu, Z.; Zhou, Y. A Research Framework of Land Use Transition in Suzhou City Coupled with Land Use Structure and Landscape Multifunctionality. Sci. Total Environ. 2020, 737, 139932. [Google Scholar] [CrossRef] [PubMed]
  48. Costanza, R.; de Groot, R.; Braat, L.; Kubiszewski, I.; Fioramonti, L.; Sutton, P.; Farber, S.; Grasso, M. Twenty Years of Ecosystem Services: How Far Have We Come and How Far Do We Still Need to Go? Ecosyst. Serv. 2017, 28, 1–16. [Google Scholar] [CrossRef]
  49. Howarth, R.B.; Farber, S. Accounting for the Value of Ecosystem Services. Ecol. Econ. 2002, 41, 421–429. [Google Scholar] [CrossRef]
  50. Liu, T.; Yu, L.; Liu, J.; Xu, Z.; Chen, X.; Wu, H.; Zheng, S.; Zhao, Q.; Gong, P. Unveiling Interprovincial Geographic Patterns of 5A-Level Tourism Cultural Ecosystem Service Flows and Tourist Preferences in China’s Metacoupled Systems. Appl. Geogr. 2024, 172, 103432. [Google Scholar] [CrossRef]
  51. Fu, B.; Tian, T.; Liu, Y.; Zhao, W. New Developments and Perspectives in Physical Geography in China. Chin. Geogr. Sci. 2019, 29, 363–371. [Google Scholar] [CrossRef]
  52. Wenhui, K.; Shuwen, Z.; Guoming, D.U.; Changzhen, Y.a.N.; Shixin, W.U.; Rendong, L.I.; Dengsheng, L.U.; Tao, P.a.N.; Jing, N.; Changqing, G.U.O.; et al. Remotely Sensed Mapping and Analysis of Spatio-Temporal Patterns of Land Use Change across China in 2015–2020. Acta Geogr. Sin. 2022, 77, 1056–1071. [Google Scholar] [CrossRef]
  53. Liu, J.; Kuang, W.; Zhang, Z.; Xu, X.; Qin, Y.; Ning, J.; Zhou, W.; Zhang, S.; Li, R.; Yan, C.; et al. Spatiotemporal Characteristics, Patterns, and Causes of Land-Use Changes in China since the Late 1980s. J. Geogr. Sci. 2014, 24, 195–210. [Google Scholar] [CrossRef]
  54. Yang, F.; Yang, X.; Wang, Z.; Sun, Y.; Zhang, Y.; Xing, H.; Wang, Q. Spatiotemporal Evolution of Production–Living–Ecological Land and Its Eco-Environmental Response in China’s Coastal Zone. Remote Sens. 2023, 15, 3039. [Google Scholar] [CrossRef]
  55. Huang, W.; Shrestha, A.; Xie, Y.; Yan, J.; Wang, J.; Guo, F.; Cao, Y.; Wang, G. Assessing Four Decades of Land Use and Land Cover Change: Policy Impacts and Environmental Dynamics in the Min River Basin, Fujian, China. Land 2025, 14, 11. [Google Scholar] [CrossRef]
  56. Xu, J.; Renaud, F.G.; Barrett, B. Modelling Land System Evolution and Dynamics of Terrestrial Carbon Stocks in the Luanhe River Basin, China: A Scenario Analysis of Trade-Offs and Synergies between Sustainable Development Goals. Sustain. Sci. 2022, 17, 1323–1345. [Google Scholar] [CrossRef] [PubMed]
  57. Wang, W.; Wang, X.; Wang, L.; Zhang, Z.; Lyu, D. Spatio-Temporal Variation and Drivers of Land-Use Net Carbon Emissions in Chengyu Urban Agglomeration, China. Land 2024, 13, 2160. [Google Scholar] [CrossRef]
  58. Xie, G.D.; Zhang, C.X.; Zhang, L.M.; Chen, W.H.; Li, S.M. lmprovement of the Evaluation Method for Ecosystem Service Value Based on Per Unit Area. J. Nat. Resour. 2015, 30, 1243–1254. [Google Scholar]
  59. Wang, X.L.; Bao, Y.H. Exploration of research methods on dynamic land use change. Prog. Geogr. 1999, 18, 81–87. [Google Scholar] [CrossRef]
  60. Zhang, X.; Wan, W.; Fan, H.; Dong, X.; Lv, T. Temporal and Spatial Responses of Landscape Patterns to Habitat Quality Changes in the Poyang Lake Region, China. J. Nat. Conserv. 2024, 77, 126546. [Google Scholar] [CrossRef]
  61. Li, H.; Wu, J. Use and Misuse of Landscape Indices. Landsc. Ecol. 2004, 19, 389–399. [Google Scholar] [CrossRef]
  62. LIETH, H. Evapotranspiration and Primary Productivity; C. W. THORNTHWAITE Memorial Model. Publ. Climatol. 1972, 25, 37–46. [Google Scholar]
  63. Su, K.; Wei, D.; Lin, W. Evaluation of Ecosystem Services Value and Its Implications for Policy Making in China—A Case Study of Fujian Province. Ecol. Indic. 2020, 108, 105752. [Google Scholar] [CrossRef]
  64. He, Y.; Wang, W.; Chen, Y.; Yan, H. Assessing Spatio-Temporal Patterns and Driving Force of Ecosystem Service Value in the Main Urban Area of Guangzhou. Sci. Rep. 2021, 11, 3027. [Google Scholar] [CrossRef] [PubMed]
  65. Zhu, L.; Zhu, K.; Zeng, X. Evolution of Landscape Pattern and Response of Ecosystem Service Value in International Wetland Cities: A Case Study of Nanchang City. Ecol. Indic. 2023, 155, 110987. [Google Scholar] [CrossRef]
  66. Shi, F.; Zhou, B.; Zhou, H.; Zhang, H.; Li, H.; Li, R.; Guo, Z.; Gao, X. Spatial Autocorrelation Analysis of Land Use and Ecosystem Service Value in the Huangshui River Basin at the Grid Scale. Plants 2022, 11, 2294. [Google Scholar] [CrossRef] [PubMed]
  67. Bai, Y.; Xu, H.; Ling, H. Eco-Service Value Evaluation Based on Eco-Economic Functional Regionalization in a Typical Basin of Northwest Arid Area, China. Environ. Earth Sci. 2014, 71, 3715–3726. [Google Scholar] [CrossRef]
  68. Yohannes, H.; Soromessa, T.; Argaw, M.; Dewan, A. Impact of Landscape Pattern Changes on Hydrological Ecosystem Services in the Beressa Watershed of the Blue Nile Basin in Ethiopia. Sci. Total Environ. 2021, 793, 148559. [Google Scholar] [CrossRef] [PubMed]
  69. Zhang, J.; Xiang, H.; Hashimoto, S.; Okuro, T. Observational Scale Matters for Ecosystem Services Interactions and Spatial Distributions: A Case Study of the Ussuri Watershed, China. Sustainability 2021, 13, 10649. [Google Scholar] [CrossRef]
  70. Deng, J.S.; Wang, K.; Hong, Y.; Qi, J.G. Spatio-Temporal Dynamics and Evolution of Land Use Change and Landscape Pattern in Response to Rapid Urbanization. Landsc. Urban Plan. 2009, 92, 187–198. [Google Scholar] [CrossRef]
  71. Serra, P.; Pons, X.; Saurí, D. Land-Cover and Land-Use Change in a Mediterranean Landscape: A Spatial Analysis of Driving Forces Integrating Biophysical and Human Factors. Appl. Geogr. 2008, 28, 189–209. [Google Scholar] [CrossRef]
  72. Zhou, Y.; Li, X.; Liu, Y. Land Use Change and Driving Factors in Rural China during the Period 1995–2015. Land Use Policy 2020, 99, 105048. [Google Scholar] [CrossRef]
  73. Kuang, W. National Urban Land-Use/Cover Change since the Beginning of the 21st Century and Its Policy Implications in China. Land Use Policy 2020, 97, 104747. [Google Scholar] [CrossRef]
  74. Duveiller, G.; Caporaso, L.; Abad-Viñas, R.; Perugini, L.; Grassi, G.; Arneth, A.; Cescatti, A. Local Biophysical Effects of Land Use and Land Cover Change: Towards an Assessment Tool for Policy Makers. Land Use Policy 2020, 91, 104382. [Google Scholar] [CrossRef]
  75. Ma, F.; Cai, Y.L. Impacts on the Land Use and Ecosystem Services Value in Shanghai Lingang New City Exploitation. J. Fudan Univ. Sci. 2013, 52, 69–77. [Google Scholar] [CrossRef]
  76. Yang, W.Q.; Yang, P.; Sun, X.; Han, B.L. Changes of landscape pattern and its impacts on multiple ecosystem services in Beijing. Acta Ecol. Sin. 2022, 42, 6487–6498. [Google Scholar]
  77. Wang, W.; Feng, C.; Liu, F.; Li, J. Biodiversity Conservation in China: A Review of Recent Studies and Practices. Environ. Sci. Ecotechnol. 2020, 2, 100025. [Google Scholar] [CrossRef] [PubMed]
  78. Xie, Z. China’s Historical Evolution of Environmental Protection along with the Forty Years’ Reform and Opening-Up. Environ. Sci. Ecotechnol. 2020, 1, 100001. [Google Scholar] [CrossRef]
  79. Yurui, L.; Xuanchang, Z.; Zhi, C.; Zhengjia, L.; Zhi, L.; Yansui, L. Towards the Progress of Ecological Restoration and Economic Development in China’s Loess Plateau and Strategy for More Sustainable Development. Sci. Total Environ. 2021, 756, 143676. [Google Scholar] [CrossRef] [PubMed]
  80. Xu, K.; Wang, J.; Wang, J.; Wang, X.; Chi, Y.; Zhang, X. Environmental Function Zoning for Spatially Differentiated Environmental Policies in China. J. Environ. Manag. 2020, 255, 109485. [Google Scholar] [CrossRef] [PubMed]
  81. Zhang, S.; Zhang, W.; Xu, J.; Zhang, Y. Does the Differentiation of China’s Land Policy Promote Regional Economic Development? Sustainability 2023, 15, 8737. [Google Scholar] [CrossRef]
  82. Guo, X.; Zhang, Y.; Guo, D.; Lu, W.; Xu, H. How Does Ecological Protection Redline Policy Affect Regional Land Use and Ecosystem Services? Environ. Impact Assess. Rev. 2023, 100, 107062. [Google Scholar] [CrossRef]
  83. Yu, H.; Chen, C.; Shao, C. Spatial and Temporal Changes in Ecosystem Service Driven by Ecological Compensation in the Xin’an River Basin, China. Ecol. Indic. 2023, 146, 109798. [Google Scholar] [CrossRef]
  84. Cao, Y.; Kong, L.; Zhang, L.; Ouyang, Z. The Balance between Economic Development and Ecosystem Service Value in the Process of Land Urbanization: A Case Study of China’s Land Urbanization from 2000 to 2015. Land Use Policy 2021, 108, 105536. [Google Scholar] [CrossRef]
  85. Liu, Y.; Yuan, X.; Li, J.; Qian, K.; Yan, W.; Yang, X.; Ma, X. Trade-Offs and Synergistic Relationships of Ecosystem Services under Land Use Change in Xinjiang from 1990 to 2020: A Bayesian Network Analysis. Sci. Total Environ. 2023, 858, 160015. [Google Scholar] [CrossRef] [PubMed]
  86. Liu, Y.; Wang, S.; Chen, Z.; Tu, S. Research on the Response of Ecosystem Service Function to Landscape Pattern Changes Caused by Land Use Transition: A Case Study of the Guangxi Zhuang Autonomous Region, China. Land 2022, 11, 752. [Google Scholar] [CrossRef]
  87. Zhao, J.; Liu, S.; Wang, Z.; Gao, H.; Feng, S.; Wei, B.; Hou, Z.; Xiao, F.; Jing, L.; Liao, X. The Impact of Land Use and Landscape Pattern on Ecosystem Services in the Dongting Lake Region, China. Remote Sens. 2023, 15, 2228. [Google Scholar] [CrossRef]
  88. Gilman, J.; Wu, J. The Interactions among Landscape Pattern, Climate Change, and Ecosystem Services: Progress and Prospects. Reg. Environ. Change 2023, 23, 67. [Google Scholar] [CrossRef]
  89. Biswas, G.; Sengupta, A.; Alfaisal, F.M.; Alam, S.; Alharbi, R.S.; Jeon, B.-H. Evaluating the Effects of Landscape Fragmentation on Ecosystem Services: A Three-Decade Perspective. Ecol. Inform. 2023, 77, 102283. [Google Scholar] [CrossRef]
  90. Hou, L.; Wu, F.; Xie, X. The Spatial Characteristics and Relationships between Landscape Pattern and Ecosystem Service Value along an Urban-Rural Gradient in Xi’an City, China. Ecol. Indic. 2020, 108, 105720. [Google Scholar] [CrossRef]
Figure 1. Location map of the WSUA. (A) Location of WSUA in China. (B) Location of WSUA in Sichuan Province. (C) WSUA 2020 land use types.
Land 14 01012 g001
Figure 2. The theoretical model of “process–structure–value”.
Land 14 01012 g002
Figure 3. Technical route and research methodology. (A) Process (Land use evolution). (B) Structure (changes in landscape structure). (C) Value (changes in the ESV). (D) Evolution of land use landscape patterns in response to changes in ESV.
Land 14 01012 g003
Figure 4. Changes in the area of land use types in WSUA from 2000 to 2020. (A) Land use change by category, 2000–2020. (B) Characteristics of changes in various types of land use, 2000–2010. (C) Characteristics of changes in various types of land use, 2010–2020. (D) Characteristics of overall changes in multiple types of land use, 2000–2020.
Land 14 01012 g004
Figure 5. Mapping the land transfer area in WSUA, 2000–2020. (A) Spatial mapping of land use change, 2000–2020. (B): Total land use transfers 2000–2020. (C) Land use transfer characteristics, 2000–2005. (D) Land use transfer characteristics, 2005–2010. (E) Land use transfer characteristics, 2010–2015. (F) Land use transfer characteristics, 2015–2020.
Land 14 01012 g005
Figure 6. Changes in landscape level index of WSUA from 2000 to 2020. (A) Changes in patch density in WSUA, 2000–2020. (B) Changes in landscape shape index of WSUA, 2000–2020. (C) Changes in contagion index of WSUA, 2000–2020. (D) Changes in Shannon’s diversity index of WSUA, 2000–2020. (E) Changes in landscape DIVISION of WSUA, 2000–2020.
Land 14 01012 g006
Figure 7. Changes in landscape pattern index of WSUA at type level, 2000–2020. (A) Changes in patch density by site type, 2000–2020. (B) Changes in aggregation index by site type, 2000–2020. (C) Changes in edge density by site type, 2000–2020. (D) Changes in mean patch size by site type, 2000–2020.
Land 14 01012 g007
Figure 8. Changes in ESV for WSUA in general and for each land type. (A) Changes in the Total ESV, 2000–2020. (B) Percentage of ESV by land use type, 2000–2020. (C) Changes in the ESV by land use type, 2000–2020.
Land 14 01012 g008
Figure 9. Spatial distribution of ESV in WSUA, 2000–2020. (A) Spatial characteristics of ESV, 2000. (B) Spatial characteristics of ESV, 2005. (C) Spatial characteristics of ESV, 2010. (D) Spatial characteristics of ESV, 2015. (E) Spatial characteristics of ESV, 2020.
Land 14 01012 g009
Figure 10. Spatial ESV Changes in WSUA, 2000–2020. (A) Trend of ESV Evolution in WSUA, 2000–2005. (B) Trend of ESV Evolution in WSUA, 2005–2010. (C) Trend of ESV Evolution in WSUA, 2010–2015. (D) Trend of ESV Evolution in WSUA, 2015–2020. (E) Trend of ESV Evolution in WSUA, 2000–2020. (F) Percentage area of ESV improvement by period, 2000–2020. (G) Percentage of deteriorated ESV area by period, 2000–2020.
Land 14 01012 g010
Figure 11. Correlation analysis between ESs and landscape level indices.
Land 14 01012 g011
Figure 12. Correlation analysis of ESs and landscape-type indices. (A) Correlation analysis of ESV with the desert. (B) Correlation analysis of ESV with waters. (C) Correlation analysis of ESV with grassland. (D) Correlation analysis of ESV with wetland. (E) Correlation analysis of ESV with arable land. (F) Correlation analysis of ESV with forest land.
Land 14 01012 g012
Table 1. Ecological Sensitivity Index of WSUA, 2000–2020.
Land Space20002005201020152020
Arable land VC ± 50%0.15855 0.15647 0.15464 0.15232 0.15039
Forest land VC ± 50%0.56532 0.56665 0.57153 0.56832 0.56602
Grassland VC ± 50%0.18383 0.18452 0.17457 0.17343 0.17295
Weltland VC ± 50%0.00936 0.00939 0.00798 0.00694 0.00652
Desert VC ± 50%0.00003 0.00003 0.00005 0.00005 0.00005
Waters VC ± 50%0.08291 0.08293 0.09123 0.09893 0.10408
Construction land VC ± 50%
Disclaimer/Publisher’s Note: The statements, opinions and data contained in all publications are solely those of the individual author(s) and contributor(s) and not of MDPI and/or the editor(s). MDPI and/or the editor(s) disclaim responsibility for any injury to people or property resulting from any ideas, methods, instructions or products referred to in the content.

