Article

Environmental Challenges and Vanishing Archaeological Landscapes: Remotely Sensed Insights into the Climate–Water–Agriculture–Heritage Nexus in Southern Iraq

1
Institute of Atmospheric Sciences and Climate (ISAC), National Research Council (CNR), Via del Fosso del Cavaliere 100, 00133 Rome, Italy
2
School of History, Classics and Archaeology, Newcastle University, Newcastle upon Tyne NE1 7RU, UK
3
School of Engineering, Newcastle University, Newcastle upon Tyne NE1 7RU, UK
4
Department of Archaeology, University of Al-Qadisiyah, Diwaniyah 88, Iraq
5
Italian Space Agency (ASI), Via del Politecnico s.n.c., 00133 Rome, Italy
*
Authors to whom correspondence should be addressed.
Land 2025, 14(5), 1013; https://doi.org/10.3390/land14051013
Submission received: 31 December 2024 / Revised: 24 April 2025 / Accepted: 29 April 2025 / Published: 7 May 2025
(This article belongs to the Special Issue Novel Methods and Trending Topics in Landscape Archaeology)

Abstract

:
Iraq faces significant challenges in sustainable water resource management, due to intensive agriculture and climate change. Modern irrigation leads to depleted natural springs and abandoned traditional canal systems, creating a nexus between climate, water availability, agriculture, and cultural heritage. This work unveils this nexus holistically, from the regional to the local scale, and by considering all the components of the nexus. This is achieved by combining five decades (1974–2024) of satellite data—including declassified HEXAGON KH-9, Copernicus Sentinel-1/2/3, COSMO-SkyMed radar, and PlanetScope’s Dove optical imagery—and on-the-ground observations (photographic and drone surveying). The observed landscape changes are categorised as “proxies” to infer the presence of the given land processes that they correlate to. The whole of southern Iraq is afflicted by dust storms and intense evapotranspiration; new areas are desertifying and thus becoming local sources of dust in the southwest of the Euphrates floodplain and close to the boundary with the western desert. The most severe transformations happened around springs between Najaf Sea and Hammar Lake, where centre-pivot and herringbone irrigation systems fed by pumped groundwater have densified. While several instances of run-off and discharge highlight the loss of water in the western side of the study area, ~5 km2 wide clusters of crops in the eastern side suffer from water scarcity and are abandoned. Here, new industrial activities and modern infrastructure have already damaged tens of archaeological sites. Future monitoring based on the identified proxies could help to assess improvements or deterioration, in light of mitigation measures.

Graphical Abstract

1. Introduction

In the current global context, where the demand for natural resources is increasing, water supply is becoming critical, especially in countries that are characterised by arid and semi-arid environments [1]. This challenge is further exacerbated if, in addition to potable water, there is a conflicting need for irrigation for agriculture. Moreover, climatological drivers and anthropogenic processes (e.g., land conversion) may put more stress on ecosystem services [1,2].
From the perspective of research methodologies and policy approaches, the water, food and climate sectors are increasingly being recognised as interconnected dimensions in a complex and mutually interacting system [3]. Scholars use the term “nexus” to refer to systematic approaches to scientific investigation and the design of coherent policy goals and instruments that focus on synergies, conflicts, and related trade-offs emerging from the interactions between these sectors [4]. The maturity of this research field can be evaluated based on the abundant published literature, which includes assessments of achievements, research gaps, and future perspectives [5]. Further proof is provided by the fact that this approach is also shared among major international organisations promoting sustainable development (e.g., [6,7]).
A fourth dimension that can also be involved in this nexus is cultural heritage. This encompasses the monuments, buildings, and sites (tangible), as well as the ethnological or anthropological diversity and traditional practices (intangible), that landscapes with long histories of occupation may still preserve. However, water resource use, agriculture, and modern development could pose threats to their conservation. Several papers have examined the impacts of climate change on cultural heritage (e.g., the overview provided in [8]). Fewer have investigated the agriculture/food security and cultural heritage nexus, to highlight threats [9] and opportunities for the preservation of agricultural practices [10,11]. The scientific literature that explicitly addresses the climate–water–agriculture nexus (e.g., [12]) is even more limited.
In this broader context, Iraq is a region where the climate–water–agriculture–heritage nexus is evident and a focused investigation, taking advantage of the multiple datasets that satellite technologies can now provide to collect objective evidence, is worthwhile. According to the United Nations Environment Programme [13], Iraq is ranked among the five countries most vulnerable to the impacts of climate change. Instrumental measurements and official reports highlight increasing temperatures, insufficient and diminishing rainfall, intensified droughts, and water scarcity, as well as frequent sand and dust storms [14]. The impacts include population displacement, the abandonment of rural territories in favour of urban settlements, and a decline in agricultural production. Where agriculture persists, water scarcity leads to the overexploitation of groundwater, impoverishment of natural resources, and ineffective surface water management. This scenario makes the nexus between climate, water consumption, and agricultural activities very evident.
Recurrent drought has been affecting Iraq since the 1970s. Although several mitigation measures, including the construction of dams and water reservoirs, were implemented, the lack of potable and usable water is still a key environmental driver of displacement [14] and large portions of the Iraqi landscape are significantly changing. Such impacts were specifically documented in the southern end of the country (i.e., the Basra, Maysan, and Dhi Qar governorates), where the extent of the historical marshes, including the UNESCO World Heritage Site of Ahwar, drastically reduced [15,16]. However, other areas are also progressively being impacted, such as the governorates of Karbala, Al-Qadisiyah, Muthanna, Najaf, and Wasit, in central Iraq, south of the capital city Baghdad [14]. Recent studies, undertaken by Iraqi scholars who used satellite imagery (e.g., [17,18,19,20]), revealed severe changes in water bodies and agricultural land, thus suggesting that more research should be undertaken to unveil the climate–water–agriculture nexus in these regions.
Further motivation to pay attention to this part of the country is provided by the historical importance of water in southern Mesopotamia, in driving settlement patterns and strategies for millennia. Moreover, the local archaeological heritage testifies to the longevity of the human–water interaction in Iraq; if not preserved, this history is at risk of vanishing due to climate change and anthropogenic factors. The Al-Qadisiyah, Muthanna, Najaf, and Wasit governorates are crossed by a widespread network of water channels dating to different periods, with the oldest dating to the time of the earliest empires and Mesopotamian civilizations. Irrigation technology and access to such hydraulic infrastructure undoubtedly provided the ‘Mesopotamian advantage’ for the development of societies in southern Iraq [21], given that, in the plains, the rainfall was less than 200 mm/year and rain-fed agriculture was not feasible [22]. Until the Ottoman period (AD 1534–1917), the excavation of canals to divert irrigation water from the main river channels towards the fields resulted in levees [21,22]. These archaeological features can be recognised, interpreted, and mapped using remote sensing data [23]. Furthermore, the reconstruction of the spatial distribution of the canal network reveals a strong communal connection to local springs in some locations along the edge of the Arabian desert. These springs, for a very long time, were the primary water sources for villages and farming communities. The largest springs, such as Ayn Sayed, Ayn Shallal, Ayn Al-Tamir, and Ayn Al-Rahhaliyah, were able to irrigate large farming areas (60, 4, 50, and 7 km2, respectively), while other small springs typically provided water to one or two households, with only a hectare of irrigated field [24]. Therefore, in the case of southern Iraq, a comprehensive understanding of the climate–water–agriculture nexus can be only achieved if the impact on local heritage (i.e., canals, levees, and the anthropogenic use of springs) is also accounted for.
This additional focus is much needed given that, in recent times, the way water is sourced and fields are irrigated has changed, as well as the changes in community socio-demographics who inhabit and utilise the land for agriculture. The extensive extraction of groundwater for irrigation has been observed in the southwest of the Abu Jir lineament [24]. Farmers who are able to purchase bore-drilling equipment or pay for well construction can feed centre-pivot systems and irrigate large clusters of fields. With a rapid pace of groundwater abstraction, privately managed wells can lead to the depletion and impoverishment of aquifers to the detriment of the springs, whose water flow diminishes, making them unable to feed the network of traditional canals. Consequently, farmlands located downstream of the ancient canals suffer from a lack of water and are abandoned, unless new irrigation systems fed by modern channels or through capturing water from the main rivers are constructed. In either case, large sections of the traditional irrigation system are not maintained and preserved and social inequalities may arise, with some populations migrating for subsistence opportunities.
An initial survey at the supra-regional level proved that these climate and human-induced processes occur at different locations, with distinctive patterns, at different paces and at different times [25]. Therefore, understanding the complexity of the climate–water–agriculture–heritage nexus and the diversity of its impacts across the territory requires multi-scale and multi-temporal observations from the broader region to the local scale. Land surface changes related to agricultural practices, the typology, morphology and condition of irrigation systems and regimes, areas under modern development, and the condition of springs and channels are all proxies to infer different facets of the nexus and the associated environmental challenges.
Accordingly, the present work aims to demonstrate that a detailed mapping of such proxies and the back-analysis of their spatio-temporal evolution, leading to impactful landscape transformations, the impoverishment of natural resources, the exacerbation of environmental issues, and loss of archaeological heritage, can be effectively achieved by means of a multi-sensor data approach, combining satellite and on-the-ground observations. The approach capitalises on decades of Earth observation imagery, spanning from 1974 to the present day and including: the declassified United States Cold War Era HEXAGON (also known as KeyHole-9, KH-9); Copernicus Sentinel-1 radar, Sentinel-2 and Sentinel-3 optical imagery; Landsat multispectral imagery; Google Earth, PlanetScope’s Dove constellation and Airbus Defence and Space (DS) Pléiades Neo optical data; and radar scenes collected on purpose by the Italian Space Agency (ASI)’s COSMO-SkyMed constellation. Verification in the field, including drone surveying, was undertaken in 2024 for the local-scale analysis of selected areas within the western part of the Samawah province in Muthanna governorate. The analysis allowed for the clear identification of the main natural, climate, and human-induced proxies and their categorisation. Examples are discussed with regard to: regional-scale land surface processes such as disturbances at springs, drought, and dust storms; agricultural practices and water use; water run-off and discharge, highlighting the non-optimised management of surface waters; and the deterioration or destruction of ancient water-related and other heritage features due to modern development. These categories, captured using satellite imagery, not only clarify the complex nature of the nexus in this portion of Iraq, but also represent a practical approach that future research can implement in the continued monitoring and assessment of preservation efforts for Iraq’s natural and cultural resources.

2. Study Area

2.1. Geographic and Archaeological Setting

The regional-scale focus of this work is on the Abu Jir lineament, a 520 km long northwest–southeast trending stretch of land running (from north to south) across the Iraqi governorates of Al-Anbar, Kerbala, Najaf, Al-Qadisiya, Muthanna, and Dhi Qar (Figure 1a). The lineament marks the boundary between the Arabian Desert plateau on the west and the fertile Mesopotamia floodplain of the Tigris and Euphrates rivers on the east [24]. The area hosts over 200 springs that are sustained by the Umm er Radhuma–Dammam carbonate aquifer system underlying the Arabian Desert [26], and discharge from the eastward-dipping Palaeocene–Eocene limestone [24].
The local-scale analysis was undertaken over the western part of the Samawah province (Figure 1b) in the Muthanna governorate. The area encompasses archaeological sites of all periods and unique rural communities, and the transition it represents between the irrigated plain and arid desert makes this area extremely vulnerable to the impacts of climate change and development activities.
Unlike the central plain of Iraq, this area has been historically understudied by archaeologists, despite its long history of human occupation; most studies focused on site-level rather than landscape-level research. The ancient tell site of Eridu (Figure 1b), considered the first Sumerian city in the region, is situated at the southern edge of the area and is well-studied. Eridu’s tell (mound) was formed by successive layers of mud–brick structures and habitation refuse that accumulated over thousands of years. Recent [27] and ongoing archaeological surveys have revealed a number of other archaeological sites in the study area (e.g., over 90 tells and settlements; Figure 1b), the remains of past water management systems and ancient watercourses, and other features, by using a combination of remote sensing and traditional archaeological surface survey techniques.
Figure 1. Location of the study area in Iraq at (a) the regional scale, with a focus on ancient springs and settlements along the Abu Jir lineament, and (b) the local scale, in the western Samawah province. KeyHole-9 (KH-9, HEXAGON), Sentinel-1, Landsat, and COSMO-SkyMed image footprints are superimposed upon an optical basemap ©Esri, Maxar, Earthstar Geographics, and the GIS User Community. Country-level climate records and projections according to [28]: (c) observed annual average mean surface air temperature in 1901–2022, and projection towards 2100 (median, and 10th–90th percentile range), considering four Shared Socioeconomic Pathways (SSPs); (d) observed annual precipitation in 1901–2022; and (e) projected precipitation anomalies under SSP5-8.5. Projected climate data are based on the multi-model ensemble approach, using 1995–2014 baseline data.
Land 14 01013 g001
As examples of Iraq’s long and continuous history of irrigation technology [22], such canals are significant heritage assets in an area—as elsewhere in the country—where rainfall is generally less than 200 mm/year and thus irrigation is the biggest consumer of water [29]. Recent work has mapped and scientifically dated a dense network of modified natural channels and ancient canals around Eridu [30]. This includes crevasse splays, fans of channels and sediments, which form when water is taken off the slope of a levee [31]. Some of these channels stem from the ancient and dried course of the Euphrates, which likely shifted in around the second millennium BC [32] and formed its present course during the Ottoman period (AD 1534–1917) [33]. Traces of the relict Euphrates are visible at locations upstream of Eridu throughout the study area, with remains of ancient canals stemming from it, giving these an ancient (first millennium BC or older) date by association.
Irrigation also seems to have long relied on drawing water from a series of springs along the edge of the recently surveyed escarpment (e.g., [24,26]). The springs have significant recharge potential, supplied by the Umm er Radhuma-Dammam aquifer, but are overexploited [24]. Historical canal systems abstracting from the springs are still visible on modern satellite imagery, although many are now becoming disused. These may have early origins in the Sasanian (AD 224–642) and Ottoman periods, given their association with the remains of forts dating to these periods.

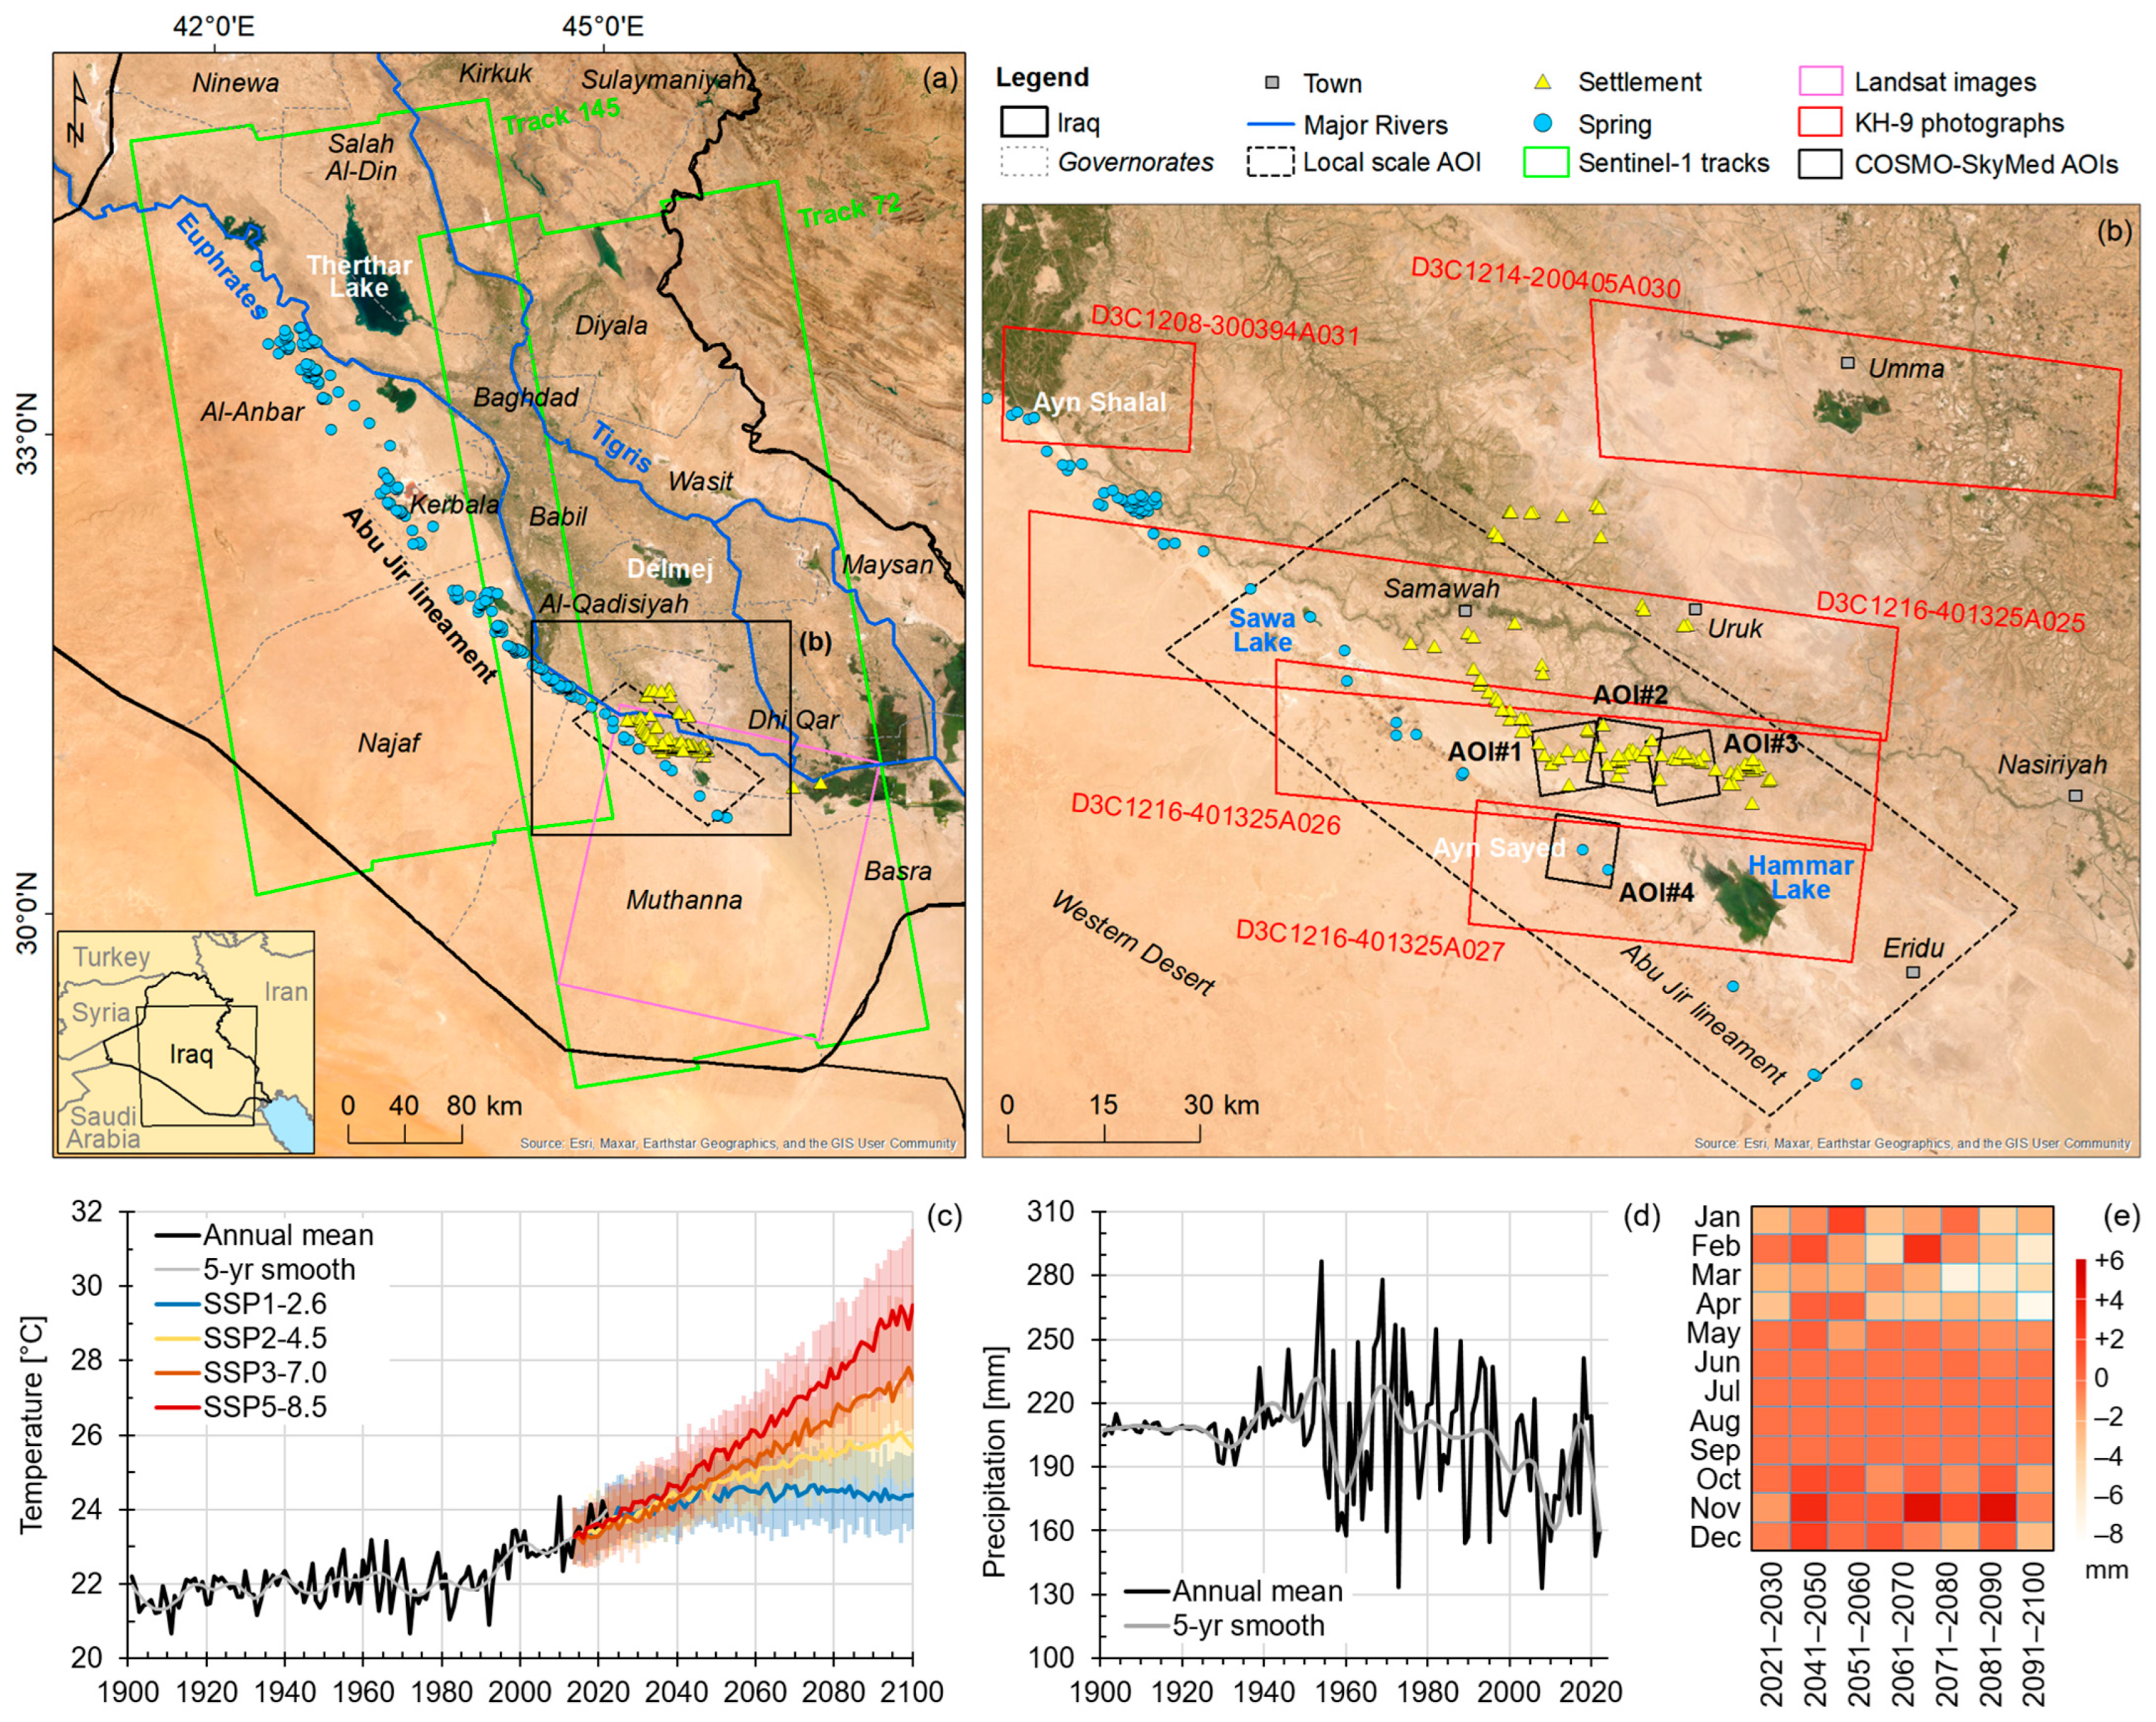
2.2. Recent and Projected Climate

According to the Köppen–Geiger climate classification system [34] and its seasonal precipitation and temperature patterns regarding the latest climatology (1991–2020), the whole study area belongs to the BWh group, hence is characterised by an arid/dry (B) hot (h) desert (W) climate [28]. The annual average mean surface air temperature gradually increases from 21.7 °C in Al-Anbar governorate in the northwest to 26.0 °C in Basra to the southeast of the country, whereas annual precipitation varies from lows of 103, 113, and 125 mm in Najaf, Muthanna and Al-Anbar, respectively, to peaks of 239, 209, and 171 mm in the Diyala, Maysan, and Wasit governorates to the east and northeast.
Observed historical records of annual precipitation and temperature for the whole of Iraq (Figure 1c,d) provide a clear picture of the temporal evolution of climate conditions of the country during the last century. Annual average mean surface air temperature increased from ~21.5 °C at the beginning of 1900 to ~23.8 °C in 2022, with most of the increase observed over the last 40 years; in the same period, a drop in annual precipitation from 205 to 160 mm was recorded [28].
The baseline knowledge of the past climate enables a better understanding of future climate scenarios and the projected changes in the next decades (Figure 1c–e). Climate projections from the global climate model compilations of the Coupled Model Intercomparison Project—Phase 6 (CMIP6), forming the foundation of the Intergovernmental Panel on Climate Change (IPCC) Assessment Reports, identify that, under the Shared Socioeconomic Pathway (SSP) SSP1-2.6, annual average surface air temperature could reach 24.4 °C (median), and could even peak at 29.5 °C (median) under SSP5-8.5 [28]. The same SSP identifies an increased number of precipitation anomalies that may occur at the decade-scale during the rest of the century, especially in the months of January–April and October–December (Figure 1e).

3. Data and Methods

3.1. Satellite Data

The core inputs of this work were satellite image datasets collected by different satellite sensors, with low to very high spatial resolution, on board past and current Earth observation missions, which sensed the landmass using the frequency spectrum of the visible, near-infrared (NIR), short-wave infrared (SWIR), and microwaves. Priority was given to those missions providing spatial coverage, time intervals, and temporal revisits that suited the purpose of documenting the multi-temporal changes that occur at different spatial scales. Furthermore, data from still-operational missions that could be tasked for the ad hoc collection of new images were included to obtain observations that were more focused on specific areas with higher detail.
To depict past land use and ancient features (e.g., canals and agricultural field systems) that now may be altered or already vanished, a set of declassified military intelligence photographs from the United States Cold War Era HEXAGON (KeyHole-9, KH-9) programme was selected. This programme combines GAMBIT and CORONA technology with telescopic camera systems able to acquire panchromatic images with ~0.6–1.2 m spatial resolution and an ~18–22 km ground footprint collected on ~0.16 cm wide film rolls [35,36], and features a higher temporal resolution and time-series of imagery, thus enabling landscape change assessments [37]. A total of 12 image sections extracted from five different scenes, acquired in February/May between 1974 and 1981 (Table A1), were sourced via the United States Geological Survey (USGS) EarthExplorer repository as part of the Declass-3 subset [38], and were provided as scanned B&W images with 3600 dpi resolution. The photographs cover the main landmarks of the Sawa and Hammar Lakes, the Umma and Uruk settlements, the Ayn Sayed and Ayn Shalal springs, and a transect of the Euphrates River (see footprints in Figure 1b).
To provide a regional-scale assessment of the major changes that occurred across the landscape along the Abu Jir region, Copernicus Sentinel-1 C-band (5.547 cm wavelength) Synthetic Aperture Radar (SAR) scenes in the Interferometric Wide (IW) swath mode (250 km swath, single-look ground range by azimuth resolution of 5 m × 20 m [39]) were used. The selected Sentinel-1 dataset includes 34 satellite passes acquired along ascending paths 72 and 145, each consisting of two or three standard IW scenes, leading to a total of 88 scenes (Table A2; see footprints in Figure 1a). Co-polarisation VV (i.e., vertical transmit, vertical receive) was used due to its higher signal power compared to cross-polarisation VH (i.e., vertical transmit, horizontal receive). Sentinel-1 images acquired in November–December (mild winter; lowest average temperature of 15 °C and highest monthly precipitation of 30 mm recorded during the year) were selected to generate nine ~1 year-long temporal baseline (Bt) pairs, i.e., 2014–2015 to 2022–2023, while trying to minimise the perpendicular baseline (Bp) with the aim of reducing the induced decorrelation in the derived interferometric products. Seven more scenes, acquired along track 145 over the area around and southwest of Najaf Sea in March–June, 2022 (Table A3), were exploited to detail the changes induced by dust storm events at shorter temporal scales by generating six pre-, cross- and post-event pairs, with a Bt of 12 to 36 days. A local-scale analysis of landscape changes in the western Samawah province was implemented using multi-spectral imagery acquired by the Copernicus Sentinel-2 constellation (290 km swath, 13 spectral bands from 0.442 to 2.202 µm, 10 days revisit, and 10–60 m pixel spacing, depending on bands [40]). A total of 234 Level-2A Bottom-Of-Atmosphere (BOA) ortho-rectified surface reflectance tiles acquired at 94 different dates were selected (Table A4) by filtering Google Earth Engine (GEE)’s Sentinel-2 BOA harmonised collection. The selected scenes focus on the months of July (hot summer; highest average temperature of the year, at 37 °C, and almost no precipitation) and December for each year in the 2018–2023 period in order to ensure temporal consistency with the Sentinel-1 data analysis, and also to provide a coeval optical layer for comparison with field and drone observations (see Section 3.2). No tiles could be exploited before December 2018 due to the unavailability of BOA scenes in the GEE collection for this region before that date. Additionally, three extra scenes acquired on 14 April 2019, 13 February 2020 and 2 December 2022 were selected to depict specific surface processes at the local scale (see Section 4.2). Since the regional-scale analysis based on Sentinel-1 and Sentinel-2 imagery allowed for the narrowing down of the analysis to sites showing the highest risk from ongoing human activities, a 1 year-long very-high resolution (VHR) survey was also designed and tasked in 2023 with ASI’s COSMO-SkyMed dual-use X-band (9.60 GHz frequency; 3.1 cm wavelength) SAR first-generation constellation (three satellites—CSK1, CSK2, CKS4—each with 16 days revisit [41,42,43]). The Enhanced SpotLight (ES) narrow-field imaging mode was employed for the survey, providing SAR data with ~0.4 m × 0.7 m pixel spacing (slant range by azimuth) and 10 km × 10 km ground footprints [44]. The data were tasked with co-polarisation HH (horizontal transmit; horizontal receive) using three ES beams (ES-17, ES-25, and ES-33, with different θ, from 44.2° to 57.8° at the scene centre) in both ascending and descending modes, in order to optimise the spatial coverage of the sites of interest and maximise opportunities for more frequent satellite revisits. Four frames were tasked: AOI#1–AOI#3, located in the eastern part of the western Samawah province and focusing on ancient and modern canals and clusters of archaeological ruins, and AOI#4, centred on the Ayn Sayed spring (see footprints in Figure 1b). The interferometric granularity with all satellites was programmed, with the aim of acquiring as many scenes per site as possible (compatibly with the other tasking priorities of the mission) by preserving the same acquisition geometry for each stack and allowing for change detection. Between the end of November 2023 and November 2024, more than 170 scenes were acquired over the four frames (see full list in Table A5, which emphasises the high temporal granularity achieved). Copernicus Sentinel-3 scenes [45] were exploited to retrieve country-wide snapshots of dust storms that occurred in 2022. These images were acquired with the Ocean & Land Colour Instrument (OLCI; visible-imaging push-broom radiometer, 21 bands from 0.400 to 1.020 µm, 300 m spatial resolution, and 1270 km field of view). The scenes were exploited at Level-1B, which provides calibrated, ortho-geolocated, and spatially re-sampled Top-Of-Atmosphere (TOA) radiance products.
A local-scale assessment of dust storms’ impact was made over the landscape around Najaf Sea before and after the event occurred on 24 April 2022, which was also observed by the Sentinel-1 change products (whereas the Sentinel-3 scene was hampered by cloudiness, and did not allow for dust storm detection). A total of 43 PlanetScope’s SuperDove multispectral image tiles (up to 32.5 km × 19.6 km wide, with four bands from 0.465 to 0.885 µm) acquired by satellites along two descending paths on 21 April (pre-storm; 26 tiles), 30 April, and 25 May 2022 (post-storm; 14 and 19 tiles, respectively) were selected and sourced as orthorectified products (radiometrically, sensor-, and geometrically corrected) at 3–4 m spatial resolution. The associated Usable Data Masks (UDM2) files providing pixel-by-pixel data usability information (e.g., a clear pixel, shadow, snow, haze, and cloud) and their respective confidence levels were also used for the following analysis.
Three Landsat scenes were exploited to verify the land cover status at the Ayn Sayed spring (see footprint in Figure 1a): two acquired on 4 May 1991 and 31 March 2002 by Landsat-5 Thematic Mapper (TM) multispectral scanning radiometer with six bands (from 0.45 to 12.5 µm) at a 30 m resolution (120 m for thermal IR), and another one acquired on 2 February 2022 by Landsat-8 Operational Land Imager (OLI) with 11 bands (from 0.43 to 12.51 µm) at a 30 m resolution (15 m for panchromatic and 100 m for thermal IR). The scenes were accessed at Level 2, i.e., radiometrically calibrated and atmospherically corrected surface reflectance products.
Additionally, 12 orthorectified Pléiades Neo multispectral scenes acquired on 28 September 2021, 1 December 2022, 25 January 2023 and 7 February 2023 were selected to allow for the identification and examination of small features. The scenes include six bands of 1.2 m resolution (deep blue to NIR; from 0.4 to 0.77 µm) and panchromatic bands of 0.3 m resolution, and all were processed to the reflectance level.
Finally, Google Earth and ESRI World VHR imagery was exploited to achieve a better definition of small-scale features. Where possible and when not hampered by imagery gaps, degraded resolution, or poor visibility, the Google Earth Pro time lapse function was utilised to visually inspect the land surface changes, presence of modern development activities, and archaeological heritage conditions.

3.2. Drone and Field Survey

A tailored field survey was carried out in early July 2024 to complement and validate satellite observations. Field photographs were taken at the most critical areas, i.e., the Ayn Sayed and Shoaib Abu Khdhair springs (within AOI#4), along key transects of ancient canals in AOI#1 and AOI#2, and also at several abandoned villages, gardens, irrigation canals, and farms, which used to thrive when the Ayn Sayed spring was actively running.
The survey at the above sites included an Unmanned Aerial Vehicle (UAV)-based imaging campaign, using a DJI Air3 system operated by the University of Al-Qadisiyah. This is a compact and foldable rotary UAV equipment, with a 46 min maximum flight time and 3D obstacle sensing. The system is equipped with two cameras: a 3× medium and a wide-angle telephoto. The latter is a FC8282 camera with field of view of 82°, an aperture of f/1.7, 24 mm format equivalent, 7 mm focal distance, 1.53 maximum aperture, and ISO-100 sensibility. Dual-camera photographs can be taken at up to 48 MP. A dataset of 49 high-resolution aerial photographs, including close-up views at priority sites, was acquired.
Both the field survey and the drone acquisitions were specifically conducted to verify the presence of the features observed from the satellite, such as new digging sites to obtain a water supply and pump installations. Furthermore, the aim was to confirm the condition of the springs, i.e., whether they were dry or whether water was still flowing. The ground-truthing of satellite estimates extracted from spectral indexes (see Section 3.3) was outside the scope of the present research. The very challenging local climatic conditions (high temperatures and intense solar radiation exposure) of the surveyed areas did not allow for field surveys and drone observations to be made over such a vast scale at the pace of the satellite overpasses, given the aim of ensuring a ground assessment that was temporally co-located with satellite observations.

3.3. Image Processing and Change Detection

KH-9 photographs were georeferenced as full frames or, in a few cases, as small cropped areas of specific sites of interest (Table A1) using 8 to 10 high-quality ground control points that could be confidently identified within Google Earth Pro imagery, and the Shuttle Radar Topography Mission (SRTM) digital surface model [46] to account for the topography. The process enabled the mitigation of geometric distortions resulting from the camera imaging parameters, satellite elliptical orbiting motion, flying height, Earth’s curvature and rotation, terrain elevation, and, lastly, additional distortion introduced during the scanning process [47]. The overall spatial accuracy that was achieved was very high, as the Root Mean Square Error (RMSE) was, on average, ~2.4 m for the whole set of photographs’ orthorectification runs, including both the full frames and extra trials of smaller cropped subsets, improving the RMSE (Table A1). The KH-9 photo-interpretation followed a standardised approach to record key features of the ancient landscape of the study area, including archaeological tells, fortified structures, canals, water bodies, groundwater wells and springs, other potential archaeological sites, and unclassified features. The KH-9 interpretation was supported by VHR imagery available via Google Earth Pro v.7 to distinguish ancient canals extracting from the relict course of the Euphrates River, which were likely to have dried up by ~1st millennium BC, from other historical ones (~20th cent.), which were drawing from single springs or from the modern Euphrates.
For the change detection analysis, differential Interferometric SAR (InSAR) [48] was implemented with the Sentinel-1 IW pairs by exploiting the on-demand InSAR processing service available through the Alaska Satellite Facility (ASF) Distributed Active Archive Center (DAAC). The processing was run using the GAMMA software-based Hybrid Pluggable Processing Pipeline (HyP3) [49], using ASF’s Vertex portal and the HyP3 Application Programming Interface (API) for tailored granule selection and input parameters setup. Image pair co-registration was implemented by exploiting the Enhanced Spectral Diversity (ESD) algorithm [50] to achieve a precision better than 1/100th of a pixel. Multi-looking was performed using a 10 × 2 range by azimuth window and Goldstein–Werner adaptive phase filtering [51] with a 0.6 factor to improve fringe visibility and reduce phase noise. Topographic phase components were subtracted using the GLO-30 Copernicus digital elevation model at 30 m resolution [52]. Terrain-corrected and radiometrically calibrated backscatter images in the sigma-nought power scale (which was then converted to dB) were generated, along with the InSAR coherence maps, both with an output pixel spacing of 40 m. The final outputs were yearly change maps based on coherence, γ, a parameter quantifying the level of change that occurred over the subsequent years on a scale from 0 to 1 (with 1 indicating a perfect match between the reference and secondary image and 0 indicating total decorrelation). Within 100 m buffers around selected site locations (i.e., 194 ancient springs of the Abu Jir lineament and 94 ancient settlements and tells located west of Uruk), the average value of the SAR amplitude at each date and the coherence of each pair were computed and appended to the point-wise datasets.
Sentinel-2 data were processed in GEE, which also provided access to a high-performance computing environment. Image composites were generated in GEE by combining the available scenes of July and, separately, December of each year by filtering out cloud coverage at each pixel and reducing by the mean pixel values. The output composites were 12 in total, starting from December 2018 and ending in July 2024. Normalised Difference Vegetation Index (NDVI) maps were generated for each composite using the red (band 4; 0.665 µm central wavelength) and NIR (band 8; 0.842 µm) channels. Five sets of yearly pairs were formed using the six December composites to match the Sentinel-1 pairs, i.e., from 2018–2019 to 2022–2023, and the NDVI difference between a particular year and the preceding one was then computed to quantify the change that occurred. Change magnitude products were also generated to quantify the amount of change that occurred across the full set of Sentinel-2 bands. Images for each year were generated with the vegetated pixels identified by NDVI, so that these values would not influence this measure. Bands of 20 m and 60 m were resampled to a 10 m pixel spacing. The change magnitude was then quantified by calculating the Euclidian Distance (ED) between each composite image in a pair of years, i.e., the square root of the band-wise sum of the squared differences in the N bands [53]:
E D = i = 1 N X i ( t 1 ) Y i ( t 2 ) 2
where Xi(t1) and Yi(t2) are the reference and target spectral band values for each pixel at times t1 and t2, respectively. This parameter has been used in remote sensing to quantify change (e.g., [53]) and, in some cases, a direction component can be added to perform change-vector analysis (e.g., [54]).
Additionally, Normalised Difference Water Index (NDWI) [55] maps were produced using the vegetation red-edge (band 8A; 0.865 µm) and SWIR (band 11; 1.610 µm) channels to support the interpretation of NDVI variations that could be correlated with water-body variations but were uncorrelated with vegetation or agricultural changes. To generate binary maps of changed vs. unchanged land (values of 1 and 0, respectively), the NDVI was first thresholded at 0.3 to separate vegetated (NDVI ≥ 0.3) from non-vegetated areas (NDVI < 0.3), and then the absolute NDVI differences were computed for the yearly pairs in order to identify the occurrence of any non-vegetation-related changes. Similarly, the Sentinel-2 composites for which vegetation was masked were thresholded at NDVI < 0.3. These were then used as inputs for the change magnitude products, which were thresholded at 0.25 to output binary maps of changed vs. unchanged land. Output composites, NDVI, NDVI change, and change magnitude maps were generated at the 10 m resolution, while the NDWI ones were generated at 20 m. A 100 m buffer was calculated around each of the selected sites within the western Samawah province (i.e., 14 ancient springs and 76 ancient settlements and tells), the respective mean change in NDVI and change magnitude values for each pair were appended to the point-wise dataset, and sites were labelled as changed if at least one pixel within the buffer was recognised as such in the change maps. The tailored GEE code used for the processing builds upon the Sentinel-2 change detection workflow published in [56], and is available for further use within Newcastle University’s research data repository data.ncl [57].
COSMO-SkyMed data were coregistered to single reference scenes for each data frame; then, four SAR amplitude maps were generated in the sigma-nought power scale then converted to dB. Multi-temporal filtering through averaging the n scenes of each coregistered stack enabled the mitigation of radar speckle and enhanced the visibility of land features by preserving the native image resolution (no multi-looking was implemented). Change detection products were generated following well-established workflows [58,59], including the amplitude ratioing of selected SAR pairs from each coregistered stack and the computation of the temporal variability (standard deviation) of the amplitude of the n coregistered scenes for each stack, using a 3 × 3 Gaussian filter. Geocoding and terrain correction were then implemented for single scenes, multi-temporal averages, and change products, which were all finally exported at a 1 m pixel spacing.
The orthorectified PlanetScope tiles were mosaicked in ArcGIS Pro using a mean operator into three single scenes, one for each acquisition date, accounting for the UDM2 usability information for each pixel, and their band histogram statistics were harmonised to ensure flawless visualisation in the GIS environment.
A stack of the six multispectral bands of Pléiades Neo imagery was produced in ArcGIS Pro for each scene. Pansharpening was then applied using the panchromatic band for each multispectral stack with the Gram Schmidt algorithm [60], which improves the spatial resolution while also preserving the spectral characteristics. In-built band weights provided by ArcGIS Pro for the Pléiades Neo sensor were exploited.
Landsat-5 and Landsat-8 surface reflectance bands were also stacked and processed to generate true colour composites and NDVI maps using the red and NIR channels (bands 3–4 in Landsat-5 and bands 4–5 in Landsat-8, respectively).

4. Results

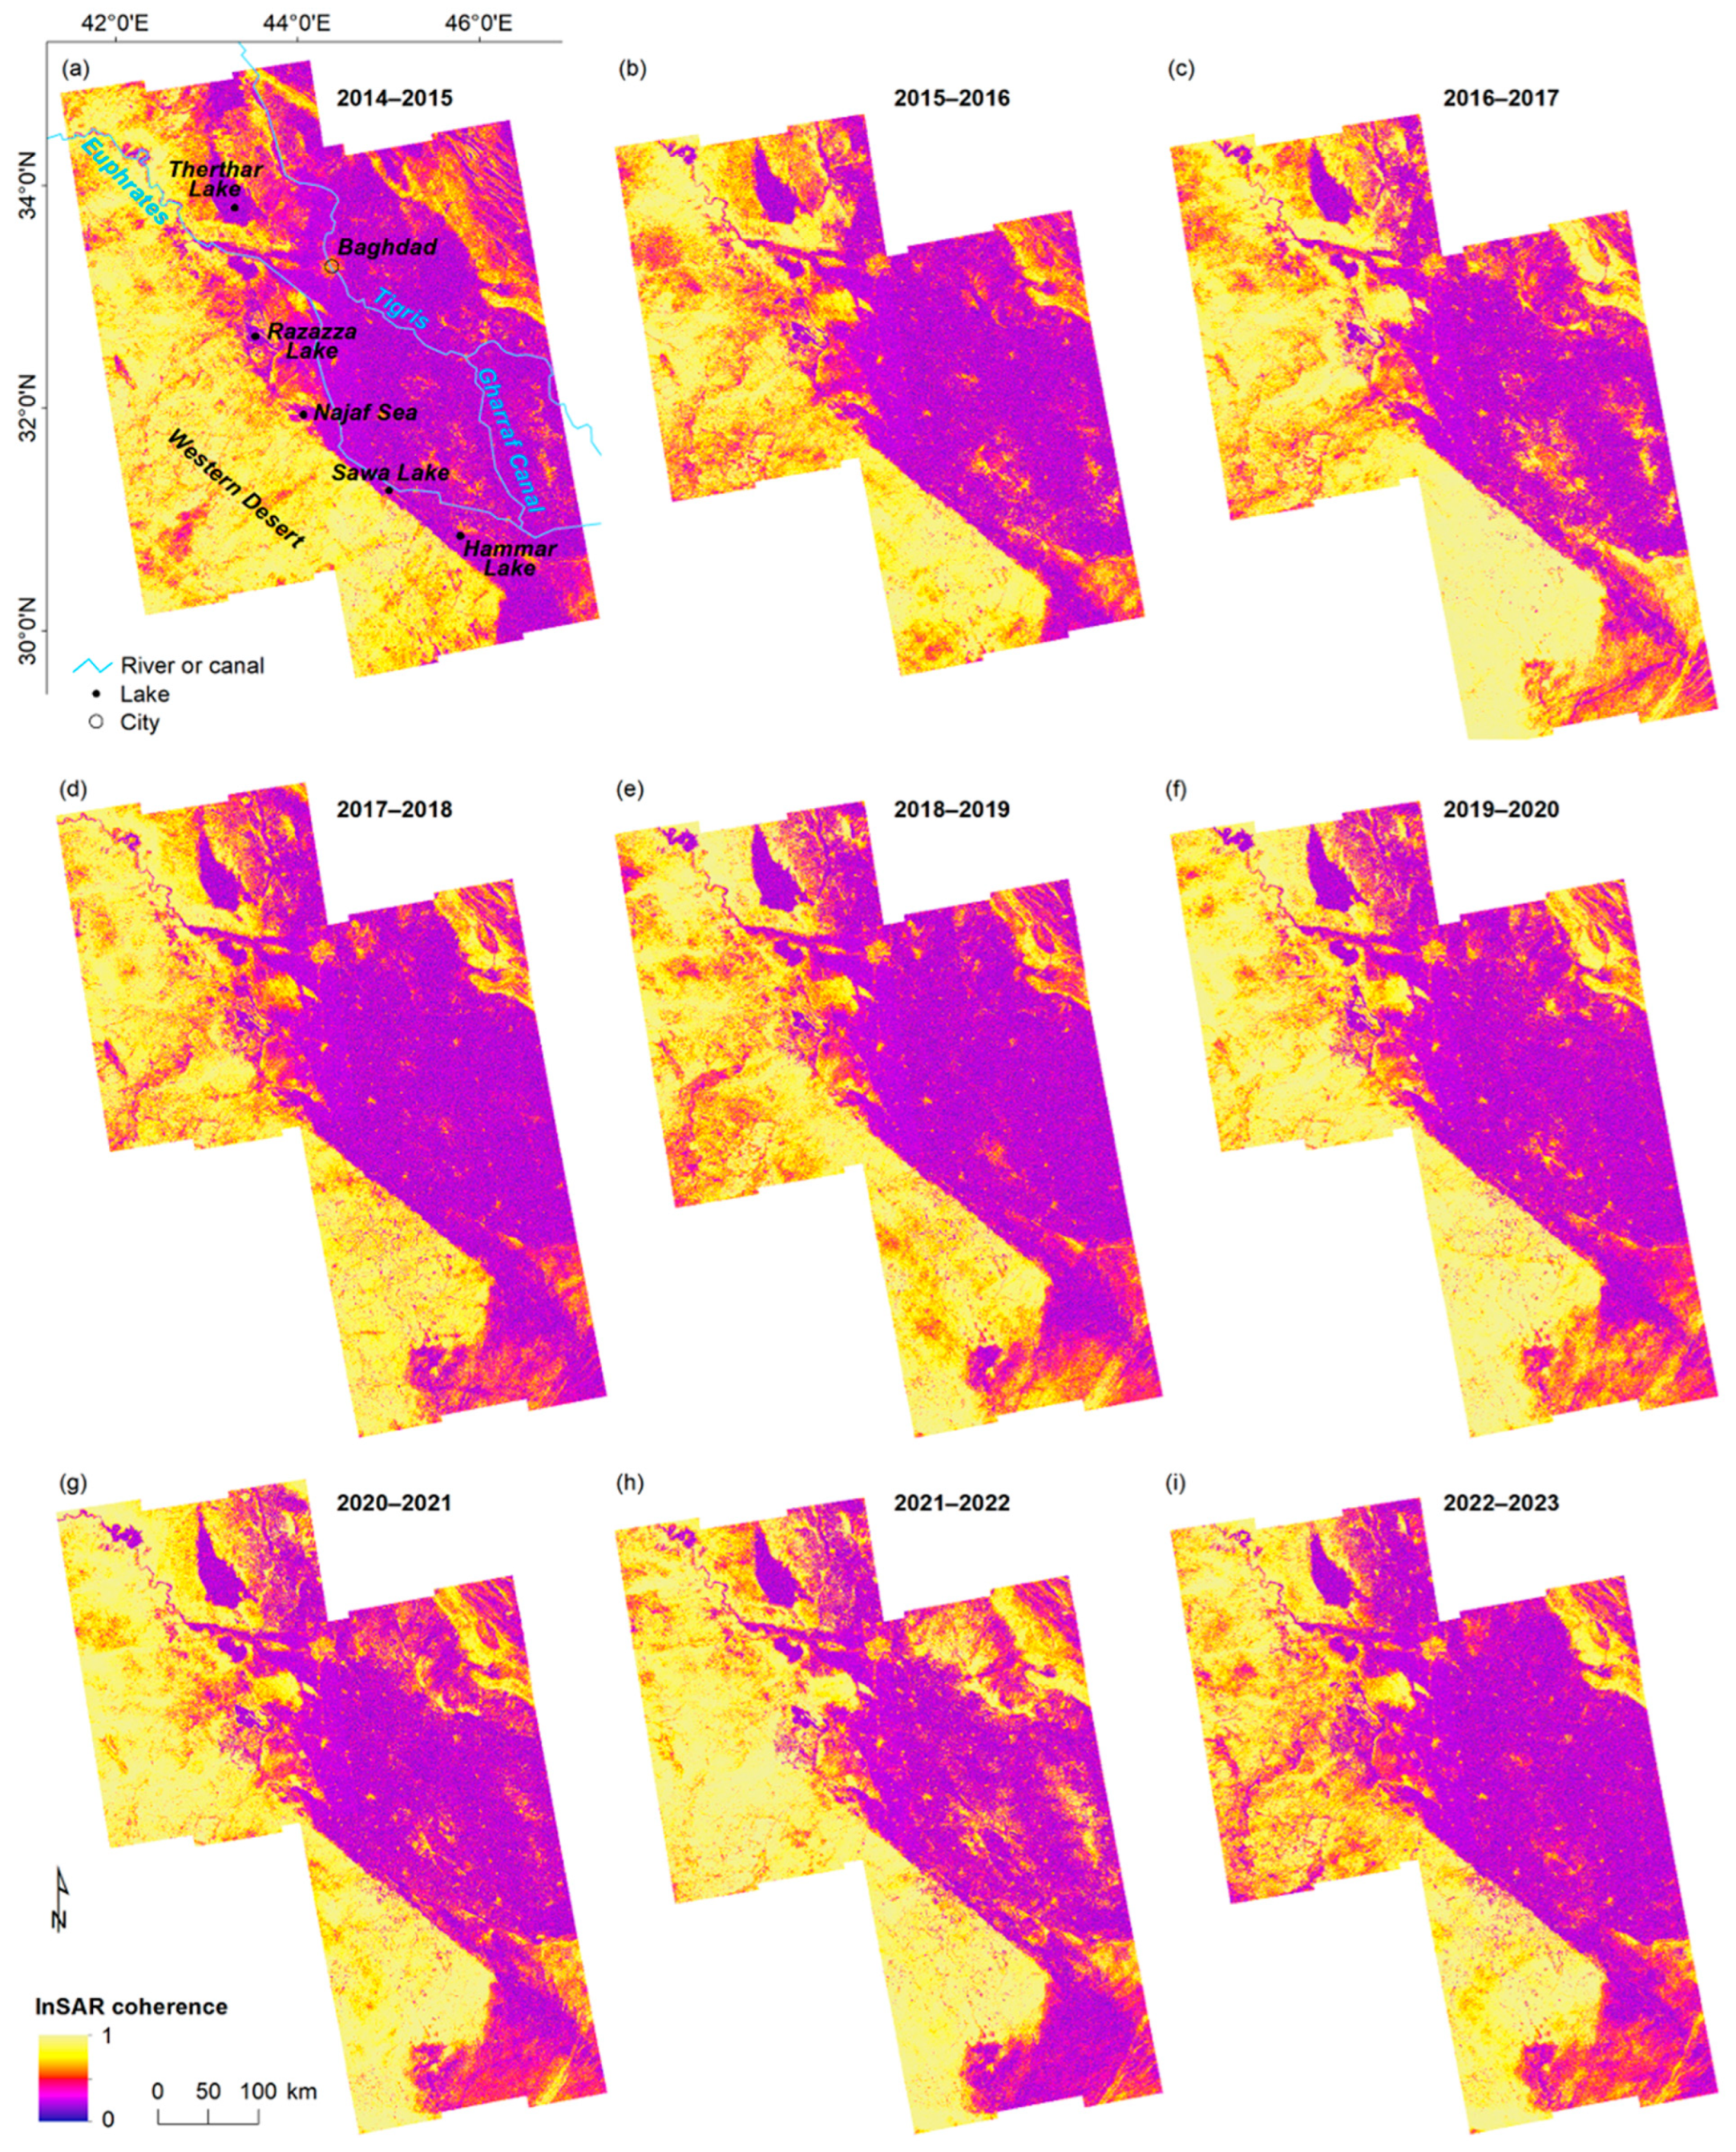
4.1. Regional-Scale Land Surface Processes

An overview of the yearly landscape transformations that occurred across the study region in 2014–2023 is provided by the time sequence of yearly change maps based on the Sentinel-1 InSAR γ (Figure 2). As proved in previous research over arid environments affected by landscape disturbances [61,62], γ patterns can be easily used as proxy for landscape changes, both macroscopic and minor, which might be undetectable in single scenes (either optical or radar). At the broad scale, the nine maps highlight an overall pattern of a relatively high correlation in the western desert plateau over the last 10 years (γ ~0.8–1.0; Figure 2). The Tigris and Euphrates Rivers plain, on the other hand, exhibits a remarkable pattern of general decorrelation (γ ~0.2–0.4).
At the local scale, a number of natural and anthropogenic features and processes can be recognised across the desert plateau, including:
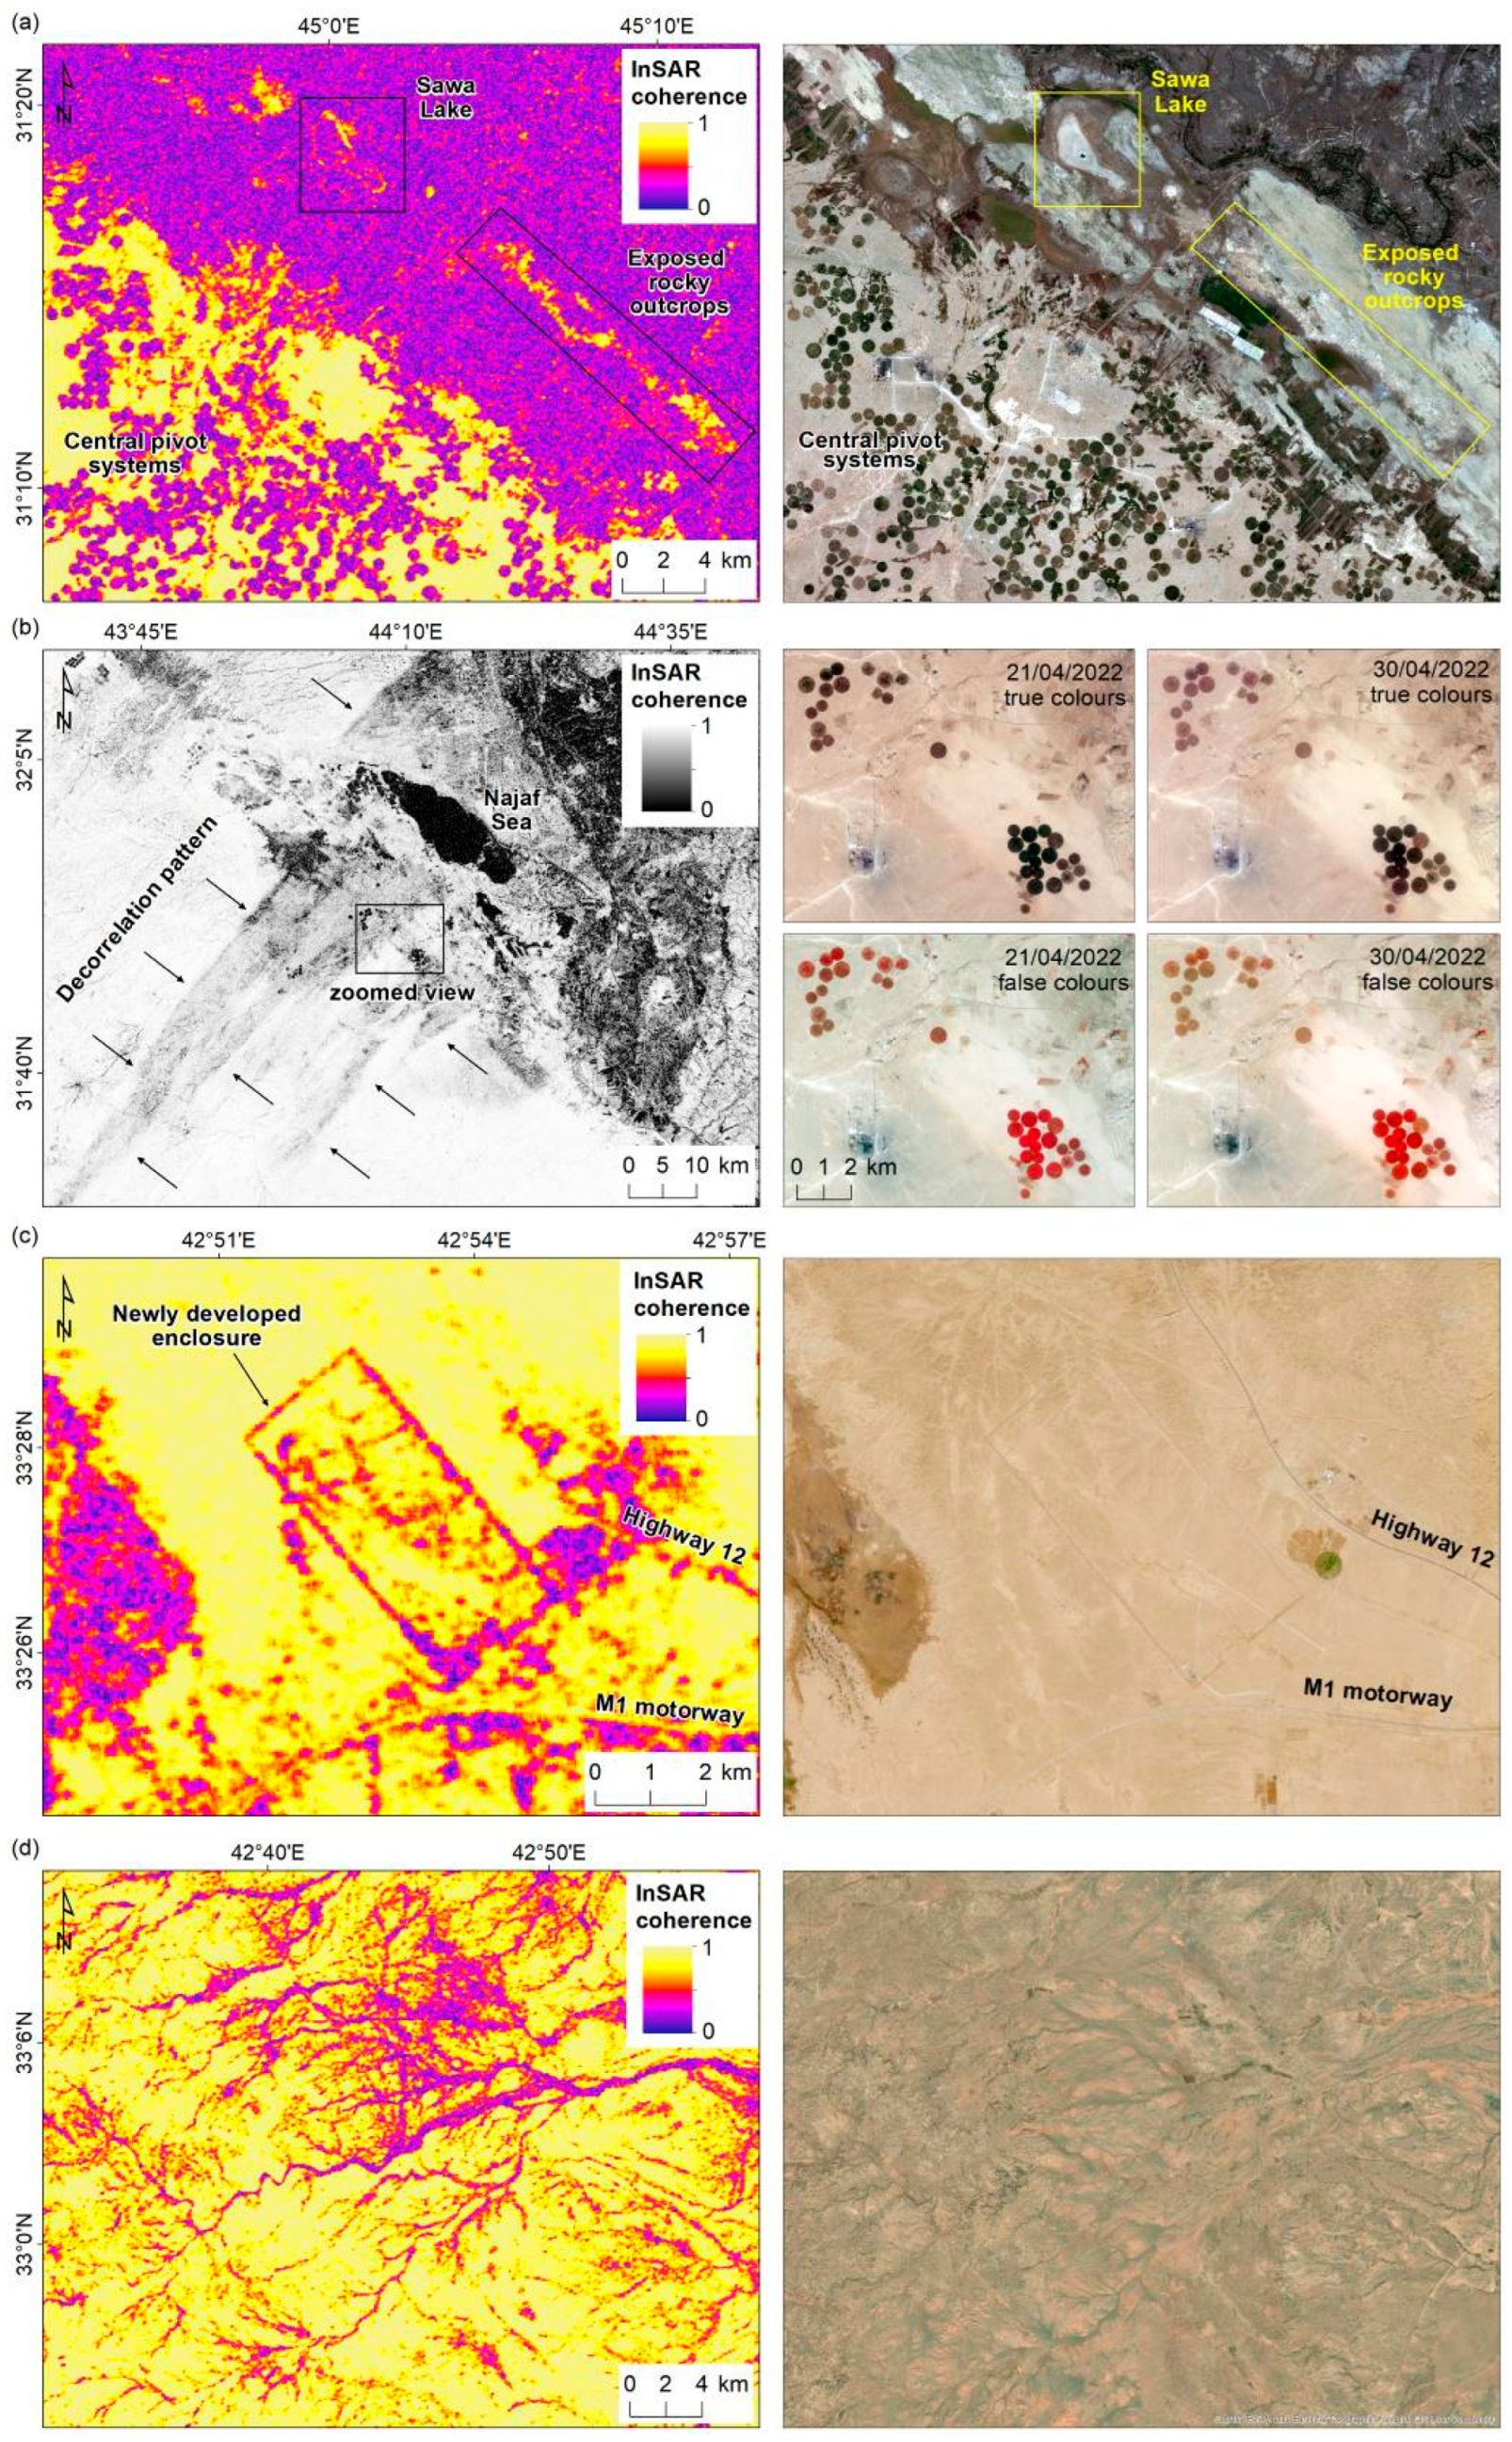
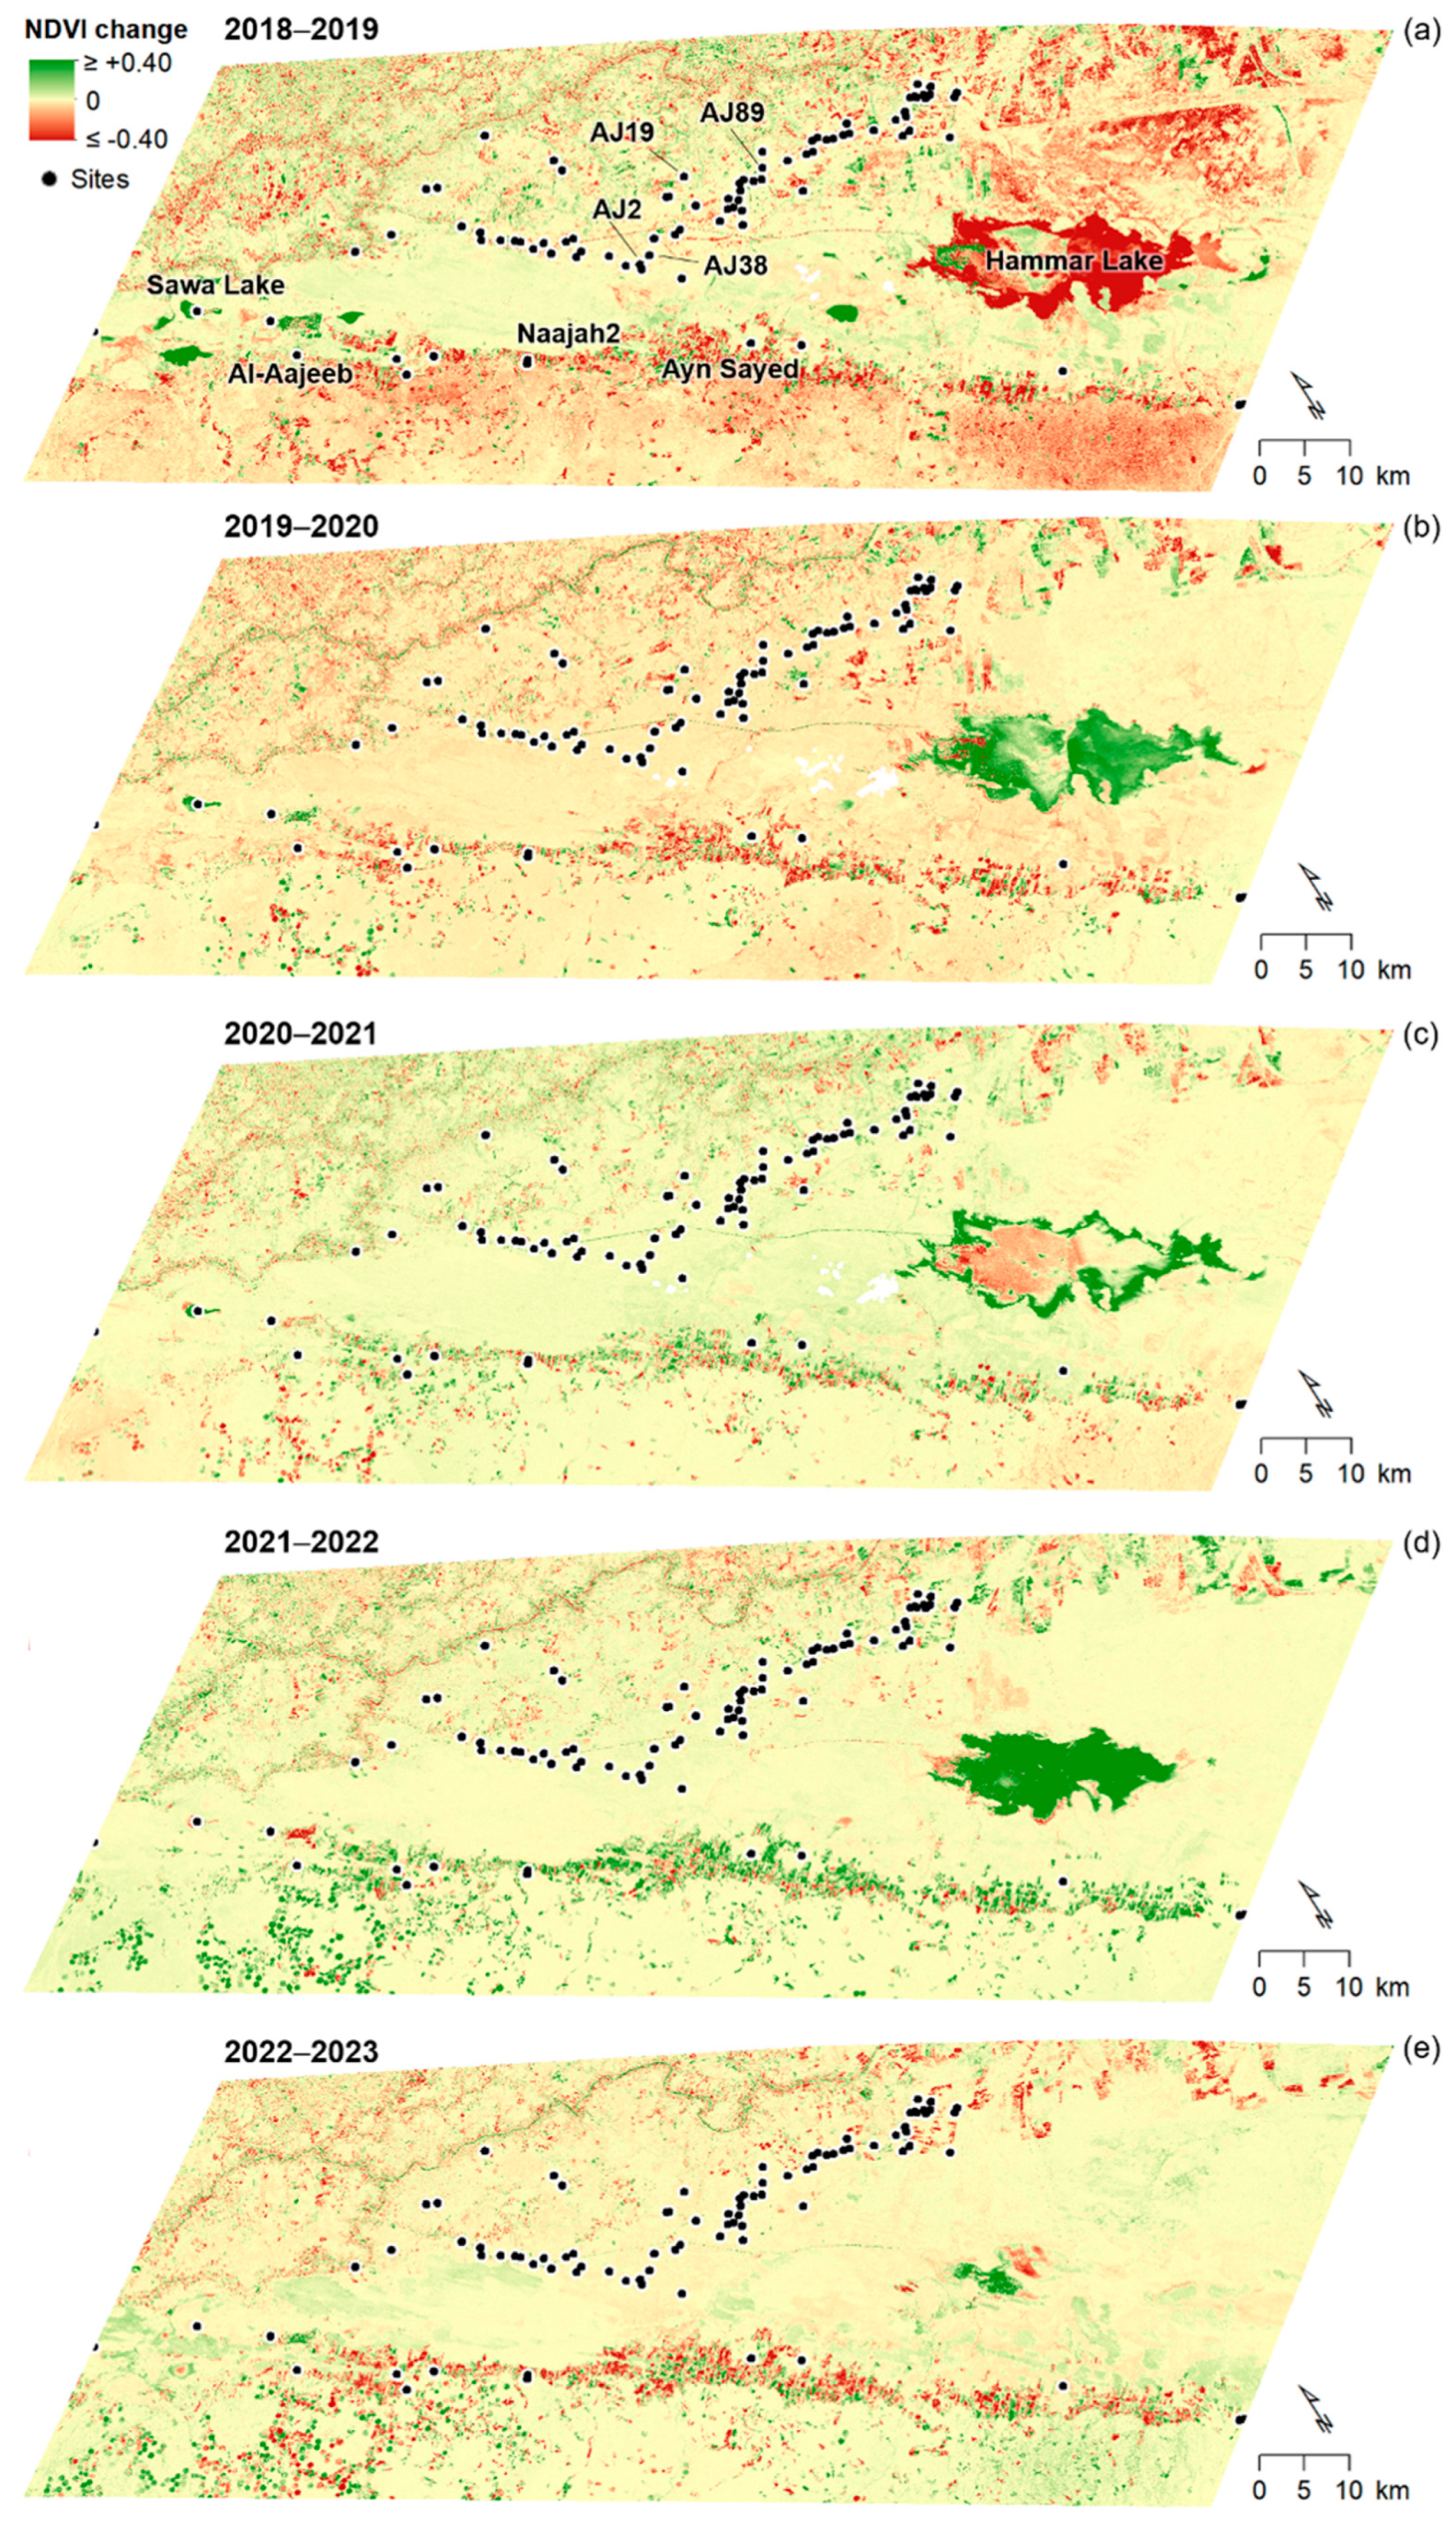
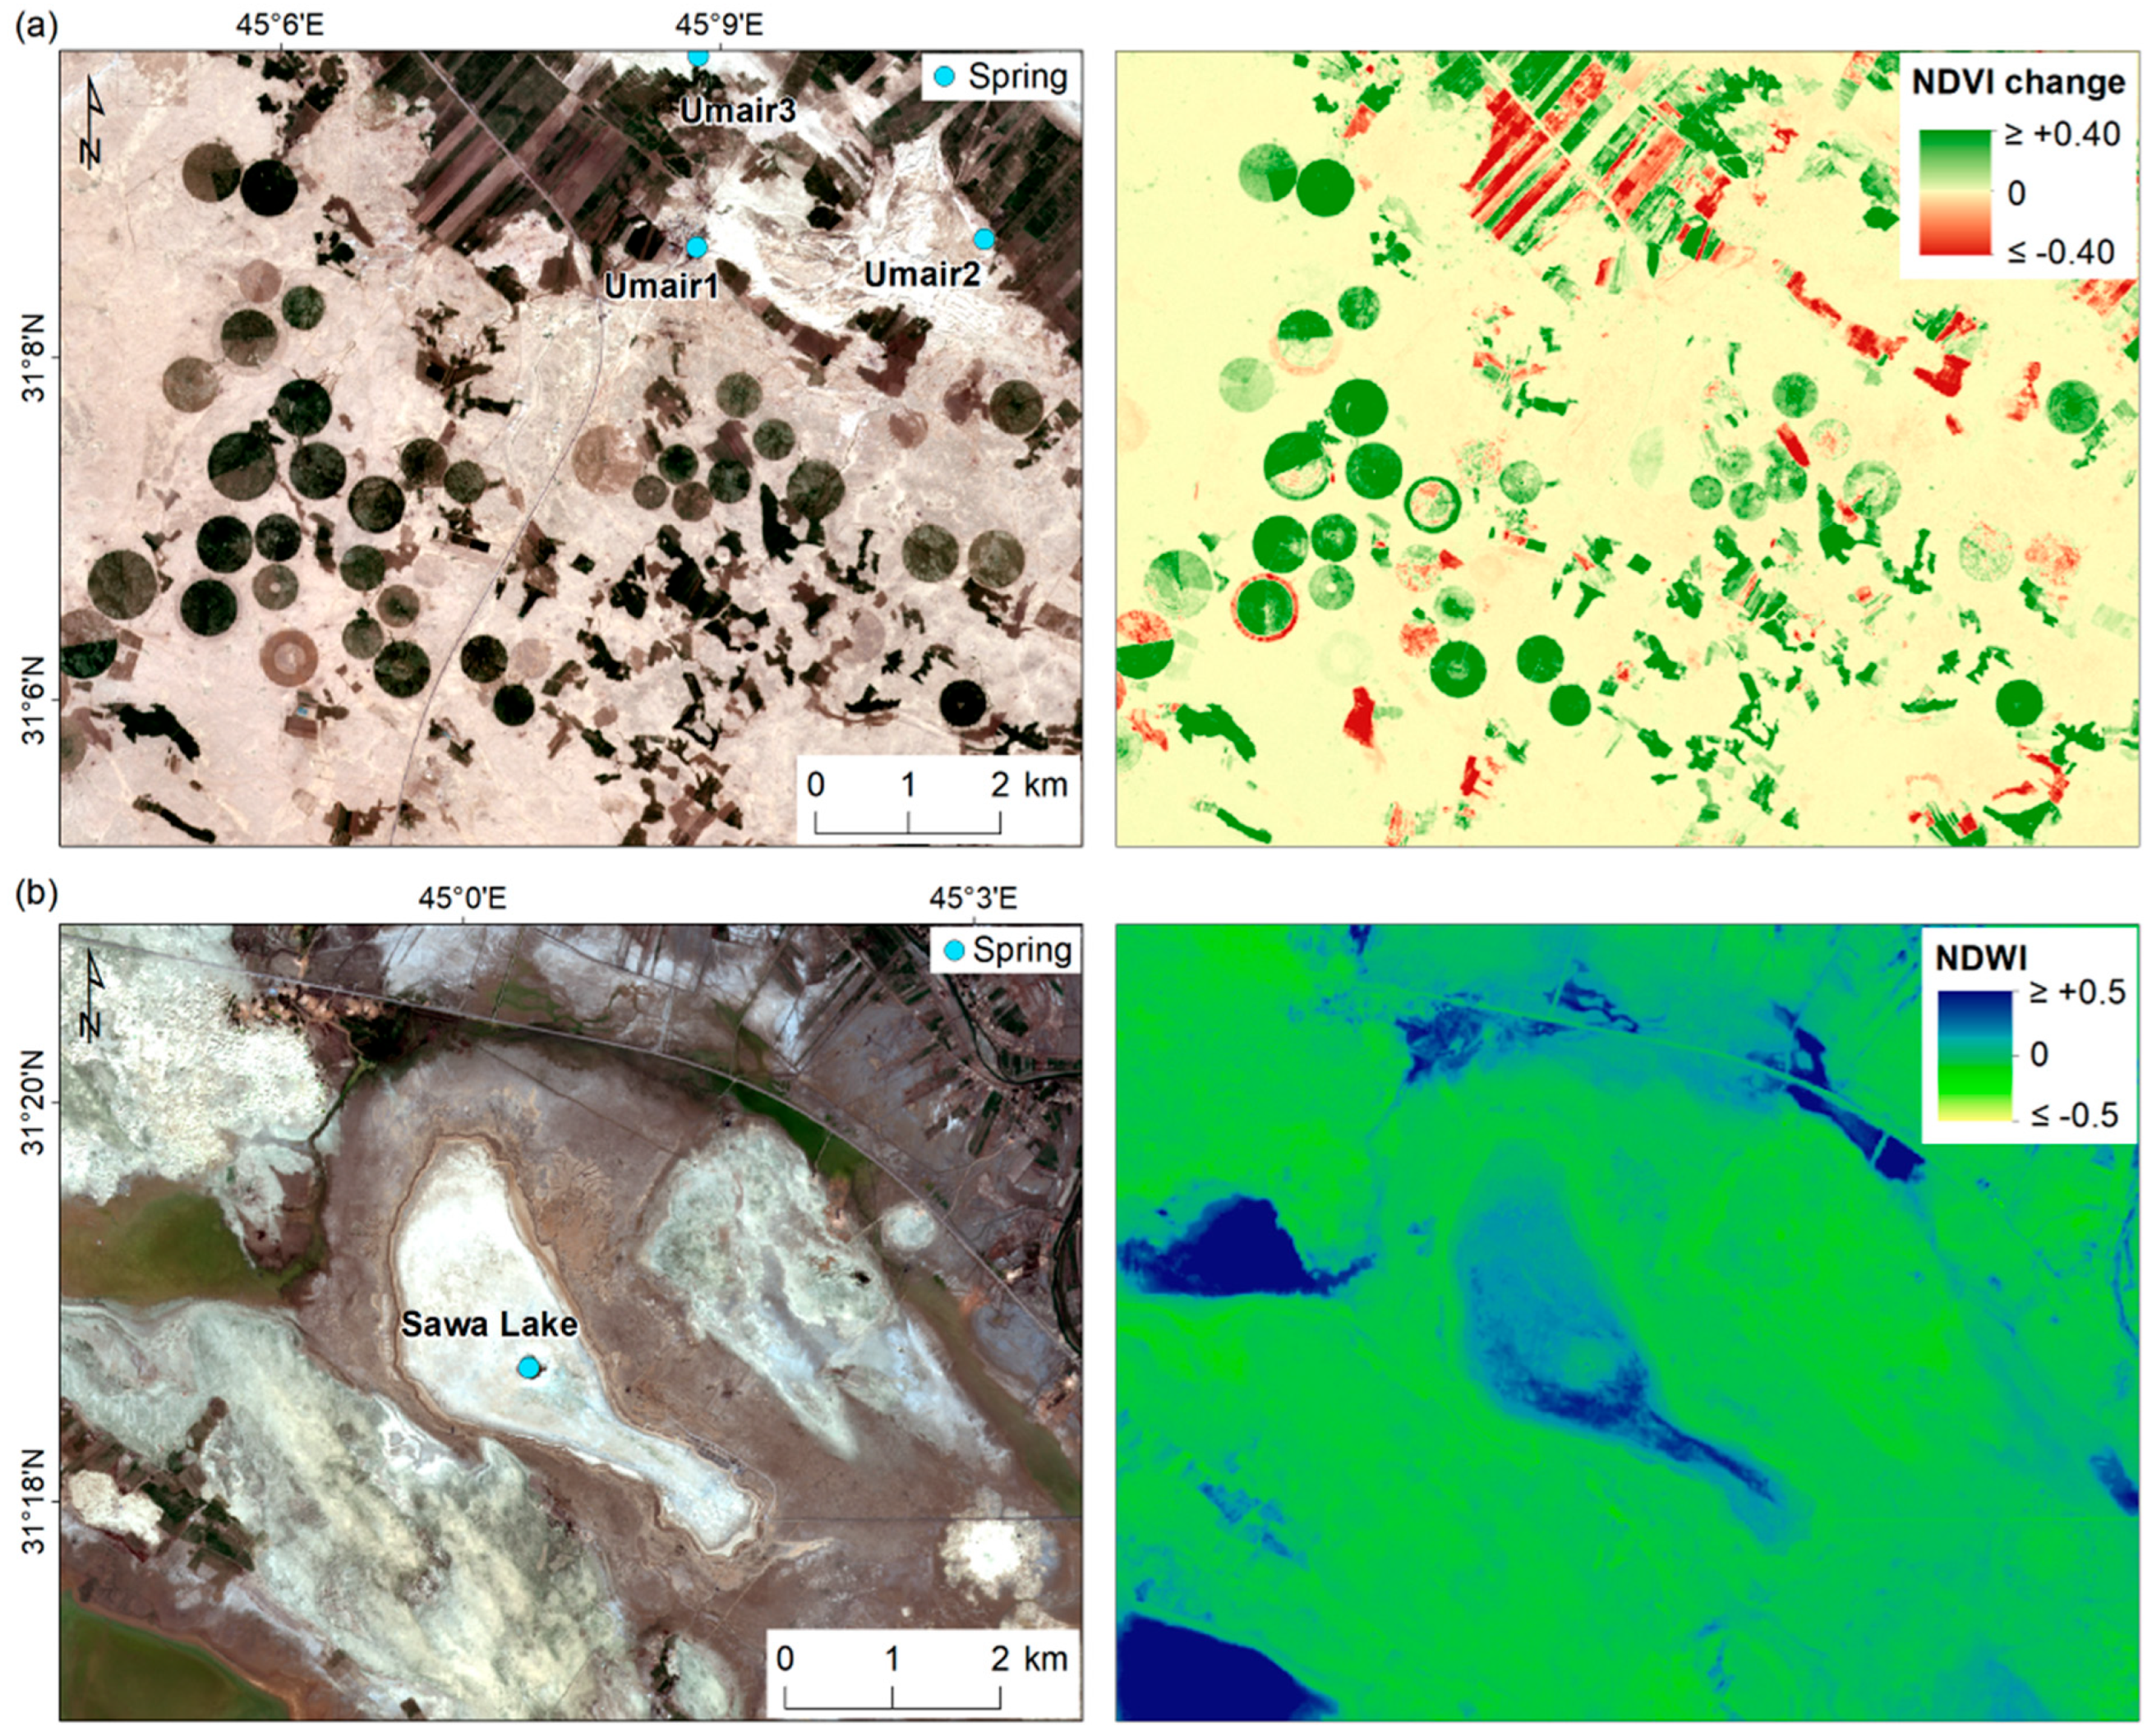
  • Main water bodies (e.g., Therthar Lake, in the northern sector of the processed tracks; Figure 2a), which rapidly decorrelate due to the typical backscattering mechanism of water and, in some cases, due to the long-term changes in the extent of the surface of lakes that are progressively drying up, e.g., the recently documented disappearance of Sawa Lake [63], as depicted by a highly decorrelated pattern in 2021–2022 and the apparently dry lake bed in 2022 (Figure 3a).
  • Land transformations linked with ongoing agricultural activities, the expansion of existing fields, the development of new ones (e.g., dense clusters of hundreds of modern centre-pivot irrigation systems, clearly indicated by the tens of decorrelating rounded features in Figure 3a; see also Section 4.2), or the abandonment of previously cultivated lands.
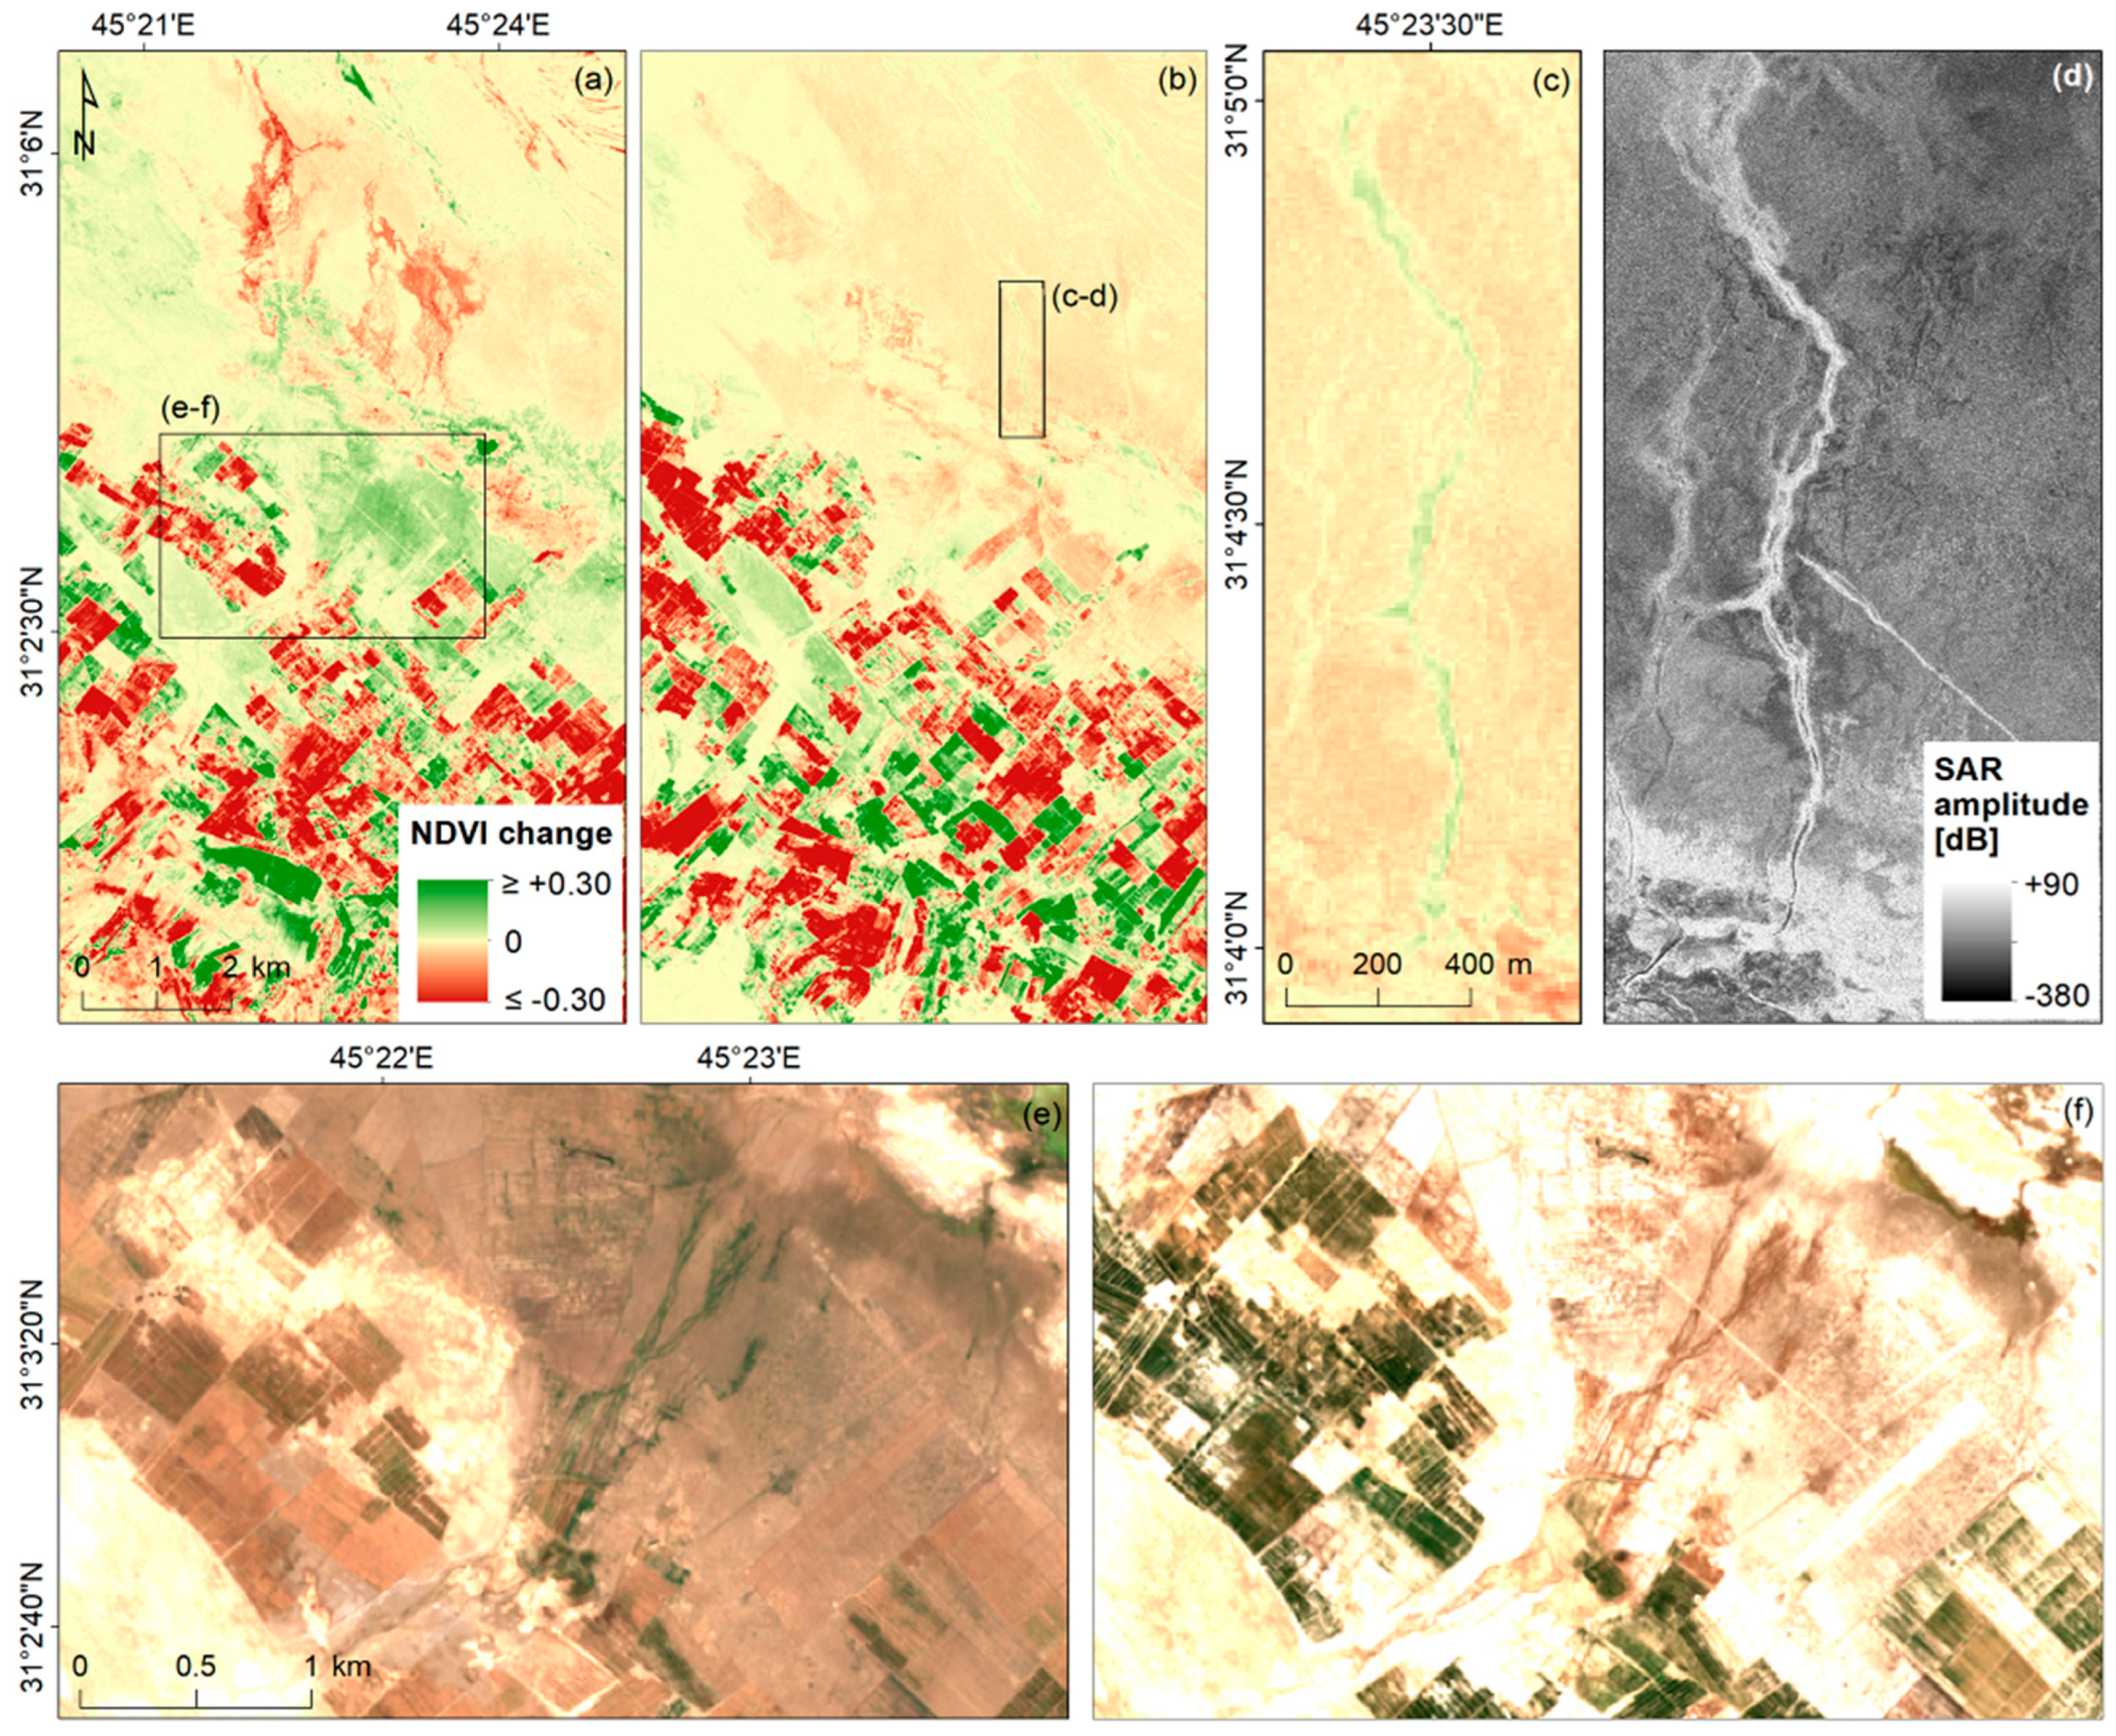
  • Sand dune migration- and dust storm-related impacts on the agricultural landscape and human settlements, e.g., near the Najaf Sea and to its southwest (Figure 3b), where both yearly and short-temporal-scale γ maps clearly depict the medium-scale impact of the storm. Further confirmation is found in the PlanetScope data showing the layer of deposited sand that, soon after the dust storm event, covered the modern agricultural fields, which consequently appear brown to dark brown in the true-colour scenes and light brown to reddish in the false-colour scenes. Some of these fields, including one of the largest clusters, developed onto white patches of land that, in InSAR γ maps, generally appear as very-low-γ areas and correspond with northwest–southeast elongated geomorphological features that have yet to be fully interpreted by local geologists. Field observations suggest that these might be remnants of Holocene dunes, consisting of well-sorted and compacted sand (thanks to their salt content) that cannot migrate with the wind. A number of these features are found towards the southeast and reaching up to Hammar Lake (locally called ‘Slibiat Lake’).
  • New urbanisation at the margins of the desert plateau and the development of manmade structures, e.g., a rectangular decorrelation feature crossing the former Al-Muhammadi airport runway at Abu Teban in the Al-Anbar governorate, indicating the construction of an enclosure in 2021–2022 (Figure 3c). This feature presumably delimits the site in which the new Anbar international airport for passenger transport and air cargo is currently under construction.
  • Soil moisture variations along the fluvial network running across the desert that are almost invisible when using optical imagery, e.g., the river network west of Razazza Lake (Figure 3d).
Similarly, the decorrelated pattern along the Tigris and Euphrates Rivers plain is locally interrupted by InSAR-coherent features at exposed rocky outcrops (Figure 3a), open mining sites, and persistently reflecting structures, such as urban settlements (e.g., the capital city Baghdad and a number of smaller towns within the river plain).
Focusing on the Abu Jir lineament, the average yearly coherence at the 100 m wide buffers around ancient springs highlights a moderately to highly decorrelated scenario in 2014–2023, with values typically in the ~0.2–0.5 range (Figure 4a). The northern cluster of springs located southwest of Therthar Lake and up to the Razzaza Lake reveals a generally variable pattern, including some unchanged sites (γ ~0.6–0.8 at 19 springs) and many others that are moderately to highly decorrelated (γ ~0.2–0.5 at 70 springs). On the other hand, the cluster between Najaf Sea and Hammar Lake depicts a pattern of mostly moderately to highly decorrelated sites (γ ~0.4–0.5 at 25 springs and ~0.2–0.3 at 66 springs), and only a few that are less affected (γ ~0.6–0.8 at 14 springs). The vast majority of springs near Najaf Sea were moderately decorrelated during 2014–2023 (γ ~0.4–0.5 at 17 springs), while the sites between Najaf Sea and Hammar Lake approached total decorrelation (γ ~0.2 at 20 springs and 40 settlements). The time series at the springs within the southern cluster show variable temporal trends, with yearly coherence changing in steps of up to ~0.2 each year (Figure 4b), suggesting alternating decreases and increases in surface disturbance during the decade of observation. The springs at Ayn Sayed (30.983 °N, 45.452 °E) and Sawa Lake (31.311 °N, 45.006 °E) show a drop in coherence in 2017–2018 and 2018–2019, followed by a recovery in the following years. Conversely, other springs provide evidence of overall increasing (e.g., Al-Aajeeb at 31.220 °N, 45.066 °E) or decreasing (e.g., Naajah2 at 31.091 °N, 45.257 °E) trends (Figure 4b). On the other hand, the time series of yearly coherence at the ancient settlements generally depict more homogeneous trends, with lower coherence values across the full set of pairs (e.g., tells AJ2, AJ38 and AJ89, and Sasanian fort at AJ19; Figure 4c). A local-scale analysis of these sites is provided in Section 4.4.
The yearly change maps derived from Sentinel-2 data allow for a better understanding of the key causes of such land disturbance (Figure 5), by highlighting significant changes in land cover and vegetation across the western Samawah province. In general, NDWI and NDVI were found to correlate well, with the former complementing the latter when the observed pattern was not due to vegetation or agricultural changes but was instead due to residual surface water and soil moisture. For the sake of brevity, the analysis mostly focuses on the NDVI results.
A general pattern of an NDVI decrease of ~0.05–0.20 was observed across the western sector of the area, across the desertified land. This was particularly apparent in 2018–2019 and, to a lesser extent, in 2020–2021 (Figure 5a,c). Localised decreasing patterns were also found at both isolated and clustered agricultural fields, suggesting a progressive transition from luxuriant to stark and barren fields in more recent years. Similarly, a loss of NDVI was observed across areas in which a dry-soil-to-water transition occurred (e.g., the increase in the surface extent of Hammar Lake between 2018 and 2019; Figure 5a); in addition to the yearly changes in the extent of surface water, the intra-annual variations across this arid landscape were also significant, depending on the months depicted by the selected images.
The evidence of an increased NDVI at a number of other water bodies (e.g., Sawa Lake; Figure 5a–c) and tens of circular features is also particularly relevant, as these showcase increases as high as ~0.9 in the 2021–2022 period (Figure 5d). These testify to the progressive development of new agricultural fields across the desert, supplied by modern wells which provide groundwater to centre-pivot irrigation systems. The Sentinel-2 data show that modern wells are typically drilled in proximity to the ancient water abstraction sites that supplied traditional cultivation (Figure 6a), and thus contribute to reducing their water resources. This adds to the natural process of desertification that was observed across the region in recent years [64], and is partly depicted by the NDVI change maps of 2019–2020 and 2020–2021 (Figure 5b,c). The change maps also confirm that, since 2020, the modern centre-pivot wells have continued to increase in number every year. On the other hand, the NDVI increase in the water bodies depicts a progressive drying-up and extensive salinisation over the last six years; for instance, at Sawa Lake (see also Sentinel-2 true-colour and NDWI maps in Figure 6b, showing values that were generally below ~0.2 in 2023 across most of its former extent). Within its bed, a groundwater source is occasionally exposed when the water levels recede [24]. Additionally, the maps reveal a few ephemeral water bodies, generated from the water run-off and discharge from irrigation activities (see also Section 4.3), and also highlight areas of dune migration and several changes at the margin of the desert, especially in 2022–2023 (light green patches in Figure 5e).
The binary assessment of changed/unchanged sites provided by the Sentinel-2 NDVI change and change magnitude products (Figure 7) shows a general trend of an increase in unchanged sites according to the NDVI change maps from 2018 to 2022, with a slight decrease in 2022–2023 (histogram in Figure 7a). The scenario provided by the change magnitude products, on the other hand, suggests an increase in changed sites in 2020–2021 and 2021–2022 (Figure 7b), possibly due to the occurrence of a significant amount of soil moisture and non-vegetation-related differences across the region. In this respect, the 2021 composite reveals a particularly dry landscape compared to the preceding and following years, likely due to a drop in the total precipitation recorded during that period (annual country-wide precipitation in 2021 was ~150 mm, compared to ~215 mm in 2020 and ~160 mm in 2022; [28]). The most updated change scenario for 2022–2023 (maps in Figure 7a,b) depicts a clear cluster of ancient springs in the western sector where changes were most significant, as opposed to a large number of sites in the eastern sector, closer to the Euphrates River, that appear to be unaffected by changes in the NDVI change map (Figure 7a) but were moderately affected according to the change magnitude products (Figure 7b), which likely included additional change factors in the overall assessment. To the south of this cluster, the Ayn Sayed spring exhibited some NDVI changes within its 100 m buffer zone (~0.02 in 2022–2023) and the site appears to have changed during that period according to the NDVI change detection method (red dot in the map in Figure 7a), suggesting the occurrence of some recent landscape disturbance around the site (see also Section 4.2).
The evidence of dust plumes and possible dune migration in 2022–2023 (e.g., the patches in Figure 5e) is linked to observations of the landscape’s susceptibility to dust storm events and related impacts. Sentinel-3 OLCI data very clearly highlight a temporal concentration of dust storms in the spring and summer seasons. More than 10 dust storms generating from the west or northwest and generally travelling towards the southeast hit the country in April–June 2022 (Figure 8a–d). The storms were featured in broadcast news and reports warning about reduced visibility even in the short/medium-distance range, the layers of dust deposited onto the land, towns and monuments, and the increased threats to human health [65], which are among the most frequent impacts of such processes [66,67,68]. Satellite observations from Sentinel-3 enable the identification of two main dust sources: (i) the Western Desert and the region of the old lakes, i.e., lowland areas filled with 1–2 m thick clay. This clay bed looks similar to white salt and is exploited by the local population for cultivation. As a consequence, the loosened clay is exposed to winds and mobilises (Figure 9); and (ii) the Central Desert, located northwest of Eridu, beyond the Euphrates River and south of Delmej reservoir, where [69], in May 2012, recorded a desertified area from which dust plumes generated. Figure 8a–d show the dust storm coming from the west and northwest, whereas Figure 8e–h focus on the dust storm plumes from the southern sector of the Central Desert. The latter area is mainly covered by fine-grained clayey sandy material and, in the 1990s, it was largely irrigated, with a dense network of ancient canals, which are now abandoned. Given its distance from both the Tigris and Euphrates Rivers and other irrigation systems, the area is isolated from water supply sources, and hence is highly susceptible to desertification and the release of dust.

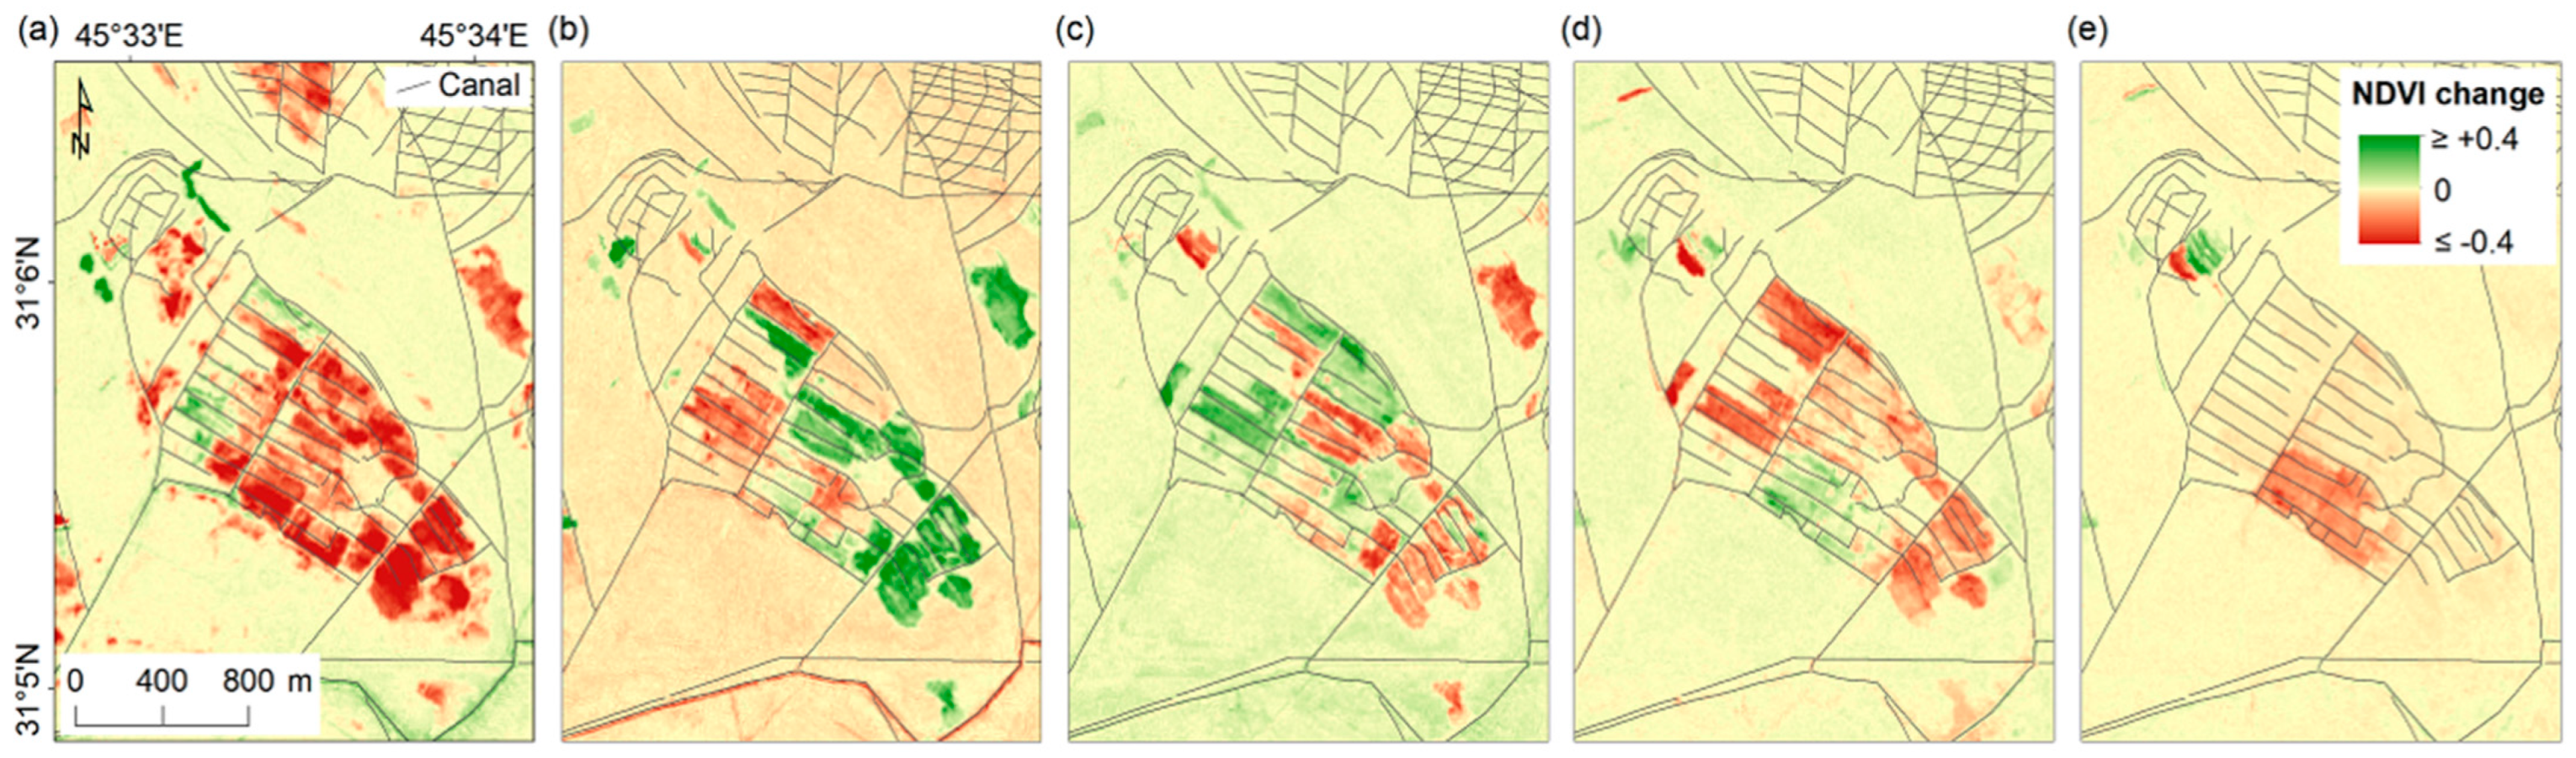
4.2. Agricultural Practices and Water Use

Springs in southern Iraq have been a focus for human settlement since the Palaeolithic era, and have sustained agriculture through networks of canals for centuries. However, satellite data highlight that the landscape around springs has been changing over the past decades, and groundwater extraction for industrial agriculture is currently threatening the springs’ preservation [24].
This can be observed, for example, around the Ayn Sayed spring (Figure 10). In February 1981, when the HEXAGON photographs were collected, the area immediately adjacent to the spring was free of agricultural fields (Figure 10a) and the canal fed by the spring and used to irrigate the fields in the western part of the Samawah province was full of water (dark-coloured line in Figure 10a; the whole extent of the canal and fields is shown in Figure 11a). Nearly 20 years later, in 2002, agricultural fields had developed west and southwest of the spring (see Figure 10b). After another 20 years, regularly shaped agricultural fields were further expanded (Figure 10c,d), surrounding the spring from the northwest, northeast, and southeast, although at a distance ranging from a minimum of 640 m up to 2 km (see Figure 10d,e).
Clear proxies of these changes are found in both the Sentinel-1 amplitude and coherence products covering the past 10 years. While amplitude increases (also outlining the irrigation of the fields, as shown in Figure 10c,f), coherence tends to decrease across the whole area, as a reflection of the agricultural practices and disturbance around the spring (see the coherence time series in Figure 4b). Matching evidence is provided by the Sentinel-2 NDVI change maps (Figure 11c,d). The comparison between the 2018–2019 and 2022–2023 change maps highlights the decrease in NDVI at the spring site and along the canal, alongside the increase in NDVI due to the development of new fields east and southeast of the spring at a closer distance (~700 m).
The fields surrounding the spring are irrigated with groundwater extracted by means of pumping systems, which are shown by the bright structures at different locations in both the Google Earth and COSMO-SkyMed VHR imagery (see Figure 10d,g). The SAR images also enhance the shape and structure of the fields, suggesting that, while the dense fields on the west exploit the local topography for water run-off and irrigation, the fields on the eastern side are irrigated through channels diverging from the natural topography (Figure 10g). The dark lines from/to the spring and the farms visible in the COSMO-SkyMed imagery are livestock tracks, while the brighter, nearly circular features around the spring and the Ottoman and Sasanian forts suggest new excavations, presumably to source water at additional locations to the main natural exit point of the spring (see Figure 10h).
Inspections in the field and the drone survey made in July 2024 allowed for verification that the spring was still active and the water was fresh (Figure 12a–d). However, the water flow was visibly impoverished and pumps were operating (Figure 12c,d). The surrounding area, characterised by grey soil of an organic composition, showed signs of salinisation. Furthermore, the local bedrock was excavated to create new openings for water abstraction, thus confirming what is visible in the COSMO-SkyMed images (compare with Figure 10h).
The ruins of the Sasanian and Ottoman forts were still in good condition (Figure 12b), as were the foundations of another structure that had not yet been mapped (Figure 12e), located 300 m northwest of the Sasanian fort and detectable in both the KH-9 photographs and the Google Earth image collected on 6 January 2012 (Figure 12a). However, industrial agricultural fields were less than 100 m from these remnant foundations, evidencing how close they are to potentially encroaching upon these archaeological features (Figure 12f).
Another interesting example of a simple irrigation system overlain by a more complex recent agricultural and irrigation system is the Shoaib Abu Khdhair spring (30.954 °N, 45.494 °E; Figure 13a), 5 km south of Ayn Sayed. In 1981, the spring nurtured a canal, slightly oriented southwest–northeast (Figure 13a and Figure 14a), which led to a small, unmapped cluster of fields in which livestock tracks were visible. Crop fields were then developed on the canal and the water flow was diverted for irrigation (Figure 13a and Figure 14b). As also well-highlighted by the most recent COSMO-SkyMed dataset (Figure 14d), there is now only a remnant of the original canal and a new well was dug, presumably under the assumption that this could replace the original spring. A number of vehicle tracks can also be recognised in the surrounding landscape (Figure 14b–d). During the field inspection in July 2024, no water was found within the original spring and the canal was completely dry (Figure 14e). This evidence matches the changes which occurred around the spring and the weak NDVI signal that was barely visible in the NDVI 2018–2019 change map (Figure 13c) and later vanished in the more recent maps (Figure 13d).

4.3. Water Run-Off and Discharge

The NDVI change maps highlight several areas of water run-off and collection within morphological depressions in the terrain. This is visible in the area of the Shoaib Abu Khdhair spring, which is located on a piece of land falling between two morphological depressions (Figure 13b–d). The NDVI change patterns outline the water run-off from the agricultural field and its flow to the depressions. These ephemeral water bodies appear intermittently across the satellite image time series. NDVI is a good proxy as it captures the floating vegetation and chlorophyll during the filling period and the decrease in this during the drying-out phase.
This surface process is not occasional or limited to individual instances but can be observed across the western part of the Samawah province. For example, at the bottom of AOI#1, at the margin of the cultivated area, a clear run-off feature repeatedly appears over time (Figure 15). The 2018–2019 and 2022–2023 NDVI change maps captured two different phases of this feature, i.e., when the water was running along the surface following the topographic gradient (red pattern in Figure 15a) and when the event was over and the terrain had already dried out (Figure 15b,c), respectively. Further confirmation that the territory is prone to such surface run-off is provided by COSMO-SkyMed data that captured another event in December 2023 along nearly the same footprint (Figure 15d).
Extending the observations further south, it is evident that the natural topographic gradient is also exploited by anthropogenic water run-off. Clear patterns are found in both yearly NDVI change maps (Figure 15a,b) and single scenes (Figure 15e,f), within irrigated fields from which water run-off originates and then accumulates into natural depressions.

4.4. Modern vs. Vanishing Older Features

The disturbances threatening springs described above and the development of more invasive agricultural practices also contribute to the progressive loss of landscape features that are related to traditional practices and cultural heritage. For example, in AOI#2 and AOI#3, on the eastern side of the Samawah province, agricultural fields that were once irrigated through traditional systems with water sourced from springs now seem to be disappearing. Figure 11a shows the irrigation system fed by the Ayn Sayed spring as it was depicted in the KH-9 photographs in 1981. Ten years later, Landsat imagery documented that this system was operational and the fields were flourishing (dark green NDVI patterns in Figure 11b). In the time span of less than a decade, the Sentinel-2 yearly NDVI change maps highlight a serious decline in these fields (Figure 11c,d). Some of the fields were definitely abandoned, as was verified in the field in July 2024 (see the zoomed-in pictures over a cluster of fields in Figure 16 and Figure 17). At the same time, other activities continued to develop, such as a private mud brick factory for which the Sentinel-2 data highlight the constant presence of water ponds used for the production chain.
A detailed analysis of the landscape reveals that one factor leading to the decline in traditional agricultural practices is the creation of modern irrigation systems overlying the older ones, which in some cases causes their destruction. An example is provided in Figure 18, which compares the present situation with how it was in 1981. Compared to this earlier period (Figure 18a), at present, at least three canal and irrigation systems spatially overlap (Figure 18b), i.e., the ancient and traditional ones (marked by yellow lines): the main canal built during Saddam Hussein’s era, crossing the landscape from north to south (cyan line), and the most recent irrigation system. The latter causes a detrimental encroachment which is clearly visible at various instances (e.g., Figure 18c) thanks to the enhancement of the surface roughness of new channels and field boundaries in the COSMO-SkyMed data. The bright lines mark the location of the nearly regular grid of this new agricultural and irrigation system, which sources water from the main Saddam Hussein-era canal and foresees the inundation of the fields (red squares in Figure 18d).
The encroachment caused by the modern agricultural and irrigation practices is in addition to other anthropogenic disturbances that threaten cultural heritage sites. These encompass looting, reworking and reshaping, levelling and flattening, earth removal, mining and quarrying, building construction, roads, disturbance from heavy vehicles, and changes in use, and are often documented across the country (e.g., [70,71]).
Within the same AOI#1, in the southern portion where the modern agricultural system lies above the palaeo-fluvial feature of ancient meanders of the Euphrates river (Figure 18a), the current land use is coupled with incidents of looting that damaged a cluster of Babylonian sites (settlements AJ2 and AJ38 in Figure 19). While no clear evidence of looting was found through the visual inspection of KH-9 imagery (Figure 19a,d), Google Earth scenes highlight the presence of looting holes since 2013 (Figure 19b,e). Illegal excavations have occurred repeatedly over the past decade, as suggested by the increased number of pits in the latest optical imagery and the bright appearance in the SAR data (Figure 19c,f) highlighting the impact due to looting that left the sites completely pockmarked.
Further invasive threats to site preservation come from modern development activities. For instance, in the northwest corner of AOI#2, a fortress with Sasanian origin that was used during the Ottoman era—which was clearly visible in 1981 in the KH-9 scene, which enhanced its regular square shape and corner turrets—was mostly destroyed due to digging and bulldozing (settlement AJ19 in Figure 20). Excavations and the removal of earth appear to have started in the proximity of the site at around 2013 (Figure 20b), and progressively expanded up to the point where at least half of the site was destroyed by 2020 (Figure 20c,d). The sharp edges of the excavated land were still clearly visible in the SAR scenes in 2023–2024 (Figure 20e). The repeated action over time suggests that the likely purpose was quarrying to supply materials for construction in the nearby villages of Al-Khidir and Al-Darraji in the northeast. Indeed, the fort is located very close to the road leading to those villages. Terrain is usually requested and purchased by local inhabitants for mud–brick manufacturing and to create artificial platforms to raise their houses to a higher elevation than the surrounding land.
At other locations, the anthropogenic impact on the landscape comes from industrial development. As observed in the Sentinel-2 time series (see Figure 11 and Figure 16), in the centre of AOI#2, a private mud brick factory developed over the past decades (east of settlement AJ28 in Figure 21a). While the sites in the area were still in good condition in 2010 (Figure 21b), the progressive expansion of the factory infrastructure toward the west, beyond the current road crossing the territory along the north–south direction, makes some sites vulnerable to future encroachment (Figure 21c,d and Figure 22). Furthermore, the passage of heavy vehicles from the north near to some sites (e.g., Babylonian site AJ25), likely in connection with the mud brick factory, left a number of tracks across the land (Figure 21c), including a cut across the southwest corner of a square foundation of an archaeological structure in 2018 (Figure 21d).
Figure 23 shows one of the many locations in which modern canals dug for irrigation cut through a tell (settlement AJ89 in AOI#2). In this instance, the encroachment must have happened before 1981, when the KH9 scene was captured (Figure 23a). The canal was most likely dug in the 1970s, when the Iraqi government planned to convert the land of the West Euphrates region into cultivated land. However, as observed through the satellite data, the channel was not further developed, no other branches or levees were built, and the land was not exploited for agriculture. Additionally, in 2010, the site was affected by looting (Figure 23b) and, since at least 2018, the wider region has been traversed by vehicles and the tell has shown signs of site clearance and flattening (Figure 23c,d). Therefore, it is likely that the intended plan did not lead to the concrete agricultural development of the area. The highland position of this land compared to the Euphrates lowlands could have substantially contributed to the abandonment of these plans, making water conveyancing (and thus irrigation) difficult. Therefore, the observed encroachment was not only detrimental for tell preservation but also was not of any utility.

5. Discussion

5.1. The Nexus in Southern Iraq

Satellite and on-the-ground observations corroborate the understanding of the links composing the climate–water–agriculture–heritage nexus in southern Iraq as follows:
  • Climate–Water: The decades-long increase in annual average mean surface air temperature and drop in annual precipitation (Figure 1c–e) led to significant water-level oscillations in surface reservoirs (e.g., Hammar Lake), drying out of lakes and contextual salinisation at the surface (e.g., Sawa Lake). Groundwater pumping was then increased along the Abu Jir lineament and the western sector of the study area to cope with the rising demand for water. However, as groundwater resources are overexploited, once they reach the surface, their excess is left to run-off and discharge, often into small to wide basins (e.g., Hammar Lake) or natural depressions. Given that these ephemeral water bodies are not potable/reusable due to water salinisation, a significant amount of water is lost in the overall hydraulic balance.
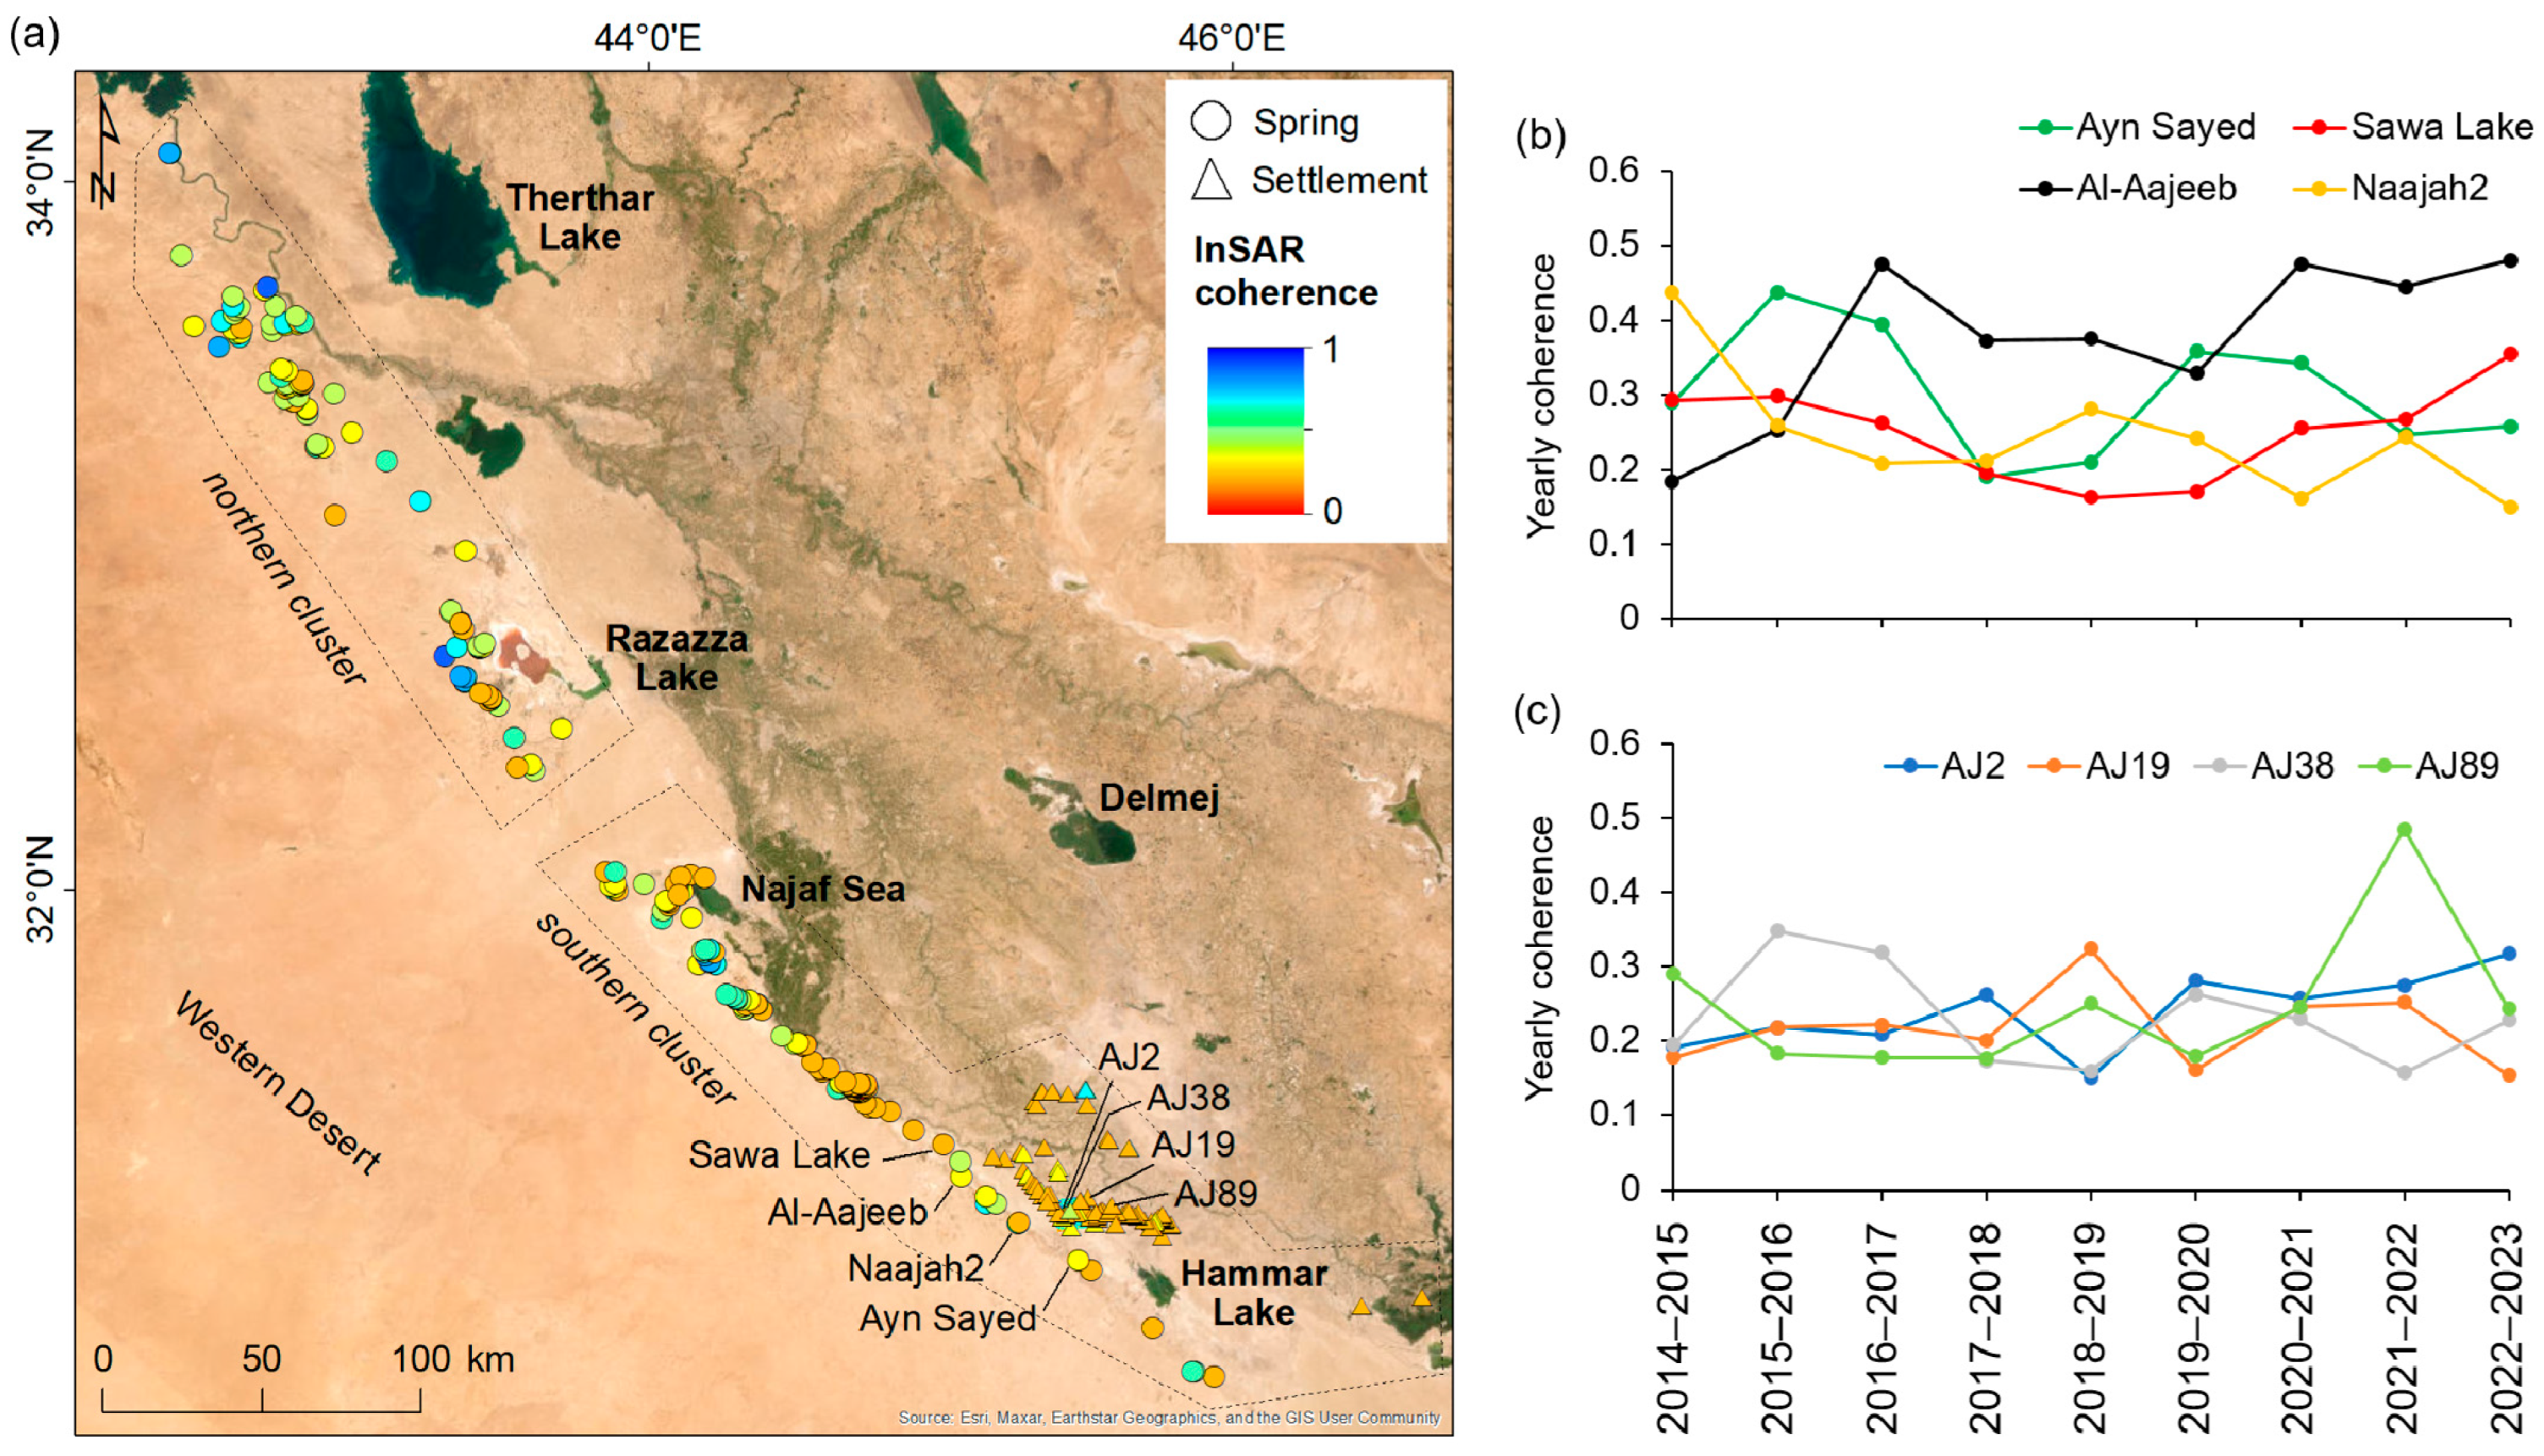
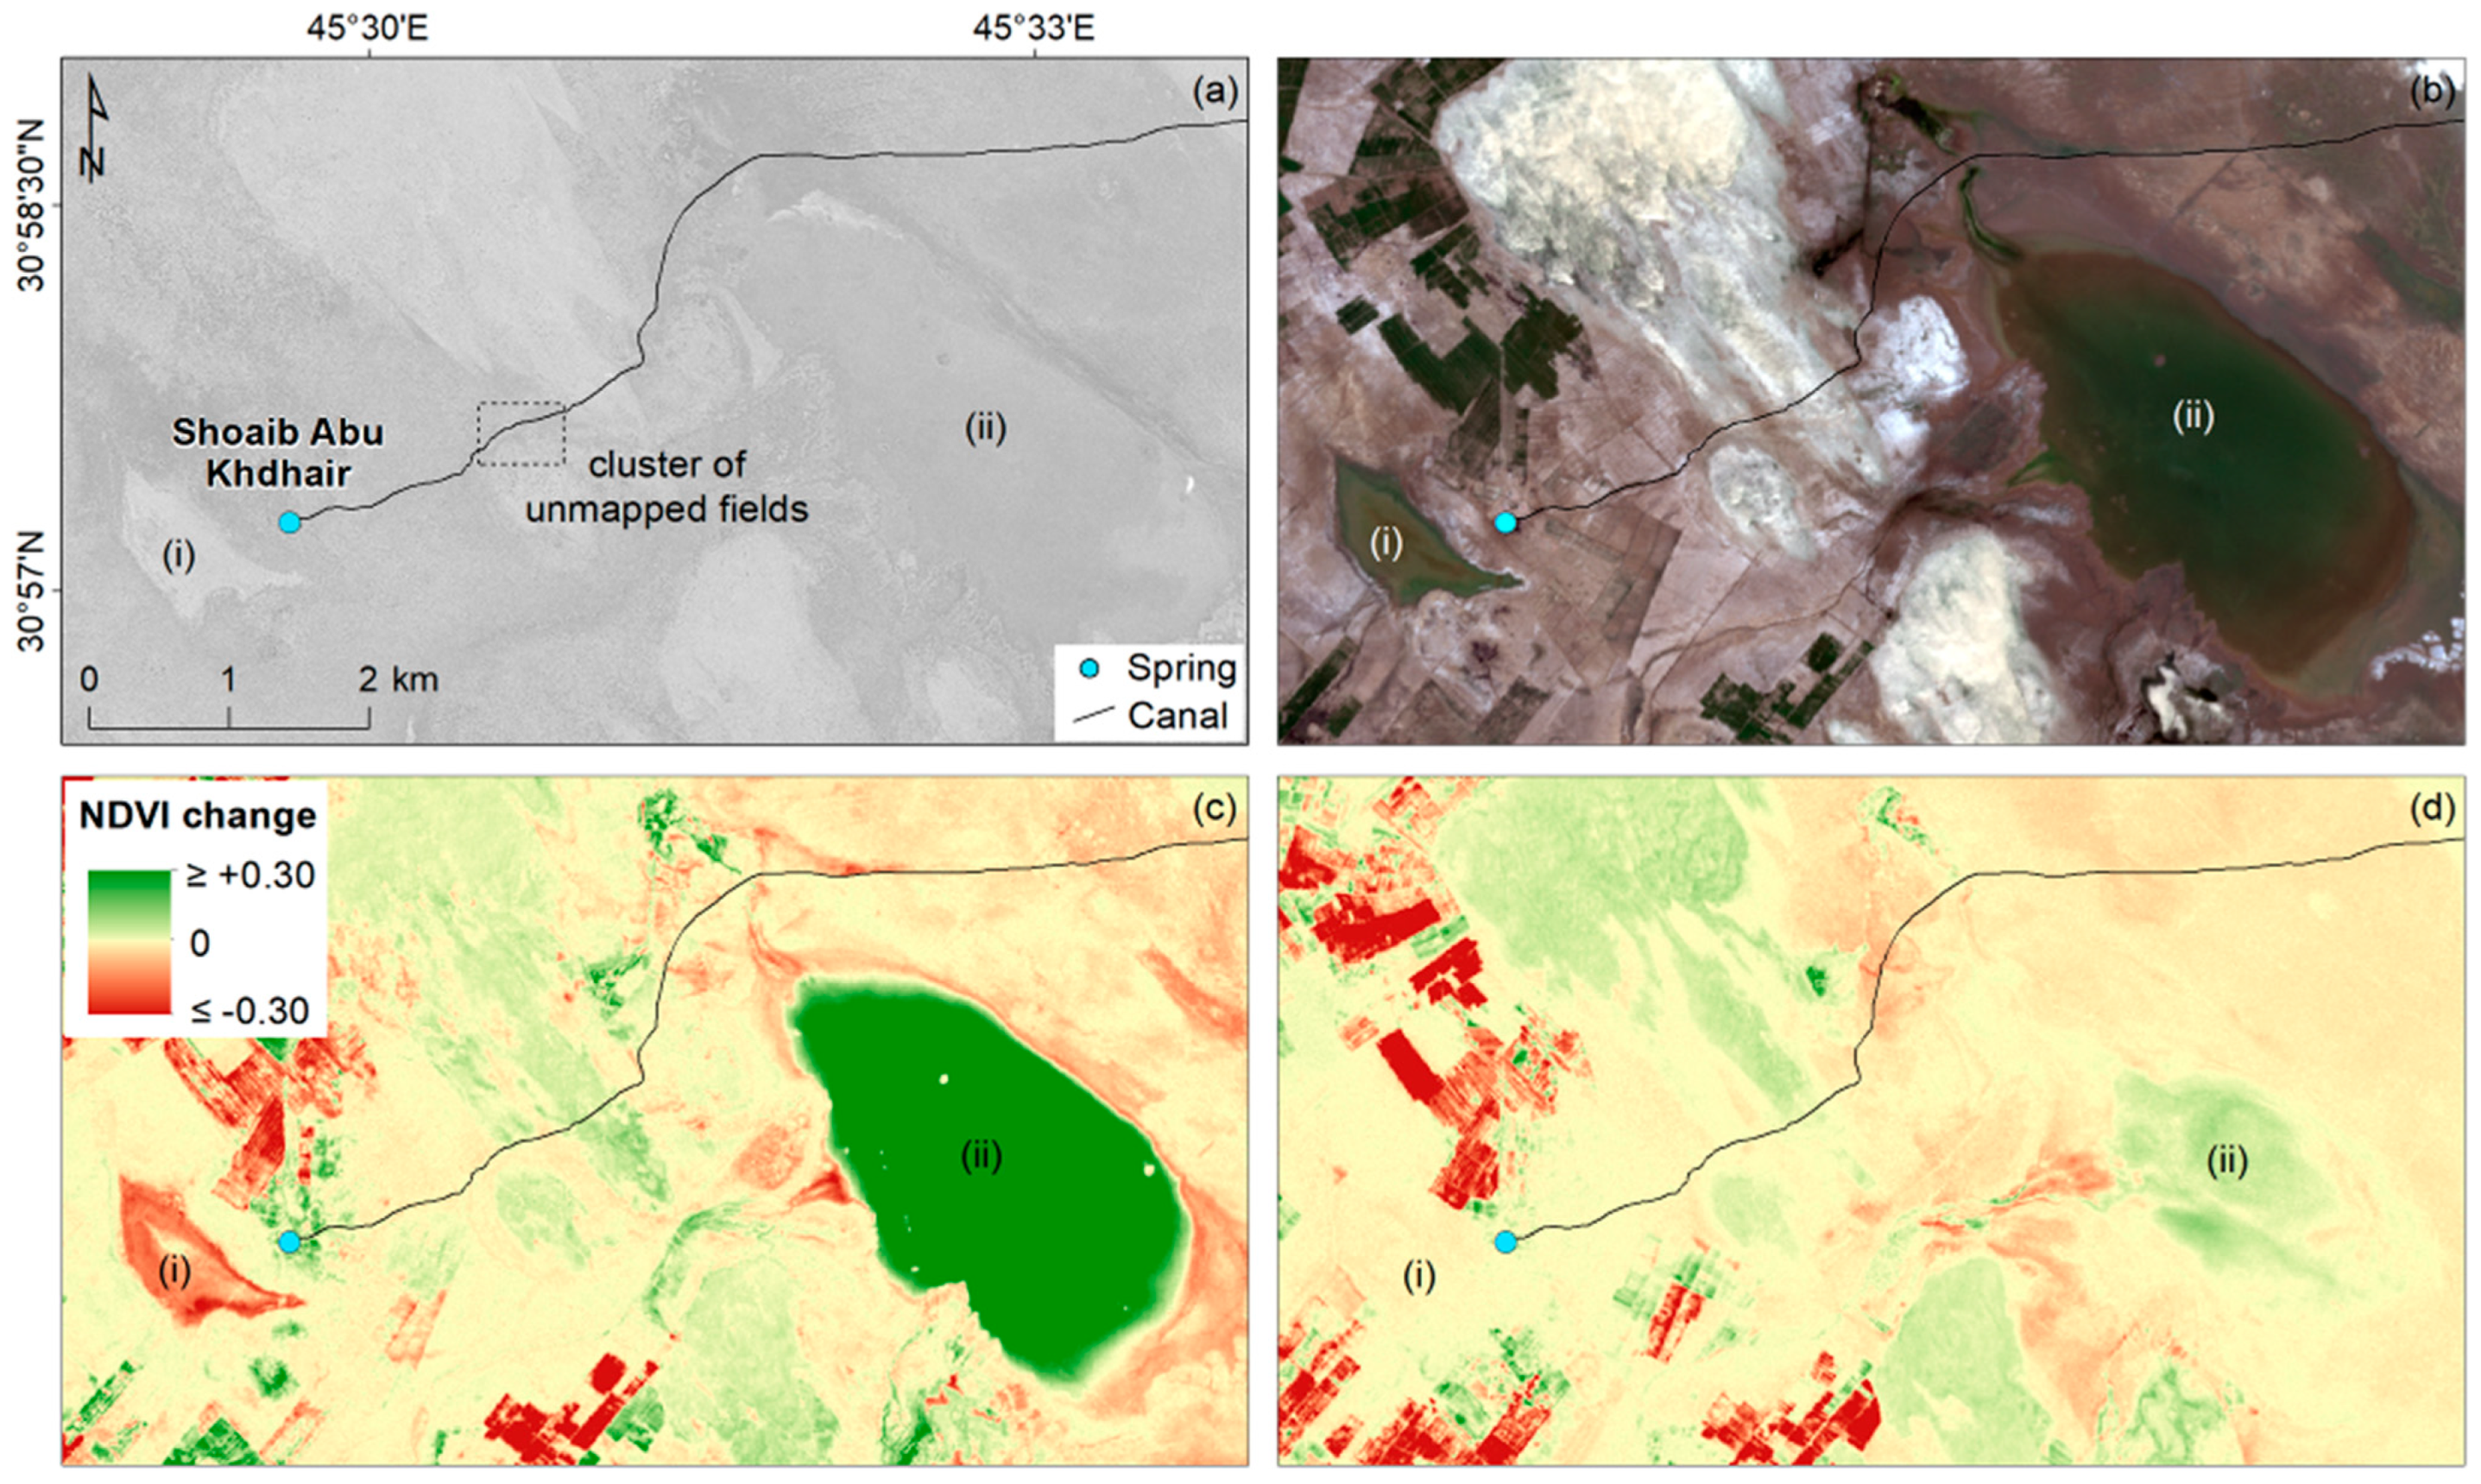
  • Water–Agriculture: Other key drivers of groundwater overexploitation are industrial and intensive agriculture practices, which mostly rely on centre-pivot and/or herringbone irrigation systems fed by groundwater pumped by newly drilled wells. The springs that originally fed a wider region are now desiccating. Along the Abu Jir lineament, this process is concentrated amongst sprawls of agriculture, thus affecting the southern cluster of ancient sites between the Najaf Sea and Hammar Lake. These springs exhibit the strongest decorrelation (γ ~0.2 at 20 springs and 40 settlements) and the most obvious landscape transformations, including the drying up of major springs (e.g., Shoaib Abu Khdhair).
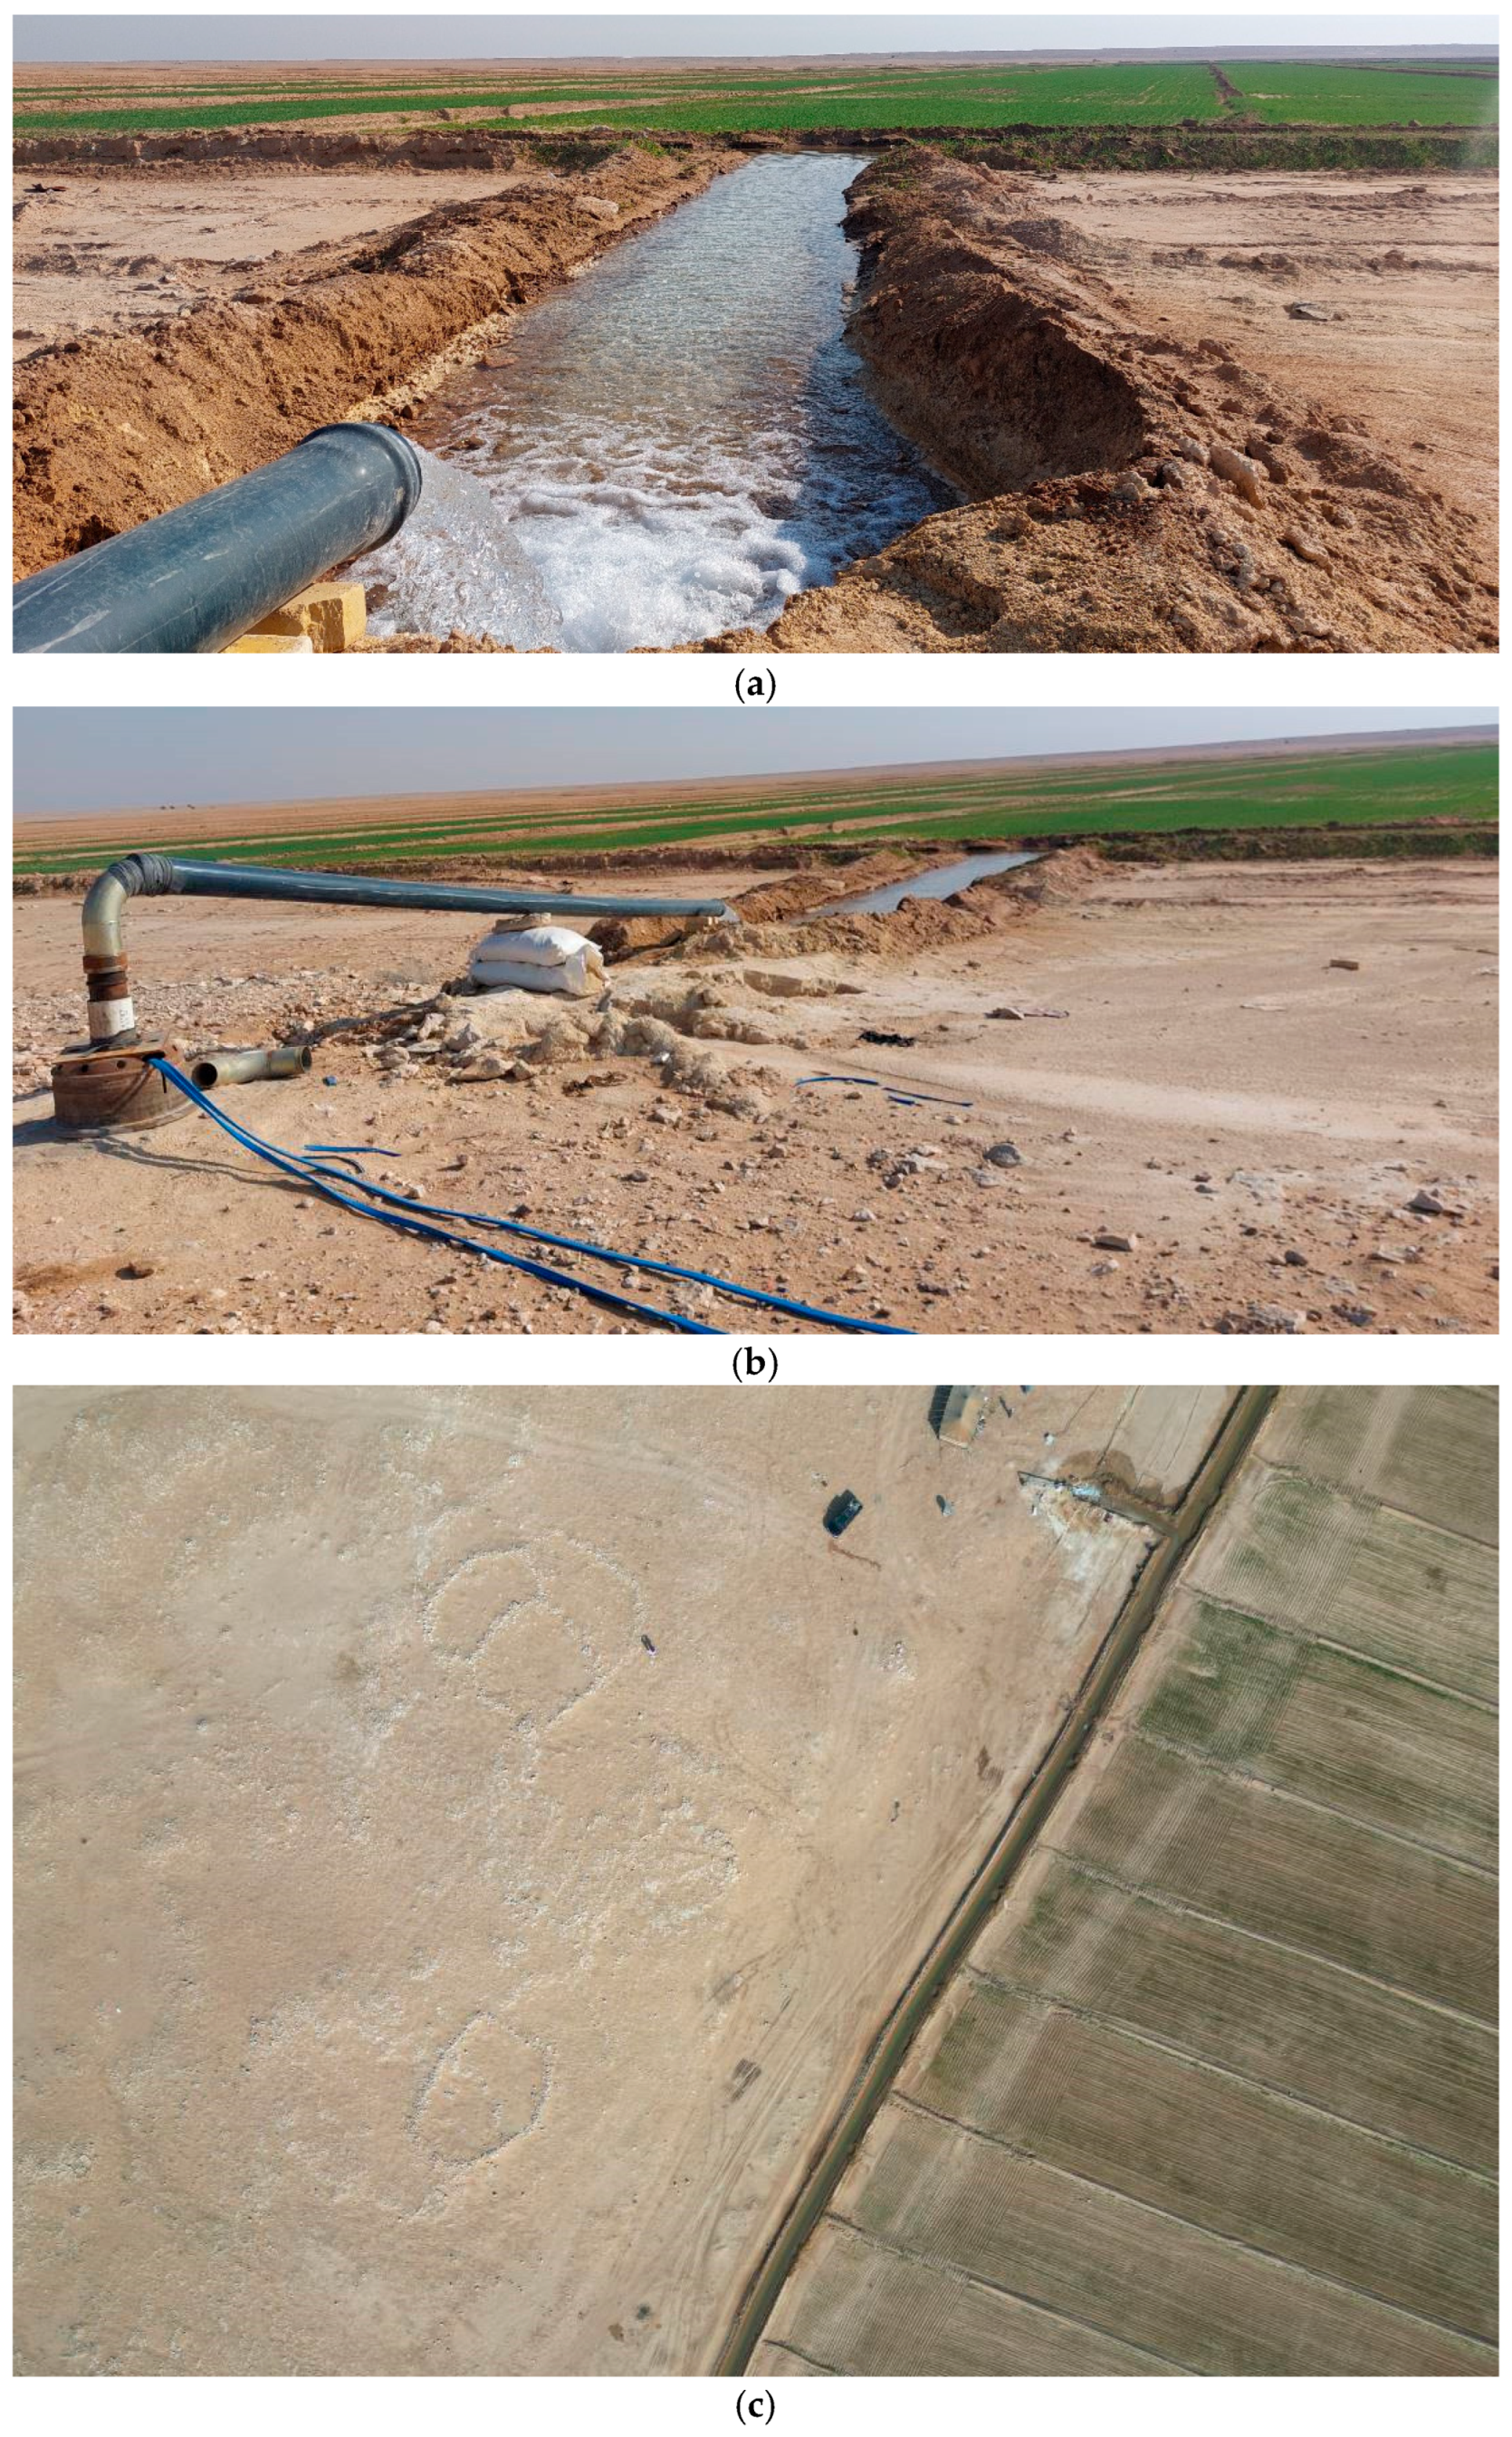
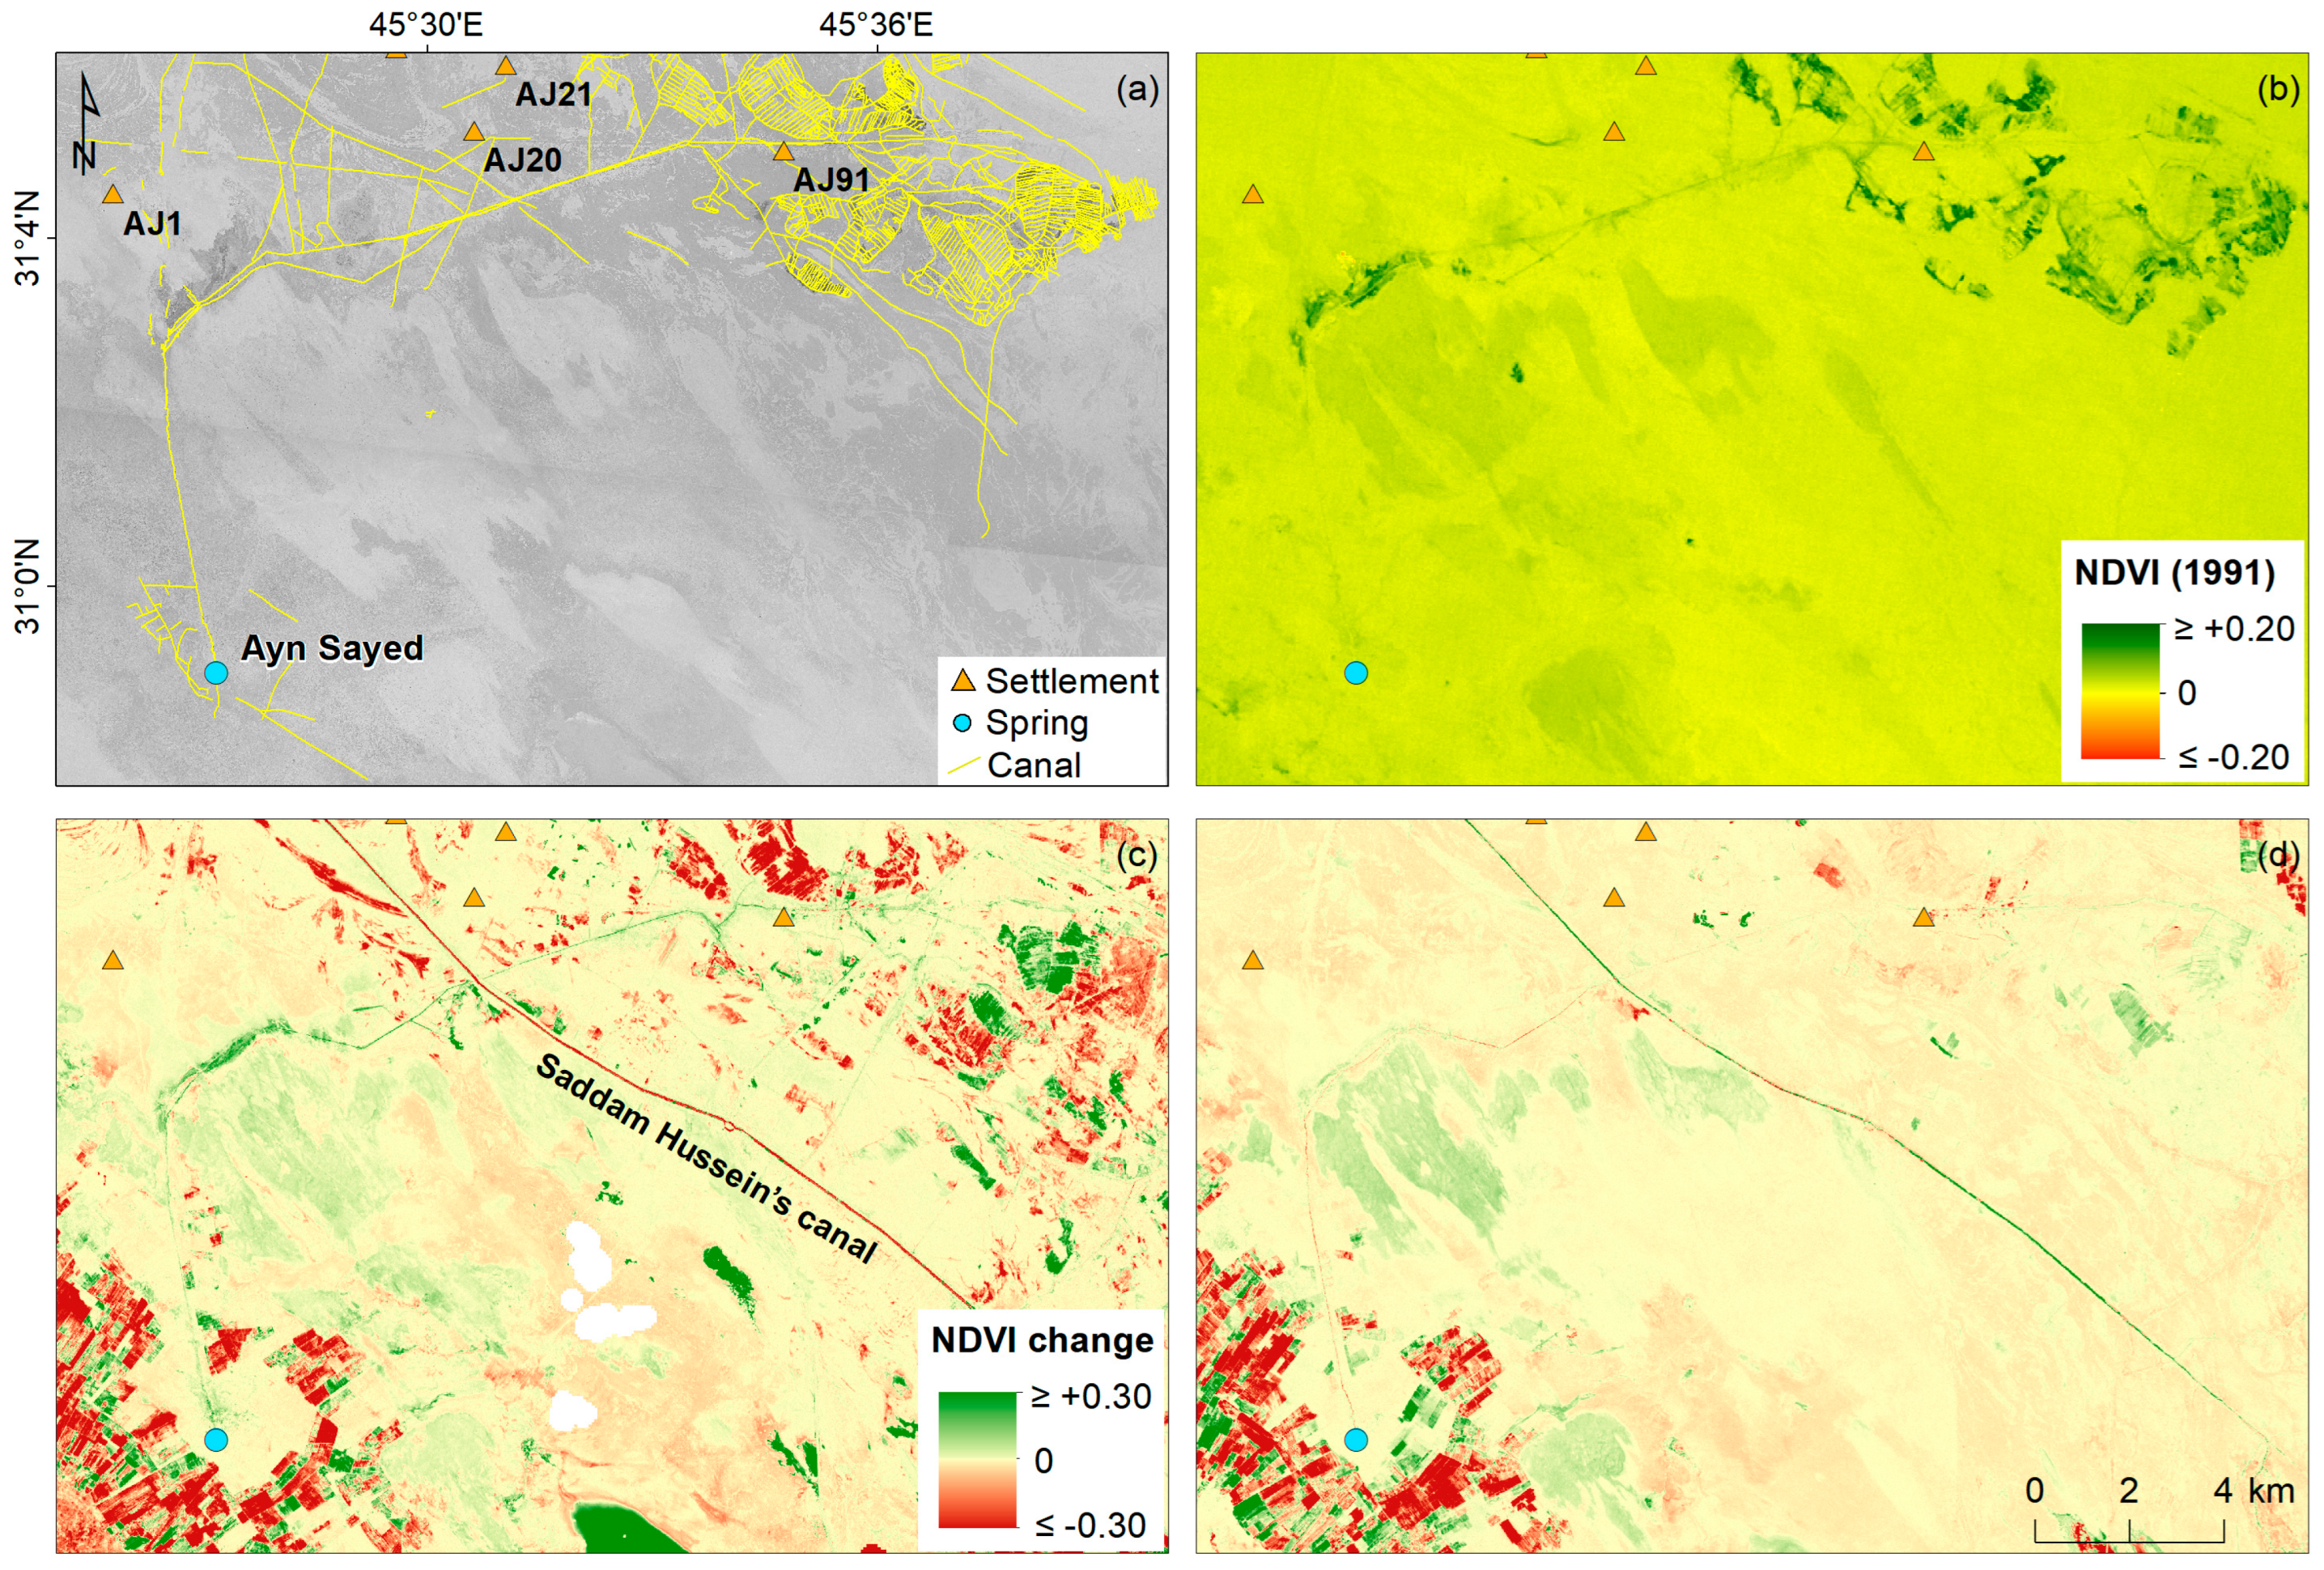
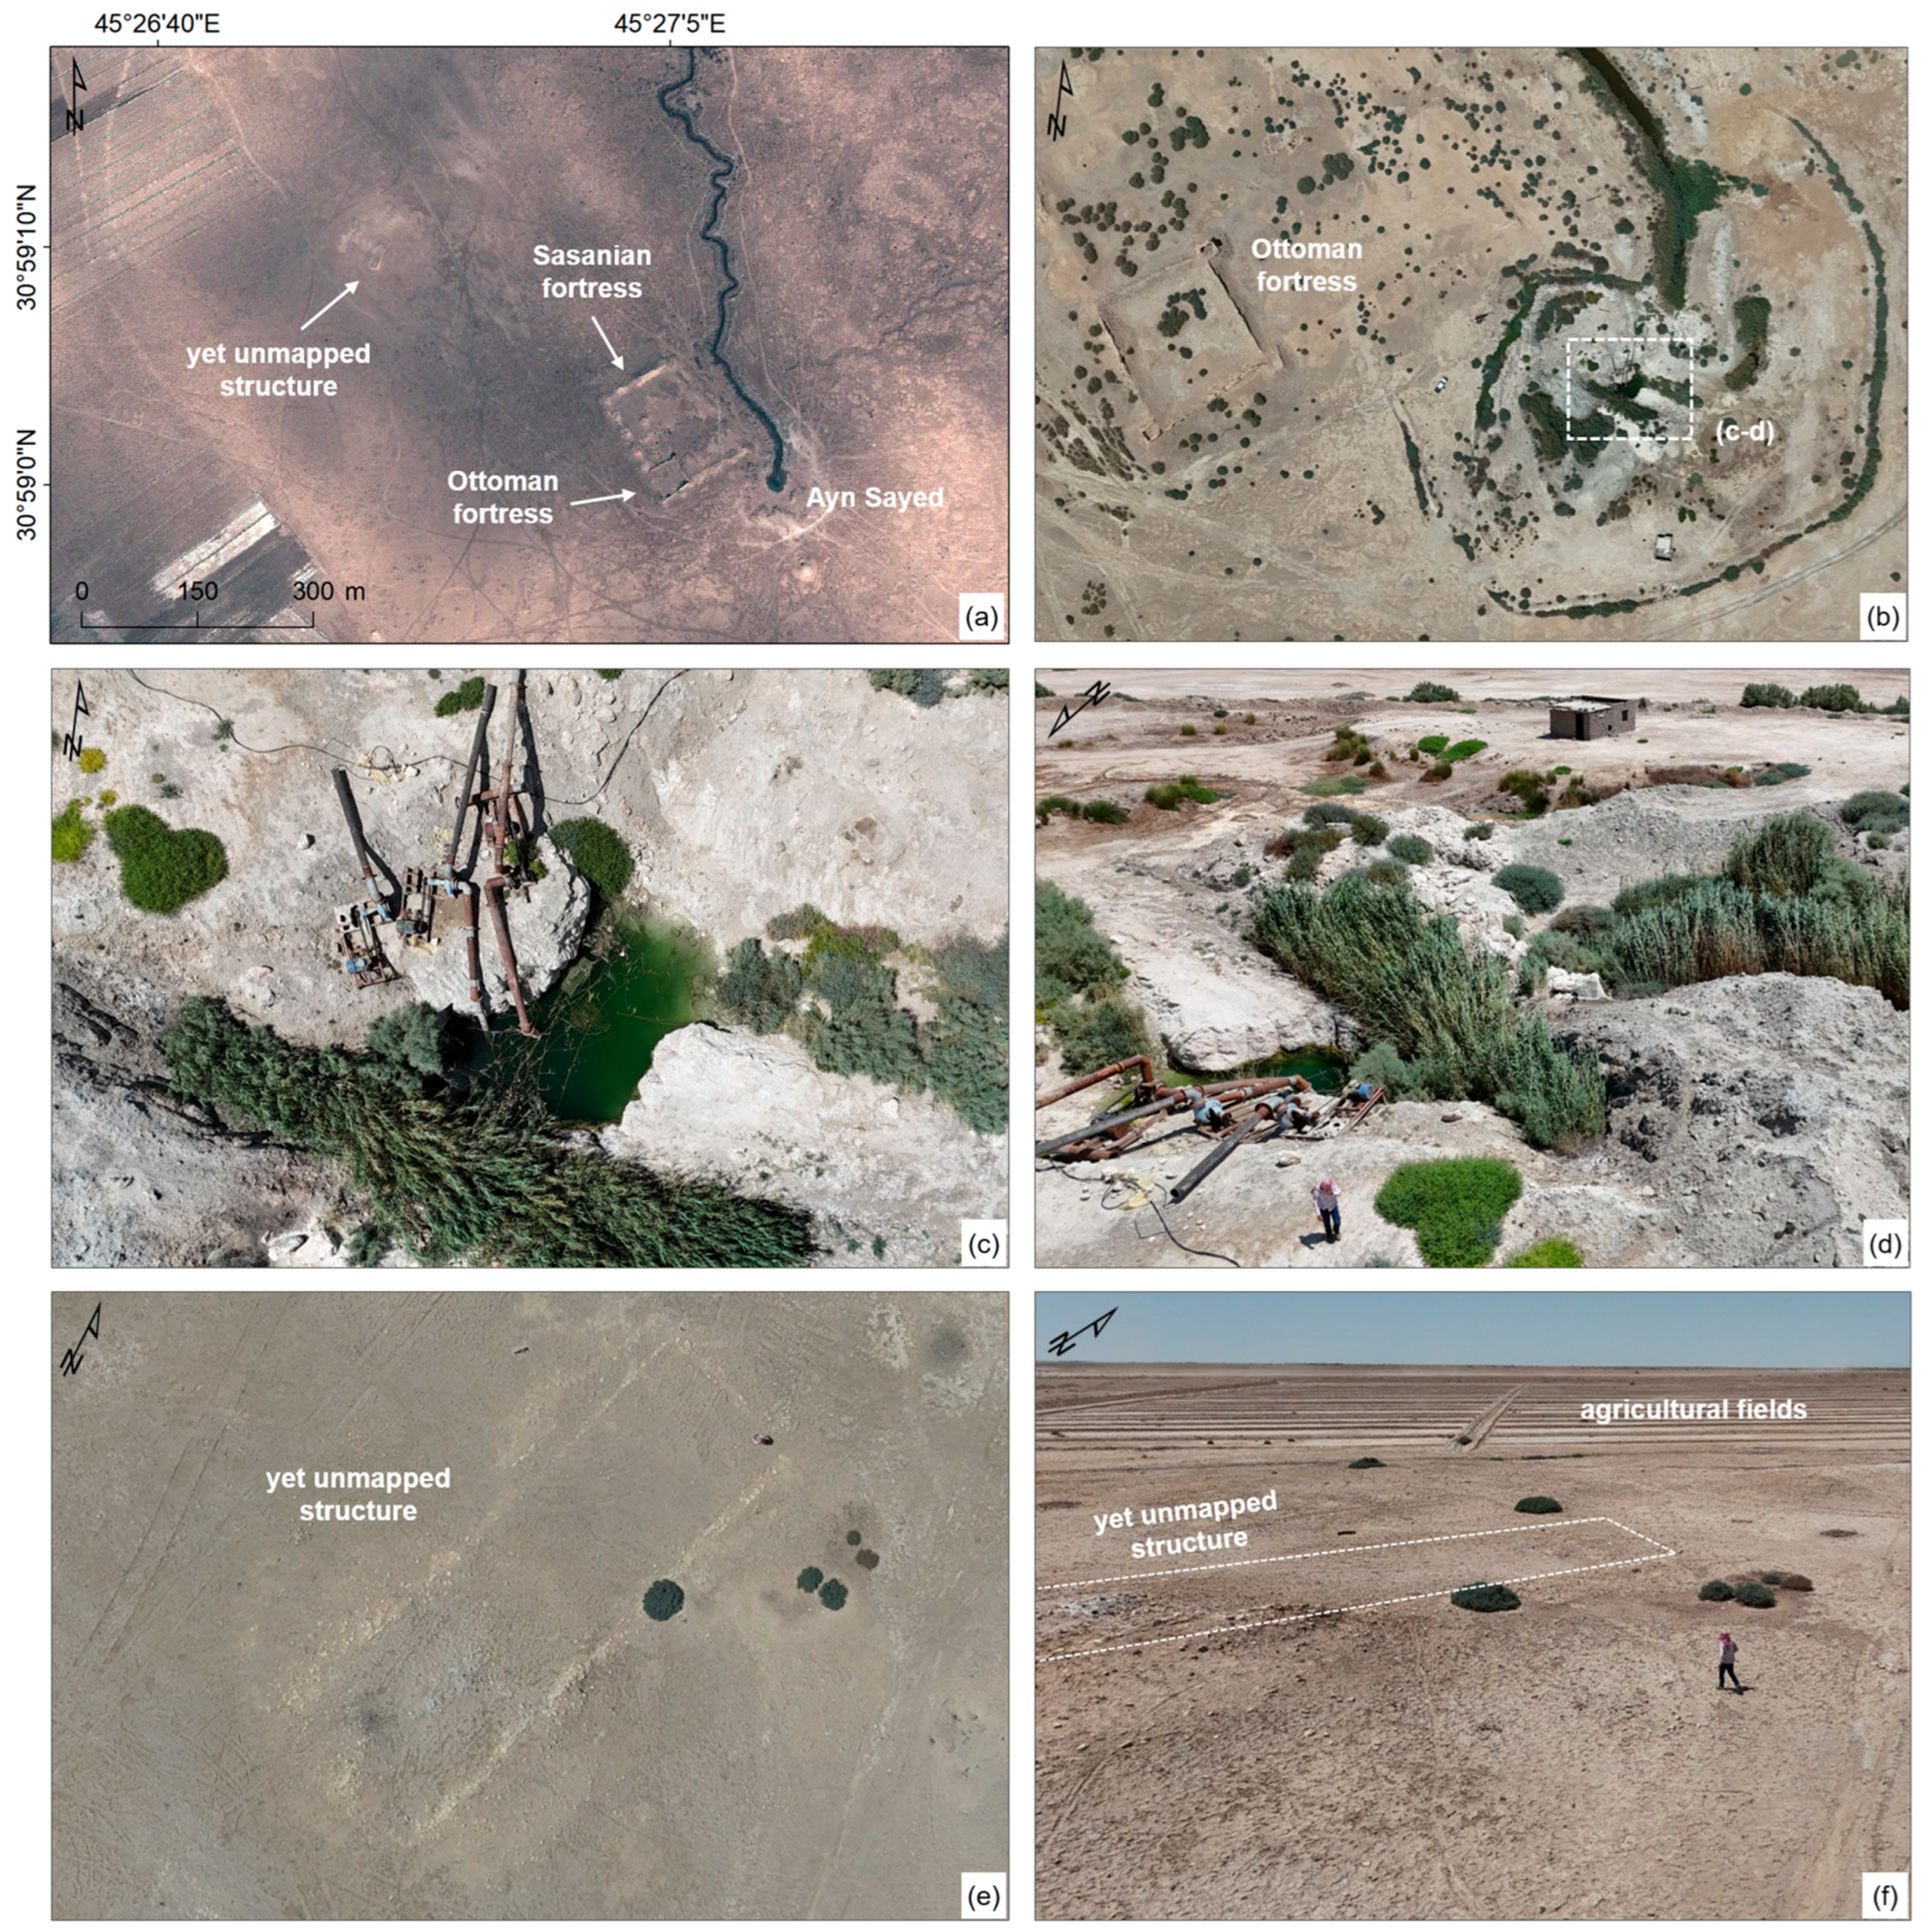
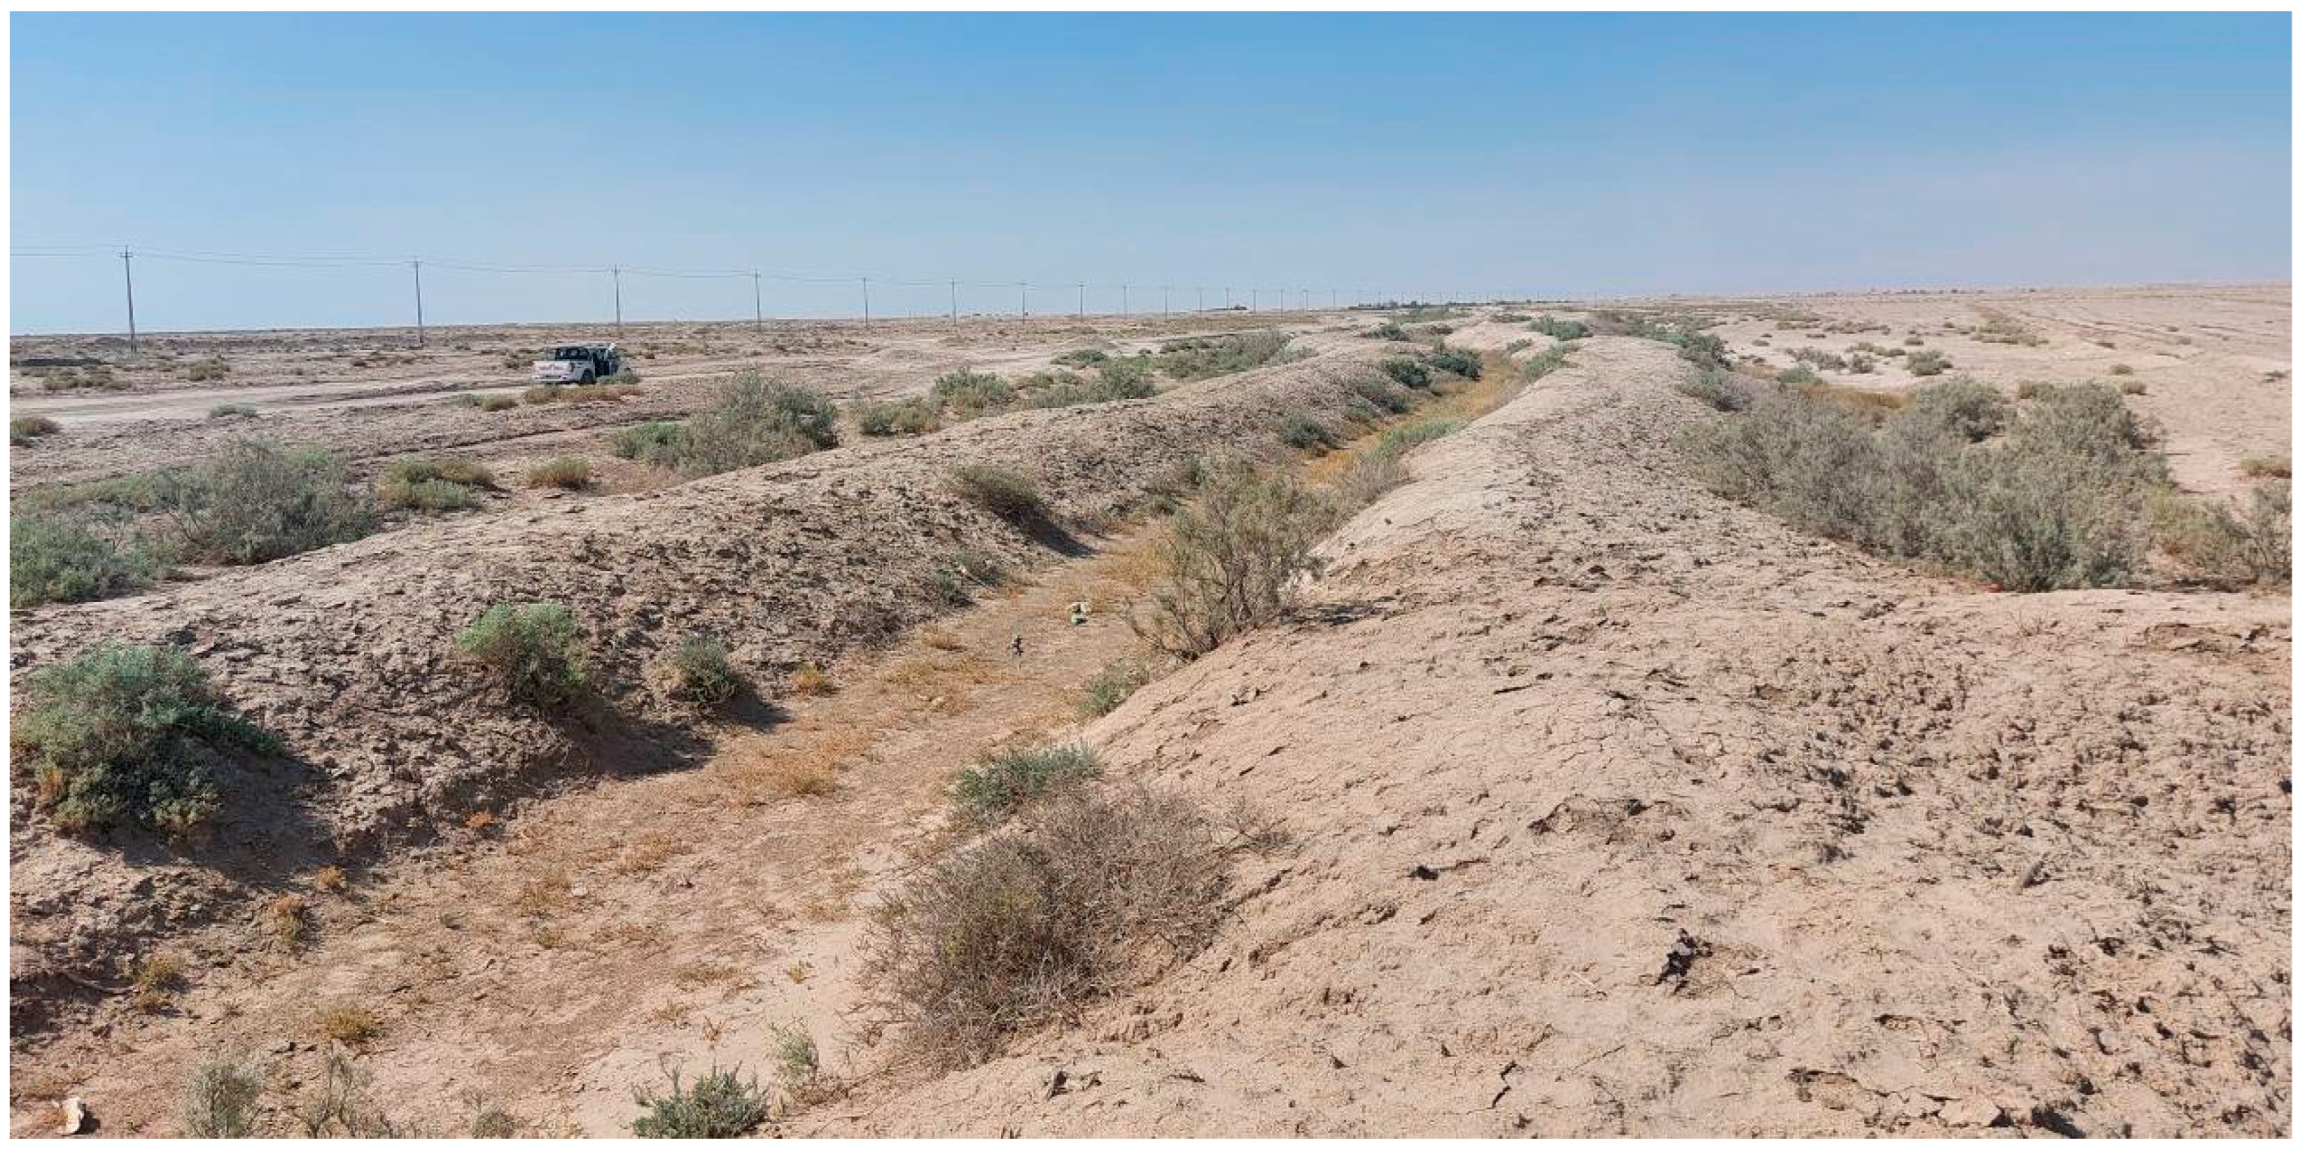
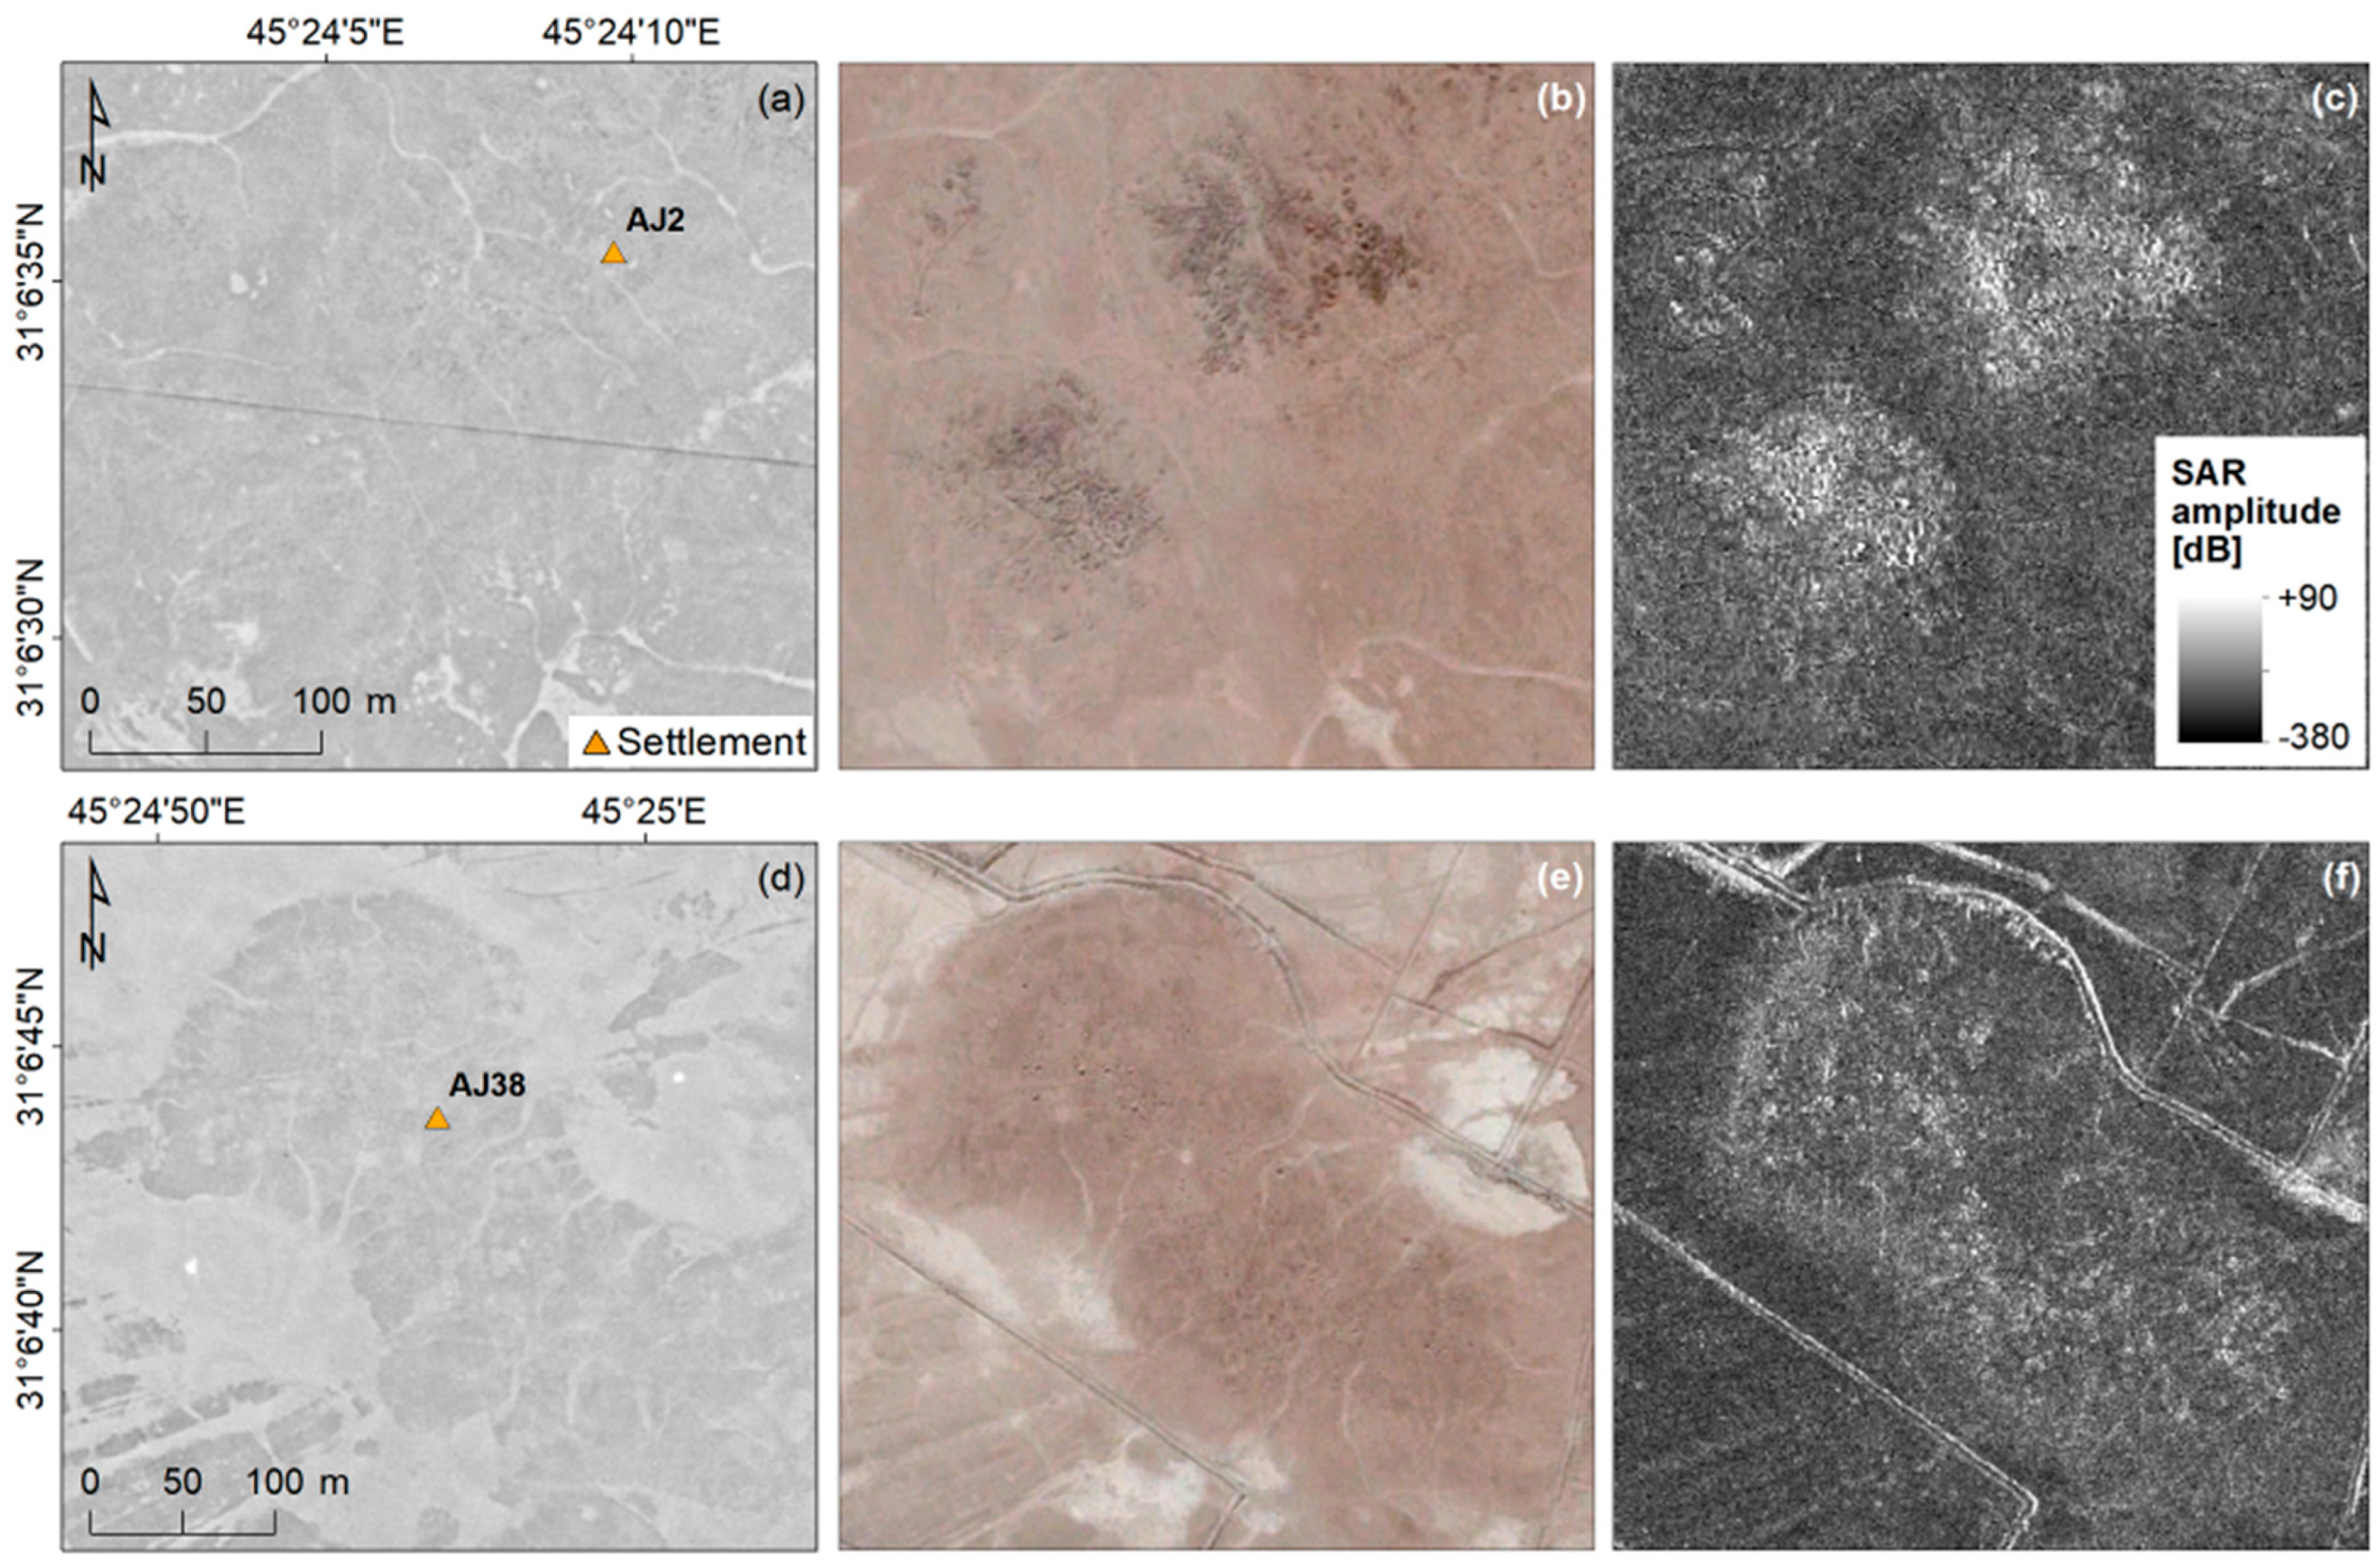
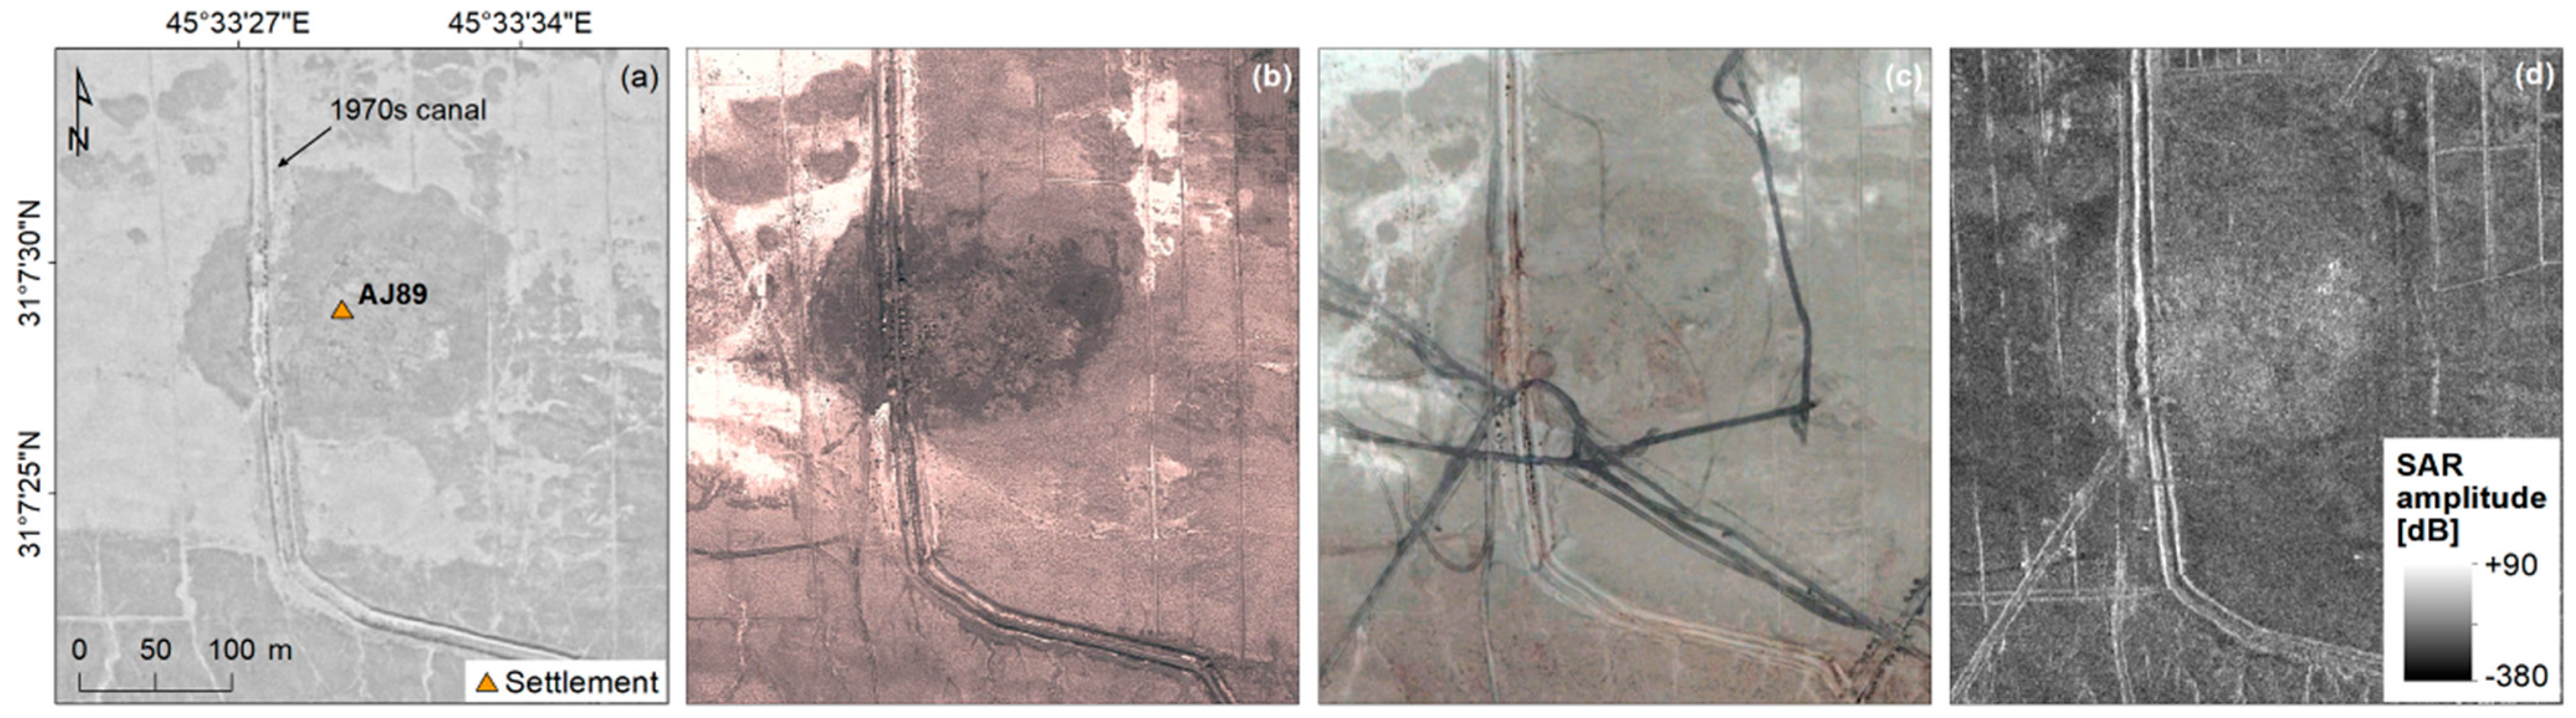
  • Agriculture–Heritage: Contemporary agricultural practices are intensive and rely on the installation of infrastructure and/or digging of new canals that supersede and destroy traditional irrigation systems. In the western part of the study area, there is evidence of new wells at sourcing/water-capture points being dug close to the original springs. These operations cause significant disturbances to the former configuration of the ancient springs. Furthermore, new pumping stations installed at private properties allow for agricultural fields to expand to the extent that they approach, or even encroach on, archaeological sites, as in the case of the unmapped structure northwest of the Ayn Sayed spring. A similar dynamic was observed on the eastern side of the study area. Although there are examples such as that of site AJ38 (Figure 19), where agricultural activities do not always lead to the flattening/levelling of a site/mound (as observed, e.g., in other areas of Iraq and in Syria [70,72]), in other circumstances, such as those concerning incidents of looting in AOI#1, there is a spatial association of agricultural practice and the expansion of modern systems with the occurrence of looting.
  • Heritage–Water–Agriculture: As a consequence of the above process, through which ancient springs no longer reliably feed the traditional irrigation networks, farmers of downstream cropfields are forced to abandon the land. Therefore, canals that were once fully operational fall into disuse and, in time, are silted up. This nexus link therefore makes evident how a change in irrigation practice and alterations in the water supply systems can cause physical damage to tangible heritage (canals), a loss of intangible heritage (traditional agricultural practices that were undertaken for centuries), and social exclusion and inequality. A striking example is provided by the Ayn Sayed spring, which no longer provides water to the fields in the eastern sector of the Samawah province, with clear impacts on the local population. In some cases, entire villages (often with substantial heritage components) were made unliveable. This area is indeed one of the poorest in the whole country, and hosts farming communities and Bedouin pastoralists. As a result, pastoral and farming communities are migrating from the area [73]. Significant migration away from their home region has been documented for village and Bedouin populations; the latter is said to have decreased by 70% since 2003 [74]. This is a clear example of how satellite-derived environmental proxies can reveal societal impacts and, in this specific case, social inequality.
  • Climate–Agriculture: The above-described abandonment process contributes to the increasing exposure to the impacts of desertification. Land abandonment occurs in the newly desertified areas highlighted by the satellite data and the previous literature [69]. This is apparent in the northern Muthanna and central Al-Qadisiyah governorates. Along the Abu Jir lineament, the population is attempting to survive the possible desertification trend through implementing intensive agriculture with centre-pivot and herringbone irrigation systems. Therefore, the nexus link between climate-forcing and agriculture practices encompasses two completely diverging patterns and trends, i.e., the shrinkage of agricultural land and the expansion of desertified areas and, on the other hand, the increase in agricultural exploitation, which leads to excessive groundwater abstraction and, thus, the unsustainable use of water. In this context, the impact due to dust storms must also be considered. Country-scale Sentinel-3 observations confirm the increased frequency of dust storms over the last few years (first images available in 2016), which is likely correlated with climate change and desertification. The latter is the outcome of a long process through which severe drought, a lack of rain, and the drying up of water bodies lead to the loss of vegetation and the exposure of significant amounts of sand and fine-grained deposits that can be mobilised. The event that occurred in April 2022, as seen in the Sentinel-1 coherence maps and PlanetScope imagery, provides clear evidence of the direct impact of storms on cultivated lands southwest of Najaf Sea. In addition to dust storms hitting the country from the west and northwest, increasingly desertified lands (e.g., the lands northwest of Eridu; Figure 8e–h) act as further sources of dust at the local scale. The existence of multiple sources of dust feeding the storms makes the implementation of mitigation initiatives aiming to reconvert desert into vegetative areas (e.g., the Ministry-funded “green this area” [75]) indispensable.
The above analysis reveals that climate change, water usage, agricultural practices, and heritage preservation are strongly interconnected dimensions in southern Iraq. The broader implication of these findings is that a holistic approach should be adopted for environmental monitoring first and, ideally, for land management subsequently. The present study is novel in providing such a multi-faceted analysis based on remote sensing data.
Previous studies did not investigate all these dimensions of the nexus together. Most of the previous literature concentrated on either water–agriculture, climate–water, or climate–agriculture links. While an increasing number of studies rely on the use of satellite data, not all the studies exploited this resource. When satellite data are used, it is most common that a single dataset is analysed. This suggests that using a combination of multi-temporal satellite data collected from different sensors in different periods is not yet an established practice across the scientific community.
The topics that were most commonly covered included an assessment of water policies, desertification, and dust storms (e.g., [75,76]). With regard to the latter, the evidence collected based on Sentinel-3 data, revealing the increased frequency of dust storms in the spring and summer seasons and the presence of new dust storm sources in Iraq, align with the recent literature [77,78,79]. Other scholars [80,81] came to the same conclusions by exploiting MODIS and Meteosat SEVIRI data, as well as simulating frontal dust storm trajectories. Further corroboration that it is appropriate to investigate the nexus link between dust storms and changes in agricultural practices through NDVI-based monitoring of land cover and crop field distribution is provided by [82]. That study found a direct connection between cropping regimes and the land’s increased susceptibility to becoming a dust source. Land abandonment plays a further important role. Disturbed land, especially if abandoned post-cropping, tends to be more susceptible to dust storms.
When heritage was accounted for in nexus studies, the natural heritage, i.e., the biosphere, with a specific emphasis on the UNESCO-listed southern marshes, was the focus. For example, ref. [83] found evidence of desertification in the southern marshes of Iraq using recent Landsat imagery, NDVI and specific indexes. Several other studies focused on the impact that dam construction or engineering projects on the Tigris–Euphrates system over the past decades have had on this ecosystem (e.g., [84,85]). Regarding cultural heritage, a few studies documented the impacts of anthropogenic activities, also exploiting remote sensing data (e.g., [70,86]), and thus provided confirmation that what was found in this research is not only a regional manifestation, but is more widely relevant across the country.

5.2. Categorisation of Satellite-Based Environmental Proxies

The other outcome of this study of broader significance, regardless of the specific region investigated, is the proof-of-concept that every time a given pattern is extracted from a remote sensing dataset, this can be used as a reliable proxy to infer the occurrence of a specific process of the nexus. Based on the findings described above, a categorisation was developed and is presented here to enable other scholars to implement the same approach in other environmental contexts. Table 1 offers a practical matrix of interpretation keys that, for each link of the nexus, allows the user to relate the observations from satellite data to on-the-ground processes. The matrix is intentionally built to guide the user in selecting the right type of satellite data to use and the associated parameter to extract. Depending on the ground feature and location in which the given observation was made, the user can identify proxies and, using the interpretation keys, match them with the given process related to the specific nexus link.
From a practical point of view, it is worth noting that the matrix is structured according to the two main types of satellite data that can be used, i.e., multispectral optical and SAR, but does not further separate data according to the technical specifics of the satellite sensors used to collect the data or the acquisition time (i.e., whether the image was taken in the past or in a more recent period). Although there can be significant differences in spatial resolution and revisit time, it is assumed that the successful detection of a given proxy depends on the combination of technical properties used to collect the images and the scale of the investigated process. Similarly, depending on the acquisition date, the identified proxy could relate to either past features (whether or not they still exist) or recent changes.

5.3. Comparability with Other Countries

A detailed search of the scientific literature did not highlight published studies presenting a similar analysis of the nexus using multi-temporal satellite image time series for other countries in the Middle East and North Africa (MENA) region, or on other continents. However, it must be acknowledged that the existing literature reports that similar challenges affect other countries.
With regard to dust storms, ref. [80] found that, after Iraq, the most common sources of dust storms are located in Syria, Saudi Arabia, and Jordan. Dust storms and the increased frequency of drought had severe impacts on crop productivity and water loss (e.g., [87] with regard to Iran). In this climatic change context, water resources are under pressure. The MENA region is widely acknowledged as the most water-stressed region in the world, hosting sixteen of the twenty-five most water-stressed countries at the global level [88,89].
For example, ref. [90] report that water stress is a challenging problem in Jordan; groundwater resources have been overexploited for decades and are estimated to be being used up twice as fast as they can be replenished. A recent fieldwork-based study by [91] reveals that the sustainability of groundwater-based agriculture is questionable in the Jordan highlands due to decrease in water quality and quantity and tougher policy measures. Several studies and the grey literature reports highlight the water scarcity issue in MENA and its impact on social inequalities. Remote sensing-based research shows the state of freshwater storage and freshwater levels. On the other hand, no studies that showcase how satellite data are used to document the desiccation of springs or identify the loss of water due to run-off from irrigated crop fields were found.
With regard to the impacts on cultural heritage, there are many studies showing incidents across the MENA countries and drylands due to agricultural expansion, modern developments, and looting, similar to those presented in this paper. The satellite data presented in this respect are already an established means to document such impacts, both in the MENA region and in Central Asia [92,93,94,95,96]. While assessments are most frequently made with regard to individual disturbance factors, some scholars have reported cases where one factor leads to another one and thus a nexus link is established. For example, the specialist literature (not only that focusing on the Middle East [97,98,99,100]) proved that the accessibility/ease of access and “visibility” (or knowledge) of sites are contributing factors to archaeological vandalism (and the magnitude of that vandalism); increased agricultural activity in the area would, in this way, provide easier access for bad actors. Therefore, it cannot be excluded that an anthropogenic presence for agricultural activities could stimulate searches for archaeological goods and disturbances to archaeological sites within yet-unlooted sites (see the example in AOI#1, where the sites are quite far away from agricultural activities and do not seem to show signs of looting).
The impacts on heritage preservation due to water-related infrastructure (e.g., dam construction and reservoir creation) were also documented using remote sensing data and monitoring/assessment frameworks were developed (see, e.g., [72,101,102,103]. Conversely, it does not appear that the literature has focused specifically on exploring the connections between water policies, agricultural practices, and heritage preservation. This is a further area in which the present method could be applied.
Finally, it is worth mentioning that, depending on the specific geographic location and social-economic context, other anthropogenic processes that cause possible damage/disturbances to heritage preservation may be present and could be documented using satellite data. One example was found in Egypt with regard to the dismantling of the ruins by local farmers, known as sabbakh-digging (or sabakhīn digging), i.e., the procurement of nitrogenous material for use in agricultural fertiliser, obtained by demolishing tells, i.e., archaeological mounds made of mud brick debris rich in salt and nitrogen [104]. Although this practice was quite widespread in the 19th and 20th centuries, similar types of detrimental encroachment still occur and are no different from those found in Iraq.

5.4. Methodology Transferability

In order for the proposed methodology to be effectively transferred to other geographic and environmental contexts, three main aspects need to be accounted for: the availability of satellite data, similarity of the processes to investigate, and the similarity of proxies that can be extracted from the satellite data.
Starting from the latter, by means of the categorisation of satellite-based environmental proxies proposed in Section 5.2 and Table 1, we provide practical guidance for users willing to implement this method. The proxies consist of patterns of increased/decreased value for specific parameters that can be extracted using standard state-of-the-art techniques. Therefore, no technological barrier constrains this methodology. Furthermore, specific shapes and characteristics make these proxies very distinguishable compared to the previous known condition of the investigated landscape. Therefore, the pictorial examples provided in the results section are helpful to train operators to recognise these proxies.
With regard to the processes to which environmental proxies can be related by means of the interpretation keys, as discussed in Section 5.3, all the processes, either natural or anthropogenic, that were found in southern Iraq were also observed in other MENA countries and other continents. When differences are observed, the recommended approach is to identify the specific variable at the surface that could make evident that particular process and, using the matrix of interpretation keys, determine the most affine process to use for comparison. An example can be provided through the case of sabbakh-digging. Although this process was not specifically observed in southern Iraq, within the satellite images it appears as digging, earth removal, and soil accumulation encroaching on a site, and therefore provides an example of the agriculture–heritage nexus link.
Finally, the availability of satellite data must be considered. In this respect, as mentioned in Section 3.1, the methodology relies on two main data groups: (i) data from missions providing historical observations and time series over a period of years over the area of interest; (ii) time series or spot images from high- to very-high-resolution missions that are still operational, have a catalogue from which suitable data can be selected, and/or can be tasked to collect new imagery. Therefore, to transfer this methodology, the first criterion to apply is the existence of archive data and their spatial coverage and temporal revisit (especially for missions that can no longer collect new data) or, alternatively, the possibility to task new acquisitions (for missions that are still operational). The second criterion is around the accessibility conditions of the satellite data.
In the present research, we used Landsat and the Sentinels, which collect imagery globally according to a regular and systematic plan. Therefore, it is very unlikely that an area of interest is not covered by these datasets. Furthermore, the data are distributed according to an open data policy. In the case of KH-9 imagery, these data are only at the very beginning of their exploitation, but they have great potential for use across the globe, and, in particular, over North Africa and Eurasia, given the wide availability of the archived data (see [37] and the interactive web scene with global coverage available at https://arcg.is/aireX, accessed on 15 December 2024). The USGS scan-and-download programme has made an enormous effort to make archival KH-9 imagery accessible to the public. Our analysis confirmed the high quality of these data once they are accurately georeferenced to the ground features. Therefore, it is recommended that this extraordinary, yet underexplored, source of historical data is used to document past land cover and vanishing/vanished features. COSMO-SkyMed and PlanetScope missions have the advantages of providing very-high-resolution data from either the existing archive across the globe or via ad hoc tasking. Although their data are not distributed according to an open data policy and are thus licenced, both missions have specific mechanisms to allow scientific users to gain access to the data at a discounted cost or no cost (readers can refer to the official websites for more information). Alternatives to COSMO-SkyMed and PlanetScope data may be provided by any SAR or multispectral optical satellite image datasets, respectively, if a similar spatial resolution, temporal revisit, and ad hoc tasking are available to suit the specific application. For example, with regard to the detection of damage to heritage, the reader could refer to the comparison of satellite missions provided in [59]. It is of course understood that, regardless of the accessibility conditions, if satellite data do not satisfy the first criterion mentioned above, their performance in the nexus analysis will be constrained.

6. Conclusions

The main outcomes of the present study can be summarised as follows:
  • The study provides, for the first time, a holistic understanding of the multiple intermingling processes that occur in this region. This is one of the most important contributions of this paper compared to the majority of previous studies—which either concentrated on specific Iraqi sites and often lacked a wider regional assessment or, vice versa, focused on a local-scale analysis but did not picture it in the broader context, or did not make comparisons between Iraq governorates.
  • This study conducted a detailed investigation of the Abu Jir lineament and Eridu region, which have been poorly covered in the literature. The most up-to-date information about the current condition of springs that, today, are at risk of vanishing, alongside traditional agricultural systems, is provided. In particular, the extracted NDVI, NDWI, and InSAR coherence values show that the cluster of springs located between the Najaf Sea and Hammar Lake has been quite unstable over time, and is the area that is most affected by anthropogenic disturbances along the whole Abu Jir lineament. Not surprisingly, the western sector of the Samawah province in the Muthanna governorate is the area in which springs are declining and diminishing their water flow due to the overexploitation of groundwater by neighbouring farms and the proliferation of centre-pivot irrigation systems. The cascading effect is that the traditional agricultural fields located on the eastern side suffer from water scarcity. Satellite data show the abandonment of cropfields and destruction of older irrigation systems in favour of more modern, invasive networks of canals. These indicators act as proxies to identify areas where the local population was compelled to leave due to decreasing resource availability.
  • This study categorizes the various processes based on the analysis and interpretation of the observed patterns related to single instances. For example, the chromatic tone changes and decorrelation in optical images and SAR coherence maps, respectively, are proxies of dust storm particle deposition and alterations in the surface properties of cropfields; NDVI, NDWI, and loss of InSAR coherence not only mark areas of the densification of industrial-scale agricultural practice and new centre-pivot irrigation systems, but also areas of water run-off and discharge into ephemeral bodies that detrimentally contribute to the non-optimised use of water resources.
  • This study provides evidence of the side-effects resulting from land cover changes and the conversion of agricultural practices. In addition to the loss of traditional agricultural practices (local intangible cultural heritage), the investigation unveils several instances of damage to archaeological heritage sites (forts and structures) due to modern development. This process not only does not contribute to increasing resilience to the current climate crisis, but also implies a loss of cultural identity.
The possibilities opened by this research are manifold, including:
  • Method’s transferability: The categorisation can be used as a practical matrix of interpretation keys to identify and track the processes contributing to this complex climate–water–agriculture–heritage nexus in other governorates of Iraq and other countries, to assess improvements in (or further deterioration of) the situation, if mitigation measures have been implemented (or not).
  • Replicability: This method can be implemented in other countries (at least in the MENA region), by feasibly relying on similar satellite datasets, and may allow for comparative assessments and the identification of common or divergent trends.
  • Awareness for future conservation: The evidence of detrimental impacts on water resources and negative encroachments onto cultural heritage preservation can stimulate further research into local resources and the necessary measures to mitigate the associated risk to conservation.

Author Contributions

Conceptualisation, F.C., L.R. and D.T.; methodology, F.C., L.R. and D.T.; validation, J.J.; formal analysis, F.C., L.R. and D.T.; investigation, F.C., L.R., J.L.M., J.J., A.A. and D.T.; resources, F.C., L.R., J.J. and D.T.; data curation, F.C., L.R., J.L.M., J.J. and D.T.; writing—original draft preparation, F.C. and D.T.; writing—review and editing, L.R., J.L.M., H.K.I., J.J. and A.A.; visualisation, F.C. and D.T.; project administration, F.C. and L.R.; funding acquisition, F.C. and L.R. All authors have read and agreed to the published version of the manuscript.

Funding

This research was supported by the National Research Council (CNR) of Italy [grant id.30505, SAC.AD002.043.020] and the Royal Society of the UK [grant no. IEC\R2\222039]—Bilateral Agreement 2023–2024, “Vanishing archaeological landscapes under anthropogenic and climate change threats” project (Principal Investigators: F. Cigna, CNR-ISAC, and L. Rayne, UNEW). Field survey was funded by L. Rayne’s Newcastle University Academic Track (NUACT) Fellowship. J. L. Makovics’ PhD was funded by a NUACT scheme PhD scholarship. H. K. Irvine’s MSc and PhD are funded by an EPSRC Centre for Doctoral Training [grant no. EP/S023577/1]. For the purpose of open access, the authors have applied a Creative Commons Attribution (CC BY) licence to any Author-Accepted Manuscript version arising from this submission.

Data Availability Statement

KH-9 imagery was obtained from the United States Geological Survey (USGS)—Earth Resources Observation and Science (EROS) Center; Sentinel-1 IW SAR data were made available via the Alaska Satellite Facility (ASF) Distributed Active Archive Center (DAAC); Sentinel-2 data were obtained through Google Earth Engine (GEE); and Sentinel-3 data were obtained through the Copernicus Data Space Ecosystem. The project was carried out using COSMO-SkyMed Products ©Italian Space Agency (ASI), delivered under a licence to use by ASI (id.828, CSK4Landscapes project, PI: F. Cigna, CNR-ISAC). For further information about COSMO-SkyMed data availability, the reader can refer to the mission description at: https://www.asi.it/en/earth-science/cosmo-skymed/ (accessed on 15 December 2024), and the Open Call opportunities for scientific users at: https://www.asi.it/bandi_e_concorsi/open-call-for-science-data-utilization-of-the-cosmo-skymed-mission-first-and-second-generation-english-version/ (accessed on 15 February 2025). PlanetScope SuperDove data were obtained through an Education and Research License held by Newcastle University, and Pléiades Neo from Airbus DS via an Academic and Media licence. Landsat imagery was sourced via USGS EarthExplorer. The GEE code can be downloaded from: https://dx.doi.org/10.25405/data.ncl.27643479 (accessed on 21 November 2024). Google Earth and ESRI World VHR imagery is available through Google Earth Pro v.7, and via the ArcGIS v.10.6.1 and QGIS v.3.34 software basemap services.

Acknowledgments

Sentinel-1 IW SAR and Sentinel-2 data were processed using the cloud infrastructure at ASF DAAC and GEE, respectively. COSMO-SkyMed data were processed using the GAMMA SAR Interferometry software, KH-9 data were processed using ERDAS Imagine® 2018 software v.16.5.0, PlanetScope, and Pléiades Neo data were processed with ESRI ArcGIS Pro software. Further geospatial analyses were carried out with Q-GIS v.3.34 and ESRI ArcGIS Desktop v.10.6.1.

Conflicts of Interest

The authors declare no conflicts of interest. The funders had no role in the design of the study; in the collection, analyses, or interpretation of data; in the writing of the manuscript; or in the decision to publish the results.

Appendix A

The lists and technical details of the KH-9 photographs, and Sentinel-1, Sentinel-2, and COSMO-SkyMed satellite images that were exploited for this research are provided in the following tables.
Table A1. Input KH-9 photographs, with indication of the acquisition date, the number of exploited control points (CPs), and the geolocation accuracy achieved after georeferencing.
Photograph IDMissionDateSectionProcessed SizeNo. CPsRMSE [m]Locations
D3C1208-300394A031KH9-826/05/1974gFull-frame82.77Ayn Shalal spring
D3C1214-200405A030KH9-1403/05/1978eFull-frame82.70Umma
fFull-frame82.97
D3C1216-401325A025KH9-1622/02/1981fCrop82.74Sawa Lake, Uruk, Euphrates River
gCrop92.24
hFull-frame92.79
iFull-frame81.81
D3C1216-401325A026KH9-1622/02/1981fCrop82.12AOI#1, AOI#2, AOI#3
gFull-frame82.92
Small crop82.62
hFull-frame82.61
D3C1216-401325A027KH9-1622/02/1981fCrop102.43Hammar Lake, AOI#4—Ayn Sayed spring
gCrop91.53
Small crop81.44
Table A2. Input Sentinel-1 IW SAR data, with indication of the temporal baselines (Bt) and average perpendicular baselines (Bp) of the processed interferometric pairs exploited for the yearly analysis at the regional scale.
PathDatesBt [Days]Bp [m]No. Scenes
14515/10/2014–03/11/2015384–43
15/11/2015–09/11/2016360102
03/12/2016–28/11/201736022
28/12/2017–11/12/201834842
17/12/2018–12/12/201936022
18/12/2019–18/12/2020366–33
24/12/2020–19/12/2021360–142
25/12/2021–08/12/202234882
20/12/2022–27/12/2023372352
7210/10/2014–29/10/2015384–483
22/11/2015–16/11/2016360123
28/11/2016–11/11/2017348–603
23/11/2017–18/11/2018360373
30/11/2018–07/12/2019372223
19/12/2019–13/12/2020360623
25/12/2020–20/12/2021360–173
20/12/2021–15/12/2022360–113
15/12/2022–10/12/2023360–363
Table A3. Input Sentinel-1 IW SAR data, with indication of the temporal baselines (Bt) and average perpendicular baselines (Bp) of the processed interferometric pairs exploited for the analysis of the 2022 dust storms.
PathDatesBt [days]Bp [m]
14531/03/2022–12/04/20221215
24/04/2022–30/05/20223643
24/04/2022–06/05/202212163
06/05/2022–18/05/20221219
18/05/2022–30/05/202212–140
30/05/2022–11/06/202212–2
Table A4. Input Sentinel-2 multi-spectral scenes, with indication of the number of tiles exploited to generate each composite for the analysis at the local scale.
Composite (MM/YYYY)DatesNo. Tiles
12/201815/12/2018, 25/12/2018, 30/12/201810
07/201903/07/2019, 05/07/2019, 08/07/2019, 10/07/2019, 13/07/2019, 15/07/2019, 18/07/2019, 20/07/2019, 23/07/2019, 25/07/2019, 28/07/2019, 30/07/201918
12/201905/12/2019, 15/12/2019, 17/12/2019, 20/12/2019, 22/12/2019, 30/12/201914
07/202002/07/2020, 04/07/2020, 07/07/2020, 09/07/2020, 12/07/2020, 17/07/2020, 19/07/2020, 24/07/2020, 27/07/2020, 29/07/202025
12/202001/12/2020, 09/12/2020, 11/12/2020, 14/12/2020, 21/12/2020, 24/12/202015
07/202102/07/2021, 04/07/2021, 07/07/2021, 09/07/2021, 12/07/2021, 14/07/2021, 17/07/2021, 22/07/2021, 24/07/2021, 27/07/202121
12/202106/12/2021, 09/12/2021, 19/12/20217
07/202202/07/2022, 04/07/2022, 07/07/2022, 09/07/2022, 14/07/2022, 17/07/2022, 19/07/2022, 22/07/2022, 24/07/202220
12/202211/12/2022, 16/12/2022, 19/12/2022, 21/12/2022, 29/12/202215
07/202302/07/2023, 04/07/2023, 07/07/2023, 09/07/2023, 12/07/2023, 14/07/2023, 17/07/2023, 19/07/2023, 24/07/2023, 27/07/2023, 29/07/202332
12/202301/12/2023, 04/12/2023, 14/12/2023, 16/12/2023, 19/12/2023, 21/12/2023, 24/12/2023, 26/12/202325
07/202401/07/2024, 03/07/2024, 08/07/2024, 11/07/2024, 13/07/2024, 16/07/2024, 18/07/2024, 21/07/2024, 23/07/2024, 26/07/2024, 28/07/202432
Table A5. Input COSMO-SkyMed Enhanced SpotLight (ES) data acquired over the four priority areas since the end of November 2023, with information on the acquisition beam, θ and look angles at the scene centre, and orbit mode (ascending/descending).
AOI#1 (Western)
Beam ES-33
(50.6° Look Angle, 57.7° θ)
Ascending Mode
AOI#2 (central)
Beam ES-17
(39.5° Look Angle, 44.2° θ)
Descending Mode
AOI#3 (Eastern)
Beam ES-25
(46.2° Look Angle, 52.5° θ)
Ascending Mode
AOI#4 (Ayn Sayed)
Beam ES33
(50.6° Look Angle, 57.8° θ)
Descending Mode
SatelliteDateSatelliteDateSatelliteDateSatelliteDate
CSK403/12/2023CSK228/11/2023CSK101/12/2023CSK208/12/2023
CSK204/12/2023CSK106/12/2023CSK408/12/2023CSK408/01/2024
CSK112/12/2023CSK122/12/2023CSK209/12/2023CSK209/01/2024
CSK419/12/2023CSK107/01/2024CSK117/12/2023CSK210/02/2024
CSK220/12/2023CSK414/01/2024CSK424/12/2023CSK226/02/2024
CSK128/12/2023CSK215/01/2024CSK225/12/2023CSK412/03/2024
CSK404/01/2024CSK430/01/2024CSK102/01/2024CSK213/03/2024
CSK205/01/2024CSK231/01/2024CSK409/01/2024CSK229/03/2024
CSK113/01/2024CSK108/02/2024CSK210/01/2024CSK214/04/2024
CSK420/01/2024CSK216/02/2024CSK118/01/2024CSK203/07/2024
CSK221/01/2024CSK402/03/2024CSK103/02/2024CSK205/09/2024
CSK129/01/2024CSK203/03/2024CSK410/02/2024CSK406/10/2024
CSK405/02/2024CSK418/03/2024CSK211/02/2024CSK207/10/2024
CSK206/02/2024CSK219/03/2024CSK119/02/2024CSK422/10/2024
CSK114/02/2024CSK403/04/2024CSK106/03/2024CSK407/11/2024
CSK421/02/2024CSK204/04/2024CSK413/03/2024CSK208/11/2024
CSK222/02/2024CSK112/04/2024CSK429/03/2024
CSK101/03/2024CSK419/04/2024CSK230/03/2024
CSK408/03/2024CSK128/04/2024CSK107/04/2024
CSK209/03/2024CSK405/05/2024CSK414/04/2024
CSK117/03/2024CSK206/05/2024CSK215/04/2024
CSK102/04/2024CSK114/05/2024CSK201/05/2024
CSK409/04/2024CSK130/05/2024CSK217/05/2024
CSK210/04/2024CSK406/06/2024CSK202/06/2024
CSK118/04/2024CSK207/06/2024CSK110/06/2024
CSK104/05/2024CSK115/06/2024CSK218/06/2024
CSK411/05/2024CSK223/06/2024CSK403/07/2024
CSK212/05/2024CSK101/07/2024CSK204/07/2024
CSK427/05/2024CSK408/07/2024CSK112/07/2024
CSK228/05/2024CSK209/07/2024CSK220/07/2024
CSK105/06/2024CSK117/07/2024CSK128/07/2024
CSK412/06/2024CSK424/07/2024CSK404/08/2024
CSK213/06/2024CSK225/07/2024CSK205/08/2024
CSK428/06/2024CSK102/08/2024CSK113/08/2024
CSK229/06/2024CSK409/08/2024CSK129/08/2024
CSK107/07/2024CSK210/08/2024CSK405/09/2024
CSK414/07/2024CSK425/08/2024CSK206/09/2024
CSK215/07/2024CSK226/08/2024CSK421/09/2024
CSK430/07/2024CSK103/09/2024CSK130/09/2024
CSK231/07/2024CSK410/09/2024CSK407/10/2024
CSK108/08/2024CSK211/09/2024CSK208/10/2024
CSK415/08/2024CSK426/09/2024CSK423/10/2024
CSK216/08/2024CSK227/09/2024CSK224/10/2024
CSK124/08/2024CSK105/10/2024CSK408/11/2024
CSK431/08/2024CSK412/10/2024CSK225/11/2024
CSK201/09/2024CSK213/10/2024
CSK109/09/2024CSK121/10/2024
CSK217/09/2024CSK428/10/2024
CSK125/09/2024CSK229/10/2024
CSK402/10/2024CSK106/11/2024
CSK203/10/2024CSK122/11/2024
CSK111/10/2024CSK429/11/2024
CSK127/10/2024
CSK403/11/2024
CSK204/11/2024
CSK112/11/2024
CSK419/11/2024
CSK220/11/2024
CSK128/11/2024

References

  1. Roldán-Cañas, J.; Moreno-Pérez, M.F. Water and Irrigation Management in Arid and Semiarid Zones. Water 2021, 13, 2446. [Google Scholar] [CrossRef]
  2. Nelson, G.C.; Bennett, E.; Berhe, A.A.; Cassman, K.; DeFries, R.; Dietz, T.; Dobermann, A.; Dobson, A.; Janetos, A.; Levy, M.; et al. Anthropogenic drivers of ecosystem change: An overview. Ecol. Soc. 2006, 11, 29. [Google Scholar] [CrossRef]
  3. van den Heuvel, L.; Blicharska, M.; Masia, S.; Sušnik, J.; Teutschbein, C. Ecosystem services in the Swedish water-energy-food-land-climate nexus: Anthropogenic pressures and physical interactions. Ecosyst. Serv. 2020, 44, 101141. [Google Scholar] [CrossRef]
  4. Marinelli, E.; Radini, S.; Akyol, Ç.; Sgroi, M.; Eusebi, A.L.; Bischetti, G.B.; Mancini, A.; Fatone, F. Water-Energy-Food-Climate Nexus in an Integrated Peri-Urban Wastewater Treatment and Reuse System: From Theory to Practice. Sustainability 2021, 13, 10952. [Google Scholar] [CrossRef]
  5. Lucca, E.; El Jeitany, J.; Castelli, G.; Pacetti, T.; Bresci, E.; Nardi, F.; Caporali, E. A review of water-energy-food-ecosystems Nexus research in the Mediterranean: Evolution, gaps and applications. Environ. Res. Lett. 2023, 18, 83001. [Google Scholar] [CrossRef]
  6. FAO. Water Efficiency, Productivity and Sustainability in the NENA Regions (WEPS-NENA). Available online: https://www.fao.org/in-action/water-efficiency-nena/activities/nexus-framework/en/ (accessed on 15 December 2024).
  7. NDC. The Water-Climate Nexus: Tackling the Growing Risk of Water-Related Crises. Available online: https://ndcpartnership.org/news/water-climate-nexus-tackling-growing-risk-water-related-crises (accessed on 15 December 2024).
  8. Sesana, E.; Gagnon, A.S.; Ciantelli, C.; Cassar, J.; Hughes, J.J. Climate change impacts on cultural heritage: A literature review. WIREs Clim. Change 2021, 12, e710. [Google Scholar] [CrossRef]
  9. Britwum, K.; Demont, M. Food security and the cultural heritage missing link. Glob. Food Sec. 2022, 35, 100660. [Google Scholar] [CrossRef]
  10. Eriksson, O. Coproduction of Food, Cultural Heritage and Biodiversity by Livestock Grazing in Swedish Semi-natural Grasslands. Front. Sustain. Food Syst. 2022, 6, 801327. [Google Scholar] [CrossRef]
  11. Daugstad, K.; Rønningen, K.; Skar, B. Agriculture as an upholder of cultural heritage? Conceptualizations and value judgements—A Norwegian perspective in international context. J. Rural Stud. 2006, 22, 67–81. [Google Scholar] [CrossRef]
  12. Ardakanian, R.; Hülsmann, S. Impact of Global Change on World Heritage and on Environmental Resources: The Need for an Integrated Management Approach. In Climate Change as a Threat to Peace: Impacts on Cultural Heritage and Cultural Diversity; von Schorlemer, S., Maus, S., Eds.; Peter Lang Verlag: Berlin, Germany, 2015; pp. 101–117. ISBN 9783653052053. [Google Scholar]
  13. UNEP. Global Environment Outlook—GEO-6: Healthy Planet, Healthy People; UN Environment, Ed.; Cambridge University Press: Cambridge, UK, 2019; ISBN 9781108627146. [Google Scholar]
  14. IOM Iraq. Migration, Environment and Climate Change in Iraq; IOM Iraq: Baghdad, Iraq, 2022. [Google Scholar]
  15. MoE. “The Ahwar” Marshlands of Southern Iraq; MoE: Baghdad, Iraq, 2014. [Google Scholar]
  16. Hashim, B.M.; Sultan, M.A.; Attyia, M.N.; Al Maliki, A.A.; Al-Ansari, N. Change detection and impact of climate changes to Iraqi southern marshes using Landsat 2 MSS, Landsat 8 OLI and Sentinel 2 MSI data and GIS applications. Appl. Sci. 2019, 9, 2016. [Google Scholar] [CrossRef]
  17. Kadhim, M.M. Monitoring land cover change using remote sensing and GIS techniques: A case study of Al-Dalmaj marsh, Iraq. J. Eng. 2018, 24, 96–108. [Google Scholar] [CrossRef]
  18. Al-Helaly, M.; Alwan, I.; AL-Hameedawi, A. Environmental investigation of Bahar Al-Najaf region using Sentinel-2 images. Eng. Technol. J. 2022, 40, 732–742. [Google Scholar] [CrossRef]
  19. Jumaah, H.J.; Ameen, M.H.; Mohamed, G.H.; Ajaj, Q.M. Monitoring and evaluation Al-Razzaza lake changes in Iraq using GIS and remote sensing technology. Egypt. J. Remote Sens. Sp. Sci. 2022, 25, 313–321. [Google Scholar] [CrossRef]
  20. Wdaah, E.R.; Nori, A.F. Detection of land cover change in the Sea of Najaf/Iraq for the period (2005–2022) using remote sensing techniques. Int. J. Adv. Multidiscip. Res. Stud. 2023, 3, 1201–1206. [Google Scholar]
  21. Hritz, C.; Wilkinson, T.J. Using Shuttle Radar Topography to map ancient water channels in Mesopotamia. Antiquity 2006, 80, 415–424. [Google Scholar] [CrossRef]
  22. Wilkinson, T.J.; Rayne, L.; Jotheri, J. Hydraulic landscapes in Mesopotamia: The role of human niche construction. Water Hist. 2015, 7, 397–418. [Google Scholar] [CrossRef]
  23. Jotheri, J.; Allen, M.B. Recognition of ancient channels and archaeological sites in the Mesopotamian floodplain using satellite imagery and digital topography. In New Agendas in Remote Sensing and Landscape Archaeology in the Near East: Studies in Honour of Tony J. Wilkinson; Lawrence, D., Altaweel, M., Philip, G., Eds.; Archaeopress: Oxford, UK, 2020; pp. 283–305. ISBN 9781789695731. [Google Scholar]
  24. Webb, J.A.; Jotheri, J.; Fensham, R.J. Springs of the Arabian desert: Hydrogeology and hydrochemistry of Abu Jir springs, Central Iraq. Water 2024, 16, 2491. [Google Scholar] [CrossRef]
  25. Cigna, F.; Tapete, D.; Rayne, L.; Makovics, J.L.; Irvine, H.K.; De Gruchy, M.W.; Jotheri, J. Assessing anthropogenic and climate change threats to archaeological landscapes in Iraq using Earth observation. In Proceedings of the 2024 IEEE Mediterranean and Middle-East Geoscience and Remote Sensing Symposium, M2GARSS 2024, Oran, Algeria, 15–17 April 2024; pp. 424–428. [Google Scholar]
  26. Saleh, S.A.; Al-Ansari, N.; Abdullah, T. Groundwater hydrology in Iraq. J. Earth Sci. Geotech. Eng. 2020, 10, 155–197. [Google Scholar]
  27. Algabri, A. Settlement Patterns in the West of Uruk During the Second Millennium BC. Master’s Thesis, University of Al-Qadisiyah, Al-Qadisiyah, Iraq, 2020. [Google Scholar]
  28. World Bank Climate Change Overview > Country Summary: Iraq. Available online: https://climateknowledgeportal.worldbank.org/country/iraq (accessed on 15 December 2024).
  29. Hewett, Z.; de Gruchy, M.; Hill, D.; Lawrence, D. Raincheck: A new diachronic series of rainfall maps for Southwest Asia over the Holocene. Levant 2022, 54, 5–28. [Google Scholar] [CrossRef]
  30. Jotheri, J.; Rokan, M.; Al-Ghanim, A.; Rayne, L.; de Gruchy, M.; Alabdan, R. Identifying the preserved network of irrigation canals in the Eridu region, southern Mesopotamia. Antiquity 2025, 1–7. [Google Scholar] [CrossRef]
  31. Colombera, L.; Mountney, N.P. Influence of fluvial crevasse-splay deposits on sandbody connectivity: Lessons from geological analogues and stochastic modelling. Mar. Pet. Geol. 2021, 128, 105060. [Google Scholar] [CrossRef]
  32. Adams, R.M. Heartland of cities: Surveys of Ancient Settlement and Land Use on the Central Floodplain of the Euphrates; University of Chicago Press: Chicago, IL, USA, 1981. [Google Scholar]
  33. Jotheri, J.; Allen, M.B.; Wilkinson, T.J. Holocene avulsions of the Euphrates River in the Najaf area of Western Mesopotamia: Impacts on human settlement patterns. Geoarchaeology 2016, 31, 175–193. [Google Scholar] [CrossRef]
  34. Köppen, W. Das Geographische System der Klimate; Gebrüder Borntraeger: Berlin, Germany, 1936. [Google Scholar]
  35. Pressel, P. Meeting the challenge: The HEXAGON KH-9 Reconnaissance Satellite; American Institute of Aeronautics and Astronautics: Reston, VA, USA, 2013; ISBN 978-1624102035. [Google Scholar]
  36. CSNR. HEXAGON America’s Eyes in Space—Fact Sheet. Center for the Study of National Reconnaissance; CSNR: Chantilly, VA, USA, 2011. [Google Scholar]
  37. Hammer, E.; FitzPatrick, M.; Ur, J. Succeeding CORONA: Declassified HEXAGON intelligence imagery for archaeological and historical research. Antiquity 2022, 96, 679–695. [Google Scholar] [CrossRef]
  38. EROS. Declassified Satellite Imagery—3. United States Geological Survey (USGS), Earth Resources Observation and Science (EROS) Center 2017. Available online: https://www.usgs.gov/centers/eros/science/usgs-eros-archive-declassified-data-declassified-satellite-imagery-3 (accessed on 15 December 2024).
  39. Torres, R.; Snoeij, P.; Geudtner, D.; Bibby, D.; Davidson, M.; Attema, E.; Potin, P.; Rommen, B.Ö.; Floury, N.; Brown, M.; et al. GMES Sentinel-1 mission. Remote Sens. Environ. 2012, 120, 9–24. [Google Scholar] [CrossRef]
  40. Drusch, M.; Del Bello, U.; Carlier, S.; Colin, O.; Fernandez, V.; Gascon, F.; Hoersch, B.; Isola, C.; Laberinti, P.; Martimort, P.; et al. Sentinel-2: ESA’s optical high-resolution mission for GMES operational services. Remote Sens. Environ. 2012, 120, 25–36. [Google Scholar] [CrossRef]
  41. Caltagirone, F.; Capuzi, A.; Coletta, A.; De Luca, G.F.; Scorzafava, E.; Leonardi, R.; Rivola, S.; Fagioli, S.; Angino, G.; Labbate, M.; et al. The COSMO-SkyMed dual use earth observation program: Development, qualification, and results of the commissioning of the overall constellation. IEEE J. Sel. Top. Appl. Earth Obs. Remote Sens. 2014, 7, 2754–2762. [Google Scholar] [CrossRef]
  42. Covello, F.; Battazza, F.; Coletta, A.; Lopinto, E.; Fiorentino, C.; Pietranera, L.; Valentini, G.; Zoffoli, S. COSMO-SkyMed an existing opportunity for observing the Earth. J. Geodyn. 2010, 49, 171–180. [Google Scholar] [CrossRef]
  43. Tapete, D.; Traviglia, A.; Delpozzo, E.; Cigna, F. Regional-scale systematic mapping of archaeological mounds and detection of looting using COSMO-SkyMed high resolution DEM and satellite imagery. Remote Sens. 2021, 13, 3106. [Google Scholar] [CrossRef]
  44. ASI COSMO-SkyMed Mission and Products Description (8 July 2019). Italian Space Agency—ASI. DOC n. ASI-CSM-PMG-NT-001, 151p. Available online: https://www.asi.it/wp-content/uploads/2019/08/COSMO-SkyMed-Mission-and-Products-Description_rev3-1.pdf (accessed on 15 December 2024).
  45. Donlon, C.; Berruti, B.; Buongiorno, A.; Ferreira, M.H.; Féménias, P.; Frerick, J.; Goryl, P.; Klein, U.; Laur, H.; Mavrocordatos, C.; et al. The Global Monitoring for Environment and Security (GMES) Sentinel-3 mission. Remote Sens. Environ. 2012, 120, 37–57. [Google Scholar] [CrossRef]
  46. Farr, T.G.; Rosen, P.A.; Caro, E.; Crippen, R.; Duren, R.; Hensley, S.; Kobrick, M.; Paller, M.; Rodriguez, E.; Roth, L.; et al. The shuttle radar topography mission. Rev. Geophys. 2007, 45, RG2004. [Google Scholar] [CrossRef]
  47. Makovics, J.L. Utilising declassified Cold War satellite imagery (KH-9 HEXAGON) for remote sensing of historic hydraulic management features in North Africa. In Proceedings of the 2024 IEEE Mediterranean and Middle-East Geoscience and Remote Sensing Symposium, M2GARSS 2024, Oran, Algeria, 15–17 April 2024; pp. 391–395. [Google Scholar]
  48. Rosen, P.A.; Hensley, S.; Joughin, I.R.; Li, F.K.; Madsen, S.N.; Rodriguez, E.; Goldstein, R.M. Synthetic aperture radar interferometry. Proc. IEEE 2000, 88, 333–380. [Google Scholar] [CrossRef]
  49. Hogenson, K.; Kristenson, H.; Kennedy, J.; Johnston, A.; Rine, J.; Logan, T.; Zhu, J.; Williams, F.; Herrmann, J.; Smale, J.; et al. Hybrid Pluggable Processing Pipeline (HyP3): A Cloud-Based Infrastructure for Generic Processing of SAR Data 2020. Available online: https://zenodo.org/records/15299601 (accessed on 15 December 2024).
  50. Prats-Iraola, P.; Scheiber, R.; Marotti, L.; Wollstadt, S.; Reigber, A. TOPS interferometry with TerraSAR-X. IEEE Trans. Geosci. Remote Sens. 2012, 50, 3179–3188. [Google Scholar] [CrossRef]
  51. Goldstein, R.M.; Werner, C.L. Radar interferogram filtering for geophysical applications. Geophys. Res. Lett. 1998, 25, 4035–4038. [Google Scholar] [CrossRef]
  52. Copernicus Copernicus DEM—Global and European Digital Elevation Model (COP-DEM)—GLO-30 2024. Available online: https://dataspace.copernicus.eu/explore-data/data-collections/copernicus-contributing-missions/collections-description/COP-DEM (accessed on 15 December 2024).
  53. Huang, H.; Wang, J.; Liu, C.; Liang, L.; Li, C.; Gong, P. The migration of training samples towards dynamic global land cover mapping. ISPRS J. Photogramm. Remote Sens. 2020, 161, 27–36. [Google Scholar] [CrossRef]
  54. Carvalho Júnior, O.A.; Guimarães, R.F.; Gillespie, A.R.; Silva, N.C.; Gomes, R.A.T. A New Approach to Change Vector Analysis Using Distance and Similarity Measures. Remote Sens. 2011, 3, 2473–2493. [Google Scholar] [CrossRef]
  55. Gao, B.C. NDWI—A normalized difference water index for remote sensing of vegetation liquid water from space. Remote Sens. Environ. 1996, 58, 257–266. [Google Scholar] [CrossRef]
  56. Rayne, L.; Gatto, M.C.; Abdulaati, L.; Al-Haddad, M.; Sterry, M.; Sheldrick, N.; Mattingly, D. Detecting change at archaeological sites in North Africa using open-source satellite imagery. Remote Sens. 2020, 12, 3694. [Google Scholar] [CrossRef]
  57. Change Detection Code for Environmental Challenges and Vanishing Landscapes: Remotely Sensed Insights into the Climate-Water-Agriculture-Heritage Nexus in Southern Iraq. Available online: https://dx.doi.org/10.25405/data.ncl.27643479 (accessed on 21 November 2024).
  58. Tapete, D.; Cigna, F.; Donoghue, D.N.M. “Looting marks” in space-borne SAR imagery: Measuring rates of archaeological looting in Apamea (Syria) with TerraSAR-X Staring Spotlight. Remote Sens. Environ. 2016, 178, 42–58. [Google Scholar] [CrossRef]
  59. Tapete, D.; Cigna, F. Detection of archaeological looting from space: Methods, achievements and challenges. Remote Sens. 2019, 11, 2389. [Google Scholar] [CrossRef]
  60. Laben, C.A.; Brower, B.V. Process for Enhancing the Spatial Resolution of Multispectral Imagery Using Pan-Sharpening. US Patent 6011875, 29 April 1998. [Google Scholar]
  61. Ruescas, A.B.; Delgado Blasco, J.M.; Costantini, F.; Sarti, F. Change detection by interferometric coherence in Nasca Lines, Peru (1997–2004). In Proceedings of the Fringe 2009 Workshop, Frascati, Italy, 30 November–4 December 2009; p. 7. [Google Scholar]
  62. Ullmann, T.; Sauerbrey, J.; Hoffmeister, D.; May, S.M.; Baumhauer, R.; Bubenzer, O. Assessing Spatiotemporal Variations of Sentinel-1 InSAR Coherence at Different Time Scales over the Atacama Desert (Chile) between 2015 and 2018. Remote Sens. 2019, 11, 2960. [Google Scholar] [CrossRef]
  63. Kullab, S. Iraq’s “Pearl of the South” Lake Sawa Dry Amid Water Crisis. Available online: https://apnews.com/article/climate-business-religion-lakes-droughts-c1bc62812c4da7b440cbb67adcc5e988 (accessed on 4 September 2024).
  64. Al-Hussaniy, Q.F. Climate change and its impact on the phenomenon of desertification in Iraq. Basic Educ. Coll. Mag. Educ. Humanit. Sci. 2019, 7, 75–96. [Google Scholar]
  65. The Guardian. Ninth Sandstorm in Less Than Two Months Shuts down Much of Iraq; Guardian Media Group: London, UK, 2022. [Google Scholar]
  66. Winkler, E.M. Silicosis. In Stone in Architecture: Properties, Durability; Winkler, E.M., Ed.; Springer: Berlin, Heidelberg, 1997; pp. 258–263. ISBN 978-3-662-10070-7. [Google Scholar]
  67. Liu, T.-C.; Tang, H.-H.; Lei, S.-Y.; Peng, Y.-I. Asian dust storms result in a higher risk of the silicosis hospital admissions. J. Environ. Health Sci. Eng. 2022, 20, 305–314. [Google Scholar] [CrossRef] [PubMed]
  68. World Bank. Sand and Dust Storms in the Middle East and North Africa (MENA) Region—Sources, Costs, and Solutions; World Bank: Washington, DC, USA, 2019. [Google Scholar]
  69. Moridnejad, A.; Karimi, N.; Ariya, P.A. Newly desertified regions in Iraq and its surrounding areas: Significant novel sources of global dust particles. J. Arid Environ. 2015, 116, 1–10. [Google Scholar] [CrossRef]
  70. Zaina, F. A risk assessment for cultural heritage in Southern Iraq: Framing drivers, threats and actions affecting archaeological sites. Conserv. Manag. Archaeol. Sites 2019, 21, 184–206. [Google Scholar] [CrossRef]
  71. Tapete, D.; Cigna, F. Detection, morphometric analysis and digital surveying of archaeological mounds in Southern Iraq with CartoSat-1 and COSMO-SkyMed DEMs. Land 2022, 11, 1406. [Google Scholar] [CrossRef]
  72. Zaina, F.; Tapete, D. Satellite-based methodology for purposes of rescue archaeology of cultural heritage threatened by dam construction. Remote Sens. 2022, 14, 1009. [Google Scholar] [CrossRef]
  73. Alshammari, L.; Mohammed, O.N. Monthly drought monitoring of the surface water area of Sawa Lake, Iraq during 2016–2022 using remote sensing data. Period. Eng. Nat. Sci. 2023, 11, 47–63. [Google Scholar] [CrossRef]
  74. ASGIS Environmental Statistics. Authority of Statistics and Geographic Information Systems (ASGIS), Iraq. (In Arabic). Available online: https://cosit.gov.iq/ar/env-stat/envi-stat (accessed on 15 December 2024).
  75. Al-Obaidi, J.R.; Yahya Allawi, M.; Salim Al-Taie, B.; Alobaidi, K.H.; Al-Khayri, J.M.; Abdullah, S.; Ahmad-Kamil, E.I. The environmental, economic, and social development impact of desertification in Iraq: A review on desertification control measures and mitigation strategies. Environ. Monit. Assess. 2022, 194, 440. [Google Scholar] [CrossRef]
  76. Ahmadzai, H. The impact of sand and dust storms on agriculture in Iraq. Middle East Dev. J. 2023, 15, 50–65. [Google Scholar] [CrossRef]
  77. Sissakian, V.K.; Al-Ansari, N.; Knutsson, S. Sand and dust storm events in Iraq. Nat. Sci. 2013, 05, 1084–1094. [Google Scholar] [CrossRef]
  78. Albarakat, R.; Lakshmi, V. Monitoring dust storms in Iraq using satellite data. Sensors 2019, 19, 3687. [Google Scholar] [CrossRef] [PubMed]
  79. Khidher, S.A. Dust storms in Iraq: Past and present. Theor. Appl. Climatol. 2024, 155, 4721–4735. [Google Scholar] [CrossRef]
  80. Al-Hemoud, A.; Al-Dousari, A.; Al-Dashti, H.; Petrov, P.; Al-Saleh, A.; Al-Khafaji, S.; Behbehani, W.; Li, J.; Koutrakis, P. Sand and dust storm trajectories from Iraq Mesopotamian flood plain to Kuwait. Sci. Total Environ. 2020, 710, 136291. [Google Scholar] [CrossRef] [PubMed]
  81. Ismail, R.R.; Halos, S.H.; Al-Abudi, B.Q. Detection of the most frequent sources of dust storms in Iraq during 2020–2023 using space tools. Kuwait J. Sci. 2025, 52, 100328. [Google Scholar] [CrossRef]
  82. Hashemi, H.; Abdi, A.M.; Naghibi, A.; Zhao, P.; Brogaard, S.; Haghighi, A.T.; Mansourian, A. Unraveling the link between agricultural patterns and dust storm occurrence in Mesopotamia. Environ. Res. Lett. 2025, 20, 24011. [Google Scholar] [CrossRef]
  83. Al-Yasiry, A.F.; Al-Lami, A.M.; Al-Maliki, A. Production of Environmental Sensitivity Maps for Desertification in Southern Marshes of Iraq. IOP Conf. Ser. Earth Environ. Sci. 2023, 1215, 12023. [Google Scholar] [CrossRef]
  84. Hason, M.M.; Abbood, I.S.; Odaa, S.A. Land cover reflectance of Iraqi marshlands based on visible spectral multiband of satellite imagery. Results Eng. 2020, 8, 100167. [Google Scholar] [CrossRef]
  85. Jones, C.; Sultan, M.; Yan, E.; Milewski, A.; Hussein, M.; Al-Dousari, A.; Al-Kaisy, S.; Becker, R. Hydrologic impacts of engineering projects on the Tigris–Euphrates system and its marshlands. J. Hydrol. 2008, 353, 59–75. [Google Scholar] [CrossRef]
  86. Marchetti, N.; Al-Hussainy, A.; Valeri, M.; Zaina, F. Assessing Endangered Cultural Heritage in Central Iraq. Methods and Perspectives of the QADIS Survey Project. Sumer. J. Archaeol. Iraq Arab World 2018, 64, 11–34. [Google Scholar]
  87. Boroughani, M.; Mohammadi, M.; Mirchooli, F.; Fiedler, S. Assessment of the impact of dust aerosols on crop and water loss in the Great Salt Desert in Iran. Comput. Electron. Agric. 2022, 192, 106605. [Google Scholar] [CrossRef]
  88. Kuzma, S.; Saccoccia, L.; Chertock, M. 25 Countries, Housing One-Quarter of the Population, Face Extremely High Water Stress. Available online: https://www.wri.org/insights/highest-water-stressed-countries (accessed on 15 December 2024).
  89. Kuzma, S.; Bierkens, M.F.P.; Lakshman, S.; Luo, T.; Saccoccia, L.; Sutanudjaja, E.H.; Van Beek, R. Aqueduct 4.0: Updated Decision-Relevant Global Water Risk Indicators; World Resources Institute: Washington, DC, USA, 2023. [Google Scholar]
  90. Al-Addous, M.; Bdour, M.; Alnaief, M.; Rabaiah, S.; Schweimanns, N. Water Resources in Jordan: A Review of Current Challenges and Future Opportunities. Water 2023, 15, 3729. [Google Scholar] [CrossRef]
  91. Al Naber, M.; Molle, F. Water and sand: Is groundwater-based farming in Jordan’s desert sustainable? Groundw. Sustain. Dev. 2017, 5, 28–37. [Google Scholar] [CrossRef]
  92. Danti, M.; Branting, S.; Penacho, S. The American Schools of Oriental Research Cultural Heritage Initiatives: Monitoring cultural heritage in Syria and Northern Iraq by geospatial imagery. Geosciences 2017, 7, 95. [Google Scholar] [CrossRef]
  93. Rayne, L.; Bradbury, J.; Mattingly, D.; Philip, G.; Bewley, R.; Wilson, A. From above and on the ground: Geospatial methods for recording endangered archaeology in the middle East and North Africa. Geosciences 2017, 7, 100. [Google Scholar] [CrossRef]
  94. Contreras, D.A.; Brodie, N. The Utility of Publicly-Available Satellite Imagery for Investigating Looting of Archaeological Sites in Jordan. J. Field Archaeol. 2010, 35, 101–114. [Google Scholar] [CrossRef]
  95. Conesa, F.C.; Orengo, H.A.; Lobo, A.; Petrie, C.A. An Algorithm to Detect Endangered Cultural Heritage by Agricultural Expansion in Drylands at a Global Scale. Remote Sens. 2023, 15, 53. [Google Scholar] [CrossRef]
  96. Contreras, D.; Brodie, N. Using Google Earth to Identify Site Looting in Jordan. Available online: https://traffickingculture.org/data/google-earth-jordan/ (accessed on 20 March 2025).
  97. Christensen, H.H.; Mabery, K.; McAllister, M.E.; McCormick, D.P. Cultural resource protection. A predictive framework for identifying site vulnerability, protection priorities, and effective protection strategies. In The Psychology of Vandalism; Goldstein, A.P., Ed.; Springer: Boston, MA, USA, 1996; pp. 117–126. ISBN 978-1-4899-0176-7. [Google Scholar]
  98. Nickens, P.R. Perspectives on Archaeological Site Protection and Preservation. Report EL-91-6; Waterways Experiment Station: Vicksburg, MS, USA, 1991. [Google Scholar]
  99. Bundy, B. Archaeological Looting and Vandalism in the Pacific Northwest: A Quantitative Analysis of Causes and Prevention; VDM Verlag: Saarbrucken, Germany, 2008. [Google Scholar]
  100. Bundy, B.; Moss, M.L. Quantifying dimensions of the looting problem at archaeological sites in Alaska. Alaska J. Anthropol. 2007, 5, 133–149. [Google Scholar]
  101. Cunliffe, E.L.; de Gruchy, M.W.; Stammitti, E. How to Build a Dam and Save Cultural Heritage. Int. J. Herit. Digit. Era 2012, 1, 221–226. [Google Scholar] [CrossRef]
  102. Cunliffe, E.; de Gruchy, M.; Stammitti, E. Dam(ned) Archaeology. Int. Water Power Dam Constr. 2012, 64, 62–65. [Google Scholar]
  103. Marchetti, N.; Curci, A.; Gatto, M.C.; Nicolini, S.; Mühl, S.; Zaina, F. A multi-scalar approach for assessing the impact of dams on the cultural heritage in the Middle East and North Africa. J. Cult. Herit. 2019, 37, 17–28. [Google Scholar] [CrossRef]
  104. Quickel, A.T.; Williams, G. In Search of Sibākh: Digging up Egypt from antiquity to the present day. J. Islam. Archaeol. 2016, 3, 89–108. [Google Scholar] [CrossRef]
Figure 2. Regional-scale change maps based on Sentinel-1 IW InSAR coherence in the 2014–2023 period: (a) 2014–2015, (b) 2015–2016, (c) 2016–2017, (d) 2017–2018, (e) 2018–2019, (f) 2019–2020, (g) 2020–2021, (h) 2021–2022, and (i) 2022–2023. InSAR products processed by ASF DAAC HyP3 2023–2024. Contains modified Copernicus Sentinel-1 data 2014–2023.
Land 14 01013 g002
Figure 3. Examples of detected changes across the region of interest using Sentinel-1 IW InSAR coherence in: (a) 2022–2023 vs. Sentinel-2 true colour composite 2023, showing decorrelation at centre-pivot irrigation systems, at Sawa Lake, and across the river plain, and higher correlation at exposed rocky outcrops; (b) 24 April 2022–6 May 2022 vs. matching PlanetScope true- and false-colour composites on 21 April 2022 and 30 April 2022, showing the impact of a dust storm event southwest of Najaf Sea; (c) 2021–2022 vs. Sentinel-2 true colour on 2 December 2022, highlighting the development of the new Anbar international airport; and (d) 2019–2020 vs. ESRI basemap, highlighting the decorrelation along the river network west of Razazza Lake, which is not clearly visible in the optical data. InSAR products processed by ASF DAAC HyP3 2023–2024. Contains modified Copernicus Sentinel-1 data 2019–2022 and Sentinel-2 data 2022–2023. Google Earth imagery © 2024 CNES/Airbus. ESRI basemap ©Esri, Maxar, Earthstar Geographics, and the GIS User Community.
Land 14 01013 g003
Figure 4. (a) Overview of the average yearly coherence observed in 2014–2023 at the 194 ancient springs along the Abu Jir lineament and 94 ancient settlements and tells west of Uruk, with indication of the eight sites selected for the time series plotting; time series of yearly coherence at selected (b) springs and (c) ancient settlements in 2014–2023. ESRI basemap ©Esri, Maxar, Earthstar Geographics, and the GIS User Community.
Land 14 01013 g004
Figure 5. Local-scale change maps based on Sentinel-2 NDVI change in the period 2018–2023: (a) 2018–2019, (b) 2019–2020, (c) 2020–2021, (d) 2021–2022, and (e) 2022–2023. Contains modified Copernicus Sentinel-2 data 2018–2023.
Land 14 01013 g005
Figure 6. Sentinel-2: (a) true-colour composite 2022 and NDVI change in 2021–2022 at centre-pivot systems close to ancient spring locations in the area southwest of Samawah town and (b) true-colour composite and NDWI at Sawa Lake in 2023. Contains modified Copernicus Sentinel-2 data 2022–2023.
Land 14 01013 g006
Figure 7. Maps and statistics showing the changed vs. unchanged classification of the 14 springs and 76 settlements based on the local-scale assessment using Sentinel-2 (a) NDVI change and (b) change magnitude 2022–2023 products. Data displayed onto the Sentinel-2 true-colour composite for 2023. Contains modified Copernicus Sentinel-2 data 2023.
Land 14 01013 g007
Figure 8. Examples of Sentinel-3 OLCI scenes clearly depicting the regions of Iraq impacted by dust storms coming from the west and northwest on (a) 1 May, (b) 2 May, (c) 5 May, and (d) 16 May 2022; detailed view of storms generated from the southern sector of the Central Desert on (e) 13 May, (f) 12 June, (g) 17 June, and (h) 28 June 2022. Contains Copernicus Sentinel-3 data 2022.
Land 14 01013 g008
Figure 9. (a,b) Field and (c) drone photographs of irrigation systems in the area surrounding the old lakes in the Western Desert, with evidence of soil being exposed to winds, causing it to be easily mobilised during storms.
Land 14 01013 g009
Figure 10. Area of the Ayn Sayed spring and surrounding agricultural fields, as recorded in (a) KH-9 ortho-photograph collected on 22 February 1981 (photo id. D3C1216-401325A027); (b) Landsat-5 TM, 31 March 2002; (c) Sentinel-1 amplitude, 2014; (d) Google Earth VHR imagery, 5 June 2018; (e) Landsat-8 OLI, 2 February2022; (f) Sentinel-1 amplitude, 2023; and (g) COSMO-SkyMed average SAR amplitude 2023–2024, with (h) a zoomed view of the spring. Contains Copernicus Sentinel-1 data 2014–2023. Google Earth imagery © 2024 Maxar Technologies. COSMO-SkyMed® Products © Italian Space Agency 2023–2024. All rights reserved. Landsat-5 and Landsat-8 images courtesy of the USGS.
Land 14 01013 g010
Figure 11. Landscape evolution of AOI#2-AOI#3, as depicted in (a) KH-9 ortho-photographs collected on 22 February 1981 (ids. D3C1216-401325A026 and D3C1216-401325A027); (b) Landsat-5 NDVI, 4 May 1991; and Sentinel-2 NDVI change maps (c) 2018–2019, and (d) 2022–2023. The white patches in (c) are due to cloud-covered pixels in the Sentinel-2 composites. Contains modified Copernicus Sentinel-2 data 2018–2023. Landsat-5 image courtesy of the USGS.
Land 14 01013 g011
Figure 12. Close-up view of the Ayn Sayed spring: (a) location of archaeological features around the spring, shown on a Google Earth image collected on 6 January 2012; (b) aerial drone-based view of the spring and Ottoman fortress, and detailed views of (c,d) the spring and pumping pipes, (e) the as-yet unmapped structure northwest of the Ayn Sayed spring, and (f) the industrial agricultural fields in close proximity to this. Drone imagery collected on 3 July 2024. Google Earth imagery © 2024 Maxar Technologies.
Land 14 01013 g012
Figure 13. Area of the Shoaib Abu Khdhair spring: (a) KH-9 ortho-photograph collected on 22 February 1981 (photo id. D3C1216-401325A027); (b) Sentinel-2 true colour composite 2018; and NDVI change maps for (c) 2018–2019 and (d) 2022–2023. Lettering (i) and (ii) indicate two natural morphological depressions filled in by water run-off and discharge. Contains modified Copernicus Sentinel-2 data 2018–2023.
Land 14 01013 g013
Figure 14. Close-up view of the Shoaib Abu Khdhair spring in (a) KH-9 ortho-photograph collected on 22 February 1981 (photo id. D3C1216-401325A027); (b,c) Google Earth images collected on 9 November 2011 and 5 June 2018, respectively; (d) COSMO-SkyMed Enhanced Spotlight average SAR amplitude in 2023–2024; and (e) a drone aerial view acquired on 3 July 2024. Google Earth imagery © 2024 Maxar Technologies. COSMO-SkyMed® Products © Italian Space Agency 2023–2024. All rights reserved.
Land 14 01013 g014
Figure 15. Surface water run-off processes in AOI#1, as documented in Sentinel-2 NDVI change maps in (a) 2018–2019 and (b) 2022–2023, with zoomed views (black boxes) of natural run-off events in (c) the 2022–2023 NDVI change map and (d) COSMO-SkyMed average SAR amplitude 2023–2024, and anthropogenic run-off from agricultural fields feeding a natural depression, as observed in the Sentinel-2 scenes collected on (e) 14 April 2019 and (f) 13 February 2020. COSMO-SkyMed® Products © Italian Space Agency 2023–2024. All rights reserved. Contains modified Copernicus Sentinel-2 data 2018–2023.
Land 14 01013 g015
Figure 16. Multi-temporal evolution of canals and fields of traditional agricultural practices in AOI#2, as depicted in the Sentinel-2 NDVI change maps: (a) 2018–2019, (b) 2019–2020, (c) 2020–2021, (d) 2021–2022, and (e) 2022–2023.
Land 14 01013 g016
Figure 17. Field photograph of abandoned fields, taken on 3 July 2024.
Land 14 01013 g017
Figure 18. Example of a vanishing landscape in AOI#1-AOI#2, as observed by comparing (a) KH-9 ortho-photograph acquired on 22 February 1981 (photo id. D3C1216-401325A026) and (b) COSMO-SkyMed average SAR amplitude 2023–2024 with related zoomed views of (c) encroachment, wherein the modern irrigation system has superseded and destroyed the traditional one and (d) offtake points (either physical offtakes with dams, sluices, etc., or offtake using pumps and pipes) along Saddam Hussein’s canal. COSMO-SkyMed® Products © Italian Space Agency 2023–2024. All rights reserved.
Land 14 01013 g018
Figure 19. Babylonian tells in the area of the palaeo-fluvial feature (crevasse splay) of ancient meanders of the Euphrates river within AOI#1 (see locations in Figure 18a): (ac) AJ2, and (df) AJ38. Evidence of looting was found through comparing (a,d) KH-9 ortho-photograph collected on 22 February 1981 (photo id. D3C1216-401325A026), (b,e) Google Earth imagery collected on 7 October 2013, and (c,f) COSMO-SkyMed average SAR amplitude 2023–2024. COSMO-SkyMed® Products © Italian Space Agency 2023–2024. All rights reserved. Google Earth imagery © 2024 Maxar Technologies.
Land 14 01013 g019
Figure 20. The Sasanian fort, which was in good condition in 1981, as depicted in (a) KH-9 ortho-photograph (photo id. D3C1216-401325A026) and was nearly completely destroyed by excavations and bulldozing, likely for quarrying, over the last decade, as observed in (bd) Google Earth imagery acquired on 7 October 2013, 4 June 2019, and 16 October 2020, and (e) COSMO-SkyMed average SAR amplitude 2023–2024. COSMO-SkyMed® Products © Italian Space Agency 2023–2024. All rights reserved. Google Earth imagery © 2024 Maxar Technologies, and CNES/Airbus.
Land 14 01013 g020
Figure 21. Example of encroachment by modern development close to a mud brick factory and heavy vehicle tracks: (a) KH-9 ortho-photograph, collected on 22 February 1981 (photo id. D3C1216-401325A026), and Google Earth imagery, acquired on (b) 25 January 2010, (c) 28 December 2015, and (d) 27 July 2018. Google Earth imagery © 2024 Maxar Technologies, and CNES/Airbus.
Land 14 01013 g021
Figure 22. Example of the heavy disturbances caused by brick manufacturing. Pits, pools of water, earthworks, and stacks of newly made bricks are visible. RGB composite pan-sharpened Pléiades Neo imagery collected on 28 September 2021. ©Airbus DS 2021.
Land 14 01013 g022
Figure 23. Example of encroachment by canal-digging affecting a tell site in the West Euphrates region, as documented in (a) KH-9 ortho-photograph on 22 February 1981 (photo id. D3C1216-401325A026), (b,c) Google Earth imagery on (b) 25 January 2010 and (c) 14 June 2018, and (d) COSMO-SkyMed average SAR amplitude 2023–2024. COSMO-SkyMed® Products © Italian Space Agency 2023–2024. All rights reserved. Google Earth imagery © 2024 Maxar Technologies.
Land 14 01013 g023
Table 1. Matrix of interpretation keys relating parameters extracted from satellite data, associated environmental proxies, and on-the-ground processes. Notation: MS, multispectral optical (e.g., Landsat, Sentinel-2, Sentinel-3 OLCI, high- to very-high-resolution commercial imagery); P, panchromatic imagery (e.g., declassified HEXAGON KH-9); RGB, Red, Green, and Blue composites; SAR, Synthetic Aperture Radar (e.g., Sentinel-1, COSMO-SkyMed); NDVI, Normalised Difference Vegetation Index; NDWI, Normalised Difference Water Index.
Nexus LinkSatellite DataExtracted ParameterGround Feature/LocationProxyInterpretation Key
Climate-WaterP, MSRGB/grey levelLake/water body/reservoirDark blue
Surface whitening
Peak water level
Intense evapotranspiration and surface salinisation
NDVILake/water body/reservoirIncreased or residual vegetation
Dry land
Drying out of lakes and reservoirs
Canals/watershed
Cropfields
Increased vegetation pattern or residual vegetation
Dry land
Surface water run-off and discharge
Lack of water/water shortage
NDWILake/water body/reservoirDecrease/increase in water extentDrying out/replenishment of lakes and reservoirs
Water accumulation in depression areas, formation of ephemeral reservoirs
Residual soil moisture in dry landIntense evapotranspiration
Cropfields/bare landDendritic/river-like surface water patternSurface water run-off and discharge
Loss of water from irrigated fields
Water-AgricultureMSNDVICropfieldsIncreased vegetation pattern according to regular field shapeOngoing agricultural practice supported by irrigation
If centre-pivot or herringbone shape, irrigation likely occurs through a modern (mechanised) irrigation system/groundwater pumping
Persistent decrease/prolonged lack of vegetationIrrigation water shortage
SpringsDecrease/increase in vegetation patternWater shortage, desiccation
SARAmplitude/radar backscatterSpringsIncreased brightness patternHigh surface moisture, suggesting irrigation is in place and/or tillage practice with a marked orientation (e.g., regular rows or a canal network)
Springs and
cropfields
Persistent, dark, thick lines crossing the landscapeDisturbance from heavy vehicles and cars related to water-exploitation activities
InSAR coherenceSpringsDecorrelationLandscape disturbance
Morphological alterations due to anthropogenic activities (e.g., new digging to source water)
Agriculture-HeritageP, MSRGB/grey levelHeritage sites or in their proximityNew features related to agriculture (e.g., canals or infrastructure) or other modern development activities (e.g., industrial site or digging to source materials for construction)Depending on the precise location and distance, the impact can be from potential risk to damage to heritage sites
NDVIHeritage sites or in their proximityNew, regularly shaped (squared/rectangular) vegetation patternExpanding crop fields that potentially or already encroach on heritage sites
SARAmplitude/radar backscatterSprings and
cropfields
New, bright spots (either nearly circular or irregularly shaped)
Mound-shaped greyish pattern with bright boundaries
Farming infrastructure (e.g., groundwater pumping system or silos)
Digging holes (e.g., water sourcing or looting)
Earth removal and soil accumulation after digging
Regular grid of bright linesNew agricultural activities
If superimposed onto or crossing former land lot boundaries/canals, it is associated with the sealing/destruction of traditional irrigation/farming
Persistent dark thick lines crossing the landscapeDisturbance by heavy vehicles and cars related to agricultural/business activities
Climate-AgricultureP, MSRGB/grey levelLandscapeYellow to brownish/grey plumes and/or wide cloudDust storm(s) imaged during its occurrence
CropfieldsSudden change in reflectance and tone (e.g., from green to brownish/reddish)Accumulation of dust at surface due to recent storms
Decreased green tone to complete change to brown/yellowish tonesLand cover transition from vegetated/cropfield to bare soil to desertified area
NDVICropfieldsDecreased vegetation to persistent loss of vegetation patternLand cover transition from vegetated/cropfield to bare soil to desertified area
SARInSAR coherenceCropfields/
landscape
Oriented patterns of decorrelationOccurrence of meteorological event (e.g., dust storm, wind storm, heavy rain, or surface flooding)
Disclaimer/Publisher’s Note: The statements, opinions and data contained in all publications are solely those of the individual author(s) and contributor(s) and not of MDPI and/or the editor(s). MDPI and/or the editor(s) disclaim responsibility for any injury to people or property resulting from any ideas, methods, instructions or products referred to in the content.

