
Climate Change-Driven Spatiotemporal Dynamics of Landscape Ecological in the Qinling Mountains (1980–2023)


Abstract
1. Introduction
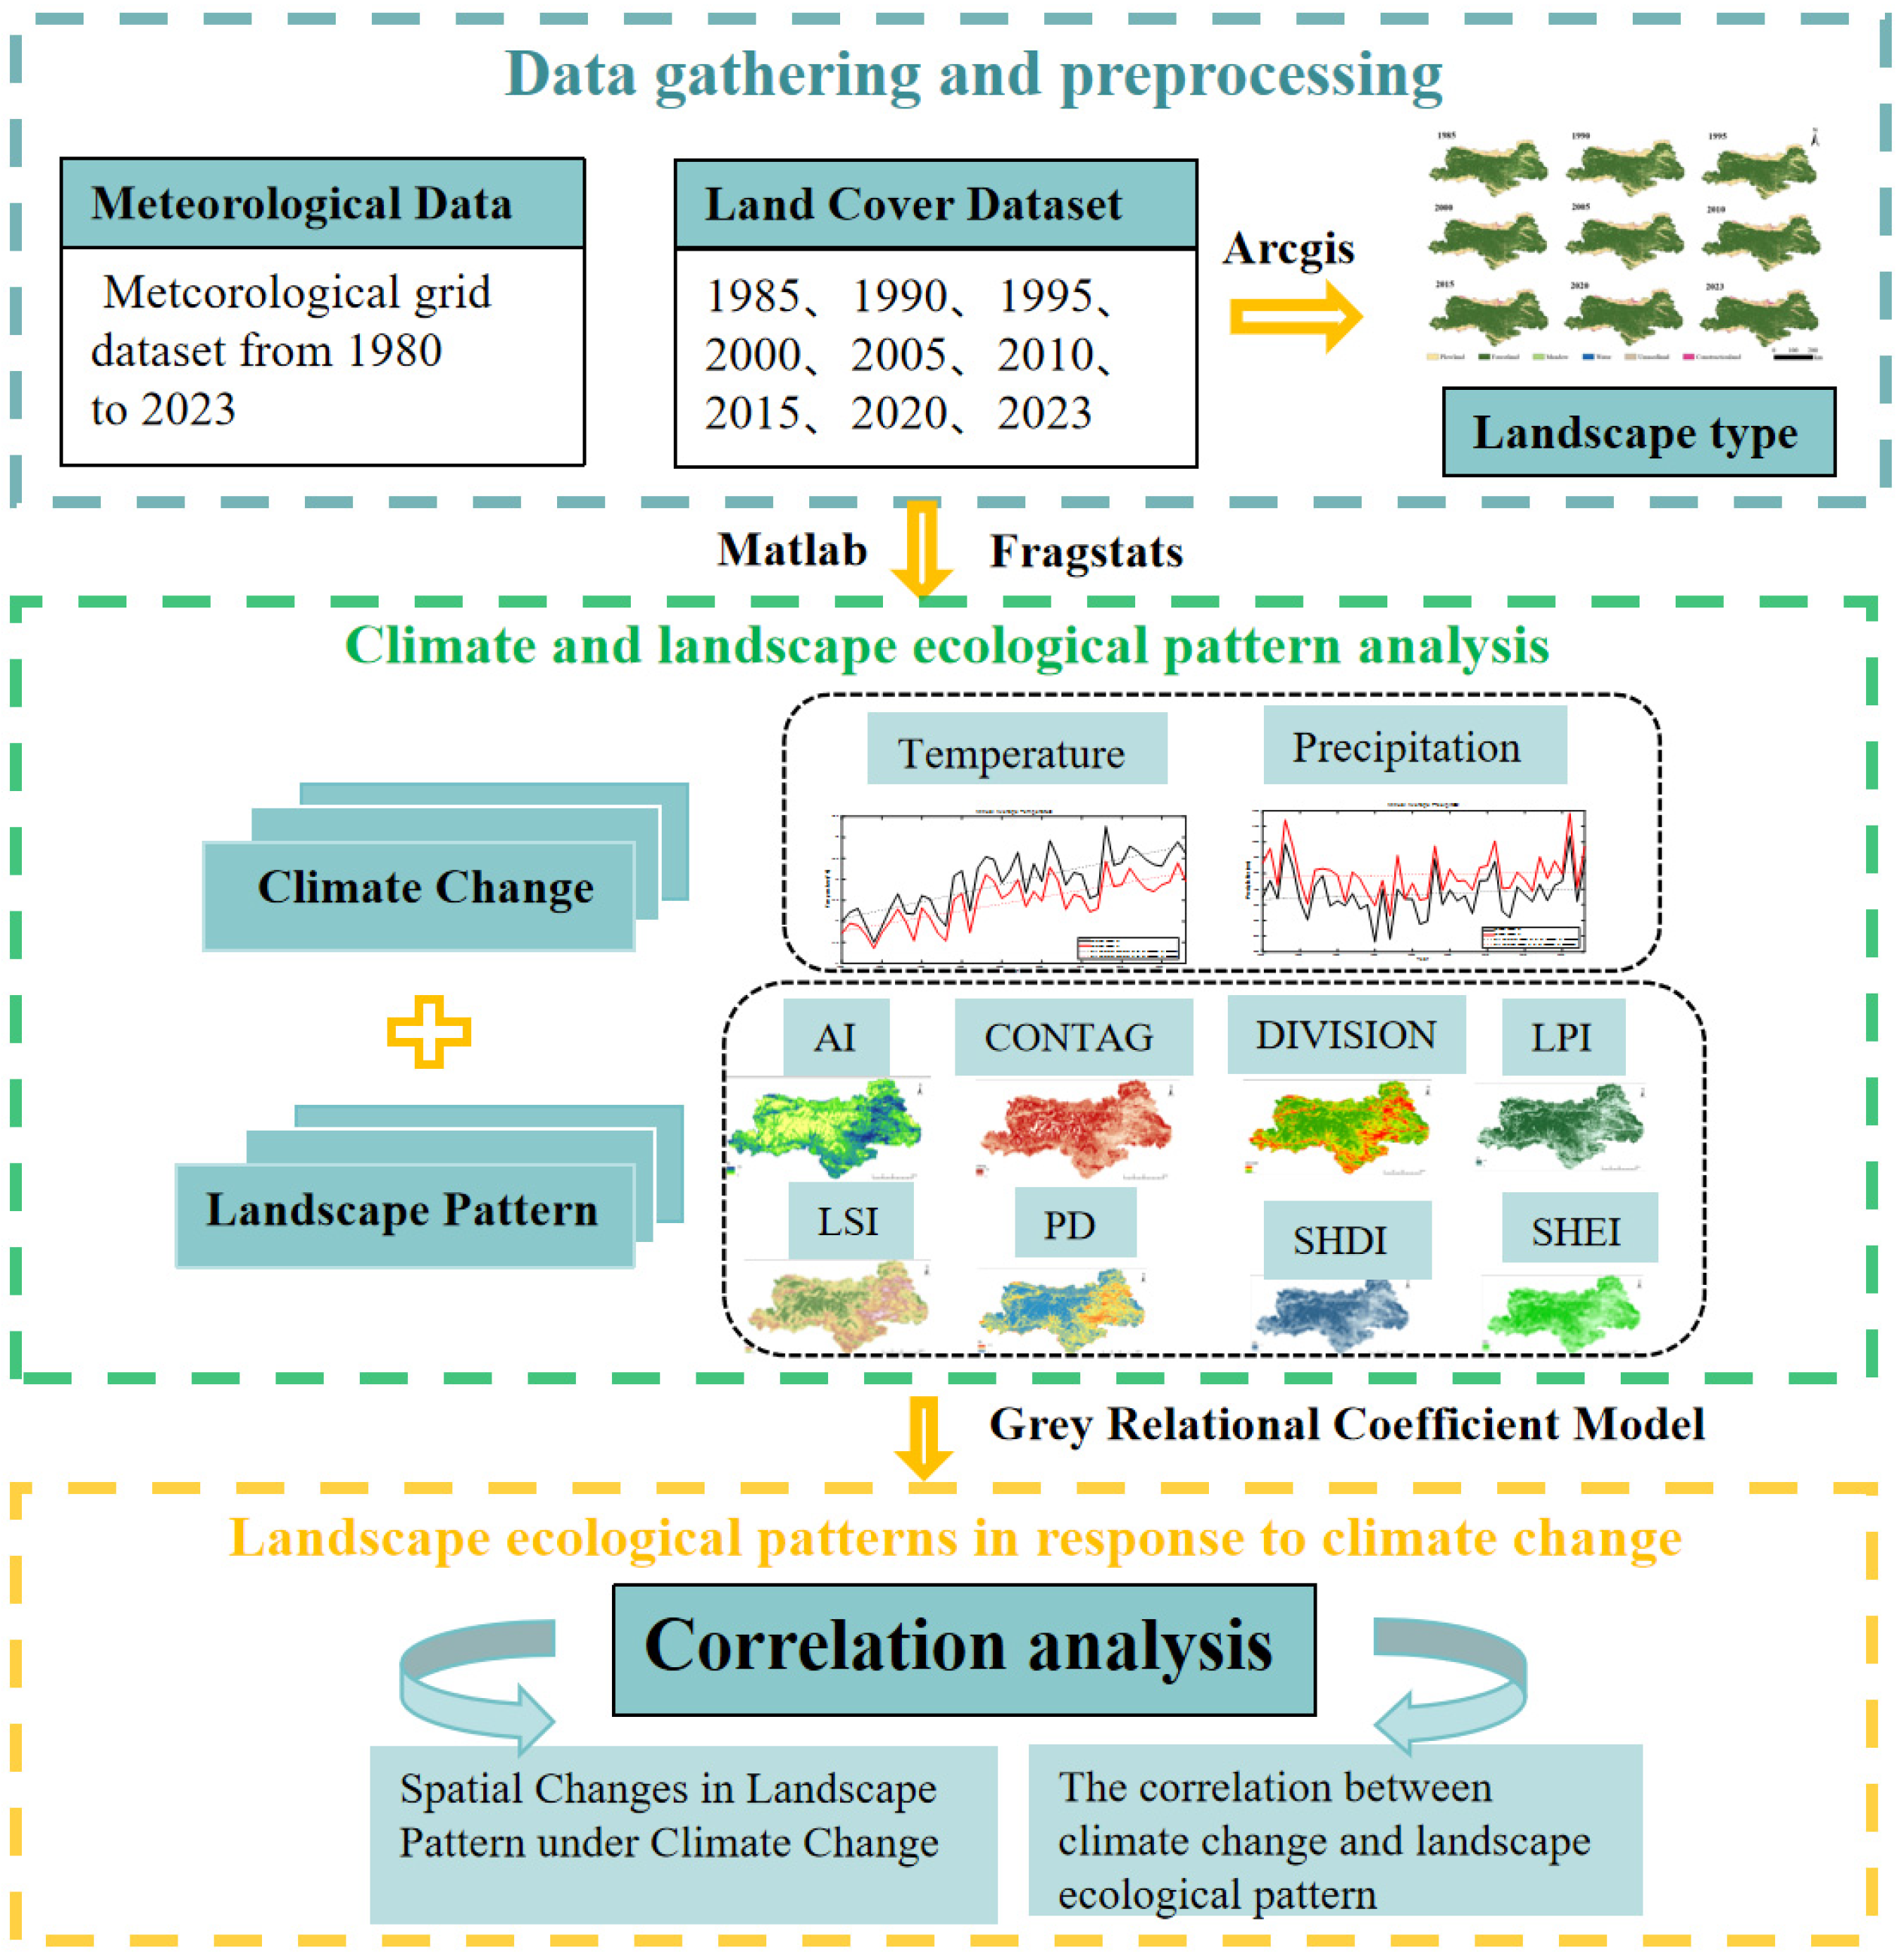
2. Methodology
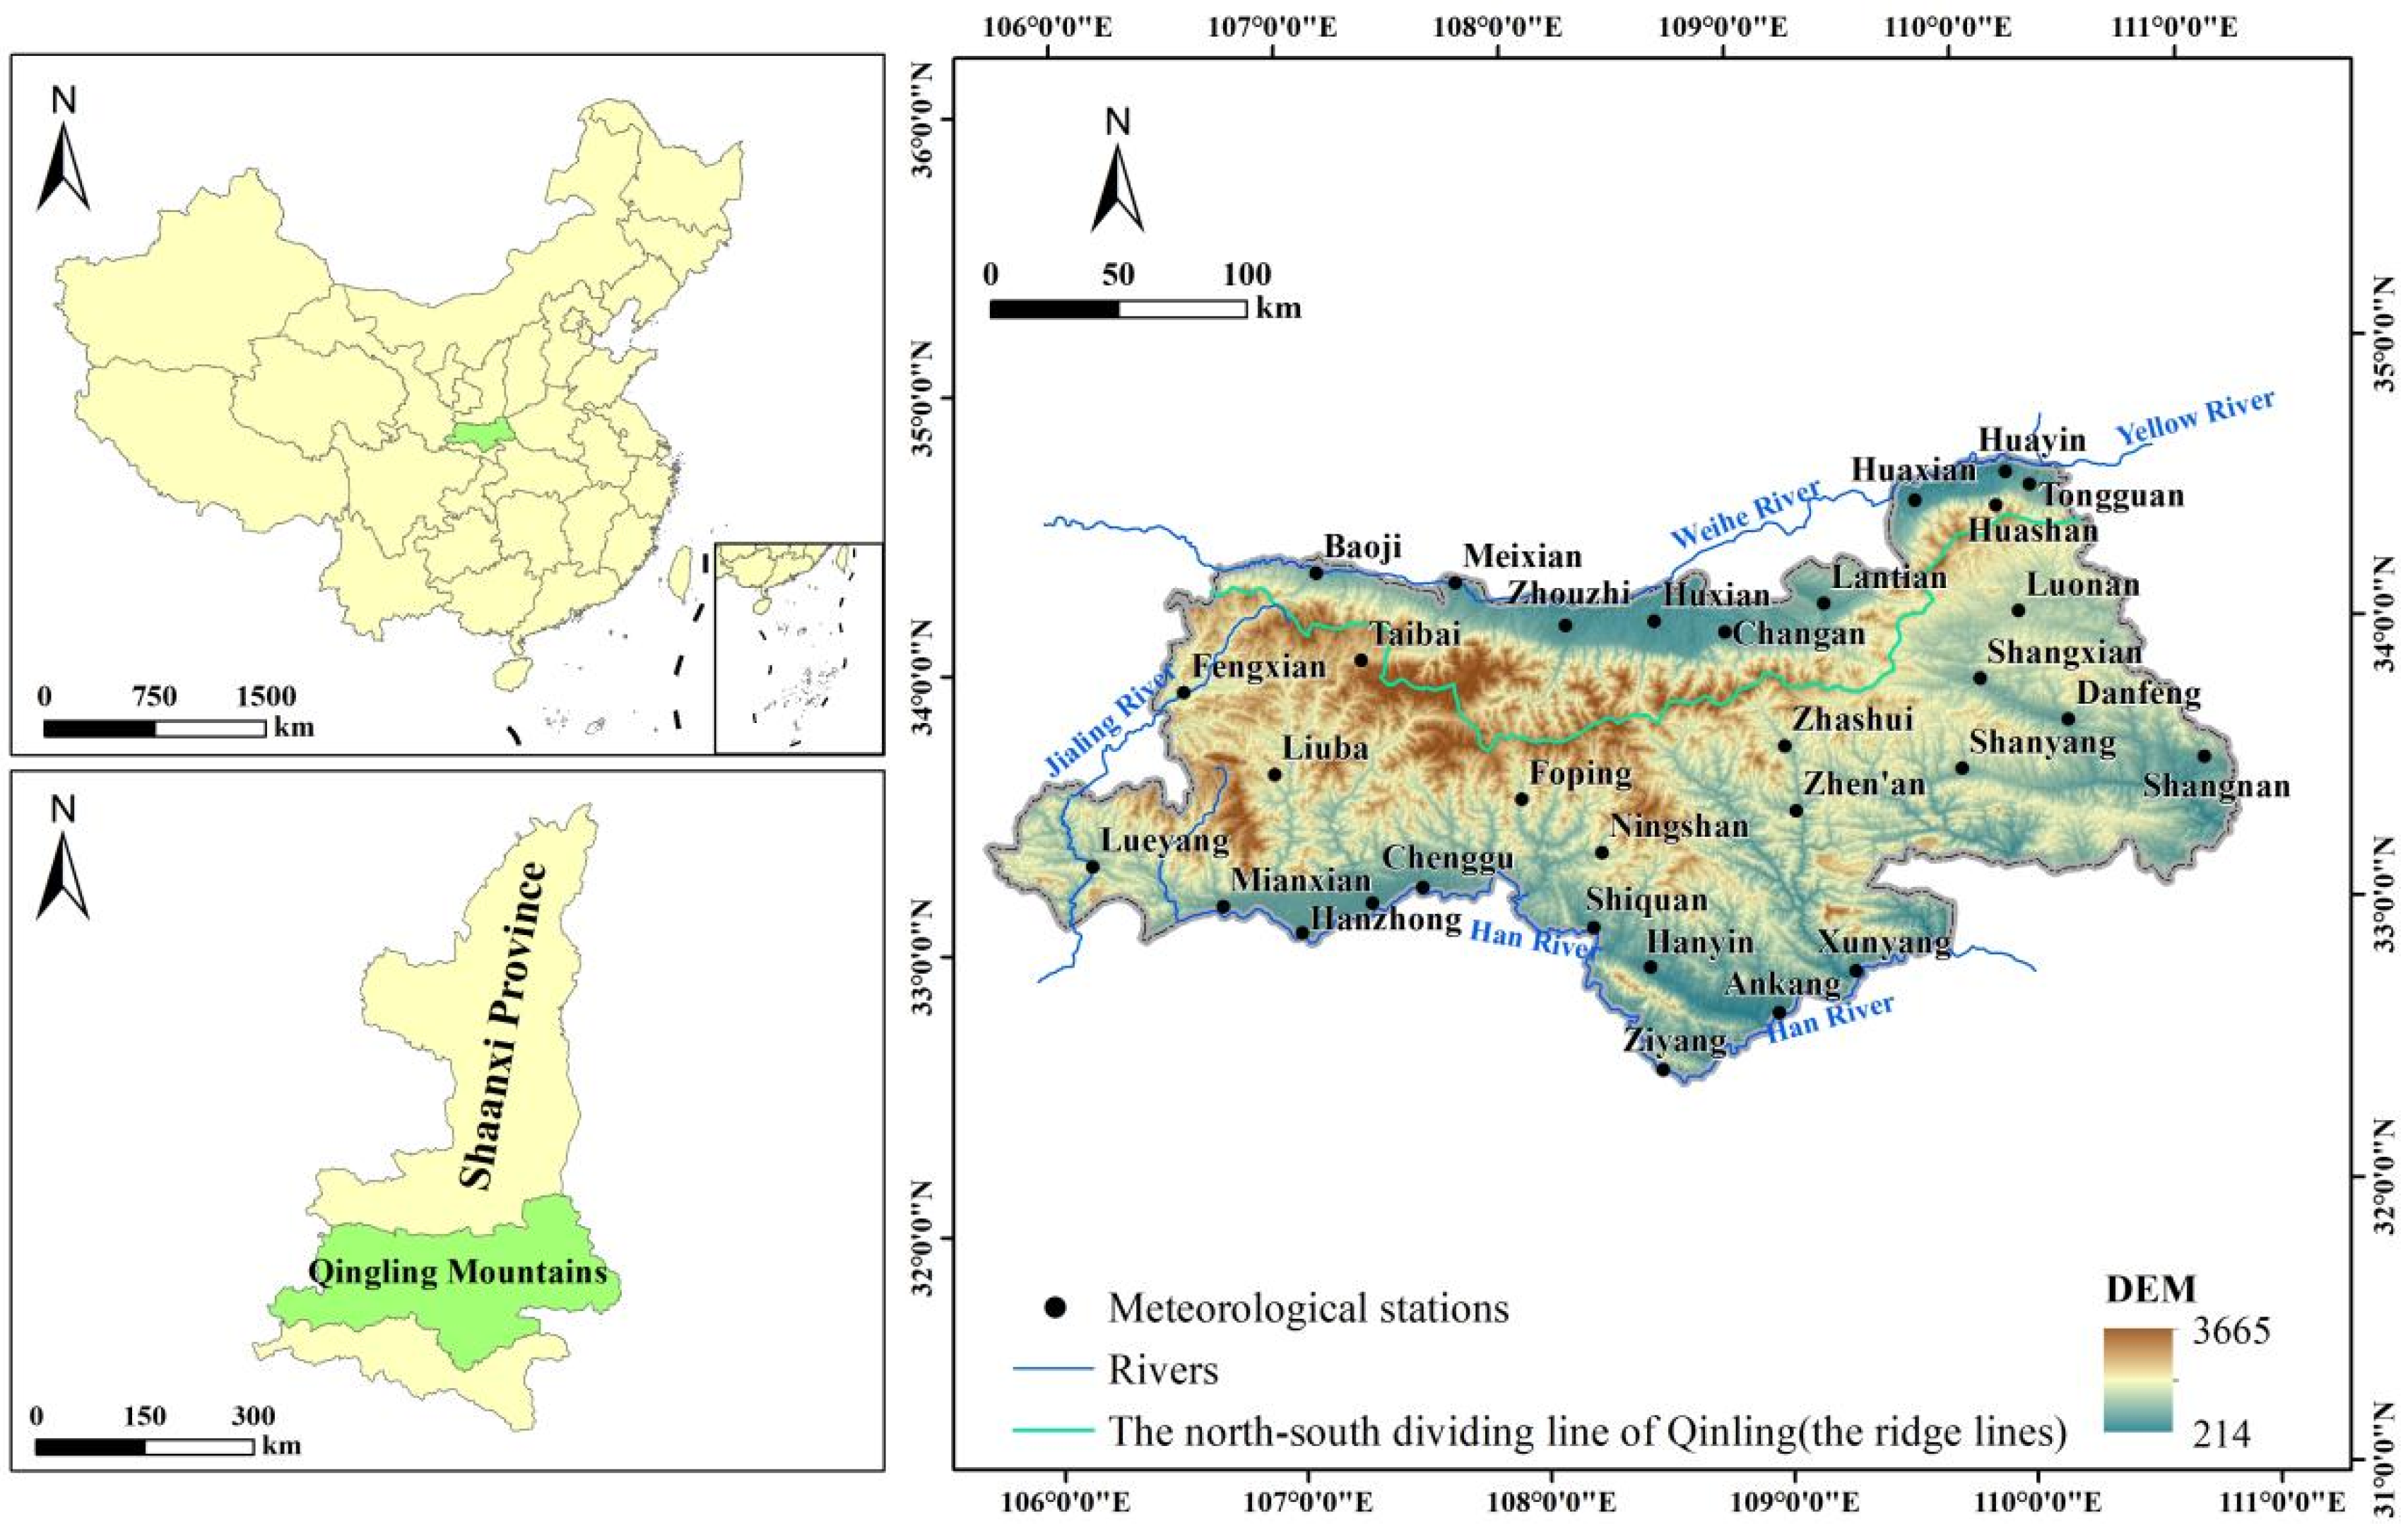
2.1. Study Area
2.2. Data Source
2.3. Methods
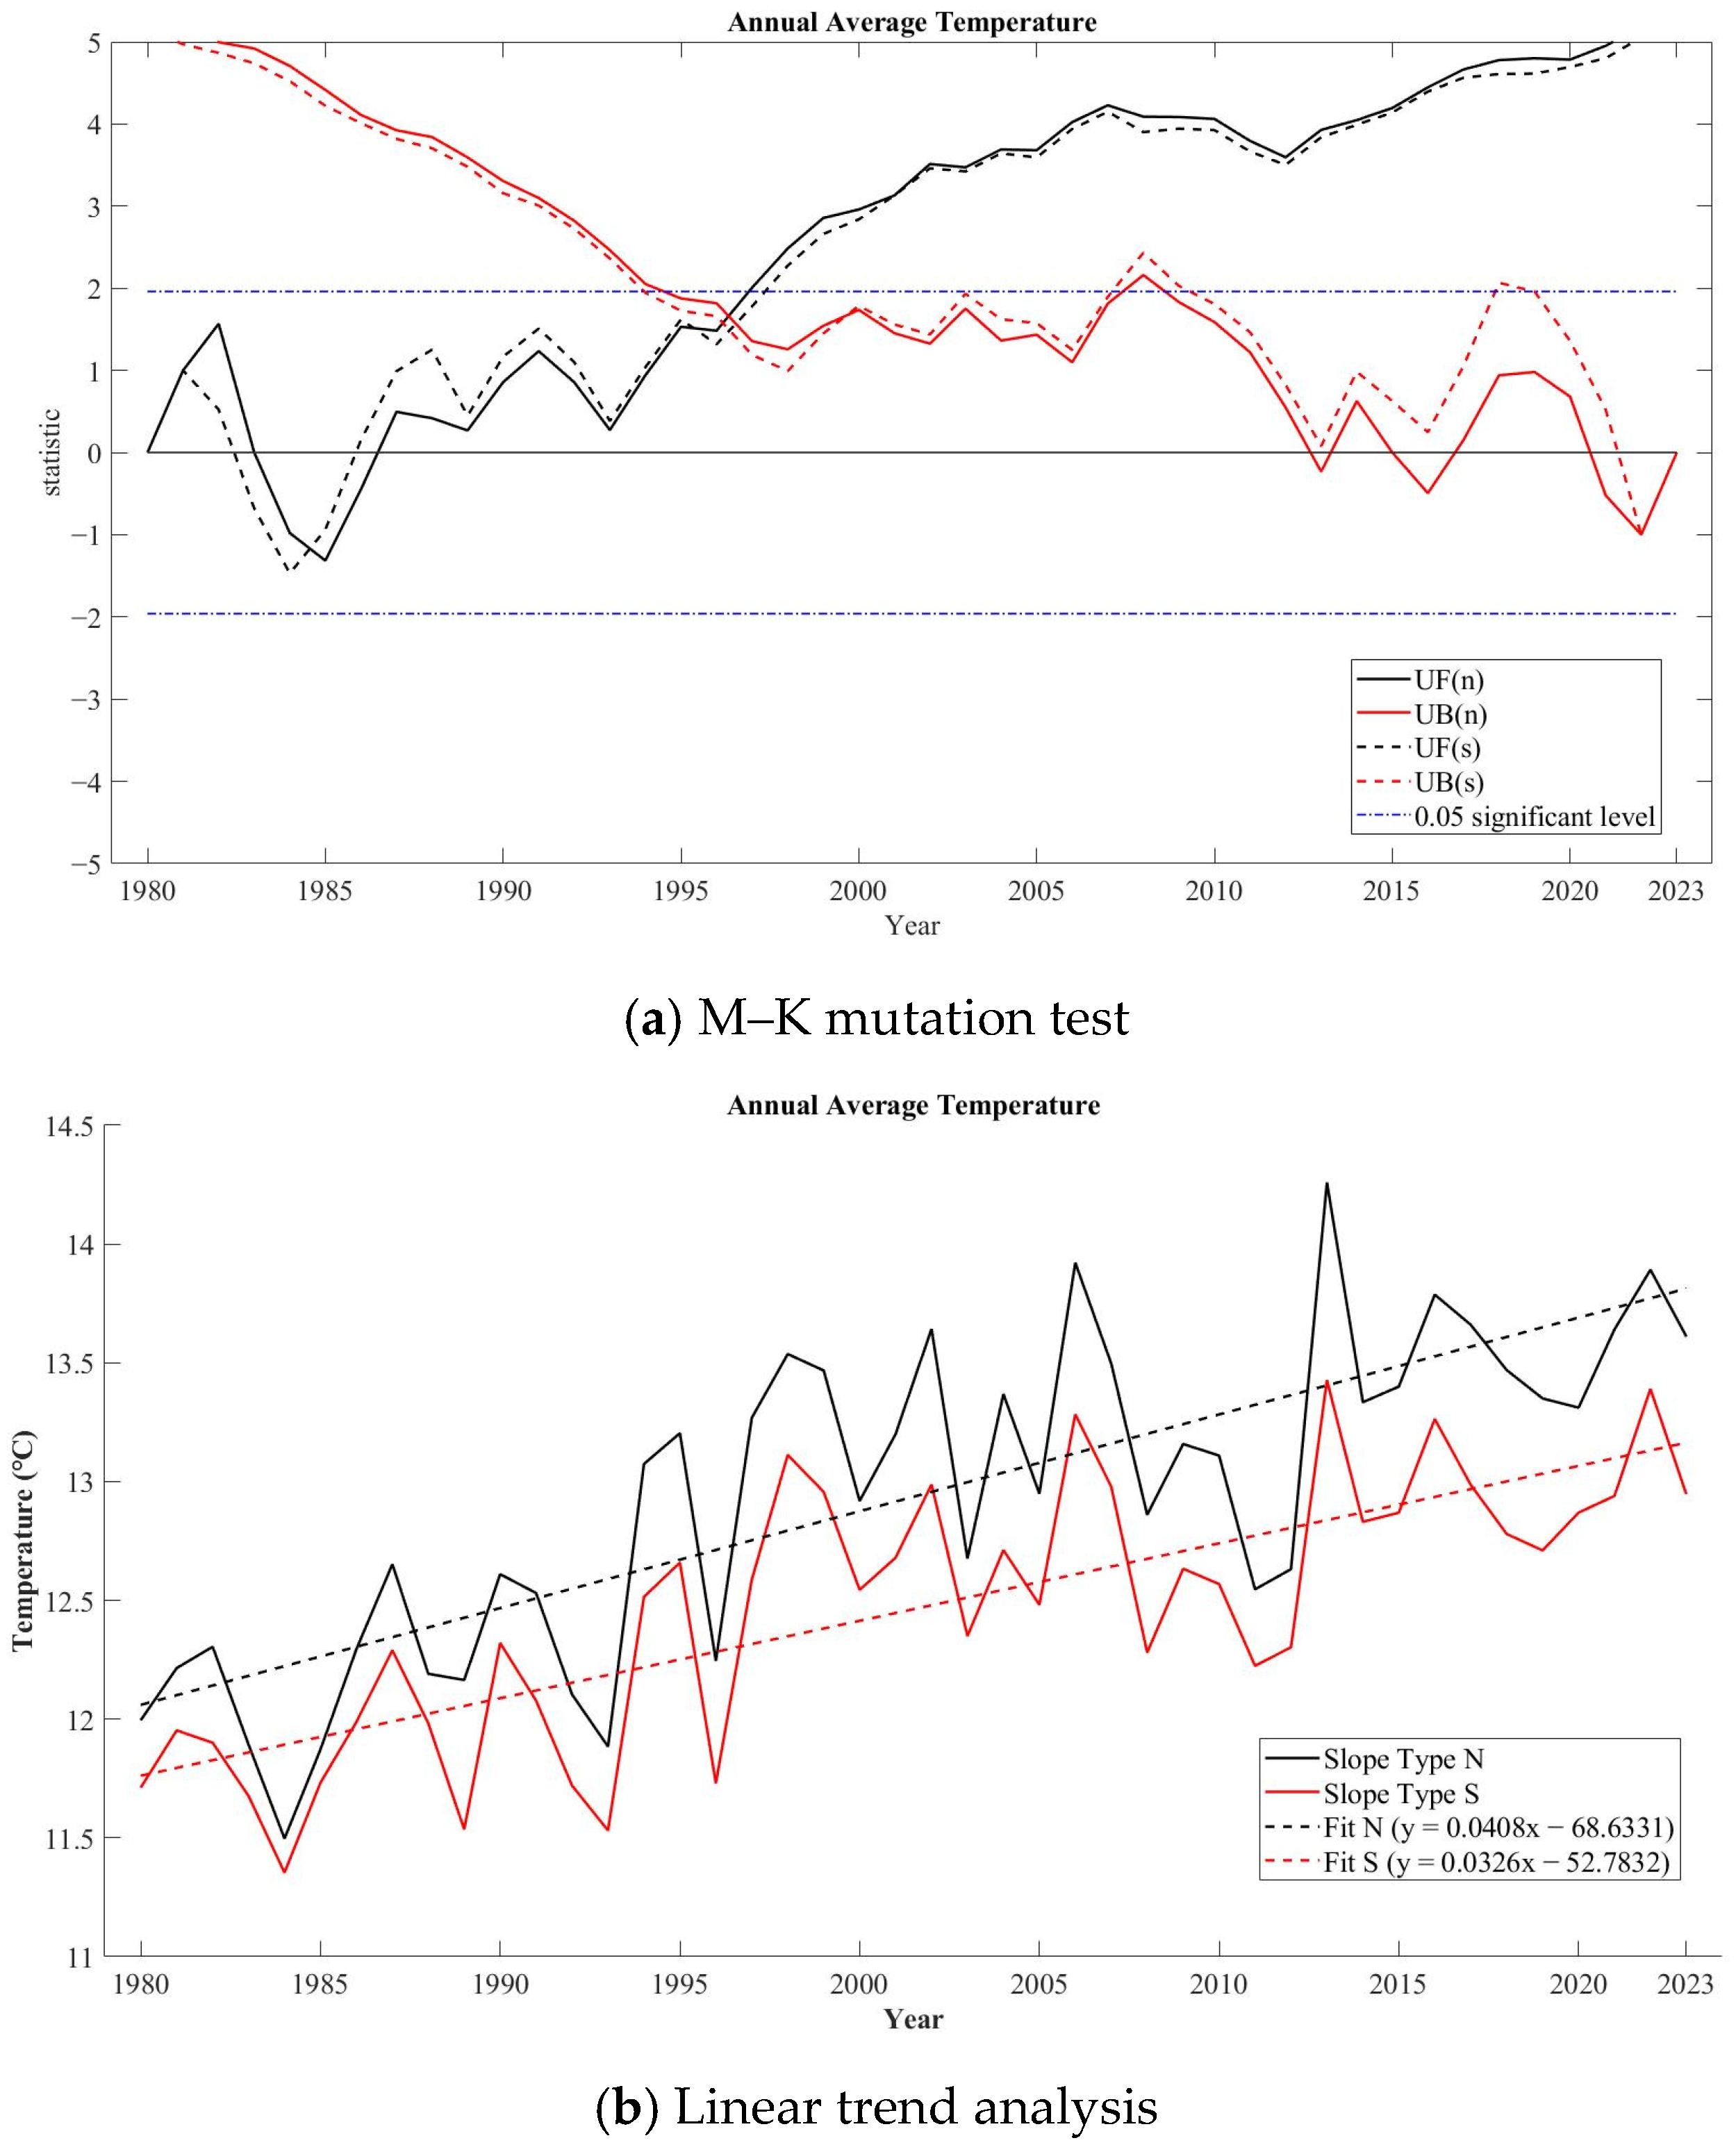
2.3.1. Analysis of Climate Change Characteristics
- (1)
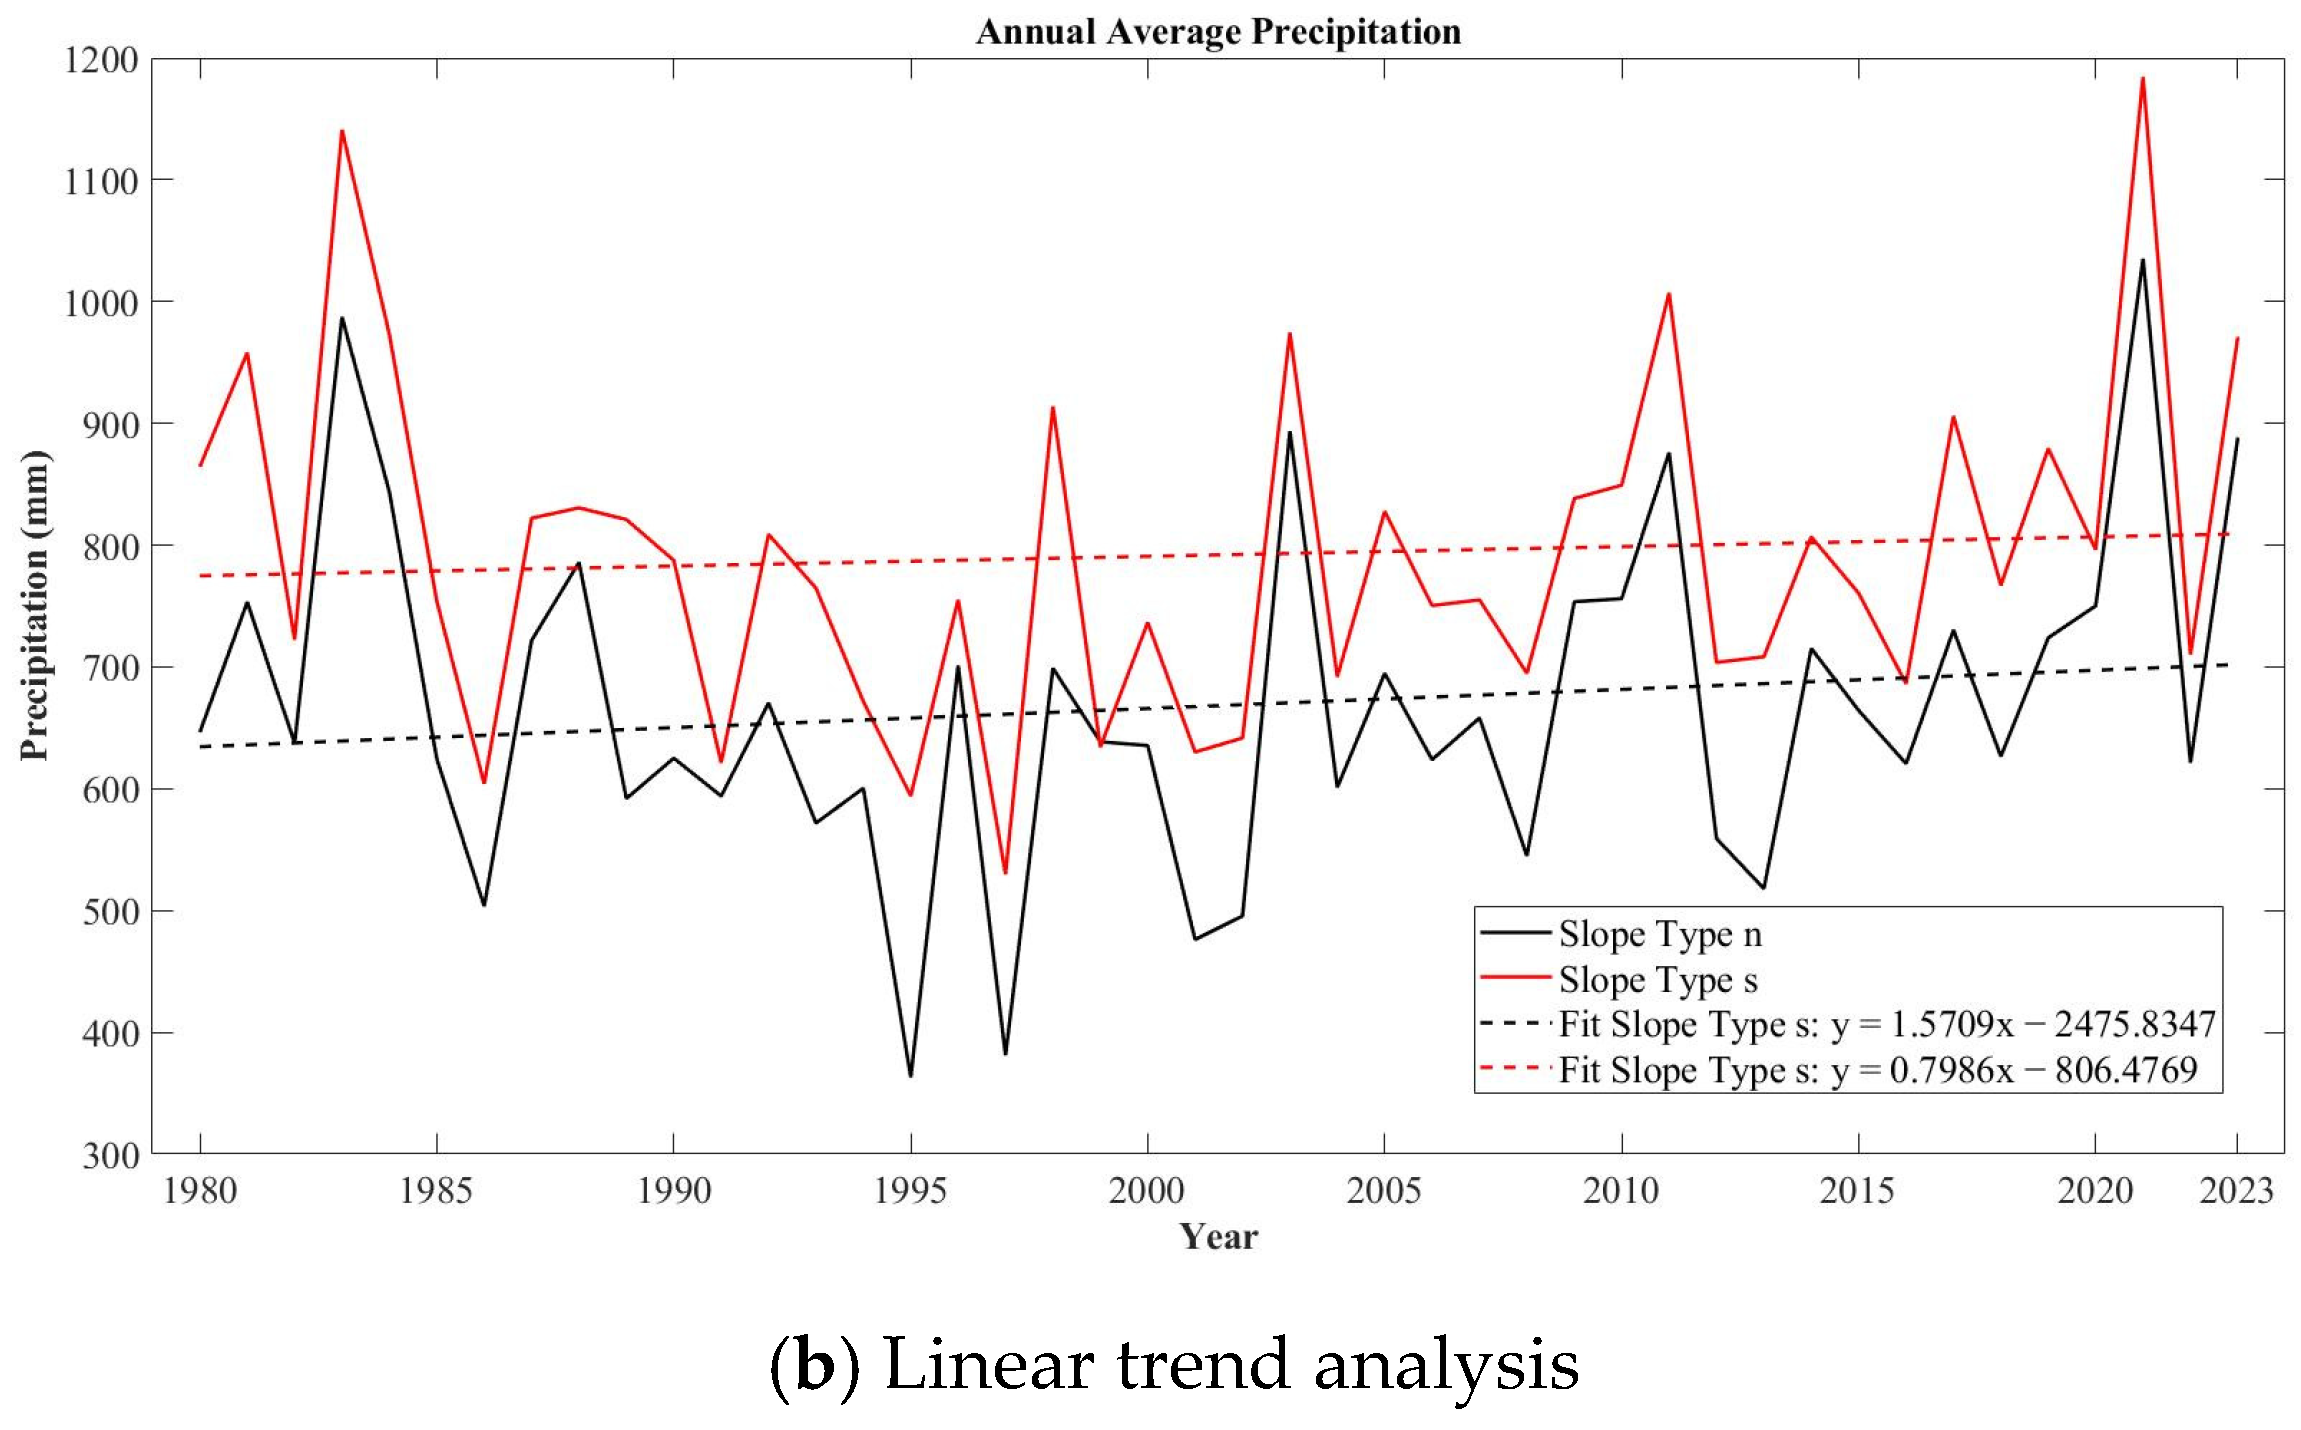
- Linear Trend Slope
- (2)
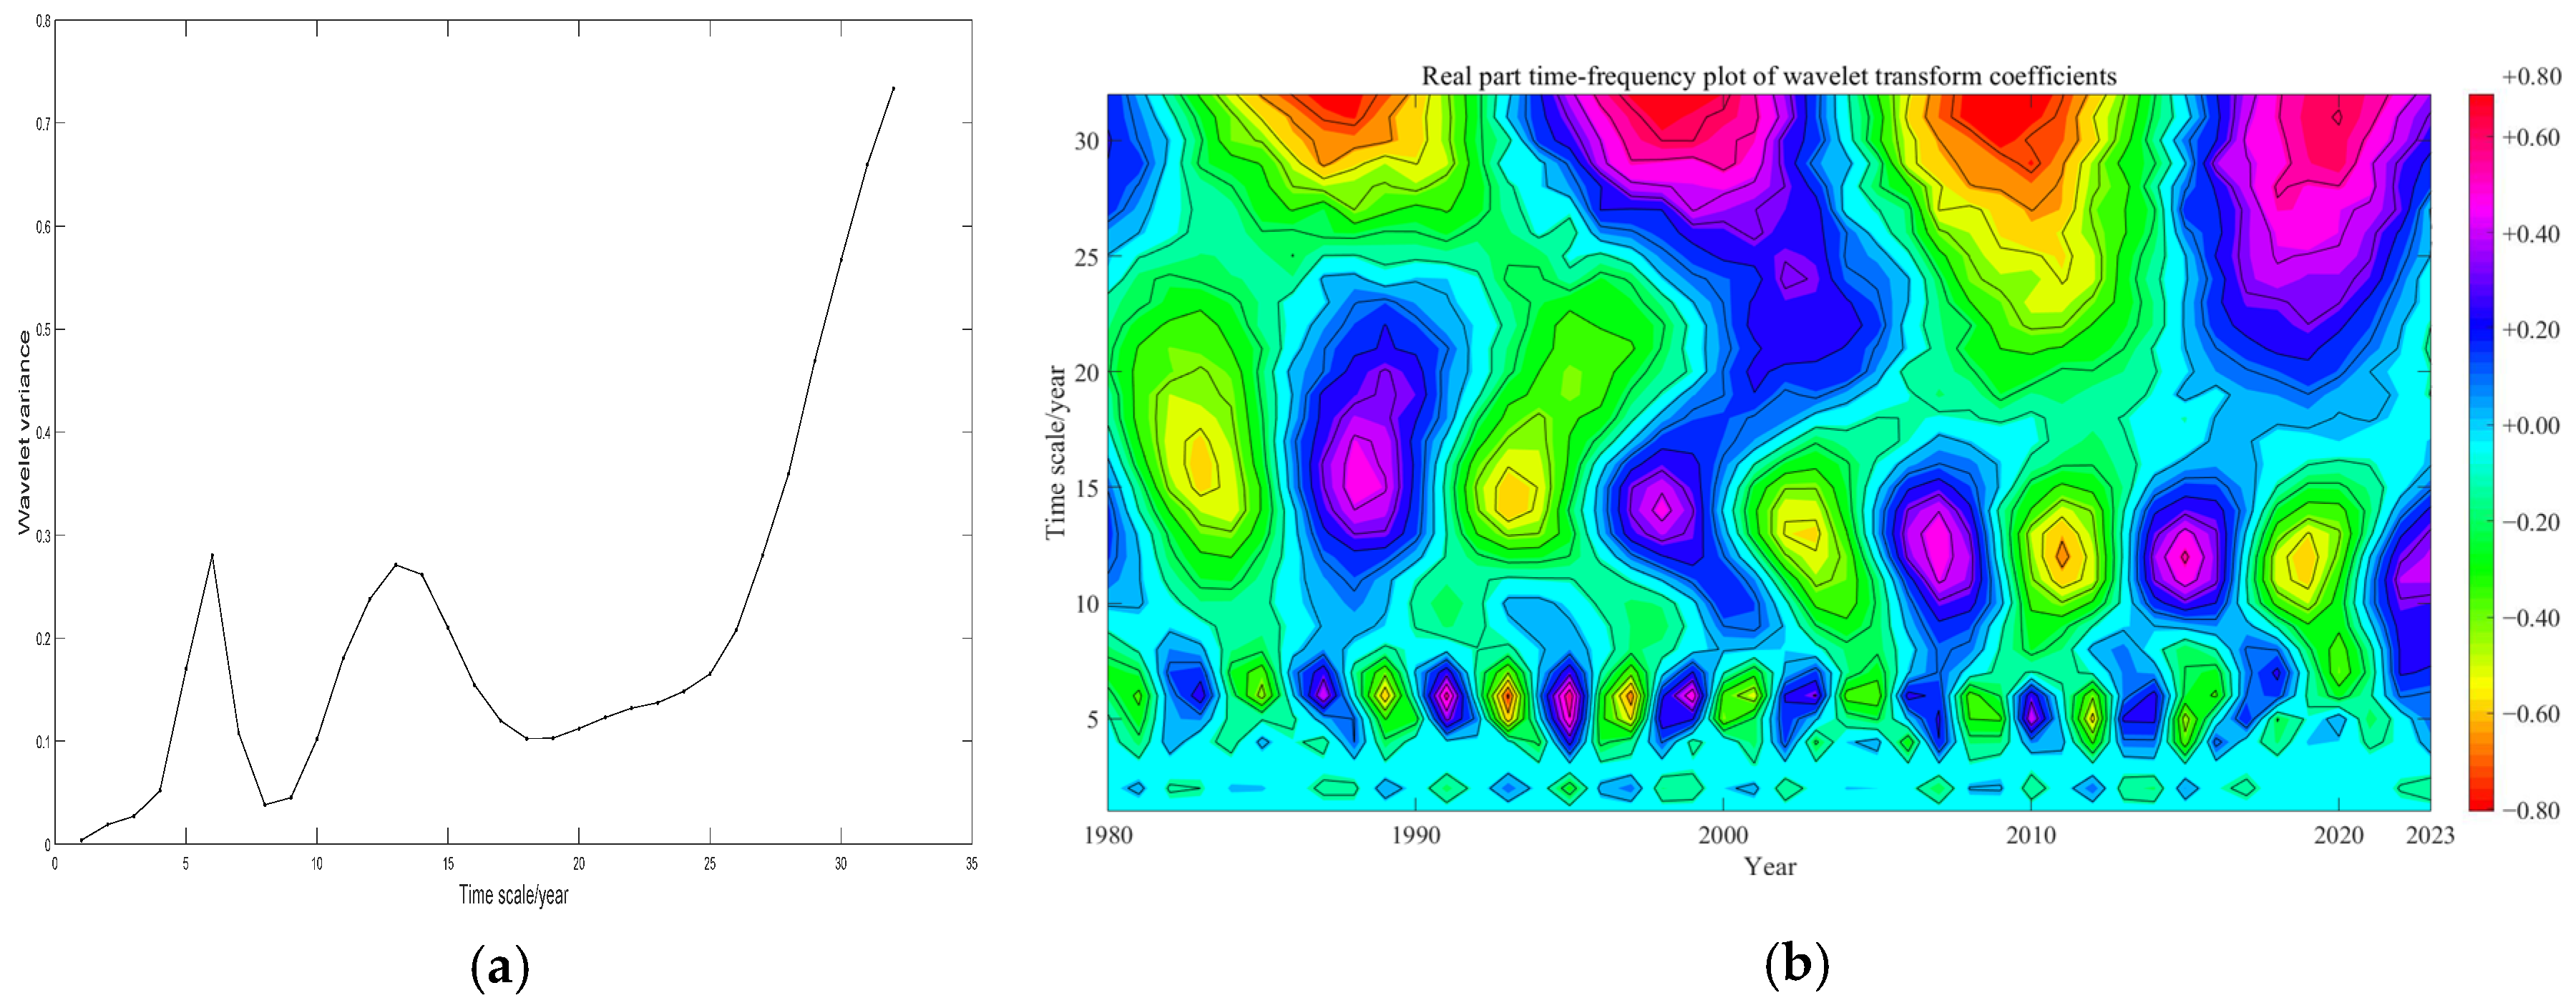
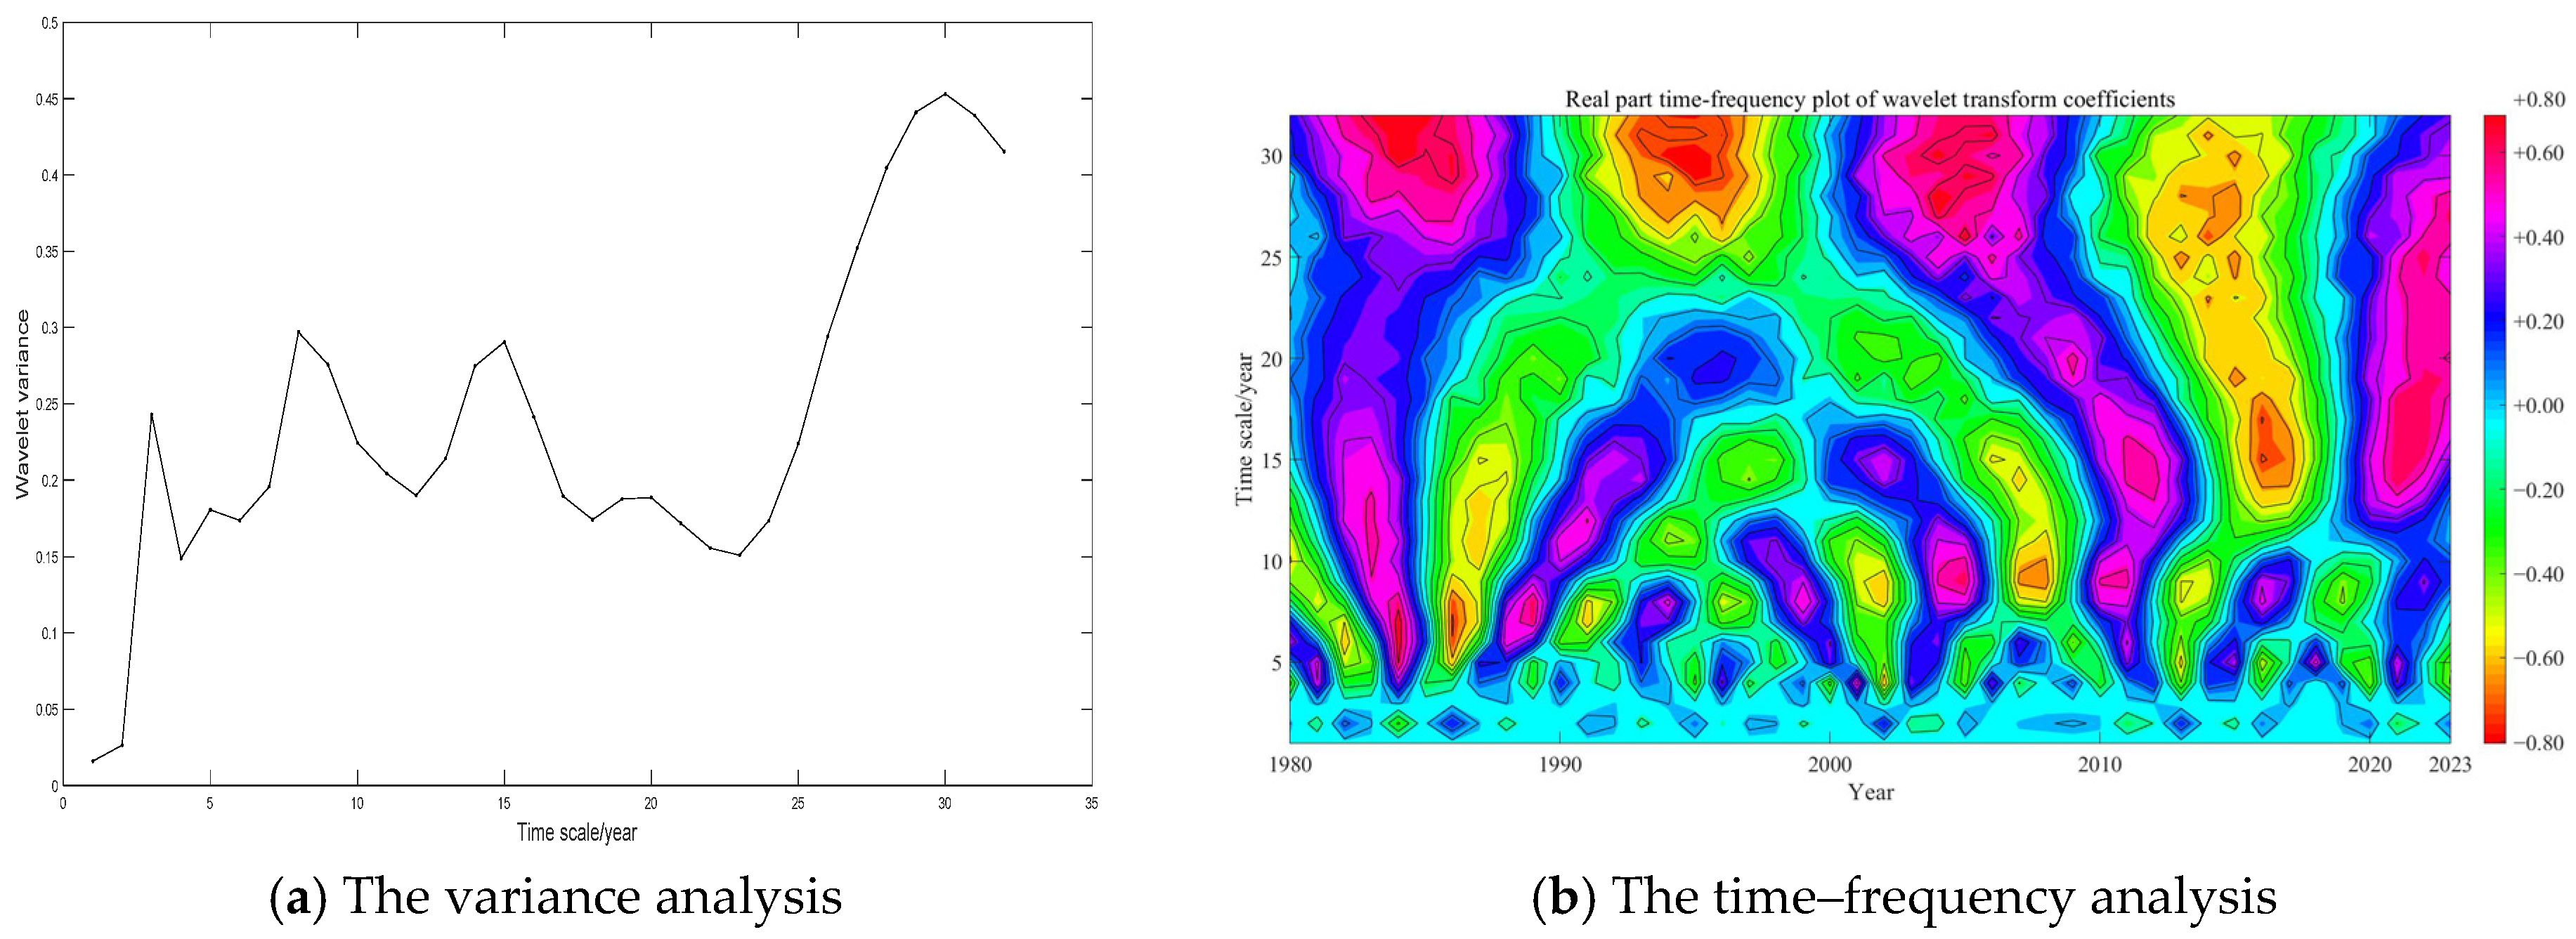
- Wavelet Analysis Method
- (3)
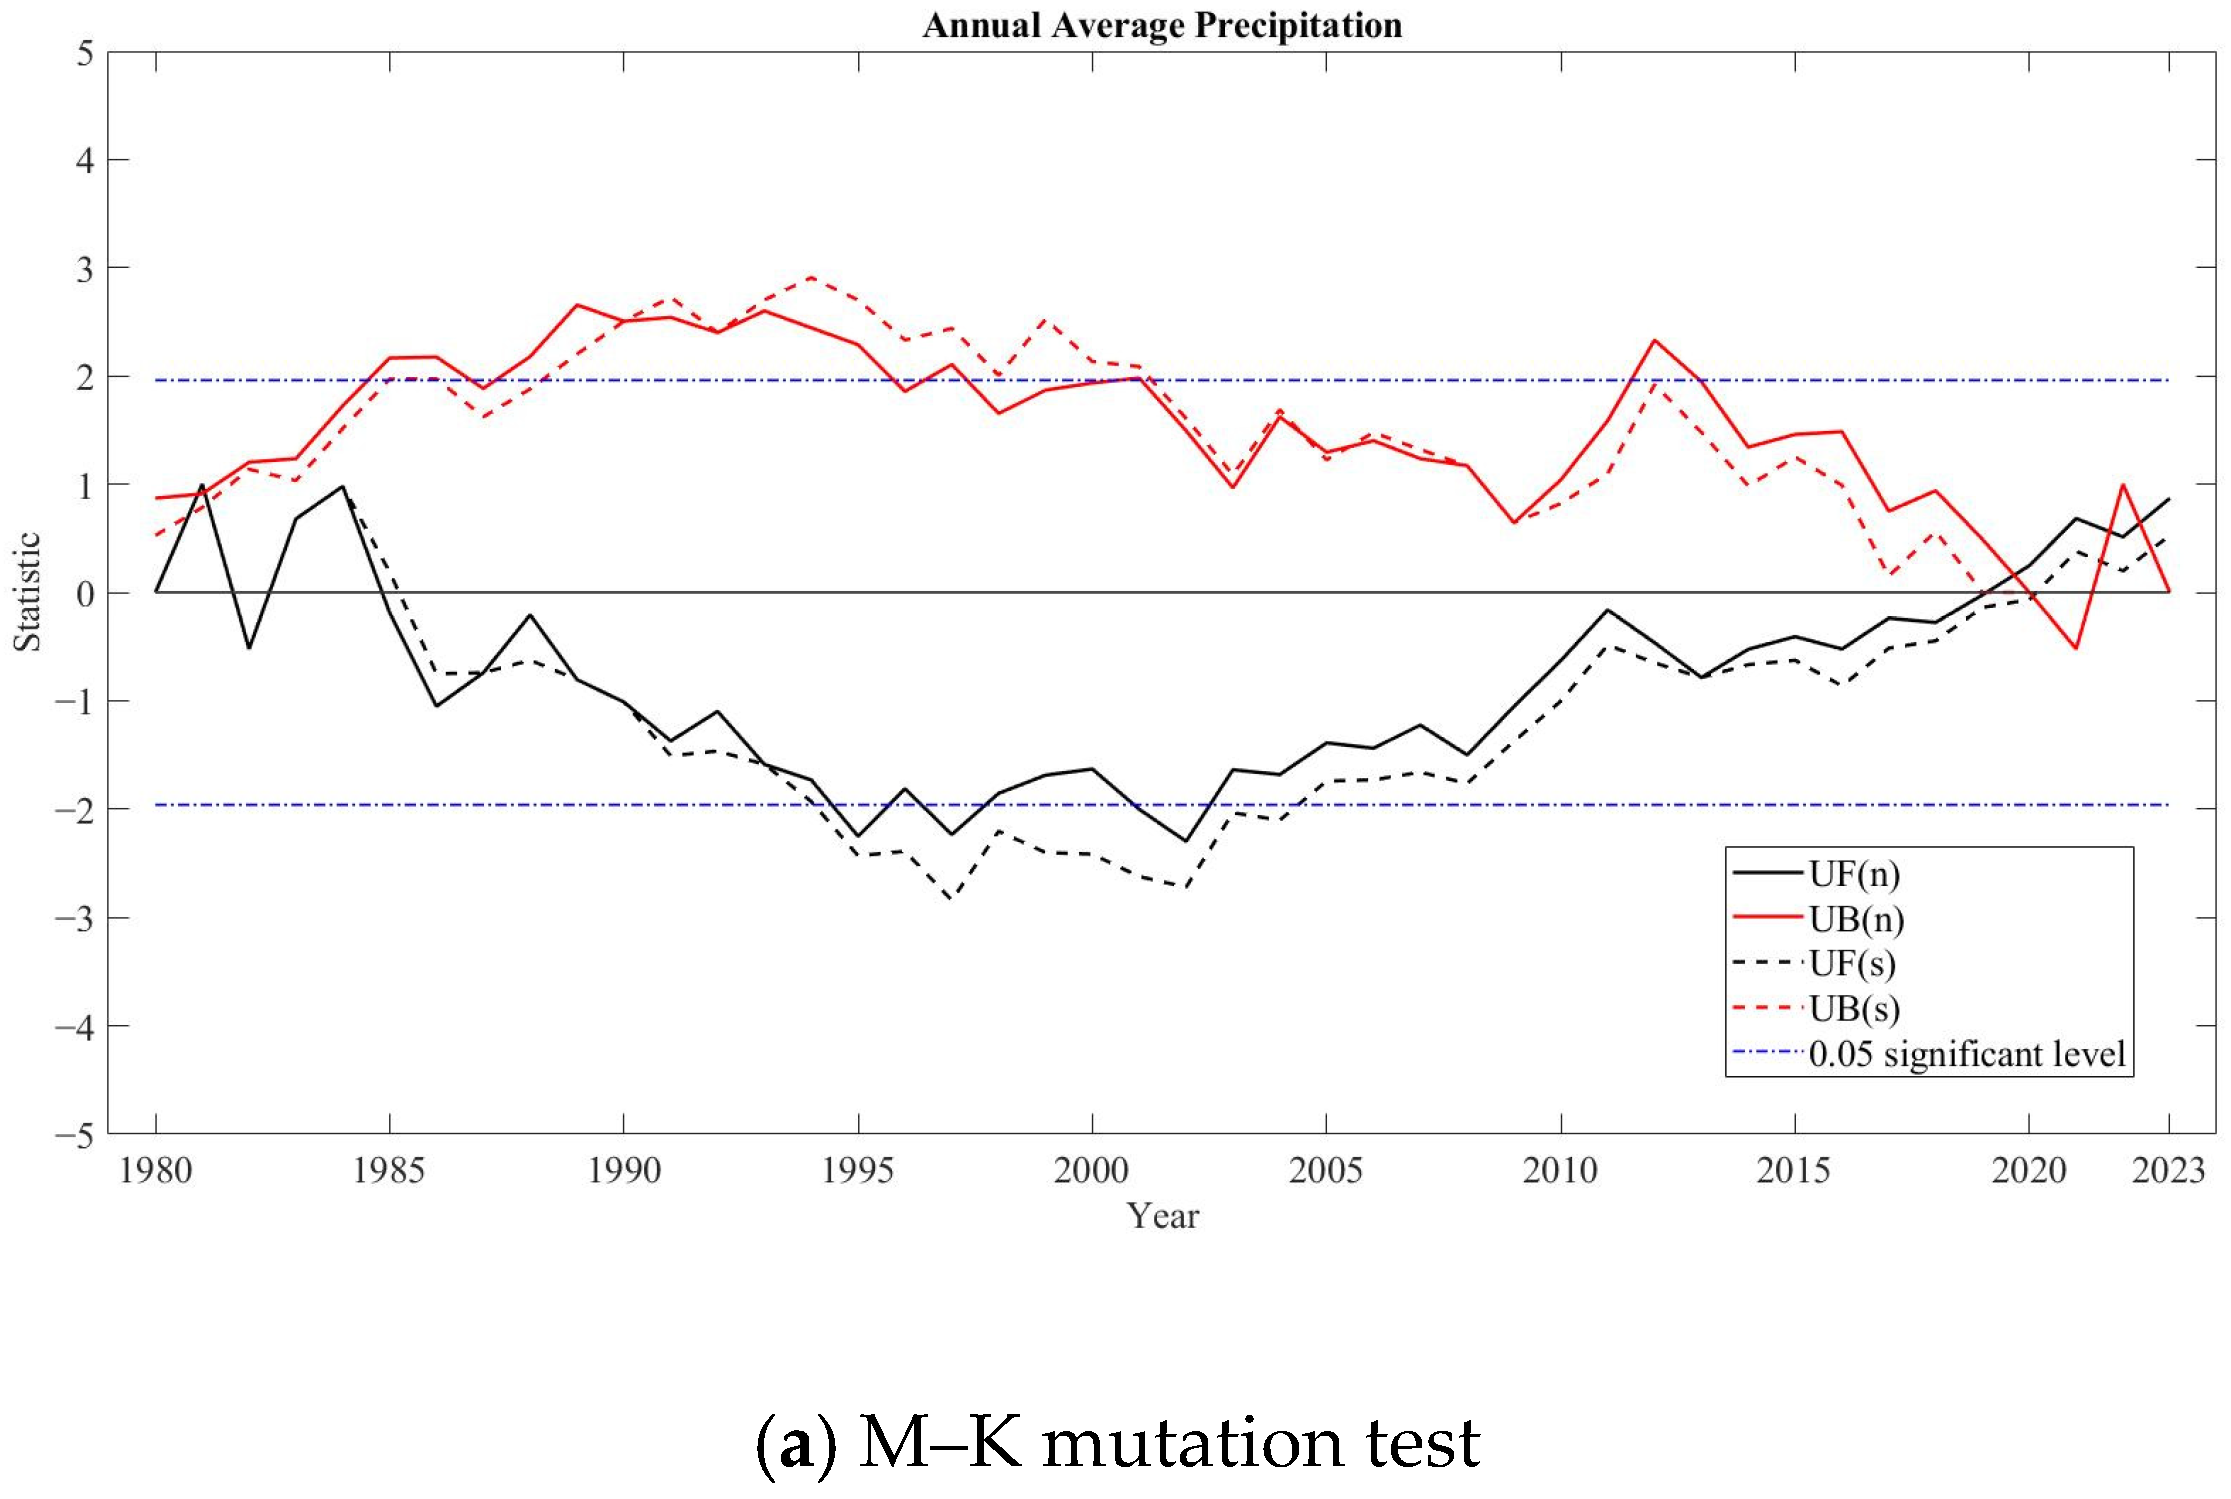
- Mann–Kendall Mutation Test
2.3.2. Analysis of Landscape Ecological Pattern
2.3.3. Interaction Analysis
3. Results
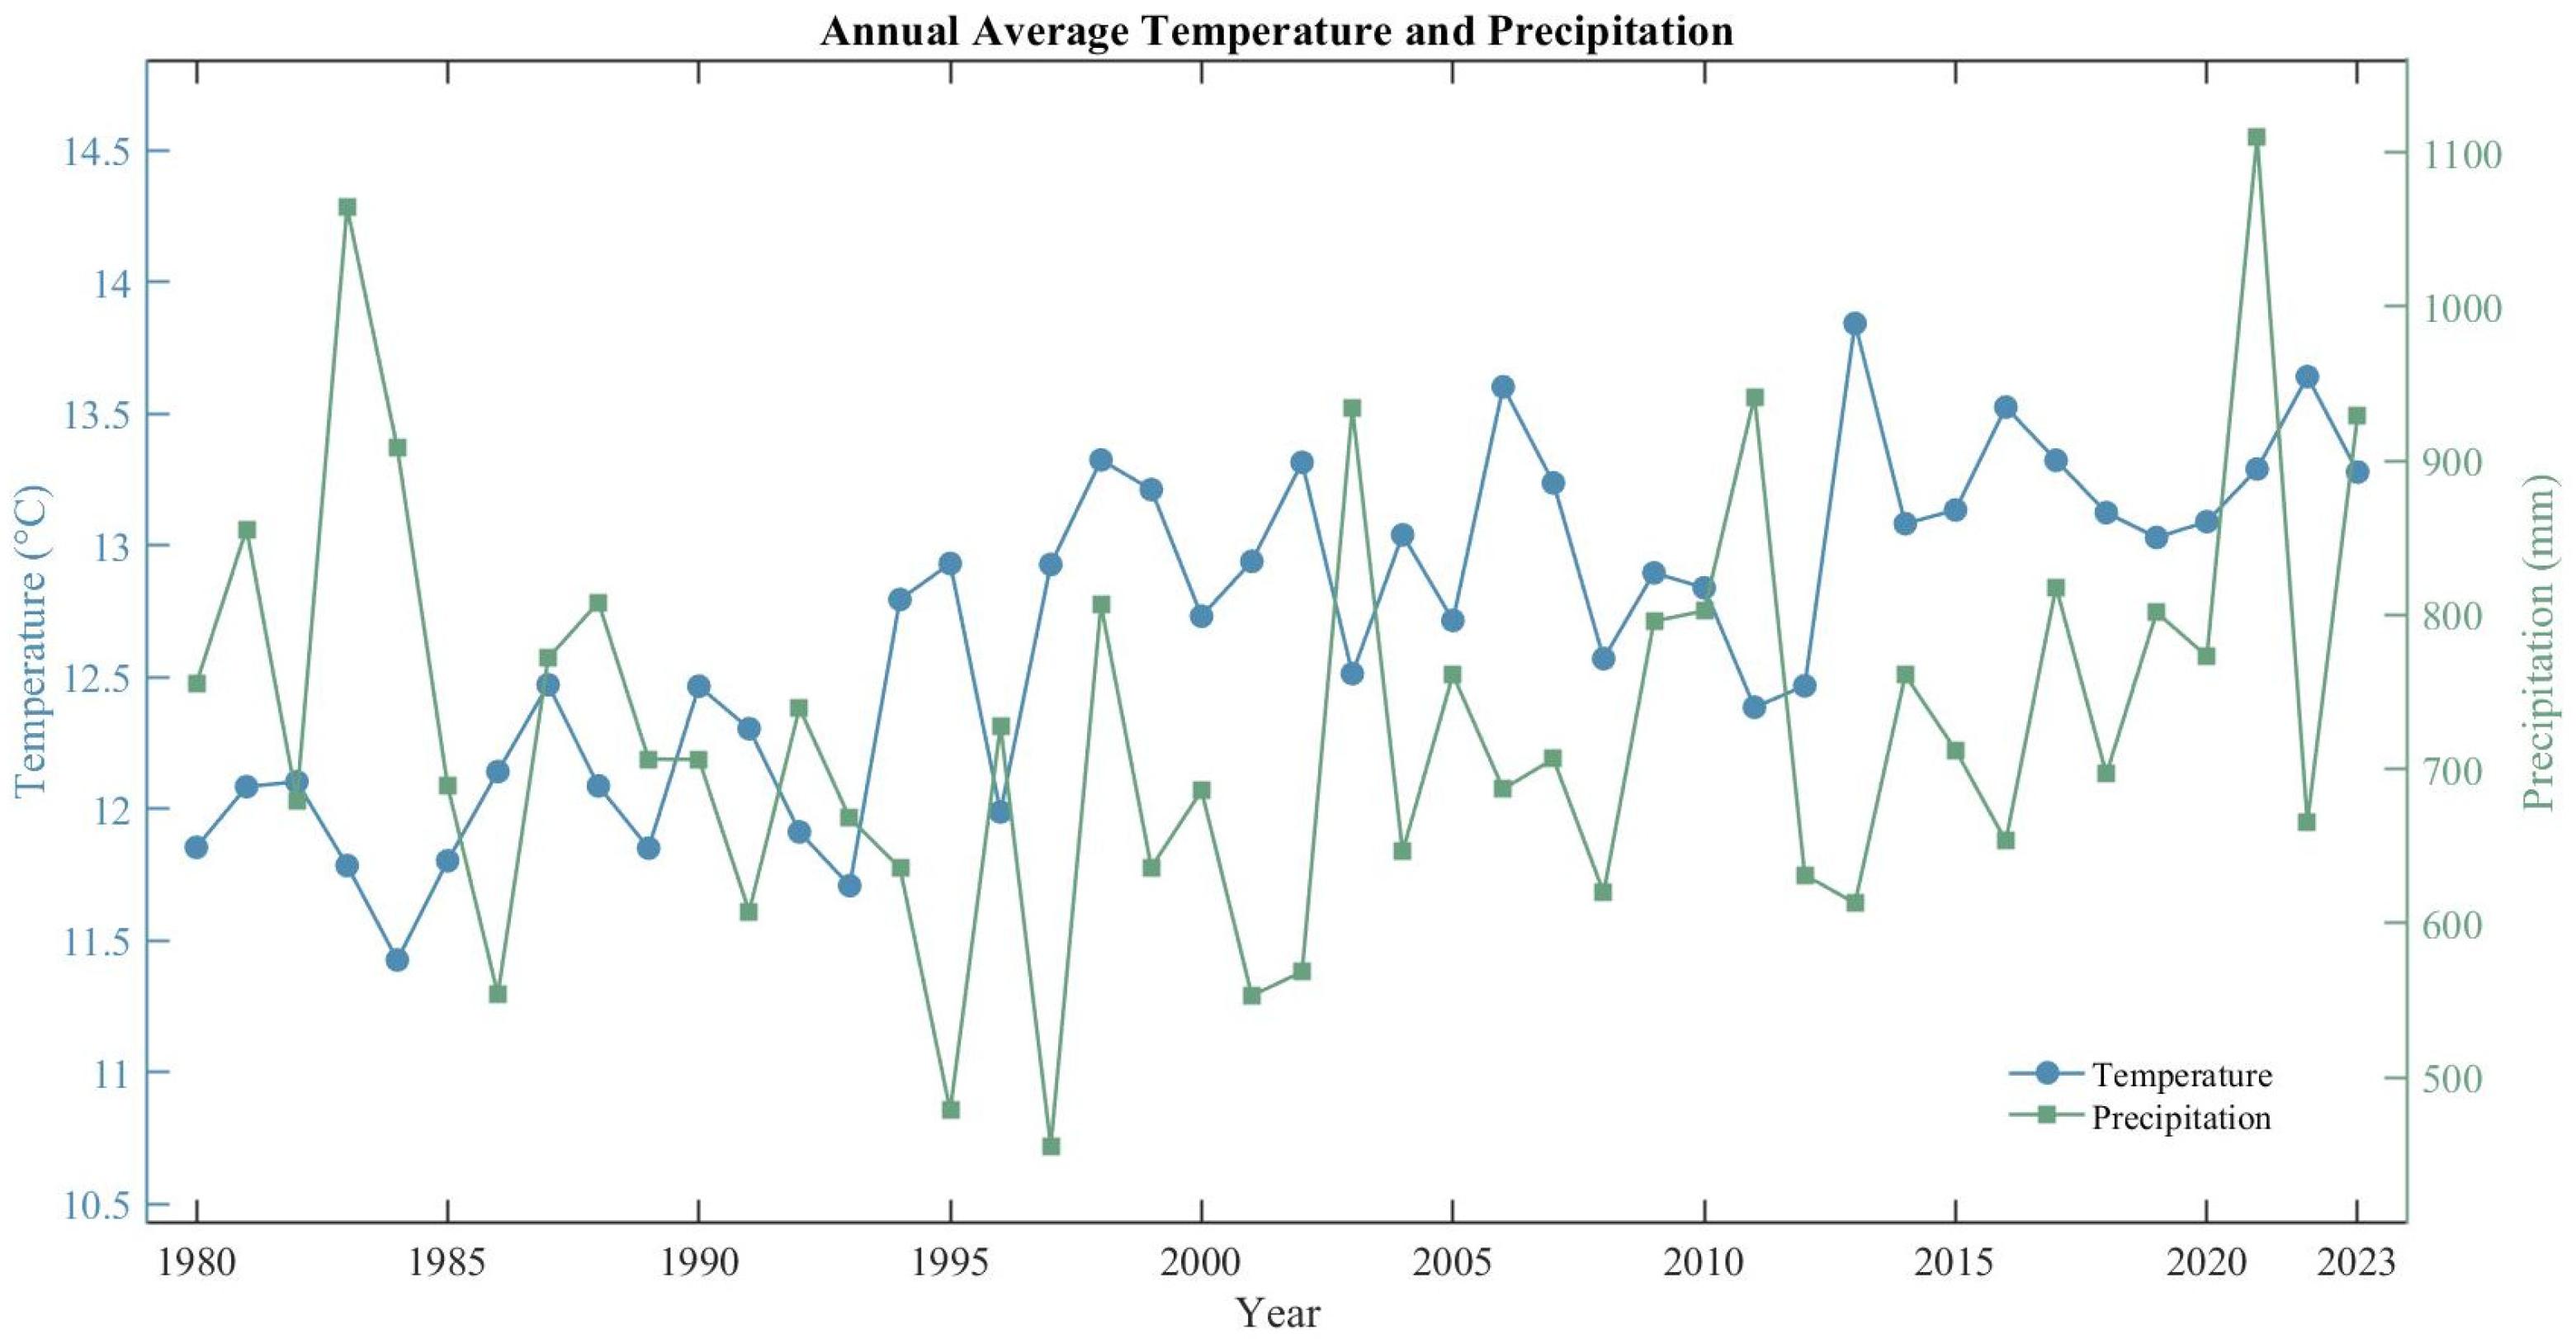
3.1. Characteristics of Climate Change in the Qinling Mountains
3.1.1. Temperature Variation
3.1.2. Precipitation Variation
3.2. Changes in Landscape Ecological Pattern in the Qinling Mountains
3.2.1. Land Use Type Variations
3.2.2. Changes in Landscape Ecological Pattern
3.3. Correlation Analysis Between Climate Change and Landscape Ecological Pattern
3.3.1. Spatial Changes in Landscape Patterns Under Climate Change
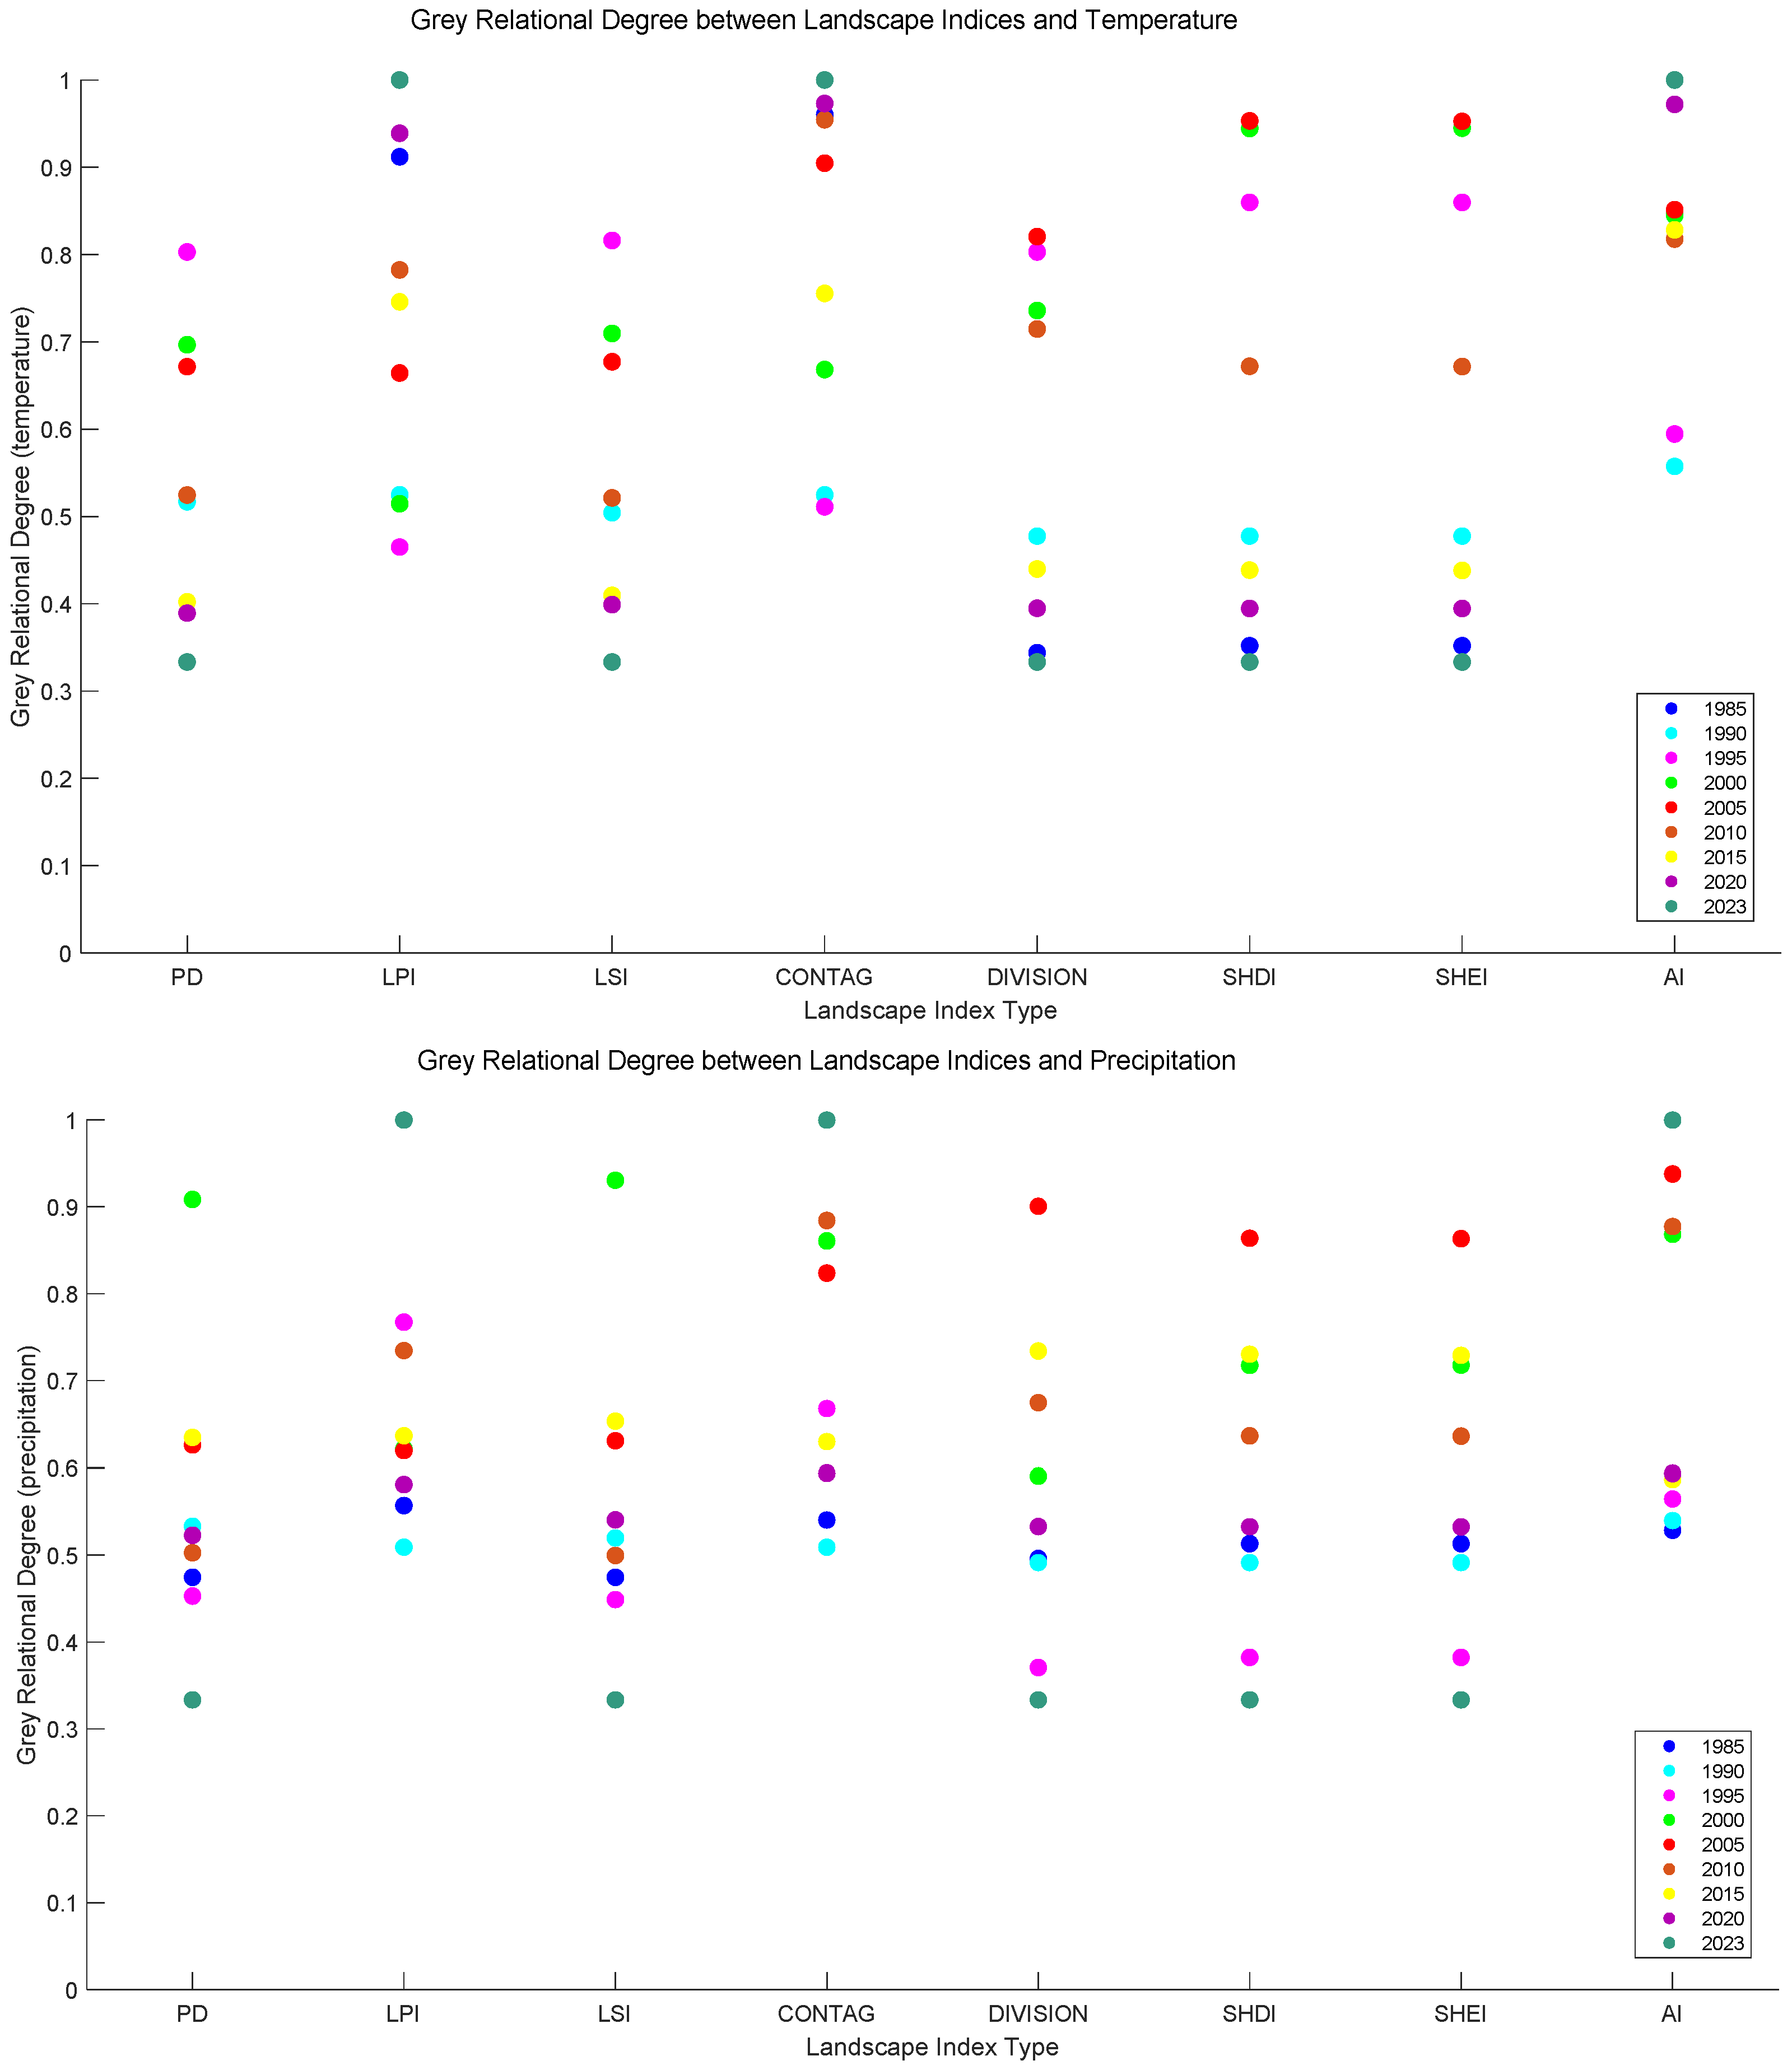
3.3.2. Correlation Between Climate Change and Landscape Ecological Patterns
- (1)
- Correlation between climate change and land-scale landscape indices
- (2)
- Correlation between Climate and Class-Scale Landscape indices
4. Discussion
4.1. Mechanisms of Climate Change Impacts on Landscape Ecological Patterns in the Qinling Mountains
4.2. Regional and Altitudinal Differentiation of Climate Change Impacts on Landscape Ecological Patterns in the Qinling Mountains
4.3. Regional Effects of Climate Change-Induced Landscape Ecological Pattern Alterations in the Qinling Mountains
5. Conclusions
Author Contributions
Funding
Data Availability Statement
Acknowledgments
Conflicts of Interest
References
- Assessment, M.E. Ecosystems and Human Well-Being: Biodiversity Synthesis; World Resources Institute: Washington, DC, USA, 2005; p. 86. [Google Scholar]
- Kienast, F.; Wildi, O.; Brzeziecki, B. Potential impacts of climate change on species richness in mountain forests—An ecological risk assessment. Biol. Conserv. 1998, 83, 291–305. [Google Scholar] [CrossRef]
- Opdam, P.; Wascher, D. Climate change meets habitat fragmentation: Linking landscape and biogeographical scale level in research and conservation. Biol. Conserv. 2004, 117, 85–297. [Google Scholar] [CrossRef]
- Pompe, S.; Hanspach, J.; Badeck, F.; Klotz, S.; Thuiller, W.; Kuhn, I. Climate and land use change impacts on plants distributions in Germany. Biol. Lett. 2008, 4, 564–567. [Google Scholar] [CrossRef] [PubMed]
- Liang, C.; Zhao, Y.; Qin, F.; Cui, Q.Y.; Li, Q.; Li, H.; Zhang, Z.Y. Complex responses of vegetation diversity to Holocene climate change in the eastern Tibetan Plateau. Veg. Hist. Archaeobot. 2019, 28, 379–390. [Google Scholar] [CrossRef]
- Huo, J.Y.; Liu, C.J.; Yu, X.X.; Jia, G.D.; Chen, L.H. Effects of watershed char and climate variables on annual runoff in different climatic zones in China. Sci. Total Environ. 2021, 754, 142157. [Google Scholar] [CrossRef]
- Solaimani, K.; Habaibnejad, M.; Pirnia, A. Temporal trends of hydro-climatic variables and their relevance in water resource management. Int. J. Sediment Res. 2021, 36, 63–75. [Google Scholar] [CrossRef]
- Shi, H.Y.; Chen, J. Characteristics of climate change and its relationship with land use/cover change in Yunnan Province, China. Int. J. Climatol. 2018, 38, 2520–2537. Available online: https://hub.hku.hk/bitstream/10722/264022/1/content.pdf?accept=1 (accessed on 10 May 2024). [CrossRef]
- Peng, J.; Zhao, H.J.; Liu, Y.X.; Wu, J.S. Progress and Prospects in the Construction of Regional Ecological Security Patterns. Geogr. Res. 2017, 36, 407–419. [Google Scholar]
- Metzger, M.J.; Leemans, R.; Schröter, D. A multidisciplinary multi-scale framework for assessing vulnerabilities to global change. Int. J. Appl. Earth Obs. Geoinf. 2005, 7, 253–267. [Google Scholar] [CrossRef]
- Meyer, B.C.; Rannow, S. Landscape ecology and climate change adaptation: New perspectives in managing the change. Reg. Environ. Change 2013, 13, 739–741. [Google Scholar] [CrossRef]
- Pang, S.E.H.; Slik, J.W.F.; Chisholm, R.A.; Webb, E.L. Conserving southeast Asian trees requires mitigating both climate and land-use change. Nat. Sustain. 2024, 7, 1313–1323. [Google Scholar] [CrossRef]
- Li, Y.F.; Sun, X.A.; Zhu, X.D.; Cao, H.H. An early warning method of landscape ecological security in rapid urbanizing coastal areas and its application in Xiamen, China. Ecol. Model. 2010, 221, 2251–2260. [Google Scholar] [CrossRef]
- Su, S.L.; Li, D.; Yu, X.; Zhang, Z.H.; Zhang, Q.; Xiao, R.; Zhi, J.J.; Wu, J.P. Assessing land ecological security in Shanghai (China) based on catastrophe theory. Stoch. Environ. Res. Risk Assess. 2011, 25, 737–746. [Google Scholar] [CrossRef]
- Gao, W.; Wan, L.; Du, Y.; Zhu, D. The effect of landscape pattern in response to ecological environment and climate change in Xiaoxing’anling, Heilongjiang Province, China. Appl. Ecol. Environ. Res. 2019, 17, 15419–15429. [Google Scholar] [CrossRef]
- Wang, R.H.; Li, X.Y.; Zhang, S.W.; Li, Y.B.; Cao, C. Research for landscape ecological security pattern and early warning in farming-pastoral zone of northeast China: A case study of Tongyu county in Jilin province. Geogr. Geo-Inf. Sci. 2014, 30, 111–115. Available online: https://webofscience.clarivate.cn/wos/alldb/full-record/CSCD:5106946 (accessed on 10 May 2024).
- Peng, J.; Liu, Y.; Wu, J.; Lv, H.; Hu, X. Linking ecosystem services and landscape patterns to assess urban ecosystem health: A case study in Shenzhen City, China. Landsc. Urban Plan. 2015, 143, 56–68. [Google Scholar] [CrossRef]
- Fu, C.B.; Wang, S.Y.; Xiong, Z.; Gutowski, W.J.; Lee, D.K.; McGregor, J.L.; Suh, M.S. Regional climate model intercomparison project for Asia. Bull. Am. Meteorol. Soc. 2005, 86, 257. [Google Scholar] [CrossRef]
- Peters, M.K.; Hemp, A.; Appelhans, T.; Becker, J.N.; Behler, C.; Classen, A.; Steffan-Dewenter, I. Climate-land-use interactions shape tropical mountain biodiversity and ecosystem functions. Nature 2019, 568, 88–92. [Google Scholar] [CrossRef]
- Zeng, W.; He, Z.; Bai, W.; He, L.; Chen, X.; Chen, J. Identification of ecological security patterns of alpine wetland grasslands based on landscape ecological risks: A study in Zoige County. Sci. Total Environ. 2024, 928, 172302. [Google Scholar] [CrossRef]
- Gao, J.; Gong, J.; Li, Y.; Yang, J.; Liang, X. Ecological network assessment in dynamic landscapes: Multi-scenario simulation and conservation priority analysis. Land Use Policy 2024, 139, 107059. [Google Scholar] [CrossRef]
- Sitotaw, T.M.; Willemen, L.; Meshesha, D.T.; Weldemichael, M.; Nelson, A. Modelling the impact of ecosystem fragmentation on ecosystem services in the degraded Ethiopian highlands. Ecol. Inform. 2025, 87, 103100. [Google Scholar] [CrossRef]
- Scheller, R.M. The challenges of forest modeling given climate change. Landsc. Ecol. 2018, 33, 1481–1488. [Google Scholar] [CrossRef]
- Zhang, X.; Li, S.; Yu, H. Analysis on the ecosystem service protection effect of national nature reserve in Qinghai-Tibetan Plateau from weight perspective. Ecol. Indic. 2022, 142, 109225. [Google Scholar] [CrossRef]
- Fu, F.; Deng, S.; Wu, D.; Liu, W.; Bai, Z. Research on the spatiotemporal evolution of land use landscape pattern in a county area based on CA-Markov model. Sustain. Cities Soc. 2022, 80, 103760. [Google Scholar] [CrossRef]
- Parmesan, C.; Singer, M.C. Mosaics of climatic stress across species’ ranges: Tradeoffs cause adaptive evolution to limits of climatic tolerance. Philos. Trans. R. Soc. B 2022, 377, 20210003. [Google Scholar] [CrossRef]
- Hu, Y.; Ji, G.; Li, J.; Hasbagan, G.; Hu, G.; Gao, Q. Interpretation of IPCC AR6: Terrestrial an freshwater ecosystems and their services. Adv. Clim. Change Res. 2022, 18, 395–404. [Google Scholar] [CrossRef]
- United Nation. Transforming Our World: The 2030 Agenda for Sustainable Development; United Nations: New York, NY, USA, 2014. [Google Scholar]
- Opdam, P.; Luque, S.; Jones, K.B. Changing landscapes to accommodate for climate change impacts: A call for Landscape Ecol. Landsc. Ecol. 2009, 24, 715–721. [Google Scholar] [CrossRef]
- Deng, C.; Bai, H.; Gao, S.; Zhao, T.; Ma, X. Differences and variations in the elevation-dependent climatic growing season of the northern and southern slopes of the Qinling Mountain of China from 1985 to 2015. Theor. Appl. Climatol. 2019, 137, 1159–1169. [Google Scholar] [CrossRef]
- Liu, K.; Ma, N.; Xu, Y.; SUN, G. Protection and construction of eco-environment in Qinling mountainous area. Chin. J. Ecol. 2004, 23, 157–160. [Google Scholar]
- Zhang, J.; Zhu, L.; Li, G.; Zhao, F.; Qin, J. Spatial pattern of SOC/TN content and its significance for determining the boundary between warm temperate zone and subtropical zone in Northern and Southern Transitional Zone of China. Acta Geogr. Sin. 2021, 76, 2269–2282. [Google Scholar] [CrossRef]
- Zhang, Y.; Yin, H.; Zhu, L.; Miao, C. Landscape Fragmentation in Qinling–Daba Mountains Nature Reserves and Its Influencing Factors. Land 2021, 10, 1124. [Google Scholar] [CrossRef]
- Guo, S.; Bai, H.; Meng, Q.; Zhao, T.; Huang, X.; Qi, G. Landscape pattern changes of woodland and grassland and its driving forces in Qinling Mountains. Acta Ecol. Sin. 2020, 40, 130–140. Available online: https://webofscience.clarivate.cn/wos/alldb/full-record/CSCD:6674469 (accessed on 16 May 2024).
- Ji, Y.; Zhou, G.; Wang, S.; Wang, L.; Zhou, M. Evolution characteristics and driving forces of vegetation ecological quality in Qinling Mountain from 2000 to 2019. Chin. J. Plant Ecol. 2021, 45, 617–625. [Google Scholar] [CrossRef]
- Yang, J.; Huang, X. The 30 m annual land cover datasets and its dynamics in China from 1985 to 2023. Earth Syst. Sci. Data. 2021, 13, 3907–3925. [Google Scholar] [CrossRef]
- Zhao, T.; Bai, H.Y.; Yuan, Y.; Deng, C.H.; Qi, G.Z.; Zhai, D.P. Spatio-temporal differentiation of climate warming (1959–2016) in the middle Qinling Mountain of China. J. Geogr. Sci. 2020, 30, 657–668. [Google Scholar] [CrossRef]
- Adebayo, T.S.; Ullah, S. Towards a sustainable future: The role of energy efficiency, renewable energy, and urbanization in limiting CO2 emissions in Sweden. Sustain. Dev. 2024, 32, 244–259. [Google Scholar] [CrossRef]
- Chen, M.; Xue, Y.; Xue, Y.; Peng, J.; Guo, J.; Liang, H. Assessing the effects of climate and human activity on vegetation change in Northern China. Environ. Res. 2024, 247, 118233. [Google Scholar] [CrossRef]
- Wu, J. Landscape Ecology: Pattern, Process, Scale and Hierarchy; Higher Education Press: Beijing, China, 2007; Available online: https://www.researchgate.net/publication/260407842_Landscape_Ecology_Pattern_Process_Scale_and_Hierarchy (accessed on 2 June 2024).
- Xu, L.; Yu, H.; Zhong, L. Evolution of the landscape pattern in the Xin’an River Basin and its response to tourism activities. Sci. Total Environ. 2023, 880, 163472. [Google Scholar] [CrossRef]
- Cushman, S.A.; McGarigal, K.; Neel, M.C. Parsimony in landscape metrics: Strength, universality, and consistency. Ecol. Indic. 2008, 8, 691–703. [Google Scholar] [CrossRef]
- Xu, N.; Zeng, P.; Guo, Y.; Siddique, M.A.; Li, J.; Ren, X.; Zhang, R. The spatiotemporal evolution of rural landscape patterns in Chinese metropolises under rapid urbanization. PLoS ONE 2024, 19, e0301754. [Google Scholar] [CrossRef]
- Zhu, K.; Zhu, Y.; Zhao, Z.; Wang, Y.; Guo, X.; Du, Y.; Gao, J. Ecological vulnerability and driving factors in the himalayan transboundary landscape under global climate change. Sci. Rep. 2025, 15, 4895. [Google Scholar] [CrossRef] [PubMed]
- Zhou, S.; Ou, Z.; Zhang, J.; Dong, L.; Li, X.; Deng, Z.; Sun, Y.; Qiu, X. Temporal and Spatial Variations in Landscape Patter-Function Risk Coupling over 20 Years in the Dry-Hot Valley of the Jinsha River in China. Land 2024, 13, 2068. [Google Scholar] [CrossRef]
- Qi, Y.; Shen, P.; Ren, S.; Chen, T.; Hu, Y. Coupling effect of landscape patterns on the spatial and temporal distribution of ecosystem services: A case study in Harbin City, Northeast China. Sci. Rep. 2025, 15, 4606. [Google Scholar] [CrossRef]
- Wang, X.; Dong, Z.; Tang, L.; Zhang, Q. Multiobjective Multitask Optimization-Neighborhood as a Bridge for Knowledge Transfer. IEEE Trans. Evol. Comput. 2023, 27, 155–169. [Google Scholar] [CrossRef]
- Lu, X.M.; Peng, S.Y.; Cai, F.C.; Peng, S.X.; Xiang, W.G. The Impact of Human Activities and Climate Change on the Wetland Landscape Patterns of the Nine Plateau Lakes in Yunnan Province. Wetl. Sci. 2024, 22, 191–206. [Google Scholar] [CrossRef]
- Ellis, E.C.; Gauthier, N.; Klein Goldewijk, K.; Bliege Bird, R.; Boivin, N.; Díaz, S.; Watson, J.E. Anthropocene gradients in managed landscapes: Reconciling ecological integrity with human dominance. Nat. Sustain. 2021, 4, 509–517. [Google Scholar]
- Forman, R.T. Land Mosaics: The Ecology of Landscapes and Regions; Cambridge University Press: Cambridge, UK, 1995; Available online: https://link.springer.com/content/pdf/10.5822/978-1-61091-491-8_21.pdf (accessed on 16 May 2024).
- Cui, L.; Zhao, Y.; Liu, J.; Han, L.; Ao, Y.; Yin, S. Landscape ecological risk assessment in Qinling Mountain. Geol. J. 2018, 53, 342–351. [Google Scholar] [CrossRef]
- Shao, Z.; Cai, J.; Fu, P.; Hu, L.; Liu, T. Deep learning-based fusion of Landsat-8 and Sentinel-2 images for a harmonized surface reflectance product. Remote. Sens. Environ. 2019, 235, 111425. [Google Scholar] [CrossRef]
- Huang, C.; Zhou, Z.; Peng, C.; Teng, M.; Wang, P. How is biodiversity changing in response to ecological restoration in terrestrial ecosystems? A meta-analysis in China. Sci. Total Environ. 2019, 650, 1–9. [Google Scholar] [CrossRef]
- Cheng, H.; Zhou, X.; Dong, R.; Wang, X.; Liu, G.; Li, Q. Natural vegetation regeneration facilitated soil organic carbon sequestration and microbial community stability in the degraded karst ecosystem. Catena 2023, 222, 106856. [Google Scholar] [CrossRef]
- Gémes, O.; Tobak, Z.; van Leeuwen, B. Satellite based analysis of surface urban heat island intensity. J. Environ. Geogr. 2016, 9, 23–30. [Google Scholar] [CrossRef]
- Zhuo, Z.; Gao, C.; Kirchner, I.; Cubasch, U. Impact of volcanic aerosols on the hydrology of the Asian monsoon and westerlies-dominated subregions: Comparison of proxy and multimodel ensemble means. J. Geophys. Res.-Atmos. 2020, 125, e2020JD032831. [Google Scholar] [CrossRef]
- Liu, X.; Liu, C.; Fan, B.; Li, L.; Tan, B.; Jin, Z.; Liu, T. Spatial responses of ecosystem water-use efficiency to hydrothermal and vegetative gradients in alpine grassland ecosystem in drylands. Ecol. Indic. 2020, 141, 109064. [Google Scholar] [CrossRef]
- Oleson, K. Contrasts between urban and rural climate in CCSM4 CMIP5 climate change scenarios. J. Clim. 2012, 25, 1390–1412. [Google Scholar] [CrossRef]
- Seto, K.C.; Reenberg, A.; Boone, C.G.; Fragkias, M.; Haase, D.; Langanke, T.; Simon, D. Urban land teleconnections and sustainability. Proc. Natl. Acad. Sci. USA 2012, 113, 893–902. [Google Scholar] [CrossRef]
- Cusack, D.F.; Karpman, J.; Ashdown, D.; Cao, Q.; Ciochina, M.; Halterman, S.; Neupane, A. Global change effects on humid tropical forests: Evidence for biogeochemical and biodiversity shifts at an ecosystem scale. Rev. Geophys. 2016, 54, 523–610. [Google Scholar] [CrossRef]
- Batori, Z.; Galle, R.; Galle-Szpisjak, N.; Csaszar, P.; Nagy, D.D.; Lőrinczi, G.; Hornung, E. Topographic depressions provide potential microrefugia for ground-dwelling arthropods. Elem. Sci. Anthr. 2022, 10, 00084. [Google Scholar] [CrossRef]
- Chen, Y.; Feng, J.; Yuan, X.; Zhu, B. Effects of warming on carbon and nitrogen cycling in alpine grassland ecosystems on the Tibetan Plateau: A meta-analysis. Geoderma 2020, 370, 114363. [Google Scholar] [CrossRef]
- Wang, S.; Foster, A.; Lenz, E.A.; Kessler, J.D.; Stroeve, J.C.; Anderson, L.O.; Hausfather, Z. Mechanisms and impacts of Earth system tipping elements. Rev. Geophys. 2023, 61, e2021RG000757. [Google Scholar] [CrossRef]
- Wu, J. Landscape sustainability science: Ecosystem services and human well-being in changing landscapes. Landsc. Ecol. 2013, 28, 999–1023. [Google Scholar] [CrossRef]
- Cao, Q.; Wu, J.; Yu, D.; Wang, R.; Qiao, J. Regional landscape futures to moderate projected climate change: A case study in the agro-pastoral transitional zone of North China. Reg. Environ. Change 2020, 20, 66. [Google Scholar] [CrossRef]
- Jenerette, G.D.; Harlan, S.L.; Stefanov, W.L.; Martin, C.A. Ecosystem services and urban heat riskscape moderation. Ecol. Appl. 2011, 21, 2637–2651. [Google Scholar] [CrossRef] [PubMed]
- Siedt, M.; Schäffer, A.; Smith, K.E.; Nabel, M.; Roß-Nickoll, M.; Van Dongen, J.T. Comparing straw, compost, and biochar regarding their suitability as agricultural soil amendments to affect soil structure, nutrient leaching, microbial communities, and the fate of pesticides. Sci. Total Environ. 2021, 751, 141607. [Google Scholar] [CrossRef] [PubMed]
- Haddad, N.M.; Brudvig, L.A.; Clobert, J.; Davies, K.F.; Gonzalez, A.; Holt, R.D.; Townshend, J.R. Habitat fragmentation and its lasting impact on Earth’s ecosystems. Sci. Adv. 2015, 6, e1500052. [Google Scholar] [CrossRef]
- Griscom, B.W.; Adams, J.; Ellis, P.W.; Houghton, R.A.; Lomax, G.; Miteva, D.A.; Fargione, J. Natural climate solutions. Proc. Natl. Acad. Sci. USA 2017, 114, 11645–11650. [Google Scholar] [CrossRef]
- Yin, Z.; Liu, Z.; Liu, X.; Zheng, W.; Yin, L. Urban heat islands and their effects on thermal comfort in the US: New York and New Jersey. Ecol. Indic. 2023, 154, 110765. [Google Scholar] [CrossRef]
- Garrabou, J.; Gómez-Gras, D.; Medrano, A.; Cerrano, C.; Ponti, M.; Schlegel, R.; Harmelin, J.G. Marine heatwaves drive recurrent mass mortalities in the Mediterranean Sea. Glob. Change Biol. 2022, 28, 5708–5725. [Google Scholar] [CrossRef]


| Landscape Metric | Equation | Description | |
|---|---|---|---|
| L | Heterogeneity | SHDI = | Reflects the complexity and variability of different patch types within the landscape. |
| SHEI = | Reflects the degree of unevenness in the distribution of patch areas within the landscape. | ||
| Concentration | AI = | Reflects the nonrandomness or degree of aggregation of different patch types within a landscape. | |
| Connectivity | CONTAG = | Measures the extent to which patch types are aggregated or clumped. | |
| DIVISION = | Division is based on the cumulative patch area distribution and is interpreted as the probability that two randomly chosen pixels in the landscape are not situated in the same patch. | ||
| L & C | Fragmentation | PD = | Number of patches divided by the total. |
| LPI = | Reflects the proportion of the largest patch of a landscape type relative to the entire landscape area. | ||
| Shape | LSI = | Reflects landscape shape, with the value being positively correlated to the complexity of the shape. | |
| C | Fragmentation | NP = | Number of patches divided by area. |
| Scale | CA = | Reflects landscape type patch area. | |
| PLAND = | Sum of the areas of all patches, divided by total landscape area. | ||
| Shape | FRAC_MN = | Reflects the shape of the landscape, with the value being positively correlated to the complexity of the shape. | |
| Networking | COHESION = | Reflects the connectivity of landscape patches. | |
| Year | CONTAG | SHDI | SHEI | AI | PD | LPI | LSI | DIVISION |
|---|---|---|---|---|---|---|---|---|
| 1985 | 66.76 | 0.87 | 0.45 | 88.42 | 24.05 | 64.92 | 481.77 | 0.57 |
| 1990 | 66.86 | 0.88 | 0.45 | 88.87 | 22.43 | 64.84 | 462.94 | 0.57 |
| 1995 | 69.92 | 0.82 | 0.42 | 90.99 | 17.16 | 66.92 | 375.37 | 0.55 |
| 2000 | 71.51 | 0.79 | 0.41 | 92.07 | 14.09 | 67.37 | 330.62 | 0.54 |
| 2005 | 73.02 | 0.76 | 0.39 | 92.84 | 12.10 | 68.85 | 298.69 | 0.52 |
| 2010 | 74.45 | 0.73 | 0.38 | 93.61 | 10.20 | 70.78 | 266.58 | 0.49 |
| 2015 | 75.83 | 0.69 | 0.36 | 93.89 | 9.08 | 72.75 | 254.84 | 0.47 |
| 2020 | 77.25 | 0.66 | 0.34 | 94.40 | 7.62 | 74.17 | 233.94 | 0.45 |
| 2023 | 78.12 | 0.64 | 0.33 | 94.99 | 6.39 | 74.99 | 209.27 | 0.43 |
| Change value | +11.36 | −0.23 | −0.12 | +6.58 | −17.66 | +10.08 | −272.49 | −0.14 |
| Mean | 72.64 | 0.76 | 0.39 | 92.23 | 13.68 | 69.51 | 323.78 | 0.51 |
| Standard deviation | 4.21 | 0.09 | 0.04 | 2.37 | 6.35 | 3.85 | 98.02 | 0.0 |
| Annual change rate | +0.38 | −0.69 | −0.56 | +0.17 | −4.13 | +0.35 | −2.49 | −0.70 |
Disclaimer/Publisher’s Note: The statements, opinions and data contained in all publications are solely those of the individual author(s) and contributor(s) and not of MDPI and/or the editor(s). MDPI and/or the editor(s) disclaim responsibility for any injury to people or property resulting from any ideas, methods, instructions or products referred to in the content. |
© 2025 by the authors. Licensee MDPI, Basel, Switzerland. This article is an open access article distributed under the terms and conditions of the Creative Commons Attribution (CC BY) license (https://creativecommons.org/licenses/by/4.0/).
Share and Cite
Liu, Y.; Yu, H. Climate Change-Driven Spatiotemporal Dynamics of Landscape Ecological in the Qinling Mountains (1980–2023). Land 2025, 14, 1008. https://doi.org/10.3390/land14051008
Liu Y, Yu H. Climate Change-Driven Spatiotemporal Dynamics of Landscape Ecological in the Qinling Mountains (1980–2023). Land. 2025; 14(5):1008. https://doi.org/10.3390/land14051008
Chicago/Turabian StyleLiu, Yufang, and Hu Yu. 2025. "Climate Change-Driven Spatiotemporal Dynamics of Landscape Ecological in the Qinling Mountains (1980–2023)" Land 14, no. 5: 1008. https://doi.org/10.3390/land14051008
APA StyleLiu, Y., & Yu, H. (2025). Climate Change-Driven Spatiotemporal Dynamics of Landscape Ecological in the Qinling Mountains (1980–2023). Land, 14(5), 1008. https://doi.org/10.3390/land14051008