Article

Unregulated Urban Regeneration in Athens: Greening and Taxation of the Built Environment as Impending Levers of Increasing Inequalities

by
Thomas Maloutas
1,2,
Stavros Nikiforos Spyrellis
2,* and
Fereniki Vatavali
2
1
Department of Geography, Harokopio University, 17676 Athens, Greece
2
National Centre for Social Research, Institute of Social Research, 10552 Athens, Greece
*
Author to whom correspondence should be addressed.
Land 2025, 14(4), 777; https://doi.org/10.3390/land14040777
Submission received: 19 February 2025 / Revised: 1 April 2025 / Accepted: 1 April 2025 / Published: 4 April 2025
(This article belongs to the Special Issue Landscape Perspectives on Urban Regeneration in Mediterranean Cities)

Abstract

:
Access to housing in Athens during the first postwar decades protected a broad range of low-means social groups and enhanced their social mobility. Eventually, the city’s housing market was dominated by neoliberal policies, producing a very different social effect. Since the mid-2010s, the changes in the housing market were also interconnected with the rise in demand for housing (some of it related to tourism and other forms of ‘external’ demand for accommodation), the boom in the construction sector, the change in property taxation, the increase in housing prices, and the need to improve built properties. The analysis of three different datasets in this paper confirmed that the unregulated city’s housing market is following the spatially differentiated demand and reproducing socio-spatial inequalities. It also confirmed that the few policy initiatives developed since the early 2010s have not faced the housing needs of the most vulnerable groups because they were weak and because these needs were not their primary target. Athens seems to be one of the most unregulated cities in Southern Europe, where housing policies are far behind the needs and issues raised by increasing inequalities, and difficulties for vulnerable groups look like unavoidable outcomes.

1. Introduction

Compared to most countries in the European continent, access to housing in Athens, and in Greece, was organized very differently during the post-war period [1,2]. Public housing estates and social housing for rent were never developed [3], and access to housing as a social right never became an important component of the local housing system [4,5]. Housing was eventually considered as an issue that each family should deal with individually in the housing market [3]. Paradoxically, this absence of welfarist public housing did not lead to rising housing inequalities and to increased housing deprivation. This absence, however, was replaced by an—implicit or explicit—protectionist policy, related to the post-civil war political climate, to the familyist welfare regime, and to the clientelist political system [6]. This protectionist policy enabled access to housing either by facilitating individual initiatives to access homeownership through self-promotion (providing land and building materials at low cost and being lenient in controlling building procedures) or by facilitating housing production through the land-for-flats system that sharply increased housing supply [1,7,8,9,10].
The social equilibrium between catering to housing needs and the poorly regulated housing market started disintegrating in the 1990s when protectionist measures (e.g., rent controls) were reduced, traditional ways of accessing homeownership declined, and private banks were allowed to invest in housing mortgages [11]. The growing influx of immigrants in the 1990s and 2000s added further complexity to the Athenian real estate market [12,13]. Prices increased rapidly, and access to homeownership became increasingly unaffordable for lower-income households [14,15,16,17].
The financial crisis of the early 2010s led the construction sector into a major recession but made real estate values more interesting for international investors. At the same time, local demand—especially related to the housing needs of the most vulnerable—remained anemic due to the sharp reduction in incomes [18]. International investment in the housing market of Athens increased impressively since the late 2010s, fueled by the overwhelming tourist demand, the demand for accommodation by the growing group of digital nomads, and the policies boosting this kind of demand by citizens from outside Europe (Golden Visa) [18]. The COVID-19 pandemic slowed down these procedures, but soon after, everything got back on track. Eventually, housing in Athens has become increasingly financialized, becoming more and more an investment and much less a use value [19,20]. Considering the fact that efficient social housing policies were never thoroughly developed and the housing market was left unregulated, housing problems have been increasingly rising, affecting not only the lower social strata.
Issues of housing affordability are rising in Southern Europe [21,22] and beyond [23,24]. Southern European cities have been affected by both the relatively weaker protection of vulnerable groups by their residual welfare states [25] and by their touristification [26]—an increase in their attractiveness as tourist destinations, an expansion of the tourist period all over the year, and incoming tourists with higher incomes than the local population—directly affecting housing affordability. In many Southern European cities, and more broadly in Europe, the discourse on unaffordable housing is also linked to energy upgrades, as the high upfront costs or lack of financial resources can limit access to energy retrofitting for low-income households [27,28]. At the same time, rent increases due to retrofitting could lead to speculation, increase housing vulnerability, and cause renovictions—namely, the direct or indirect displacement of low-income tenants of private rented sector or social housing to even more precarious and lower-quality housing [29,30,31,32,33]. These rising affordability issues were not addressed by policy measures within a South European context where housing issues were not usually considered as social issues but as individual/family matters [3]. This paper presents the outcomes of poorly regulated housing regeneration in Athens that was unable to face unaffordable housing issues that became part of the social and political agenda since the end of the 2010s.
Analyzing the changes in the Athens Metropolitan Area (AMA), in this paper we intend to investigate how recent trends of urban regeneration processes fueled by the dynamics in the construction sector and real estate market, often supported by state policies, correlate with and affect the social profile of certain areas. Furthermore, we intend to explore which socio-economic groups—but also which areas—are the winners and which are the losers in the context of the recent cycles of capital investment in the built environment and of the state policies. This examination is operated through the analysis of detailed datasets on the Energy Performance Certificates (EPCs) of properties, supplied by the Greek Ministry of the Environment and Energy (MoEE), on building and small-scale work permits, registered by the Technical Chamber of Greece (TCG), and on changes in Official Real Estate Property Values (OREPV), set by the Ministry of Finance (MoF), with a direct impact on property taxation. These data have not been previously examined or analyzed and mapped in detail. In order to enrich this analysis, we compare our findings to the overall construction activity registry produced by the Hellenic Statistical Authority (ELSTAT). Finally, this paper intends to illustrate the social profile of the effective outcomes of housing-related policies, regardless of the often-opposite discourses that accompanied their deployment. Identifying the social impact of these outcomes is enabled by their detailed distribution in the socially different parts of the city. New constructions and refurbishments are not randomly distributed in the neighborhoods of Athens. The same applies for housing units whose owners requested EPCs for sale or for rent or for dwellings’ retrofitting through state subsidies, as well as for changes in official property values affecting in different ways the taxation of properties according to their location and, eventually, their owners’ social profile.

2. Materials and Methods

The analysis focuses on the Athens Metropolitan Area (AMA), encompassing the entire territory of the Attiki Region, excluding the islands (Figure 1). As mentioned in the introduction, in seeking to question the regeneration trends in Athens, we analyzed and mapped three different datasets. We cross-referenced the data with information from ELSTAT, including a socioeconomic typology of residential areas based on the 2011 national census and the construction activity registry.

2.1. Energy Performance Certificate (EPC) Registry

Apart from providing information about the energy performance of the housing stock, the EPCs are used as a trustworthy real estate indicator, since they are mandatory for property sales and rentals, regardless of the size or function (housing or commercial use) of the units. Such certificates are also required in all applications for subsidies for Energy Upgrade Funding (EUF), namely the “Exikonomo” program, which will be presented further down.
Between 2012 and 2023, more than 730,000 EPCs for residential properties have been issued in the AMA (Table 1). These EPCs were predominantly intended for rentals (74%), whereas 22% were linked to sales and a limited 4% aimed at the EUF. The latter cannot be linked to rents or sales, since the future use was not declared; we assume, however, that it is mainly for the owners’ own use.
The main lacuna of the EPCs dataset is the 10-year duration of the certificates’ validity. For our analysis, the latter mainly affects the EPCs issued for rent. Issuing a certificate indicates the intention of an owner to introduce his property in the rental market, but since our dataset includes the EPCs produced between 2012 and 2023, we cannot estimate how many times this property was rented, if rented. On the other hand, the EPC is a much clearer indicator concerning the sales of properties or the Energy Upgrade Funding (EUF). We consider that rarely a property is sold twice in a decade. In such a case, the same certificate could be used. If important work was carried out on the property, a new certificate should be issued.
For each registry, we provide detailed information including the purpose of the issuance of the EPC, the property’s size, and its energy class. We also applied a size threshold of 300 m2 to our dataset, which resulted in the exclusion of 1.4% of housing units up to 9000 m2 that, most probably, are not intended for residential use.

2.2. Building Permits Registry

Since January 2018, the Technical Chamber of Greece (TCG) has been the responsible authority for processing requests related to permits for any construction activity. The dataset we analyzed includes all building or small-scale work permits issued within the AMA from 2019 to 2023. Since it contains permits, it essentially reflects the intention to build or make changes to a building and not actual construction activity. Furthermore, we decided that some secondary types of permits should be excluded. As such, we consider the demolition permits—a new construction permit is required to replace a demolished dwelling, and the issuance of construction permits is taken into consideration—the approval of completion works on illegal construction permits, and the approval of tourist facilities permits, which represent only 81 acts. Furthermore, we excluded these permits because they are not directly related to construction activity that supports urban regeneration processes, such as building new structures, renovations, or significant changes in land use. Having removed all acts linked to updates, renewals, or revisions of permits, we focused on analyzing 75,334 acts, 36% of the 208,789 acts included in the initial TCG registry.
We chose to organize the dataset in two distinct groups (Table 2). The first group includes building permits. According to Article 29 of Law 4495/2017, a building permit is required for various activities, mainly for the construction of new buildings and the extension of existing structures, the demolition of buildings, large-scale earthworks, swimming pool construction, significant changes in building use, and high-budget interventions in existing buildings exceeding 25,000 euros, etc. Although a building permit is required for a wide range of construction activities, we claim that the analysis of available data offers valuable insights into prevailing trends in new building constructions and large-scale interventions on existing structures in the AMA.
A second group includes small-scale works permits. According to Article 29 of Law 4495/2017, small-scale work permits are required for a range of low-cost renovation activities (less than 25,000 euros), including external painting, façade repairs and façade cladding with the use of scaffolds, the installation of passive solar systems, internal and external thermal insulation, roof maintenance, and modifications to building facades. Although small-scale works permits are also required for constructed activities such as the installation of prefabricated houses or stonework fencing—which are inevitably included in the available dataset—and although numerous renovation activities (e.g., interior painting, minor repairs to doors and windows, or replacement of frames and glazing) do not require permits, we claim that the analysis of available data offers valuable insights into prevailing trends in the renovation of the AMA’s building stock.

2.3. Objective Real Estate Property Values (OREPV)

Last, we analyze the Objective Real Estate Property Values (OREPV) published by the Greek Ministry of Economy and Finance concerning the 2018 prices and the revised 2021 prices. Usually, the OREPV are lower than market prices, also due to the time-consuming update processes. Their readjustment is supposed to get closer to market values and integrate market trends.
The main use of the OREPV is the determination of the taxable value of a property. According to the Greek real estate taxing system, property taxes apply to ownership—the municipal Real Estate Tax (TAP) and the Uniform Property Ownership Tax (ENFIA)—and to transfer—3% property value transfer tax with an exemption for first home buyers.
The calculation of OREPV is based upon zone values (circular or linear), while a set of coefficients and factors (related to the age, floor, facade, stage of completion, etc.) also apply. To implement this analysis, we created an OREPV urban index considering both linear and circular OREPV and combining them with the detailed analysis units (Urban Analysis Units [URANUs]) at the metropolitan level 1. URANUs are an aggregated version of the 2011 Census Tracts (CTs), dividing Athens into 2999 units with an average of 1200 residents. Therefore, each URANU is given a weighted OREPV 2018 and 2021 value.

2.4. Social Types of Residential Areas

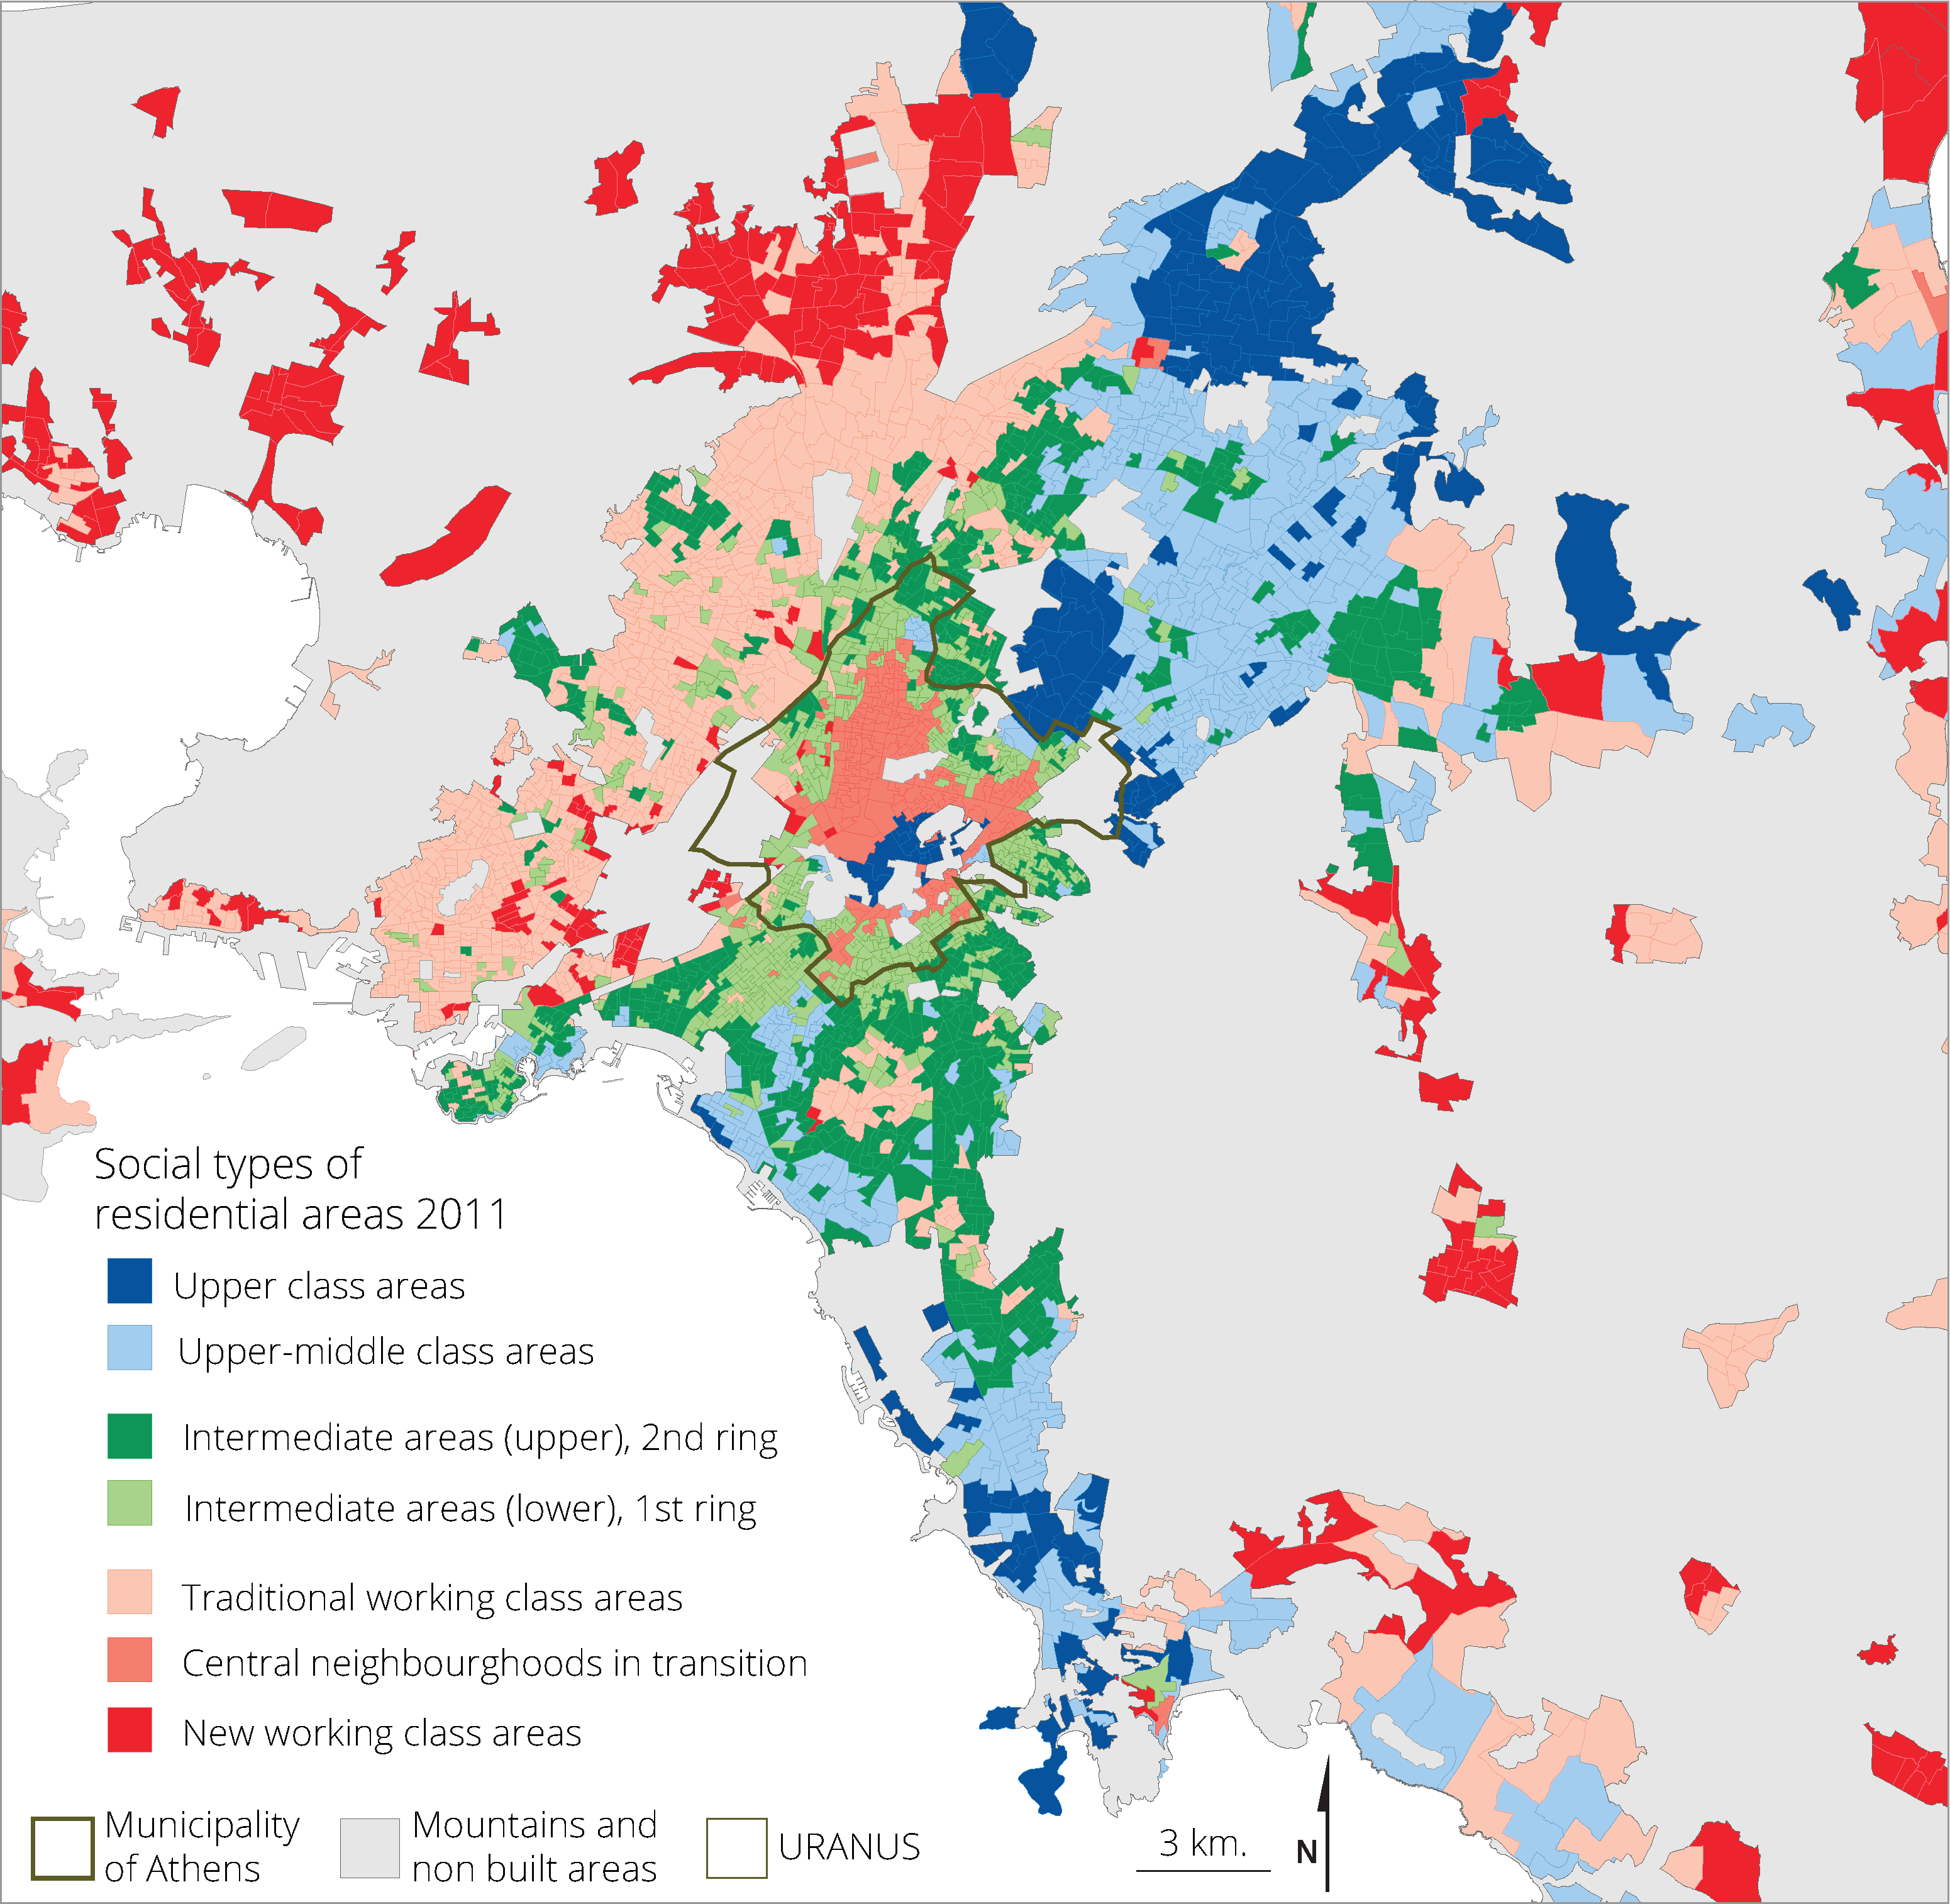
To explore the relationship between the spatial dynamics of socioeconomic groups within the context of recent cycles of capital investment in the built environment and state housing policies, we used a typology proposed by Maloutas and Spyrellis in 2019 [34], which is based on the distribution of the 2011 National Census occupational categories (OC) and mapped at the detailed level of the 2011 URANUs (Figure 2).
Figure 2 shows that the traditional divide between the eastern—mainly suburban—upper and upper-middle class area and the western, lower-income areas remains prevalent [35], while also recognizing two key intermediate zones around the city center that contain both upper and lower intermediate areas. Within the city center, primarily characterized by apartment buildings constructed through the “land-for-flats” system (mentioned in the introduction), we observe in dark blue the traditional bourgeois neighborhoods, while the central areas in transition are represented in a medium shade of red. On the outskirts of the Municipality of Athens, areas with an intermediate character appear to dominate. Finally, in the more distant, peri-urban zones of the metropolis, the new working-class areas are marked in dark red.
To provide a clear comparative image of the different types of areas, we calculated the level of unequal distribution of variables that we consider indicative of both social and housing characteristics (Table 3 and Table 4). To compare the deviation of each type of area from the average profile, we used location quotients (LQ). LQs compare the presence of a variable in a given spatial unit to its presence in the wider AMA. An LQ score below 1 indicates that the selected variable is under-represented, and an LQ score above 1 indicates that the selected variable is over-represented, compared to its presence in the rest of the residential space.
Table 3 and Table 4 show some indicative characteristics that divide the urban space. The upper areas (in blue on Figure 2) show higher levels of education and a greater representation of higher occupational categories, coupled with lower ethnic diversity. In these areas, housing poverty is less prevalent; fewer people live in apartment buildings, while larger residences and homeowners are more common.
Regarding the areas with intermediate occupational categories (in green colors on Figure 2), they generally follow the broader trends of the metropolis, although some distinctions can be identified. The upper intermediate areas are closer to the upper areas, particularly in terms of social variables (e.g., higher occupations and lower ethnic mix), while the lower intermediate areas share more characteristics with the lower areas, especially in housing variables (e.g., apartment living, size, and ownership), while the higher levels of tenants and ethnic mix are also important.
Lastly, the lower-type social areas show clear spatial differentiations among them. The traditional working-class areas, dominating in the western part of the city, align with the average housing profile, with the notable exception of high levels of homeownership. In terms of social variables, there is a clear underrepresentation of highly educated individuals and higher occupations, while low levels of ethnic diversity are present.
The central zones undergoing social transformation are the most diverse, both in terms of social and housing characteristics. In these areas, we observe very high levels of housing poverty, coupled with low levels of homeownership and an overrepresentation of apartment buildings. Socially, these areas exhibit increased ethnic diversity, alongside a high prevalence of routine occupations, while educational levels do not appear to be particularly low. The last point may be attributed to the combination of the relatively high education level of foreign nationals from developing countries with their socioeconomic status, due to the different relation of educational level and social status between neighboring countries (mainly Albania) and the local context. Moreover, the pronounced vertical segregation in these areas combines different social and educational profiles in the same places [10].
The new and distant working-class areas (shown in dark red on Figure 2) are characterized by high levels of homeownership in low-rise housing stock surrounding the capital. Furthermore, these areas score very low on all social variables. High levels of ethnic diversity combined with high levels of homeownership are also observed. The overrepresentation of immigrants cannot be linked to housing availability, as in the central areas, but is likely related to their employment in the agricultural sector, which is prominent in these regions.

2.5. Analyzing the Aged and Outdated Housing Stock: Socio-Spatial Facts About the Energy Performance of Dwellings

To map and further analyze the datasets, we were required to use postal codes—specifically, 290 postal codes in the AMA—as it was the most detailed level of data available to us. Since postal code boundaries are not administrative or aligned with population distribution, and given that in Athens, postal codes generally cover much larger areas as they move away from the city center, we decided to standardize each variable’s score based on the number of residences per postal code, using 2011 census data [36].
Next, using the postal codes basemap, we created a three-level typology to categorize the spatial units based on their scores relative to the average. The middle-scoring polygons were grouped around the average (with scores between average −0.5 standard deviation and average +0.5 standard deviation), while two additional groups were formed to categorize the postal codes either above or below the middle group. This method was applied to both the EPCs registry and the building and small-scale work permits registry datasets, organized by postal code.
Finally, to connect the social characteristics of residential areas in Athens, we linked the postal codes to the more detailed URANUs typology, merging the three-level postal code typology with the seven-level social typology.
The housing stock of the AΜA, being relatively old and not sufficiently renovated, has low energy efficiency. A large part of the houses (53.5%) in the Attiki Region was built before 1980 [37], when the first regulations on thermal insulation were adopted. According to ELSTAT data, 45.0% of the dwellings do not have any type of insulation, 75.6% do not have double glazing, and 92.8% do not have insulation on the external walls [36]. In fact, out of the 736,764 EPCs issued for dwellings in the AMA, 69.2% are low energy class (E–G), while 26.9% are middle energy class (C–D) and just 3.9% are high energy class (A–B) dwellings (Table 2). Furthermore, heating in many houses is based on outdated technologies and depends on the use of fossil fuels [38], while the issue of cooling also presents significant gaps, with 27% of the housing stock not having cooling systems (ELSTAT 2021). The use of renewable energy sources is relatively limited.
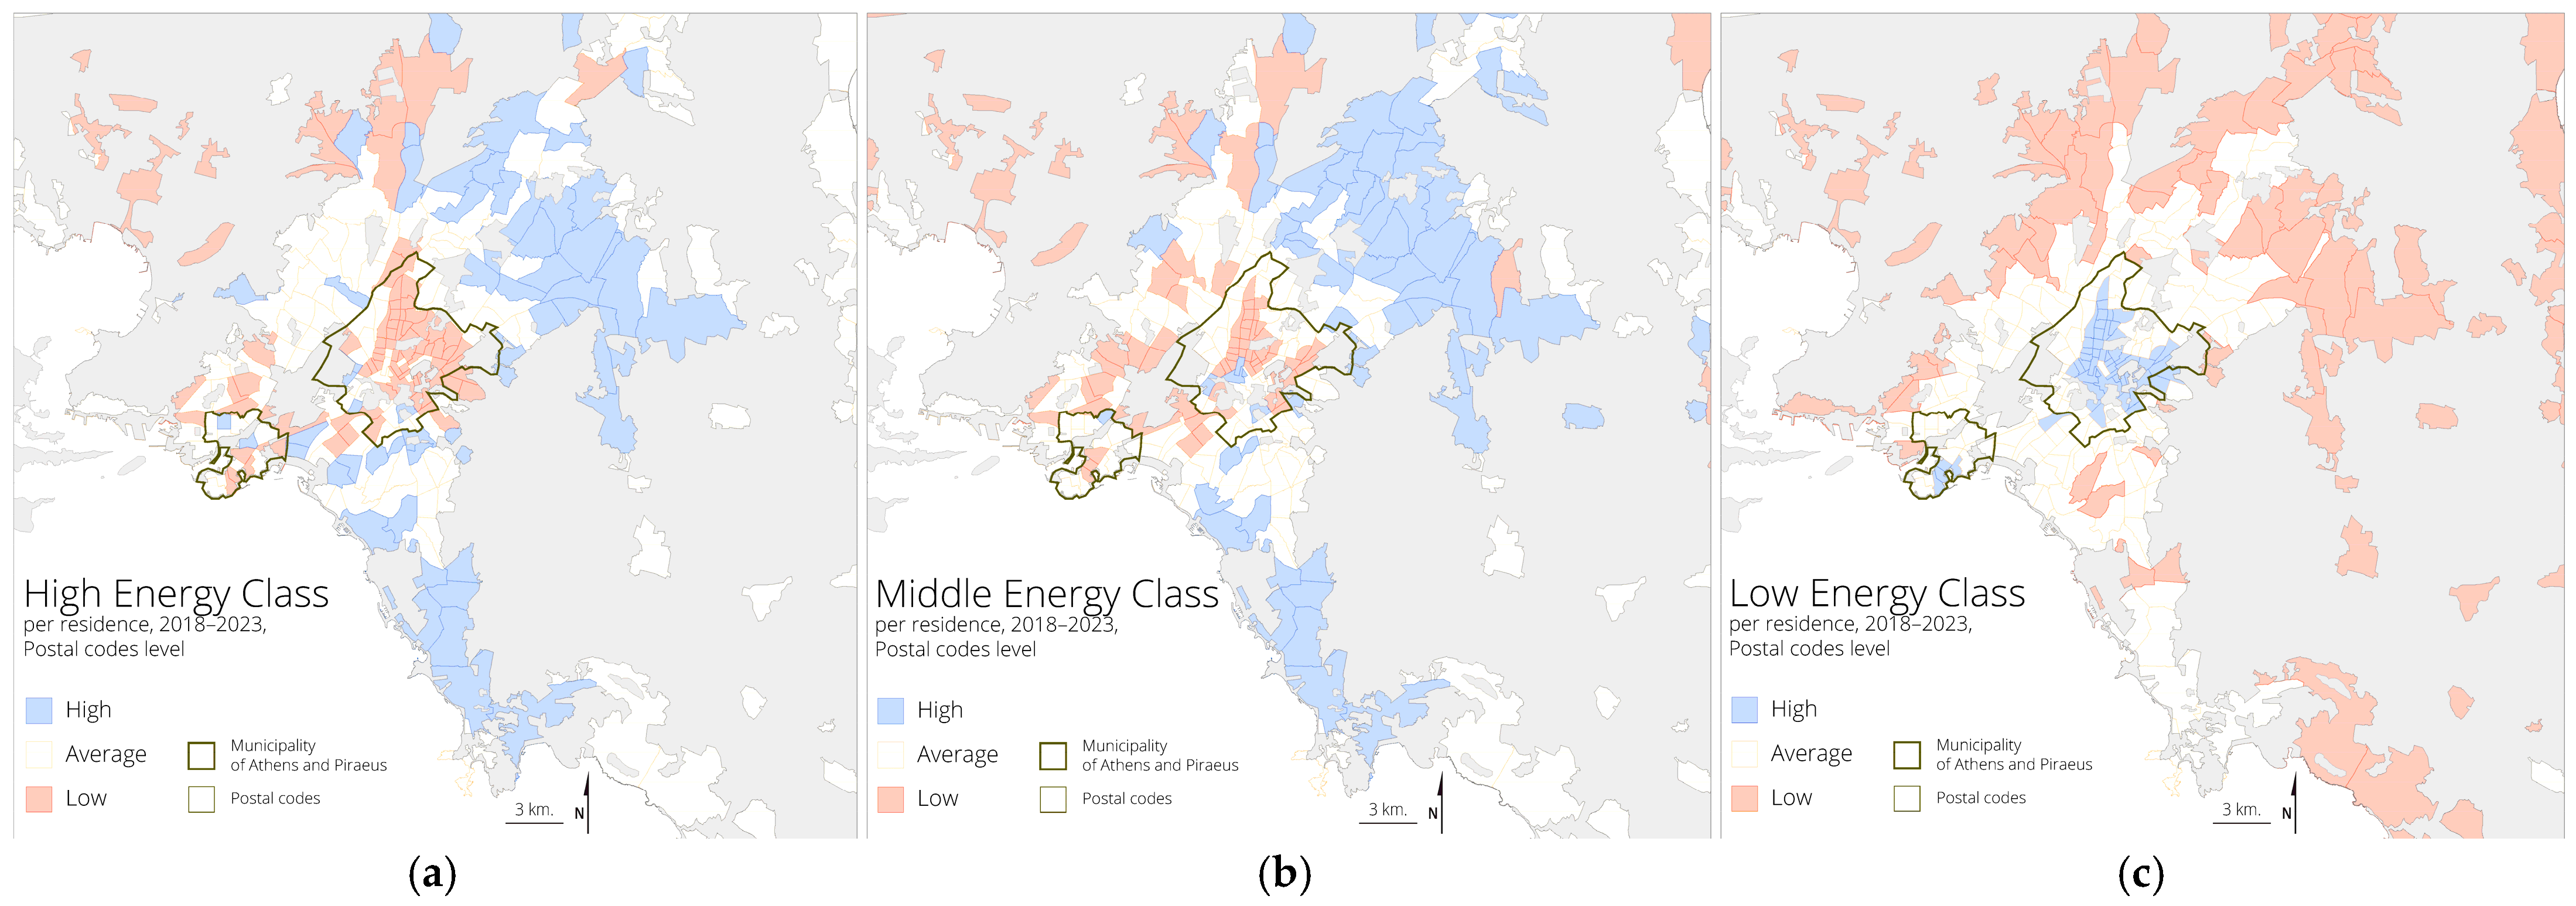
Moreover, the spatial distribution of low-energy-efficient dwellings shows significant differentiations, as the highest concentration of low-energy-efficient (E, F, and G) housing is found in the central areas of Athens and Piraeus (Figure 3c), where the housing stock is old and a large segment of it is rented [34]. On the other hand, the areas of the Northern and Southern suburbs show a greater concentration of higher-energy-efficient (A and B) and middle-energy-efficient (C and D) residences (Figure 3a,b). This finding is linked to the fact that the housing stock is newer and owner-occupied and that the upper and upper-middle occupational categories that live there can afford investments that improve the energy performance of their dwellings.
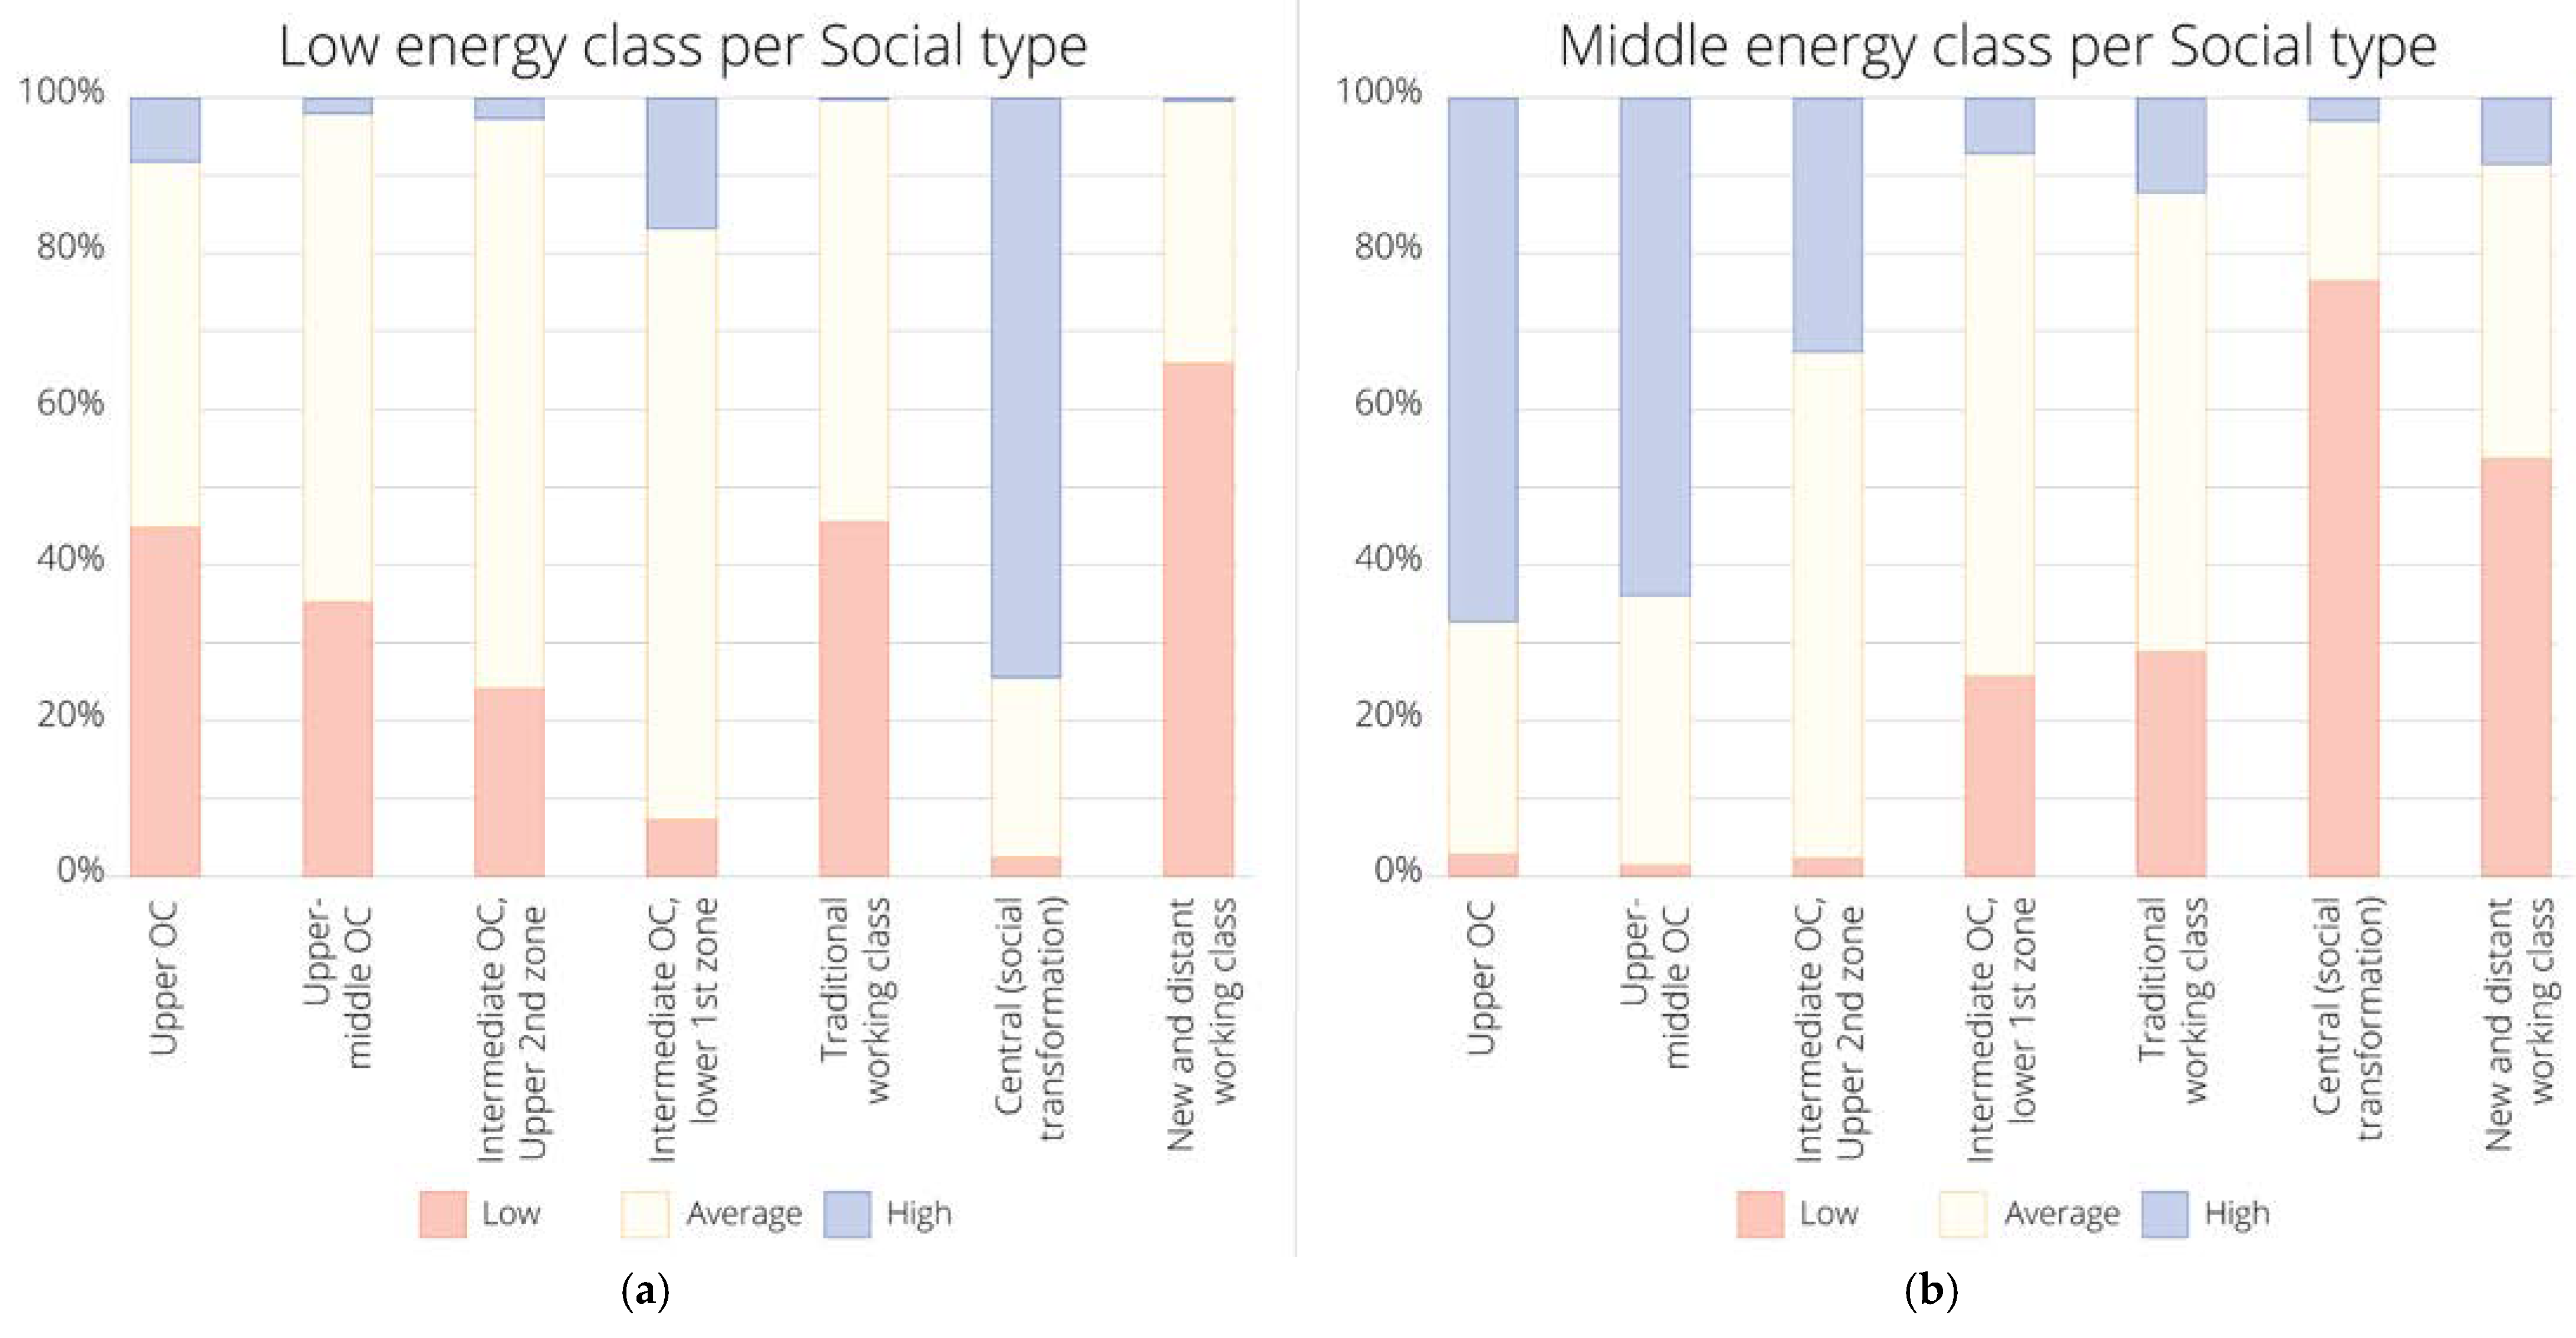
According to Figure 4a, approximately 75% of the URANUs of the central areas under transformation present high concentrations of low energy class (E, F, and G) dwellings. On the contrary, more than 60% of the URANUs in areas of upper and upper-middle occupational groups present high concentrations of middle energy class (C and D) (Figure 4b).

3. Results

3.1. Construction Activity: Dynamics in the City Center and Affluent Suburbs

Since the mid-1990s, Greece has witnessed a substantial expansion in the construction sector, particularly in housing [11], a trend directly related to the significance of urban land within the global economy. This has had profound implications for the spatial organization and social geography of Athens [39,40]. The growth of the housing sector is closely tied to a reduction in interest rates, the expansion of mortgage lending, and escalating housing prices [14,15]. It has also been driven by fiscal policies that have incentivized construction activity, such as the announcement of the inclusion of new buildings in the VAT regime before its implementation in 2006, tax exemptions for first-time homebuyers, and housing rehabilitation programs targeting specific social groups. Furthermore, substantial profits accumulated from stock market activities and large infrastructure projects, both domestically and internationally, have contributed to this expansion. Housing demand has surged within inner city areas but was primarily concentrated in the suburban and peri-urban areas of Athens, which became increasingly attractive due to major infrastructure developments and commercial projects. Additionally, there has been significant demand for luxury housing from higher-income groups. Broader social and economic processes also underpin this market dynamic, including increased household incomes and spending power, shifts in lifestyles and consumption patterns, a substantial influx of immigrants, and the rise in international tourism.
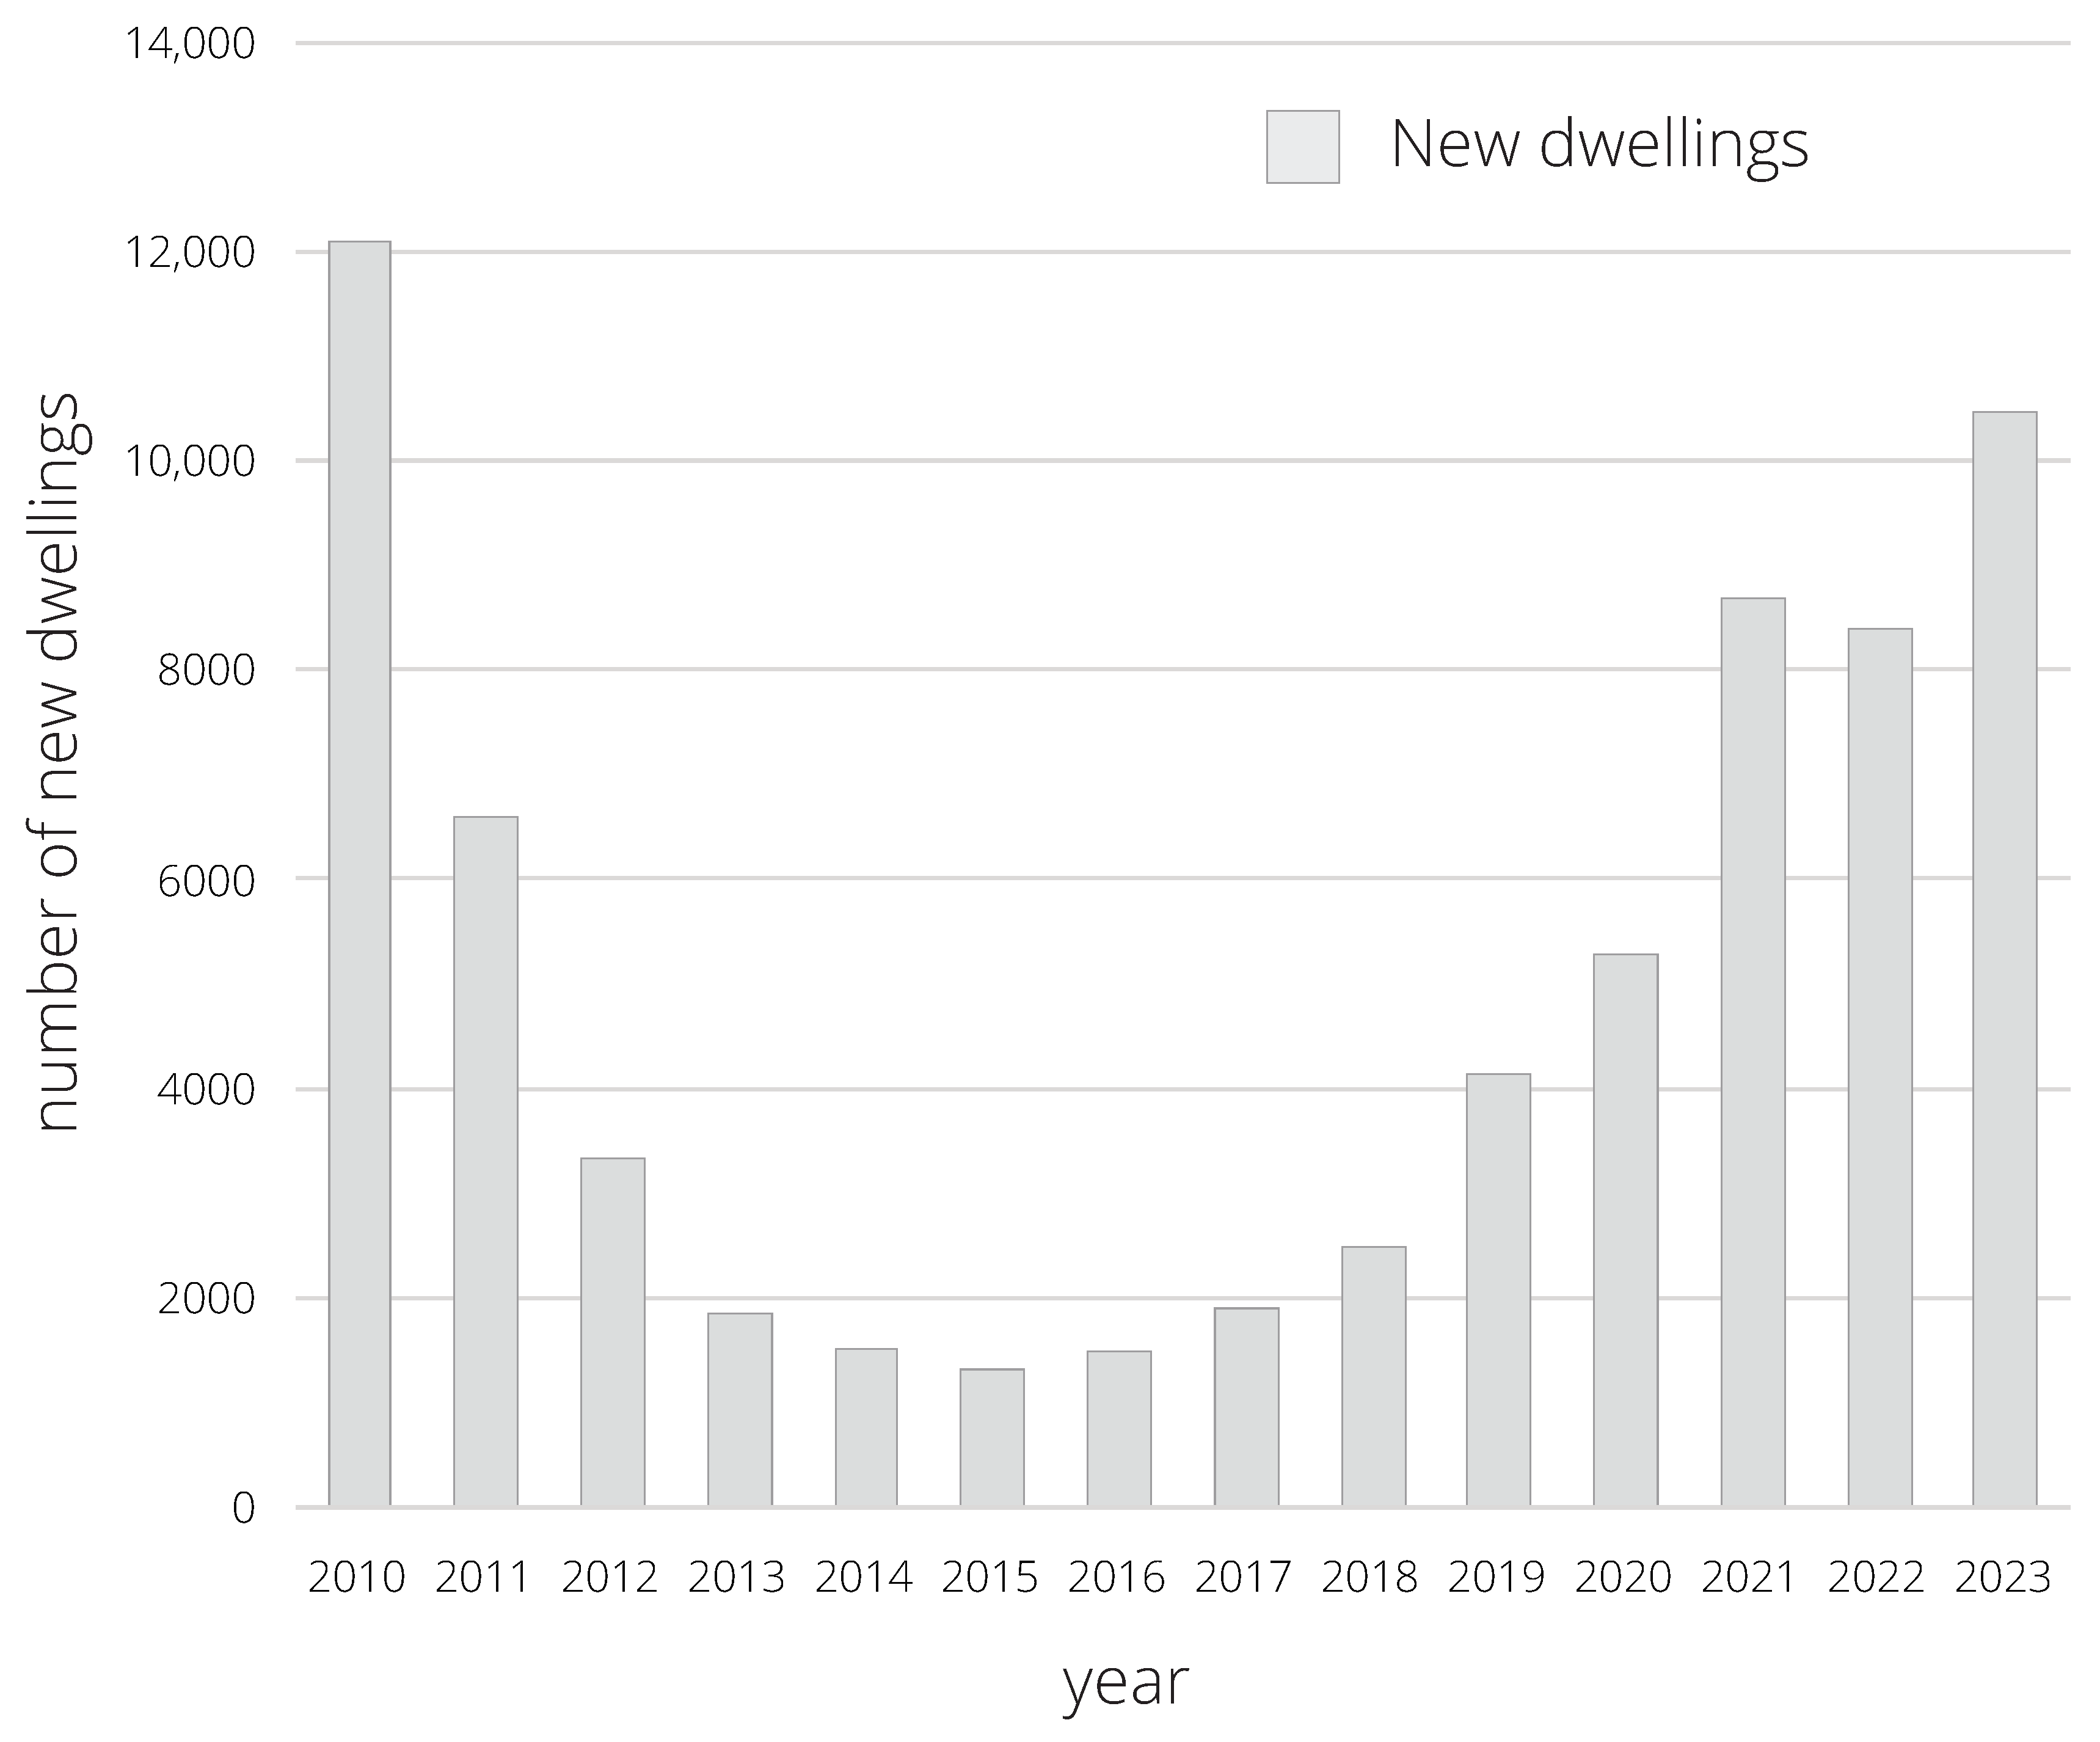
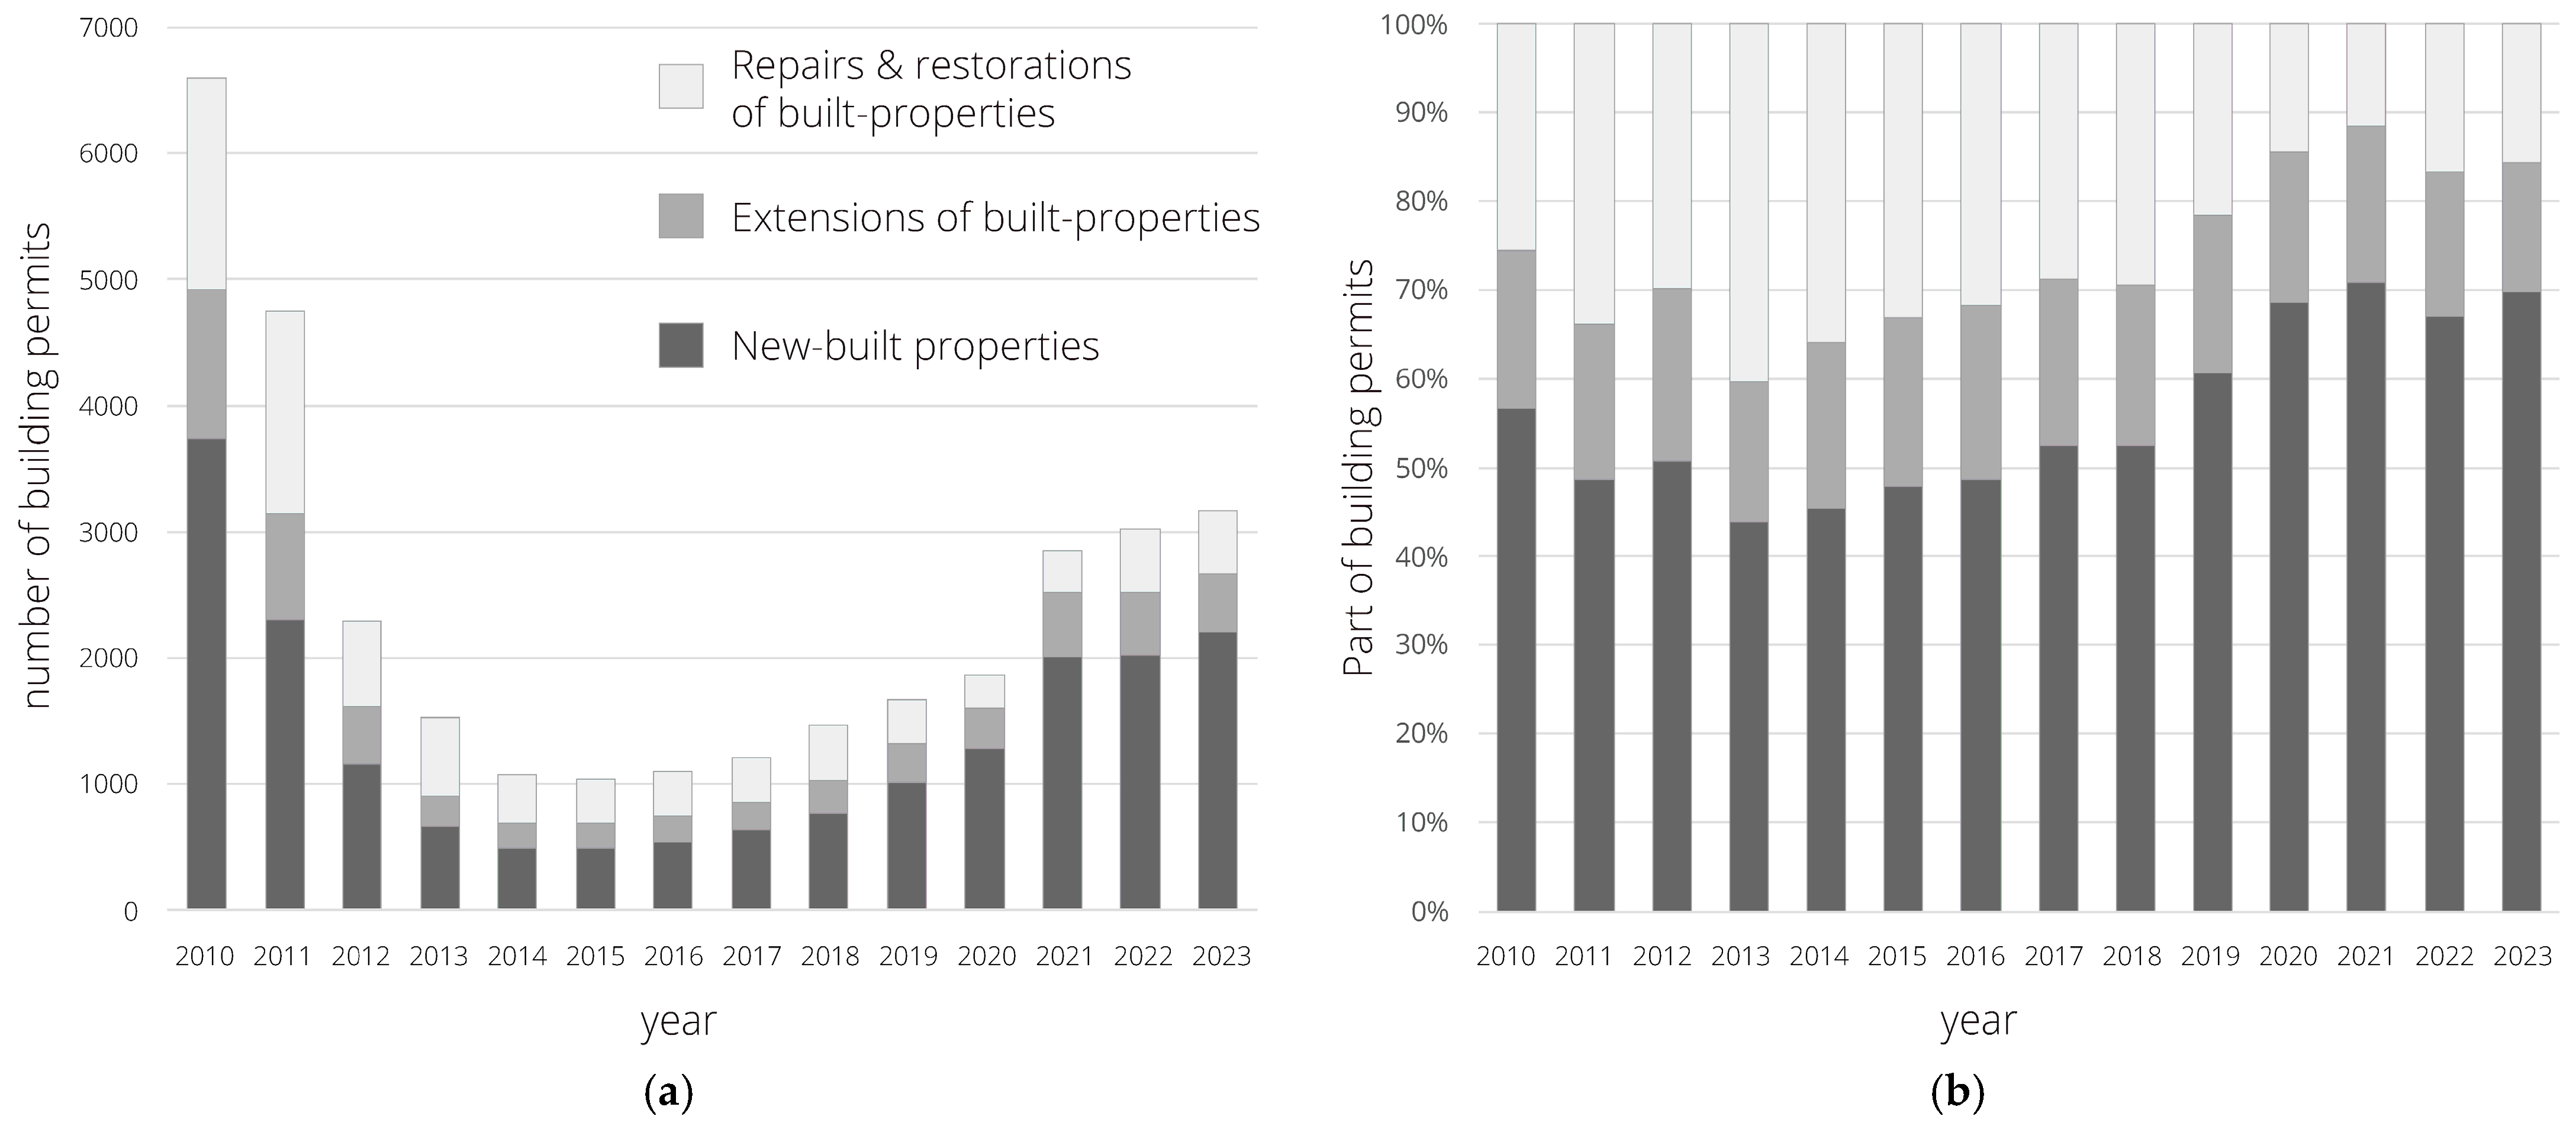
The economic crisis that began in Greece in 2010 has introduced profound changes to the land and construction system, as well as to the housing market in Athens. Declining incomes, rising unemployment, increased taxation, and elevated debt levels have exerted immense pressure on households and businesses, directly impacting the real estate sector. Construction activity has contracted, both in the development of new housing and in renovations (Figure 5 and Figure 6a,b), leaving the housing stock stagnant in quantity and declining in quality.
With the gradual economic recovery beginning in 2015, the construction sector has experienced a revival, characterized by a diverse range of activities and the participation of a wide array of actors. Both the construction of new buildings and the renovation or expansion of existing buildings have steadily increased, although growth experienced a slight deceleration in 2020 and a jump in 2021 due to the economic impact of the COVID-19 pandemic (Figure 6a). The prolonged economic crisis and austerity measures have increased the shares of extensions and repairs within the overall reduced building activity (Figure 6b), with the very reduced production of new housing leaving a significant quantitative and qualitative deficit in the housing sector. However, the current momentum in housing activity has not adequately addressed these deficits. Housing has re-emerged as an attractive investment sector, spurring increased production of new housing units (Figure 5), renovation projects (Figure 6a,b), and energy efficiency upgrades.
The ELSTAT data on the construction activity presented hereinabove provide a comprehensive view of the construction sector’s trajectory in Athens over time. However, they are available only at the municipal level; they cannot be used for detailed mapping at the local level and for correlating construction trends with the social profiles of specific areas.
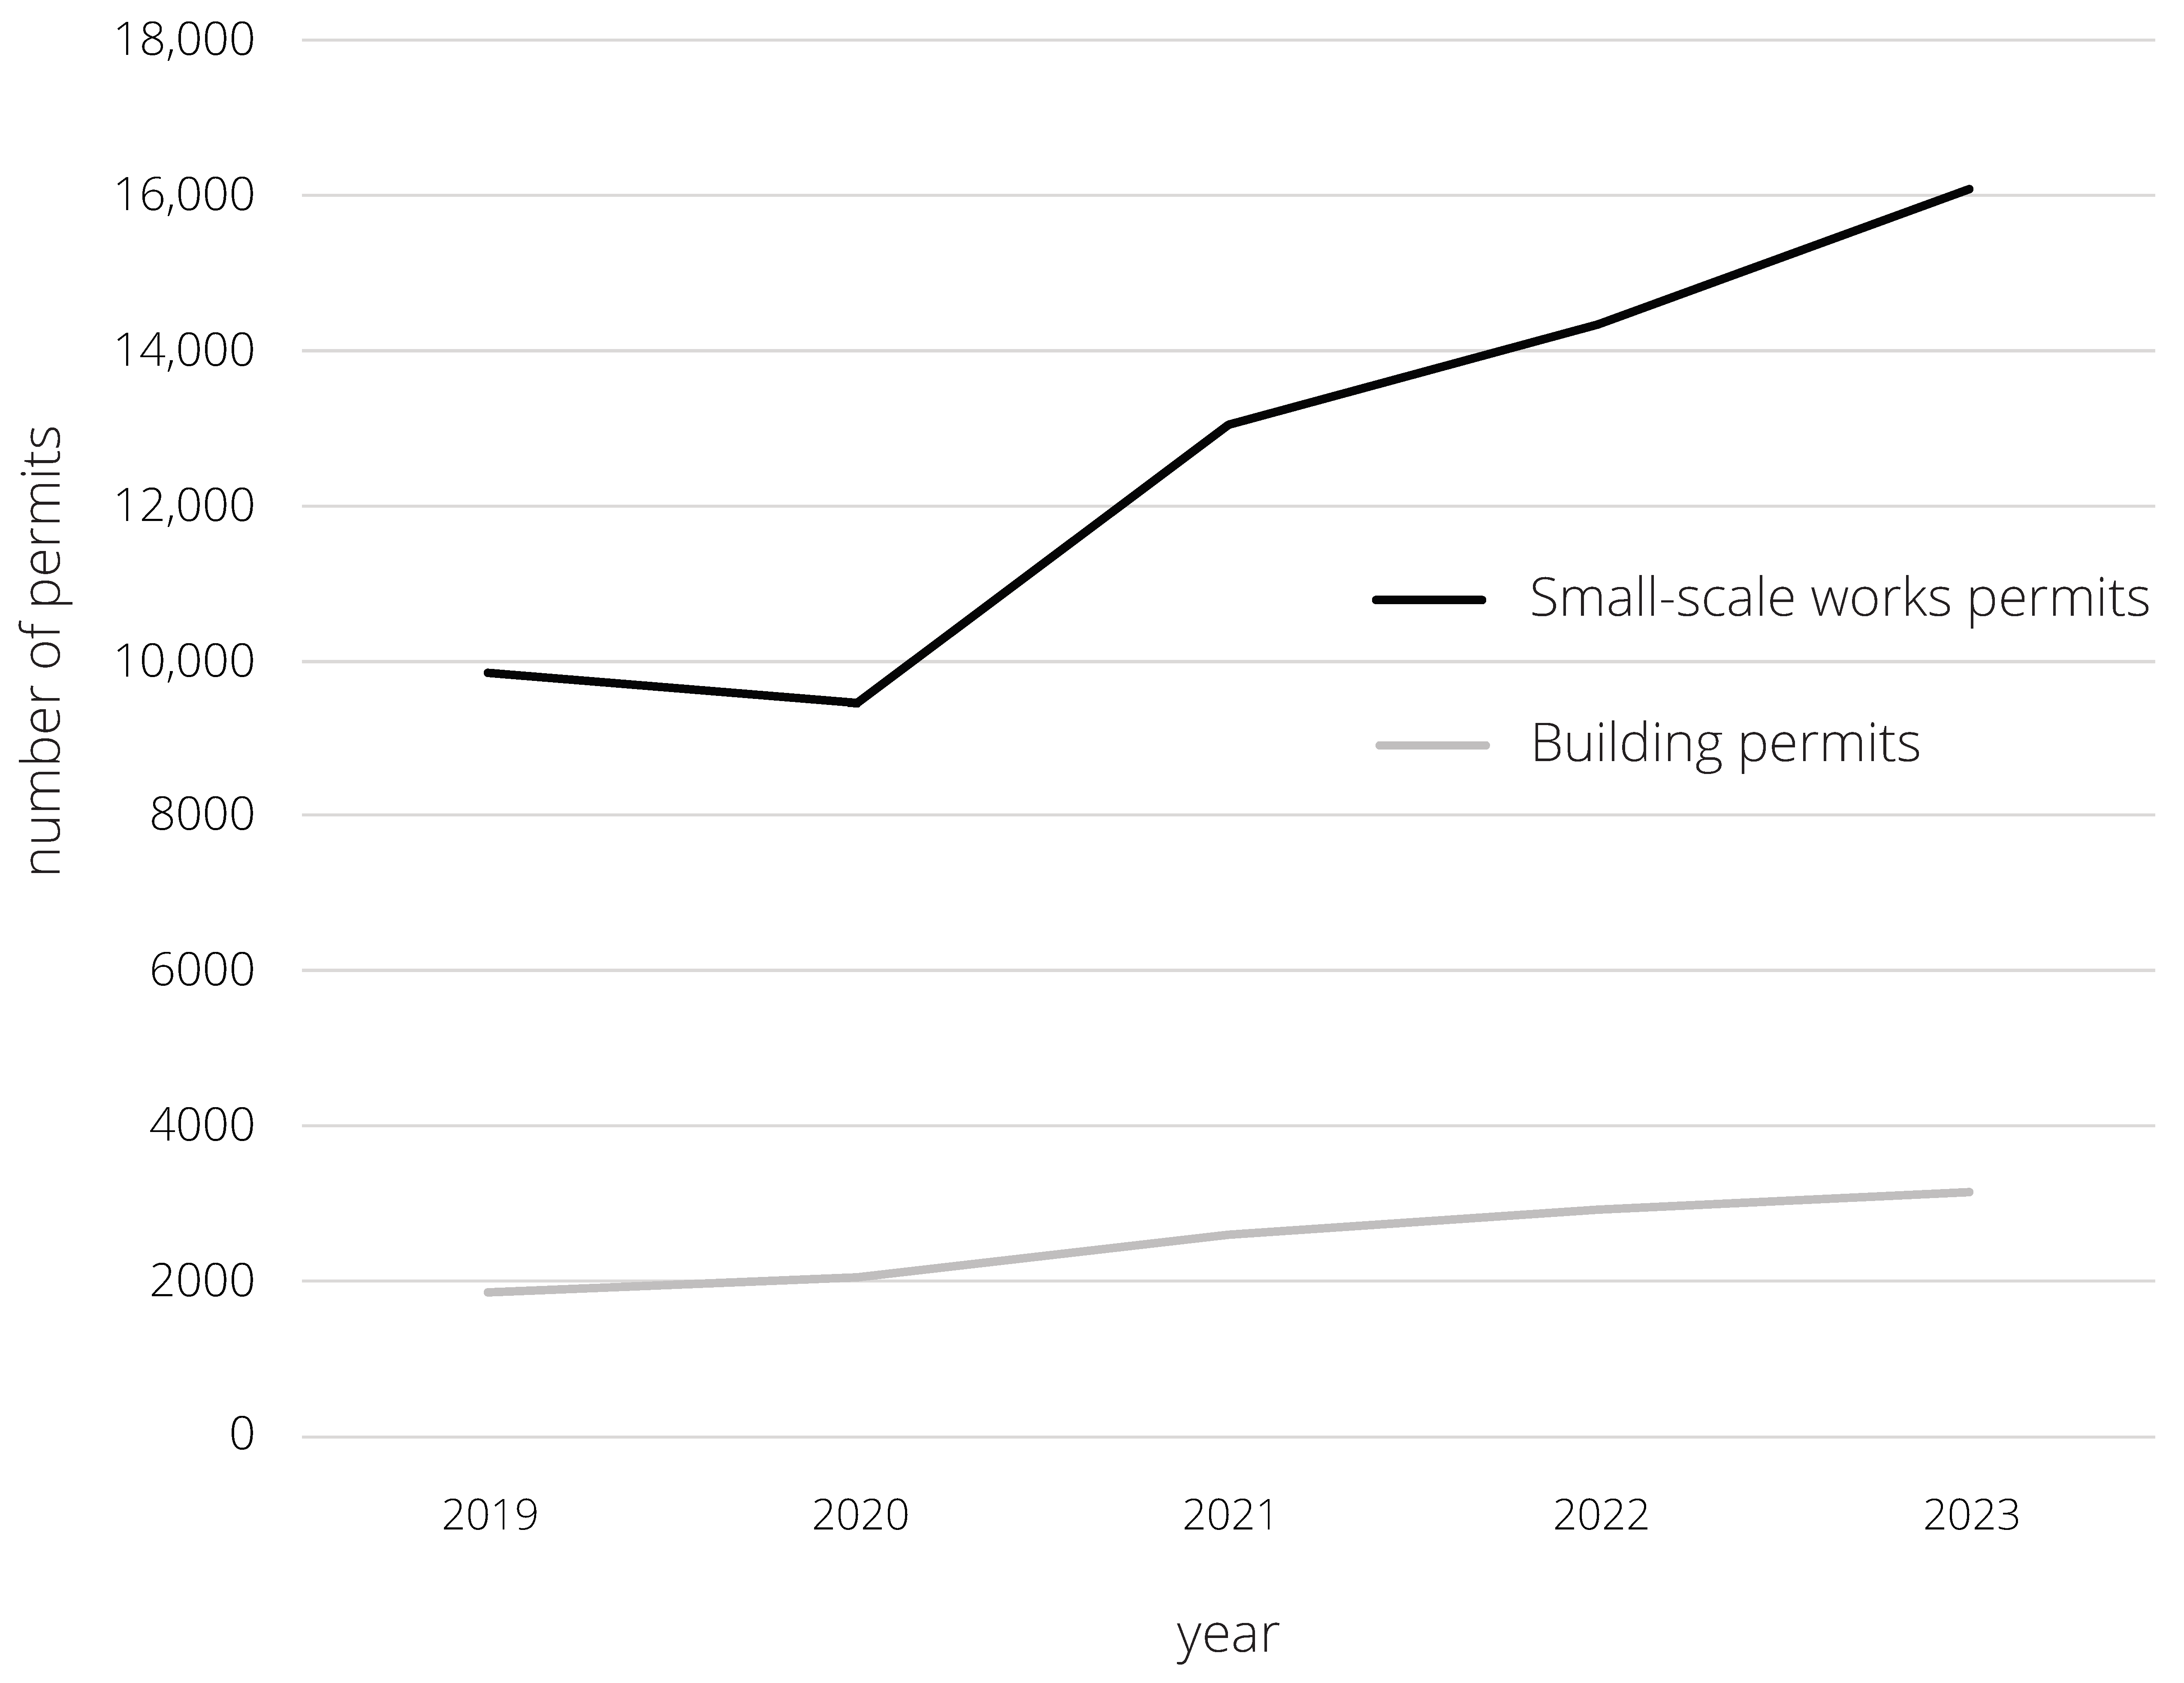
The data on construction activity in the AMA, as provided by the Technical Chamber of Greece (TCG), on a more detailed spatial level, are limited to the period from 2018 to 2023—a time characterized by a substantial increase in construction activity. Since 2019, building permits have shown a slow but steady increase. On the other hand, small-scale works permits, even with a limited decrease in 2020, show an impressive increase since then (Figure 7).
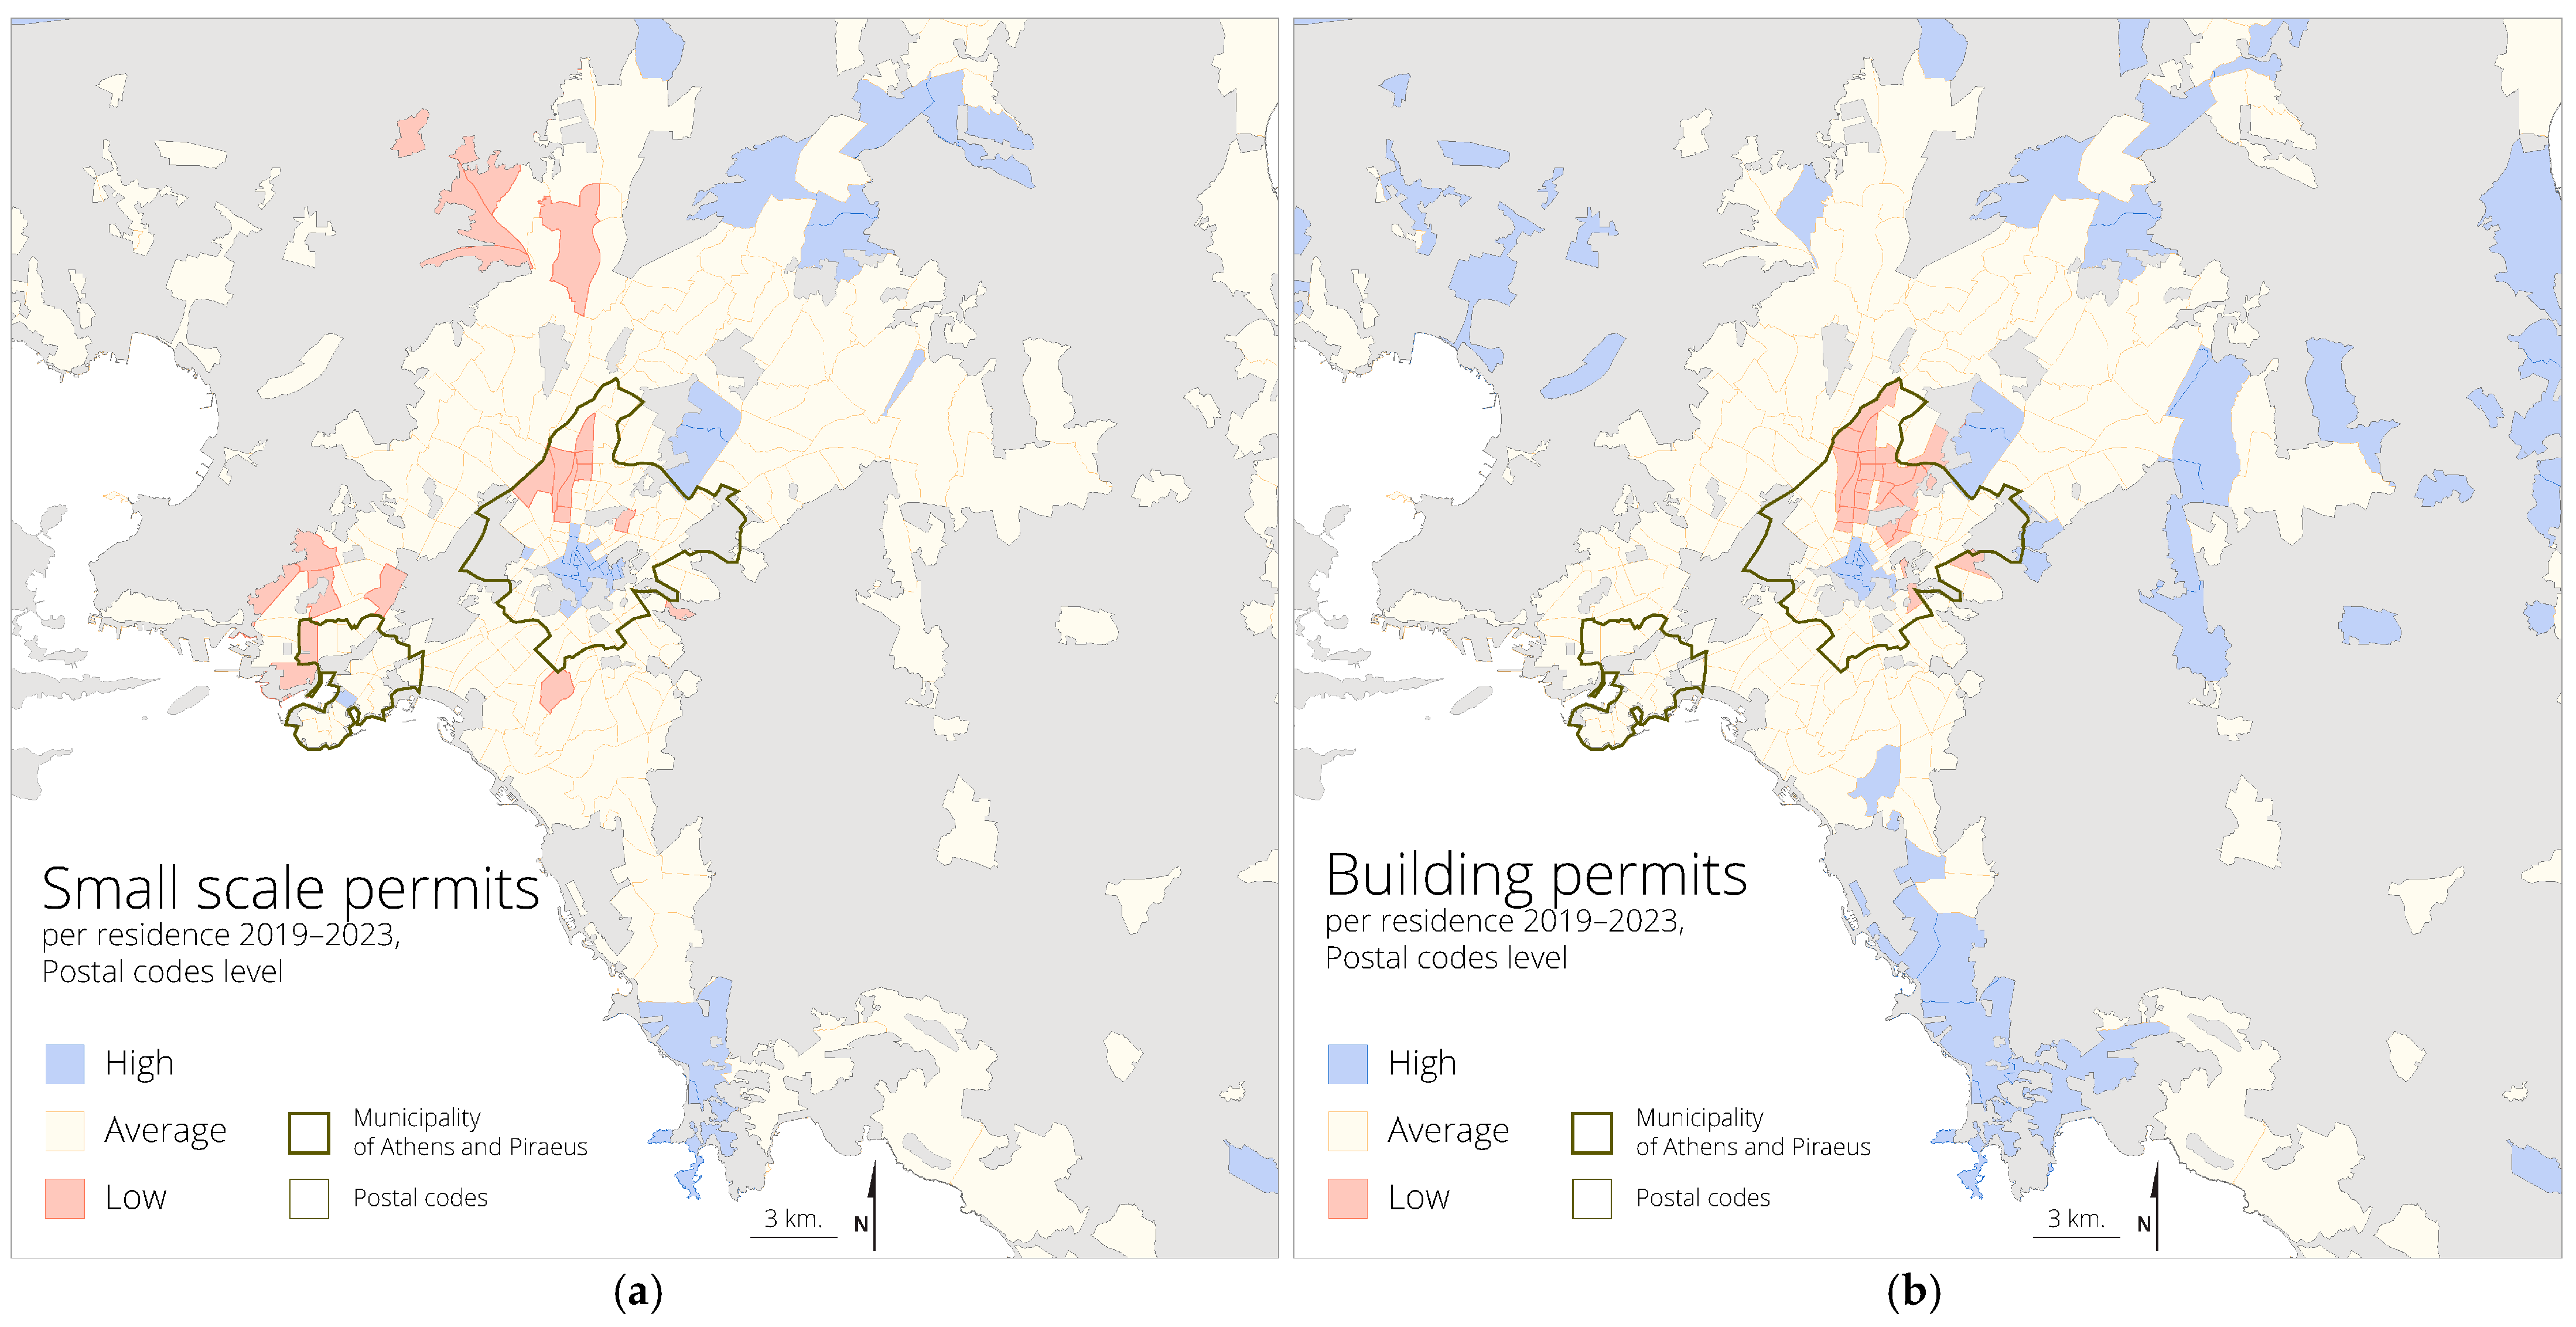
Moreover, the data provided by TCG clearly indicates that construction activity is expanding across the metropolitan area, although significant spatial differentiations are observed. Regarding new constructions, large-scale renovation works, and changes in use, the highest concentrations of building permits are observed in affluent northern and southern suburbs, such as Psychiko, Kifisia, and Glyfada, as well as in peri-urban areas like Thriasio and Mesogia plains and the eastern coastal regions, where substantial tracts of land remain available for development (Figure 8a). Additionally, a significant concentration of building permits is evident in large parts of Athens’ historical center (Figure 1). However, the activity in the historical center is less focused on new construction and more on extensive renovation projects (with budgets exceeding €25,000), particularly for hotels, which necessitate building permits. In contrast, the lowest concentration of new construction is observed in the central areas under social transformation of the historical center (Figure 1), where the lack of unbuilt land limits opportunities for constructing new buildings.
The spatial distribution of small-scale works permits (Figure 8b) closely mirrors that of building permits, a fact that reflects the interaction among the two segments of the building sector in terms of capital flow and the consolidation of real estate interest in certain areas of Athens. The highest concentrations are found in upper-class northern and southern suburbs, as well as in significant parts of Athens’ historical center and the central area of Piraeus (Figure 1). Conversely, the lowest concentrations of permits for small-scale works are recorded in central areas under social transformation (Figure 1), even though these areas contain some of the oldest, most degraded, and energy-inefficient housing stock and high levels of mobility in property transactions. Similarly, low concentrations of small-scale work permits are observed in working-class districts of western Athens, including Acharnes and Fili (Figure 1), as well as in municipalities around Piraeus (Figure 1). These areas are predominantly characterized by low-income, working-class populations, which likely cannot afford investments in renovation activities.
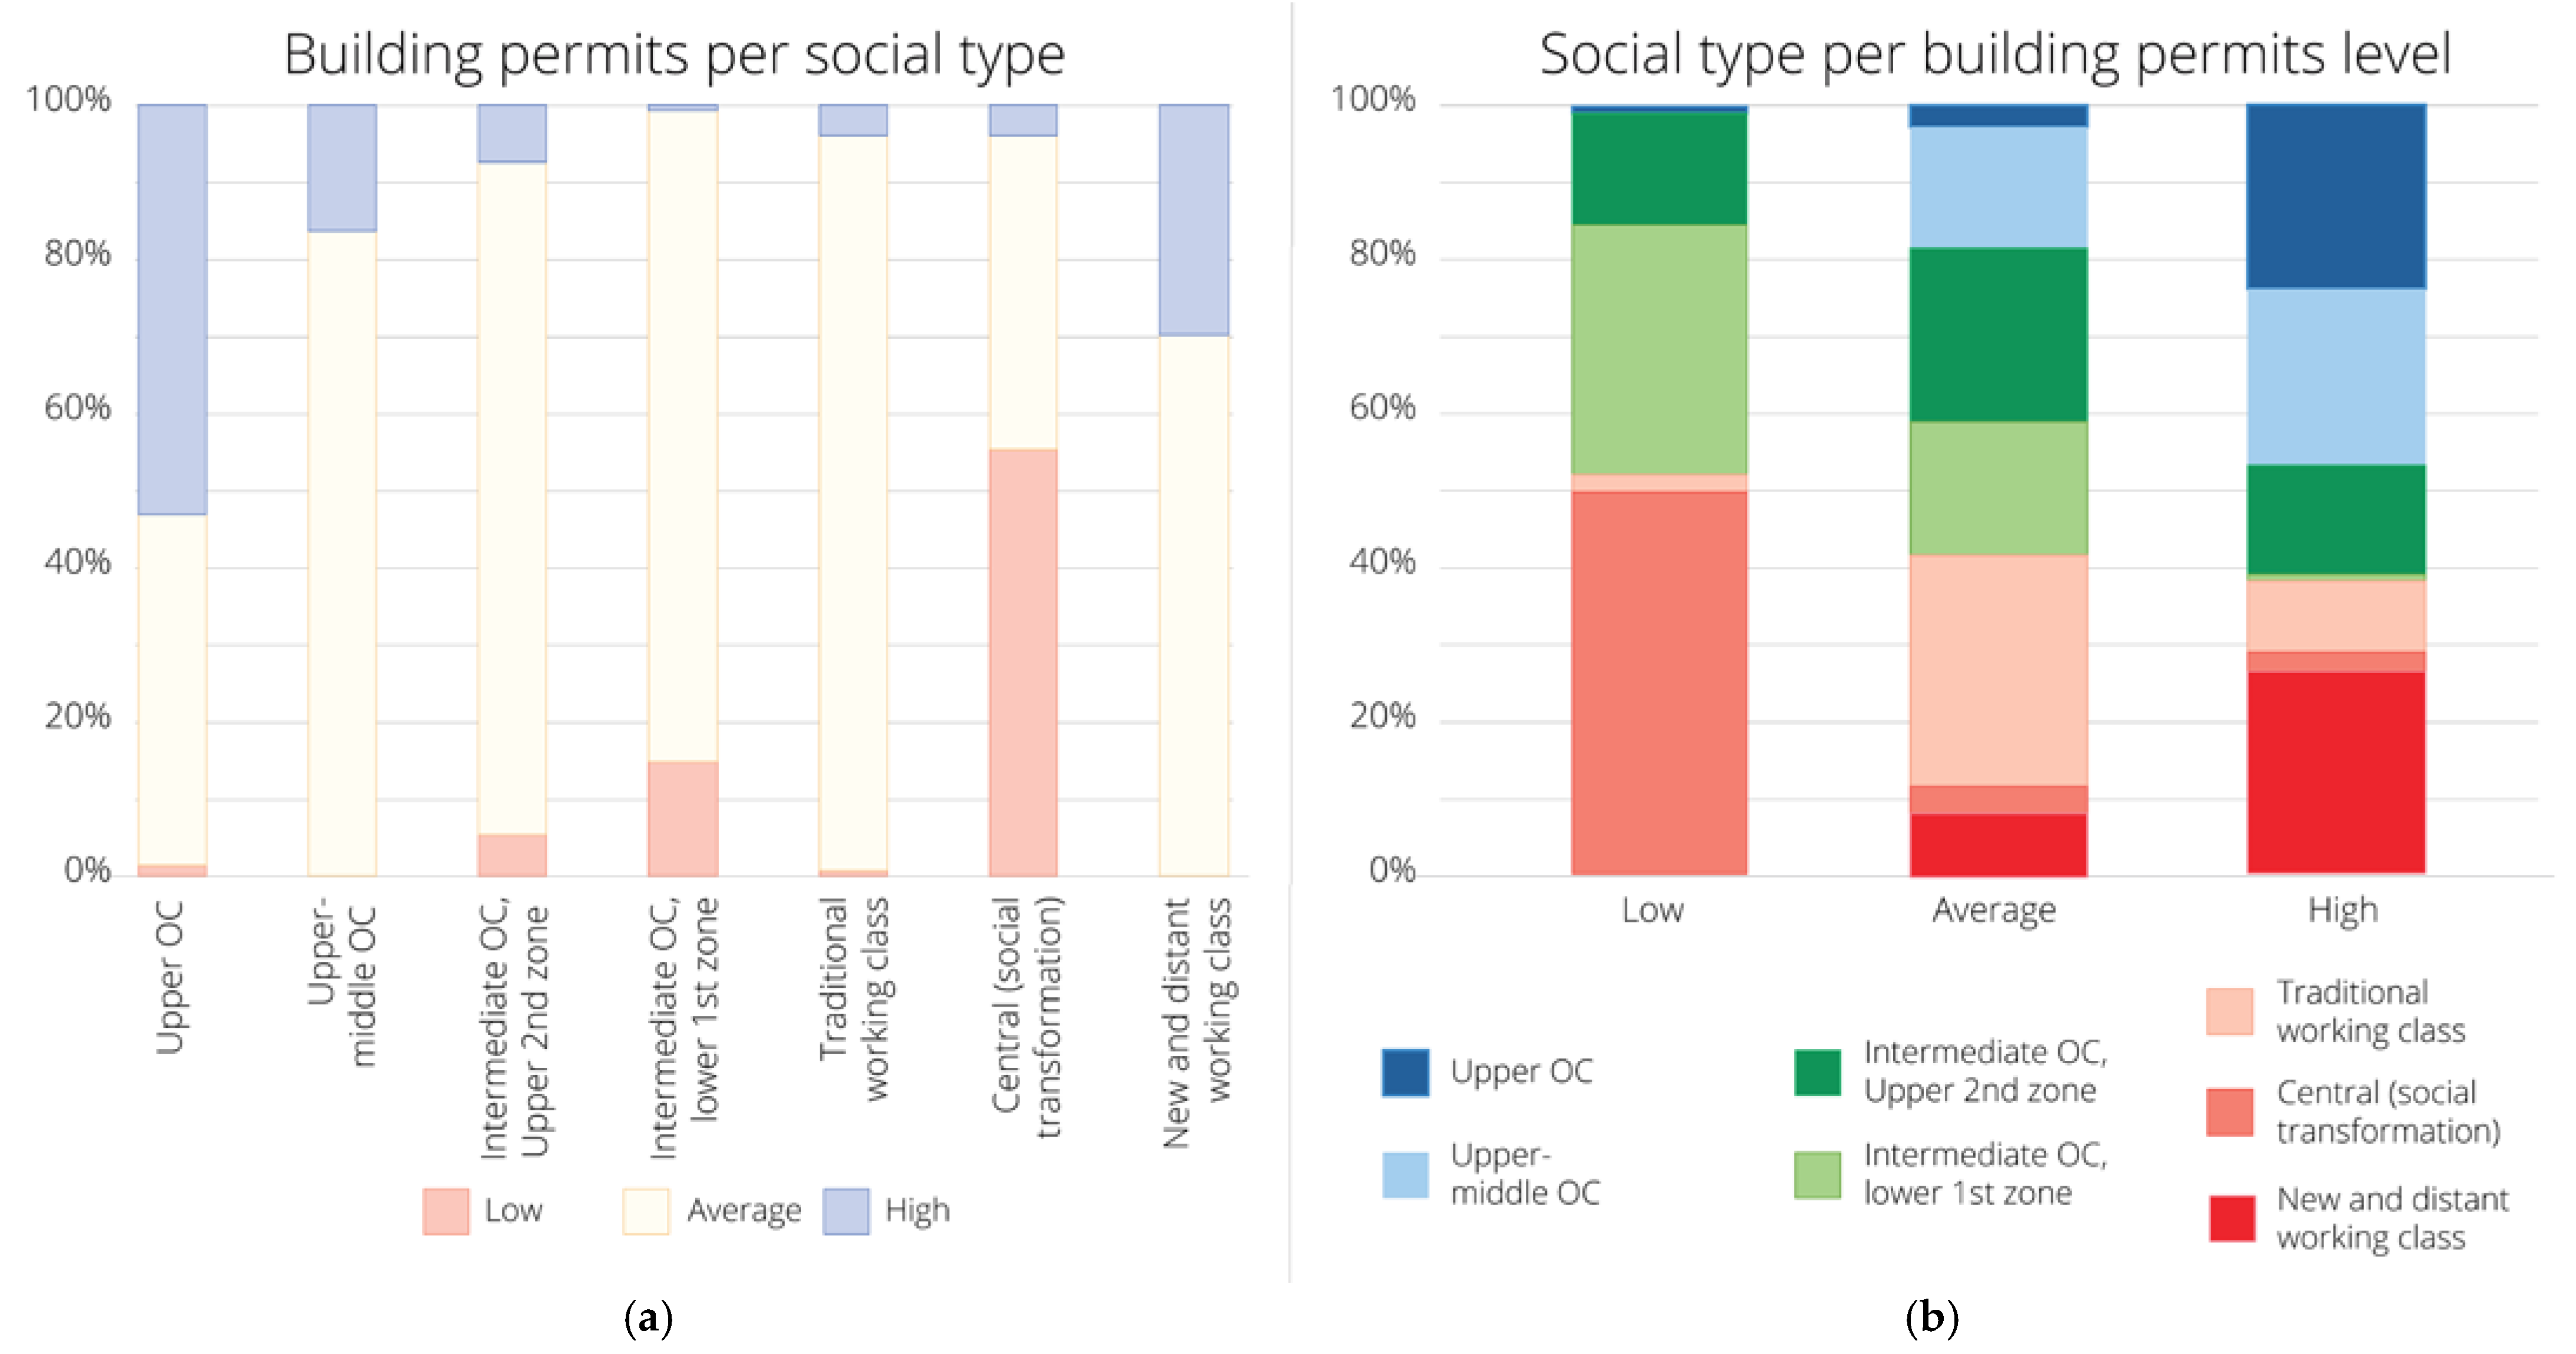
Regarding the spatial distribution of building permits based on the social profile of different areas in Athens, Figure 9a indicates that, between 2019 and 2023, approximately 45% of the URANUs with an overrepresentation of upper and upper-middle occupational categories and 30% of the URANUs with an overrepresentation of newly developed and more distant working-class categories present high concentrations of new buildings and large-scale renovation works. Conversely, central areas under transformation exhibit very low concentrations of building permits. Additionally, very low concentrations of building permits are recorded in areas of intermediate occupational categories (Figure 9b).
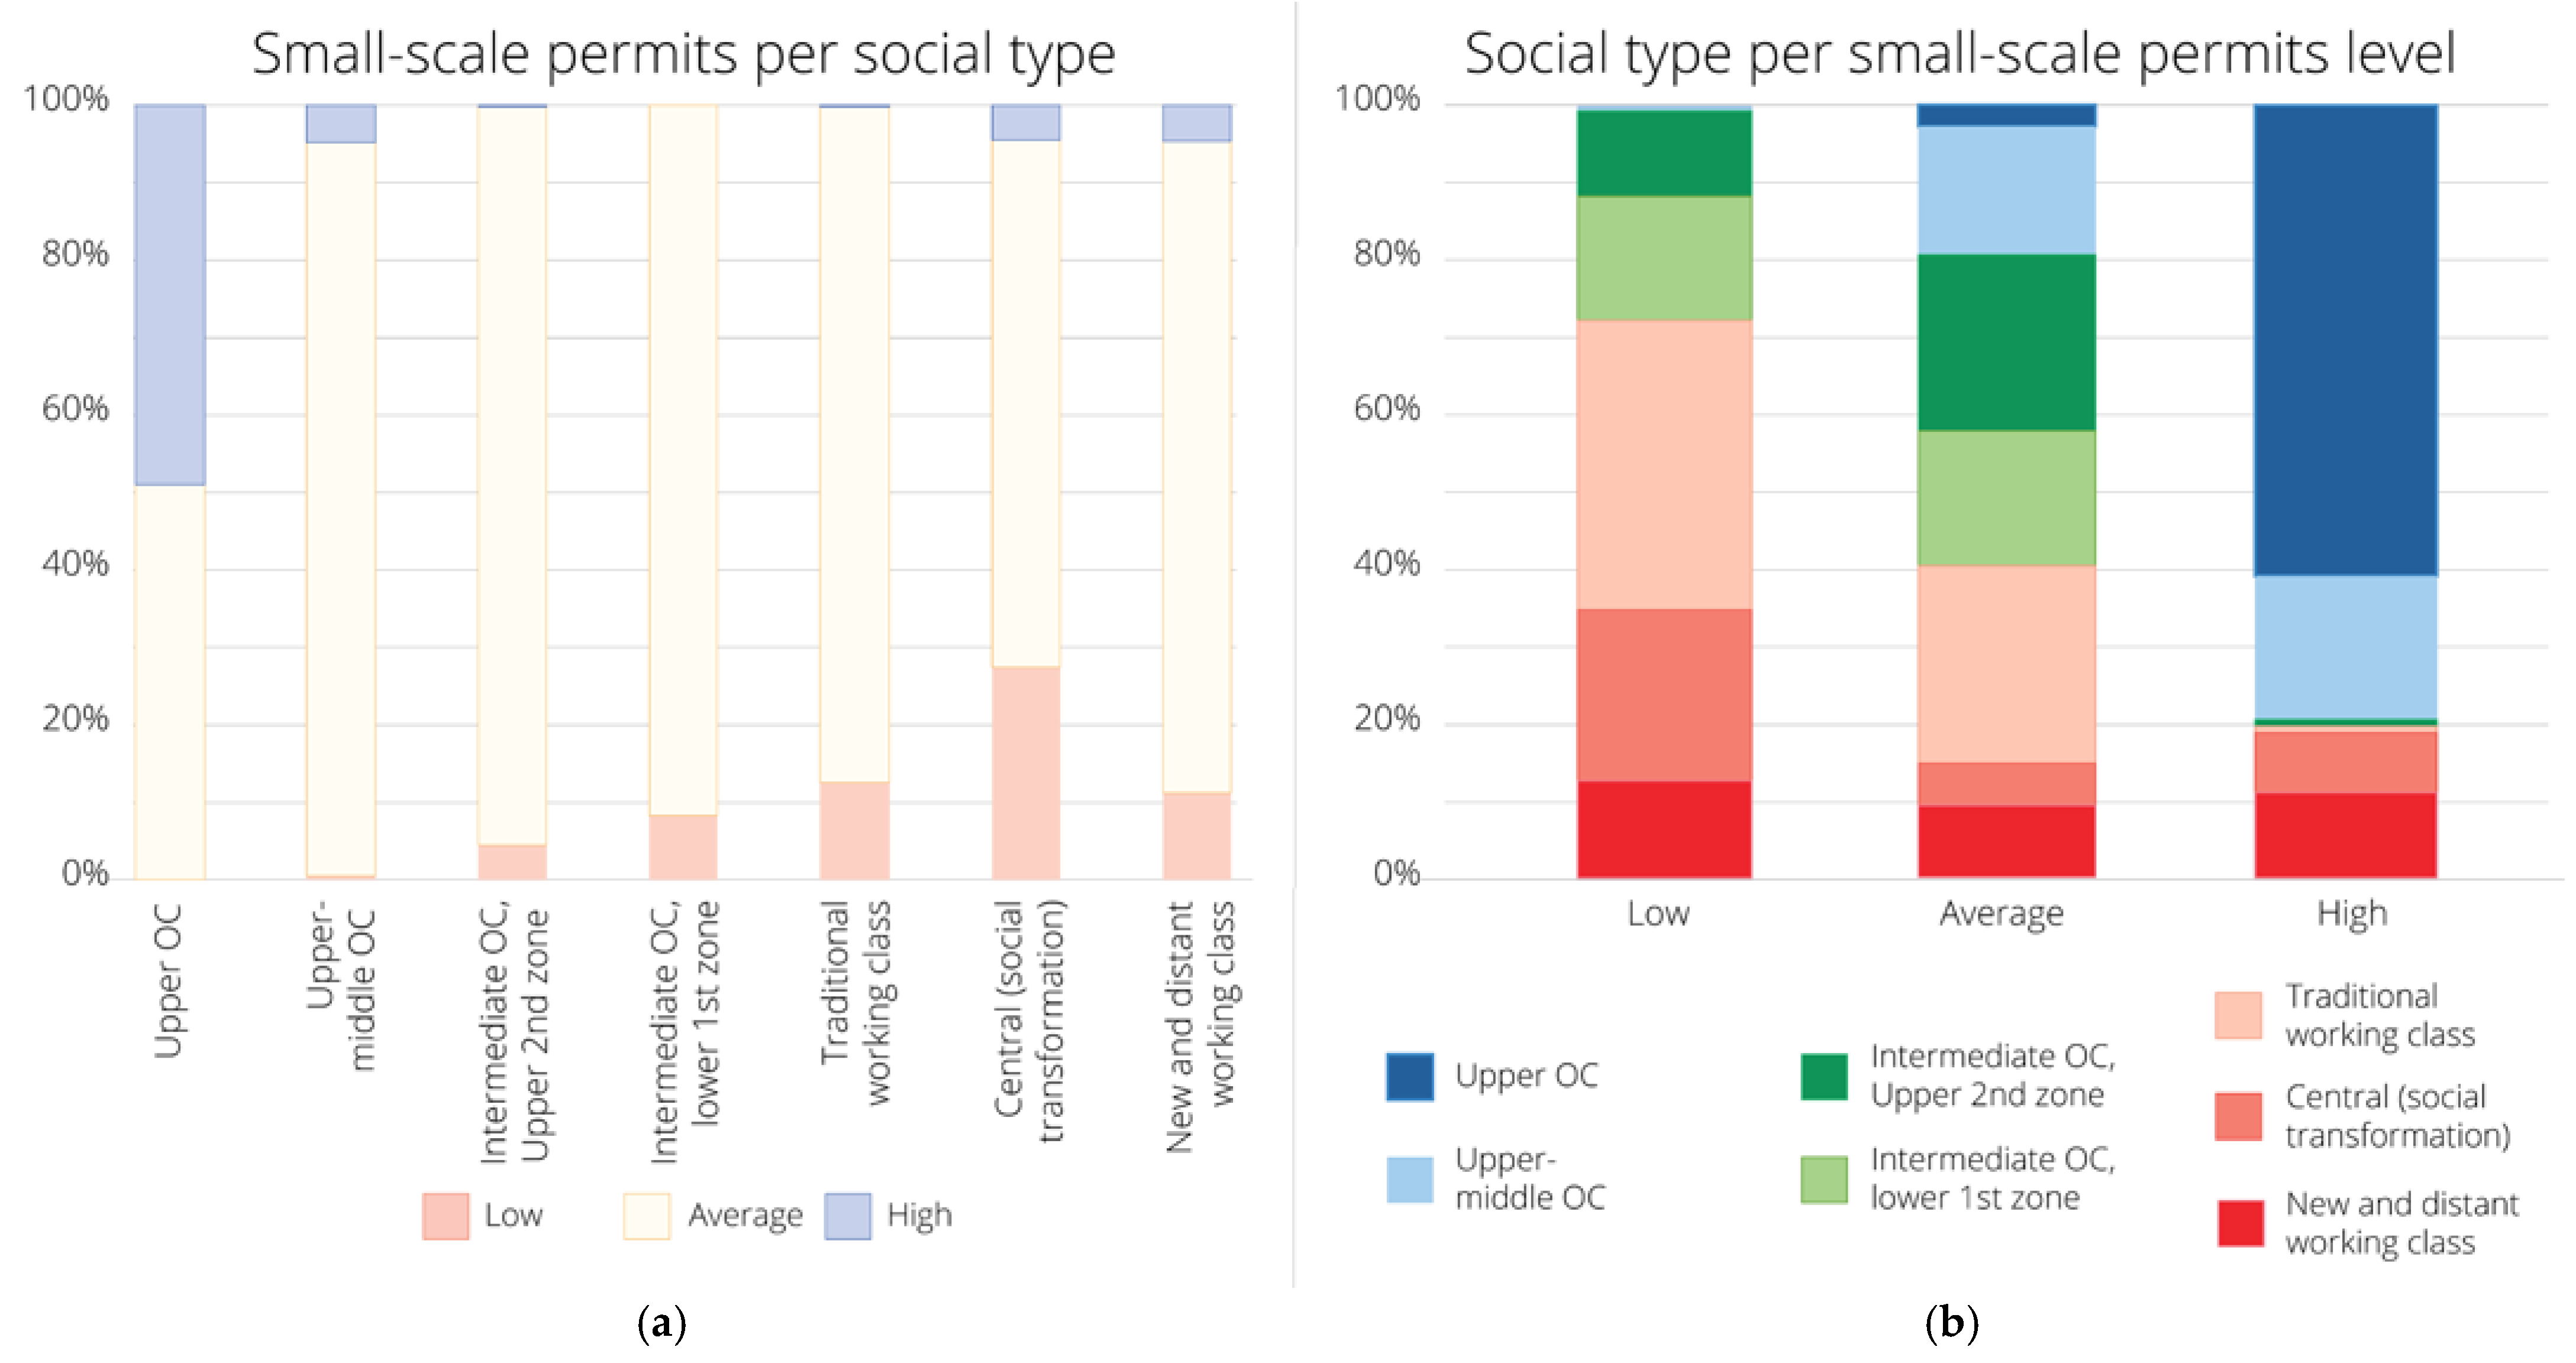
Regarding the spatial distribution of small-scale works permits based on the social profile of different areas in Athens, there is an overrepresentation in the areas of the upper and upper-middle occupational categories (Figure 10a,b). On the other hand, very low concentrations of renovation activity are recorded in working-class areas (Figure 10a).

3.2. The Shifting Landscape of Athens’ Housing Market and Sociospatial Differentiations

Housing is a complex sector shaped by a combination of economic, social, institutional, and spatial factors operating at local, national, and global levels [42]. Sales trends are primarily influenced by macroeconomic conditions, including interest rates, household incomes, and access to mortgage financing, while rental trends are largely determined by demographic shifts, urbanization, and tourism demand. Government policies, such as property taxation, housing subsidies, land use regulations, and property transaction systems, alongside external factors like foreign investment and short-term rental platforms, further differentiate these trends across urban areas. Spatially, these variations are driven by factors such as land availability, infrastructure development, large-scale investments, urban planning regulations, the beauty of the natural environment, the socio-economic characteristics of neighborhoods, as well as prevailing perceptions and the social value attributed to specific areas. The housing market is characterized by significant fluctuations, alternating between periods of growth and recession. In Athens, due to the sector’s substantial role in the economy, these fluctuations closely align with the city’s broader development dynamics, including construction activity [8].
The economic crisis that struck Greece in 2010 had a profound impact on property transactions [43], particularly in the housing market. Residential properties have been devalued under the combined weight of high taxes, low or negligible rental yields, and costly maintenance, transforming them from an asset that provides security into a burden for many property owners. Consequently, housing market demand has diminished significantly, leading to substantial reductions in sales and rental prices [44]. Many properties remained vacant [45,46], and early signs of asset accumulation by domestic and foreign investment groups are becoming evident. Simultaneously, government policies have prioritized the privatization of public land and the facilitation of large-scale investments (e.g., Hellinikon, Asteras, Olympic assets, the port of Piraeus), which shaped new trends in the real estate market and opened new opportunities for capital investment in residential assets in the AMA.
The housing market began to recover after 2015, marked by a steady increase in demand for both rental housing and property sales [43]. A significant portion of Athens’ housing stock is utilized for short-term rentals as part of the city’s touristification [20] or is purchased by foreign investors—both individuals and corporations—often facilitated by public policies such as Golden Visas [47]. These trends have contributed to rising rental and sales prices, rendering housing increasingly unaffordable for a substantial segment of the city’s population. Simultaneously, a considerable portion of the housing stock remains inactive, either due to complexities in ownership structures or the poor condition of these properties. A slight slowdown in the local housing market in 2020 is directly linked to the challenges posed by measures to control the COVID-19 pandemic, as well as the broader economic impact of the pandemic.
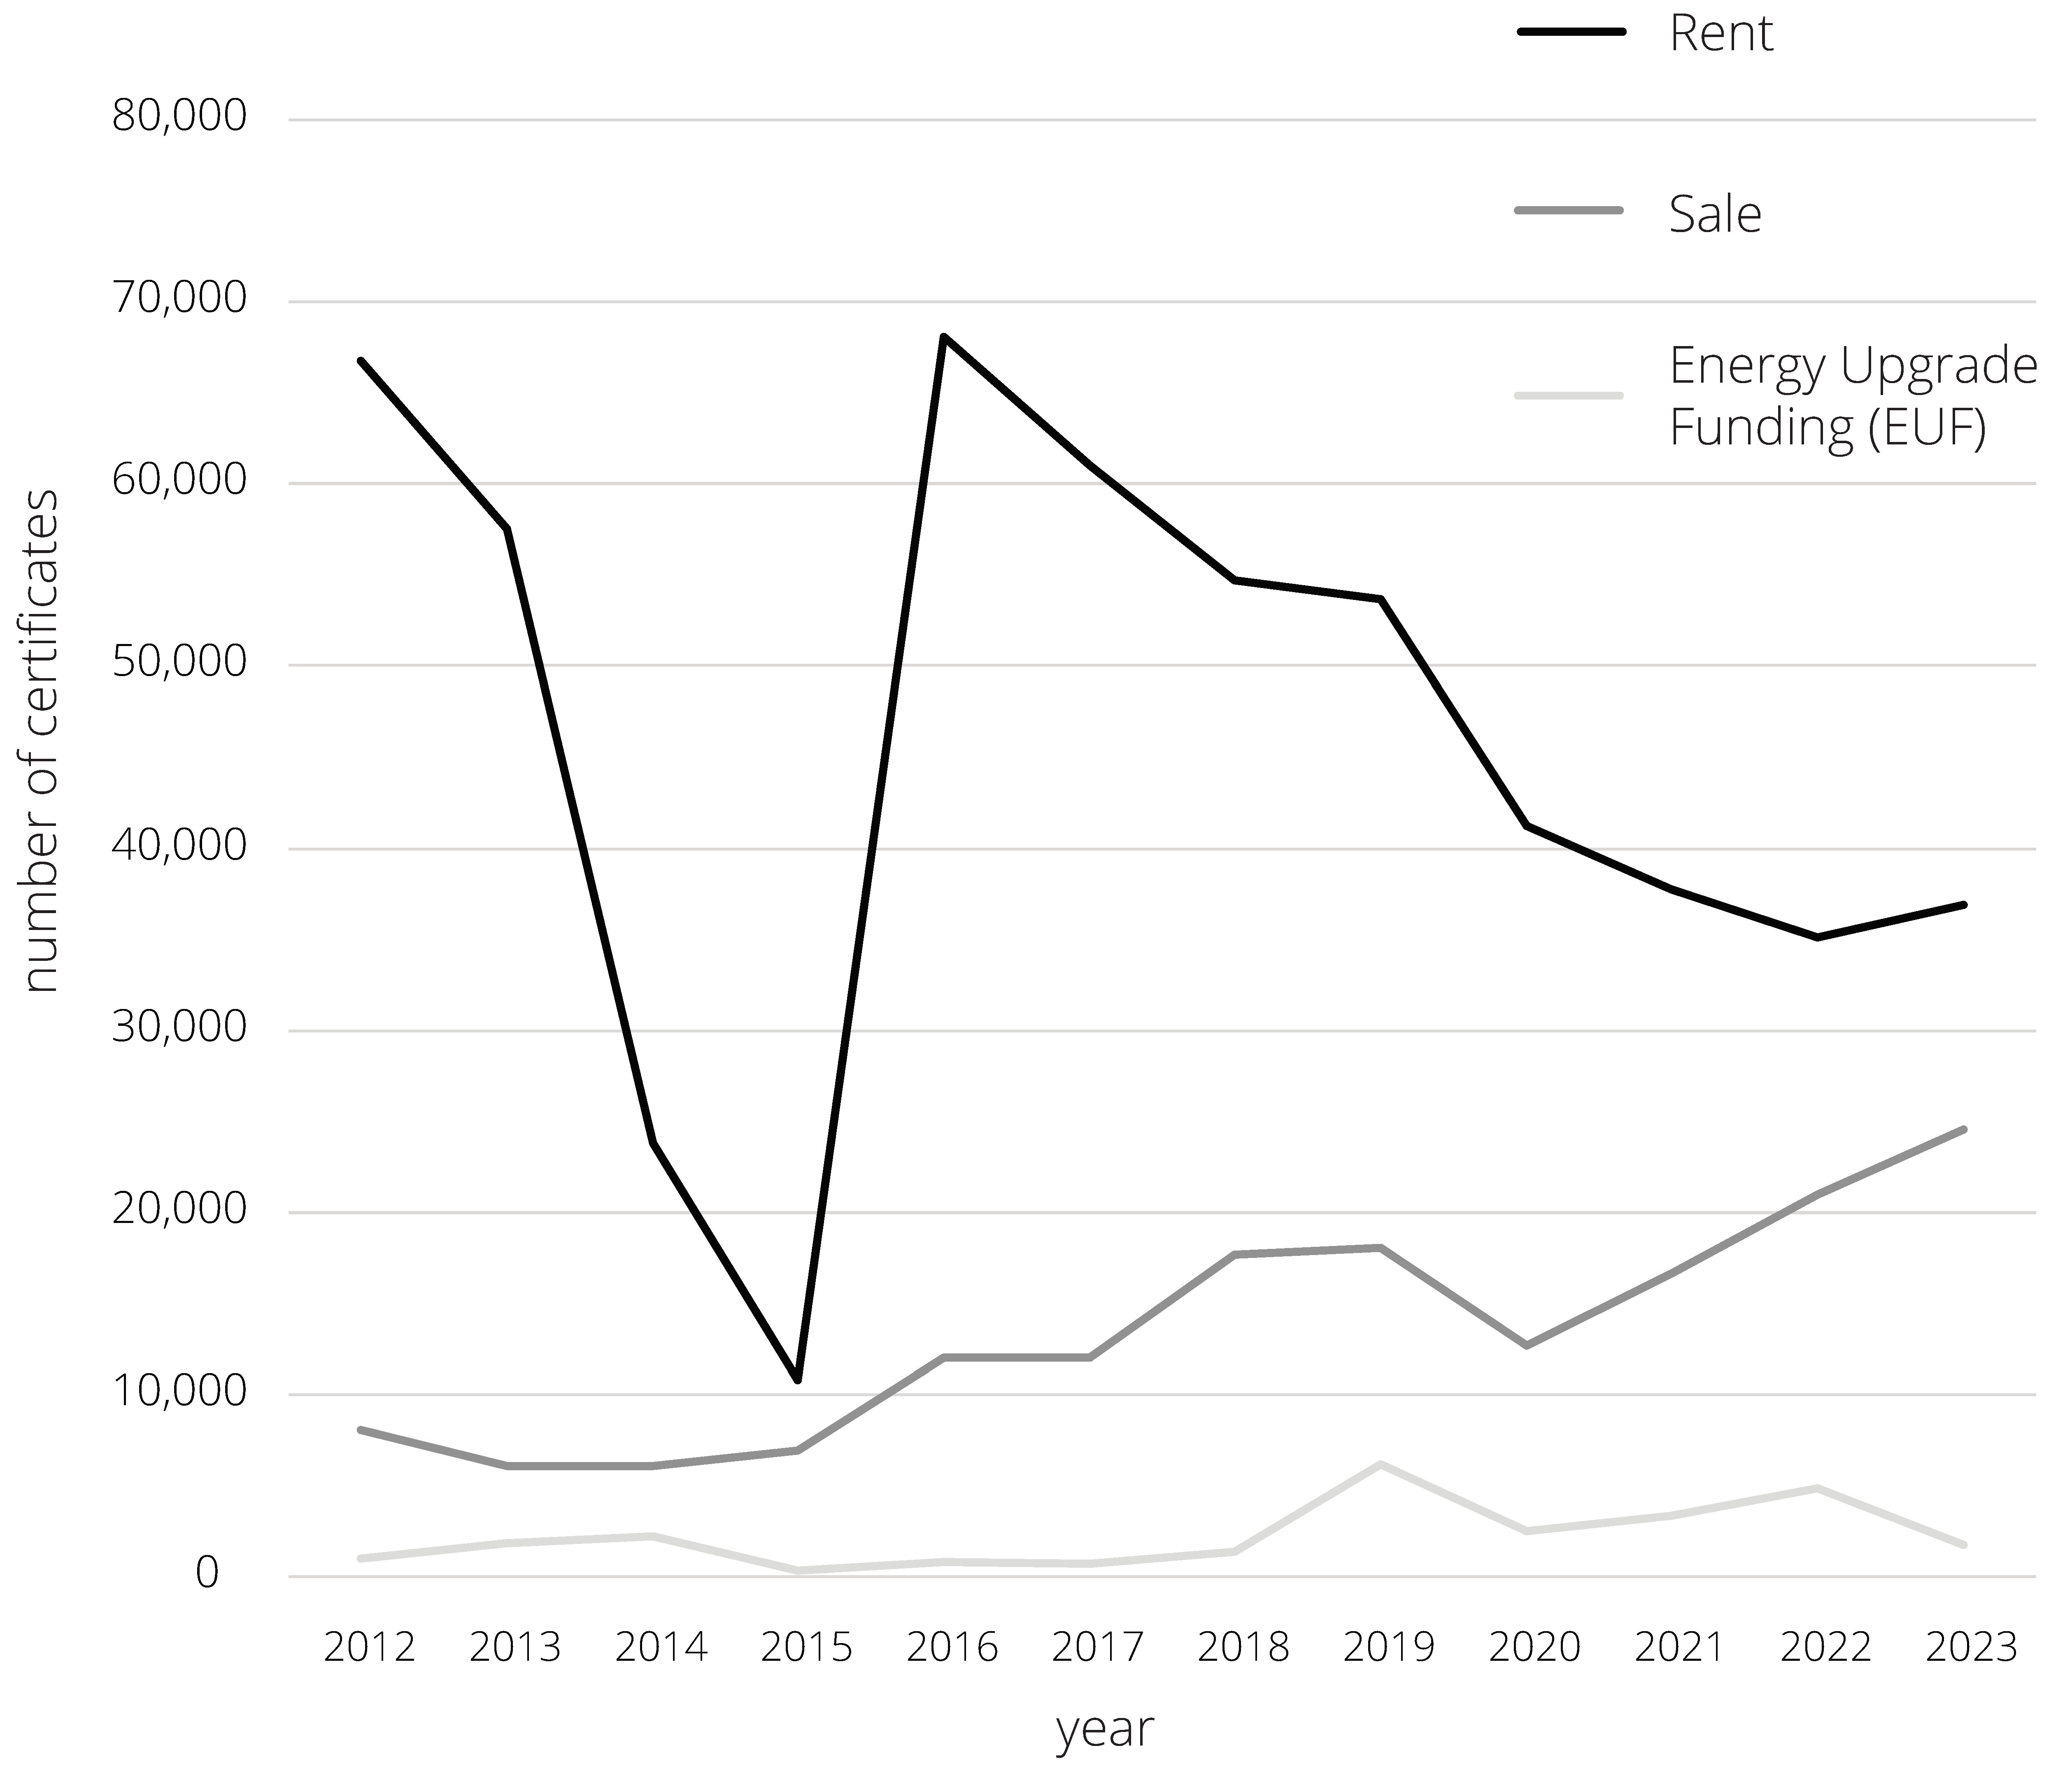
Although precise data on residential sales and rentals in Athens are unavailable, a general understanding of spatial trends for the period 2012 to 2023 can be constructed using data of EPCs issued by the Ministry of Environment and Energy (Figure 11). As expected, the evolution of the annual number of EPCs issued for rental properties since 2012 is strongly connected to the state of the Greek economy. We observe a sharp decrease in new EPCs for a 3-year period (2012–2015), a period of financial decline, political instability, and extreme austerity measures. After 2015, there is an impressive increase, since the market recovers rapidly, returning to its pre-2012 standards by 2016. Since then, the issuing of new EPCs shows a steady decrease, which should be linked to the fact that a declining number of properties have not already issued an EPC, as well as that the certificate has a 10-year validity period. The limited increase observed after 2022 is probably a post-COVID19 market reflex.
The sales of dwellings were also influenced by the turbulent 2012–2015 period, although to a lesser extent. During the crisis, the real estate market seemed to experience more of a slowdown than a full decline. Since 2015, however, it has followed a steady upward trajectory, with the only notable exception being during the pandemic, from 2019 to 2020, when a 30% drop in sales was recorded. Overall, sales have demonstrated consistent growth throughout this period. The distribution of EPCs issued for EUF over time should be closely tied to the frequency of calls and the overall budget allocated to the program.
The spatial distribution of the EPCs issued for the sale and rental of residential properties is illustrated in Figure 12a,b. With respect to sales, the highest concentration of EPCs of homes for sale is observed in the historical center of Athens and in a large area around it, both in upper-class and working-class neighborhoods (Figure 12a), where demand for real estate is high due to tourism and/or gentrification processes [20]. Moreover, concentration is also high in the center of Piraeus, in some old suburban bourgeois areas, as well as in the coastal areas along the Athenian Riviera (Figure 1). The findings about the high concentration of EPCs for housing units for sale are aligned with the spatial concentration of foreign investment in the city’s housing stock [48]. Conversely, a low concentration of homes for sale is primarily found in the western districts of Athens and in peri-urban areas.
The EPCs to rent a housing unit have a slightly different pattern of spatial distribution (Figure 12b). High concentration is observed in the central areas of Athens, mainly its southeastern part and its adjacent municipalities like Zografou. These areas comprise the city’s historical center and the upper, upper-middle, and middle-middle-class neighborhoods of the broader city center. This concentration is expected compared to the suburbs and, even more, the city’s outer periphery. However, the difference with the equally central but socially different neighborhoods in the northern part of the Municipality of Athens, where rent tenure is equally high, can be attributed to its lower social profile, the reduced demand from upper- and middle-class tenants, and consequently lower residential mobility. Additionally, it is possible that some housing units in these areas are rented informally without obtaining an EPC. All in all, we claim that, although the spatial distribution of rental housing is not unexpected, as it aligns with the patterns observed in the distribution of rental housing reported in the ELSTAT census [34], a high concentration of EPCs for rental housing in certain areas can be interpreted as an indication of heightened mobility in the rental sector.
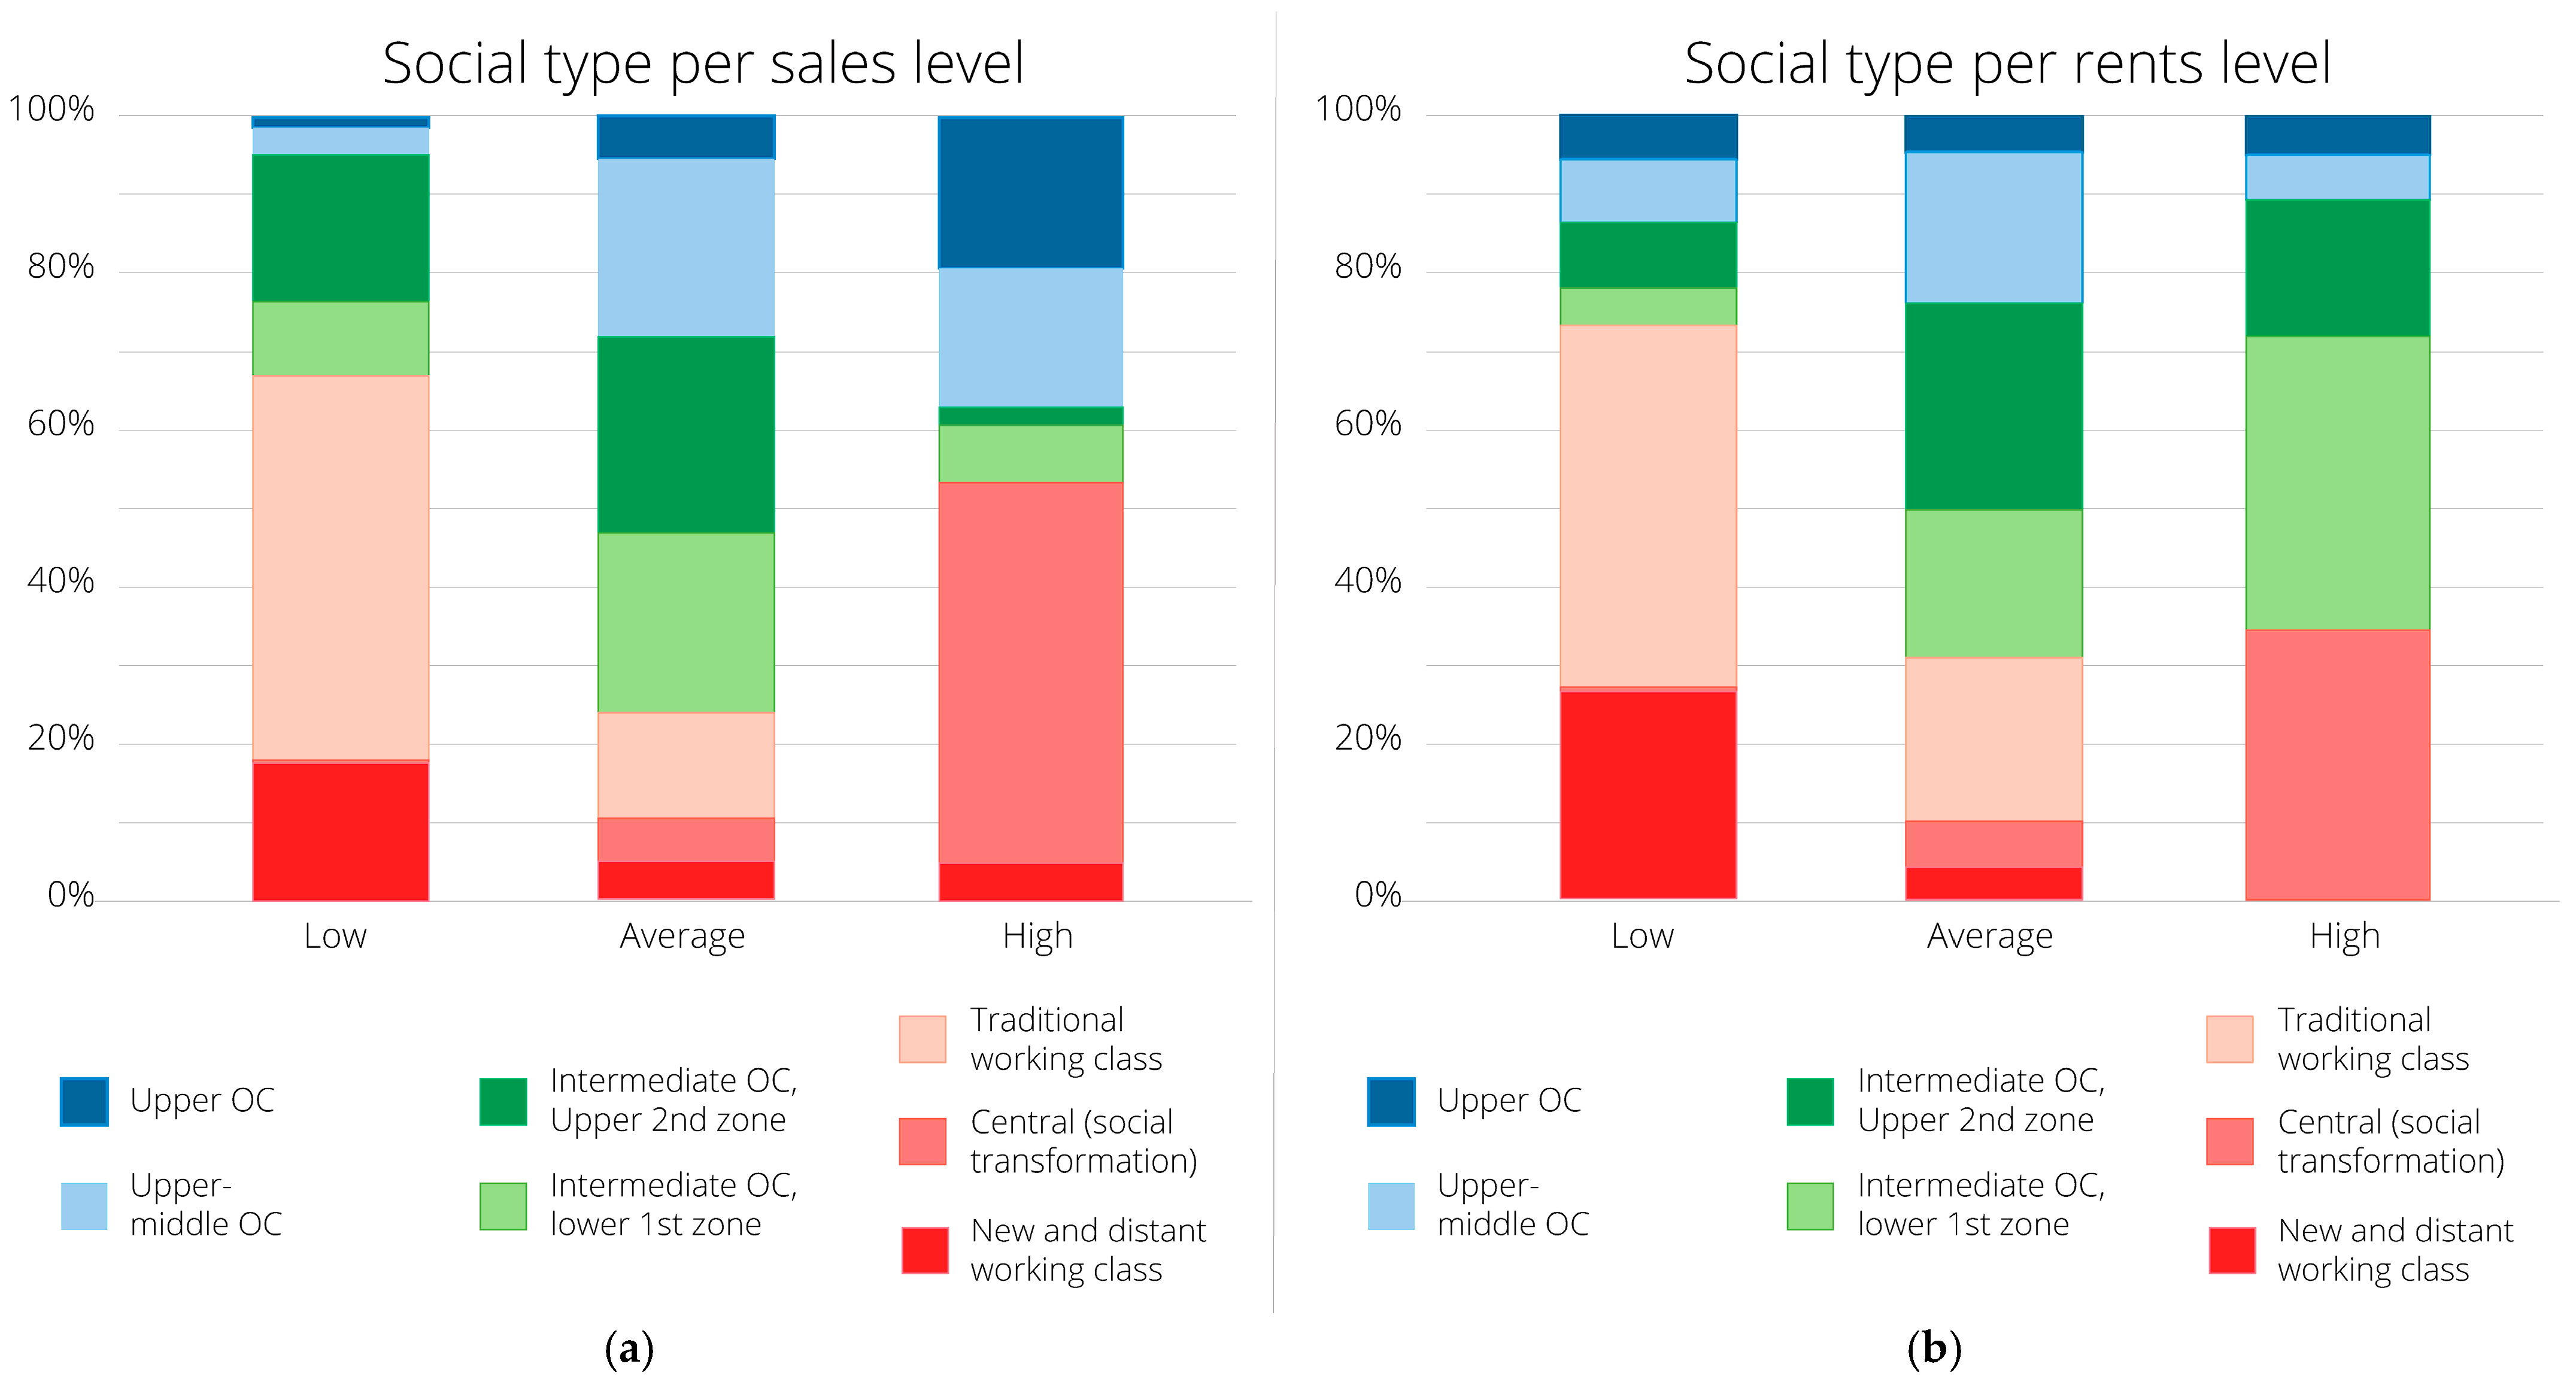
Regarding the spatial distribution of the housing units for sale based on the social profile of different areas in Athens, almost 50% of the URANUs with the highest concentrations of dwellings for sale correspond to central areas under social transformation and 38% to areas characterized by an overrepresentation of upper and higher-middle occupational categories (Figure 13a). We claim that the fact that a large part of the housing units for sale have low energy performance (Table 5), especially in the central areas (Figure 12a), probably indicates that there is a change of hands in housing property from those who cannot afford the required investment to upgrade their assets to those who can do it as a profitable investment, a change that might accelerate the social transformation of central neighborhoods. On the other hand, the offer of dwellings for sale is low in the majority of the working-class areas.
Regarding the spatial distribution of the housing units for rent, Figure 13b shows a high concentration of rental properties in middle-class areas and central areas under transformation. Just like the spatial distribution of dwellings for sale, the concentration of assets for rent is very low in working-class areas. These trends reflect the dynamics of the real estate market in affluent areas, leading to the extraction of surplus value by higher economic classes. At the same time, they highlight the strong interest in central areas undergoing gentrification.
Assuming that the issuance of EPCs indicates an interest in utilizing a residence—whether for sale, rental, or upgrade—we claim that the analysis of the EPCs provides useful information about the characteristics of the dwellings that are available in the real estate market (Table 5). The market seems to be primarily focused on medium-sized and low-energy class properties, while smaller and larger dwellings are almost equally represented. Smaller dwellings are more commonly associated with rental transactions, whereas larger properties are typically linked to sales. Table 5 further highlights that properties intended for sale or rent generally have lower energy ratings, while EUF properties tend to feature higher energy standards. This is because the energy class of EUF properties is recorded after the completion of the retrofitting works, while the EPCs for rent or sales are confirming the energy class of the unit and not related to an energy upgrading process.
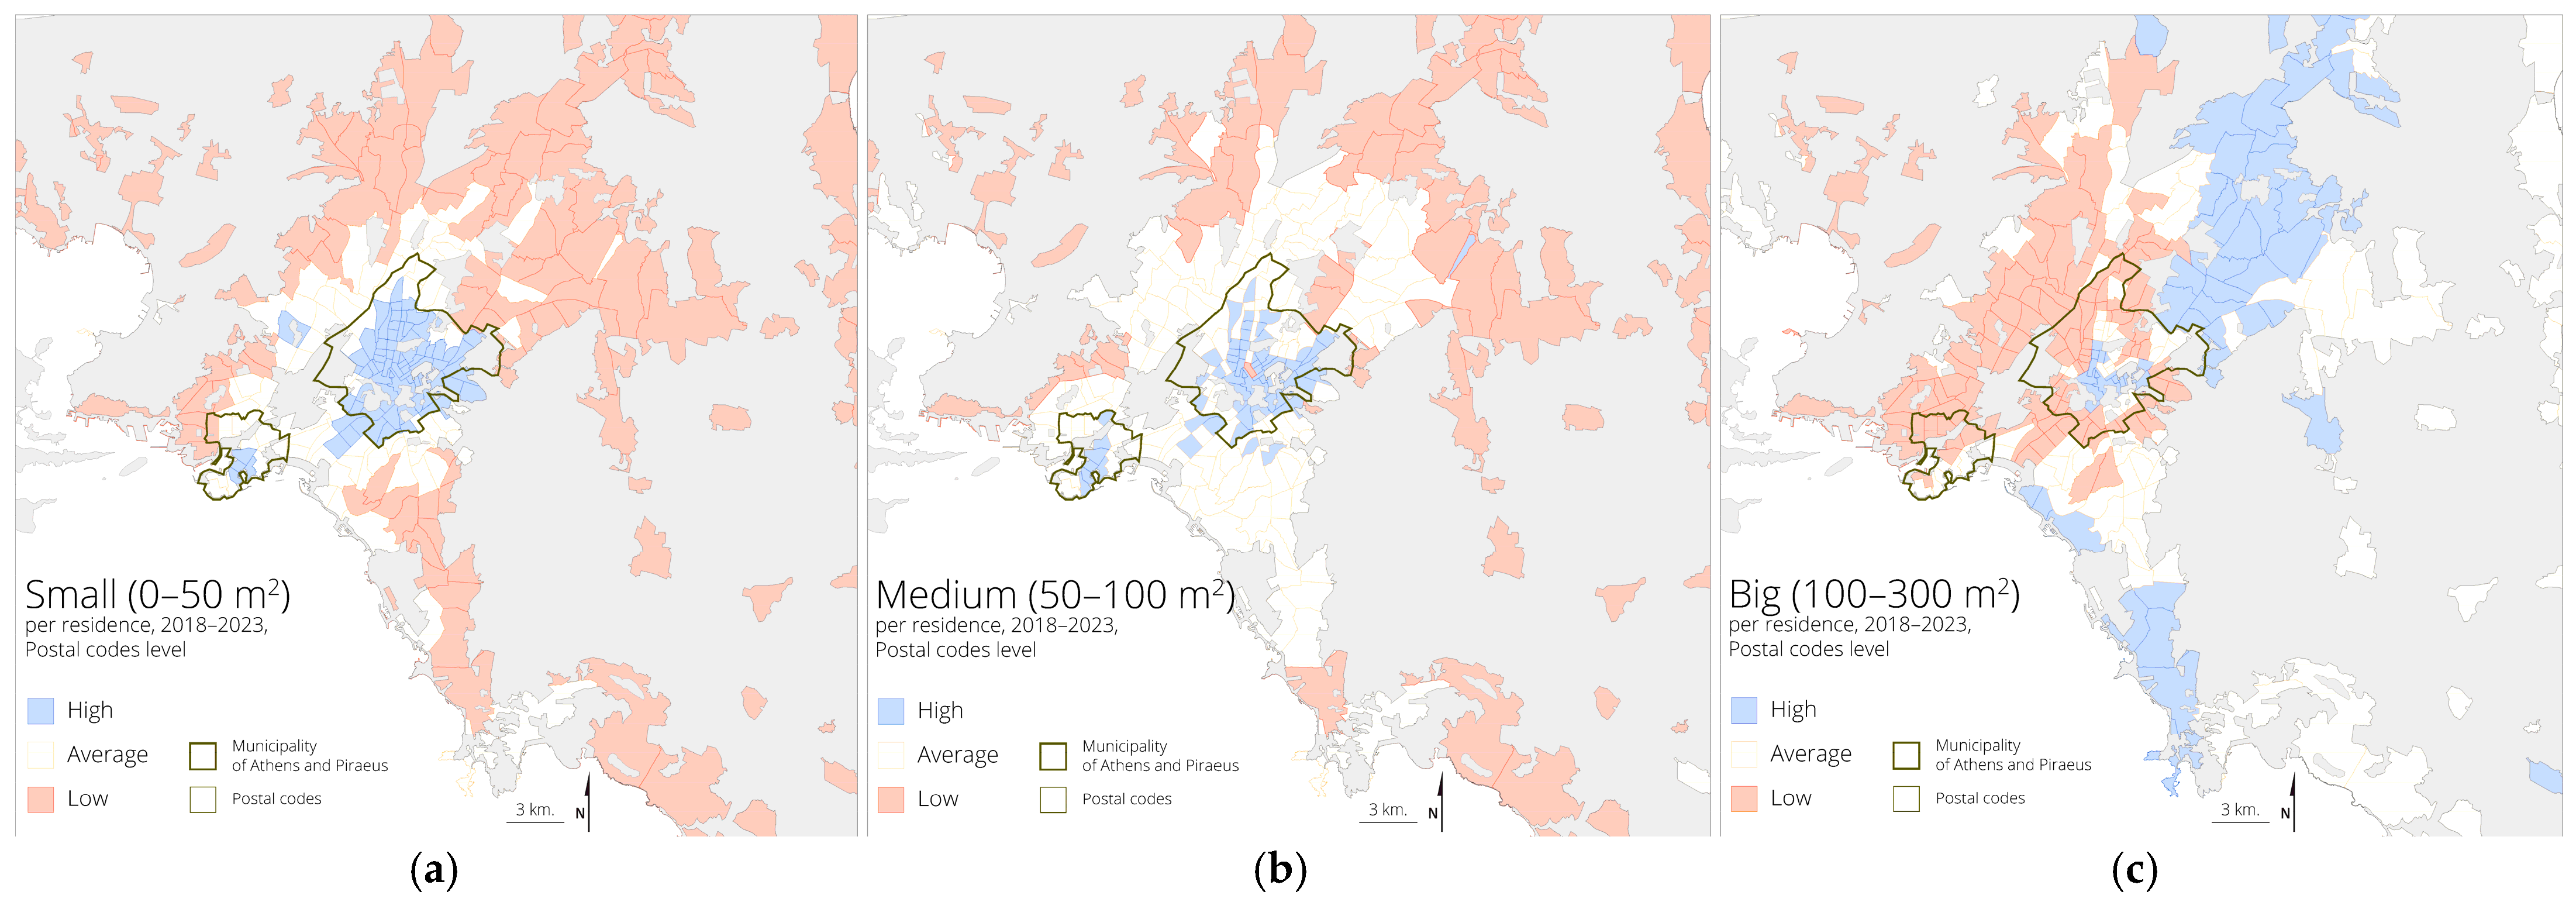
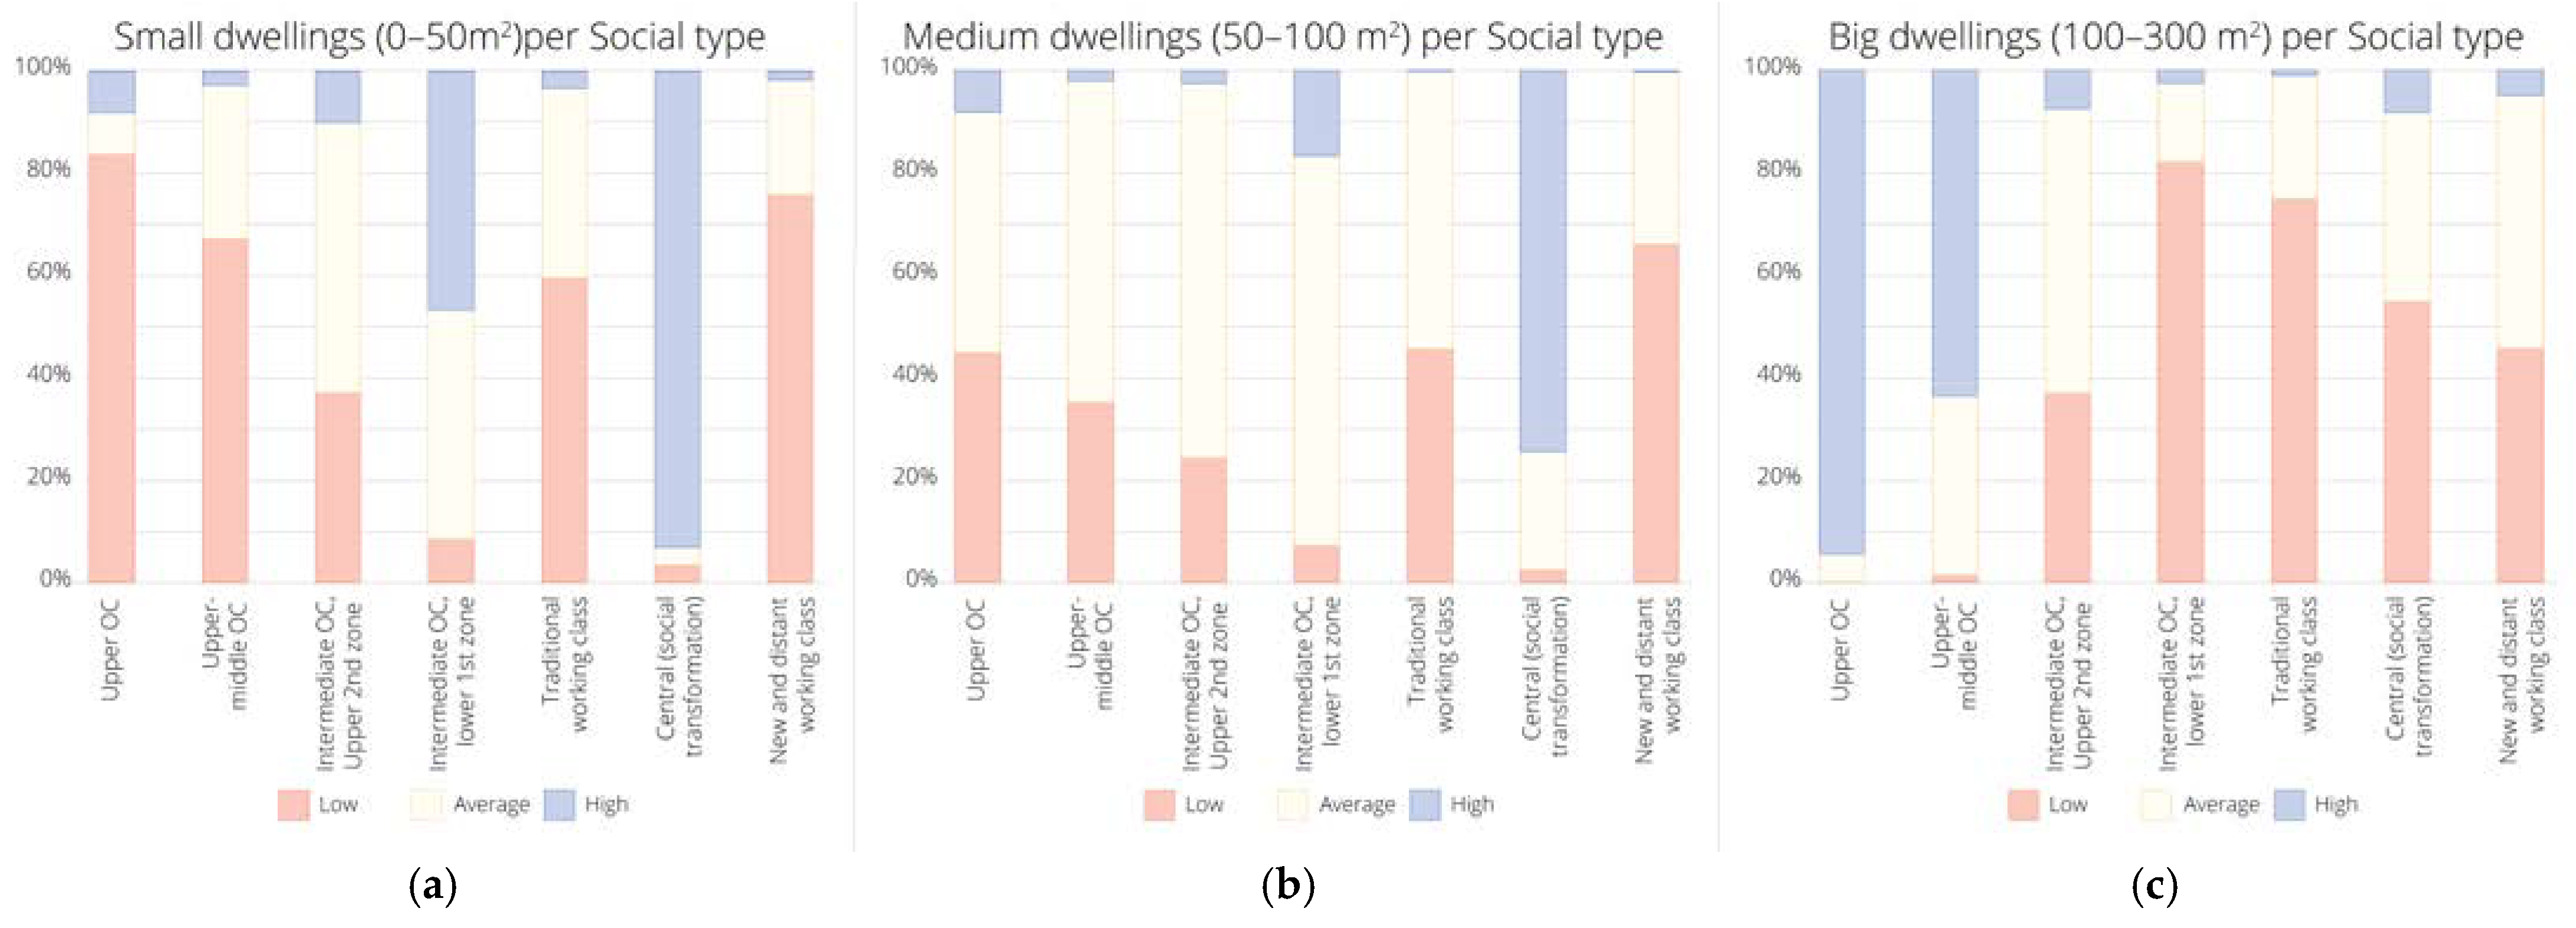
The following maps and figures allow us to draw initial conclusions regarding the sizes of residences that exhibit greater mobility in the real estate market across different areas of Athens. Figure 14a,b and Figure 15a,b reveal that in central areas, there is a strong demand for small (<50 m2) and medium-sized (50–100 m2) apartments. Meanwhile, Figure 14c and Figure 15c suggest that in upper and upper-middle-class areas of the northeastern and coastal suburbs of Athens, there is significant interest in the utilization of large residences (100–300 m2). This spatial distribution aligns with the concentration of small, medium, and large residences in the AΜA, as recorded in the 2011 ELSTAT census [34]. At the same time, it supports the assumption that recent real estate trends are contributing to the long-lasting process driving families and larger households away from central areas toward more spacious suburban residences, while centrally located, upgraded, or gentrified neighborhoods increasingly cater to small households, including cosmopolitan elites and digital nomads.

3.3. Policies Leading Urban Regeneration Processes

The housing sector is influenced—directly or indirectly—by a wide array of policies, including those related to building and spatial regulations, investments, energy, the environment and climate change, tourism, urban development, social welfare, and taxation. In recent years, especially since the 1990s, the housing sector in Greece has appeared to operate unregulated [6]; however, numerous policies have been implemented that contribute to the regeneration of Athens’ urban space in a socially and spatially unequal manner [49]. The spatial analysis of policies creates certain difficulties. First, that policies change over time, producing a dynamic context, and second, that analyzing them requires a multidimensional approach based on access to different data sources, often not accessible, or spatially incomparable. Several researchers have pointed out those issues while investigating the impact of policies on housing and urban regeneration [2,5,8,13,20,50]. Within the scope of this article, we will focus on two specific policies that play a significant role in the recent socio-spatial transformations of the AMA and urban regeneration processes: the subsidies for energy-efficient housing upgrades through the “Exikonomo” program and the adjustments to the official values of real estate.

3.3.1. “Exikonomo” Program: Inclusions and Exclusions of the Energy Upgrade Funding (EUF)

Within the framework of policies to address climate change and the green transition, European and national policies place particular emphasis on the energy upgrade of the housing stock [51]. Energy-efficient dwellings contribute to reducing greenhouse gas emissions, which is crucial for combating climate change. Sufficient thermal insulation, energy-efficient window frames/glazing, highly efficient heating and cooling systems, renewable energy sources technologies, and energy-saving appliances help decrease energy consumption. Reduced energy consumption results in lower utility bills, providing financial relief and improving the affordability of energy for households. Also, energy retrofitting measures such as improved insulation, efficient heating and cooling systems, and passive ventilation enhance indoor air quality, reduce the risk of respiratory problems, and create healthier living environments, while maintaining consistent indoor temperatures improves comfort and well-being, particularly for vulnerable households. Moreover, high energy performance increases both rental and sale prices of homes [52].
Despite the low energy performance of the residences in Athens, the rate of energy retrofitting of the housing stock is low. The available data refers to the entire national territory; however, they are indicative of trends that are valid for AMA as well. According to the 2023 Household Income and Living Conditions Survey [53], the vast majority of the population (88.0%) stated that it has not made any improvements to their home in the last five years regarding thermal insulation or the heating system of their home. Among the poor population, this percentage amounts to 91.2%. According to a survey conducted by the Nicos Poulantzas Institute [38], during the last three years, 18% of the homeowners of the sample had invested in solar water heaters, 14% in a new heating system, 14% in new window frames, 13% in thermal insulation, and just 2% in renewable energy sources other than solar water heaters.
The financial burden associated with improving the energy performance of dwellings presents another challenge for Greek households. Retrofitting measures, such as improving insulation, upgrading heating systems, and implementing renewable energy solutions, often require substantial upfront costs. For many households already grappling with economic difficulties and unaffordable housing, these expenses can be prohibitive, hindering their ability to invest in energy efficiency improvements. The energy crisis that started in 2021 skyrocketed energy costs, threw many households into a situation of energy deprivation, and posed new questions about interventions that would reduce energy consumption at home [54]. Apart from households, improving the energy performance of the housing stock is a challenge for big and small investors who expect higher profits from upgraded properties [55,56].
The sole state policy that supports the improvement of the energy performance of dwellings is the Energy Upgrade Funding (EUF), namely the “Exikonomo” (“I Save”) program. EUF was launched in 2011 by the Ministry of Environment and Energy, and since then, nine cycles of the program have been implemented. The program subsidizes interventions for the energy retrofitting of dwellings, such as replacing window frames, installing thermal insulation, upgrading heating and cooling systems, installing solar water heaters, etc. The subsidy rate is calculated upon income and social criteria, and the declared goals of the program include addressing energy poverty. The program has a low total budget, is based on a complicated process of applications and long bureaucratic procedures, and requires private funds to cover part of the investment [38,55,57].
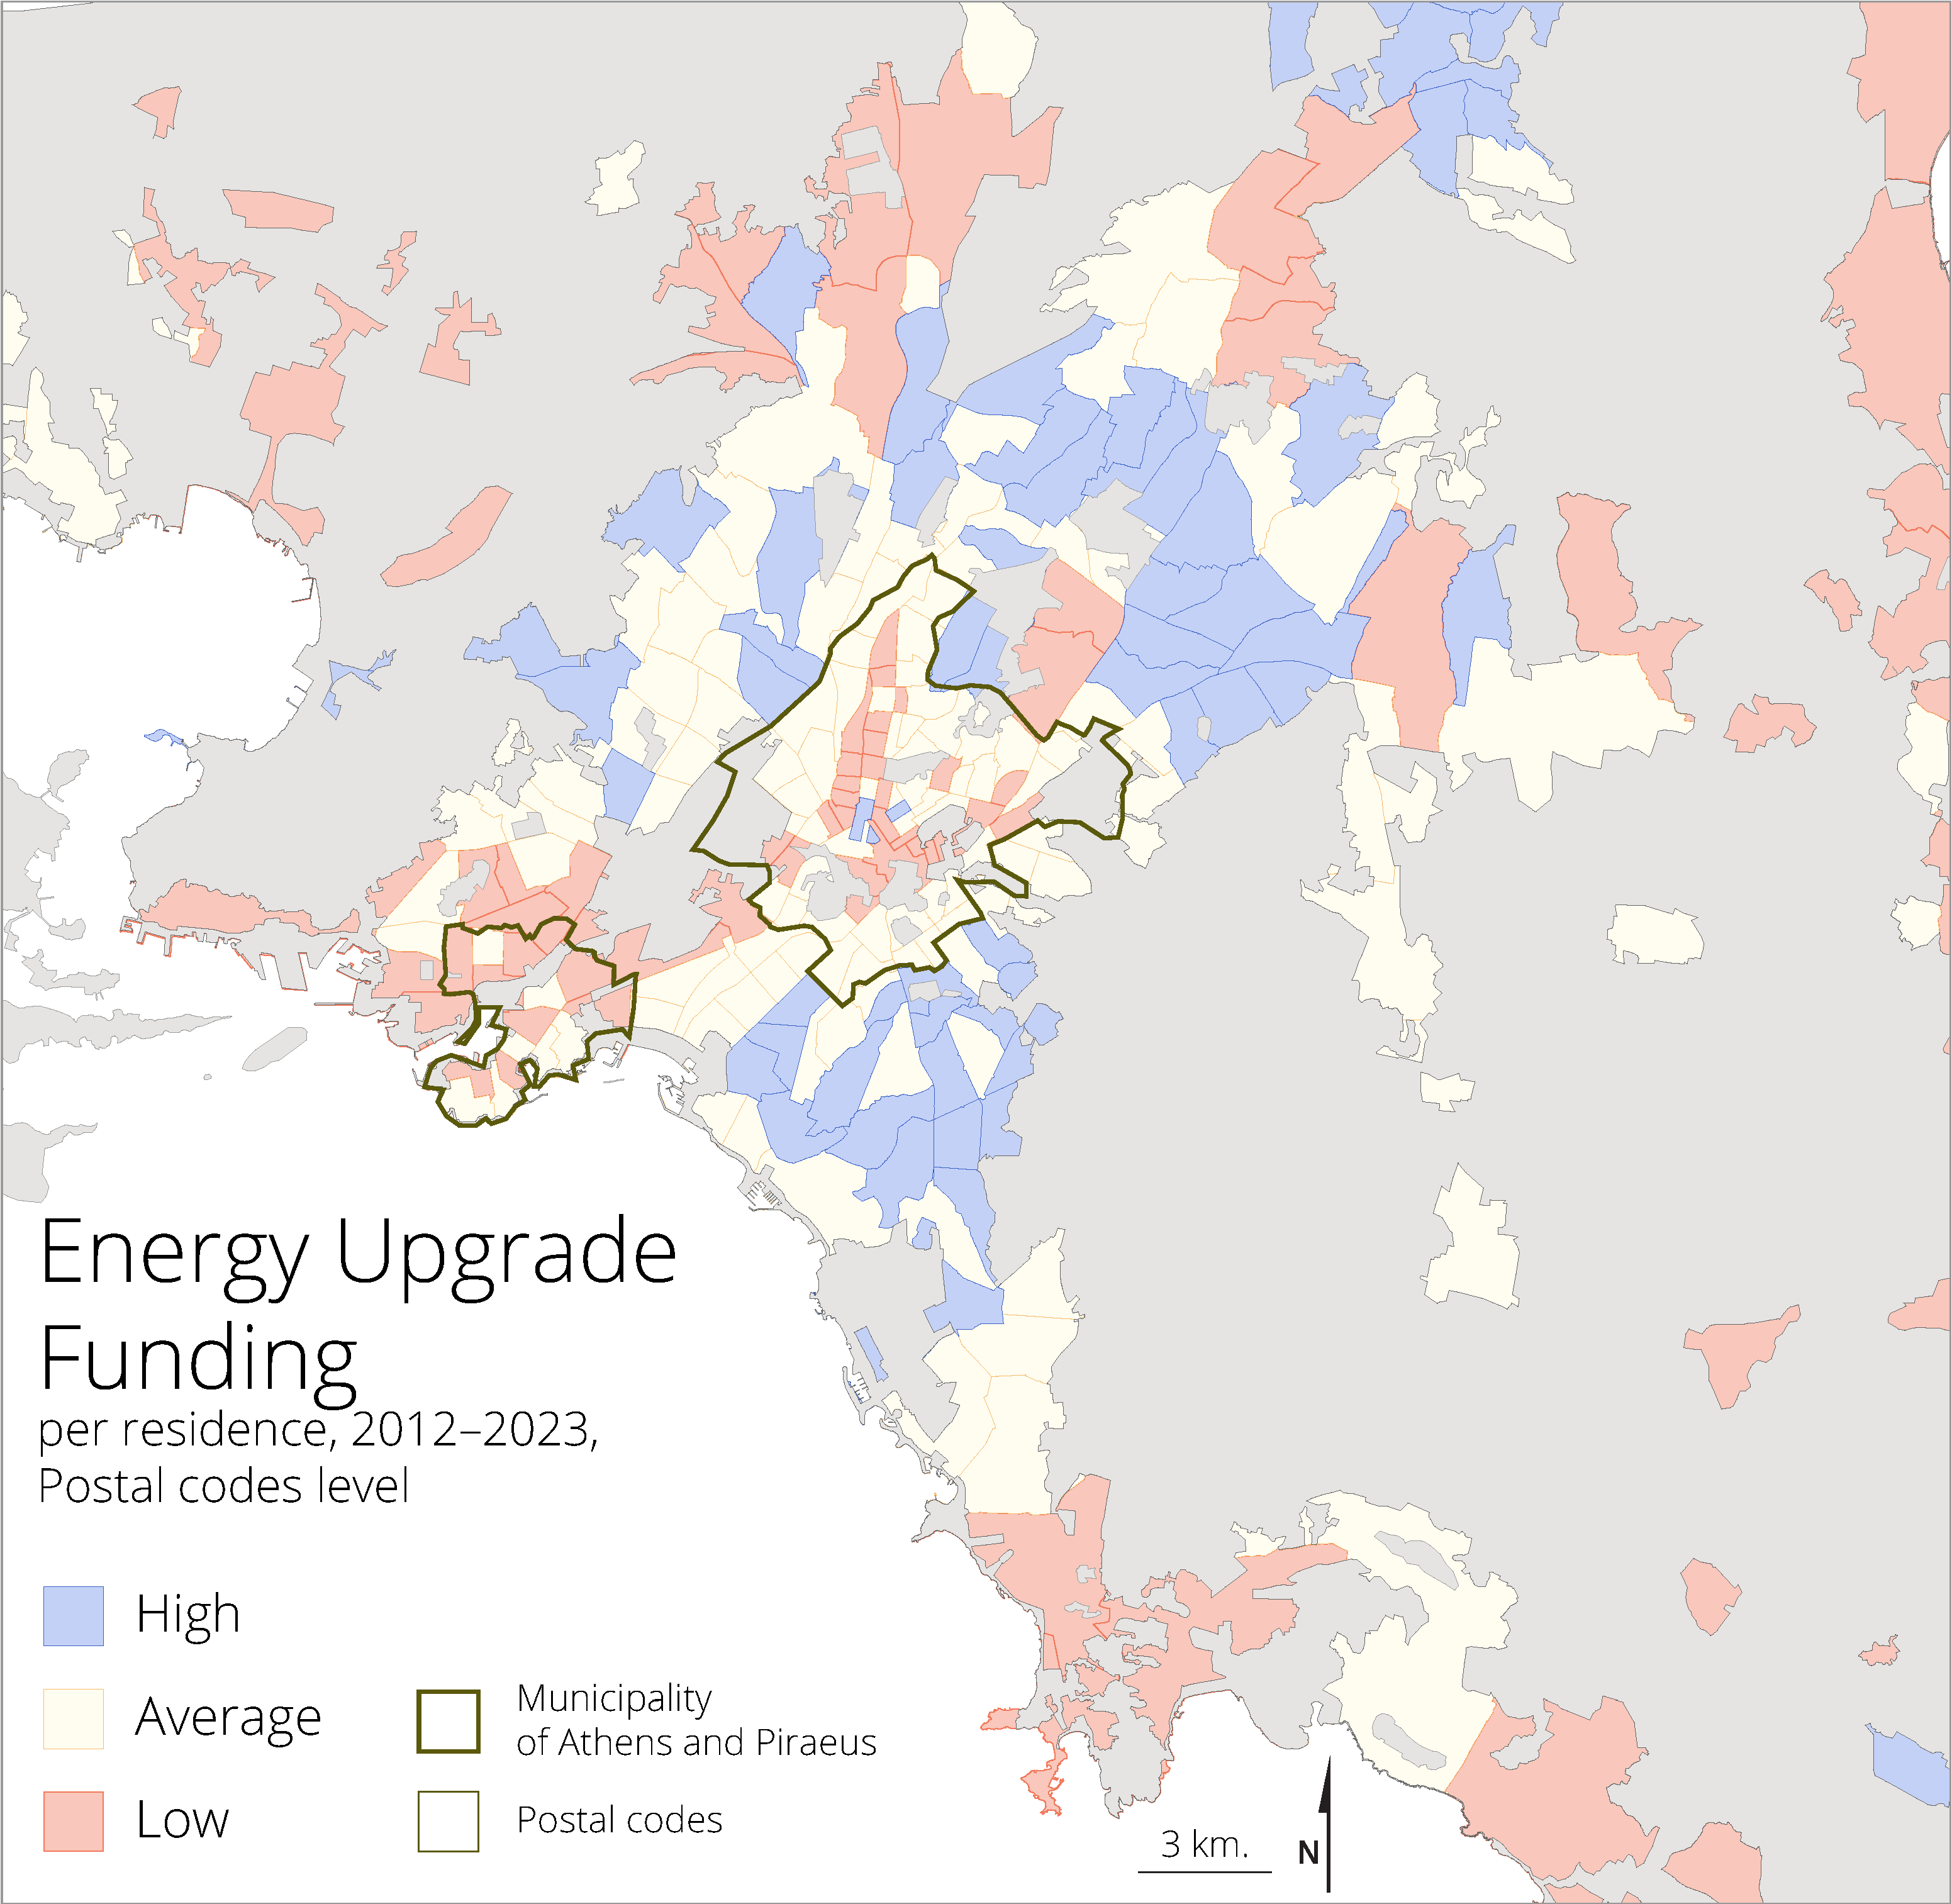
The EPCs issued for accessing subsidies for energy retrofitting interventions in dwellings through EUF show large differentiations in their spatial distribution (Figure 16). The majority of subsidies are attributed to dwellings within the Attiki basin, i.e., the part of the AMA between the sea and the Parnitha, Penteli, and Hymettus mountains, and particularly in the northern and southern suburbs and in some enclaves of the western suburbs. In contrast, subsidies for dwellings in the peri-urban areas of the outer periphery (Mesogeia and Thriasio plains, Figure 1) are much lower. Moreover, subsidies for energy retrofits in central areas of Athens and Piraeus are also limited, despite the fact that the housing stock is old [34] and has lower energy performance. It is estimated that the low concentration of subsidies in the central areas of Athens and Piraeus is also associated with the high prevalence of rental housing in these areas [34]. Owners of rental properties tend to show less interest in upgrading such dwellings compared to owner-occupied properties [38,55,57]. Furthermore, EUF has, in certain cycles, offered lower subsidy rates for rental properties than for owner-occupied housing, following the traditional housing policy favoring homeownership versus rent [15], a fact that possibly discourages potential applicants from applying for funding.
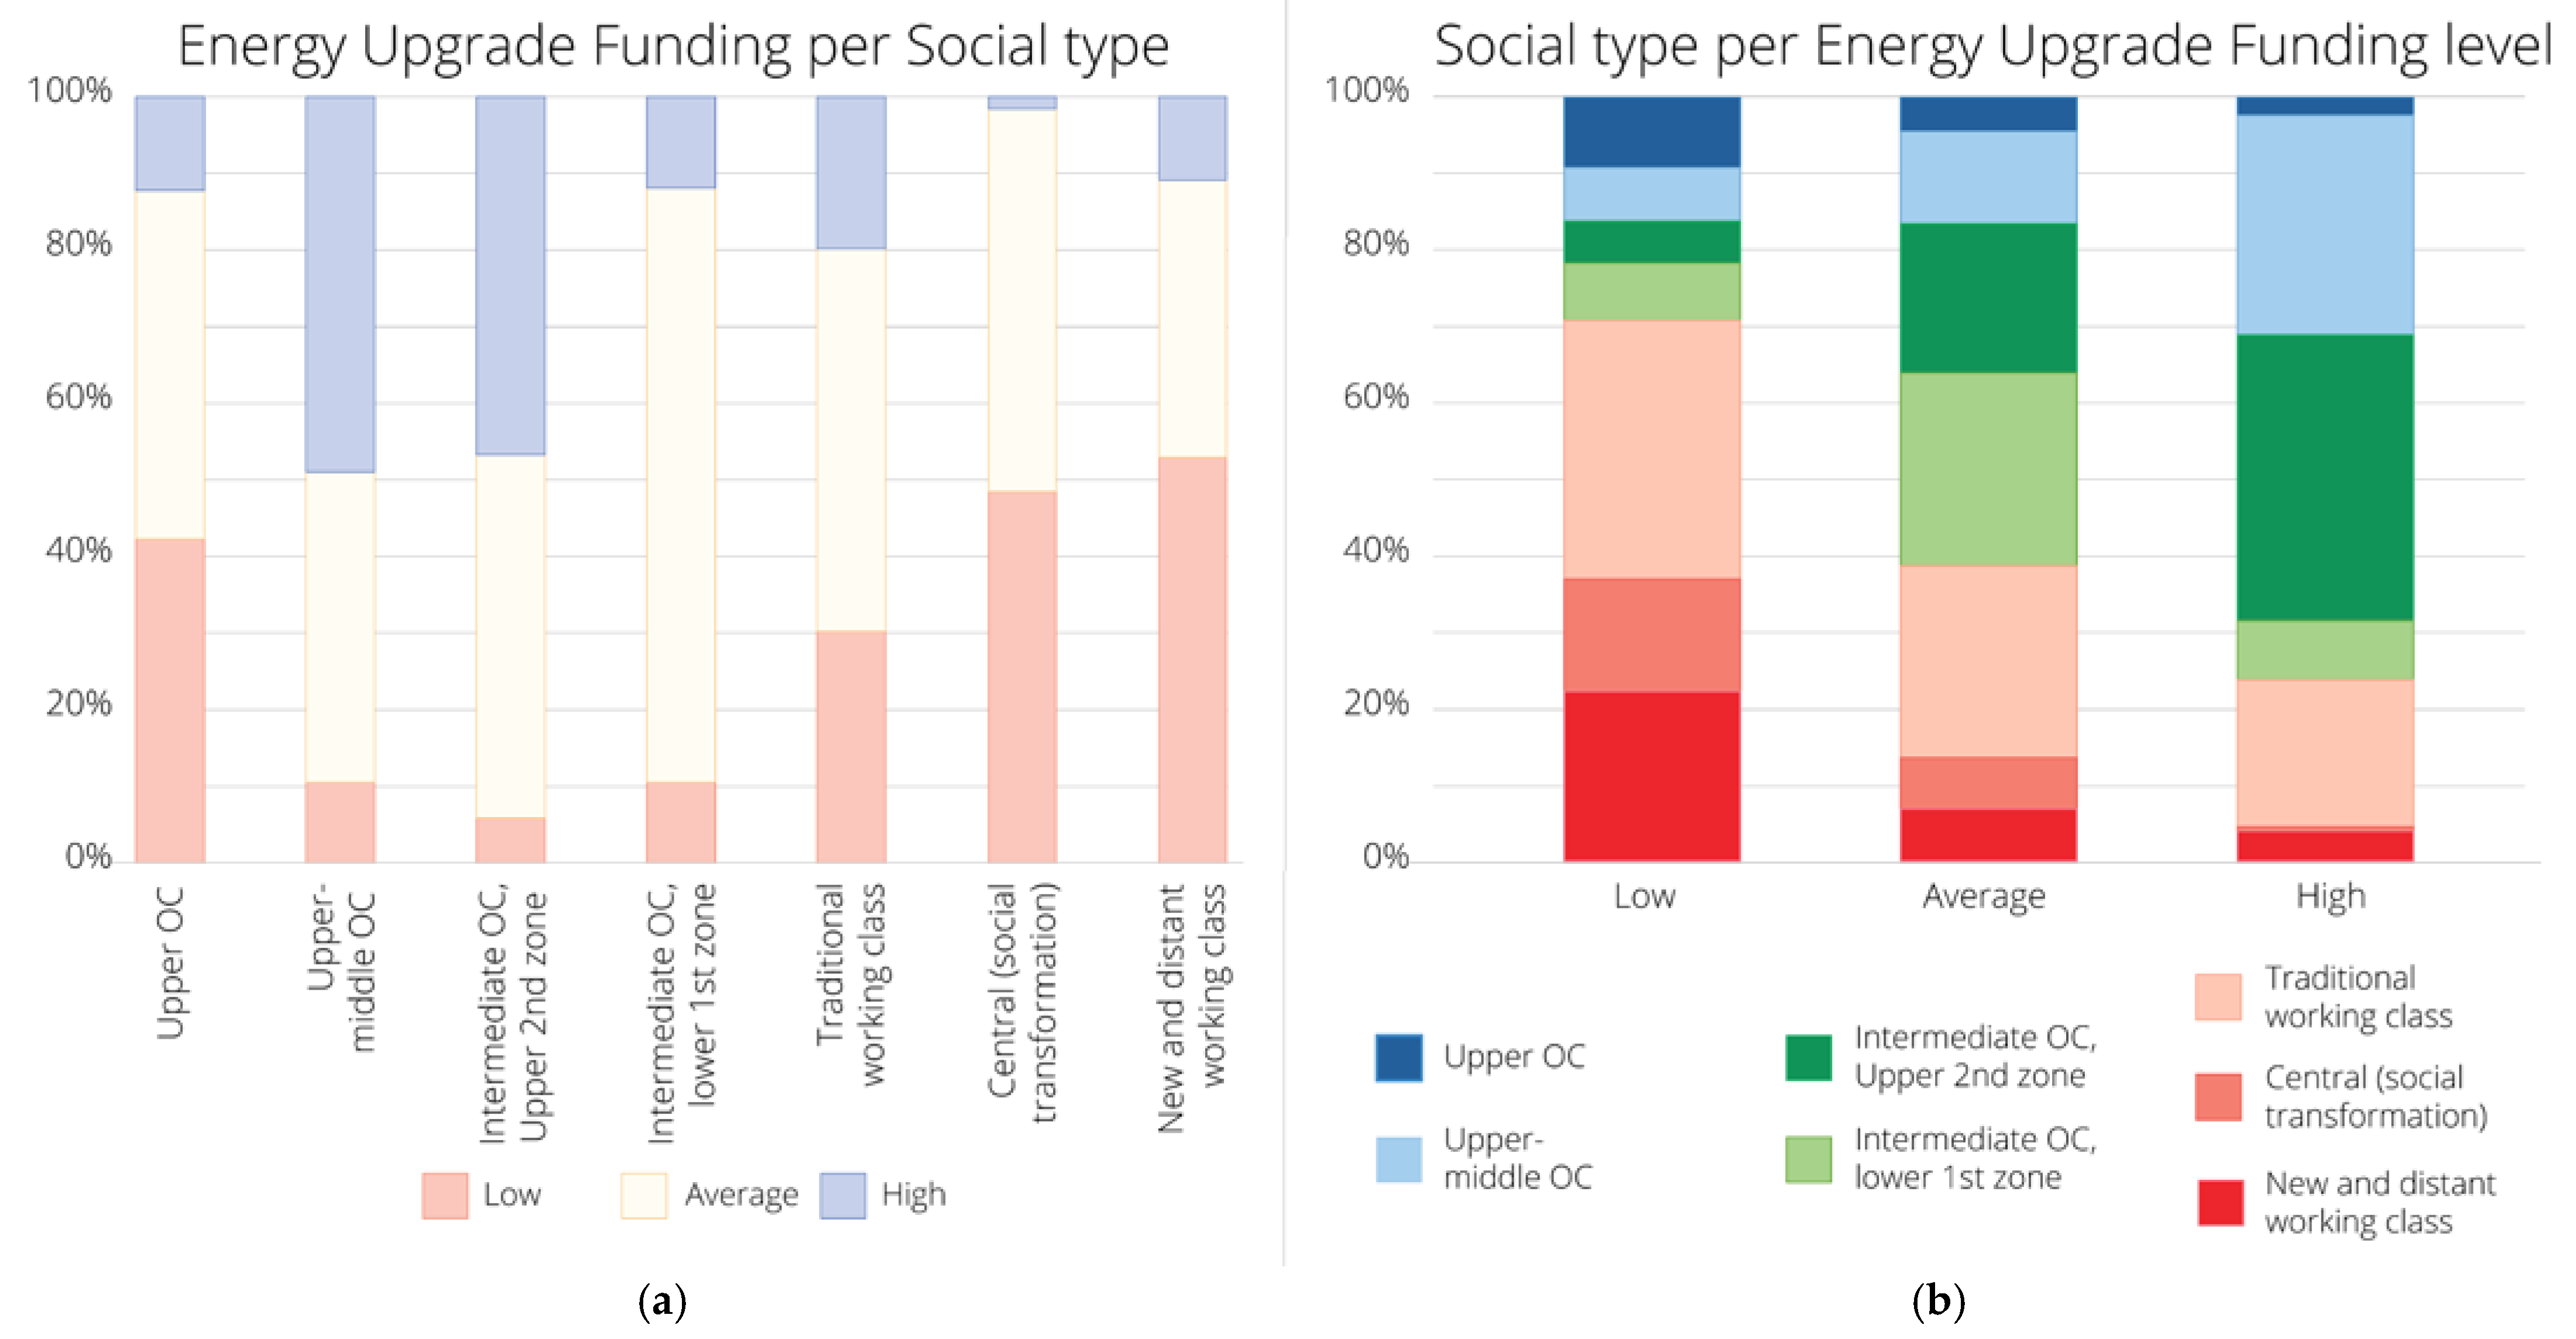
The spatial distribution of EUF subsidies for the energy retrofitting of dwellings is directly related to the social profile of the areas of Athens. Their highest concentration is mainly observed in the middle-middle-class suburban neighborhoods of the city, leaving out both the upper-class and the working-class neighborhoods. The former were eliminated due to the income and property value limits specified by most of the circles of the program, while the latter were left out due to the difficulty of the owners to cover the part of the investment that is not subsidized [38].
Almost 80% of the URANUs with a high rate of beneficiaries of the program correspond to areas of upper, middle-upper, and intermediate social categories. On the other hand, 70% of the URANUs with the lowest concentration of EUF subsidies correspond to areas of working occupational categories (Figure 17b). The highest absorption of subsidies in residential areas of the upper-middle and upper-intermediate social categories is also evident from Figure 17a. Moreover, the inner-city areas of Athens that are under rapid transformation present a low concentration of subsidies for the energy upgrading of homes, although the housing stock of these areas is old, unrenovated, and thus of low energy efficiency.

3.3.2. Objective Real Estate Property Values (OREPV) as a Tool for Leading Regeneration

The Objective Real Estate Property Values (OREPV) are the official property values acting as a minimum value for real estate transactions and for property taxation. They provide another indication of the way official values simulate actual property values and the way they are calibrated by taxation changes, affecting urban/housing policies in recent years. Official property values follow the social profile of neighborhoods in Athens, with higher values in higher social profile neighborhoods and so on. These official values, apart from organizing and simplifying the taxation procedure for all real estate property possessions and transactions, are also a policy instrument. They were first introduced in order to normalize the arbitrarily declared property values and avoid tax evasion/avoidance. Initially they were important for property transactions, when transaction taxes were very high (10–11%) and their evasion/avoidance was affecting the public budget.
The financial crisis that started in 2010 and the need for increased and guaranteed revenues to pay off debts to the country’s main institutional lenders (EC, ECB, and IMF) led to the neoliberal rationale of spreading the financial burden to a much larger range of the population and to reduce the cost for investment in real estate. The rationale of the taxation policy for real estate has changed completely. Instead of taxing transactions, the load of taxes was transferred to possessing property, mainly housing possession. This change was detrimental, especially for lower-income groups who were distanced from new acquisitions for several decades and who possessed properties as use values and not as investments valorized in the housing market. The social spreading of the financial burden also materialized by the abolishment of taxation on high-value properties (law 2459, established in 1997 and abolished in 2008). The cost reduction for investment in real estate materialized with the sharp reduction in the tax on acquiring properties (from 10 to 11% to 3% [58] and change in the way of taxing income from real estate. This income is taxed separately (and not added to the total income) of the earner, with a tax rate of 15% for the first 12,000; 35% for the income between 12,000 and 35,000; and 45% for income above 35,000). This separate taxation is detrimental for those with very low overall income, since they will have to pay 15% regardless of their other income; advantageous for middle- and upper-middle incomes, since their income from properties is separately and favorably taxed without bringing their total income to the high tax rate levels; and insignificant for higher incomes, since the tax rate for real estate income is the same as the high income tax rate. The tax relief for households with high income and accumulated wealth was further improved in 2022 by the abolition of inheritance tax for any transfer up to 800,000 for each inherited individual or donor.
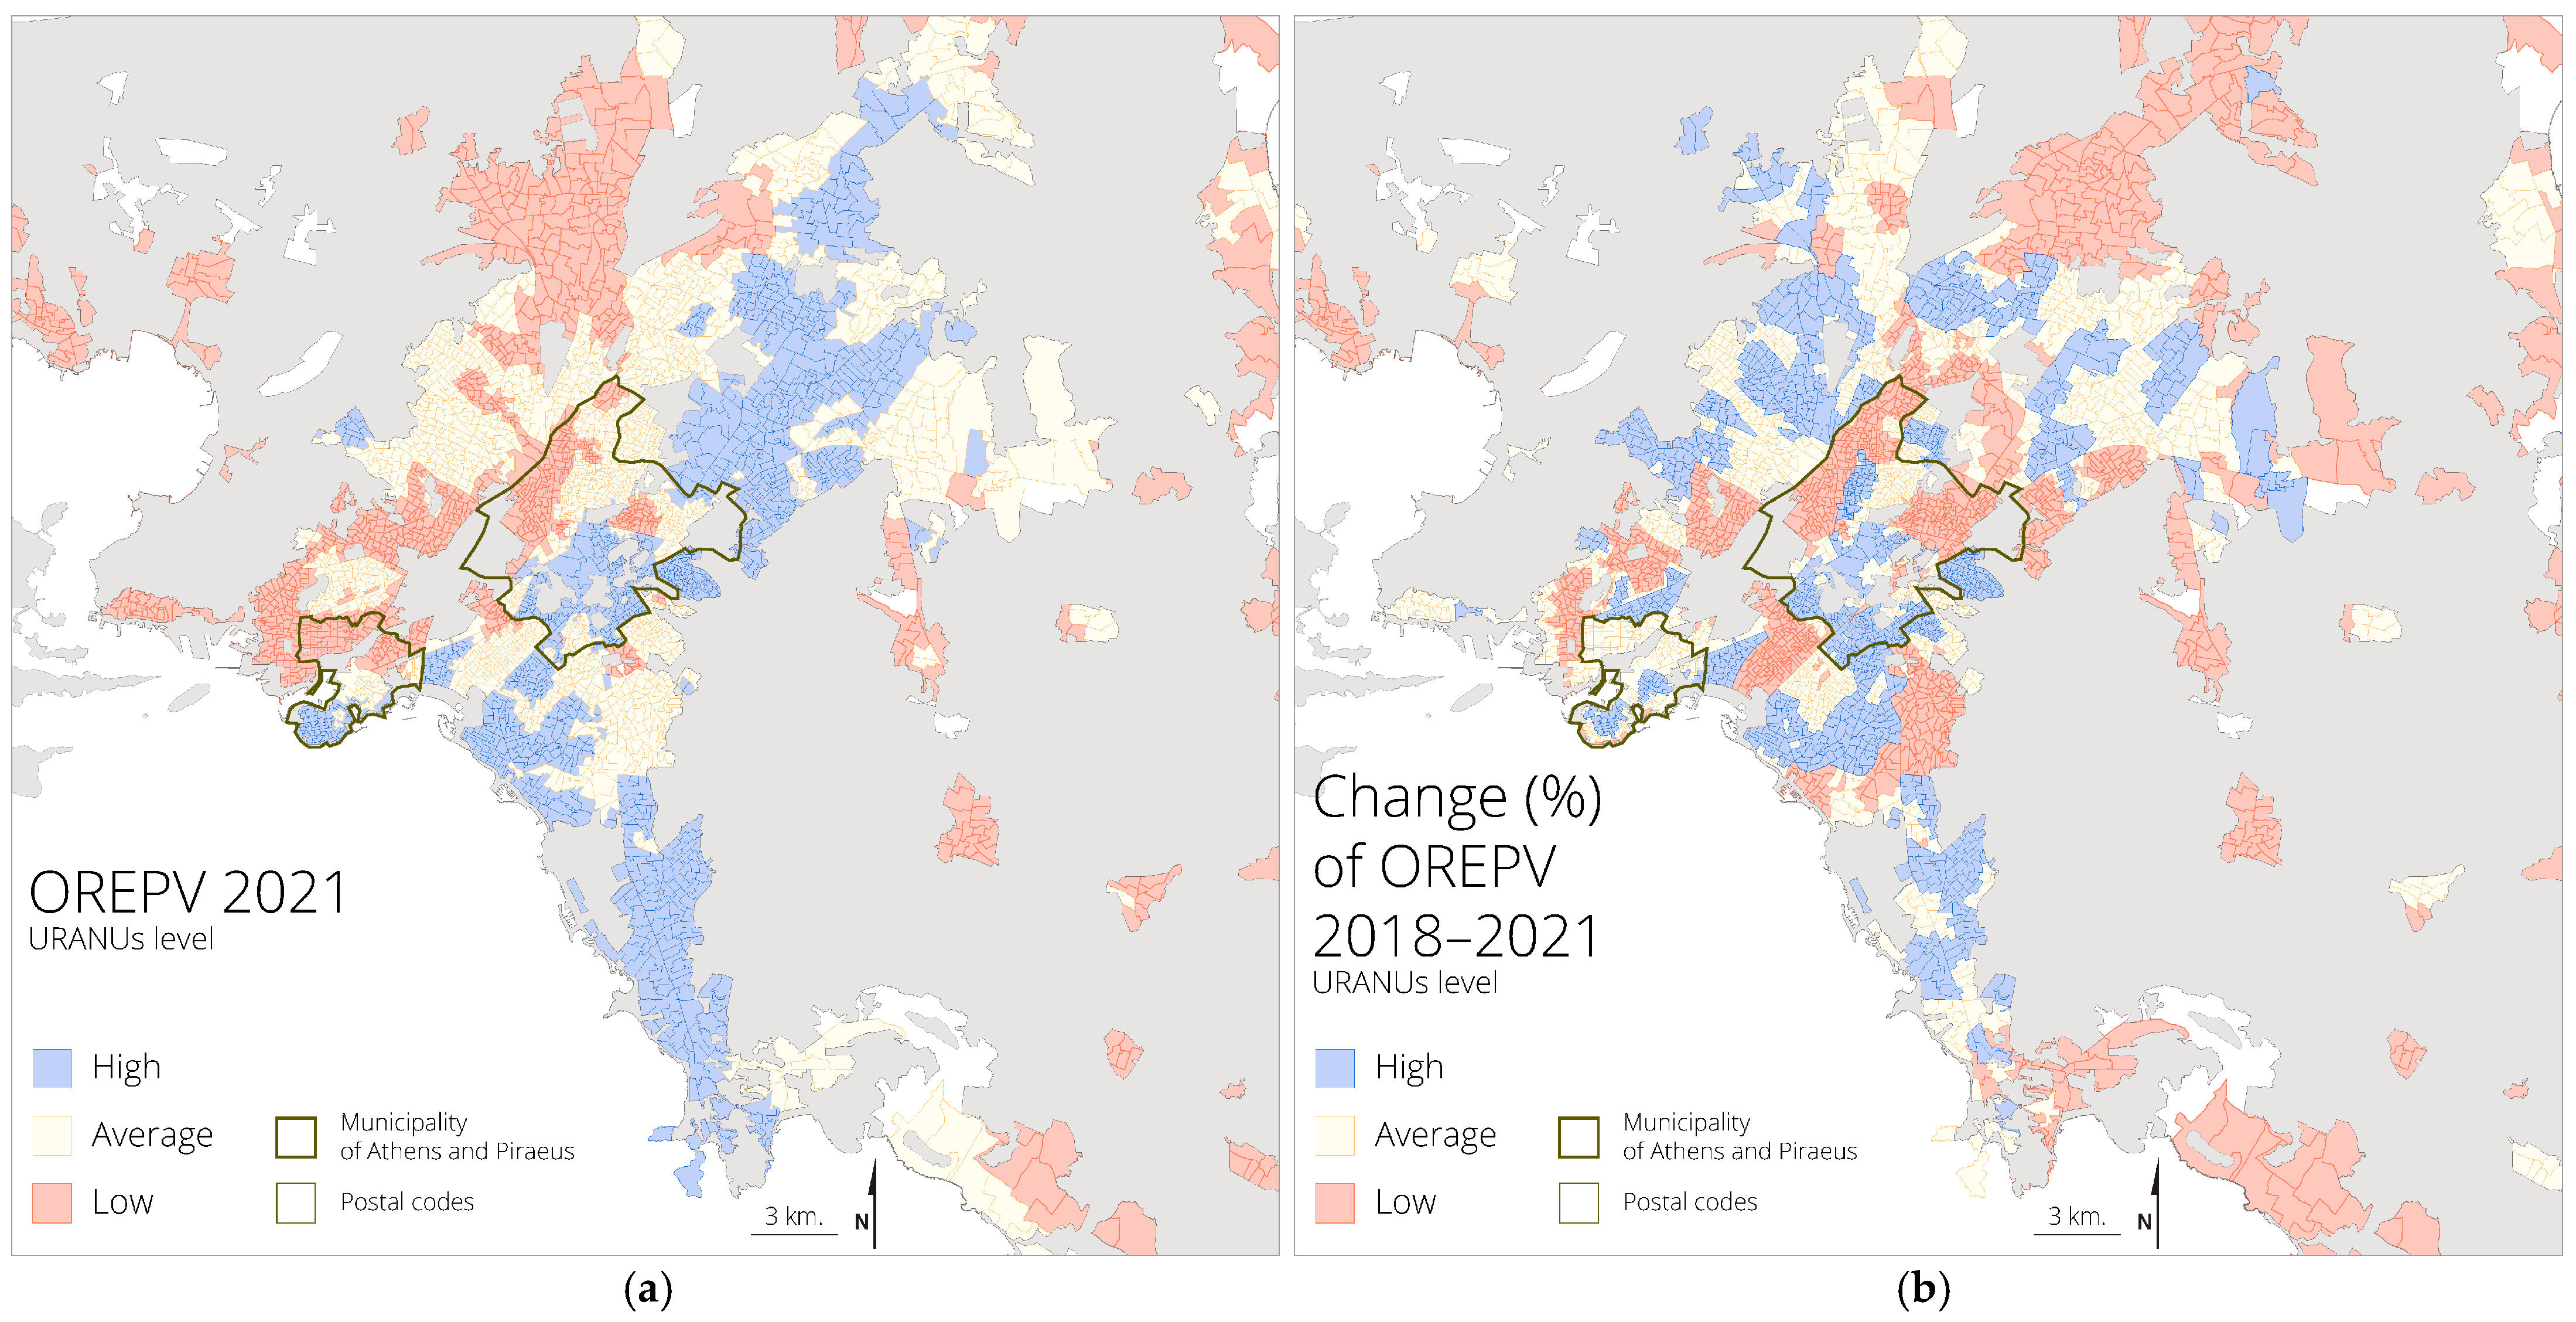
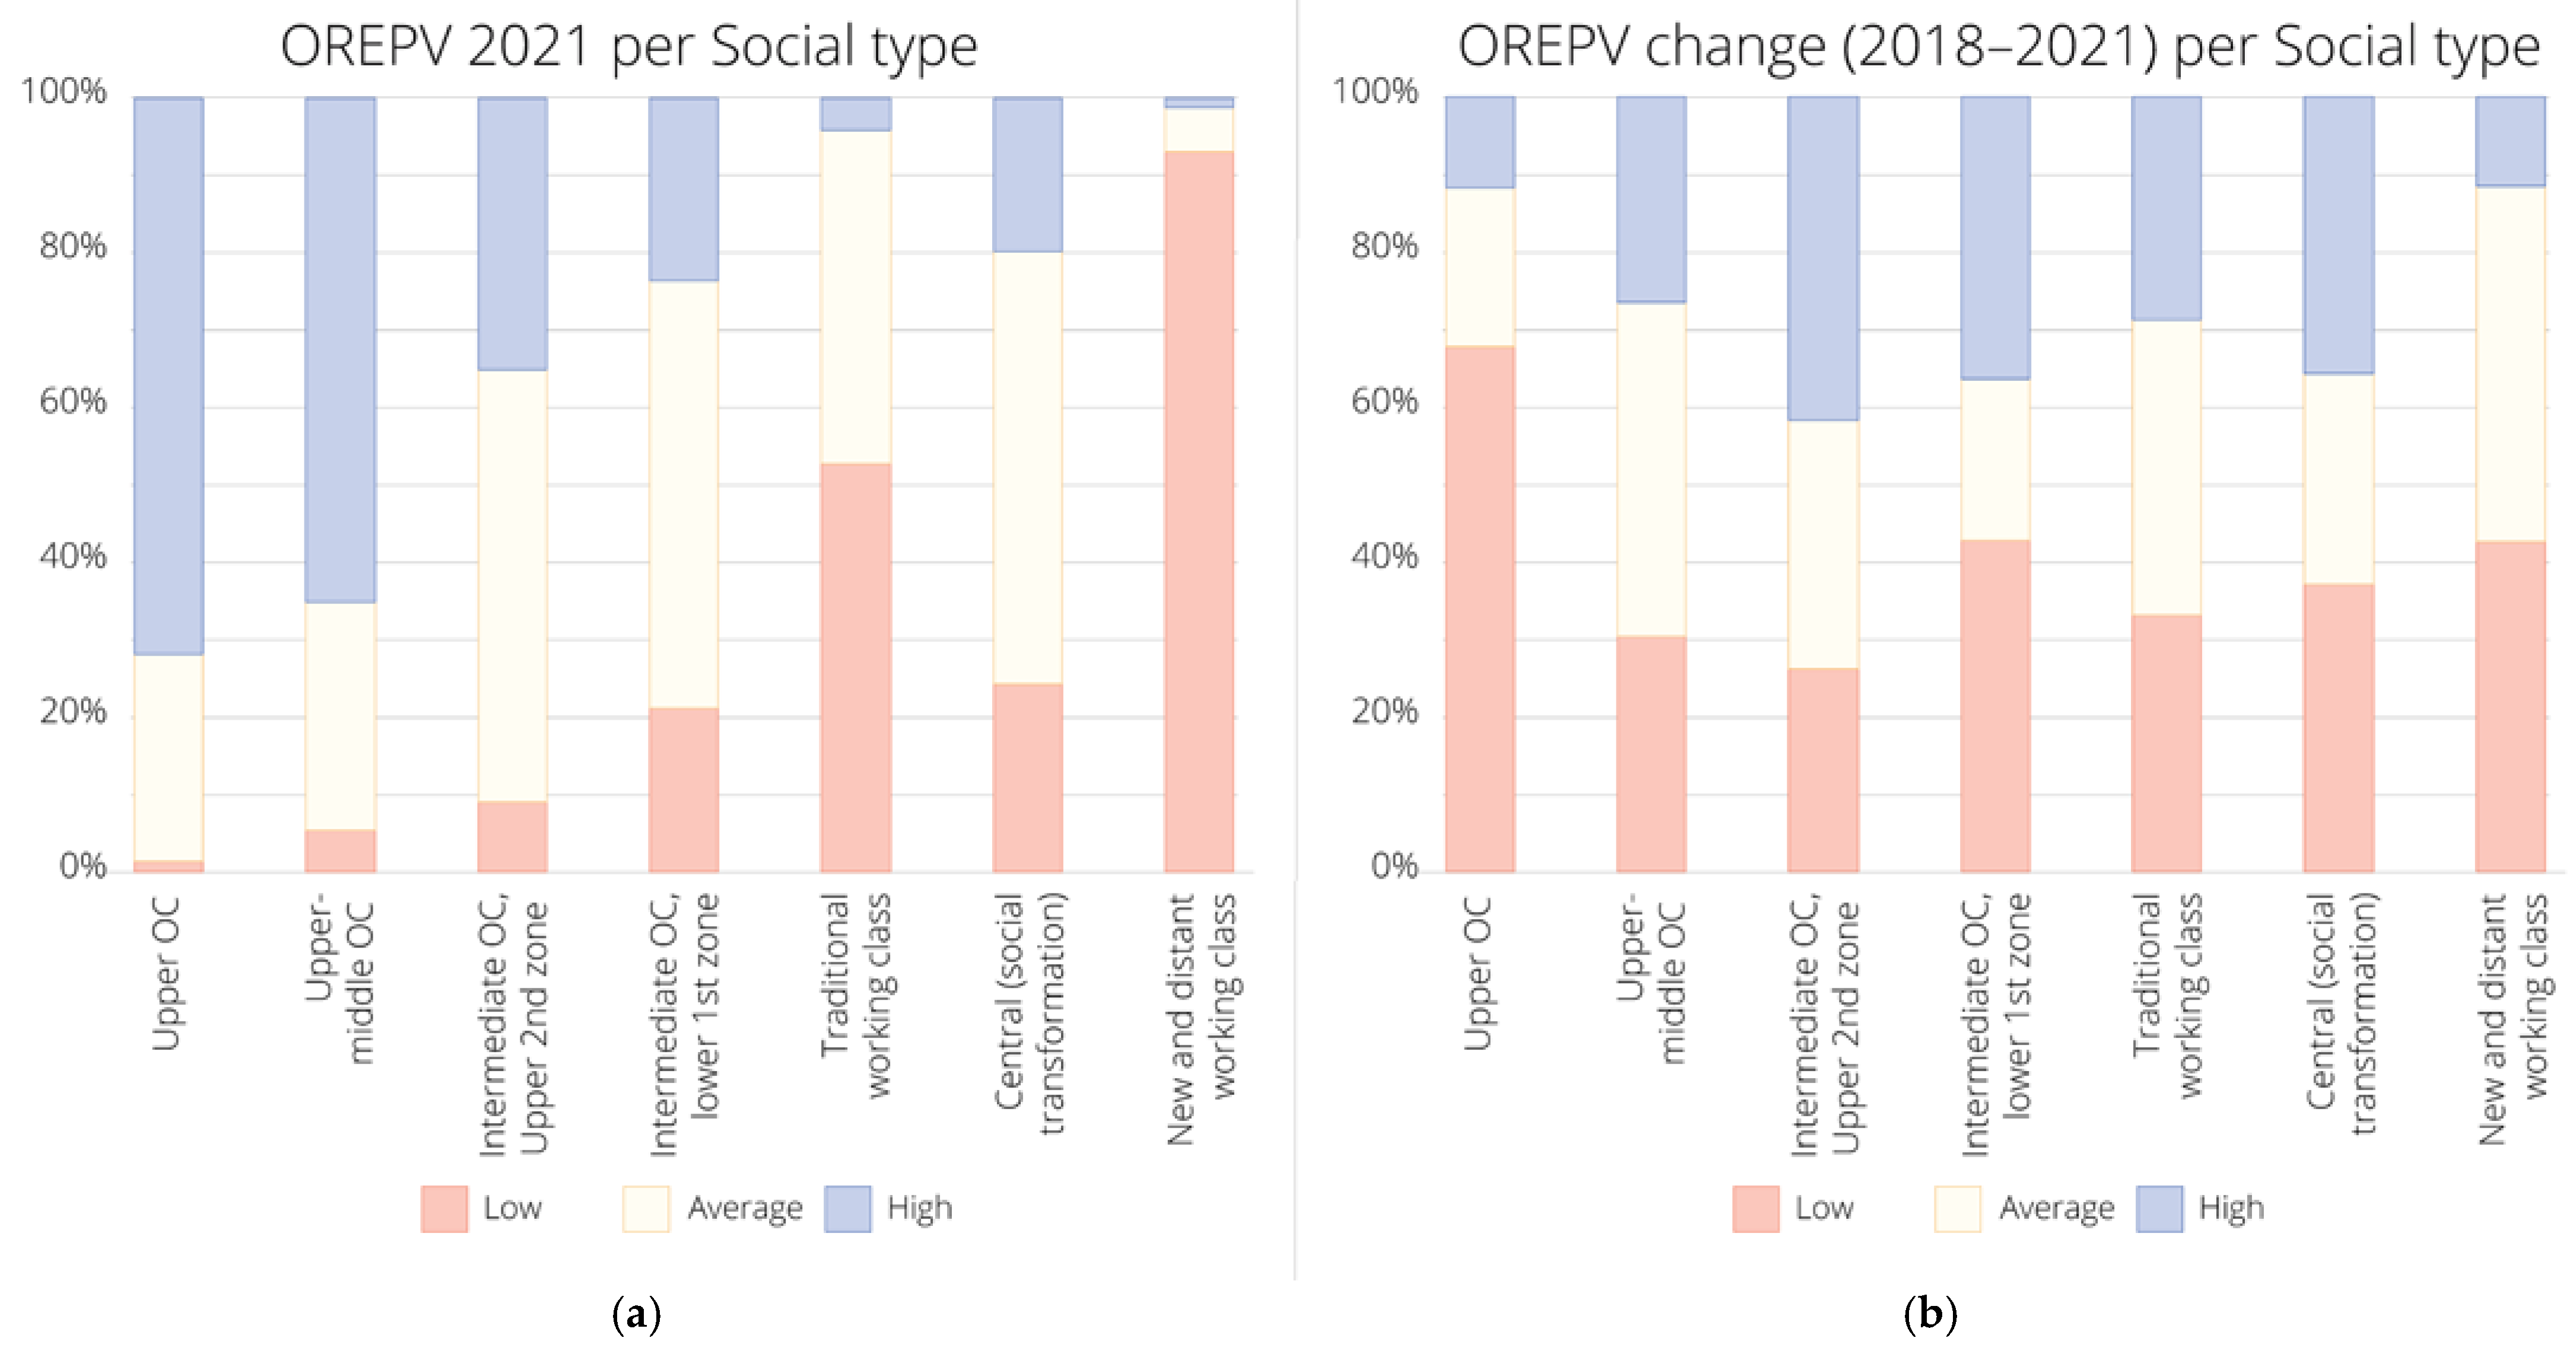
Under these changing circumstances, the Objective Real Estate Property Values (OREPV) became an important tool to calibrate tax policies. Initially, OREPV acted as a tool to avoid tax evasion/avoidance. Since the imposition of the “Urgent Special Fee for Electrified Structured Surfaces” in 2011, which was replaced in 2013 by the “Unified Property Tax” (ENFIA) (tax on property possession), these official values became significant for policies to distribute socially the financial burden of property tax. Starting from a tool that expanded taxing to all property owners in the early 2010s, OREPV in the 2015–2019 period when, despite the conditions of intense control by the institutional lenders, the SYRIZA government (left wing) tried to relieve part of the burden for low-income groups through keeping values relatively low in low-income areas (Figure 18a). On the contrary, the changes in OREPV in 2021, when the New Democracy conservative party was back in government since 2019, were favorable for traditional upper-class neighborhoods (decreasing values), less favorable for new working-class areas, and much less favorable for middle-middle-class areas, including traditional and upwardly mobile working-class areas and areas under gentrification at the city center or the coastal zone (Figure 18b and Figure 19a,b).
Figure 19a,b shows the OREPV change from 2018 to 2021 and the social types of residential areas. Source EKKE-ELSTAT [36], MoEE.

4. Discussion

In this paper we tried to explore trends of the housing market and housing policies in Athens, where housing was developed under protectionist measures during the first post-war decades and within an unregulated context since the 1990s. For this exploration we used the datasets on construction activity permits between 2019 and 2023, on Energy Performance Certificates (EPCs) issued between 2012 and 2023, and on the changes in Official Real Estate Property Values (OREPV) between 2018 and 2021. These datasets have not been previously used and helped us draw a clearer picture of housing trends and housing policies in a period where Athens is traversing a period of housing financialization and of exacerbating housing needs.
The analysis of the construction activity permits highlights that new constructions and renovations are concentrated in the higher social profile areas of the city, both central and suburban. This indicates that the new building or the renovation activity is mainly focused on areas where housing needs are the lowest, leaving out the areas where these needs have been steeply rising since the financial crisis. This means that the unleashed market, in a context where housing regulation remains minimal, is focused on housing as an investment and neglects housing as a need. The provision—production or renovation—of affordable housing in a city where housing cost overburden has skyrocketed does not meet social needs [4]. At the same time, the policies developed in that direction—triggered by the fact that the housing question can no longer be dealt with without regulation like in the past—are so ineffective that they make no difference. The development of a comprehensive housing strategy that combines tools for access to decent and affordable housing (such as social housing, low-interest housing loans, and tax incentives for renovations) with measures to regulate housing prices would contribute to ensuring housing for all and reducing disparities between neighborhoods in Athens.
The most comprehensive dataset we used—the EPCs—confirmed the general hypothesis that transaction activity in the housing market is mainly concentrated in the areas where more demand is concentrated. In more detail, EPCs issued for selling housing units are highly concentrated in the city center, the coast (or Athenian Riviera), and some of the northern bourgeois suburbs. These areas are mainly middle- and upper-middle-class areas of the city and, at the same time, areas where demand for high-quality housing, intensive refurbishment, and housing demand by affluent households, including foreign digital nomads, foreign investors, and holders of Golden Visas, are also concentrated. As far as the Golden Visa policy is concerned, it drives up property prices, leading to higher owner expectations, and often removes from the market and keeps many properties vacant [19,20,46]; thus, the amount and the spatial distribution of Golden Visas should be regulated. EPCs issued for renting housing units are much more territorially focused on central neighborhoods, where rental properties have historically comprised a significant portion of the housing stock and where the recent tourist demand is mainly concentrated.
On the contrary, EPCs issued for accessing subsidies for improving dwellings’ energy performance are concentrated in middle- and upper-middle neighborhoods, testifying that the Energy Upgrade Funding (EUF) project is socially biased, excluding the lower part of the social ladder that could not finance its share of the funding and favoring eventually middle and upper-middle class areas and households. This means that the program has not been able to provide help for upgrading the part of the housing stock with the worst energy performance by excluding, in fact, the lower part of the social ladder located in the neighborhoods with the lowest social profile, including energy-vulnerable populations, but also rented dwellings [38]; findings that align with experiences from other European countries [59,60,61] and pose questions for a social reorientation of renovation policies at the European level. Moreover, areas of the AMA with newer buildings, which typically face fewer severe issues in terms of housing energy performance, gain advantages from the state subsidies. From another perspective, subsidies for energy retrofitting tend to increase the value of properties in already high-value areas, a fact that, according to broader European trends [27,28] ultimately generates surplus value for privileged groups and exacerbates residential segregation. Meanwhile, the housing stock in areas associated with lower economic classes experiences further devaluation. In this context, prioritizing low-income groups and tenants is not the goal of the retrofitting policies, which are not accompanied by providing more funding and protection for tenants from rent increases and renovictions.
Finally, the change in Official Real Estate Property Values (OREPV) in 2021 has been a policy move that (a) reduced property taxes in many upper and upper-middle-class suburbs and (b) increased taxes in upwardly mobile neighborhoods, from upper-middle to lower-middle class, including most of the traditional working-class areas of the city. Readjusting OREPV in order to protect low-income areas from excessive real estate taxation and ensuring a fairer distribution of public policy benefits (which are calculated based on property values) would help mitigate socio-spatial inequalities in Athens and other major cities.
The analysis of these different datasets revealed that the unregulated housing market is following the spatially differentiated demand and reproducing socio-spatial inequalities. It also revealed that the few policy initiatives developed since the early 2010s have not faced the housing needs of the most vulnerable because they were weak and because these needs were not their primary target. The EUF project and the property taxation policies are not simple, but it is clear that their impact has not been advantageous for the lowest part of the social ladder and for deprived neighborhoods. In fact, the first-aid policies developed for housing in Athens, in a transition from conservative protectionism to neoliberal laissez-faire, look ineffective to address housing needs and the improvement of the housing stock. Compared to much stronger welfare regime contexts—like that of Vienna [62], where affordable housing is protected by both the profile of the housing market (i.e., the important share of the non-profit segment and the significant share of social housing)—but also to the residual welfare regimes of the rest of Southern Europe, Athens seems one of the most unregulated cities of the region, where developed housing policies are far behind the needs and trends of increasing inequalities and difficulties for vulnerable groups look like unavoidable outcomes.

Author Contributions

Conceptualization, T.M., S.N.S. and F.V.; methodology, T.M., S.N.S. and F.V.; formal analysis, T.M., S.N.S. and F.V.; data curation, T.M., S.N.S. and F.V.; writing—original draft preparation, T.M., S.N.S. and F.V.; writing—review and editing, T.M., S.N.S. and F.V.; visualization, S.N.S.; funding acquisition, S.N.S. All authors have read and agreed to the published version of the manuscript.

Funding

This research was funded by the Hellenic Foundation for Research and Innovation (HFRI) under grant agreement HFRI-15585. Project title: ‘Segregation patterns and deprivation areas in Athens 2011–2021 (SeDe)’.

Data Availability Statement

The datasets concerning the 2011 census can be directly accessed at the Panorama of the Greek Census Data “(https://panorama.statistics.gr/en/, accessed on 28 November 2024)”.

Conflicts of Interest

The authors declare no conflicts of interest.

Note

1
The OREPV urban index was calculated using QGIS 3.2 tools of spatial analysis. In more detail, we combined 3 distinct basemaps: the linear OREPV (15 m. buffer zone), the circular ORPV and the 2011 URANUS. This procedure was applied to both the 2018 and 2021 OREPV basemaps and their corresponding values. Our goal was to calculate a OREPV urban index for each URANU. First, we intersected the three basemaps and then we “reconstructed” the URANU basemap attributing a OREPV urban value to each URANU. This value, that we named OREPV urban index, equals the average of the values of the linear and circular OREPV intersecting with each URANU, weighted by their part to the total URANUS surface.

References

  1. Kalfa, K. Self-Sheltering Now! The Invisible Side of American Aid to Greece (in Greek); Futura: Athens, Greece, 2019. [Google Scholar]
  2. Mantouvalou, M.; Mavridou, M.; Vaiou, D. Processes of Social Integration and Urban Development in Greece: Southern European Challenges to European Unification. Eur. Plan. Stud. 1995, 3, 189–204. [Google Scholar] [CrossRef]
  3. Allen, J.; Barlow, J.; Leal, J.; Maloutas, T.; Padovani, L. Housing and Welfare in Southern Europe; Blackwell: Oxford, UK, 2004; ISBN 978-1-4051-0307-7. [Google Scholar]
  4. Siatitsa, D. Claims for the ‘Right to Housing’ in Cities of Southern Europe: Discourse and Impact of Social Movements; National Technical University of Athens (NTUA): Athens, Greece, 2014. [Google Scholar]
  5. Siatitsa, D.; Tulumello, S.; Colini, L. Private Profit vs Social Value. In Housing as an Investment in Greece and Southern Europe; FEPS/ ETERON: Athens, Greece, 2025. [Google Scholar]
  6. Maloutas, T. Athens. A Rapidly Changing Metropolis in the European South; Maloutas, T., Ed.; Routledge: London, UK, 2025; ISBN 9781032659848. [Google Scholar]
  7. Economou, D. Land and Housing System. In The Problems of Welfare State Development in Greece (in Greek); Maloutas, T., Economou, D., Eds.; Exadas: Athens, Greece, 1988; pp. 57–114. [Google Scholar]
  8. Mantouvalou, M. Urban Land Rent, Land Prices and Urban Space Development Processes II: Problematic for Spatial Analysis in Greece (in Greek). Greek Rev. Soc. Res. 1996, 89, 53. [Google Scholar] [CrossRef]
  9. Antonopoulou, S. The Building Industry in Greece: Its Role in the Post-War Greek Economy; University College London: London, UK, 1987. [Google Scholar]
  10. Maloutas, T.; Spyrellis, S.N. Vertical Segregation: Mapping the Vertical Social Stratification of Residents in Athenian Apartment Buildings. Méditerranée 2016, 127, 27–36. [Google Scholar] [CrossRef]
  11. Vatavali, F. Housing Production and Land Ownership during the Period 1990–2007. Social Dimensions of the Transformations in the City of Ioannina (in Greek). Geographies 2017, 28, 78–96. [Google Scholar]
  12. Polyzou, I.; Spyrellis, S.N. Housing Practices of Albanian Immigrants in Athens: An “in-between” Socio-Spatial Condition. Land 2024, 13, 964. [Google Scholar] [CrossRef]
  13. Kourachanis, N. Housing as a Base for Welfare in Greece: The Staircase of Transition and Housing First Schemes. Int. J. Hous. Policy 2022, 24, 596–616. [Google Scholar] [CrossRef]
  14. Emmanuel, D. Socio-Economic Inequalities and Housing in Athens: Impacts of the Monetary Revolution of the 1990s. Greek Rev. Soc. Res. 2004, 113, 121–143. [Google Scholar]
  15. Emmanuel, D. The Greek System of Home Ownership and the Post-2008 Crisis in Athens. Reégion Et Deéveloppement 2014, 39, 167–182. [Google Scholar]
  16. Chimoniti-Teroviti, S. Developments in the Housing Market; CRES: Athens, Greece, 2005. [Google Scholar]
  17. Kandylis, G.; Papatzani, E.; Polyzou, I. Between Coexistence and Marginality: Migrants and Socio-Spatial Change in Athens. In Athens A Rapidly Changing South European Metropolis; Maloutas, T., Ed.; Routledge: London, UK, 2024. [Google Scholar]
  18. Siatitsa, D.; Gyftopoulou, S.; Balampanidis, D.; Papatzani, E. For the Right to Affordable Rental Housing (a Summarised Version); ETERON: Athens, Greece, 2022. [Google Scholar]
  19. Alexandri, G. Housing Financialisation a La Griega. Geoforum 2022, 136, 68–79. [Google Scholar] [CrossRef]
  20. Pettas, D.; Avdikos, V.; Papageorgiou, A. Platform—Driven Housing Commodification, Financialisation and Gentrification in Athens. J. Hous. Built Environ. 2024, 39, 1541–1562. [Google Scholar] [CrossRef]
  21. Tulumello, S.; Dagkouli-Kyriakoglou, M. Housing Financialization and the State, in and Beyond Southern Europe: A Conceptual and Operational Framework. Hous. Theory Soc. 2024, 41, 192–215. [Google Scholar] [CrossRef]
  22. Tulumello, S.; Dagkouli-Kyriakoglou, M. Financialization of Housing in Southern Europe: Policy Analysis and Recommendations. Final Report—Submitted 28/01/2021; Project commissioned by the European Parliament, office of MEP José Gusmão (group The Left in the European Parliament): Brussels, Belgium, 2021. [Google Scholar]
  23. Wetzstein, S. The Global Urban Housing Affordability Crisis. Urban Stud. 2017, 54, 3159–3177. [Google Scholar] [CrossRef]
  24. Zhang, C.; Jia, S.; Yang, R. Housing Affordability and Housing Vacancy in China: The Role of Income Inequality. J. Hous. Econ. 2016, 33, 4–14. [Google Scholar] [CrossRef]
  25. Ferrera, M. The “Southern Model” of Welfare in Social Europe. J. Eur. Soc. Policy 1996, 6, 17–37. [Google Scholar] [CrossRef]
  26. Sequera, J.; Nofre, J. Urban Activism and Touristification in Southern Europe. In Contemporary Left-Wing Activism Vol 2; Routledge: London, UK, 2018; pp. 88–105. [Google Scholar]
  27. Grossmann, K. Energy Efficiency for Whom? A Conceptual View on Retrofitting, Residential Segregation and the Housing Market. Sociol. Urbana Rural. 2019, 119, 78–95. [Google Scholar] [CrossRef]
  28. Bouzarovski, S.; Frankowski, J.; Tirado Herrero, S. Low-Carbon Gentrification: When Climate Change Encounters Residential Displacement. Int. J. Urban Reg. Res. 2018, 42, 845–863. [Google Scholar] [CrossRef]
  29. Bergoënd, A. Renovictions in Europe. Briefing, FEANTSA, 2022. Available online: https://www.feantsa.org/public/user/Resources/reports/2022/2_Briefing_-_Renovictions_in_Europe.pdf (accessed on 20 February 2025).
  30. Burbidge, M.; Papantonis, D.; Petrova, S.; Bouzarovski, S.; Apostoliotis, A.; Flamos, A. Gender-Blind Energy Efficiency Policy-Making in Europe: Risks and Challenges for the Private Rented Sector. In Proceedings of the European Council for an Energy Efficient Economy—Summer Study, Chamouille, France, 10–15 June 2024. [Google Scholar]
  31. von Platten, J.; Mangold, M.; Johansson, T.; Mjörnell, K. Energy Efficiency at What Cost? Unjust Burden-Sharing of Rent Increases in Extensive Energy Retrofitting Projects in Sweden. Energy Res. Soc. Sci. 2022, 92, 102791. [Google Scholar] [CrossRef]
  32. Gustafsson, J. Renovations as an Investment Strategy: Circumscribing the Right to Housing in Sweden. Hous. Stud. 2021, 39, 1555–1576. [Google Scholar] [CrossRef]
  33. Charles, H.; Bouzarovski, S.; Bellamy, R.; Gormally-Sutton, A. ‘Although It’s My Home, It’s Not My House’—Exploring Impacts of Retrofits with Social Housing Residents. Energy Res. Soc. Sci. 2025, 119, 103869. [Google Scholar] [CrossRef]
  34. Maloutas, T.; Spyrellis, S. Inequality and Segregation in Athens: Maps and Data. In Athens Social Atlas. Digital Compendium of Texts and Visual Material; Maloutas, T., Spyrellis, S., Eds.; Athens Social Atlas: Athens, Greece, 2019. [Google Scholar]
  35. Maloutas, T.; Spyrellis, S.N. Segregation Trends in Athens: The Changing Residential Distribution of Occupational Categories during the 2000s. Reg. Stud. 2019, 54, 462–471. [Google Scholar] [CrossRef]
  36. EKKE (National Centre for Social Research)—ELSTAT (Hellenic Statistical Authority) Panorama of Greek Census Data 1991–2011. Internet Appl. Access Map Census Data 2015. Available online: https://panorama.statistics.gr/en/ (accessed on 3 November 2024).
  37. ELSTAT (Hellenic Statistical Authority). The Results of the Census, Population and Residences 2021 (in Greek); ELSTAT (Hellenic Statistical Authority): Athens, Greece, 2023. [Google Scholar]
  38. Chatzikonstantinou, E.; Katsoulakos, N.; Vatavali, F. Housing, Energy Performance and Social Challenges in Greece. A Quantitative Approach. E3S Web. Conf. 2023, 436, 01015. [Google Scholar] [CrossRef]
  39. Vaiou, D.; Mantouvalou, M.; Mavridou, M. Athens 2004. On the Traces of Globalisation? (In Greek). Geographies 2004, 7, 13–25. [Google Scholar]
  40. Delladetsimas, P.M. The Current Dynamics of Athens’ Development: Conventional-New Model and Infrastructure Projects (in Greek). Geographies 2004, 7, 48–64. [Google Scholar]
  41. ELSTAT (Hellenic Statistical Authority) 2021 Population-Housing Census. Available online: https://www.statistics.gr/en/2021-census-pop-hous (accessed on 19 November 2024).
  42. Mantouvalou, M. Urban Land Rent, Land Prices and Urban Space Development Processes I: Theory through the Greek Experience (in Greek). Greek Rev. Soc. Res. 1995, 88, 33–59. [Google Scholar]
  43. ELSTAT (Hellenic Statistical Authority). Notary Activities: Year 2023 (in Greek); ELSTAT (Hellenic Statistical Authority): Athens, Greece, 2024. [Google Scholar]
  44. Bank of Greece Indices of Residential Property Prices: Q1 2024; Bank of Greece: Athens, Greece, 2024.
  45. Triantafyllopoulos, N. The Building Stock of Central Athens. In Athens Social Atlas. Digital Compendium of Texts and Visual Material; Maloutas, T., Spyrellis, S., Eds.; Athens Social Atlas: Athens, Greece, 2015. [Google Scholar]
  46. Dimitrakou, I. Vacancy, Access to Housing and Micro-segregation. Bull. Corresp. Hellénique Mod. Contemp. 2022, 43–66. [Google Scholar] [CrossRef]
  47. Tyrovolas, A. He “Golden Visa” Policy in Greece: Privileged Mobility; Harokopeio University of Athens: Athens, Greece, 2020. [Google Scholar]
  48. Pavlou, A. Real Estate: Who Are the Foreign Buyers in Greece? (in Greek). Oikon. Taxydromos 2024. Available online: https://www.ot.gr/2024/04/13/oikonomia/akinita/akinita-poioi-ksenoi-agorazoun-stin-ellada-pinakes-2/ (accessed on 25 November 2024).
  49. Alexandri, G. Planning Gentrification and the ‘Absent’ State in Athens. Int. J. Urban Reg. Res. 2018, 42, 36–50. [Google Scholar] [CrossRef]
  50. Pettas, D.; Avdikos, V.; Iliopoulou, E.; Karavasili, I. “Insurrection Is Not a Spectacle”: Experiencing and Contesting Touristification in Exarcheia, Athens. Urban Geogr. 2022, 43, 984–1006. [Google Scholar] [CrossRef]
  51. European Commission. A Renovation Wave for Europe—Greening Our Buildings, Creating Jobs, Improving Lives; European Commission: Bruxelles, Belgium, 2020. [Google Scholar]
  52. McCord, M.; Haran, M.; Davis, P.; McCord, J. Energy Performance Certificates and House Prices: A Quantile Regression Approach. J. Eur. Real Estate Res. 2020, 13, 409–434. [Google Scholar] [CrossRef]
  53. ELSTAT (Hellenic Statistical Authority). Energy Efficiency and Housing Difficulties; ELSTAT (Hellenic Statistical Authority): Athens, Greece, 2024. [Google Scholar]
  54. Chatzikonstantinou, E.; Katsoulakos, N.; Vatavali, F. Housing and Energy Consumption in Greece. Households’ Experiences and Practices in the Context of the Energy Crisis. IOP Conf. Ser. Earth Environ Sci. 2022, 1123, 012043. [Google Scholar] [CrossRef]
  55. Ozgunes, M.; Vrantsis, N. Energy Efficiency Renovation: Impact and Challenges in Greece. FEANTSA: Brussels, Belgium, 2022. [Google Scholar]
  56. Spitogatos.gr. The Impact of Energy Class on Property Values and Rental Prices in Athens; Spitogatos: Athens, Greece, 2024. [Google Scholar]
  57. Christoforaki, K. The Spatial and Social Footprint of the Energy Saving Program “Eksikonomisi Kat’ Oikοn”. In Athens Social Atlas. Digital Compendium of Texts and Visual Material; Maloutas, T., Spyrellis, S., Eds.; Athens Social Atlas: Athens, Greece, 2018. [Google Scholar]
  58. Vourgana, M. The Price List for Property Transfers (in Greek). Oikon. Taxidromos 2023. Available online: https://www.ot.gr/2023/06/17/forologia/forologia-eidiseis/o-timokatalogos-stis-metavivaseis-akiniton/ (accessed on 3 November 2024).
  59. Fernández, A.; Haffner, M.; Elsinga, M. Subsidies or Green Taxes? Evaluating the Distributional Effects of Housing Renovation Policies among Dutch Households. J. Hous. Built Environ. 2024, 39, 1161–1188. [Google Scholar] [CrossRef]
  60. Willand, N.; Moore, T.; Horne, R.; Robertson, S. Retrofit Poverty: Socioeconomic Spatial Disparities in Retrofit Subsidies Uptake. Build. Cities 2020, 1, 14–35. [Google Scholar] [CrossRef]
  61. Schleich, J. Energy Efficient Technology Adoption in Low-Income Households in the European Union—What Is the Evidence? Energy Policy 2019, 125, 196–206. [Google Scholar] [CrossRef]
  62. Kazepov, Y.; Verwiebe, R. Vienna; Routledge: London, UK, 2021; ISBN 9781003133827. [Google Scholar]
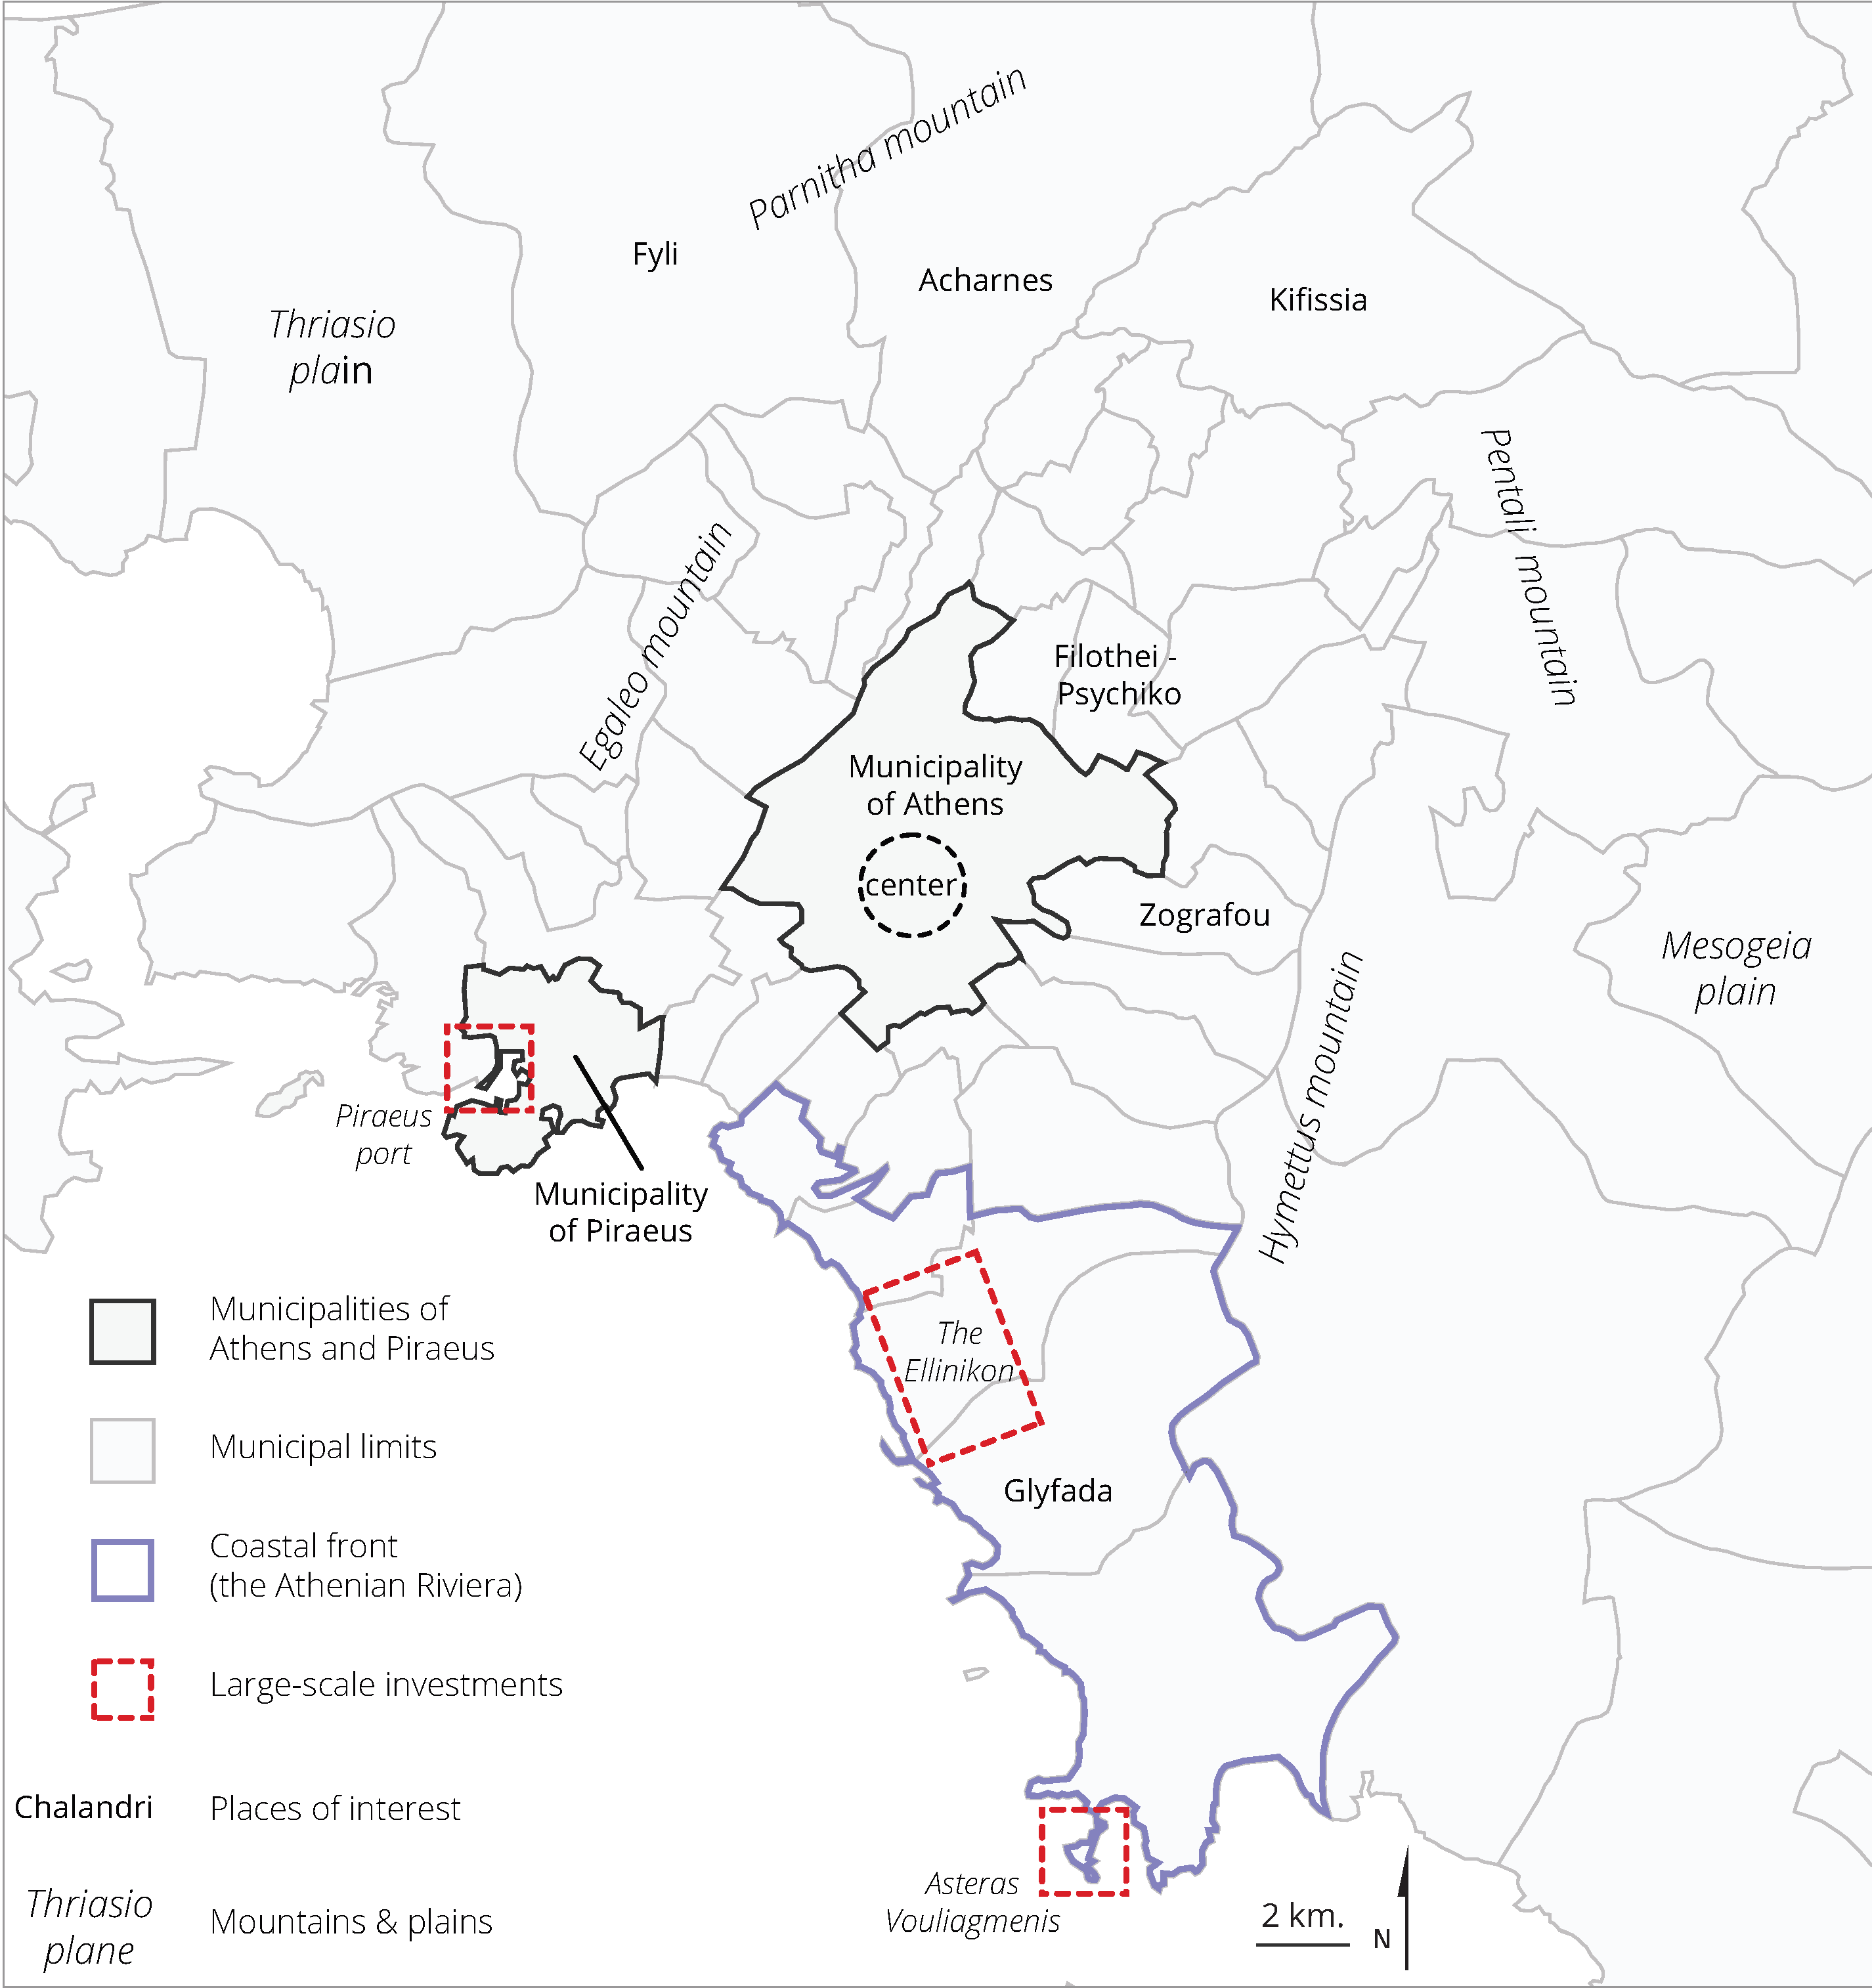
Figure 1. The Athens Metropolitan Area (AMA).
Land 14 00777 g001
Figure 2. Social types of residential areas, AMA (2011). Source: Maloutas and Spyrellis (2019) [34].
Land 14 00777 g002
Figure 3. Dwellings’ Energy Class level by Postal code level (2012–2023), in the AMA. (a) High energy class dwellings; (b) middle energy class dwellings; (c) low energy class dwellings. Source: [36], MoEE.
Land 14 00777 g003
Figure 4. (a) Low and (b) middle energy class dwellings and social types of residential areas (2012–2023), in the AMA. Source: EKKE ELSTAT [36], MoΕE.
Land 14 00777 g004
Figure 5. Number of new dwellings in the AMA (2010–2023). Source: ELSTAT [41].
Land 14 00777 g005
Figure 6. (a) Building permits per category and (b) part of building permits per category in the AMA (2010–2023). Source: ELSTAT [41].
Land 14 00777 g006
Figure 7. Evolution of permits for construction activity, 2019–2023, in the AMA. Source: TCG.
Land 14 00777 g007
Figure 8. (a) Small-scale works permits and (b) building permits, postal codes level (2019–2023), in the AMA. Source: [36], TCG.
Land 14 00777 g008
Figure 9. (a) Building permits per social type of residential area and (b) social type of residential areas per level of concentration of building permits (2019–2023), in the AMA. Source: [36], TCG.
Land 14 00777 g009
Figure 10. (a) Small-scale works permits per social type of residential area and (b) Social type of residential areas per level of concentration of small-scale works permits (2019–2023), in the AMA. Source: EKKE-ELSTAT [36], TCG.
Land 14 00777 g010
Figure 11. Evolution of issuing EPCs, by purpose, 2012–2023, in the AMA. Source: MoEE.
Land 14 00777 g011
Figure 12. Energy Performance Certificates (EPCs) issued for (a) selling or (b) renting dwellings, postal codes level (2012–2023), in the AMA. Source: EKKE-ELSTAT [36], MoEE.
Land 14 00777 g012
Figure 13. Social type of residential areas per level of concentration of (a) Energy Performance Certificates (EPCs) issued for selling dwellings and (b) Energy Performance Certificates (EPCs) issued for renting dwellings, in the AMA. Source: EKKE-ELSTAT [36], MoEE.
Land 14 00777 g013
Figure 14. (a) Small size (0–50 m2) dwellings; (b) medium size (0–50 m2) dwellings; and (c) big size (0–50 m2) dwellings, for which an EPC has been issued, postal codes level (2012–2023), in the AMA. Source: EKKE-ELSTAT [36], MoEE.
Land 14 00777 g014
Figure 15. (a) Small size (0–50 m2) dwellings; (b) medium size (0–50 m2) dwellings; and (c) big size (0–50 m2) dwellings, per social type of residential area (2012–2023), in the AMA. Source: EKKE-ELSTAT [36], MoEE.
Land 14 00777 g015
Figure 16. EPCs issued for EUF, Postal codes level (2012–2023), in the AMA. Source: EKKE-ELSTAT [36], MoEE.
Land 14 00777 g016
Figure 17. (a) Energy Upgrade Funding per social type of residential area and (b) social type of residential areas per level of concentration of Energy Upgrade Funding subsidies (2019–2023), in the AMA. Source: EKKE-ELSTAT [36], MoEE.
Land 14 00777 g017
Figure 18. (a) 2018 Objective Real Estate Property Values (OREPV) and (b) change (%) of Objective Real Estate Property Values (OREPV) 2018–2021, 2011 URANU level, in the AMA. Source EKKE-ELSTAT [36], MoF.
Land 14 00777 g018
Figure 19. (a) 2018 Objective Real Estate Property Values (OREPV); (b) change (%) of the Objective Real Estate Property Values (OREPV) in 2018–2021, per social type of residential area (2012–2023), in the AMA. Source: EKKE-ELSTAT [36], MoF.
Land 14 00777 g019
Table 1. Energy Performance Certificates (EPCs) issued by purpose, 2012–2023 in the AMA. Source: MoEE.
PurposeNumberPercentage (%)
Rent547,44674.3%
Sales162,04022.0%
Energy Upgrade Funding (EUF)27,2783.7%
Total736,764100.0%
Table 2. Permits issued by TCG, 2019–2023 in the AMA. Source: TCG.
Type of PermitNumberPart (%)
Building permits12,54216.6%
Small-scale works permits62,79283.4%
Total75,334100.0%
Table 3. Distribution of the population by social type of areas and by indicative social variables. Location quotient (LQ) (2011). Source: EKKE-ELSTAT [36].
Social Profile of Residential AreasTenantsHigher Education (Age 22+)Higher OC (ISCO 1 and 2) Lower OC (ISCO 6 to 9) Immigrants
Upper OC0.762.332.090.430.53
Upper-middle0.881.681.590.550.47
Intermediate OC, Upper 2nd zone 0.961.041.070.790.60
Intermediate OC, lower 1st zone1.260.890.871.031.33
Traditional working-class 0.840.560.701.170.76
Central (social transformation)1.821.090.851.383.15
New and distant working-class 0.710.410.521.631.22
Total11111
Table 4. Distribution of the population by social type of residential areas and by housing variables. Location quotient (LQ) (2011). Source: EKKE-ELSTAT [36].
Social Profile of Residential AreasIn Apartment
Buildings
In Conditions of Housing Poverty (<20 m2 per capita)Up to
50 m2 *
Between
50–90 m2 *
Between
90–300 m2 *
Upper OC0.780.220.333.991.86
Upper-middle1.020.480.482.081.55
Intermediate OC, Upper 2nd zone 1.120.850.790.731.00
Intermediate OC, lower 1st zone1.251.151.440.380.65
Traditional working-class 0.871.180.900.600.85
Central (social transformation)1.381.392.220.440.59
New and distant working-class 0.451.471.090.951.04
Total11111
* Size of dwellings.
Table 5. EPCs by purpose of issuing, size and energy class, 2012–2023, in the AMA. Source: MoEE.
PurposeSize in m2 (%)Energy Class (%)
Small
(0–50 m2)
Medium
(50–100 m2)
Big
(100–300 m2)
High
(A, B)
Average
(C, D)
Low
(E, F, G)
Rent20.461.917.72.427.270.3
Sales18.556.125.43.623.073.4
Energy Upgrade Funding (EUF)3.858.737.535.8 *43.1 *21.1 *
Total19.360.520.23.926.969.2
* Energy Class of housing units after retrofitting funded by EUF.
Disclaimer/Publisher’s Note: The statements, opinions and data contained in all publications are solely those of the individual author(s) and contributor(s) and not of MDPI and/or the editor(s). MDPI and/or the editor(s) disclaim responsibility for any injury to people or property resulting from any ideas, methods, instructions or products referred to in the content.