Article

Quantifying the Provincial Carbon Emissions of China Embodied in Trade: The Perspective of Land Use

1
Key Laboratory of Earth Surface Processes of Ministry of Education, College of Urban and Environmental Sciences, Peking University, Beijing 100871, China
2
Key Laboratory of Geographic Information Science of the Ministry of Education, School of Geographic Sciences, East China Normal University, Shanghai 200241, China
*
Authors to whom correspondence should be addressed.
Land 2025, 14(4), 753; https://doi.org/10.3390/land14040753
Submission received: 28 February 2025 / Revised: 27 March 2025 / Accepted: 29 March 2025 / Published: 1 April 2025

Abstract

:
Land use supports production and living activities and provides ecosystem services for people. With the flow of capital, goods, and services among regions, trade leads to the transfer of carbon emissions from importing regions to exporting regions, and this is telecoupled with land systems in different regions. Although significant progress has been made in quantifying embodied carbon emissions induced by interprovincial and international trade, the telecoupling relationship between carbon emissions and land systems has not been sufficiently investigated. Here we followed the telecoupling theoretical framework and used the multi-region input–output (MRIO) model to examine the spatial pattern of embodied carbon emissions by land use in China due to interprovincial trade. The results show that the spatial patterns of embodied carbon emissions from the production end and from the consumption end are different based on land use type. The provinces with rich energy resources and favorable conditions such as Inner Mongolia, Xinjiang, and Heilongjiang undertake carbon emissions from the agricultural and industrial land use of other provinces. In contrast, the provinces with large economies but scarce resources such as Zhejiang and Guangdong export larger portions of their carbon emissions to the land use of other provinces. Across China, developed regions generally exported more carbon emissions from land use than they undertake from other developing regions. The carbon transfer in agricultural land was prominent between the eastern and western regions. The carbon emissions of industrial land were generally transferred from southern regions to northern and western areas. Our research reveals different patterns of embodied carbon emissions for different land use types, and these findings could provide more detailed information for policy-making processes to achieve fair carbon emissions and sustainable land use.

1. Introduction

Fossil energy consumption and land use/cover change (LUCC) are two key sources of carbon emissions and contribute much to global warming [1]. Land is an essential resource for supporting human beings by providing production, living, and ecological functions. Land use activities, along with the energy use and carbon emissions, directly affect terrestrial carbon cycling [2,3]. Due to the different endowments of land resources and varied human needs among regions, trades occur to meet the diverse needs of a region with the flow of commodities and services, during which the transfer of embodied carbon emissions are indispensable. For example, developed countries tend to transfer polluting industries and energy-intensive industries to underdeveloped regions, which increases their burden of carbon emissions and causes inequality [4,5]. Carbon emissions associated with international trade account for about 27% of total global land-use emissions [6]. The transfer of carbon emissions could also occur within a single country, where the trade leads to carbon emitted from the production end of one region to the consumption end of another through the transportation of goods [7,8]. Differences in industrial structure, energy consumption patterns, and human activity intensity result in diverse land use patterns, so that the transfer of carbon emissions embodied in trade is closely linked to land-use activities [6,9,10]. Therefore, investigating the spatial patterns of carbon emissions embodied in trade from the perspective of land use can provide more detailed information about to policy-making processes to achieve carbon emissions equality and sustainable land use.
Significant progress has been made to quantify the carbon emissions of a country or region embodied in international or regional trade, especially in recent years when the impact of CO2 emissions on global warming has attracted more global attention [11,12]. Various approaches, such as life cycle assessments (LCA) and input–output analysis (IOA), have been used to quantify embodied carbon emissions in trade [13,14]. LCA can accurately estimate the carbon emissions by taking into account the whole product’s lifecycle, but this method has high data requirements and has difficulty in determining the boundary of life stage, making it challenging to be used at large scales, e.g., provincial or national. Input–output models, which define the system boundary clearly by considering the economy as a whole at national or sectoral level, can provide a consistency analysis of flows among regions. Examples of these models include the single region input–output (SRIO) model, the bilateral trade input–output (BTIO) model, and the MRIO model, and their differences lie in system boundaries, assumptions, and model complexity. Among them, MRIO divides bilateral trade into intermediate inputs and final use and enables the ability to trace back to specific production and consumption regions, so that they can reflect inter-regional production and consumption dynamics, and the connections among different sectors. Therefore, MRIO has been widely and effectively employed for its better performance in quantifying embodied carbon emissions to understand the patterns of carbon emission flows caused by international or inter-regional trade [15]. However, the telecoupling between carbon emissions and land systems has still not been sufficiently investigated to support the achievement of carbon emissions equality and land sustainability because land is the basic site for carbon emissions and policy implementation [16,17].
With the increased interconnection due to globalization and trade, a land system in one place could have significant influence on distant places with the flows of goods, capital, and information [18,19,20] such that quantifying the land use-based carbon emissions of a region should account for the carbon emissions released from the land use of the region and the carbon emission from other regions for production or consumption [21,22]. Neglecting the spillover effect of regional carbon emissions may underestimate a region’s actual carbon emissions and unfair carbon quota allocation [13]. Previous studies have developed various of methods to quantify land use-based carbon emissions at multiple scales and examined the influencing mechanisms of land-use emissions [21,23,24,25]. The telecoupling framework could revisit the interaction among multiple coupled human–environmental systems over long distances and reveal hidden cross-regional connections [18]. Studies have successfully conducted telecoupling analysis on land use change [26], effects of international trade on environmental pressures [20], urbanization [19], and ecosystem services [27]. Embodied carbon emissions are telecoupled with land use, which can be investigated using the telecoupling framework [27,28,29]. Previous studies have quantified carbon emissions embodied in trade by particular regions and specific land use types [30,31]. To our best knowledge, there is still a lack of studies that analyze carbon emissions based on land use embodied in trade from the perspective of the telecoupling framework.
Carbon emissions in China play an important role in the global carbon budget. Since the 1980s, China’s carbon emissions from fossil fuel combustion have increased by an average of 15% per year, and since 2006, China has been the largest CO2 emitter globally [3]. Meanwhile, China has implemented a series of ecological engineering and conservation management measures, such as Three Norths Shelter Forest System Project and the Natural Forest Conservation Program. These initiatives have contributed 10~31% of the total carbon sequestration in global terrestrial ecosystems [32]. China became the center of world exports of embodied carbon emissions, undertaking more than one-fifth of carbon transfers embodied in global trade. The net carbon emissions embodied in exports increased from 956 Mt in 2004 to 1201 Mt in 2014, making it an increasingly typical net exporter of embodied carbon [33]. The net amount of interprovincial carbon emissions in trade shows an increasing trend, and the transfer patterns also change. China has set itself the ambitious goal of achieving carbon peaking before 2030 and carbon neutrality before 2060. Achieving these goals requires the determination of carbon emissions quotas for different provinces and regions from the perspective of equality and sound information to guide sustainable land use. Given this, we incorporated the telecoupling framework into multi-regional input–output models to quantify the spatial pattern of land use-based carbon emissions embodied in trade in China. We addressed the following questions: (1) How much embodied carbon emissions from other provinces are undertaken by the land use of each province? (2) How much embodied carbon emissions does the consumption of each province transfer to the land use of other provinces? (3) How do embodied carbon emissions flow among different provinces and economic zones? We assumed that the spatial patterns of embodied carbon emission caused by trade were different based on land use type. This study deepens our understanding of the long-distance interactions between land systems and provides guidance for formulating more targeted carbon emission reduction policies.

2. Study Area and Data Sources

2.1. Study Area

China, with its vast territory and abundant land resources, has provided great support for social and economic development. China’s economy has grown rapidly with GDP increasing from CNY 364.52 billion in 1978 to CNY 101.59 trillion in 2020, and, accordingly, land use patterns have changed dramatically. In the past 20 years, cultivated land has increased in the northeastern and northwestern regions, while built-up land has expanded rapidly in the Beijing–Tianjin–Hebei region, the Yangtze River Delta, and the Pearl River Delta. It is worth noting that over 80% increased construction land came from cultivated land [34]. Meanwhile, carbon emissions embodied in the trade of China generally shift from Guangdong and Jiangsu to regions such as Hebei, Shanxi, and Inner Mongolia [35]. With the rapid development of China’s economy, industrial restructuring, and continuous improvements in infrastructure such as railways and highways, inter-regional trade in intermediate and final products has become more frequent. Since 2002, the scale of inter-regional trade among provinces has far exceeded international trade, accounting for 13% of the GDP in 2017. Due to the obvious asymmetry in the inflow and outflow of goods in inter-regional trade among provinces in China, the spatial transfer of embodied carbon emissions among provinces is not neglectable [36].
We conducted analyses both at provincial level and by economic zone. Due to data availability, we included 30 provinces, autonomous regions, and municipalities of China in our analysis. We adopted the division scheme of economic zones from the Development Research Center of the State Council of China, which is based on geographical location and the distribution of natural resources and takes into account national and regional development plans, economic policies, and inter-regional economic connections. The eight economic regions include (Figure 1) the northeastern region, Beijing–Tianjin region, northern coastal region, eastern coastal region, southern coastal region, central region, southwestern region, and northwestern region. Tibet, Hong Kong, Macau, and Taiwan were excluded from the study.

2.2. Data Sources and Processing

We used the MRIO table of China from 2017, which was obtained from the Carbon Emissions Accounts & Datasets (CEADs) [37]. The reason for using the table from 2017 is that it contains the latest data generated by the CEADs, which provides accurate and the most up-to-date carbon emissions, social economic, and trade data. The IPCC conversion factors for fossil energy in standard coal and carbon emission coefficients were adopted to quantify the carbon emissions for each production activity (2006). We collected data on socio-economy, population, agriculture, and energy consumption from the China Statistical Yearbook (2018), China Agricultural Statistical Yearbook (2018), and the China Energy Statistical Yearbook (2018).

3. Methods

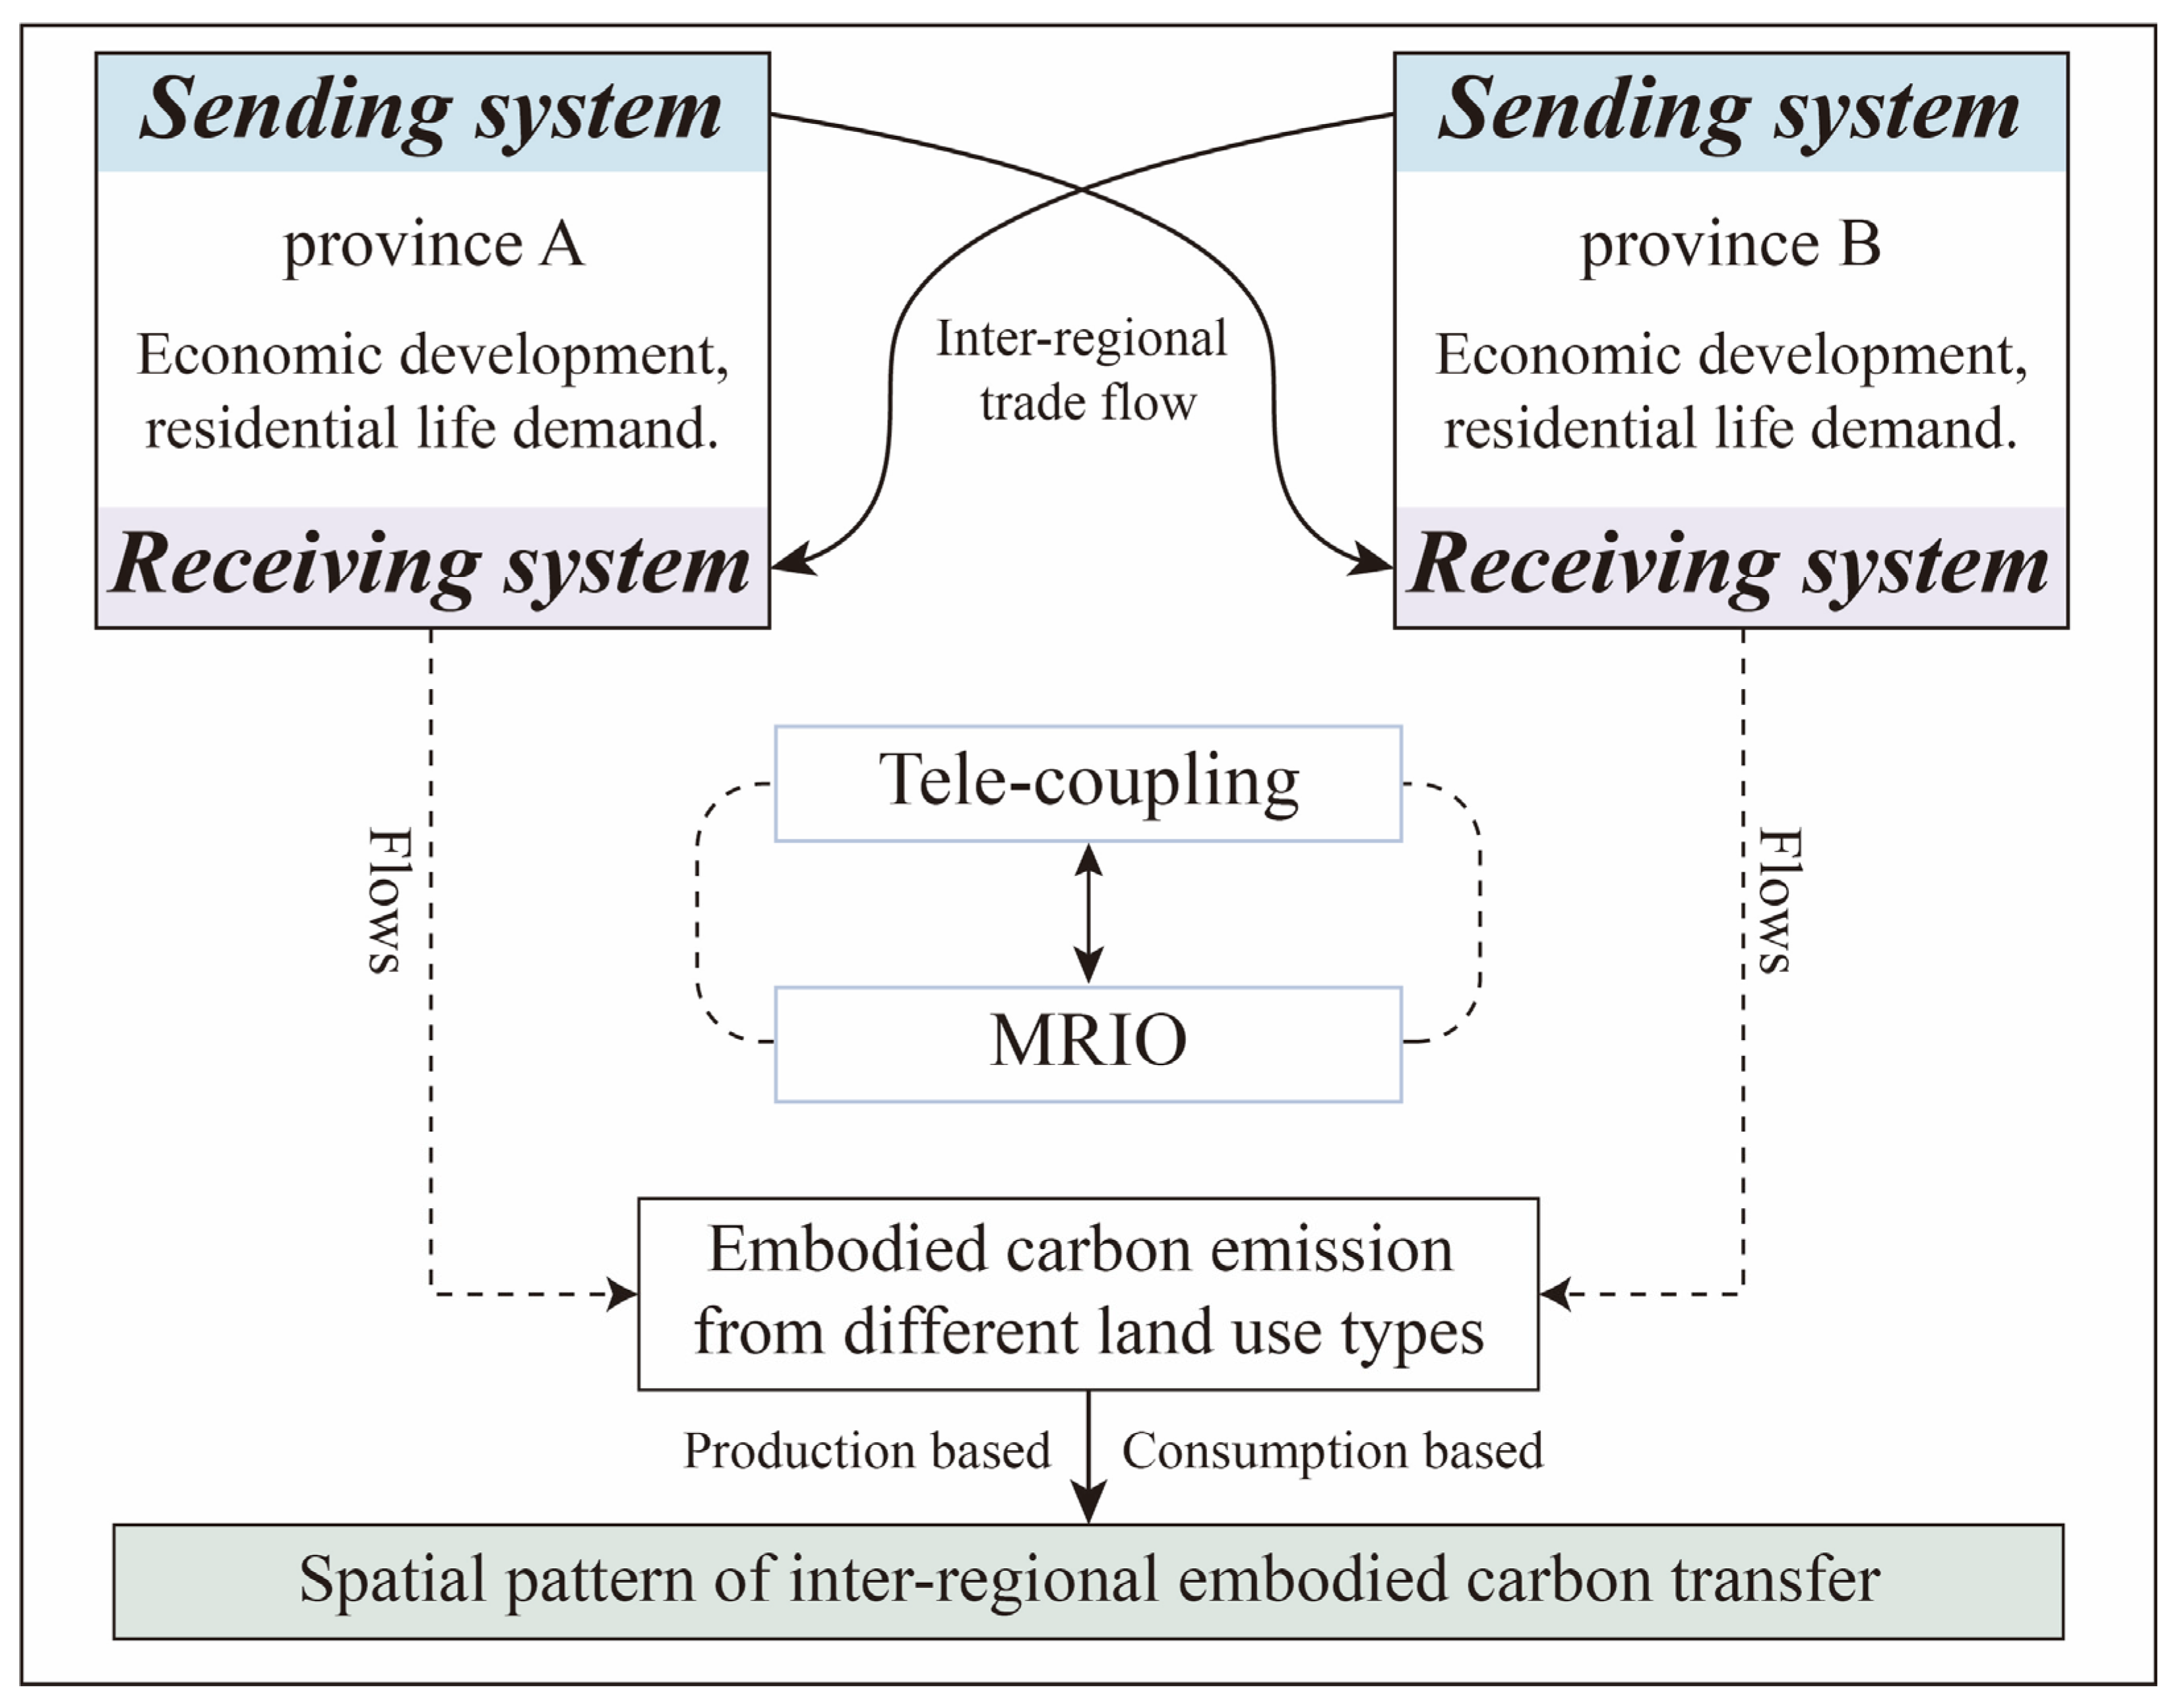
3.1. Telecoupling Framework

We applied a telecoupling framework to analyze land use-based embodied carbon emissions induced by trade (Figure 2) [18]. Each province is a dual system, functioning as both a sender and a receiver. As a sending system, the province utilizes its land resources to produce goods to meet the demands of this province and other provinces via trade. As a receiving system, the province imports goods produced on land of other provinces to meet its demands. The goods obtained through land use activities can be represented by embodied carbon emissions, while trade signifies the spatial transfer of land use-based embodied carbon emissions. Following this framework, we employed the MRIO model to quantify the patterns of the flows of land use-based embodied carbon emissions between provinces and regions.

3.2. Quantifying Land-Use Carbon Emissions Based on Energy Consumption

To characterize the transfer of land use-based embodied carbon emissions among provinces, we used a carbon emission model based on energy consumption to calculate embodied carbon emissions of various land-use types and provinces. First, we used the carbon emission coefficients to convert the energy consumption of 42 sectors into carbon emissions. Then, we categorized these 42 energy consumption sectors into three aggregated land-use types: agricultural land (agr), industrial land (ind), and construction land (con). Due to the mismatch between land use classes and economic sectors in the energy consumption table, we assigned the sectors to land-use types based on their energy use types (Table 1). Third, the land use-based carbon emissions for each land-use type and the total for each province can be calculated as follows:
C tot = C agr + C ind + C con
C tot = i = 1 n = 5 T i δ i Agricultural   land + i = 1 n = 11 E ni θ i f i Industrial   land + i = 1 n = 11 E ki θ i f i + K i p i Construction   land
where C t o t is the total carbon emissions of a province; C a g r , C i n d , and C c o n represent the carbon emissions for agricultural land, industrial land, and construction land, respectively; T i   represents the ith source of carbon emissions in agricultural land, including the usages of pesticides, agricultural diesel, agricultural irrigation, chemical fertilizer, and agricultural plastic film; δ i represents the carbon emission coefficient; E n i and E k i represent the energy consumption of type i by industrial land and construction land, respectively; θ i is the conversion coefficient of standard coal; f i is the carbon emission coefficient for specific energy use; K i is the carbon emission coefficient associated with animal gastrointestinal fermentation and excretion; and p i is the number of different organisms producing carbon emissions, including humans and large livestock. The factors for standard coal conversion and carbon emission of energy sources referred to the IPCC Guidelines for National Greenhouse Gas Inventories [38].

3.3. Modeling the Flows of Land Use-Based Embodied Carbon Emissions

Based on the China’s MRIO table at the provincial level, we examined the flows of land use-based embodied carbon emissions induced by trade for each province using the MRIO model. This model reveals economic and technological linkages between sectors in different regions and has proven to be an effective method for describing and analyzing supply chains and the linkage effects between consumption and production sectors [15,29,39]. Assuming a country with m regions, with each region having n sectors, the MRIO was written as follows:
X = AX + Y
Equation (3) could be formulated as follows:
X i   =   I     A ii 1 j = 1 j i m A ij X j + j = 1 j i m Y ij + Y ii + E X i
where matrix X i represents the total output in region i. A ij represents the production of one unit of output in region j that requires the output in region i. I A i i 1 is the Leontief inverse, which reveals the direct and indirect input relationship to produce one unit of final product. I A i i 1 j i m A i j X j and I A i i 1 j i m Y i j represent the total output of intermediate and final products provided by province i to other provinces, respectively. I A i i 1 Y i i and I A i i 1 E X i represent the total output of final and export products provided by province i to meet its local demands. Here, we did not consider the international trade due to its smaller percentage compared to the total trade and consumption within China.
Based on all the above equations, the land use-based embodied carbon emissions caused by trade can be calculated as follows:
C embodied   =   C i   I A 1 Y
where C i is carbon intensity, indicating the physical carbon emissions per unit of output for each sector.
Based on the carbon accounting framework of the Kyoto Emissions Reduction Model, carbon emissions from the production end not only include the emissions from producing final products for meeting the domestic demand within a country, but also includes those from producing products for meeting the demand of other regions [40].
Carbon emissions from the production end in province i can be calculated as follows:
CE producer i = C i I A ii 1 Y ii domestic   demand   +   C i I A ii 1 j = 1 j i m A ij X j   +   C i I A ii 1 j = 1 j i m Y ij external   demand
Carbon emissions from the consumption end in province i are composed of two components: carbon emissions from consuming products of a region and carbon emissions from consuming products from other regions through trade. The latter represents the amount of emissions that is transferred to other regions that should have been taken on by the region itself.
Carbon emissions from the consumption end in province i can be calculated as follows:
CE consumer i = C i I A ii 1 Y ii domestic   consume   +   C j I A jj 1 j = 1 j i m A ji X i   +   C j I A jj 1 j = 1 j i m Y ji external   consume
We calculated the net land use-based embodied carbon emissions transfer of province C E N i as the difference between the amount of land use-based carbon emissions transferred from province i to all other regions and the amount of land use-based carbon emission transferred from all other regions to province i as follows:
CEN i = CE producer i   CE consumer i
where C E N i > 0 indicates that the land use-based embodied carbon emissions imported in province i are greater than the land use-based embodied carbon emissions exported to other provinces. Thus, this province takes on more carbon emissions of other provinces through trade. C E N i < 0 indicates that embodied carbon emissions exported by province i are greater than those imported. Thus, this province transfers more carbon emissions to other provinces that should be undertaken by itself.

4. Results

4.1. Land Use-Based Embodied Carbon Emissions from the Production and Consumption Ends

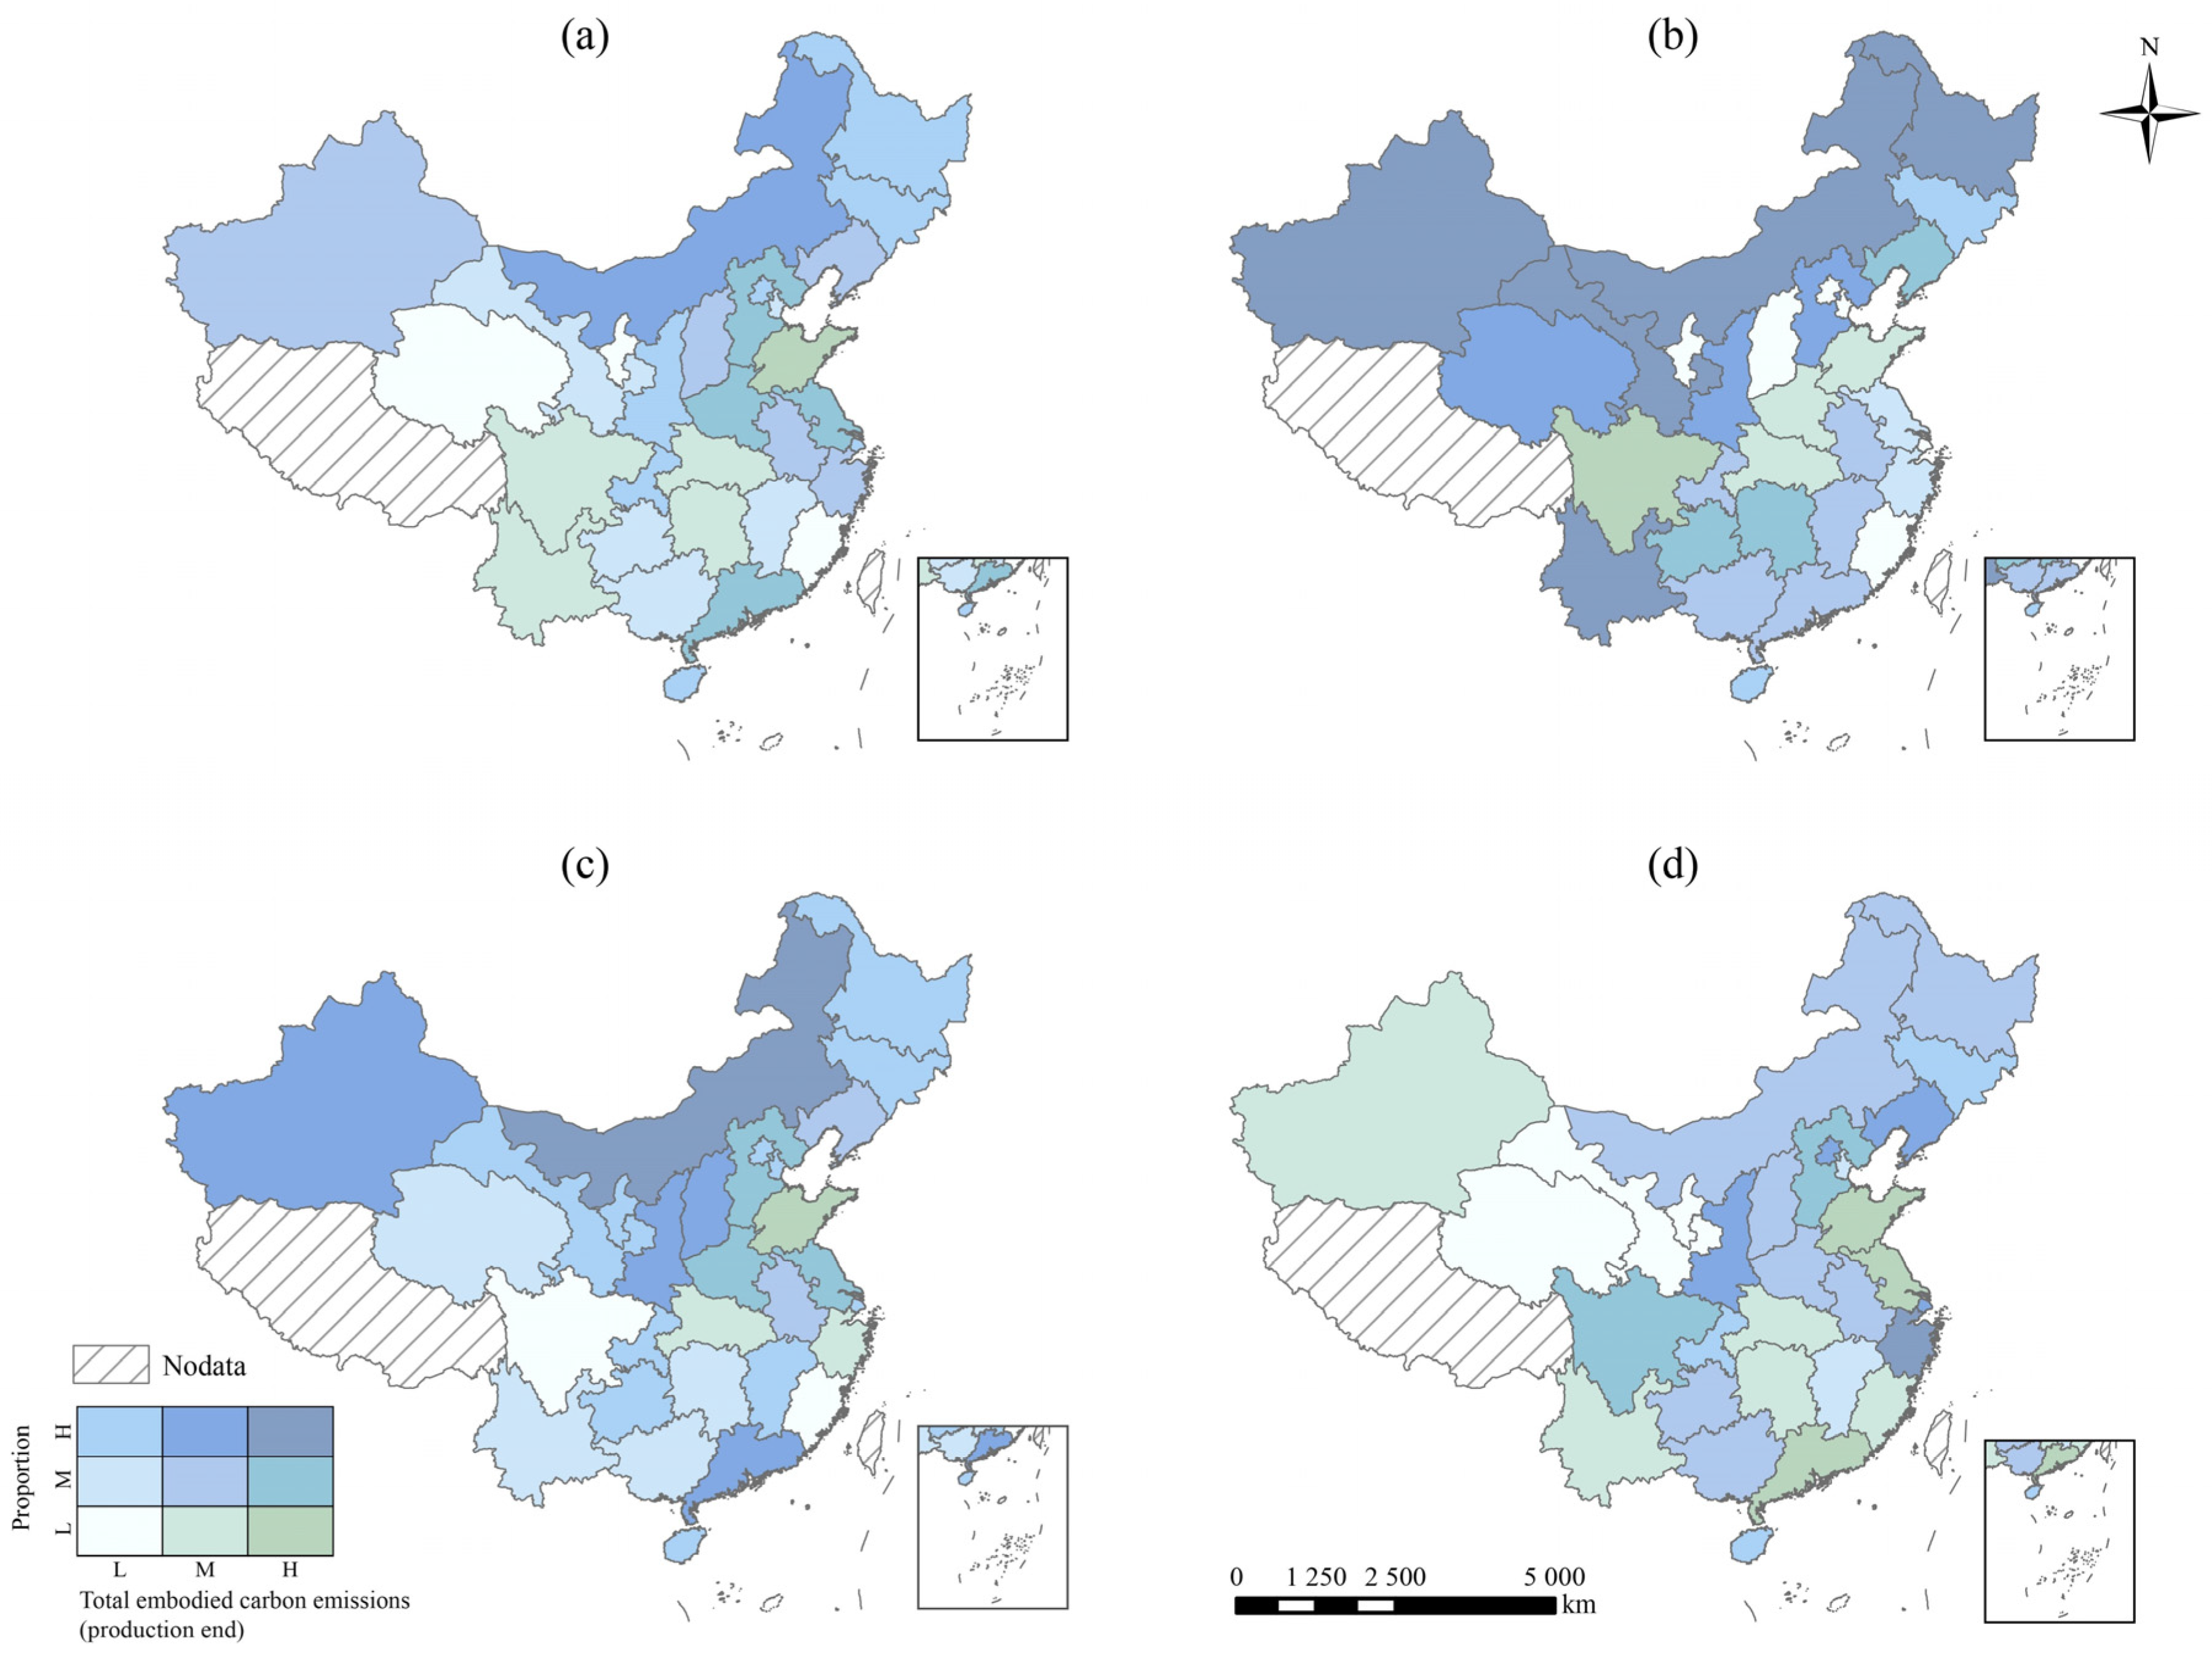
4.1.1. Land Use-Based Embodied Carbon Emissions from the Production End

We showed the combined patterns of total land use-based embodied carbon emissions from the production end and the percentage of the part for other provinces’ needs (Figure 3). Inner Mongolia showed higher carbon emissions and higher percentages of carbon emissions for other provinces’ needs (H-H in Figure 3a). Provinces with higher carbon emissions but lower proportions of carbon emissions for other provinces’ needs were Shandong, Hubei, Hunan, Sichuan, and Yunnan (M-L, H-L in Figure 3a). In terms of agricultural land, provinces in the north and southwest, including Inner Mongolia, Heilongjiang, Gansu, and Yunnan, indicated higher embodied carbon emissions and higher percentage for other regions’ needs (H-H in Figure 3b). Conversely, provinces with lower carbon emissions and lower percentages for other provinces’ needs are found in Beijing, Tianjin, Shanghai, and Fujian (L-L in Figure 3b). For industrial land, provinces with higher emissions and higher proportions for other regions’ needs are distributed in Inner Mongolia, Xinjiang, Shaanxi, Shanxi, and Guangdong (H-H in Figure 3c). In contrast, Shandong, Hubei, and Zhejiang provinces showed higher emissions but lower proportions for other regions’ needs (M-H and H-H in Figure 3c). For construction land, the higher emissions and proportions are mainly located in Zhejiang province (H-H in Figure 3d) due to its developed private economy and retail industry. The higher emissions and lower proportions are found in Shandong, Jiangsu, and Guangdong provinces. The results suggest that the provinces such as Inner Mongolia, Heilongjiang, and Xinjiang could undertake more carbon emissions from the land use of other regions when it has abundant energy resources or favorable conditions for agricultural development.

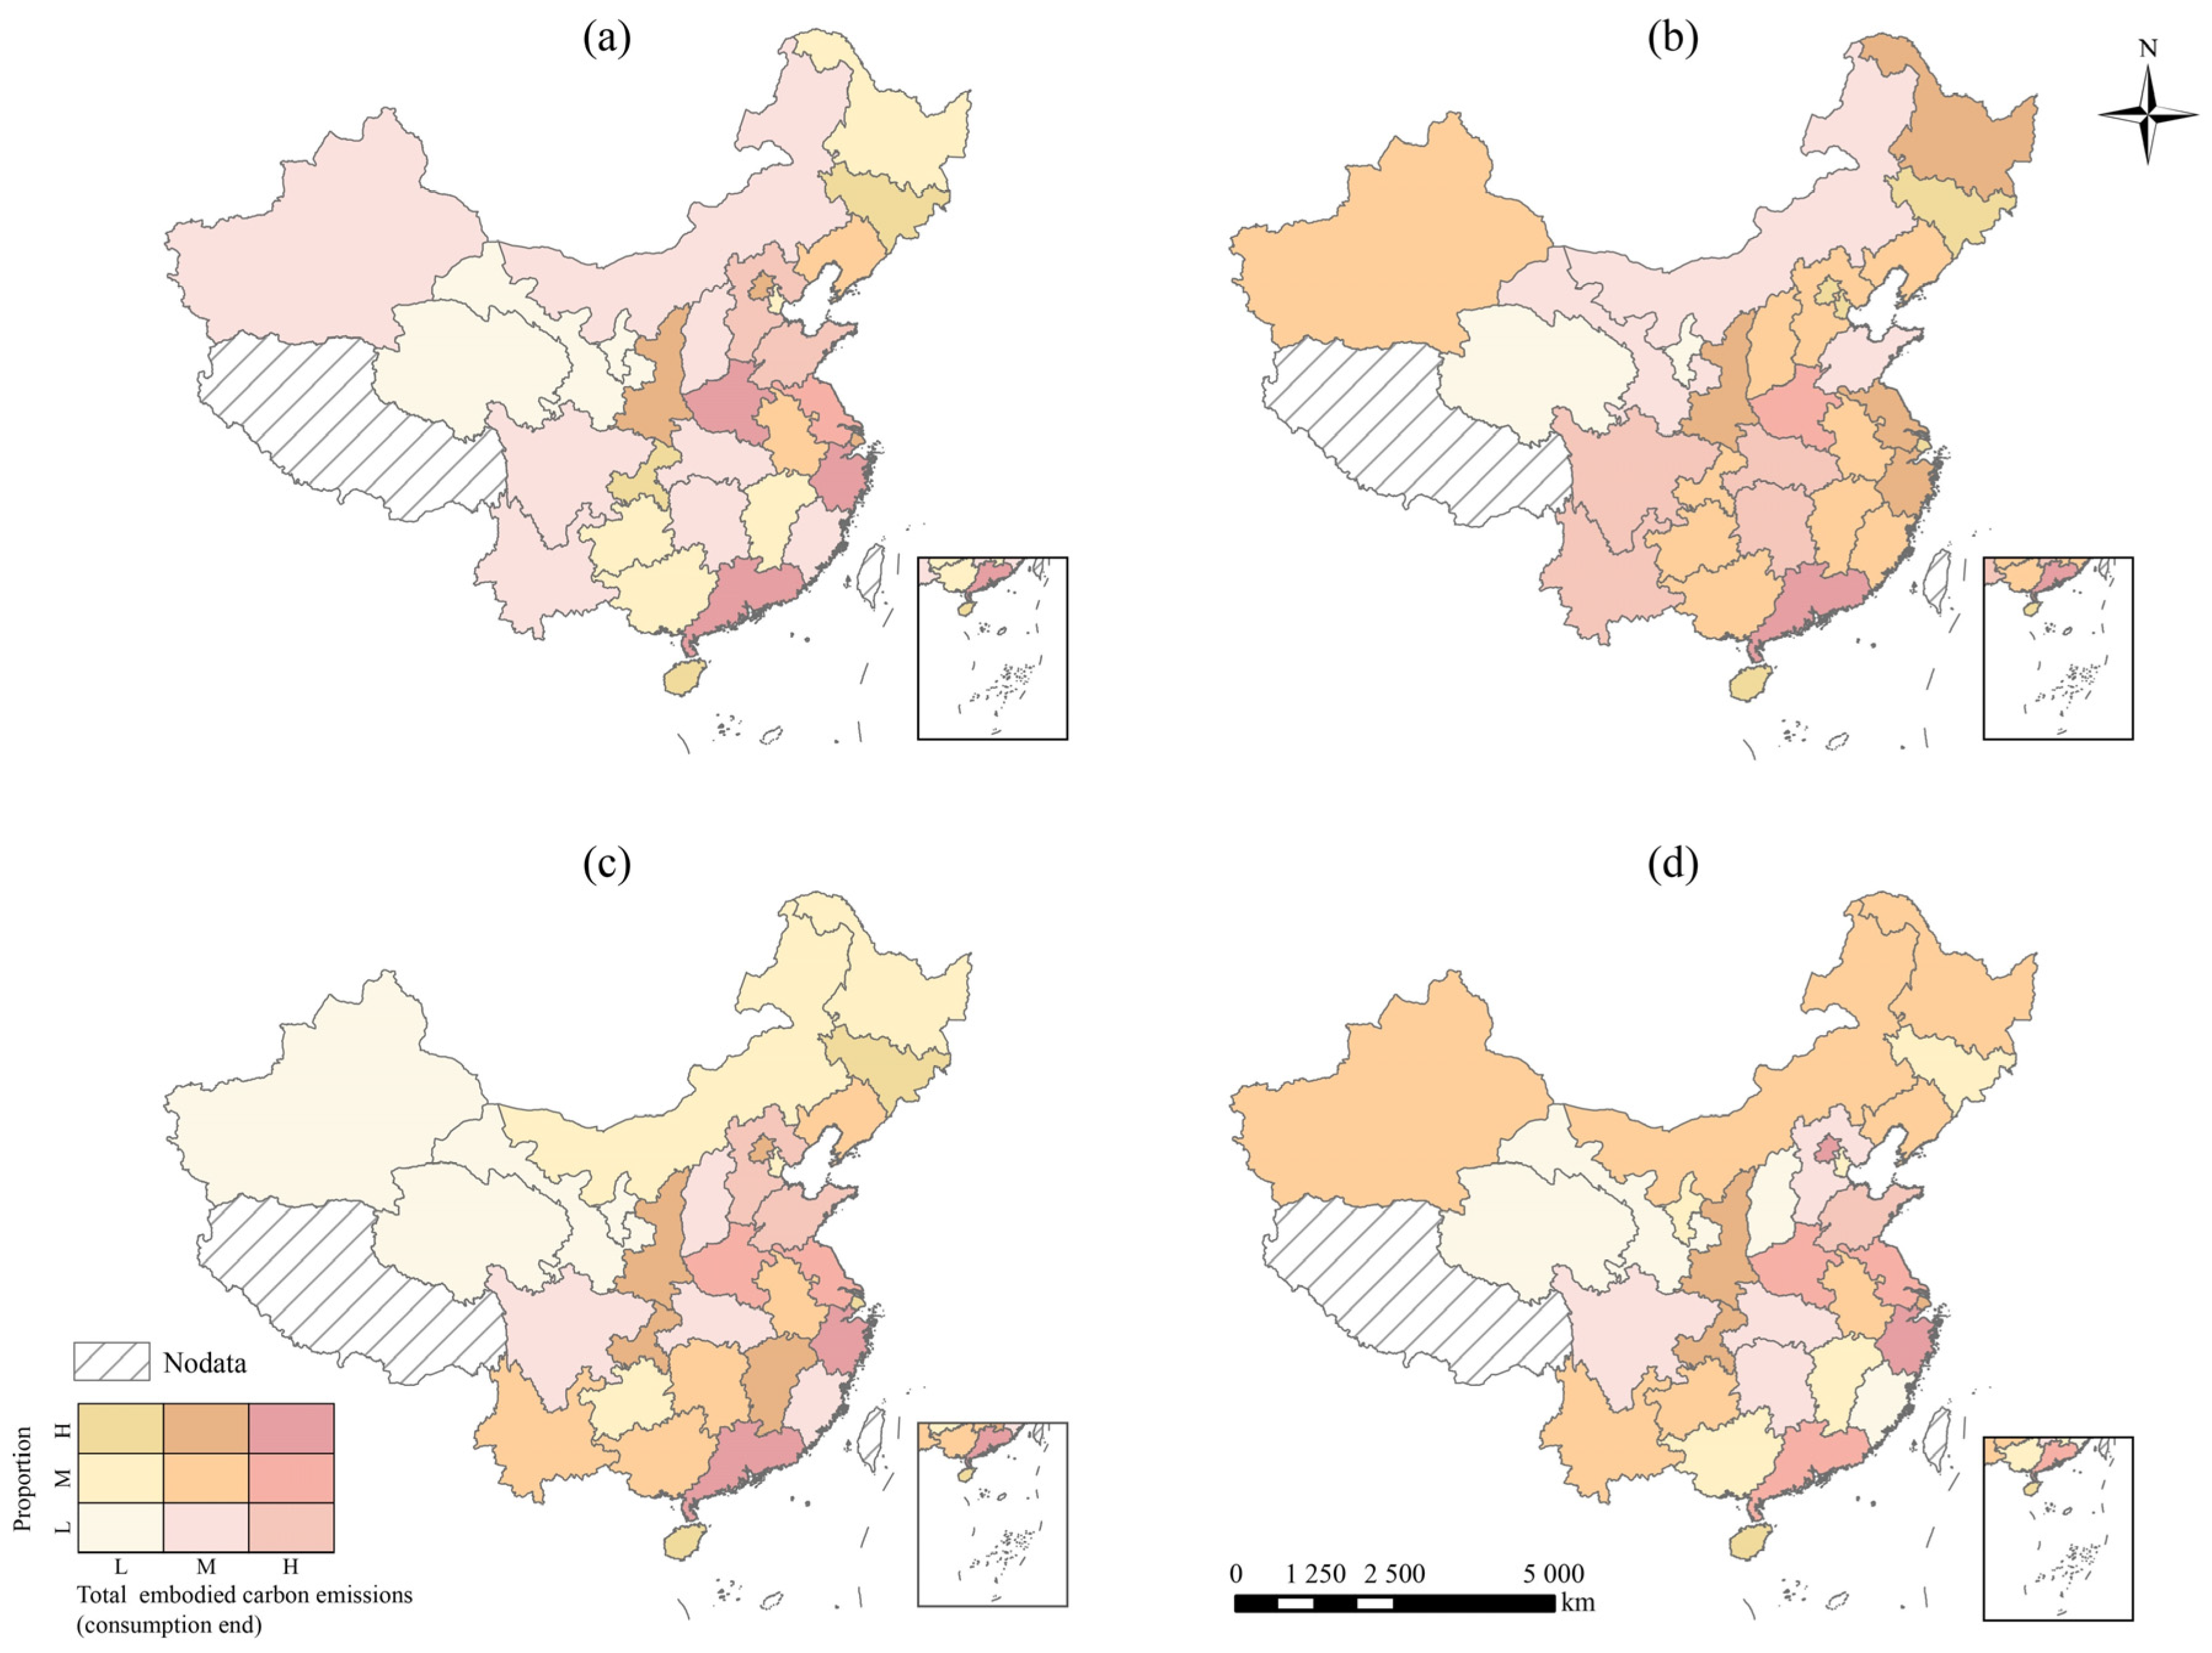
4.1.2. Land Use-Based Embodied Carbon Emissions from the Consumption End

We showed the combined patterns of total land use-based embodied carbon emissions from the consumption end of a province and the proportion of carbon emissions due to the consumption of products from other provinces (Figure 4). Zhejiang, Guangdong, and Henan Provinces show high emissions at the consumption end and a higher proportion of carbon emissions from the consumption of goods of other regions (H-H in Figure 4a). Provinces showing high emissions and low proportions include Shandong and Hebei (H-L in Figure 4a). For agricultural land, the province showing higher values for both emissions and proportions is Guangdong (H-H in Figure 4b). Provinces with higher emissions but low proportion are Sichuan, Yunnan, Hubei, and Hunan (H-L in Figure 4b). Regarding industrial land and construction land, Zhejiang province shows both high emissions and a high proportion of carbon emissions from the consumption of goods from other regions, while Shandong province has high emissions but a low proportion (Figure 4c,d). Our results highlight that Zhejiang and Guangdong provinces have high carbon emissions locally and tend to transfer carbon emissions to distant provinces. The reason is that they have a large economic scale and a developed manufacturing industry, but relatively scarce natural resources. This is comparable to Shandong and Hebei with large economies and rich natural resources. Here, carbon emissions are less exported to other provinces, although their carbon emission levels are high.

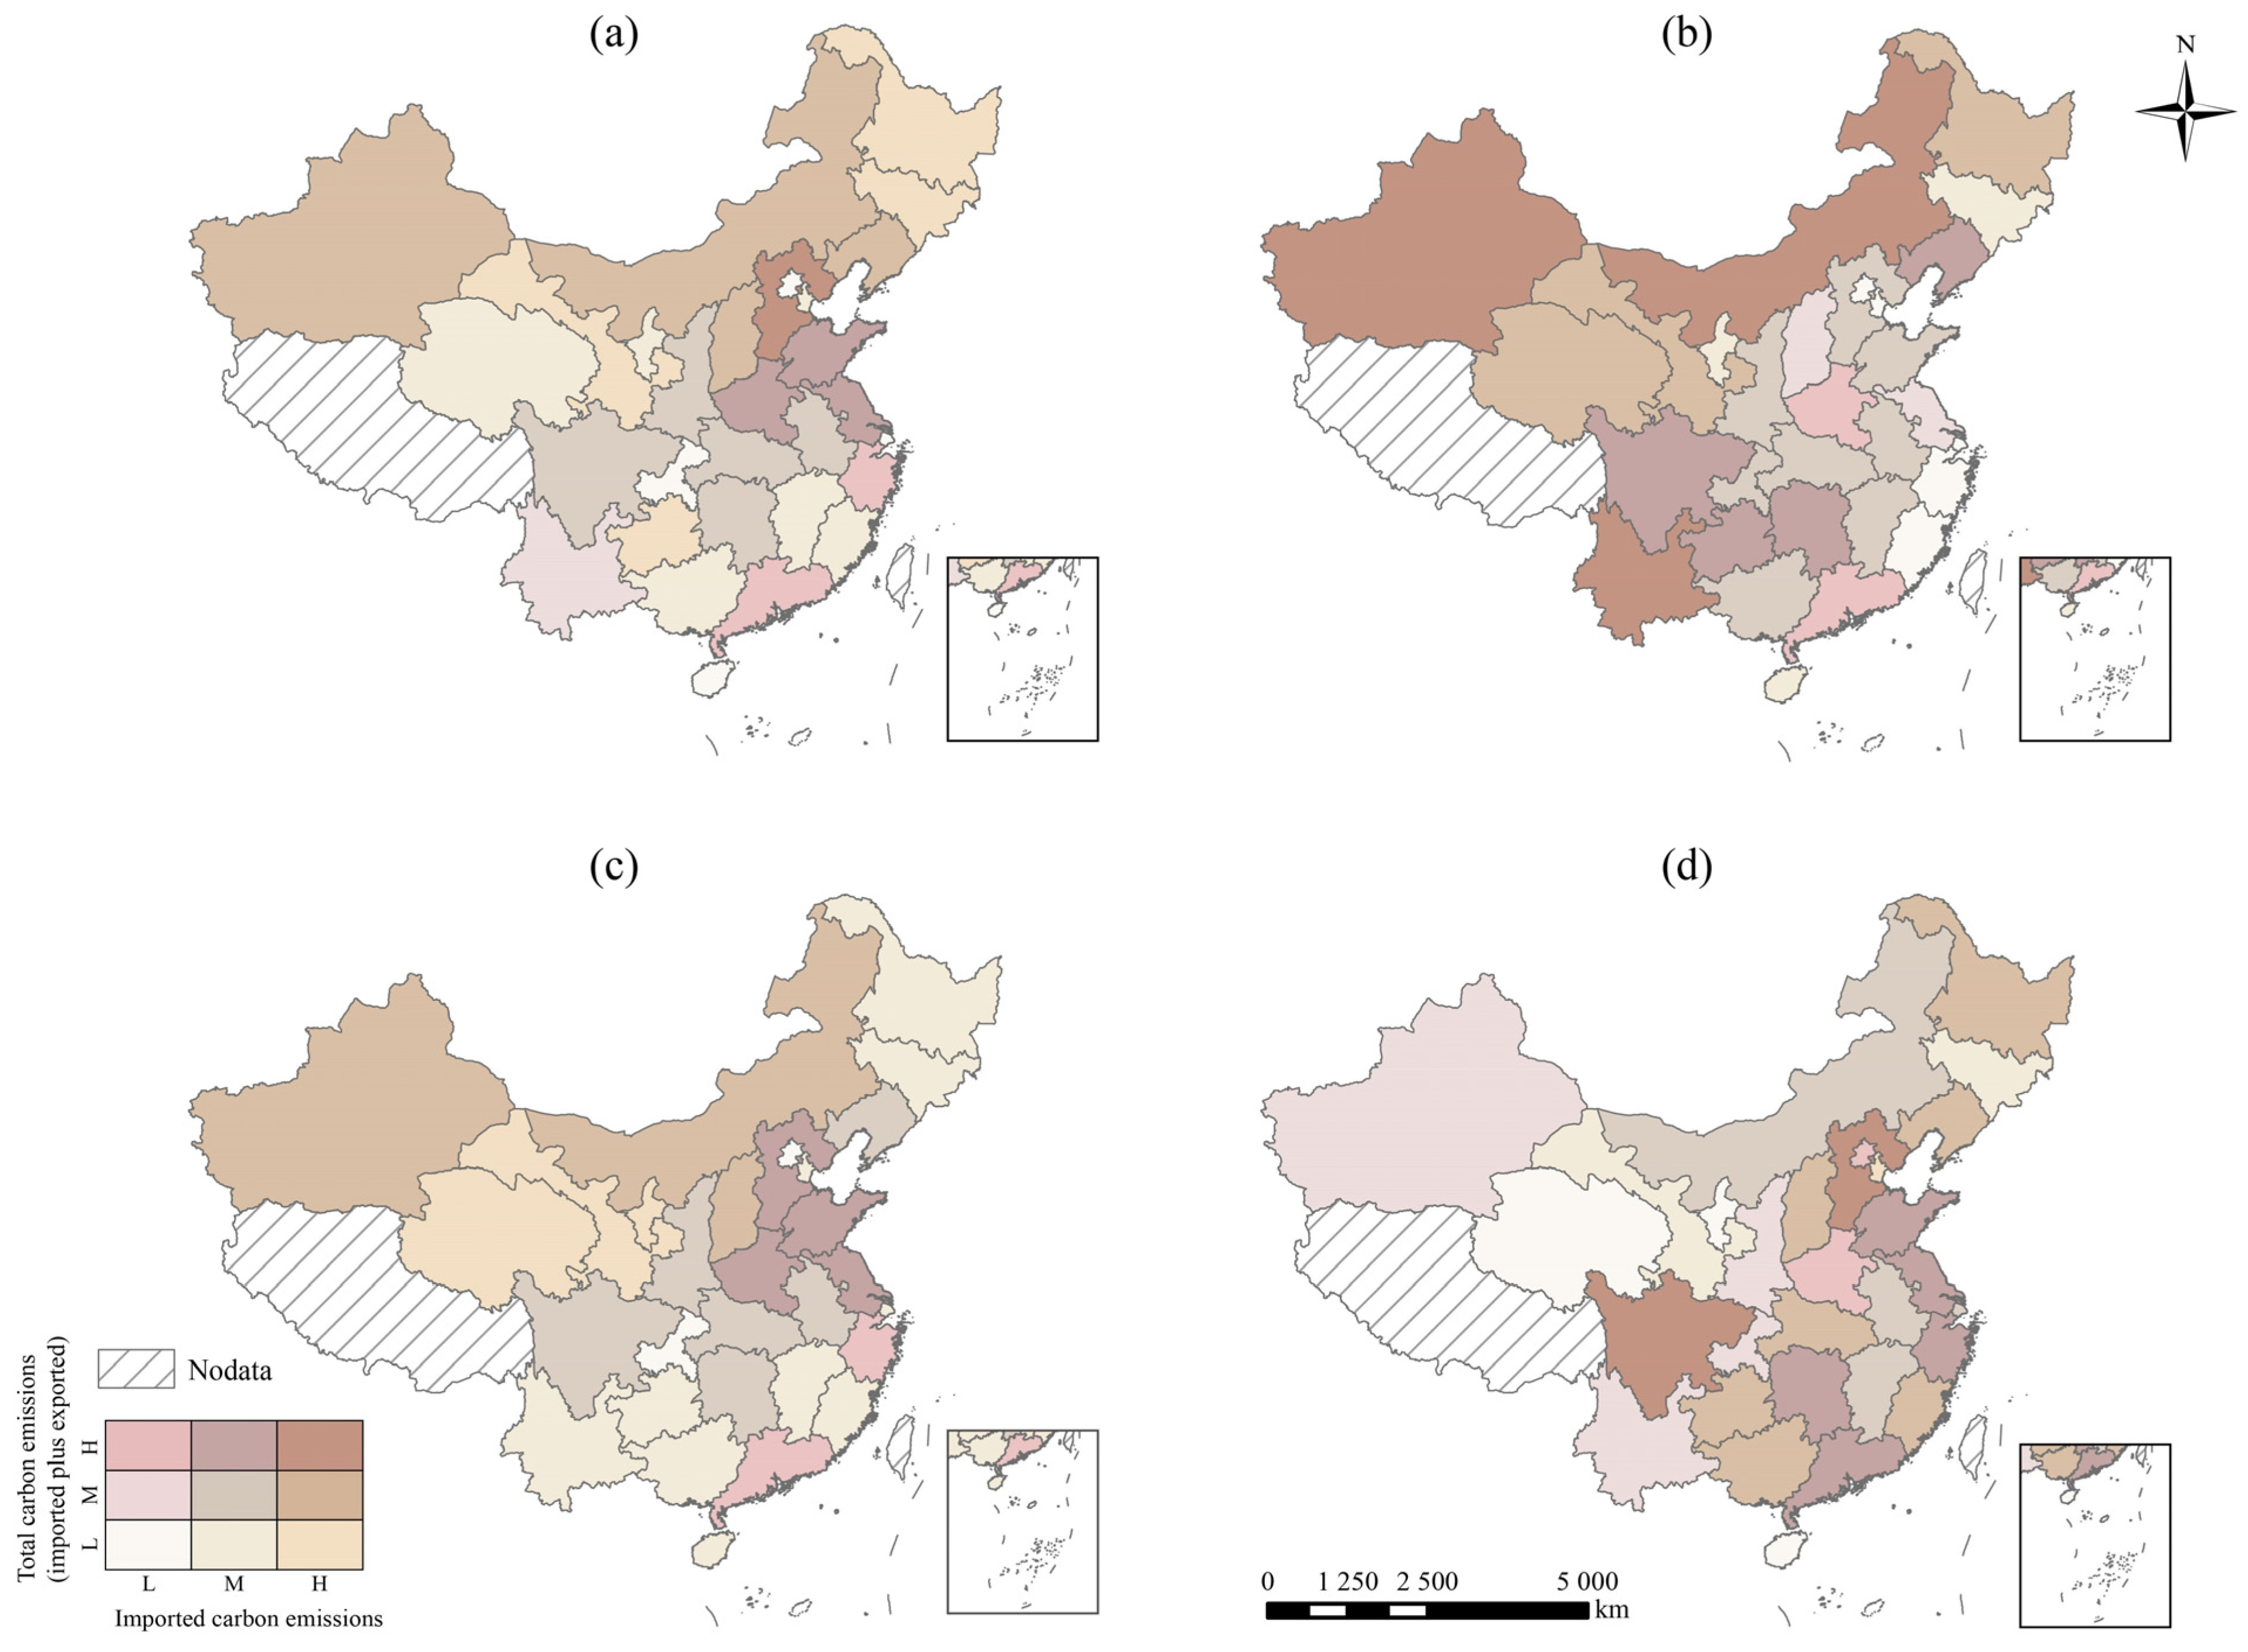
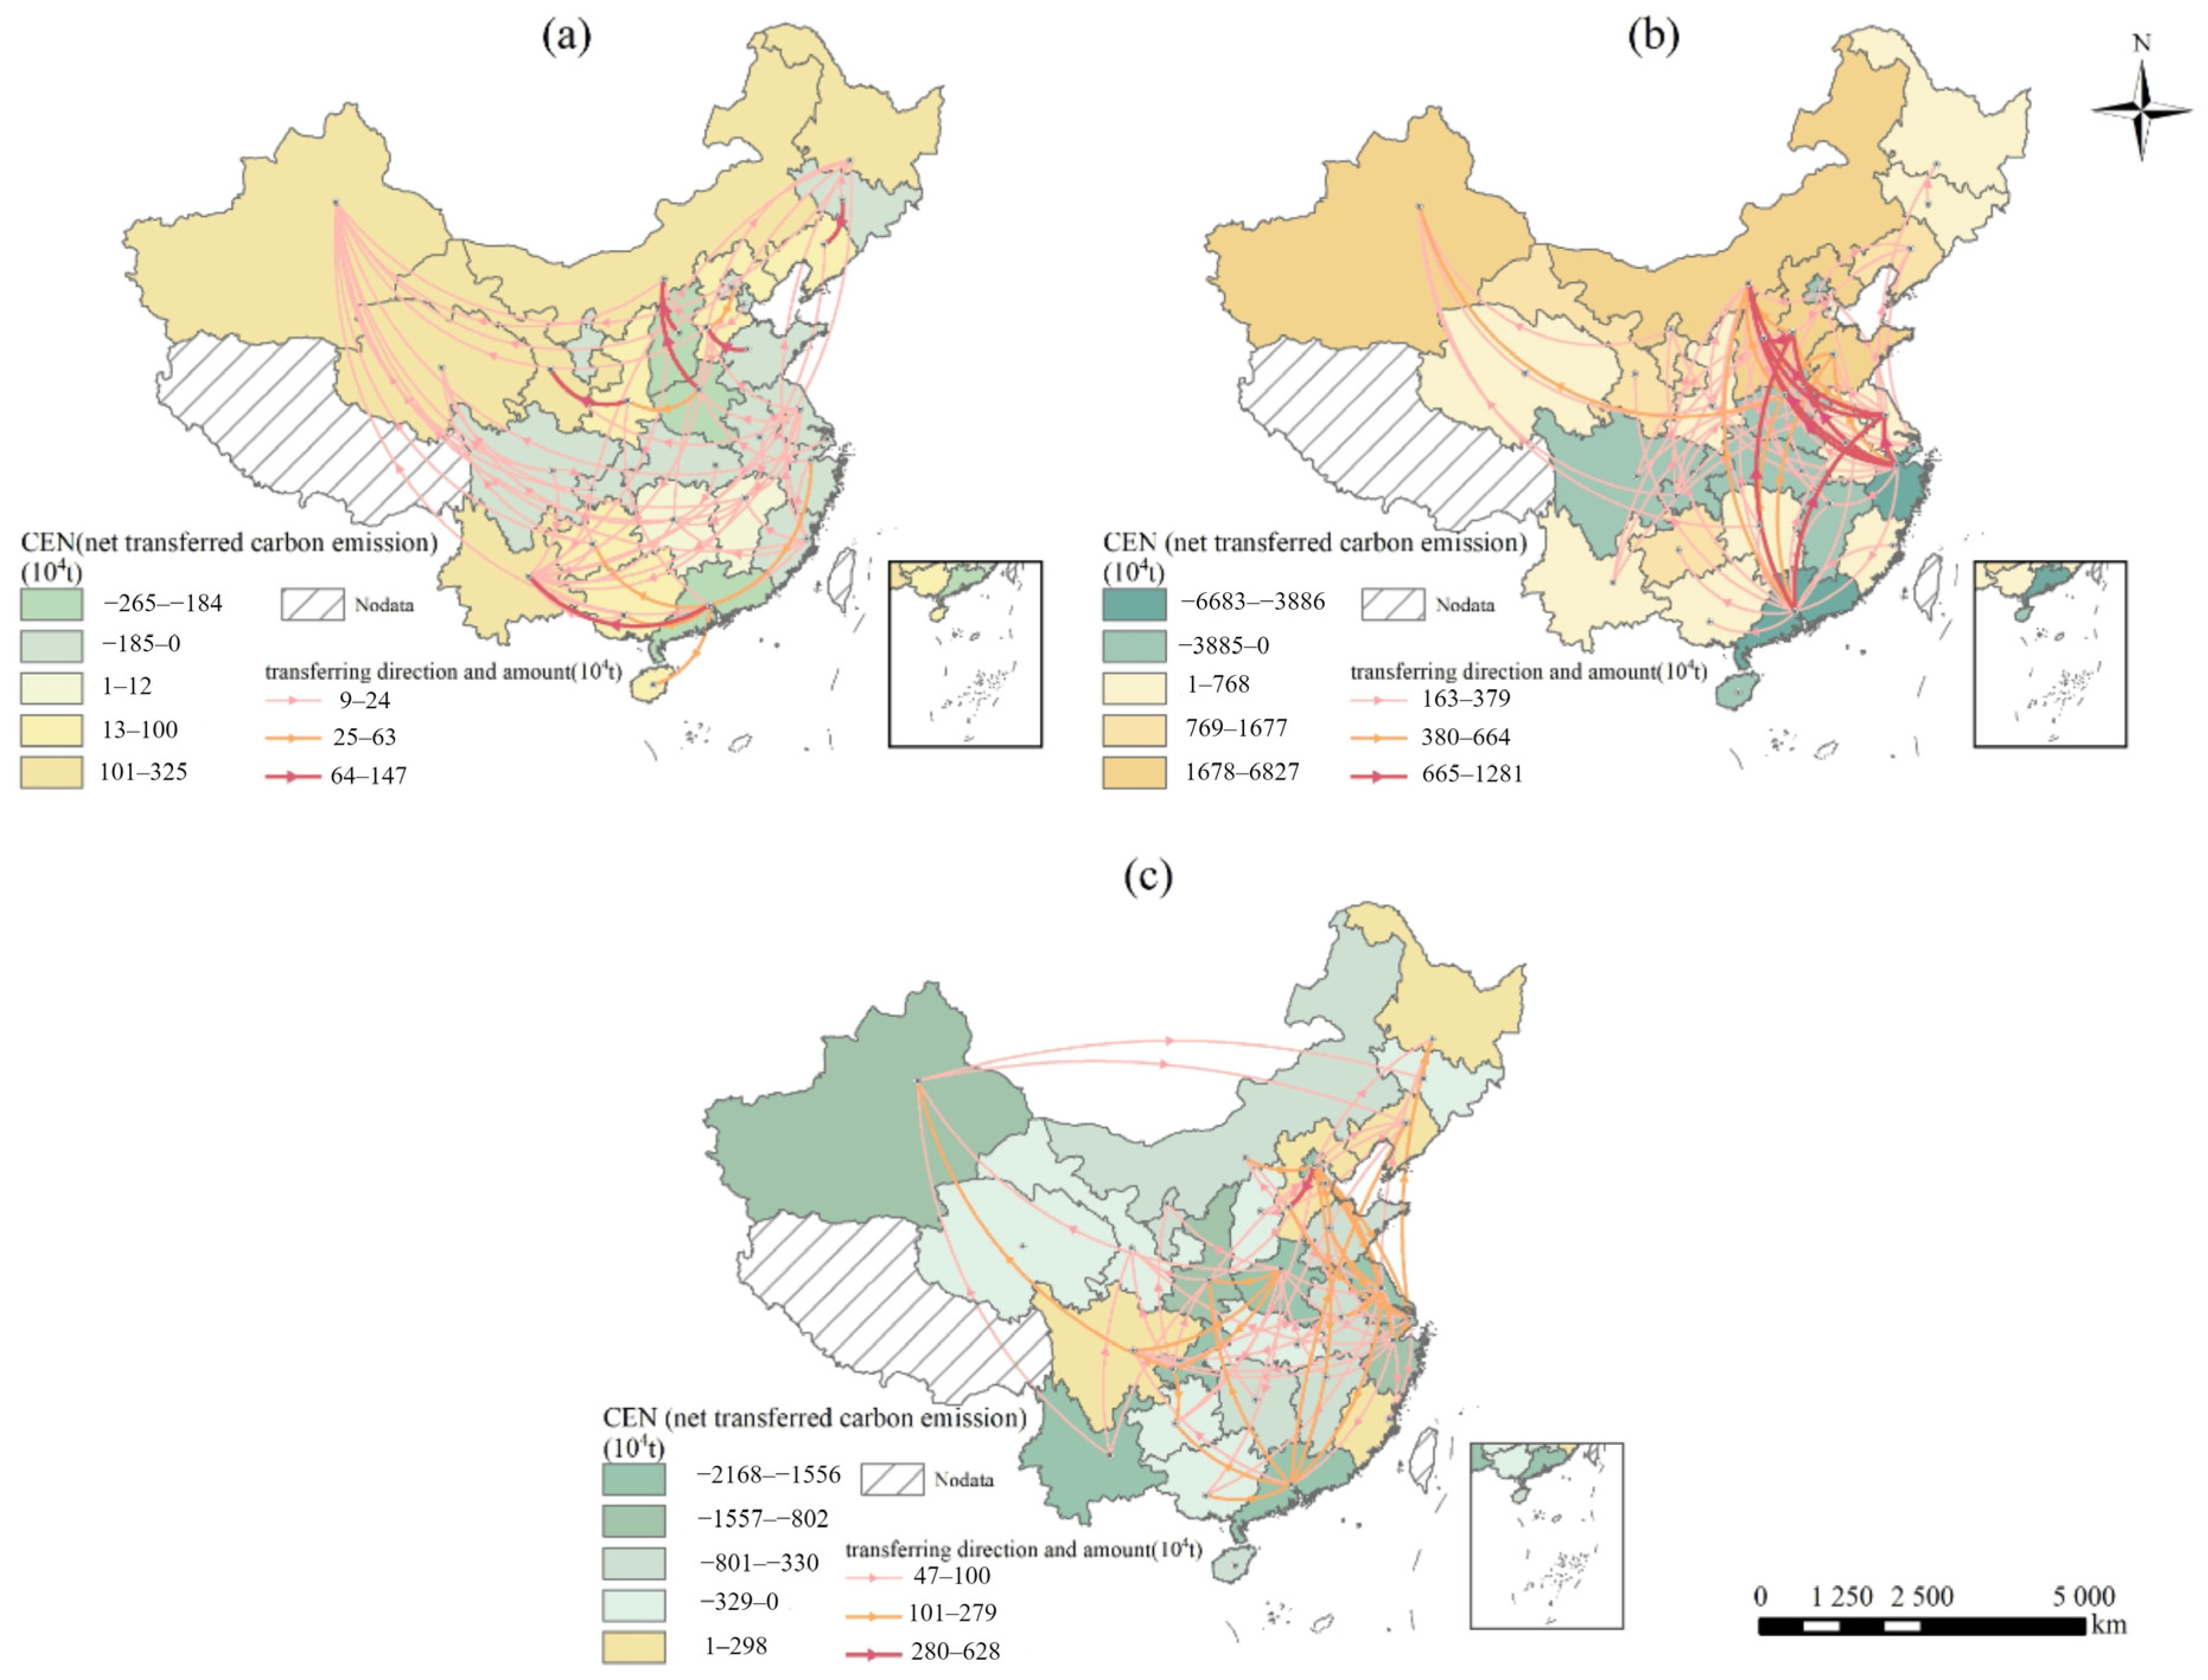
4.2. Net Transfer of Land Use-Based Embodied Carbon Emissions of Provinces

We show the spatial pattern of total land use-based embodied carbon emissions (imported plus exported carbon emissions) and the proportion of imported carbon emissions (imported/(exported + imported)) (Figure 5). Provinces including Guangdong, Zhejiang, Jiangsu, Henan, and Hebei have a large volume of carbon flow as indicated by the sum of import and export (Figure 5a). Generally, the provinces in the north of China show a lighter proportion of the imported embodied carbon emissions compared to the exported, while the opposite is observed in the provinces of the south. The reason is that northern provinces are mostly resource-rich areas, with a higher proportion of primary products being exported to other provinces. For agricultural land, provinces in coastal regions and central China, including Beijing, Jiangsu, Zhejiang, Fujian, and Shanxi have lower proportions (L-L, L-M, L-H in Figure 5b), suggesting that these regions are dominated by the transfer of carbon emissions to the agricultural land of other provinces. In contrast, most provinces in the northwest and southwest show a high proportion of imported carbon emissions (Figure 5b). These provinces are major producers of agricultural products. Due to their sparse population, supply exceeds demand, and the surplus agricultural products can meet the needs of other provinces, making them the recipients of carbon emissions. For industrial land, the provinces in the north, such as Xinjiang and Inner Mongolia, are characterized by higher proportions of imported embodied carbon emissions. The reason is that these provinces have rich natural resources but a relatively singular industrial structure, and the export of energy resources dominates the trade. Zhejiang and Guangdong are dominated by the export of carbon emissions from industrial land to other provinces (L-H type in Figure 5c), which is consistent with their embodied carbon emissions at the consumption end. For construction land, the provinces with the type H-H are Sichun and Hebei, suggesting that they are dominated by imported carbon emissions from construction land (Figure 5d). Sichuan has a developed high-end manufacturing industry and is a key electronic information industry hub in China. Its products are exported nationwide and internationally and are closely linked to the embodied carbon of urban land use. In contrast, Hebei, as a major heavy industry province, produces and exports a large number of energy-intensive products, such as steel and coal, so that it undertakes large proportion of the carbon emissions of other provinces.

4.3. Network of Land Use-Based Embodied Carbon Emission Transfer

We show the network of embodied carbon emission flows among provinces by land-use type (Figure 6).
For agricultural land, the lowest net embodied carbon emissions transfer is mainly distributed in coastal regions (Figure 6a), including Guangdong, Zhejiang, Beijing, Fujian, and Shanghai. These regions have limited agricultural land but have a large population, so their consumption of produce depends much on exports from other provinces, leading to the transfer of land use-based embodied carbon emissions to other provinces. In contrast, provinces in the northeastern and central-western regions, such as Heilongjiang, Liaoning, Inner Mongolia, Xinjiang, and Yunnan, show the highest net embodied carbon emissions transfer, suggesting that these regions undertake more embodied carbon emissions from their agricultural land by not only meeting demands of produce for themselves but also fulfilling the needs of other provinces. Regarding transfer direction, the land use-based embodied carbon emissions are generally transferred from the southeastern coastal regions to the west and southwest of China. Additionally, the major transfer of a province often occurs with its neighboring provinces.
For industrial land, regions with substantial net carbon exports are primarily located in the south (Figure 6b), including Guangdong, Zhejiang, and Sichuan, and along the Yangtze River including Sichuan, Chongqing, Hubei, and Jiangxi. Oppositely, Inner Mongolia, Shanxi, Hebei, and Shandong show massive net land use based-embodied carbon emissions import, suggesting that the industrial land of these provinces undertake more carbon emissions from other provinces. Spatially, the land use-based embodied carbon emissions are generally transferred from the southeast and southwestern regions to the northern and western regions. The pattern suggests that the north of China bears more pressure of land use-based embodied carbon emissions of the south due to abundant energy resources.
For construction land, the regions with massive net embodied carbon emission imports are Hebei, Sichuan, Fujian, Heilongjiang, and Liaoning, while the net carbon emissions export regions are pervasive (Figure 6c) with Beijing, Guangdong, Henan, and Yunnan exporting the most. Spatially, embodied carbon emissions from construction land are transferred in general from the north to the south.
We show the flows of land use-based embodied carbon emissions between pairs of eight major economic regions (Figure 7). The coastal regions are the primary sources of carbon emissions from agricultural land, exporting massive emissions to other regions through the consumption of produce. The northwestern region receives more carbon emissions from other regions, accounting for 27.81% of the total carbon imports. The eastern and southern coastal areas, as well as the Beijing–Tianjin regions are the main contributors to carbon emissions of industrial land, contributing 20.22%, 17.51%, and 9.47% of the total emissions, respectively. In contrast, the northwestern and central area as well as the northern coastal region serve as the major recipients of carbon emissions of industrial land. Regarding carbon emissions from construction land, the Beijing–Tianjin region, the eastern region, and the southern coastal region are the primary carbon emission sources, while the northwestern, northeastern, and the northern coastal regions are the primary recipients. Overall, the Beijing–Tianjin region and the eastern and southern coastal regions are major sources of embodied carbon emissions that are exported to a wide range of provinces.

5. Discussion

Our research applies the MRIO model to reveal the transfer patterns of embodied carbon emissions based on land-use types. Interprovincial trade has led massive and unbalanced flows of embodied carbon among provinces, potentially resulting in the unfairness of carbon emissions.
The land systems of different provinces showed evident telecoupling features with the nexus of embodied carbon emissions. Some developed regions, such as Zhejiang, Guangdong, and Beijing, required more land products from other provinces to fulfill their needs (receiving systems), while exporting massive land use-based embodied carbon emissions to other provinces. It should be noted that Zhejiang and Guangdong show large flows of embodied carbon emissions (imported and exported) and lower portions of imported emissions from other provinces. However, within international trade, these provinces are key exporters of China that export a large amount of goods and import embodied carbon emissions from other countries. On the other hand, regions such as Inner Mongolia and Hebei provinces served as important sources of land products of other provinces (sending systems), while undertaking carbon emissions from them. Although the trade in goods could bring benefits for both receiving and sending systems, it is likely to cause carbon emission inequality and environmental consequences, such as land degradation and environmental pollution. Hence, our study reveals the carbon inequality hidden in China’s interprovincial trade, which provides valuable information for the formulation of carbon reduction and trade policies to attain high-quality development in China.
The use of the MRIO model effectively quantifies the transfers of embodied carbon emissions by land-use types. Industrial land is the largest source of carbon emissions in China, accounting for over 60% of the total in 2017 [41]. The transfer of carbon emissions from industrial land is massive compared to other land-use types. Thus, it is of significance to undertake efforts for carbon reduction in industrial lands. Construction land is the second largest source of carbon emissions in China, and rapid urban expansion increases, especially in the three major urban agglomerations [42]. Our research shows that areas with rapid urbanization tend to export more carbon emissions to surrounding regions. Construction land is also crucial for achieving two carbon goals. Agricultural land is both a carbon source and a sink [34,43]. Agricultural quantity, quality, intensity, and mechanization levels directly influence carbon emissions from the agricultural land of a province. The differences in the production needs of provinces promote the flows of embodied carbon emissions of agricultural land among provinces. Specifically, the primary grain production regions of China undertakes carbon emissions from other regions. Our findings of the carbon emissions of agricultural lands of each province and the flows of carbon facilitate the formulation of targeted policies for carbon reduction in agricultural land.
The pollution haven hypothesis (PHH) works in inter-regional trade within China [44]. With the provinces of net embodied carbon import and export, our results show that the provinces with net land use based-embodied carbon exports are primarily in the developed regions located in the east of China and emphasize low-carbon development to achieve the goal of an earlier carbon peak. While some provinces mitigate carbon emissions through measures such as industrial transformation and the adoption of renewable energy, others likely transfer the industries of high carbon emissions to other regions. Our findings provide a warning signal of the latter that might be unfavorable for carbon emission reductions in developing regions to achieve the dual-carbon goal. The role of developing regions is similar to that of China in international trade. China became the center of world exports of embodied carbon emissions, undertaking more than one-fifth of carbon transfers embodied in global trade, while the United States became the center of imports. China’s export structure is mainly concentrated in energy-intensive and carbon-intensive manufacturing industries [45]. For Chinese products exported to the US, the carbon emissions embodied in one unit of economic value amount to 0.92 kg/USD. However, for US products exported to China, the carbon emissions embodied in one unit of economic value amount to 0.53 kg/USD [33]. The US benefits from a trade surplus of environmental costs by importing energy-intensive and pollution-intensive products from China, which increases China’s environmental pollution and abatement costs.
Our research provides valuable information for China’s high-quality development strategy, which aims to establish a robust economic system on a green, low-carbon, and circular basis. For provinces undertaking more carbon emissions of agricultural land, i.e., major grain production zones, they need to promote green and efficient agricultural machinery, implement protective cultivation practices, and enhance the carbon sink function of agricultural land. Simultaneously, the provinces exporting more carbon emissions of agricultural land are encouraged to increase investments in the receiving provinces to develop carbon reduction and sequestration technologies in agriculture. For provinces that undertake massive carbon emissions of industrial land from other regions, especially those having high emissions with intensive resources consumption, extra financial and technical support should be provided by the carbon export provinces beyond the payment for industrial products alone. Moreover, for ecologically vulnerable provinces such as Inner Mongolia and Xinjiang, the import of carbon emissions should be restricted to avoid exceeding land carrying capacity. The provinces that import more carbon emissions of construction land from other regions should prioritize scientific urban planning for construction land to avoid unreasonable inputs for carbon emissions.

6. Conclusions

Using the telecoupling framework in conjunction with a multi-regional input–output model, we quantify the spatial patterns of land use-based embodied carbon emissions among 30 provinces of China. The key findings are as follows:
(1) The spatial patterns of carbon emissions embodied in trade are different among land use types.
(2) Our results of embodied carbon emissions at the production end provide valuable information for the emissions of other provinces undertaken by the targeted province. The agricultural and industrial lands in northern and northwestern China, such as Inner Mongolia, Xinjiang, and Heilongjiang, undertake larger proportions of carbon emissions due to their rich natural resources and favorable agricultural conditions. Zhejiang Province, as an important center of manufacturing industry and retail trade, can undertake the carbon emissions of the construction land of other provinces by exporting consumer goods.
(3) The carbon emission patterns for the consumption end show the dependence degree of different land use types. The provinces or municipalities with large economies but scarce resources such as Zhejiang, Guangdong, and Beijing show heavy dependence on other provinces and export large proportions of carbon emissions for all land use types.
(4) Across China, developed regions generally export more carbon emissions from land use than they undertake from other developing regions. The carbon transfer in agricultural and industrial land is prominent between the eastern and western regions. The carbon emissions of industrial land are generally transferred from southern regions to northern and western areas.
In summary, our research from the perspective of land use provides new insights into the patterns of embodied carbon flows and the telecoupling of land systems, and this information is more useful for proposing targeted policies to achieve carbon mitigation and land sustainability.

Author Contributions

Conceptualization, Q.W., J.M. and L.Z.; methodology, Q.W.; validation, Q.W. and L.Z.; formal analysis, Q.W. and C.Y.; investigation, Q.W.; writing—original draft preparation, Q.W.; writing—review and editing, J.M., C.Y. and L.Z.; supervision, J.M. and L.Z.; project administration, J.M.; funding acquisition, J.M. All authors have read and agreed to the published version of the manuscript.

Funding

This research was supported by the National Natural Science Foundation of China (NSFC, Grant No. 42230506).

Data Availability Statement

The data presented in this study are available on request from the corresponding authors.

Conflicts of Interest

The authors declare no conflicts of interest.

References

  1. Karl, T.R.; Trenberth, K.E. Modern global climate change. Science 2003, 302, 1719–1723. [Google Scholar]
  2. Houghton, R.A. Interannual variability in the global carbon cycle. J. Geophys. Res. Atmos. 2000, 105, 20121–20130. [Google Scholar]
  3. Friedlingstein, P.; O’Sullivan, M.; Jones, M.W.; Andrew, R.M.; Gregor, L.; Hauck, J.; Le Quéré, C.; Luijkx, I.T.; Olsen, A.; Peters, G.P.; et al. Global Carbon Budget 2022. Earth Syst. Sci. Data 2022, 14, 4811–4900. [Google Scholar]
  4. Bruckner, B.; Hubacek, K.; Shan, Y.; Zhong, H.; Feng, K. Impacts of Poverty Alleviation on National and Global Carbon Emissions. Nat. Sustain. 2022, 5, 311–320. [Google Scholar] [CrossRef]
  5. Wang, Y.; Xiong, S.; Ma, X. Carbon Inequality in Global Trade: Evidence from the Mismatch between Embodied Carbon Emissions and Value Added. Ecol. Econ. 2022, 195, 107398. [Google Scholar] [CrossRef]
  6. Hong, C.; Zhao, H.; Qin, Y.; Burney, J.A.; Pongratz, J.; Hartung, K.; Liu, Y.; Moore, F.C.; Jackson, R.B.; Zhang, Q.; et al. Land-Use Emissions Embodied in International Trade. Science 2022, 376, 597–603. [Google Scholar] [CrossRef] [PubMed]
  7. Zhao, N.; Xu, L.; Malik, A.; Song, X.; Wang, Y. Inter-provincial trade driving energy consumption in China. Resour. Conserv. Recycl. 2018, 134, 329–335. [Google Scholar]
  8. Zhu, M.; Zhao, Z.; Meng, Y.; Chen, J.; Yu, Z.; Meng, C. Unfolding the Evolution of Carbon Inequality Embodied in Inter-Provincial Trade of China: Network Perspective Analysis. Environ. Impact Assess. Rev. 2022, 97, 106884. [Google Scholar]
  9. Henders, S.; Persson, U.M.; Kastner, T. Trading forests: Land-use change and carbon emissions embodied in production and exports of forest-risk commodities. Environ. Res. Lett. 2015, 10, 125012. [Google Scholar]
  10. Chuai, X.; Huang, X.; Qi, X.; Li, J.; Zuo, T.; Lu, Q.; Li, J.; Wu, C.; Zhao, R. A Preliminary Study of the Carbon Emissions Reduction Effects of Land Use Control. Sci. Rep. 2016, 6, 36901. [Google Scholar]
  11. Sato, M. Embodied Carbon in Trade: A Survey of the Empirical Literature. J. Econ. Surv. 2013, 28, 831–861. [Google Scholar]
  12. Zhang, B.; Bai, S.; Ning, Y.; Ding, T.; Zhang, Y. Emission Embodied in International Trade and Its Responsibility from the Perspective of Global Value Chain: Progress, Trends, and Challenges. Sustainability 2020, 12, 3097. [Google Scholar] [CrossRef]
  13. Peters, G.P. Carbon Footprints and Embodied Carbon at Multiple Scales. Curr. Opin. Environ. Sustain. 2010, 2, 245–250. [Google Scholar] [CrossRef]
  14. Qian, Y.; Zheng, H.; Meng, J.; Shan, Y.; Zhou, Y.; Guan, D. Large Inter-City Inequality in Consumption-Based CO2 Emissions for China’s Pearl River Basin Cities. Resour. Conserv. Recycl. 2022, 176, 105923. [Google Scholar] [CrossRef]
  15. Wang, H.; Fujita, T. A Review of Research on Embodied Carbon in International Trade. Sustainability 2023, 15, 7879. [Google Scholar] [CrossRef]
  16. Chuai, X.; Huang, X.; Wang, W.; Zhao, R.; Zhang, M.; Wu, C. Land use, total carbon emissions change and low carbon land management in Coastal Jiangsu, China. J. Clean. Prod. 2015, 103, 77–86. [Google Scholar]
  17. Zhou, Y.; Chen, M.; Tang, Z.; Mei, Z. Urbanization, Land Use Change, and Carbon Emissions: Quantitative Assessments for City-Level Carbon Emissions in Beijing-Tianjin-Hebei Region. Sustain. Cities Soc. 2021, 66, 102701. [Google Scholar] [CrossRef]
  18. Liu, J.; Hull, V.; Batistella, M.; DeFries, R.; Dietz, T.; Fu, F.; Hertel, T.W.; Izaurralde, R.C.; Lambin, E.F.; Li, S. Framing Sustainability in a Telecoupled World. Ecol. Soc. 2013, 18, 26. [Google Scholar] [CrossRef]
  19. Seto, K.C.; Reenberg, A.; Boone, C.G.; Fragkias, M.; Haase, D.; Langanke, T.; Marcotullio, P.; Munroe, D.K.; Olah, B.; Simon, D. Urban land teleconnections and sustainability. Proc. Natl. Acad. Sci. USA 2012, 109, 7687–7692. [Google Scholar]
  20. Sun, J.; Mooney, H.; Wu, W.; Tang, H.; Tong, Y.; Xu, Z.; Huang, B.; Cheng, Y.; Yang, X.; Wei, D. Importing Food Damages Domestic Environment: Evidence from Global Soybean Trade. Proc. Natl. Acad. Sci. USA 2018, 115, 5415–5419. [Google Scholar]
  21. Shi, K.; Chen, Y.; Yu, B.; Xu, T.; Chen, Z.; Liu, R.; Li, L.; Wu, J. Modeling Spatiotemporal CO2 (Carbon Dioxide) Emission Dynamics in China from DMSP-OLS Nighttime Stable Light Data Using Panel Data Analysis. Appl. Energy 2016, 168, 523–533. [Google Scholar] [CrossRef]
  22. Liu, X.; Klemeš, J.J.; Varbanov, P.S.; Čuček, L.; Qian, Y. Virtual carbon and water flows embodied in international trade: A review on consumption-based analysis. J. Clean. Prod. 2017, 146, 20–28. [Google Scholar]
  23. Arneth, A.; Sitch, S.; Pongratz, J.; Stocker, B.D.; Ciais, P.; Poulter, B.; Bayer, A.D.; Bondeau, A.; Calle, L.; Chini, L.P.; et al. Historical carbon dioxide emissions caused by land-use changes are possibly larger than assumed. Nat. Geosci. 2017, 10, 79–84. [Google Scholar]
  24. Liu, M.; Chen, Y.; Chen, K.; Chen, Y. Progress and Hotspots of Research on Land-Use Carbon Emissions: A Global Perspective. Sustainability 2023, 15, 7245. [Google Scholar] [CrossRef]
  25. Liu, C.; Hu, S.; Wu, S.; Song, J.; Li, H. County-level land use carbon emissions in China: Spatiotemporal patterns and impact factors. Sustain. Cities Soc. 2024, 105, 105304. [Google Scholar]
  26. Friis, C.; Nielsen, J.Ø. Land-use change in a telecoupled world: The relevance and applicability of the telecoupling framework in the case of banana plantation expansion in Laos. Ecol. Soc. 2017, 22, 30. [Google Scholar] [CrossRef]
  27. Wang, Y.; Hong, S.; Wang, J.; Lin, J.; Mu, H.; Wei, L.; Wang, Z.; Bryan, B.A. Complex Regional Telecoupling between People and Nature Revealed via Quantification of Trans-boundary Ecosystem Service Flows. People Nat. 2022, 4, 274–292. [Google Scholar]
  28. Fang, C.; Ren, Y. Analysis of Emergy-Based Metabolic Efficiency and Environmental Pressure on the Local Coupling and Telecoupling between Urbanization and the Eco-Environment in the Beijing-Tianjin-Hebei Urban Agglomeration. Sci. China Earth Sci. 2017, 60, 1083–1097. [Google Scholar] [CrossRef]
  29. Chuai, X.; Gao, R.; Huang, X.; Lu, Q.; Zhao, R. The Embodied Flow of Built-up Land in China’s Interregional Trade and Its Implications for Regional Carbon Balance. Ecol. Econ. 2021, 184, 106993. [Google Scholar] [CrossRef]
  30. Wang, P.; Li, H.; Huang, Z. The Inter-Provincial Trade Inequality in China: An Assessment of the Impact of Changes in Built-up Land and Carbon Storage. Ecol. Econ. 2023, 206, 107749. [Google Scholar] [CrossRef]
  31. Gao, R.; Chuai, X.; Ge, J.; Wen, J.; Zhao, R.; Zuo, T. An Integrated Tele-Coupling Analysis for Requisition–Compensation Balance and Its Influence on Carbon Storage in China. Land Use Policy 2022, 116, 106057. [Google Scholar] [CrossRef]
  32. Xia, X.; Ren, P.; Wang, X.; Liu, D.; Chen, X.; Dan, L.; He, B.; He, H.; Ju, W.; Liang, M.; et al. The carbon budget of China: 1980-2021. Sci. Bull. 2024, 69, 114–124. [Google Scholar] [CrossRef]
  33. Liu, Z.; Meng, J.; Deng, Z.; Lu, P.; Guan, D.; Zhang, Q.; He, K.; Gong, P. Embodied carbon emissions in China-US trade. Sci. China Earth Sci. 2020, 63, 1577–1586. [Google Scholar] [CrossRef]
  34. Zhou, Y.; Li, X.; Liu, Y. Land Use Change and Driving Factors in Rural China during the Period 1995-2015. Land Use Policy 2020, 99, 105048. [Google Scholar] [CrossRef]
  35. Guo, J.; Zhang, Z.; Meng, L. China’s provincial CO2 emissions embodied in international and interprovincial trade. Energy Policy 2012, 42, 486–497. [Google Scholar] [CrossRef]
  36. Li, B.; Wang, C.; Wang, Y.; Wang, W.; Lin, A. Impact Assessment of China’s Inter-Provincial Trade on Trade-Related Sustainable Development Goals. J. Clean. Prod. 2023, 388, 135983. [Google Scholar] [CrossRef]
  37. Mi, Z.; Meng, J.; Guan, D.; Shan, Y.; Song, M.; Wei, Y.-M.; Liu, Z.; Hubacek, K. Chinese CO2 Emission Flows Have Reversed since the Global Financial Crisis. Nat. Commun. 2017, 8, 1712. [Google Scholar] [CrossRef] [PubMed]
  38. IPCC. 2006 IPCC Guidelines for National Greenhouse Gas Inventories. In Proceedings of the National Greenhouse Gas Inventories Programme, Intergovernmental Panel on Climate Change IPCC, c/o Institute for Global Environmental Strategies IGES, 2108–11, Hayama, Japan, 1 July 2006; Eggleston, H.S., Buendia, L., Miwa, K., Ngara, T., Tanabe, K., Eds.; IGES: Hayama, Japan, 2006. [Google Scholar]
  39. Shao, L.; Li, Y.; Feng, K.; Meng, J.; Shan, Y.; Guan, D. Carbon emission imbalances and the structural paths of Chinese regions. Appl. Energy 2018, 215, 396–404. [Google Scholar] [CrossRef]
  40. Peters, G.P. From Production-Based to Consumption-Based National Emission Inventories. Ecol. Econ. 2008, 65, 13–23. [Google Scholar] [CrossRef]
  41. Xue, R.; Wang, S.; Long, W.; Gao, G.; Liu, D.; Zhang, R. Uncovering GHG emission characteristics of industrial parks in Central China via emission inventory and cluster analysis. Energy Policy 2021, 151, 112191. [Google Scholar] [CrossRef]
  42. Liu, X.; Wang, S.; Wu, P.; Feng, K.; Hubacek, K.; Li, X.; Sun, L. Impacts of Urban Expansion on Terrestrial Carbon Storage in China. Environ. Sci. Technol. 2019, 53, 6834–6844. [Google Scholar] [CrossRef] [PubMed]
  43. Liu, X.; Wang, S.; Zhuang, Q.; Jin, X.; Bian, Z.; Zhou, M.; Meng, Z.; Han, C.; Guo, X.; Jin, W.; et al. A Review on Carbon Source and Sink in Arable Land Ecosystems. Land 2022, 11, 580. [Google Scholar] [CrossRef]
  44. Yan, B.; Xia, Y.; Jiang, X. Carbon Productivity and Value-Added Generations: Regional Heterogeneity along Global Value Chain. Struct. Change Econ. Dyn. 2023, 65, 111–125. [Google Scholar] [CrossRef]
  45. Liu, Z.; Dou, X.Y.; Yu, Y.; Tan, J.G.; Sun, T.C.; Meng, J. China’s Embodied Carbon Transfer in Global Trade. China J. Econom. 2023, 3, 1225–1242. [Google Scholar]
Figure 1. Map of the study area showing the boundaries of the provinces and the eight economic regions.
Land 14 00753 g001
Figure 2. Framework showing the telecoupling of land use-based carbon emissions between two human–environmental systems. MRIO refers to the MRIO table of China in 2017.
Land 14 00753 g002
Figure 3. Land use-based embodied carbon emissions from the production end: (a) total, (b) agriculture, (c) industry, and (d) construction. Proportion represents the proportion of land use-based embodied carbon emissions from the production end that meet the demand of other provinces to the total land use-based embodied carbon emissions from the production end of a province. We used the natural breakpoint method to categorize total embodied carbon emissions and the proportion into three classes: low (L), medium (M), and high (H).
Land 14 00753 g003
Figure 4. Land use-based embodied carbon emissions from the consumption end: (a) total, (b) agriculture, (c) industry, and (d) construction. Proportion represents the ratio of land use-based embodied carbon emissions transferred out due to the consumption of products of other provinces to the total land use-based embodied carbon emissions from the consumption end. The higher proportion suggests that the province exports more carbon emissions to other provinces due to consumption that should have been undertaken by itself.
Land 14 00753 g004
Figure 5. The net transfer of embodied carbon emissions for total land area and by land-use type: (a) total, (b) agriculture, (c) industry, and (d) construction. Total carbon emissions represent the sum of imported and exported land use-based carbon emissions. The imported carbon emissions show the proportion of imported to the sum of imported and exported carbon emissions.
Land 14 00753 g005
Figure 6. Network of embodied carbon flows by land-use type among provinces: (a) agriculture, (b) industry, and (c) construction. CEN < 0 (green color scheme) denotes net carbon emissions export, which means that more carbon emissions are transferred to other regions than those that a region can undertake from other provinces. CEN > 0 (yellow color scheme) represents net carbon emissions import, indicating a region can undertake more carbon emissions from other regions than those that are transferred out. The arrow direction represents the land use-based embodied carbon emissions flow direction, and the line width represents the magnitude of transfer.
Land 14 00753 g006
Figure 7. The flow direction of land use-based embodied carbon emissions among economic regions in China: (a) agricultural land, (b) industrial land, and (c) construction land.
Land 14 00753 g007
Table 1. The matching between land use types and energy consumption items.
Land Use Type (Level 1)Land Use Type (Level 2)Energy Consumption Items
Agricultural landCroplandAgriculture
Industrial landIndustrial and mining landIndustry
Construction landUrban built-up landConstruction industry
Retail, wholesale, accommodation, and food services
Urban household consumption
Rural residential landRural household consumption
Infrastructure landTransportation, postal, and warehousing industry
Disclaimer/Publisher’s Note: The statements, opinions and data contained in all publications are solely those of the individual author(s) and contributor(s) and not of MDPI and/or the editor(s). MDPI and/or the editor(s) disclaim responsibility for any injury to people or property resulting from any ideas, methods, instructions or products referred to in the content.

