Abstract
Soil heavy metal (HM) contamination has become a critical global environmental issue, predominantly caused by industrial and agricultural operations. This study focuses on Mount Wuyi, a UNESCO biodiversity hotspot and major tea production base, to examine vegetation-mediated soil HM accumulation under anthropogenic impacts. We analyzed nine HMs (Mn, Cu, Zn, Cd, Hg, As, Pb, Cr, Ni) across diverse vegetation types using geochemical indices and Positive Matrix Factorization (PMF) modeling. The findings revealed Mn and Zn were dominant elements, and Cr and Pb concentrations exceeded regional background values by 3.47 and 1.26 times, respectively. Cr, Cd, and Pb demonstrated significant pollution levels, while Cd and Hg posed the highest ecological risks. Vegetation type significantly influenced HM distribution patterns, with cultivated areas and shrublands (including tea gardens) accumulating higher concentrations of Cu, Cd, Pb, and Hg from agricultural and transportation sources. Notably, bamboo forests exhibited natural resistance to HM contamination. PMF analysis identified four primary pollution sources: urbanization (27.94%), transport–agriculture activities (21.40%), agricultural practices (12.98%), and atmospheric deposition (12.96%). These results underscore the need for implementing clean energy solutions, phytoremediation strategies, and tea-specific detoxification measures to maintain ecological security and agricultural sustainability in this ecologically significant region.
1. Introduction
Soil environmental security is crucial for human survival and development, critically influencing public health and ecological stability. As a vital component of terrestrial ecosystems, soil not only supports plant growth and agricultural productivity but also plays a crucial role in nutrient cycling, water filtration, and carbon sequestration [1]. However, heavy metal (HM) contamination poses a serious threat. Industrialization, urbanization, vehicle emissions, agricultural chemicals, and improper waste disposal are major sources [2]. These pollutants persist in the environment and accumulate in organisms. They contaminate both soil and groundwater, reducing farmland quality. Through food chains, HMs may even ultimately harm human health through bioaccumulation. Their persistence and bioaccumulation demand accurate risk assessment and source identification for effective management.
Recently, HM pollution in soil has emerged as an interdisciplinary research focus spanning environmental sciences and soil sciences with growing intersections in toxicology, biogeochemistry, and public health policy. Spatial analysis, risk indexing, and source apportionment techniques are widely used to study HM contamination. Studies have quantified the HM levels in mining, agricultural, urban soils and sediments using the Potential Ecological Risk Index [3] and geochemical indices [4,5,6,7,8,9], with Cd and Pb consistently ranking as priority pollutants across ecosystems. Meanwhile, soil physicochemical properties, terrain factors, and human activity intensity were analyzed to identify the key drivers for HM accumulation. Notably, the Positive Matrix Factorization (PMF) model, originally developed for atmospheric particulate analysis, has been increasingly applied to HM source identification after gaining U.S. EPA endorsement [10,11,12,13].
Mount Wuyi, a UNESCO World Heritage Site and biodiversity hotspot [14,15], enriched by a deep cultural history and longstanding traditional agricultural practices, serves as both a critical ecological barrier and a renowned tea production base along China’s southeastern coast. Rapid industrialization and urbanization highlight the urgent need to assess HM accumulation patterns and associated ecological risks in this region [16]. Plant species modulate the absorption, accumulation, and migration of HM through physiological differences, directly influencing HM distribution and risk profiles in soil [17,18]. However, existing studies have largely overlooked comparative analyses of soil HM levels across vegetation types [19]. Moreover, systematic investigations into the pollution levels, ecological risks, and pollution sources on Mount Wuyi are still scarce [20]. Addressing these gaps will provide critical insights for regional ecological risk management, early warning system development, and sustainable agricultural practices in this unique region.
Therefore, our research addresses these critical gaps through the first comprehensive investigation that characterizes HM distribution patterns across different vegetation types in this understudied World Heritage Site, establishing vital baseline data for ecological monitoring. Through systematic comparative analysis, we reveal distinct enrichment patterns of soil HMs under various vegetation types, representing a significant advancement beyond previous studies that largely overlooked cross-vegetation comparisons [19]. Most importantly, our findings particularly emphasize the ecological security implications of Mount Wuyi’s dominant tea production. We quantified the accumulation and ecological risks of HMs in surface soils of tea cultivation zones (classified within shrubland), a critical revelation given the shallow root systems of tea plants. These results will provide empirical evidence for implementing sustainable soil management strategies that balance agricultural productivity with heritage conservation priorities.
Thus, this study focuses on Mount Wuyi, targeting eight UN Environment Programme priority HMs (i.e., Cu, Zn, Cd, Hg, As, Pb, Cr, and Ni) and Mn (as a stable reference element) to achieve three objectives: (1) assess the influence of vegetation types on HM enrichment characteristics; (2) evaluate ecological risks of HMs under different vegetation types; and (3) identify primary potential pollution sources of these HMs. The findings will support ecological risk management and sustainable agricultural development in the region, particularly for tea production.
2. Materials and Methods
2.1. Study Area
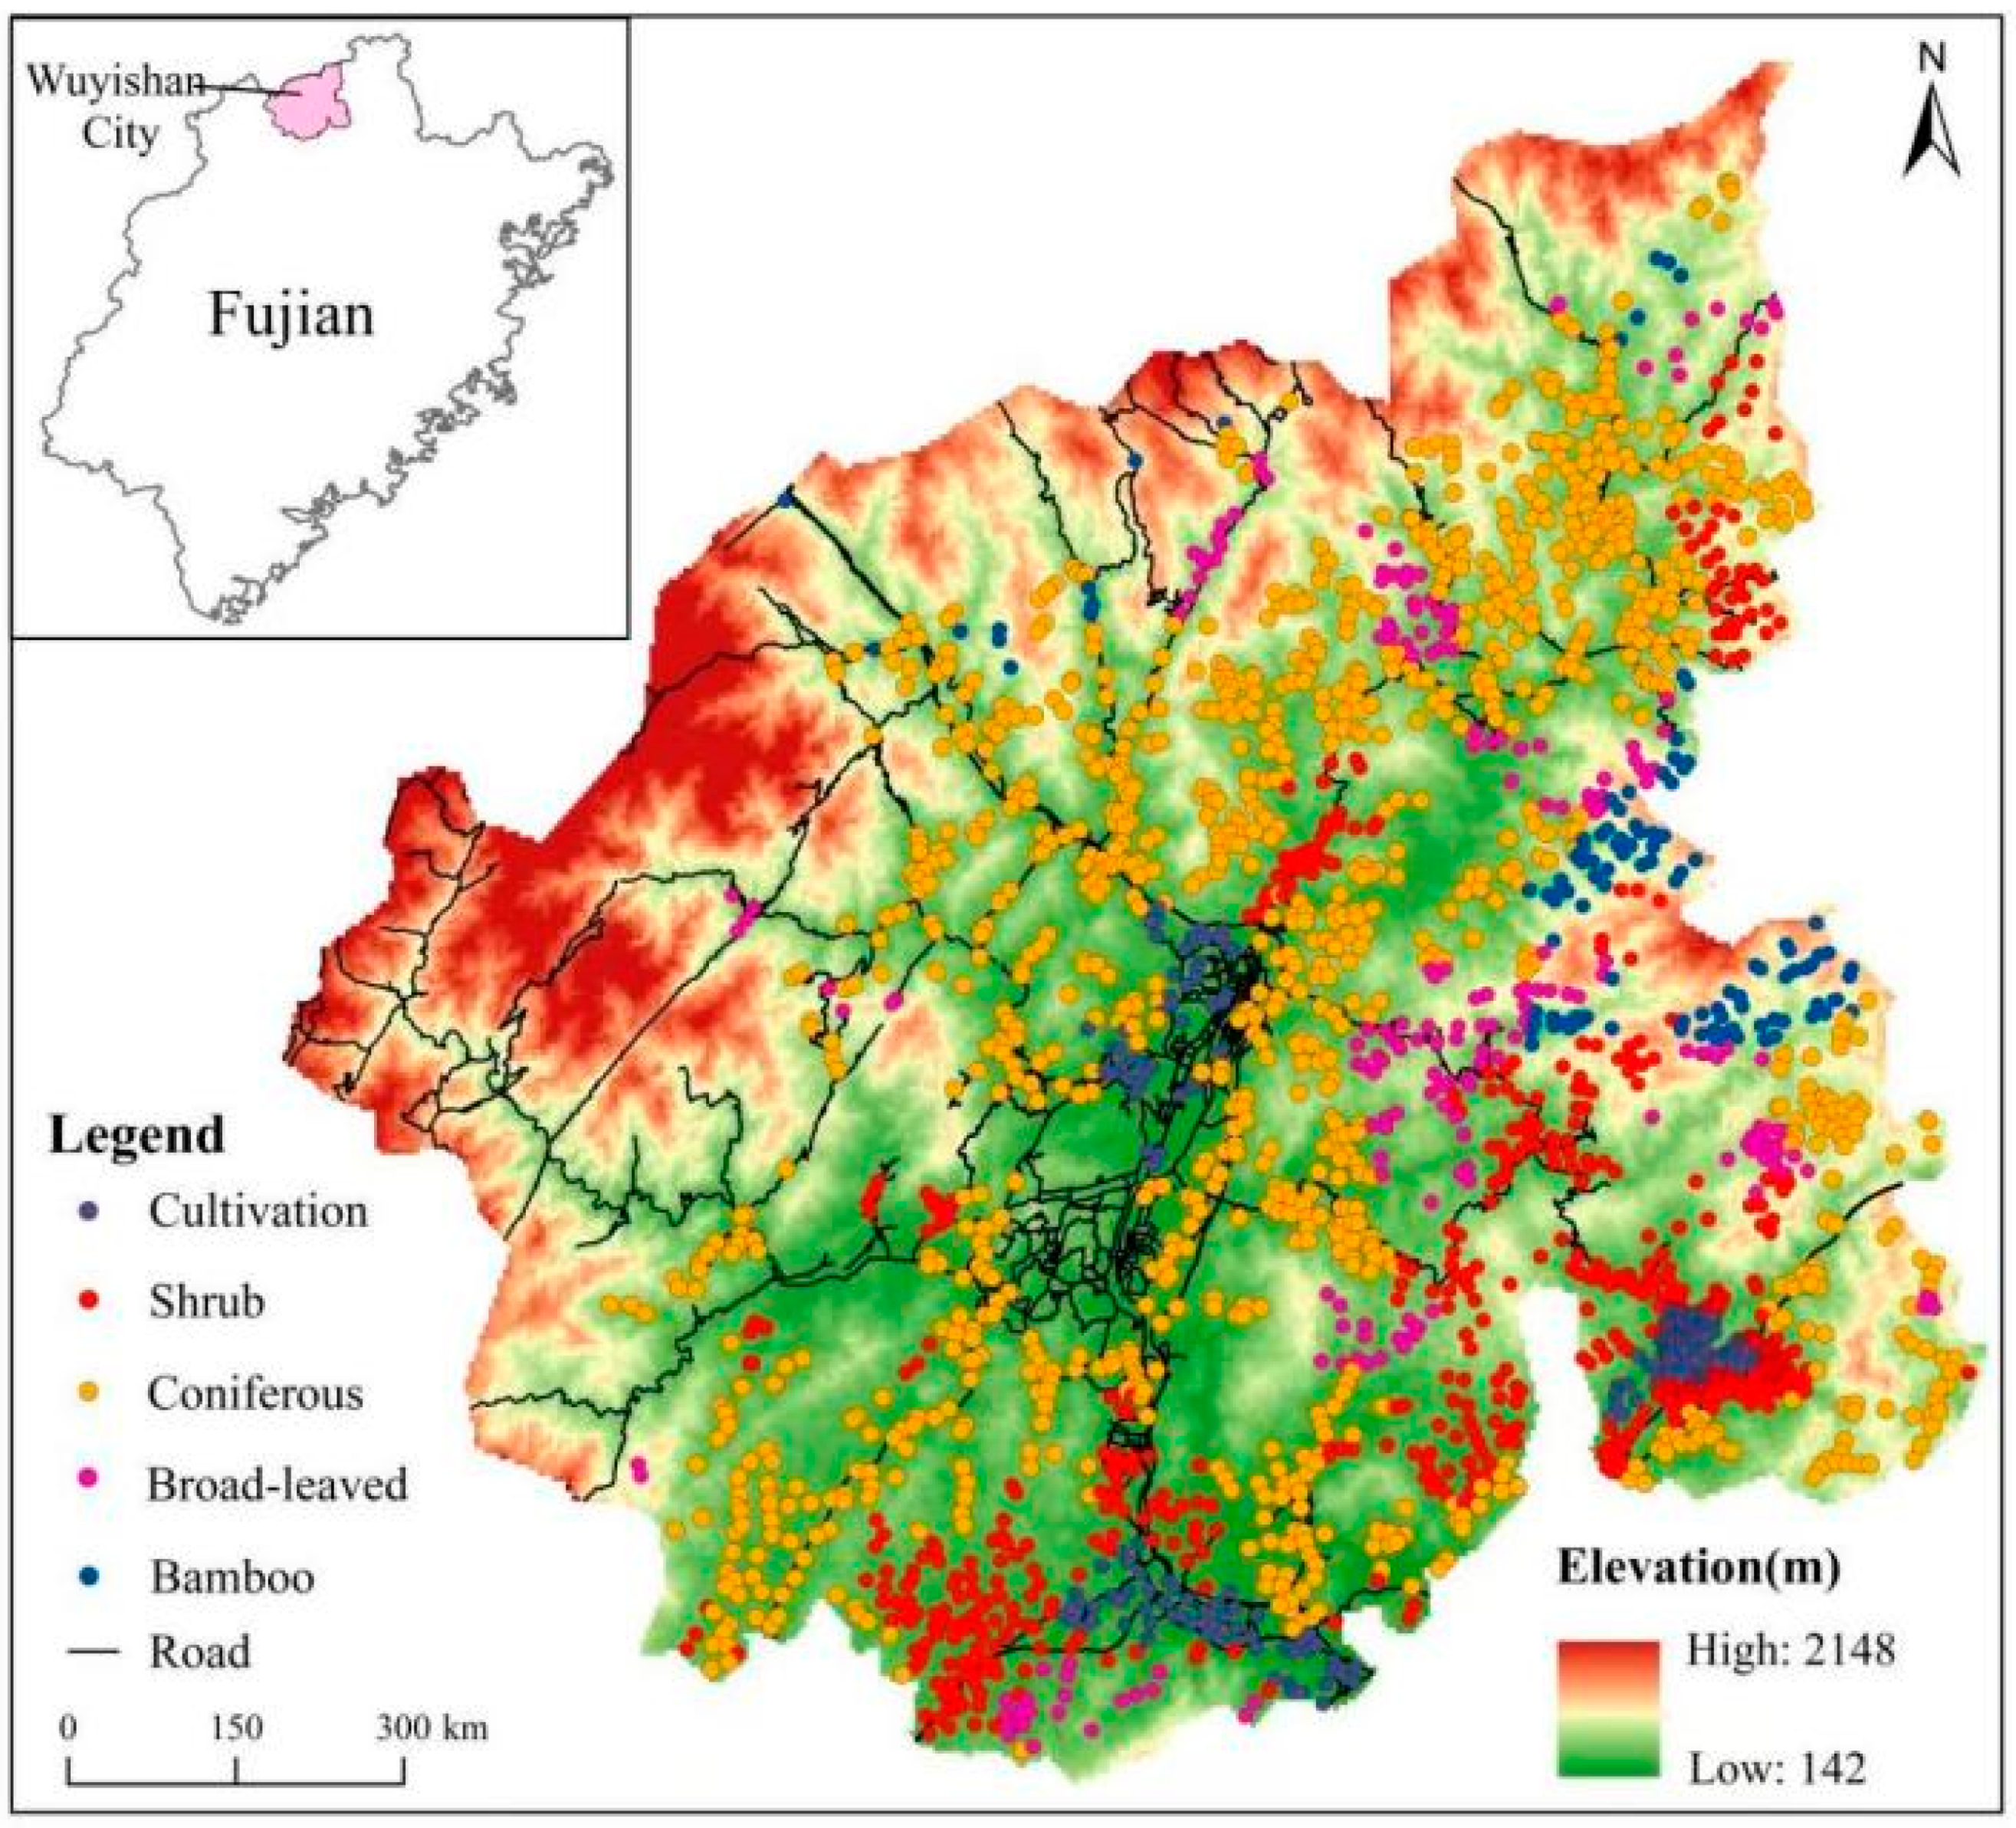
The study area is in the Mount Wuyi of northern Fujian Province, China, covering a total area of 2813 square kilometers. This region experiences a mid-subtropical monsoon humid climate, characterized by distinct seasons, abundant rainfall, an average annual temperature of 19.7 °C, and an average annual precipitation of 1926.9 mm. The area is surrounded by mountains to the east, west, and north, with relatively flat terrain in the central and southern parts (Figure 1). The terrain slopes from the northwest to the southeast, reaching its highest point at Huanggang Mountain, which stands at 2158 m above sea level. Known for its rich biological resources, Mount Wuyi boasts a forest coverage rate of over 80%.
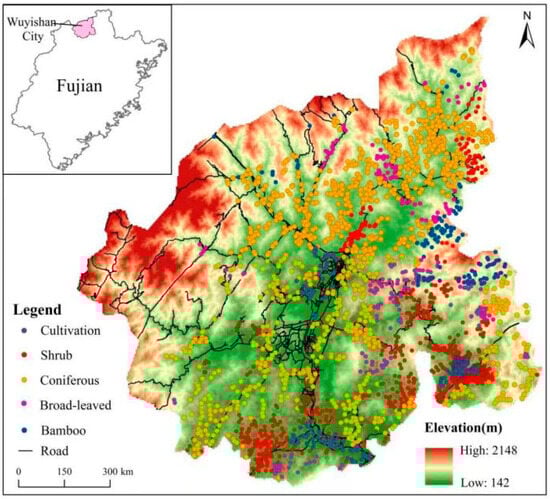
Figure 1.
Sampling sites in the study area.
2.2. Sample Collection and Measurement
Soil sampling was conducted between June and September 2023 at 0–20 cm depth, following the “Technical Specification for Soil Environmental Monitoring” (HJ/T166-2004) [21]. This period represents the peak season for vegetation growth and root activity, providing optimal conditions for investigating the influence of vegetation. Meanwhile, it coincides with the intensive agricultural practices, including fertilization and pesticide application, in tea plantations and other agricultural areas. In addition, we specifically targeted 0–20 cm depth because: (1) it is the primary interface where human activities directly interact with plant root systems; (2) it serves as the initial reservoir for atmospheric deposition and agricultural inputs; (3) HMs, particularly Pb, Cd, and Hg, exhibit preferential accumulation in this layer due to their limited vertical mobility. This sampling strategy not only captures the immediate effects of human activities on soil contamination but also provides reliable data for characterizing the spatial distribution patterns of HMs in the soil profile.
A total of 2409 sampling sites were established across five vegetation types (Figure 1): cultivated land (including farmland, orchard, and subtropical economic forest), shrubland (predominantly Wuyi tea gardens), coniferous forest, broad-leaved forest, and bamboo forest. Approximately 1 kg of soil per site was collected, air-dried, and sieved through 60-mesh screens. Heavy metal concentrations were determined via inductively coupled plasma mass spectrometry (ICP-MS) after microwave digestion, following the standard of “Soil and Sediment—Determination of 19 Total Metal Elements” (HJ 1315-2023) [22].
Soil pH was determined using a compound electrode (MP551, China) in a 1:2.5 (w/w) soil-to-water suspension. Soil texture analysis was performed with a laser particle sizer (LS13320, Beckman Coulter, Pasadena, CA, USA) [23]. After removing carbonates with 1 M HCl and neutralizing with deionized water, total organic carbon (TOC) and total nitrogen (TN) were quantified using an Elementary Analyzer (Elementar vario, Langenselbold, Germany). Soil total phosphorus (TP) and available phosphorus (AP) were measured via molybdenum blue spectrophotometry, and available nitrogen (AN) was determined by alkaline diffusion titration. Total potassium (TK) was analyzed through NaOH fusion in a nickel crucible at 750 °C, while available potassium (AK) was assessed using NH4Ac extraction followed by flame photometry [24].
2.3. Heavy Metal Evaluation and Source Apportionment
The extent of HM pollution in Mount Wuyi soils was conducted using two complementary indices: enrichment factor (EF) and geoaccumulation index (Igeo) [2]. For EF determination, Mn was selected as the reference element due to its stable geochemical behavior under natural conditions. The Igeo (Müller index) was applied to quantify the integrated impact of both anthropogenic inputs and natural geochemical processes on sediment and soil contamination levels.
For comprehensive ecological risk evaluation, we employed the Hakanson-based potential ecological risk index (Ei) for individual HMs and the composite risk index (RI) accounting for multiple pollutants [3,25]. This standardized methodology integrates contaminant type, concentration magnitude, and inherent toxicity, offering a systematic framework for environmental risk assessment. The calculation protocols follow established equations [2,3,26,27]:
where, Ci and CMn are the measured concentration of the target HM I and reference element Mn, respectively. The ratios (Ci/CMn)s and (Ci/CMn)b are the concentrations of metal i and Mn in the target and background soil, respectively. Bi represents the background value of metal i, and K is the correction factor (K = 1.5 for contaminated sites) [26]. Ti represents the toxicological coefficient (1, 5, 1, 30, 40, 10, 5, 2, 5 for Mn, Cu, Zn, Cd, Hg, As, Pb, Cr, Ni, respectively) [3,28].
The evaluation criteria for each index are represented in Table 1. National soil quality standards were used to evaluate individual metal concentrations, including: (1) Environmental Quality Standard for Soils (GB 15618-1995) [29]; and (2) Soil Environment Quality Risk Control Standard for Soil Contamination of Agriculture Land.

Table 1.
Grading criteria for HM pollution and ecological risk indices.
The PMF model was then applied to identify and quantify potential HM pollution sources using an advanced three-dimensional decomposition framework. This technique integrates receptor concentration data with source signatures through an iterative optimization process, effectively separating mixed environmental samples into distinct source contributions while accounting for measurement uncertainties [30,31].
2.4. Statistical Analysis
T-test was used to evaluate whether the measured concentration of a specific HM significantly deviates from the regional background value. Descriptive statistics, including the coefficient of variation (CV) and frequency analysis, were applied to characterize the spatial distribution of HMs. One-way ANOVA, followed by Duncan’s test, was conducted to assess the impact of vegetation type on soil properties, HM concentrations, and associated indices. Source apportionment of HMs was performed using the PMF model, using EPA PMF 5.0. Mantel tests were employed to examine correlations between HM concentrations and soil properties. All analyses were conducted in R with a significance level of 0.05. In the figures, the error bars represent the standard error (SE).
3. Results
3.1. Heavy Metal Distribution Patterns
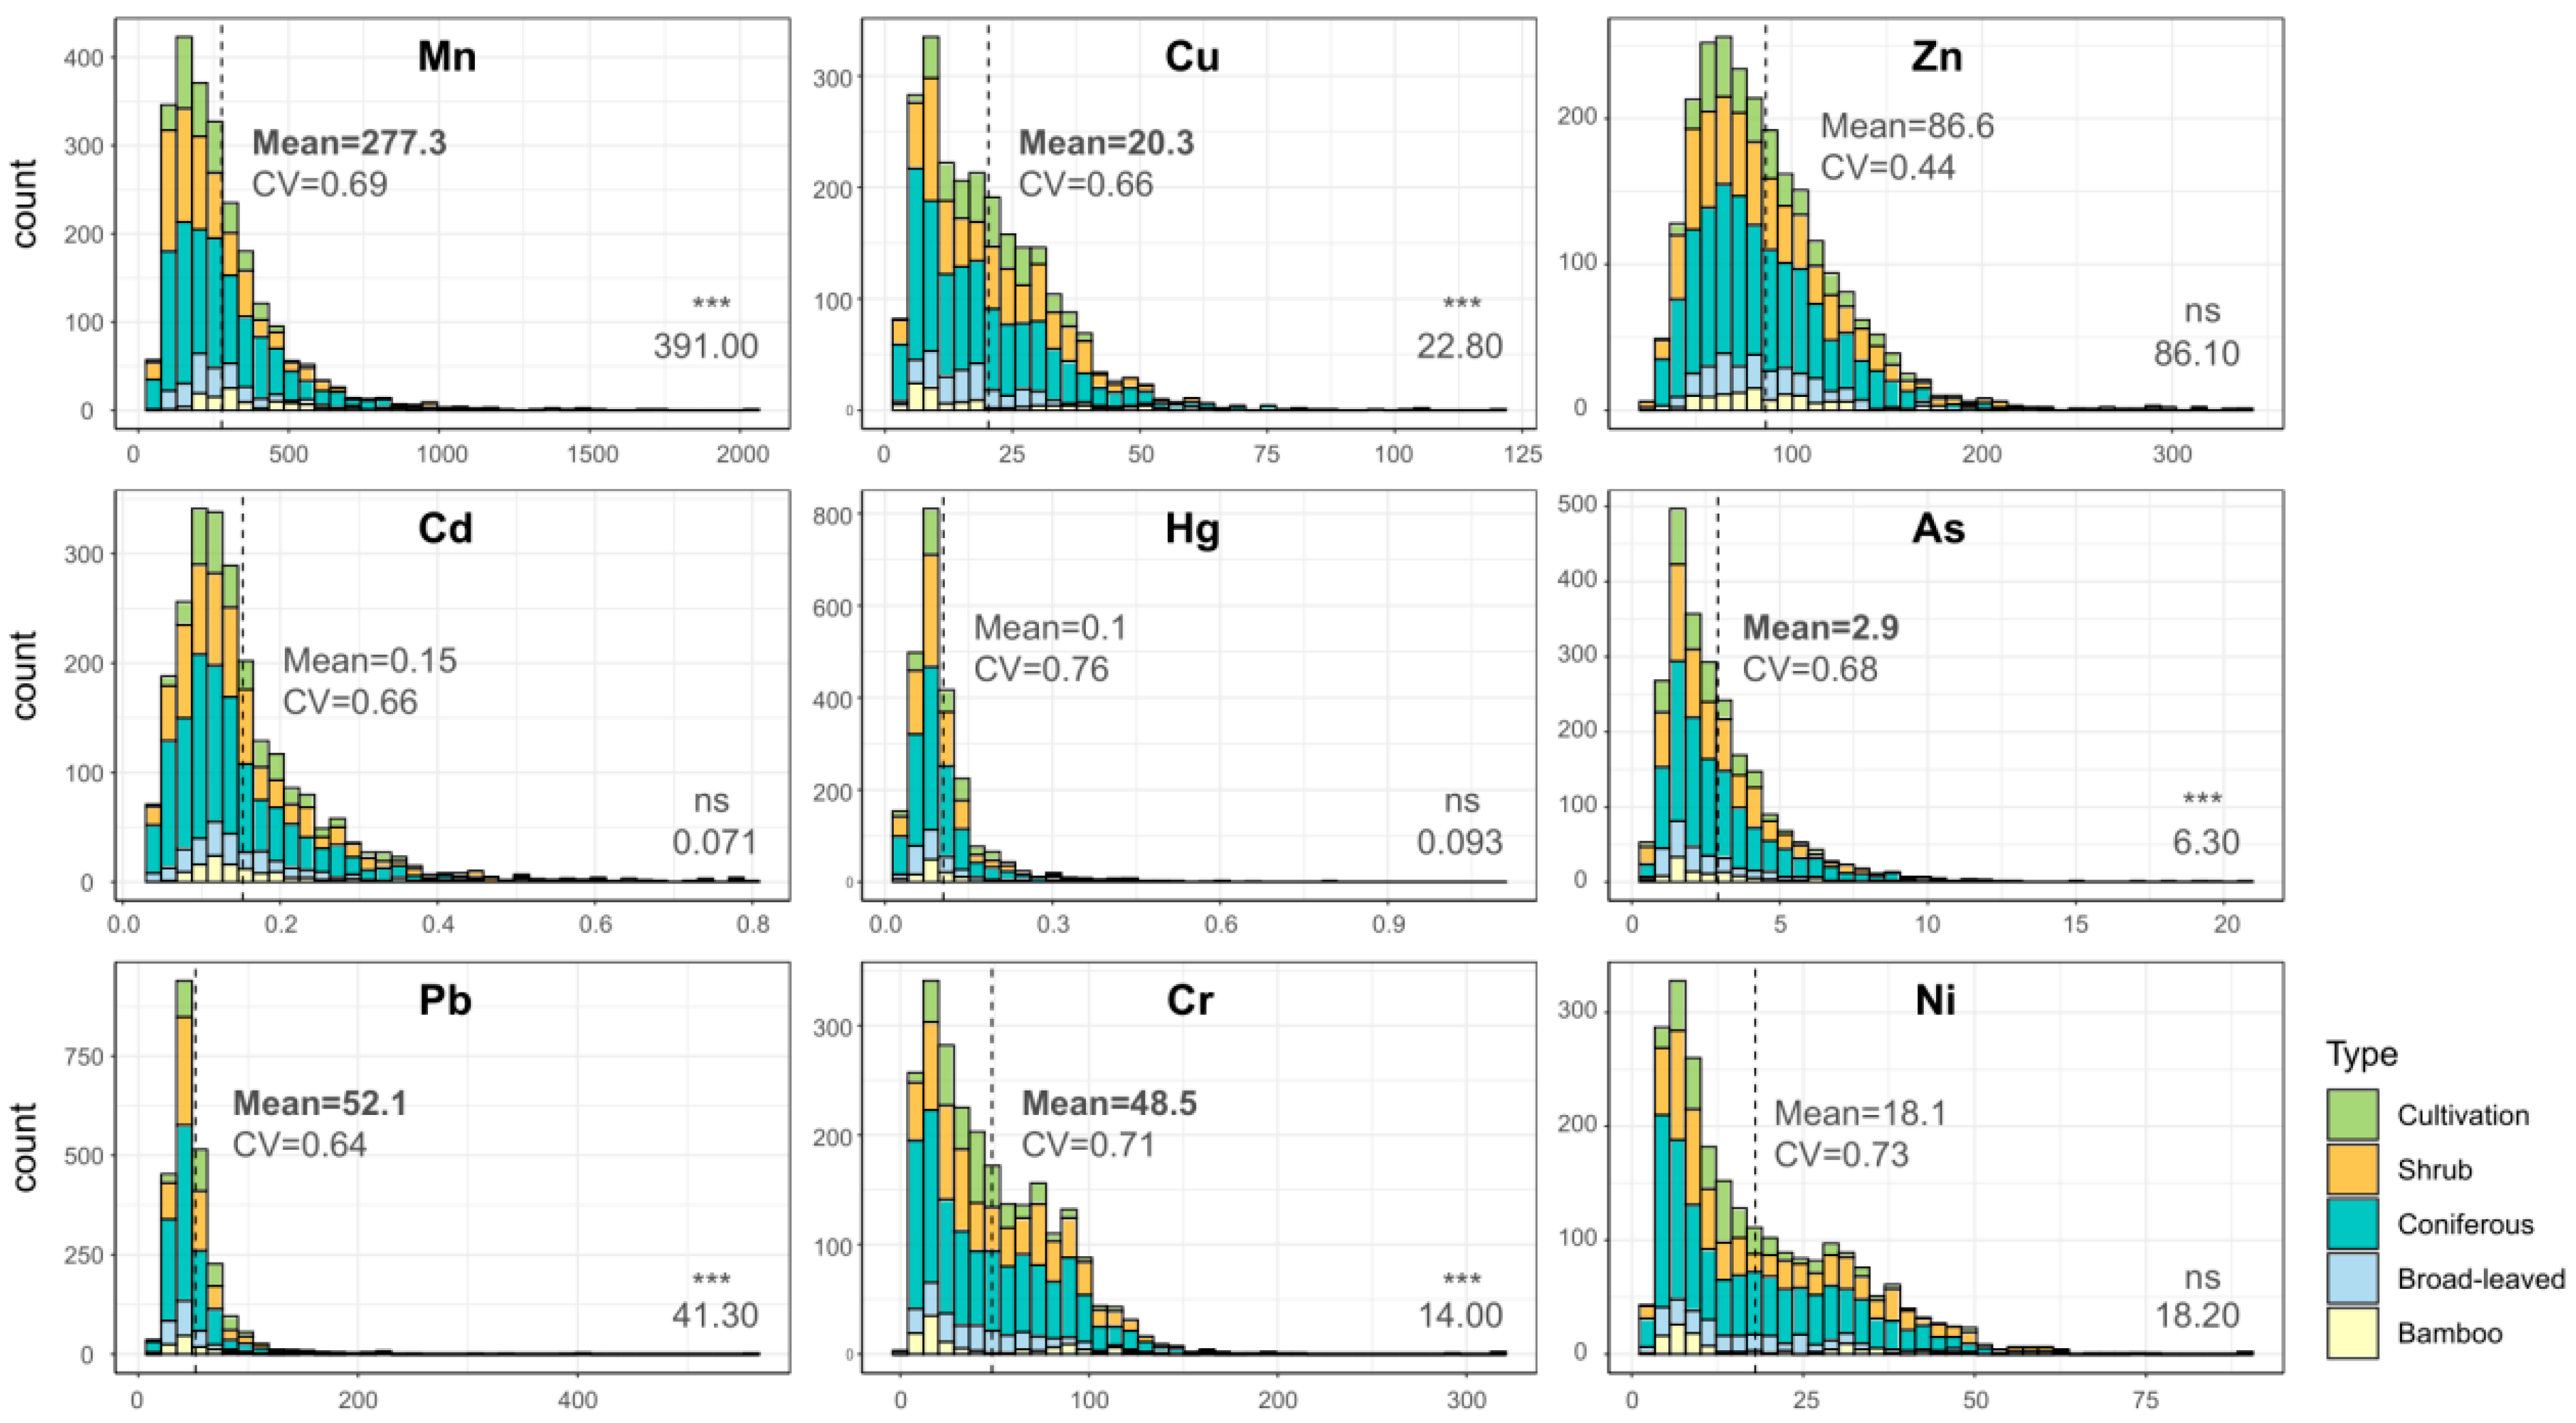
The concentrations of 9 HMs in the study area generally followed a normal distribution (Figure 2). The mean values were ordered as Mn > Zn > Pb > Cr > Cu > Ni > As > Cd > Hg. T-tests revealed that Pb and Cr concentrations were significantly higher than regional background values (p ≤ 0.05), with respective increases of 1.26 and 3.47 times. Conversely, Mn, Cu, and As levels were significantly lower than background values (p ≤ 0.05). Among all HMs, Zn exhibited the lowest coefficient of variation (CV = 0.44), while Hg, Ni, and Cr showed the highest variability.

Figure 2.
Frequency distribution of soil heavy metal concentrations (mg/kg). Vertical axis represents the frequency of samples within specific concentration intervals (i.e., the number of sampling points per histogram bin). Dashed line indicates the mean concentration. CV denotes coefficient of variation. The regional background value (shown in bottom right corner) was obtained from “Background Values of Chinese Soil Elements” [32]. Bold values and *** indicate statistically significant differences from background values (p ≤ 0.05); ns denotes non-significant differences (p > 0.05).
The soil in the study area was acidic, with an average TOC of 17.73 g/kg (Table 2). Significant differences were observed in soil properties and heavy metal distributions across vegetation types (p ≤ 0.05), except for Cu and Zn. Specifically, Cd concentrations peaked in cultivated land and broad-leaved forests, while Hg levels were significantly higher in cultivated areas compared to other vegetation types. As content was highest in coniferous forests and lowest in cultivated land. Pb, Cr, and Ni exhibited maximum concentrations in shrubland, whereas bamboo forests showed a distinct pattern with the highest Mn content, but lower levels of other HMs compared to other vegetation types.
Table 2.
Variations in soil properties and heavy metal concentrations across vegetation types (Mean ± SE). Different lowercase letters indicate statistically significant differences among vegetation types (p ≤ 0.05). TOC, total organic carbon; TN, total nitrogen; TP, total phosphorus; TK, total potassium; AN, available nitrogen; AP, available phosphorus; AK, available potassium.
3.2. Pollution Status and Ecological Risk of Heavy Metals
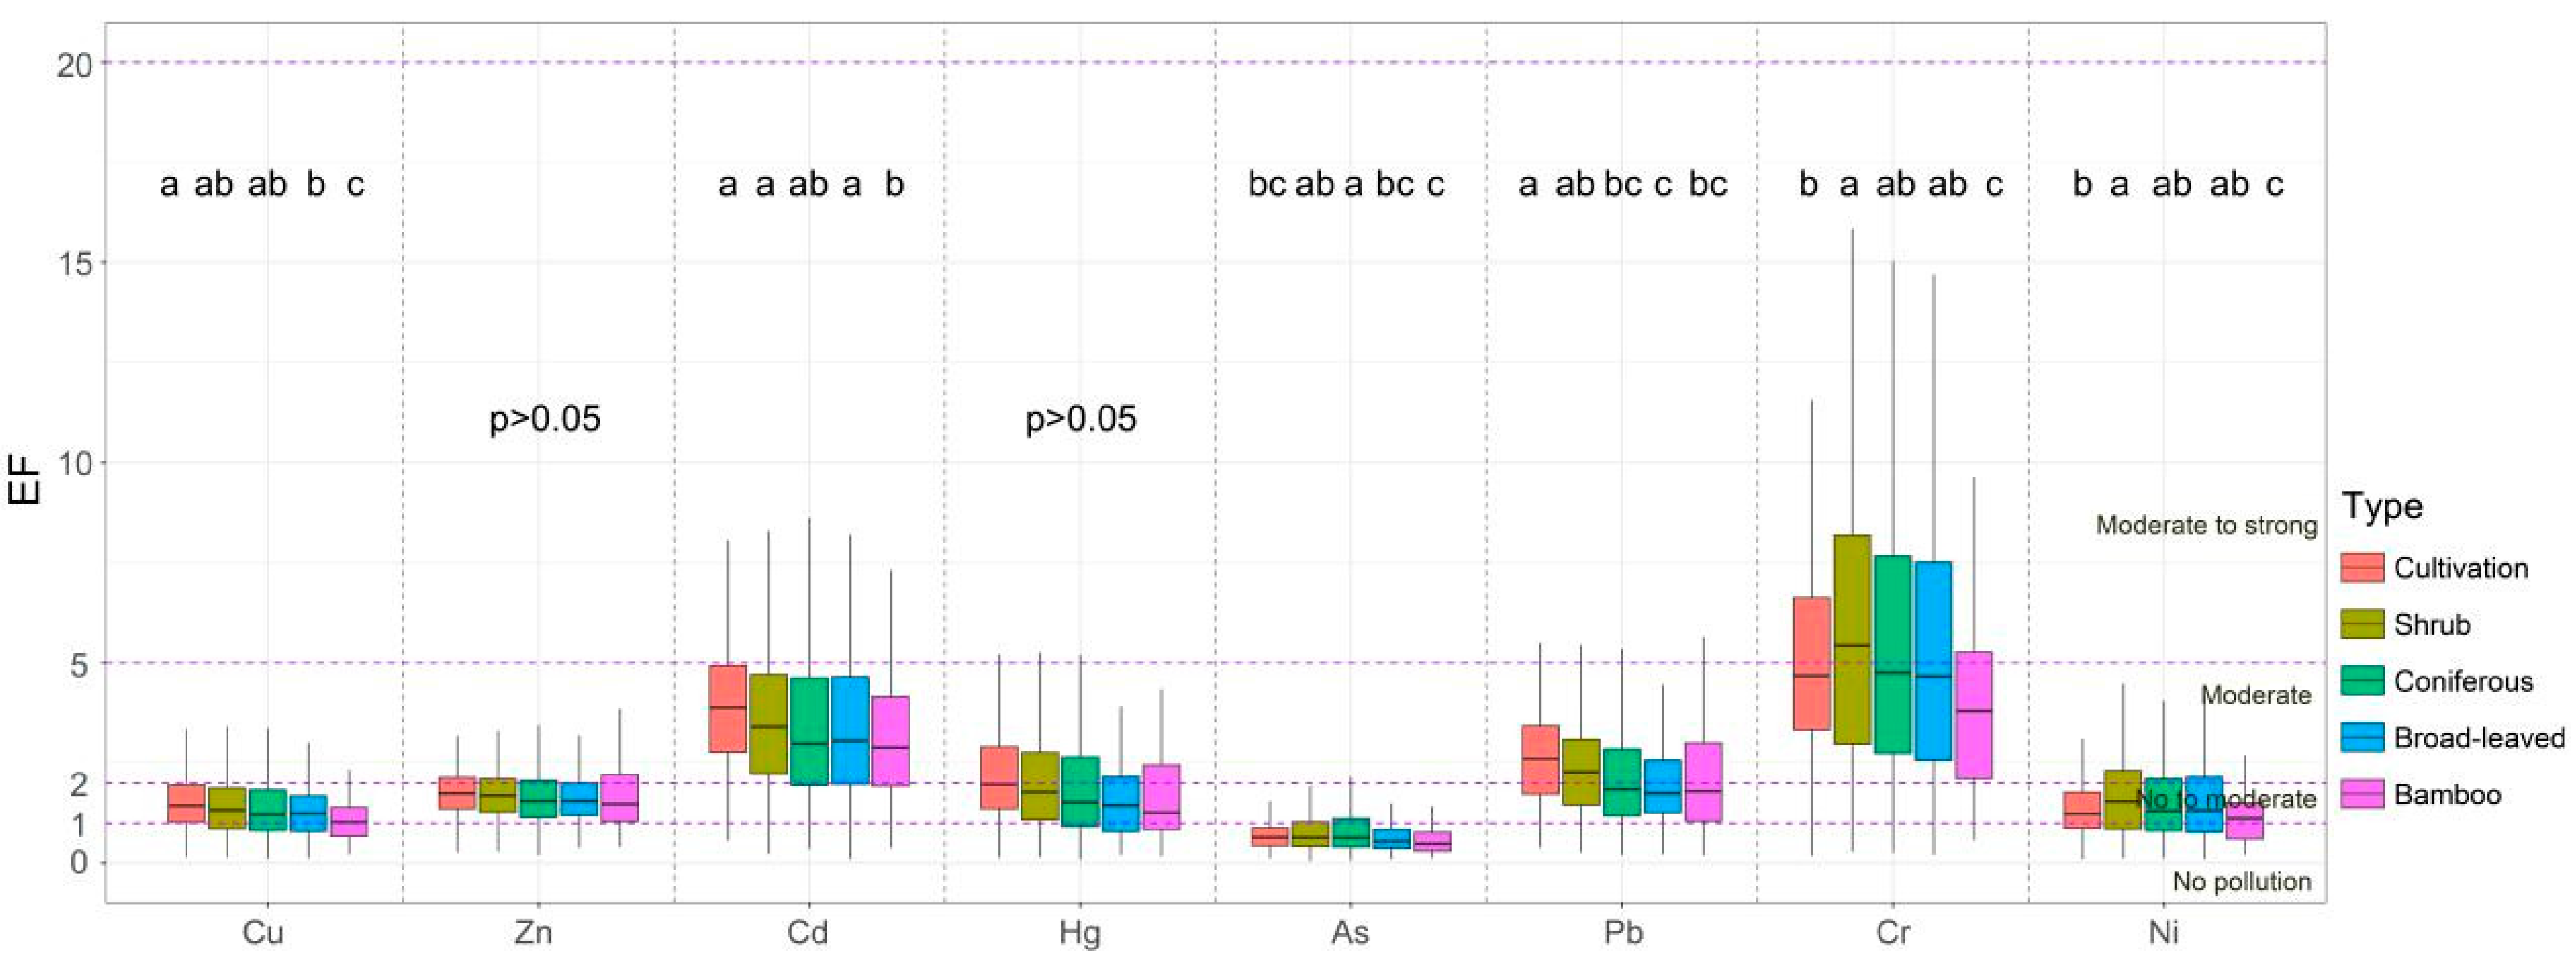
The EF values of HMs followed the order of Cr (5.67) > Cd (3.71) > Pb (2.34) > Hg (2.18) > Zn (1.72) > Ni (1.58) > Cu (1.46) > Mn (1.00) > As (0.85). According to the EF evaluation criteria (Table 1), the enrichment levels of Zn, Ni, and Cu were none to moderate, Cd, Pb, and Hg were moderate, and Cr was moderate to strong. Significant differences in EF values were observed for Cu, Cd, As, Pb, Cr, and Ni across vegetation types (p ≤ 0.05, Figure 3). The EF values of Cu decreased from cultivated land to bamboo forest, while Cd exhibited higher values in cultivated land, shrubland, and broad-leaved forest compared to bamboo forest. The EF of As was highest in coniferous forests but lowest in bamboo forests. The EF of Pb was highest in cultivated land > shrubland > coniferous forest and bamboo forest > broad-leaved forest. Cr and Ni maintained similar EF patterns across vegetation types, with shrubland > coniferous forest and broad-leaved forest > cultivated land > bamboo forest.

Figure 3.
Variations in EF values of soil heavy metals across vegetation types. Different letters indicate statistically significant differences among vegetation types (p ≤ 0.05).
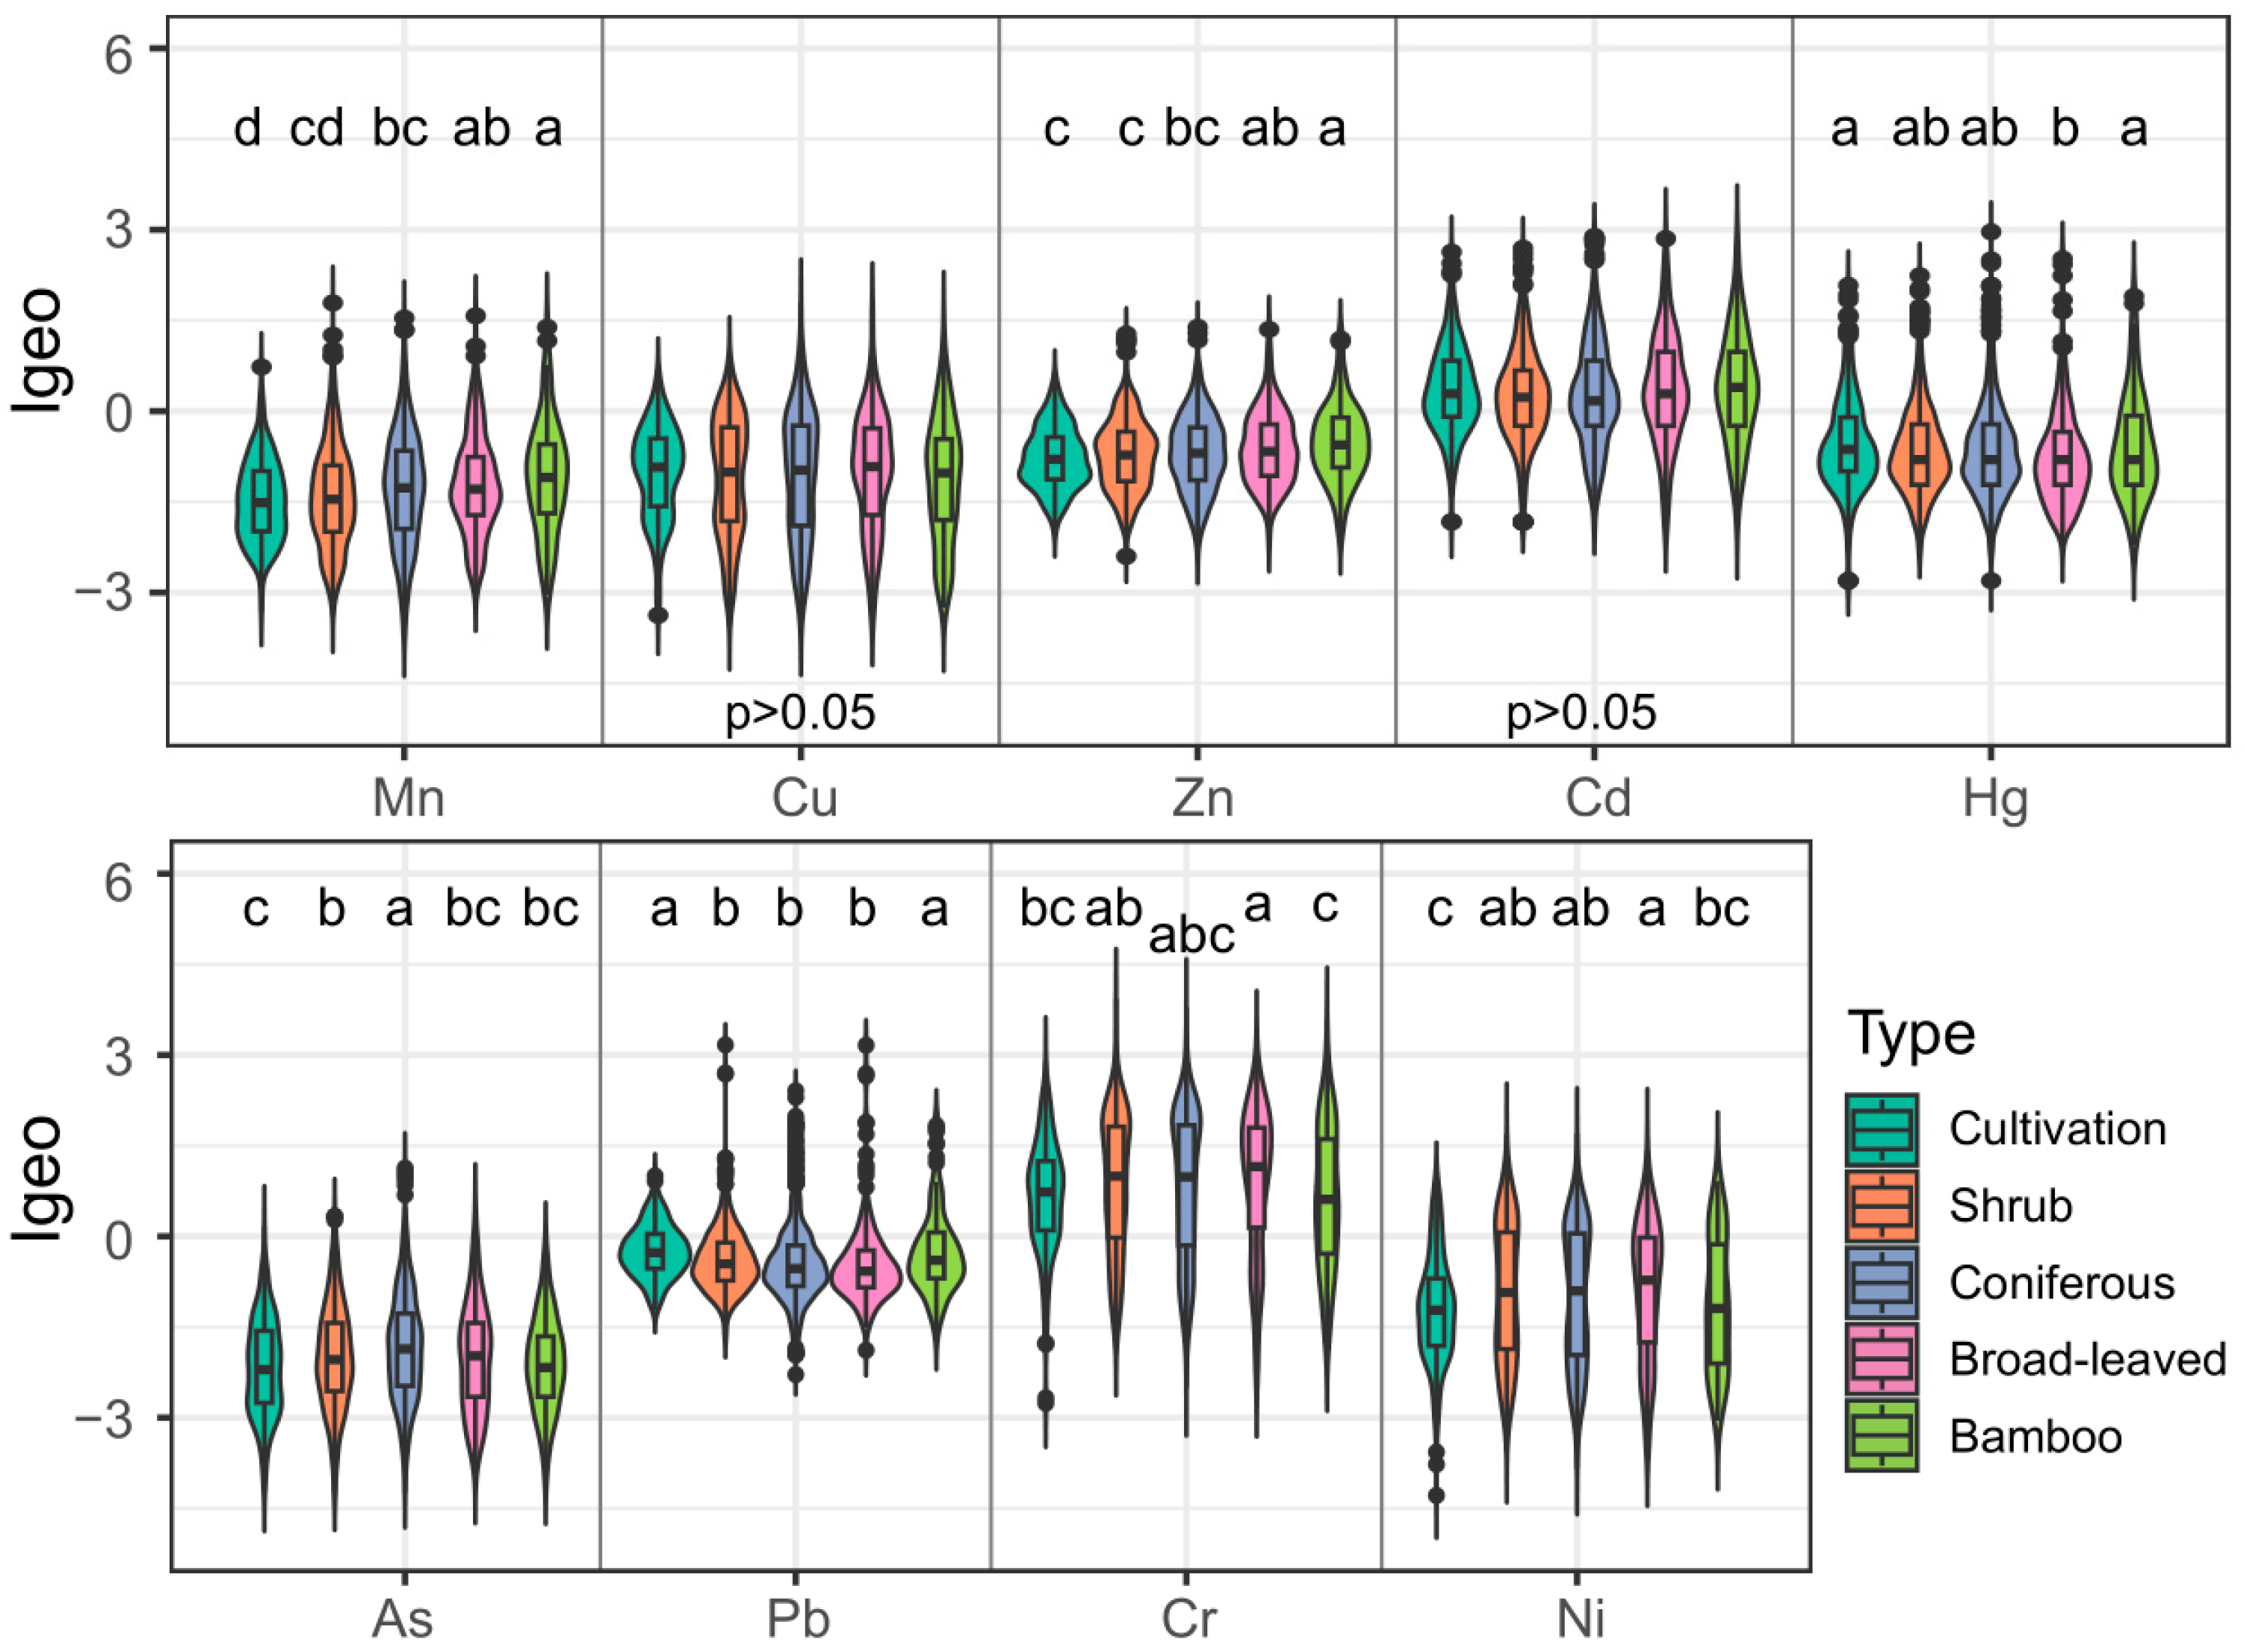
Except for Cr (0.81) and Cd (0.27), the average Igeo values of HMs were <0, with the sequence of Igeo values consistent with EF. Vegetation type significantly influenced HM Igeo values (p ≤ 0.05, Figure 4), except for Cu and Cd. The Igeo of Mn and Zn increased in the order of cultivated land < shrubland < coniferous forest < broad-leaved forest < bamboo forest, and both the Igeo of Hg and Pb were highest in cultivated land and bamboo forest. However, the Igeo of As was highest in the coniferous forest, while Cr and Ni were highest in the broad-leaved forest.
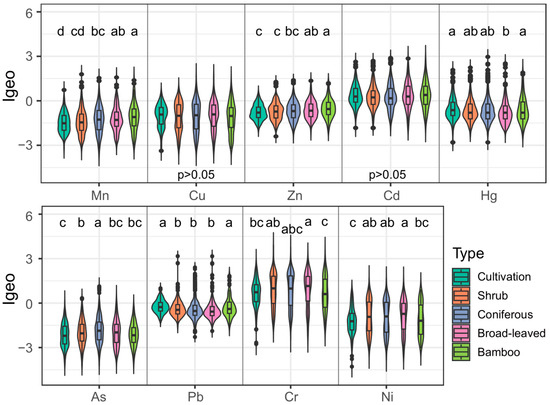
Figure 4.
Variations in Igeo values of soil heavy metals across vegetation types. Different letters indicate statistically significant differences among vegetation types (p ≤ 0.05).
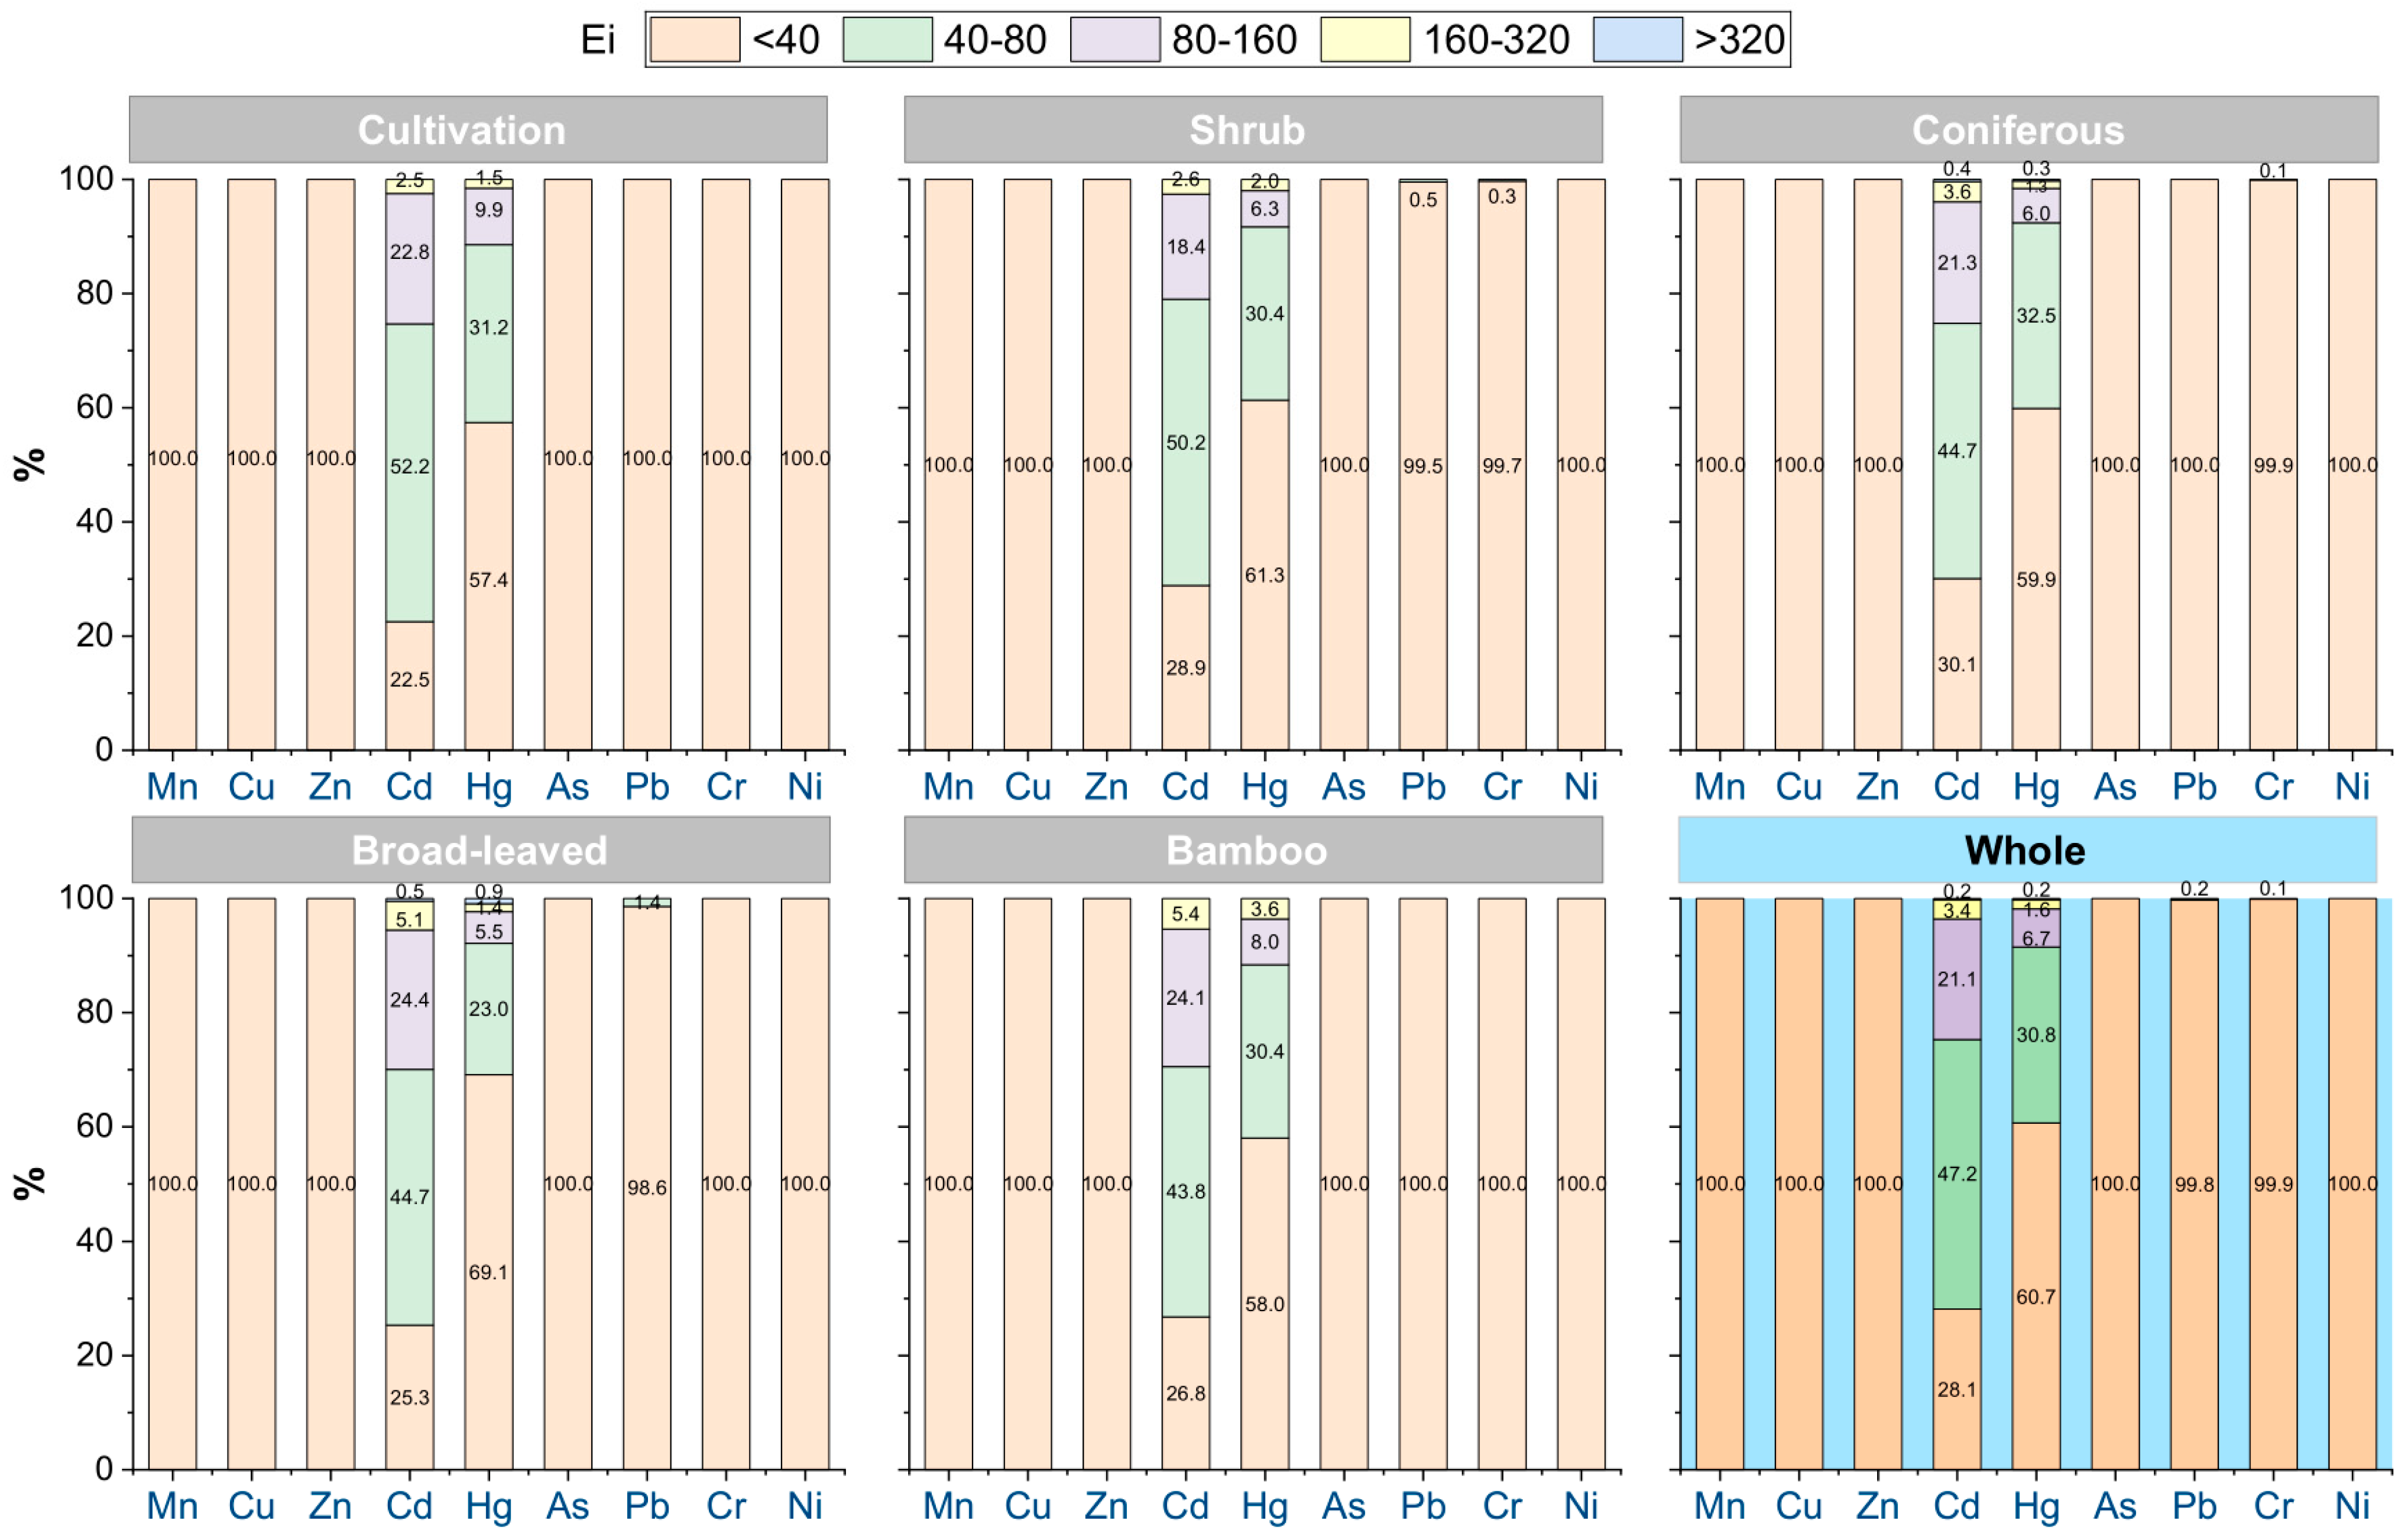
Regarding ecological risk, Cd (64.30) and Hg (44.95) exhibited the highest Ei among all HMs. Moderate-to-high-risk areas associated with these elements were distributed across all vegetation types (Figure 5). Nevertheless, moderate-risk Pb areas accounted for only 0.2% of the study area, primarily located in shrubland and broad-leaved forest, and moderate-risk Cr areas totaled 0.1%, concentrated in shrubland and coniferous forest regions.
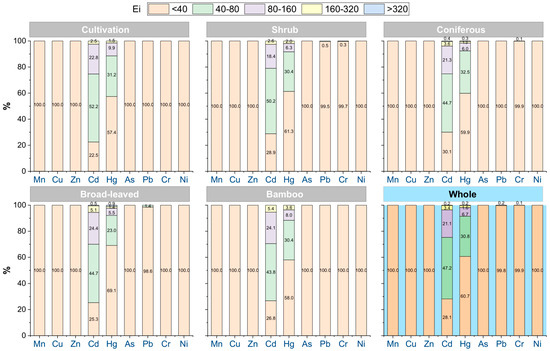
Figure 5.
Distribution of Ei values of soil heavy metals in the study area. Data in the figure show the proportion of Ei values at different levels (%).
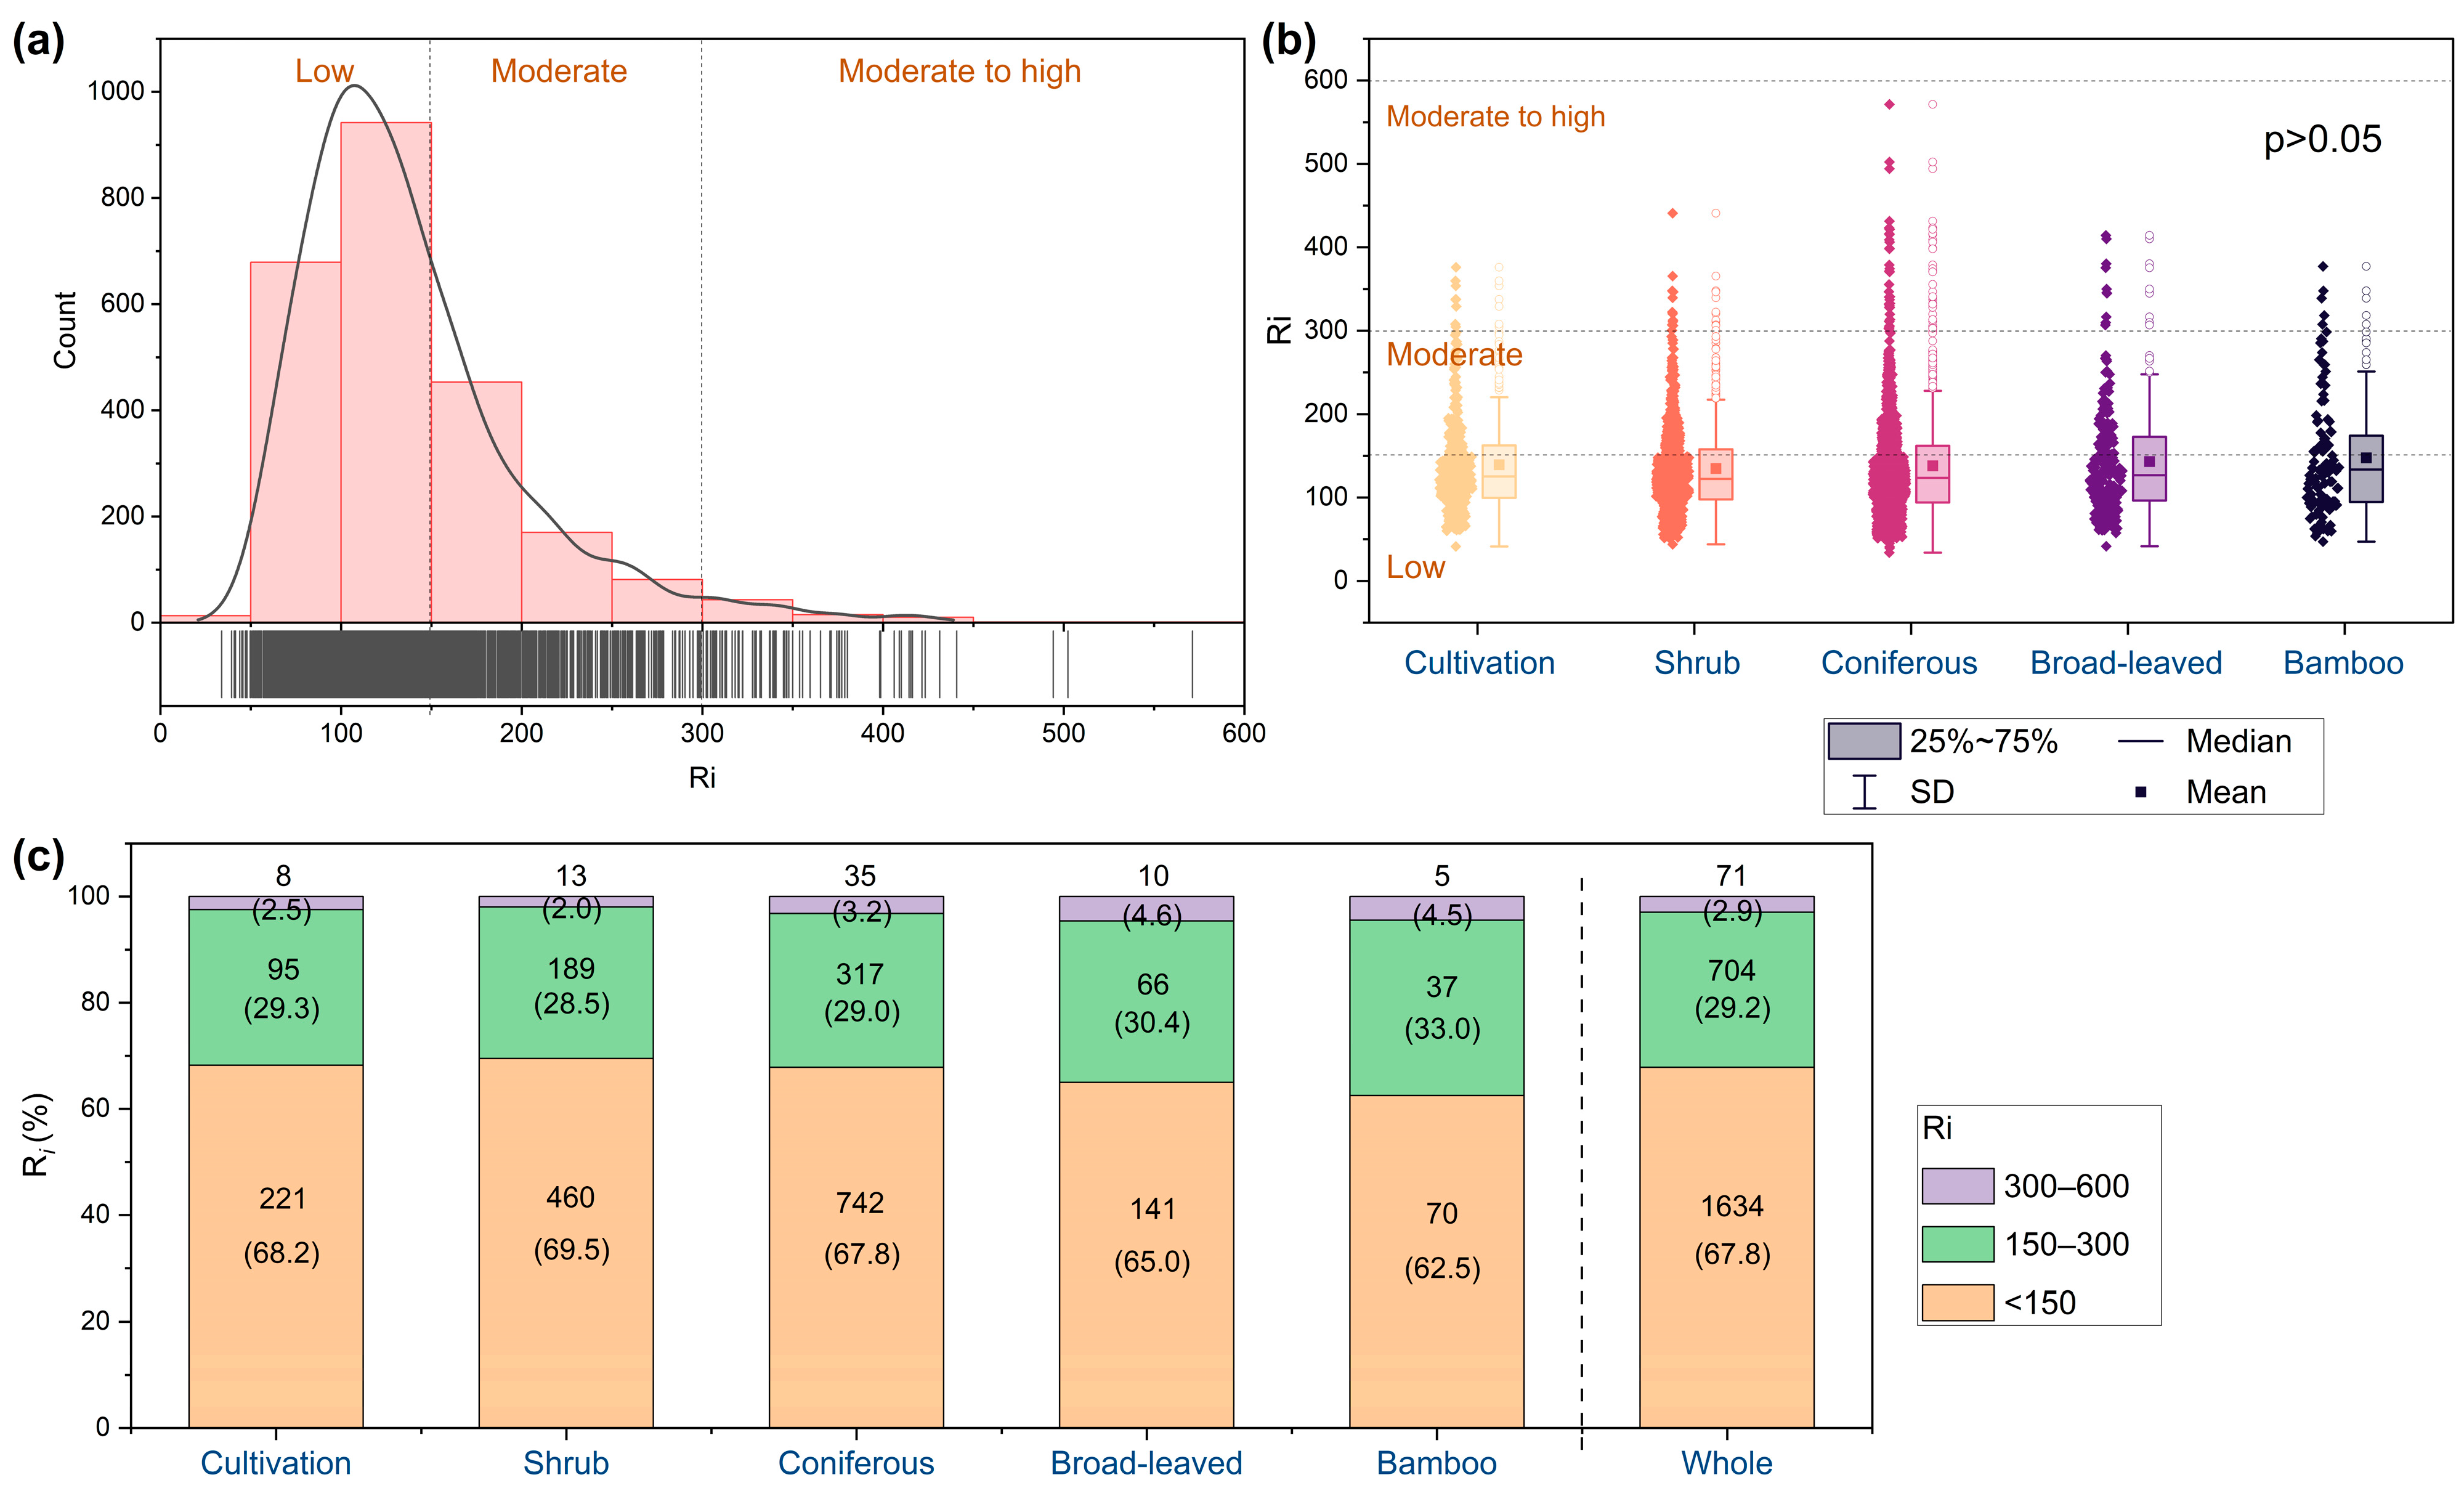
The RI values were mostly <150 in the study area (67.8% of samples), with only 2.9% exceeding 300 (Figure 6a). No significant differences were observed in RI across vegetation types (p > 0.05, Figure 6b). The proportion of samples in high-risk areas decreased as broad-leaved forest (4.6%) > bamboo forest (4.5%) > coniferous forest (3.2%) > cultivated land (2.5%) > shrubland (2.0%). In contrast, the proportion of low-risk areas was highest in shrubland (69.5%), followed by cultivated land (68.2%), coniferous forest (67.8%), broad-leaved forest (65.0%), and bamboo forest (62.5%) (Figure 6c).
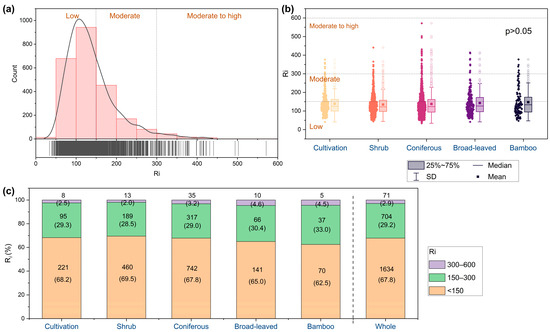
Figure 6.
Frequency distribution histogram of potential ecological risk index (RI) of soil heavy metal in the whole region (a), RI in different vegetation types (b), and the proportion of RI at each level (c). The numbers in parentheses in (c) are the proportions, while the others are counts.
3.3. Analysis of Heavy Metal Sources
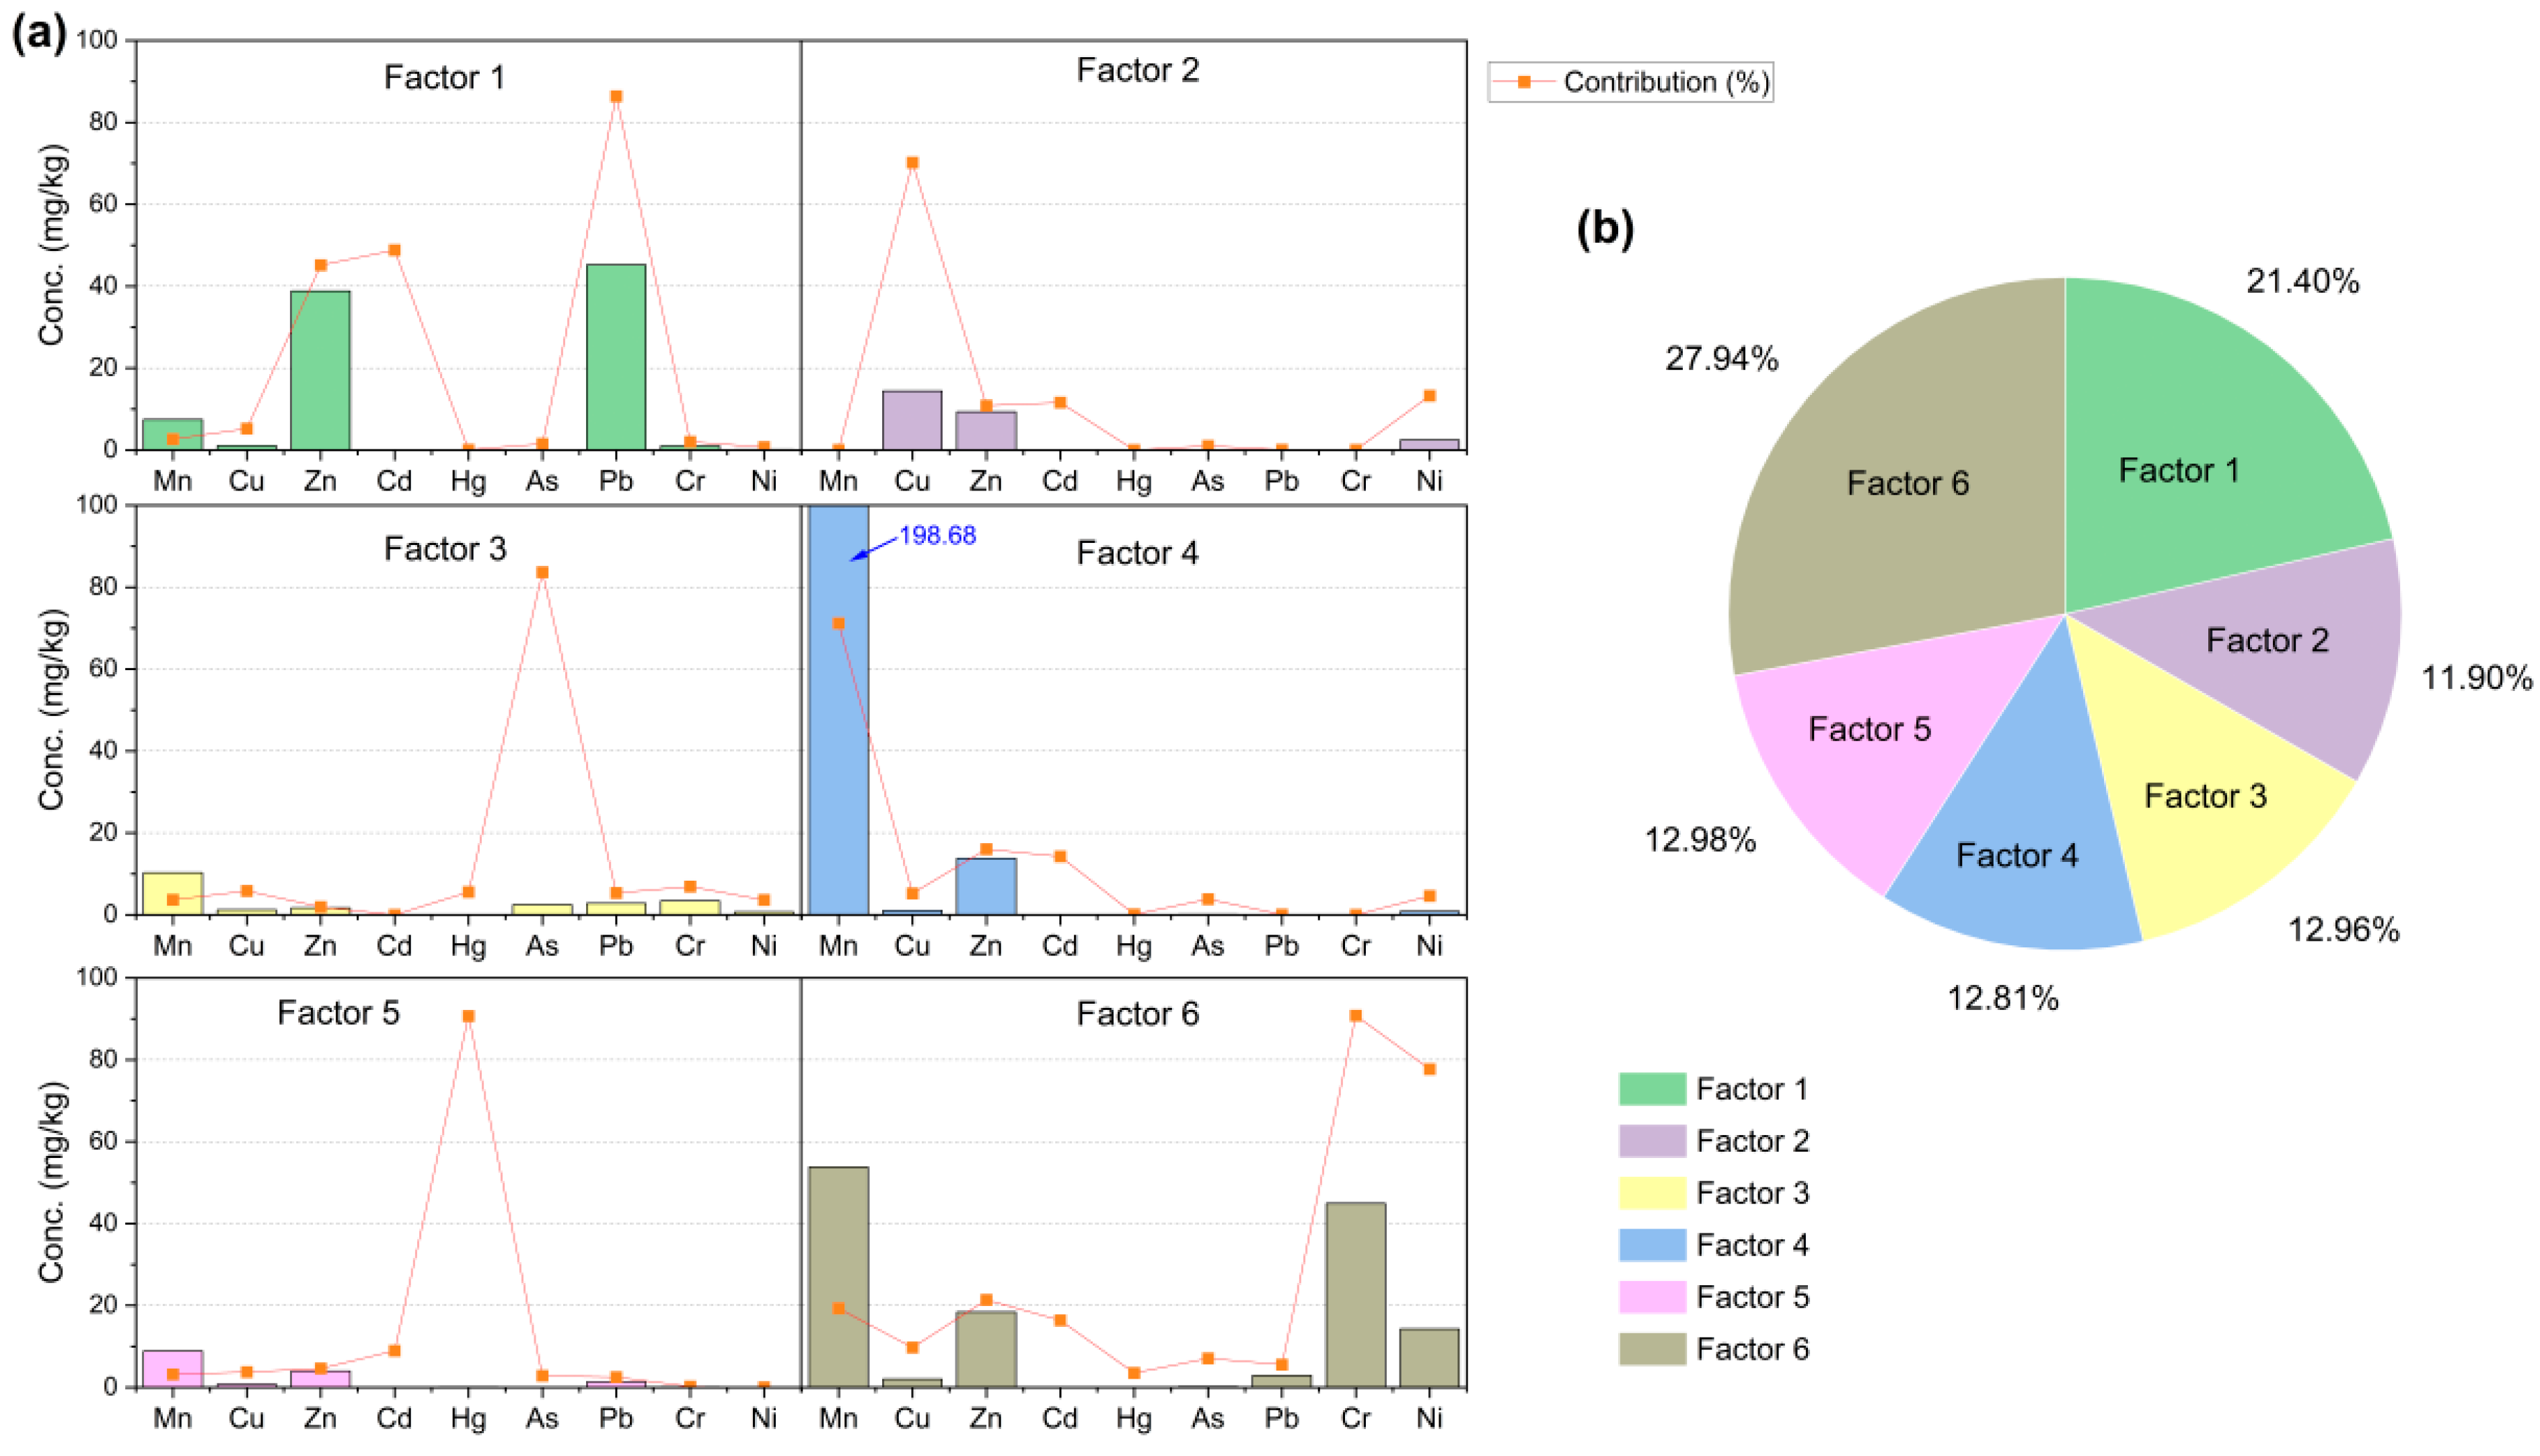
Based on the PMF model, a total of six comprehensive factors were identified as the sources of metal pollution (Figure 7). Factors 6, 1, 5, and 3 together accounted for 75.28% of the total source, with their respective contributions of 27.94%, 21.40%, 12.98%, and 12.96%. The main contributors for each factor were: Pb (86.40%), Cu (70.21%), As (83.68%), Mn (71.18%), and Hg (90.68%) for factors 1–5, respectively, while Cr (90.78%) and Ni (77.71%) contributed more to factor 6.
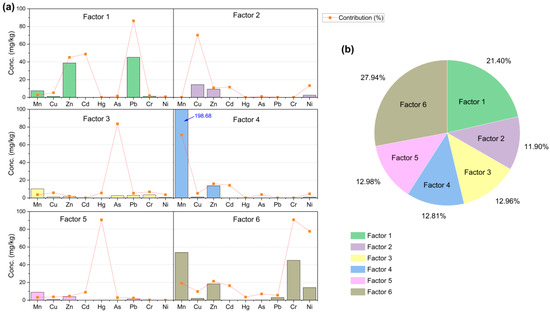
Figure 7.
Source profiles apportionment by positive matrix factorization (PMF) model. (a) Source profiles and contributions of the soil heavy metal. (b) Source contributions of the soil heavy metal.
Mantel test revealed that most soil heavy metal concentrations exhibited significant positive correlations (p ≤ 0.05; Table 3). The strongest relationship was found between Cr and Ni (r = 0.937, p < 0.01). Additionally, soil pH showed positive correlations with Cr and Ni, while TOC and nutrients were positively correlated with Mn, Cu, As, Cr, and Ni. Clay content exhibited positive correlations with Mn, Cu, and Pb (p ≤ 0.05).
Table 3.
Correlation coefficients between soil heavy metal concentrations and physicochemical properties in the mantel test. Nutrition includes total and available nitrogen (N), phosphorus (P), and potassium (K). *, p ≤ 0.05; **, p < 0.01.
4. Discussion
4.1. Vegetation-Mediated Heavy Metal Accumulation and Spatial Distribution
Through systematic analysis of 2409 soil samples from Mount Wuyi, we identify Mn and Zn as the most abundant HMs in the soil, but with relatively low pollution and ecological risk. This highlights the limitations of relying solely on single-element concentration indicators for HM assessment. Study areas typically exhibit composite pollution from multiple HMs [33], indicating the need to comprehensively assess HM accumulation by combining their chemical forms and ecological thresholds. The strong chemical stability of Mn [34] and the influence of soil parent material on Zn levels [35] explain the low ecological risk of these metals in Mount Wuyi.
In contrast, Cr, Cd, and Pb show significant enrichment. In particular, the concentrations of Cr and Pb are significantly higher than the background values. EF and Igeo values confirm high pollution levels for these metals [2,3]. Although Hg does not rank among the top three in terms of concentration or pollution level, its ecological risk index is second only to Cd, underscoring its significant ecological toxicity. Given the health and ecological risks posed by Cr, Cd, Pb, and Hg [2,36], future efforts should prioritize tracing and mitigating these metals, with a focus on understanding their transformation and migration mechanisms [2].
Importantly, vegetation significantly influences the distribution and pollution of HMs. Cultivated areas (including farmland and orchards) and shrublands (including tea gardens) exhibit the highest concentrations and EF values of Cr, Cd, Pb, and Hg. These vegetation types are located in areas with intensive human activity. Studies show that Cd, Hg, and Cu primarily originate from fertilizer and pesticide applications [37], with elevated Cu concentrations observed in agricultural soils and sediments [38,39]. Pb accumulation, on the other hand, is linked to vehicle exhaust, tire wear, and industrial emissions [40,41]. Thus, the enrichment of Cr, Cd, Pb, and Hg in cultivated and shrublands can be attributed to agricultural non-point source pollution and traffic emissions.
Among all vegetation types, shrublands have the highest Pb, Cr, and Ni concentrations, and EF values of Cd, Cr, and Ni. However, this is inconsistent with the results from Igeo. The inconsistency is because EF focuses on local enrichment, whereas Igeo reflects broader geographical accumulation [42]. Given the concentrated distribution of shrublands, this study prioritizes EF results, emphasizing its sensitivity to Cd, Cr, Ni, and Pb enrichment. Tea gardens, famous in Mount Wuyi, are located at urban edges (Figure 1). The dual pressure from industrial and traffic factors causes their enrichment of Cd, Cr, Ni, and Pb [41,43,44]. Since the shallow roots of shrubs increase the accumulation of pollutants in surface soil [45] and the transport of pollutants to water bodies through runoff [46], these potential threats to the quality and safety of Wuyi tea are also worth noting.
However, bamboo forests exhibit resistance to HM contamination, particularly for As, Cd, and Cr. This resistance may be linked to rhizosphere organic acids. Studies show that hyperaccumulators like Pteris vittata release organic acids to solubilize insoluble arsenic compounds, promoting As uptake [47]. Similar mechanisms for Cd reduction via root exudates are also documented in other plants [48]. Nevertheless, Igeo for Mn increases with vegetation type. Since Mn in soil mainly comes from the weathering of parent materials [49], our results reflect the combined effects of parent material weathering and human activities.
Additionally, the correlation between soil properties and HMs such as Cu, As, Cr, and Ni, suggests that vegetation can indirectly influence HM accumulation by altering soil conditions. Specifically, soil pH, organic matter, and clay content critically affect the migration and distribution of HM. For example, acidic conditions enhance the solubility of certain HMs, while organic matter can reduce their bioavailability by forming stable metal–organic complexes [50]. Clay minerals, on the other hand, act as adsorbents, immobilizing HMs from soil solutions [51]. Furthermore, plants influence soil properties through root activity, indirectly affecting HM accumulation. The organic acids released by roots can lower soil pH, increasing the solubility and mobility of specific HMs [52]. These interactions highlight the intricate relationship between vegetation, soil properties, and the dynamics of HMs.
4.2. Ecological Risk Assessment and Source Apportionment of Heavy Metals
Unlike pollution levels, the comprehensive ecological risks of HMs do not vary significantly across vegetation types, and the region exhibits low ecological risk. However, localized risks in broad-leaved and bamboo forests warrant focused monitoring. On the other hand, Cd and Hg exhibit the highest ecological risks among all HMs, with moderate or higher risk levels distributed across all vegetation types. As Cd and Hg pose a threat to human health through their biomagnification effects in the food chain and deposition [2,36], this again draws attention to the need for their control. Conversely, Pb and Cr risks show spatial heterogeneity, concentrated in shrublands and broad-leaved forests, likely due to localized pollution from transportation and industrial activities.
Four main factors are identified from the PMF modeling as the main sources of soil HMs in Mount Wuyi (Figure 7): urbanization (factor 6, 27.94%), transport–agriculture activities (factor 1, 21.40%), agricultural practices (factor 5, 12.98%), and atmospheric deposition (factor 3, 12.96%). For factor 6, Cr and Ni contribute the most. The strong correlation between Cr and Ni suggests a common pollution source (Table 3). Although Cr and Ni are typically considered geochemical elements, they can also coexist in industrial waste from cement production and metal smelting [43,53], with additional Ni contributions from mining, fossil fuel combustion, and pesticide use [54,55]. The Cr concentration in this study significantly exceeded the background value, indicating a non-natural origin. Furthermore, the elevated Cr and Ni levels observed in shrublands and urban areas, which are characterized by industrial and transportation activities, strongly suggest that factor 6 is closely associated with urbanization. Pb is the primary contributor to factor 1, indicating mixed pollution from transportation and agriculture. Pb originates mainly from vehicle emissions, tire wear, fuel additives, and phosphate fertilizers [56]. Studies confirm that traffic-related activities cause Pb accumulation in roadside soils [41], supported by our elevated Pb levels in cultivated and shrublands near railways, highways, and airports. Similarly, Hg, the main contributor to factor 5, stems largely from agricultural activities. Approximately 90% of global Hg emissions are anthropogenic [57], resulting in significant Hg accumulation in soils of cultivated regions. Given the volatile nature of Hg, Henry’s law [58] enhances its uptake by plants, highlighting the need for vigilance against Hg pollution, particularly in crop-growing regions.
In addition, factor 3 corresponds to As, mainly derived from atmospheric deposition. Notably, coniferous forests demonstrate the highest As concentrations and pollution levels among the studied ecosystems. This phenomenon can be attributed to several interconnected factors. Firstly, As undergoes long-range transport in its gaseous form, subsequently accumulating through secondary precipitation after canopy interception [59]. Secondly, the environmental conditions in coniferous forests further amplify this process; their acidic soils enhance As solubility, while the combination of high-altitude distribution and substantial precipitation significantly intensifies As wet deposition. Field investigations have identified that industrial and mining operations in these areas emit As-containing gases, which subsequently enter the soil via atmospheric deposition.
4.3. Mitigation Strategies and Future Research Directions
Based on the spatial differentiation and driving mechanisms of HM pollution in Mount Wuyi, we suggest building a coordination framework of “policy regulation, ecological restoration, and technical support”. At the policy level, targeted measures should address Cr/Ni (factor 6) and Pb (factor 1) pollution. First, accelerate the optimization of energy structure and promote clean energy to reduce Cr/Ni emissions. Second, construct reasonable buffer zones along traffic arteries, balancing pollution interception and potential negative impacts of vegetation [60,61]. Organic fertilizer policies could also be adopted to control the input of Pb from phosphate fertilizers.
For ecological restoration, priority should be given to vegetation type classification. Strategies may include: (1) designating broad-leaved and bamboo forests, which have higher ecological risks, as key monitoring areas; (2) exploring the phytoremediation of bamboo forests with hyperaccumulating plants such as P. vittata by utilizing their HM resistance [47]; and (3) targeting the potential accumulation of Cd/Cr/Ni/Pb in shrublands, studying HM migration and detoxification mechanisms, and developing passivation techniques based on tea extracts or nanomaterials.
Although we provide a comprehensive analysis of HM pollution in Mount Wuyi, gaps remain in understanding HM migration, transformation, and source apportionment. Complex sources, including industrial emissions, urban waste, and atmospheric deposition, require further data (e.g., agricultural HM flux, industrial parameters, and meteorological factors) for accurate source quantification. Additionally, HM distribution in forest soils varies with depth due to colloid adsorption, oxide interactions, and redox states [62]. Therefore, further research is needed on the vertical distribution of soil HMs to fully elucidate their behavior in the soil ecosystem.
5. Conclusions
Vegetation significantly influences HM accumulation in Mount Wuyi soils, which are notably enriched with Cr, Cd, and Pb. Cultivated areas and shrublands (tea gardens) are pollution-sensitive due to human activities, while bamboo forests exhibit natural contamination resistance. PMF analysis identifies four main sources: urbanization (27.94%), transport–agriculture activities (21.40%), agricultural practices (12.98%), and atmospheric deposition (12.96%). Ecological risk assessment reveals widespread risks from Cd and Hg requiring comprehensive control, and localized risks from Pb and Cr needing targeted management. This study provides foundational data on HM distribution in this ecologically significant region, offering critical insights for environmental management. Notably, it emphasizes the ecological security of Mount Wuyi as a key tea production area. Our findings underscore the importance of adaptive governance frameworks and zoning-based regulations. Future research may prioritize tea plant detoxification, bamboo phytoremediation, and HM migration pathways to enhance regional ecological security.
Author Contributions
F.W.: writing—review and editing, conceptualization. D.Z.: visualization, formal analysis, data curation. T.Y.: writing—original draft preparation, methodology, data curation. C.M.: data curation, formal analysis. W.H.: data curation. S.Z.: data curation. Y.Y.: writing—original draft, supervision, methodology. All authors have read and agreed to the published version of the manuscript.
Funding
This research was financially supported by the China Geological Survey Project (DD20230479), Natural Science Foundation of China (32001298), and Postgraduate Education and Teaching Reform Project of Hubei University (JGYJS202225).
Data Availability Statement
The data that support the findings of this study are available from the corresponding author upon reasonable request.
Conflicts of Interest
The authors declare that they have no known competing financial interests or personal relationships that could have appeared to influence the work reported in this paper.
References
- Kumar, S.; Gopinath, K.A.; Sheoran, S.; Meena, R.S.; Srinivasarao, C.; Bedwal, S.; Jangir, C.K.; Mrunalini, K.; Jat, R.; Praharaj, C.S. Pulse-based cropping systems for soil health restoration, resources conservation, and nutritional and environmental security in rainfed agroecosystems. Front. Microbiol. 2022, 13, 1041124. [Google Scholar]
- Chen, L.; Luo, X.; He, H.; Duan, T.; Zhou, Y.; Yang, L.; Zeng, Y.; Chen, H.; Fang, L. Hg-mining-induced soil pollution by potentially toxic metal(loid)s presents a potential environmental risk and threat to human health: A global meta-analysis. Soil Ecol. Lett. 2024, 6, 240233. [Google Scholar]
- Hakanson, L. An Ecological Risk Index for Aquatic Pollution Control–A Sedimentological Approach. Water Res. 1980, 14, 975–1001. [Google Scholar]
- Tošić Jojević, S.; Mrvić, V.; Stajković-Srbinović, O.; Jovković, M.; Antić Mladenović, S.; Krpović, M.; Belanović Simić, S. Geochemical Distribution of Ni, Cr, and Co in the Main Soil Types of the Čemernica River Basin in Serbia (In a Serpentine Environment). Land 2024, 13, 2075. [Google Scholar] [CrossRef]
- Bi, R.; Fu, W.; Fu, X. Heavy Metal Spatial Variation Mechanism and Ecological Health Risk Assessment in Volcanic Island Soils: A Case Study of Weizhou Island, China. Land 2025, 14, 35. [Google Scholar]
- Du, W.; Zeng, P.; Yu, S.; Liu, F.; Sun, P.a. Distribution, Risk Assessment, and Quantitative Source Analysis of Soil Heavy Metals in a Typical Agricultural City of East-Central China. Land 2025, 14, 66. [Google Scholar] [CrossRef]
- Zgorelec, Ž.; Šprem, N.; Abramović, R.; Galić, M.; Hrelja, I.; Delač, D.; Safner, T.; Kisić, I. Temporal and Spatial Changes in Soil Quality at Shooting Ranges: A Case Study in Croatia. Land 2025, 14, 78. [Google Scholar] [CrossRef]
- Meng, F.; Liu, D.; Bu, T.; Zhang, M.; Peng, J.; Ma, J. Assessment of pollution and health risks from exposure to heavy metals in soil, wheat grains, drinking water, and atmospheric particulate matter. J. Environ. Manag. 2025, 376, 124448. [Google Scholar]
- Saha, A.; Sen Gupta, B.; Patidar, S.; Hernández-Martínez, J.L.; Martín-Romero, F.; Meza-Figueroa, D.; Martínez-Villegas, N. A comprehensive study of source apportionment, spatial distribution, and health risks assessment of heavy metal(loid)s in the surface soils of a semi-arid mining region in Matehuala, Mexico. Environ. Res. 2024, 260, 119619. [Google Scholar]
- Singh, S.; Maiti, S.K.; Raj, D. An approach to quantify heavy metals and their source apportionment in coal mine soil: A study through PMF model. Environ. Monit. Assess. 2023, 195, 306. [Google Scholar]
- Anaman, R.; Peng, C.; Jiang, Z.C.; Liu, X.; Zhou, Z.R.; Guo, Z.H.; Xiao, X.Y. Identifying sources and transport routes of heavy metals in soil with different land uses around a smelting site by GIS based PCA and PMF. Sci. Total Environ. 2022, 823, 153759. [Google Scholar]
- Shao, F.; Li, K.; Ouyang, D.; Zhou, J.; Luo, Y.; Zhang, H. Sources apportionments of heavy metal(loid)s in the farmland soils close to industrial parks: Integrated application of positive matrix factorization (PMF) and cadmium isotopic fractionation. Sci. Total Environ. 2024, 924, 171598. [Google Scholar] [CrossRef] [PubMed]
- Zhou, H.; Yue, X.; Chen, Y.; Liu, Y. Source-specific probabilistic contamination risk and health risk assessment of soil heavy metals in a typical ancient mining area. Sci. Total Environ. 2024, 906, 167772. [Google Scholar]
- Yang, Y.B.; Zhu, B.Q.; Rehman, A.; Du, Y.Z. A review of Leuctridae (Insecta, Plecoptera) in Wuyi Mountains, China. Biodivers. Data J. 2022, 10, e86735. [Google Scholar] [CrossRef]
- Hu, J.T.; Zheng, Z.L.; Wen, X.Y.; Hu, X.S.; Lin, Y.M.; Li, J.; Ni, J.; Wu, C.Z. Variation in Niche and Interspecific Associations across Elevations in Subtropical Forest Communities of the Wuyi Mountains, Southeastern China. Forests 2024, 15, 1256. [Google Scholar] [CrossRef]
- Chen, J.; Shi, S.; Zhong, X.; Si, Y.; Ma, H.; Gao, R.; Yin, Y. Soil microbial biomass carbon, nitrogen, phosphorus contents and their ecological stoichiometric characteristics along an elevation gradient in the Wuyi Mountains. Chin. J. Ecol. 2024, 43, 2999–3004. [Google Scholar]
- Ahmad, Z.; Khan, S.M.; Page, S.E.; Balzter, H.; Ullah, A.; Ali, S.; Jehangir, S.; Ejaz, U.; Afza, R.; Razzaq, A.; et al. Environmental sustainability and resilience in a polluted ecosystem via phytoremediation of heavy metals and plant physiological adaptations. J. Clean. Prod. 2023, 385, 135733. [Google Scholar]
- Xu, J.Y.; Zheng, L.L.; Xu, L.G.; Wang, X.L. Uptake and allocation of selected metals by dominant vegetation in Poyang Lake wetland: From rhizosphere to plant tissues. Catena 2020, 189, 104477. [Google Scholar]
- Shi, J.; Zhao, D.; Ren, F.; Huang, L. Spatiotemporal variation of soil heavy metals in China: The pollution status and risk assessment. Sci. Total Environ. 2023, 871, 161768. [Google Scholar]
- Ma, J.; Lei, K.; Li, Y.; Zhang, Y.; Li, F.; Xia, F.; Li, Y. Spatiotemporal simulation, early warning, and driving factors of soil heavy metal pollution in a typical industrial city in southeast China. Stoch. Environ. Res. Risk Assess. 2024, 38, 315–337. [Google Scholar]
- HJ/T166-2004; Technical Specification for Soil Environmental Monitoring. Ministry of Ecology and Environment: Beijing, China, 2004.
- Yang, T.; Wu, F.; Luo, M.; Xiong, J.; Nie, X.; Cao, F.; Ruan, Y.; Li, F.; Huang, W.; Liang, T.; et al. Accumulation Pattern and Potential Ecological Risk of Heavy Metals in Topsoil as Affected by Diverse Sources in Different Ecosystems in Western Dabie Mountain. Forests 2024, 15, 1116. [Google Scholar] [CrossRef]
- Yang, X.L.; Zhang, Q.Y.; Li, X.Z.; Jia, X.X.; Wei, X.R.; Shao, M.A. Determination of Soil Texture by Laser Diffraction Method. Soil Sci. Soc. Am. J. 2015, 79, 1556–1566. [Google Scholar]
- Fan, K.; Weisenhorn, P.; Gilbert, J.A.; Shi, Y.; Bai, Y.; Chu, H. Soil pH correlates with the co-occurrence and assemblage process of diazotrophic communities in rhizosphere and bulk soils of wheat fields. Soil Biol. Biochem. 2018, 121, 185–192. [Google Scholar]
- Yaşar Korkanç, S.; Korkanç, M.; Amiri, A.F. Effects of land use/cover change on heavy metal distribution of soils in wetlands and ecological risk assessment. Sci. Total Environ. 2024, 923, 171603. [Google Scholar]
- De Nicola, F.; Maisto, G.; Alfani, A. Assessment of nutritional status and trace element contamination of holm oak woodlands through analyses of leaves and surrounding soils. Sci. Total Environ. 2003, 311, 191–203. [Google Scholar]
- Muller, G. Index of Geoaccumulation in Sediments of the Rhine River. GeoJournal 1969, 2, 109–118. [Google Scholar]
- Xu, Z.; Ni, S.; Tuo, X.; Zhang, C. Calculation of heavy metals’ toxicity coefficient in the evaluation of potential ecological risk index. Environ. Sci. Technol. 2008, 31, 112–115. [Google Scholar]
- GB 15618-1995; Environmental Quality Standard for Soils. Ministry of Ecology and Environment: Beijing, China, 1995.
- Paatero, P. Least squares formulation of robust non-negative factor analysis. Chemom. Intell. Lab. Syst. 1997, 37, 23–35. [Google Scholar]
- Paatero, P.; Tapper, U. Positive matrix factorization: A non-negative factor model with optimal utilization of error estimates of data values. Environmetrics 1994, 5, 111–126. [Google Scholar]
- China National Environmental Monitoring Centre. Background Values of Chinese Soil Elements; China Environmental Science Press: Beijing, China, 1990. [Google Scholar]
- Oyebamiji, A.O.; Olaolorun, O.A.; Popoola, O.J.; Zafar, T. Assessment of heavy metal pollution in soils of Jebba Area, Nigeria: Concentrations, source analysis and implications for ecological and human health risks. Sci. Total Environ. 2024, 945, 173860. [Google Scholar]
- Chu, X.; Ma, Z.; Wu, D.; Wang, H.; He, J.; Chen, T.; Zheng, Z.; Li, H.; Wei, P. High Fe and Mn groundwater in the Nanchang, Poyang Lake Basin of China: Hydrochemical characteristics and genesis mechanisms. Environ. Monit. Assess. 2022, 195, 124. [Google Scholar]
- Han, R.; Liu, W.; Xu, Z. The constraint of soil Zn isotope compositions by diverse land utilizations: Evidence from geochemical fingerprint in a typical karst area. Catena 2024, 240, 108005. [Google Scholar]
- Peana, M.; Pelucelli, A.; Chasapis, C.T.; Perlepes, S.P.; Bekiari, V.; Medici, S.; Zoroddu, M.A. Biological Effects of Human Exposure to Environmental Cadmium. Biomolecules 2023, 13, 36. [Google Scholar]
- Komárek, M.; Čadková, E.; Chrastný, V.; Bordas, F.; Bollinger, J.C. Contamination of vineyard soils with fungicides: A review of environmental and toxicological aspects. Environ. Int. 2010, 36, 138–151. [Google Scholar]
- Marrugo-Negrete, J.; Pinedo-Hernández, J.; Díez, S. Assessment of heavy metal pollution, spatial distribution and origin in agricultural soils along the Sinú River Basin, Colombia. Environ. Res. 2017, 154, 380–388. [Google Scholar]
- Palacios-Torres, Y.; de la Rosa, J.D.; Olivero-Verbel, J. Trace elements in sediments and fish from Atrato River: An ecosystem with legal rights impacted by gold mining at the Colombian Pacific. Environ. Pollut. 2020, 256, 113290. [Google Scholar]
- Yan, G.; Mao, L.; Liu, S.; Mao, Y.; Ye, H.; Huang, T.; Li, F.; Chen, L. Enrichment and sources of trace metals in roadside soils in Shanghai, China: A case study of two urban/rural roads. Sci. Total Environ. 2018, 631–632, 942–950. [Google Scholar]
- Chen, T.; Chang, Q.; Liu, J.; Clevers, J.G.P.W.; Kooistra, L. Identification of soil heavy metal sources and improvement in spatial mapping based on soil spectral information: A case study in northwest China. Sci. Total Environ. 2016, 565, 155–164. [Google Scholar]
- Reimann, C.; Fabian, K.; Flem, B.; Englmaier, P. The large-scale distribution of Cu and Zn in sub- and topsoil: Separating topsoil bioaccumulation and natural matrix effects from diffuse and regional contamination. Sci. Total Environ. 2019, 655, 730–740. [Google Scholar]
- Du, H.; Wang, J.; Wang, Y.; Yao, Y.; Liu, X.; Zhou, Y. Contamination characteristics, source analysis, and spatial prediction of soil heavy metal concentrations on the Qinghai-Tibet Plateau. J. Soils Sediments 2023, 23, 2202–2215. [Google Scholar]
- Sharifi, S.A.; Zaeimdar, M.; Jozi, S.A.; Hejazi, R. Effects of Soil, Water and Air Pollution with Heavy Metal Ions Around Lead and Zinc Mining and Processing Factories. Water Air Soil Pollut. 2023, 234, 760. [Google Scholar]
- Wang, S.F.; Du, Z.Y.; Shi, X.; Chen, Y.T.; Chen, G.C. Linking root traits to phytoremediation in trees and shrubs: Implications of root economics spectrum. J. Appl. Ecol. 2024, 61, 249–259. [Google Scholar]
- Taka, M.; Sillanpää, N.; Niemi, T.; Warsta, L.; Kokkonen, T.; Setälä, H. Heavy metals from heavy land use? Spatio-temporal patterns of urban runoff metal loads. Sci. Total Environ. 2022, 817, 152855. [Google Scholar]
- Fu, J.W.; Liu, X.; Han, Y.H.; Mei, H.Y.; Cao, Y.; de Oliveira, L.M.; Liu, Y.G.; Rathinasabapathi, B.; Chen, Y.S.; Ma, L.Q. Arsenic-hyperaccumulator Pteris vittata efficiently solubilized phosphate rock to sustain plant growth and As uptake. J. Hazard. Mater. 2017, 330, 68–75. [Google Scholar]
- Qin, S.M.; Zhang, H.Y.; He, Y.H.; Chen, Z.J.; Yao, L.G.; Han, H. Improving radish phosphorus utilization efficiency and inhibiting Cd and Pb uptake by using heavy metal-immobilizing and phosphate-solubilizing bacteria. Sci. Total Environ. 2023, 868, 161685. [Google Scholar]
- Shi, G.; Wang, X.; Wang, W.; Liu, D.; Liu, Q.; Zhou, J.; Chi, Q.; Liu, H. Nation-wide concentration and spatial distribution of manganese with links to manganese mineralization in China. J. Geochem. Explor. 2023, 244, 107130. [Google Scholar]
- Gao, S.; Walker, W.J.; Dahlgren, R.A.; Bold, J. Simultaneous Sorption of Cd, Cu, Ni, Zn, Pb, and Cr on Soils Treated with Sewage Sludge Supernatant. Water Air Soil Pollut. 1997, 93, 331–345. [Google Scholar]
- Bradl, H.B. Adsorption of heavy metal ions on soils and soils constituents. J. Colloid Interface Sci. 2004, 277, 1–18. [Google Scholar]
- Angon, P.B.; Islam, M.S.; Kc, S.; Das, A.; Anjum, N.; Poudel, A.; Suchi, S.A. Sources, effects and present perspectives of heavy metals contamination: Soil, plants and human food chain. Heliyon 2024, 10, e28357. [Google Scholar]
- Guria, M.K.; Guha, A.K.; Bhattacharyya, M. A green chemical approach for biotransformation of Cr(VI) to Cr(III), utilizing Fusarium sp. MMT1 and consequent structural alteration of cell morphology. J. Environ. Chem. Eng. 2014, 2, 424–433. [Google Scholar]
- Banerjee, S.; Ghosh, S.; Jha, S.; Kumar, S.; Mondal, G.; Sarkar, D.; Datta, R.; Mukherjee, A.; Bhattacharyya, P. Assessing pollution and health risks from chromite mine tailings contaminated soils in India by employing synergistic statistical approaches. Sci. Total Environ. 2023, 880, 163228. [Google Scholar] [CrossRef] [PubMed]
- Luo, X.; Bing, H.; Luo, Z.; Wang, Y.; Jin, L. Impacts of atmospheric particulate matter pollution on environmental biogeochemistry of trace metals in soil-plant system: A review. Environ. Pollut. 2019, 255, 113138. [Google Scholar] [CrossRef] [PubMed]
- Lough, G.C.; Schauer, J.J.; Park, J.S.; Shafer, M.M.; Deminter, J.T.; Weinstein, J.P. Emissions of metals associated with motor vehicle roadways. Environ. Sci. Technol. 2005, 39, 826–836. [Google Scholar] [CrossRef] [PubMed]
- Kung, H.C.; Wu, C.H.; Huang, B.W.; Chang-Chien, G.P.; Mutuku, J.K.; Lin, W.C. Mercury abatement in the environment: Insights from industrial emissions and fates in the environment. Heliyon 2024, 10, e28253. [Google Scholar] [CrossRef]
- Andersson, M.E.; Gårdfeldt, K.; Wängberg, I.; Strömberg, D. Determination of Henry’s law constant for elemental mercury. Chemosphere 2008, 73, 587–592. [Google Scholar] [CrossRef]
- Petrash, D.A.; Novák, M.; Bohdálková, L.; Krachler, M.; Curík, J.; Veselovsky, F.; Stepánová, M.; Umbría-Salinas, K.; Prechová, E.; Komárek, A. Winter arsenic pollution in 10 forest ecosystems in the mountainous border regions of the Czech Republic. Environ. Sci. Pollut. Res. 2021, 28, 16107–16121. [Google Scholar] [CrossRef]
- Abhijith, K.V.; Kumar, P. Quantifying particulate matter reduction and their deposition on the leaves of green infrastructure. Environ. Pollut. 2020, 265, 114884. [Google Scholar] [CrossRef]
- Karttunen, S.; Kurppa, M.; Auvinen, M.; Hellsten, A.; Järvi, L. Large-eddy simulation of the optimal street-tree layout for pedestrian-level aerosol particle concentrations–A case study from a city-boulevard. Atmos. Environ. X 2020, 6, 100073. [Google Scholar] [CrossRef]
- Hahn, J.; Mann, B.; Bange, U.; Kimmel, M. Horizon-specific effects of heavy metal mobility on nitrogen binding forms in forest soils near a historic smelter (Germany). Geoderma 2019, 355, 113895. [Google Scholar] [CrossRef]
Disclaimer/Publisher’s Note: The statements, opinions and data contained in all publications are solely those of the individual author(s) and contributor(s) and not of MDPI and/or the editor(s). MDPI and/or the editor(s) disclaim responsibility for any injury to people or property resulting from any ideas, methods, instructions or products referred to in the content. |
© 2025 by the authors. Licensee MDPI, Basel, Switzerland. This article is an open access article distributed under the terms and conditions of the Creative Commons Attribution (CC BY) license (https://creativecommons.org/licenses/by/4.0/).