Article

Heavy Metal(oid)s in Soil–Tea System: Sources, Bioaccumulation, and Risks in Eastern Dabie Mountain

1
Changsha General Survey of Natural Resources Center, China Geological Survey, Changsha 410600, China
2
Hubei Key Laboratory of Regional Development and Environmental Response, Faculty of Resources and Environmental Sciences, Hubei University, Wuhan 430062, China
*
Authors to whom correspondence should be addressed.
These authors contributed equally to this work.
Land 2025, 14(6), 1269; https://doi.org/10.3390/land14061269
Submission received: 9 May 2025 / Revised: 28 May 2025 / Accepted: 10 June 2025 / Published: 12 June 2025

Abstract

:
Yuexi County, a key tea-producing area in eastern Dabie Mountain, may face potential heavy metal(oid) (HM) contamination risks due to nearby mining and intensive agricultural activities. This study investigated seven HMs (As, Cd, Cr, Hg, Ni, Pb, and Zn) in paired soil–tea samples using multiple analytical approaches, including the geoaccumulation index (Igeo), the potential ecological risk index (RI), bioconcentration factor (BCF), and positive matrix factorization (PMF) with Monte Carlo simulation for health risk assessment. Results showed that Zn (82.65 mg/kg) and Cd (0.15 mg/kg) were the most enriched HMs in soils with higher Igeo values than other HMs. PMF analysis identified four major HM sources: mining and transportation (27.75%), agricultural activities (26.90%), natural soil parent material (26.17%), and industrial emissions (19.18%). Tea plants exhibited selective HM absorption, with Hg showing the highest bioaccumulation (BCF = 0.45), while As, Cr, and Pb had minimal uptake (BCF < 0.05). Although health risk assessments confirmed that both non-carcinogenic and carcinogenic risks from soil and tea consumption were within safe limits for adults and children, Cr and Ni required special attention due to their risk contributions. Overall, ecological and health risks in the region were found to be low. These findings provide important scientific support for pollution monitoring, risk management, and overcoming trade barriers in tea-growing regions with acidic soils. Future research should integrate HM speciation analysis with seasonal monitoring to further optimize tea plantation management strategies.

1. Introduction

Heavy metal(oid) (HM) pollution in soils has emerged as a critical global environmental concern, posing substantial risks to ecosystem stability and human health [1]. These persistent contaminants, characterized by their toxicological properties and bioaccumulation potential, readily enter food chains through biogeochemical cycling [2]. The interdisciplinary nature of HM research now encompasses toxicology, public health policy, and environmental remediation, with recent methodological advances significantly advancing the field. Notably, the integration of spatial analysis techniques with established risk assessment tools—particularly the combined application of Hakanson’s potential ecological risk index [3] and the geoaccumulation index [4,5,6]—has proven effective in characterizing HM distribution patterns across various ecosystems, including mining and agricultural areas. Furthermore, the US EPA-certified Positive Matrix Factorization (PMF) model has become an indispensable tool for quantitative source apportionment [7,8,9].
As a globally significant economic crop, tea plants (Camellia sinensis) accumulate HMs primarily through soil uptake, with additional contributions from atmospheric deposition, irrigation, and processing activities. Excessive HM exposure can severely impact tea plant physiology, causing chloroplast ultrastructure damage, cellular morphological alterations, and disruptions in polyphenol biosynthesis [10]. While previous studies have examined HM accumulation and transfer mechanisms in soil–tea systems [11,12], critical knowledge gaps remain regarding regional pollution heterogeneity, multi-source input dynamics, and pathway-specific health risks. Particularly concerning is the pH-mediated activation of HMs in acidic soils, which may substantially enhance their bioavailability [13]. This aspect has been underestimated in current risk assessment paradigms.
The eastern Dabie Mountains represent China’s premier tea production base, with Yuexi County serving as both a characteristic tea-growing region and a cornerstone of the local agricultural economy. Tea gardens in this region typically occupy acidic yellow soils at elevations of 500–800 m. While these unique edaphic conditions contribute to superior tea quality, the proximity to mineral resources and intensive agricultural activities introduces significant HM contamination risks. Mountainous microclimates may also further exacerbate pollutant migration and accumulation processes. Compounding these challenges, the implementation of stringent EU standards (EC No. 2023/915) in 2023 has created substantial trade barriers, with Chinese tea exports frequently rejected due to excessive As and Cd concentrations. These developments underscore the urgent need for a comprehensive investigation of HM distribution characteristics, source apportionment, and health risk assessment in soil–tea systems. Such research will not only ensure tea quality and safety but also support industry sustainability and international trade compliance.
To address these critical issues, this study employs a comprehensive analytical framework incorporating the geoaccumulation index (Igeo), the potential ecological risk index (Ei), the bioconcentration factor (BCF), and PMF modeling to examine seven HMs (As, Cd, Cr, Hg, Ni, Pb, and Zn) in paired soil–tea samples from Yuexi County. Our specific objectives are to (1) elucidate interfacial migration dynamics and ecological risks of the HMs in the soil–tea system; (2) quantitatively apportion HM sources; and (3) assess health risks through Monte Carlo simulation of soil exposure and tea consumption pathways. The findings will provide actionable insights for region-specific tea garden management, facilitate EU trade barrier mitigation, and establish methodological benchmarks for global tea-producing regions with acidic soils.

2. Materials and Methods
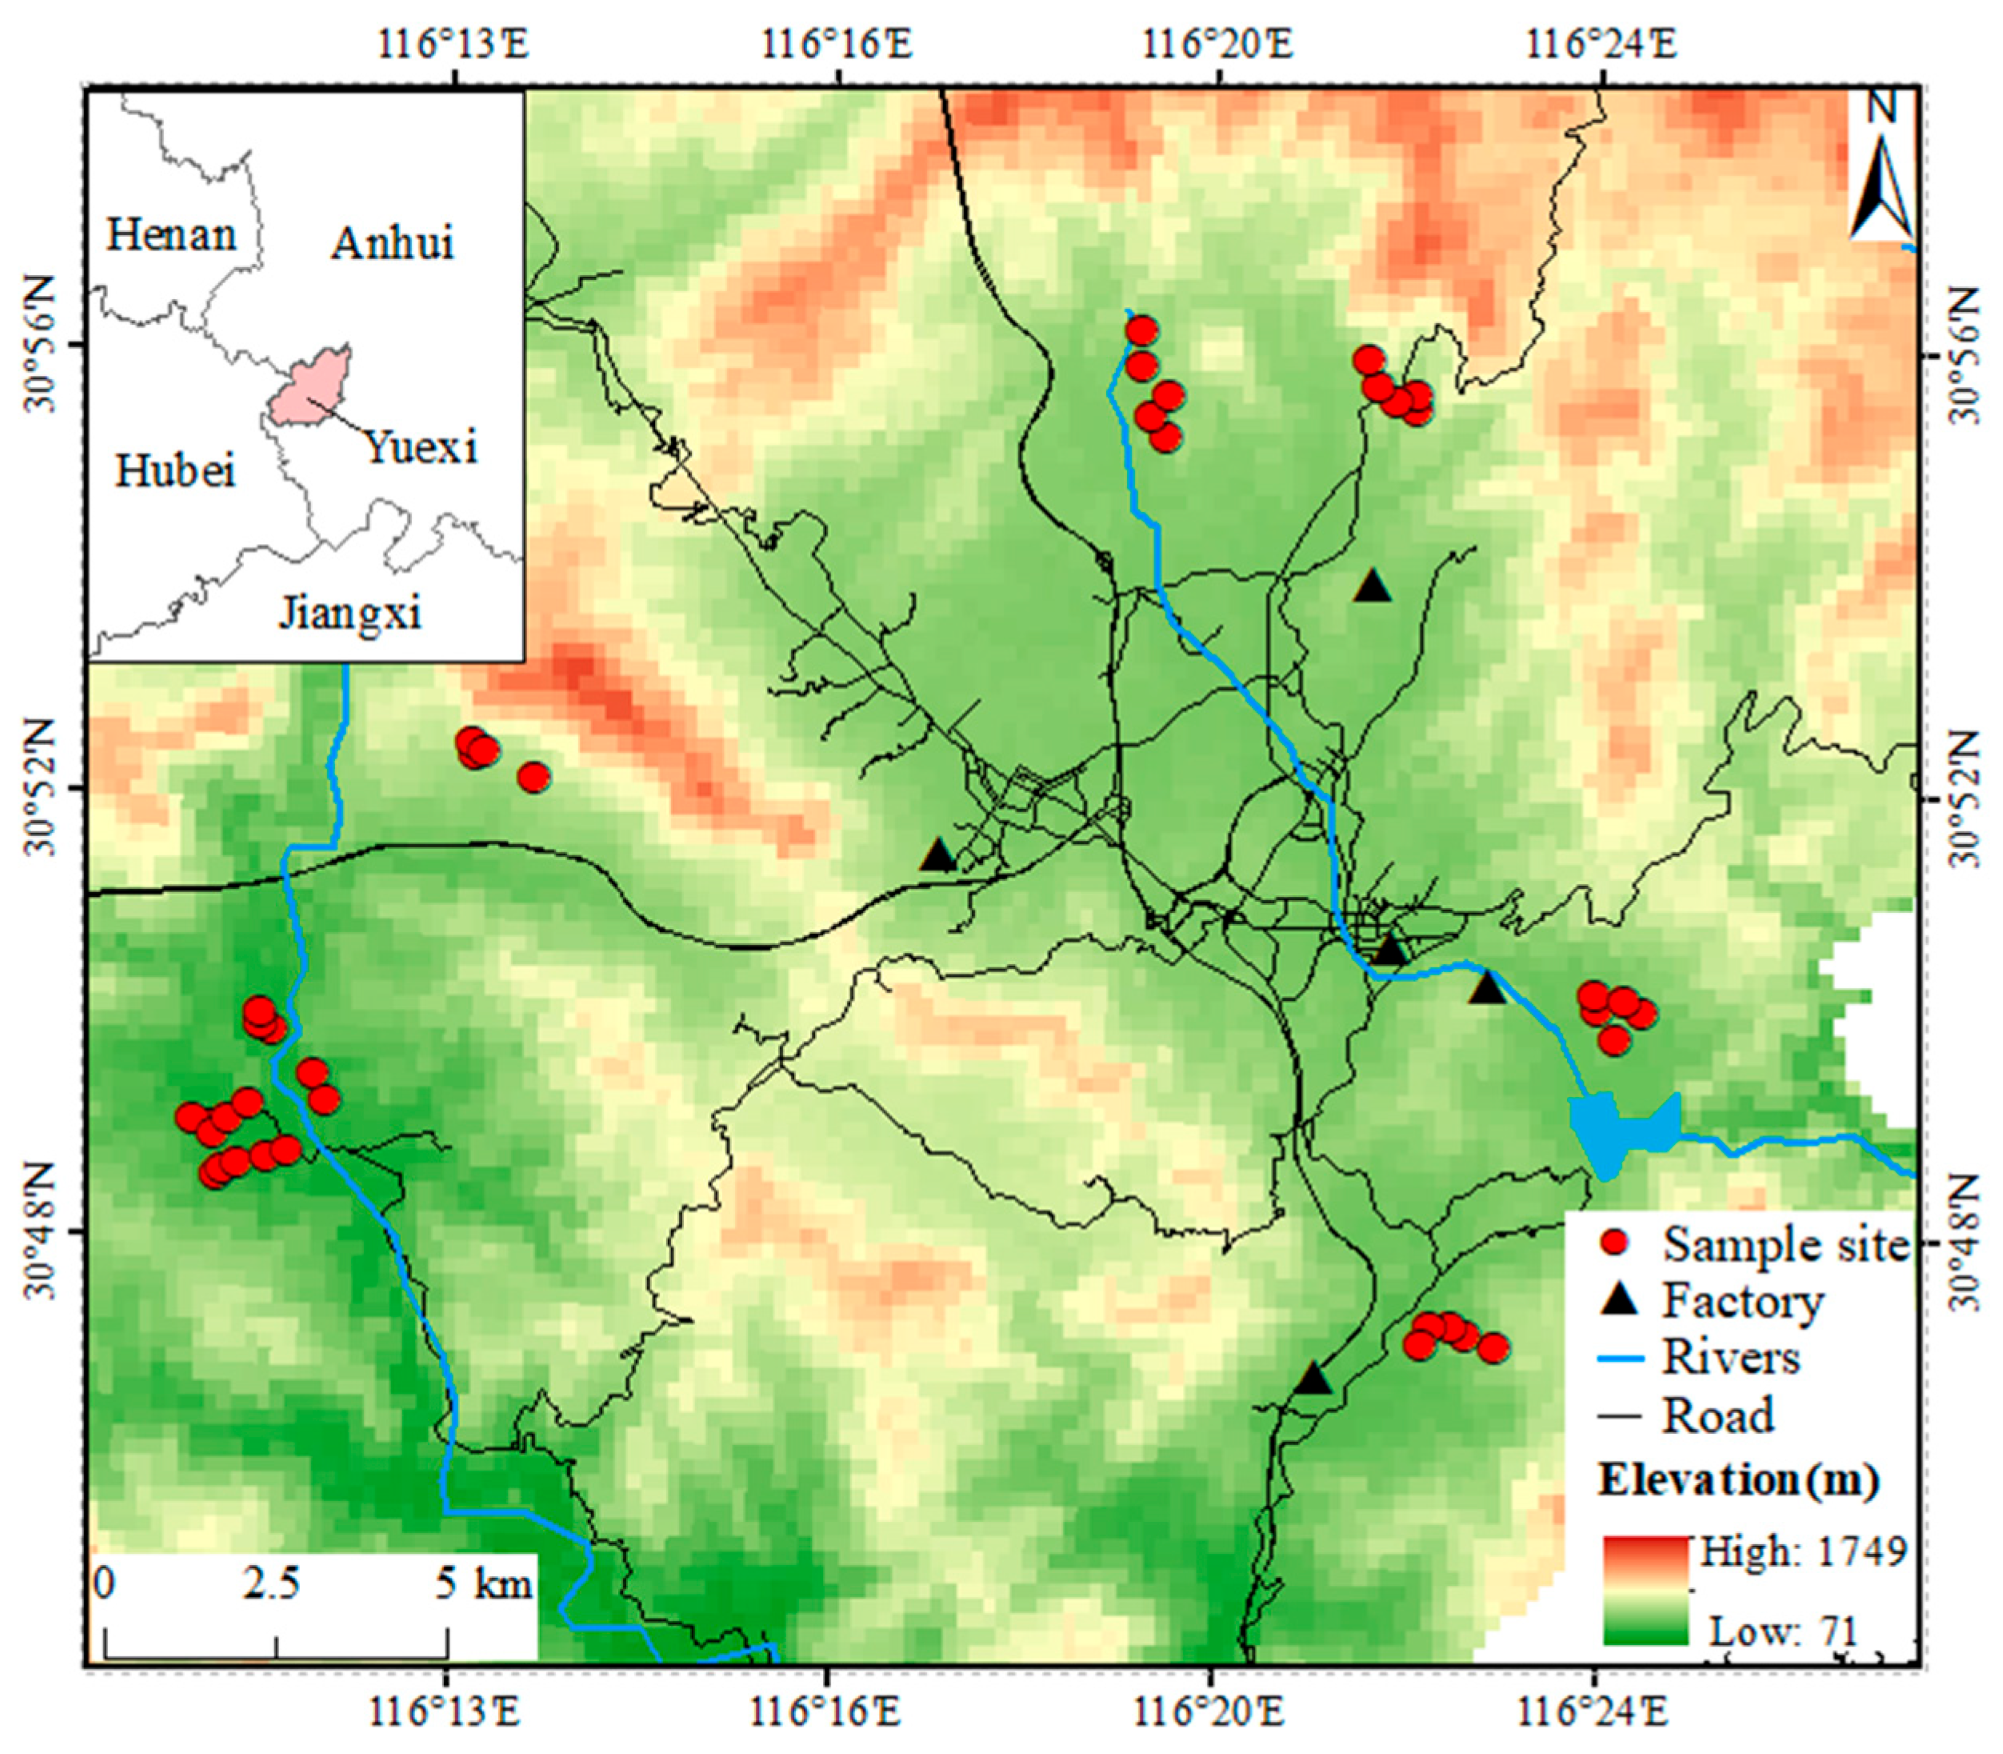
2.1. Study Area

The study area encompasses Yuexi County (30°39′–31°11′ N, 115°50′–116°33′ E) in Anhui Province, China (Figure 1). It is located in the southeastern foothills of the Dabie Mountain. The region features hilly terrain with an average elevation of 600 m and a distinct northwest-to-southeast topographic gradient. Characterized by a northern subtropical monsoon climate, the area experiences mean annual temperature and precipitation of 14.5 °C and 1400 mm, respectively. These conditions, combined with significant diurnal temperature variations and acidic yellow-brown soils (pH 3.7–7.8), create optimal conditions for tea cultivation on gentle slopes. The local environment is further defined by the presence of iron, copper, and lead–zinc mineral resources while remaining relatively free from significant industrial pollution.

2.2. Sample Collection and Preparation

Sampling was conducted within a 1 km radius of large-scale tea gardens using a combination of grid and random methods. Within the study area, large-scale tea gardens are predominantly distributed along rivers (Figure 1). To ensure spatial representativeness of sampling sites, soil, and plant samples were systematically collected from all major tea gardens to comprehensively assess the bioaccumulation and risks of HMs. During June–August 2024 (peak growing season with active root systems and intensive agricultural activities), we collected paired topsoil (0–20 cm) and mature tea leaf samples. The topsoil layer was selected because it (1) represents the primary interface between human activities and plant roots; (2) serves as the initial sink for atmospheric deposition and agricultural inputs; and (3) shows the greatest accumulation of Pb, Cd, and Hg due to their limited vertical mobility.
Each composite soil sample consisted of five subsamples homogenized in the field, while tea samples were collected from current-year healthy leaves adjacent to sampling points. A total of 40 soil–tea pairs were obtained. Soil samples were air-dried, sieved (100 mesh) after removing gravel and roots, while tea leaves were washed with deionized water, oven-dried at 60 °C, and ground.
Heavy metal(oid) concentrations (As, Cd, Cr, Hg, Ni, Pb, and Zn) in both soil and tea leaf samples were determined following Chinese standards, including “Soil environmental quality—Risk control standard for soil contamination of agricultural land” [14] and “National food safety standards for tea” [15]. The concentrations of HMs except for As and Hg were determined by using inductively coupled plasma mass spectrometry (ICP-MS). The concentrations of As and Hg were determined using an atomic fluorescence spectrophotometer. Before measuring, we fully digested the soil samples with HNO3-HCl-HF, while the tea samples were microwave-digested with HNO3-H2O2. The detection limits for As, Cd, Cr, Hg, Ni, Pb, and Zn were 0.05, 0.02, 2, 0.0003, 1, 1, and 2 mg/kg, respectively. To ensure analytical precision and accuracy, quality control measures included the analysis of three blank samples and three replicate samples for error assessment. Furthermore, four standard reference materials (National Grade-1 soil standards) were incorporated per batch of 20 samples for quality assurance purposes. The qualification rate of parallel test and standard reference material was >90% and >98%, respectively.

2.3. Pollution Assessment

We employed multiple indices to assess HM contamination in soil and tea leaves. The Igeo, originally proposed by Müller [16], was used to evaluate soil pollution levels [6,17,18]. For ecological risk assessment, we applied Hakanson’s potential ecological risk index (Ei) for individual HMs and the composite risk index (RI) for multiple HMs [3,19]. This integrated approach considers contaminant type, concentration, and toxicity, providing a robust framework for environmental risk evaluation. The indices were calculated using established methods [2,3,16]:
I g e o = l o g 2 [ C i / k × B i ]
E i = T i × C i B i
RI   = i = 1 n E i
where Ci and Bi represent measured and background concentrations (from “Background values of Chinese soil elements” [20]), k is a correction factor (=1.5) [21], and Ti represents the toxicological coefficient (As = 10, Cd = 30, Cr = 2, Hg = 40, Ni = 5, Pb = 5, Zn = 1) [3,22]. Pollution levels were classified into seven categories for Igeo and five categories for Ei and RI from low to high (Table A1).
The single-factor pollution index (PI) was employed to assess HM contamination in tea leaves, calculated as the ratio of the measured concentration of HM i to its corresponding standard value. These standard values were derived from Chinese Food Standards [15,23,24], with PI ≤ 1 indicating a safe level. Additionally, the bioconcentration factor (BCF)—defined as the ratio of HM concentration in plants to that in the soil—was used to evaluate the tea plant’s capacity for HM accumulation.
To further identify and quantify potential HM sources, the PMF model was applied. This advanced receptor model utilizes a three-dimensional decomposition framework, integrating concentration data with source profiles through an iterative optimization process. The model effectively resolves mixed environmental samples into distinct source contributions while accounting for measurement uncertainties [25].

2.4. Health Risk Assessment

The US EPA model [26] was used to evaluate HM health risks (carcinogenic and non-carcinogenic) in adults and children. Three exposure pathways were evaluated: ingestion (ing), oral–nasal inhalation (inh), and dermal exposure (der). Average daily intake (ADD) was calculated for each pathway as follows:
A D D i n g = C i × R i n g × E F × E D B W × A T 10 6
A D D i n h = C i × R i n h × E F × E D P E F × B W × A T
A D D d e r = C i × A F × S A × A B S × E F × ED B W × A T × 10 6
where Ci is the HM concentration, and the remaining parameters are defined in Table A2. Non-carcinogenic (HI) and carcinogenic (CR) risks were calculated as follows:
H I i = A D D i R f D i
T H I = H I i = H I i n g + H I i n h + H I d e r
C R i = A D D i × S F
T C R = C R i
where HIi and THI represent the non-carcinogenic health risk factors for all exposure pathways for single and multiple HMs, respectively. Similarly, Cri and TCR are for the carcinogenic risk for single and multiple HMs, respectively. Other parameters are listed in Table A3.
Following US EPA guidelines (https://semspub.epa.gov/work/HQ/174688.pdf, accessed on 9 April 2025), risk thresholds were set as follows: HI or THI <1 (safe); CR or TCR <10−6 (safe), 10−6–10−4 (acceptable). Then, Monte Carlo simulations (10,000 iterations) quantified uncertainty for each HM using Oracle Crystal Ball. Given that HM pollution can mainly pose a threat to human health through soil exposure and tea consumption, this study simultaneously evaluated the health risks from both soil and tea.

2.5. Statistical Analysis

All statistical analyses were performed using R (version 4.4.2) at a 0.05 significance level. We first conducted descriptive statistics to characterize HM distributions in soil and tea leaves, followed by t-tests comparing measured concentrations with regional background values. Differences in BCF among HMs were analyzed using one-way ANOVA with Tukey’s post hoc test for multiple comparisons. Pearson’s correlation analysis was employed to examine relationships between soil pH and HM concentrations in the soil–tea system. Source apportionment was performed using EPA PMF 5.0 software. For health risk assessment, Monte Carlo simulations were implemented in Oracle Crystal Ball to generate probability distributions of risk estimates. Error bars in all figures represent standard error (SE).

3. Results

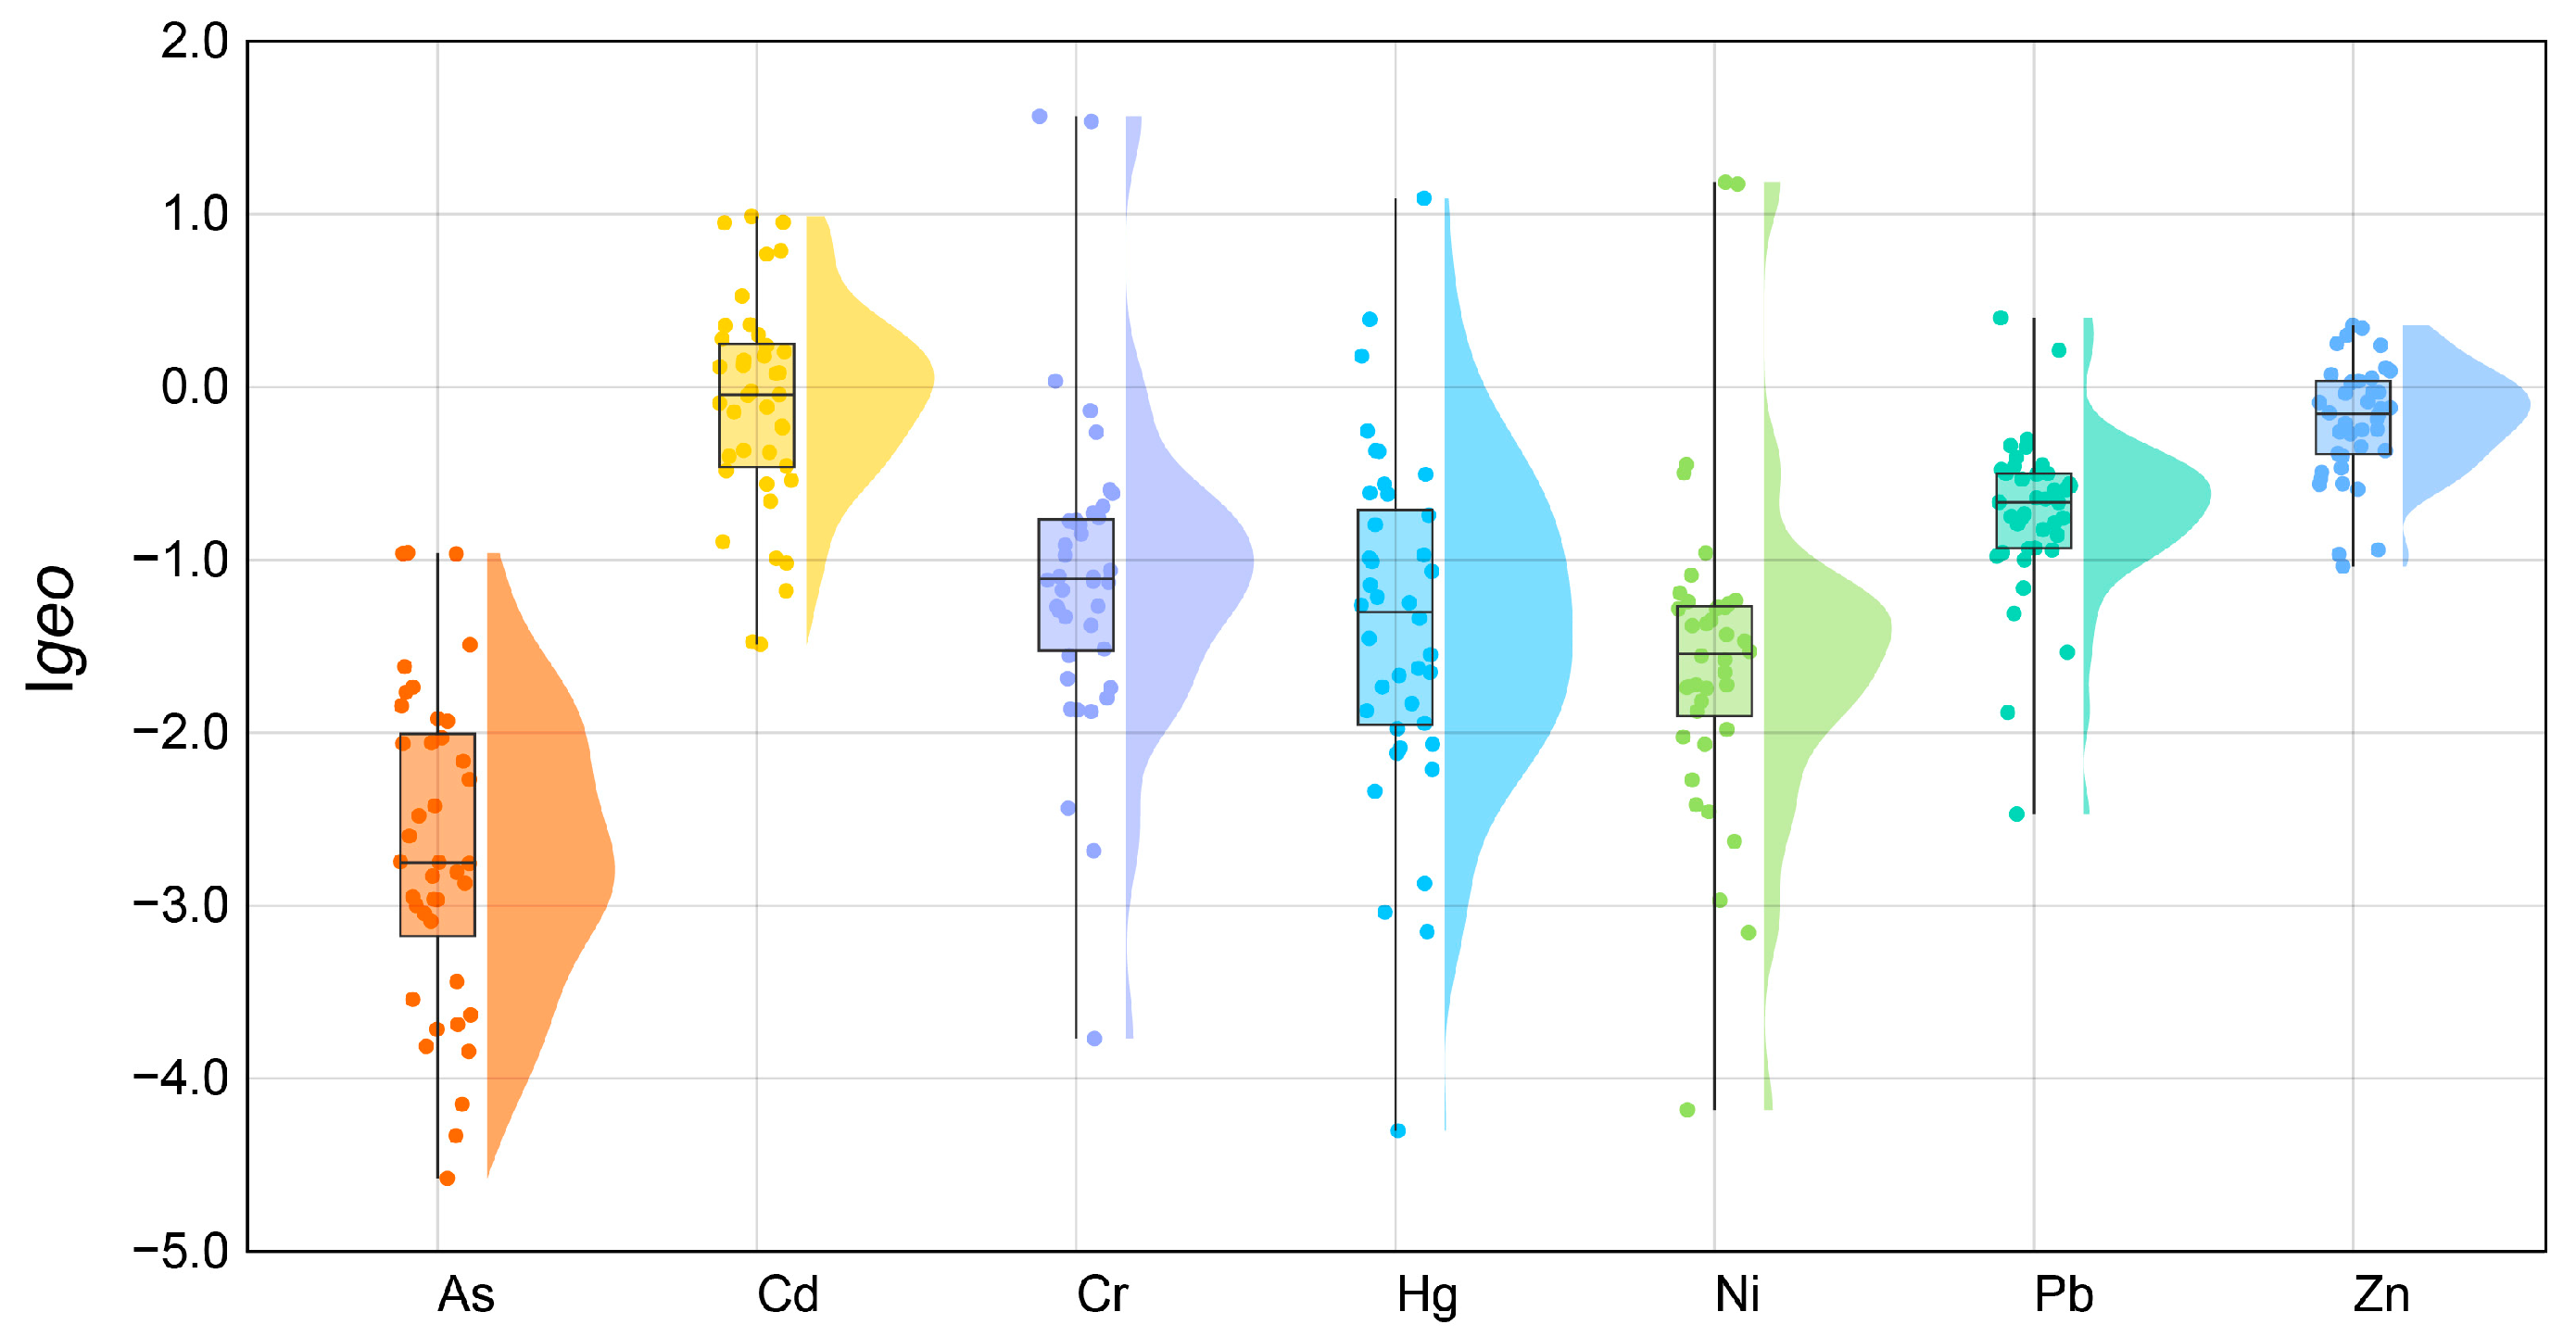
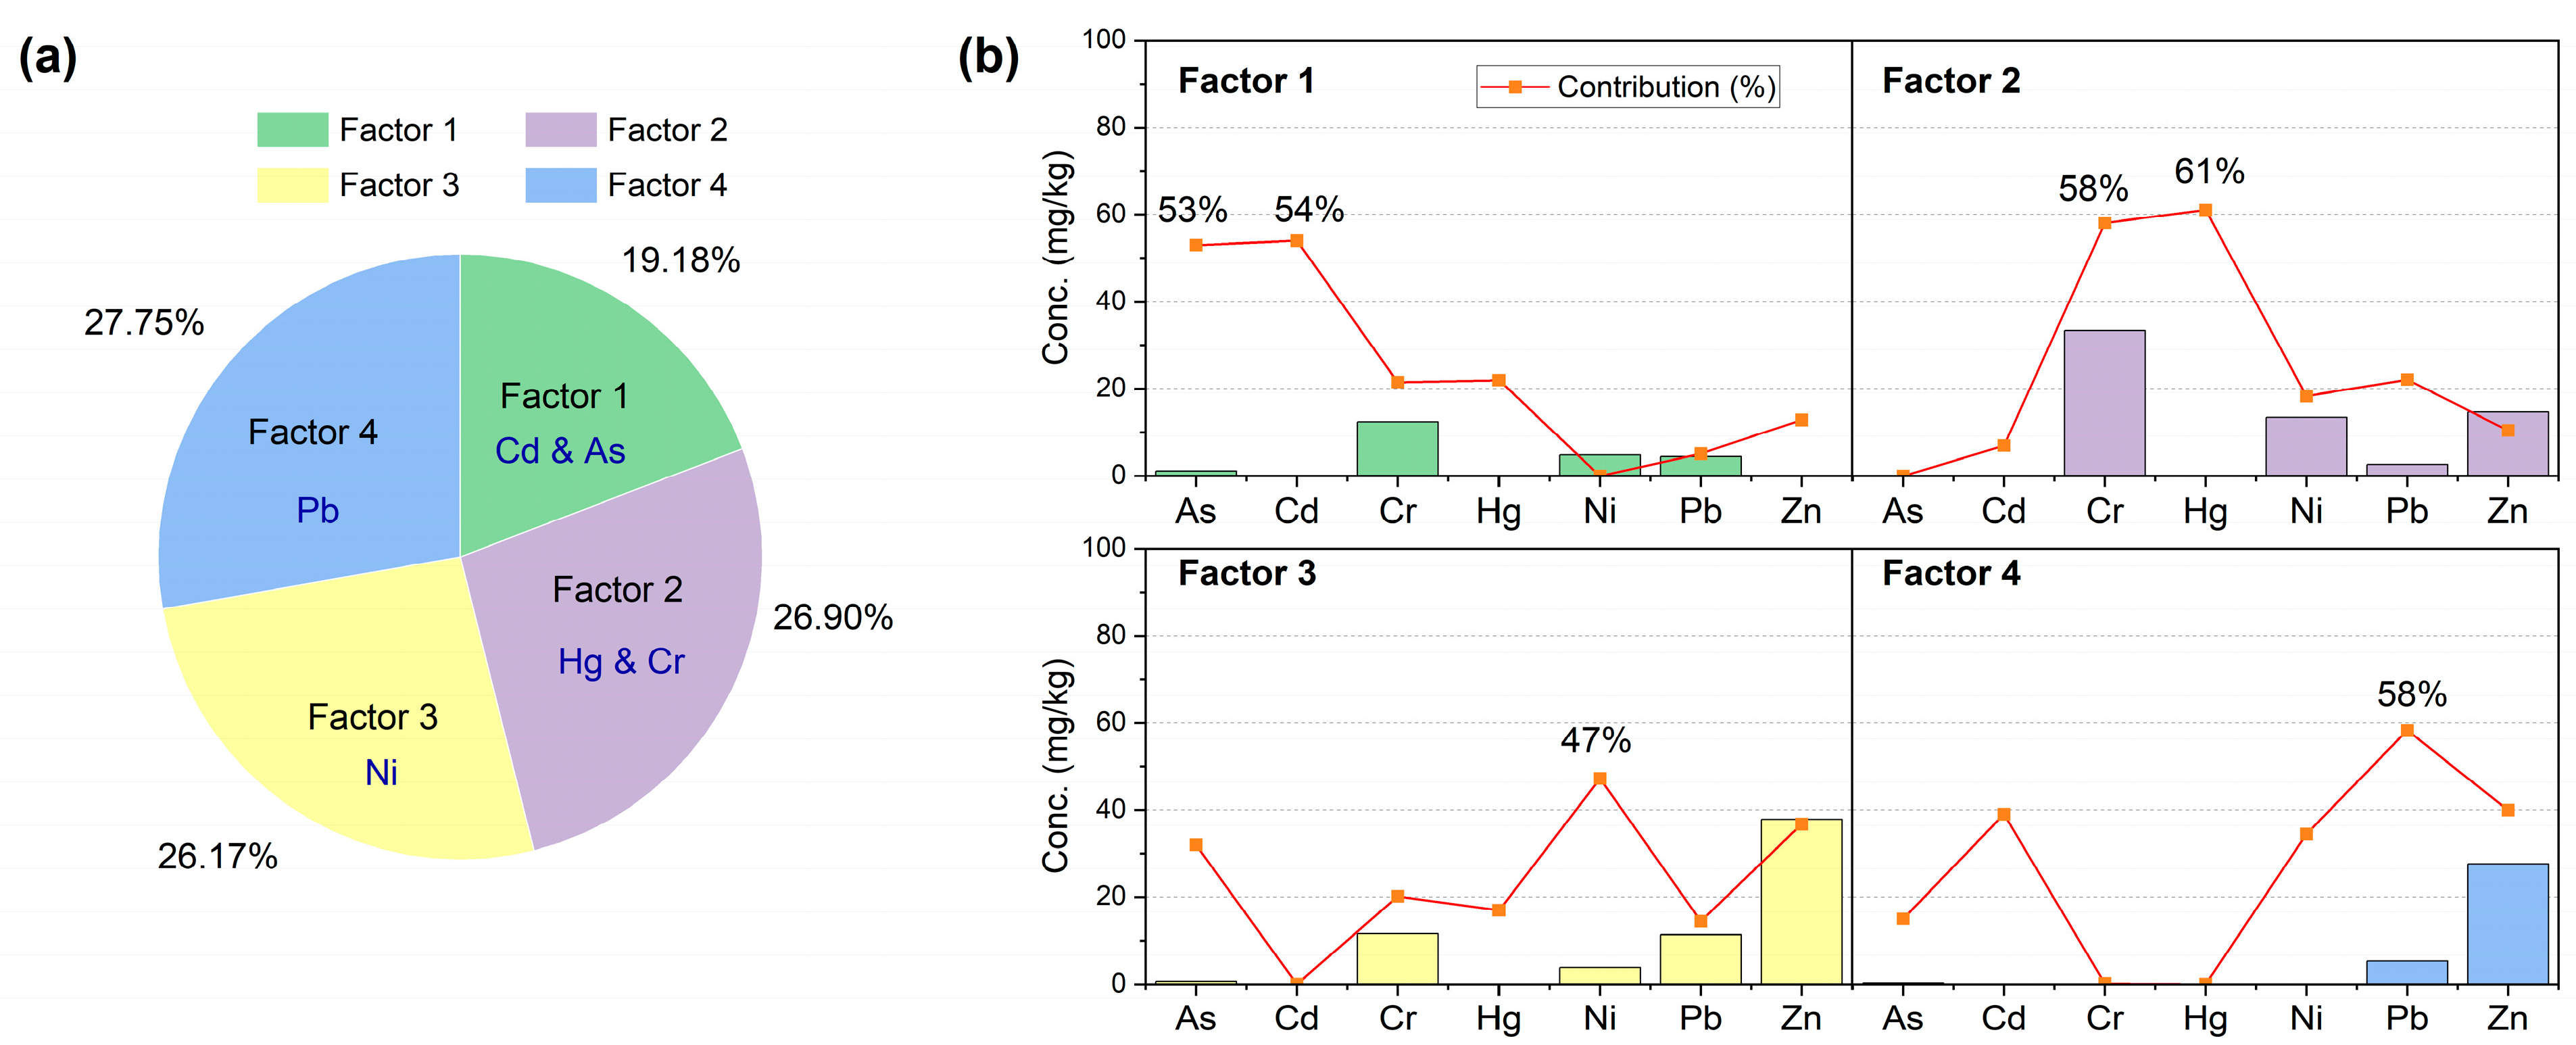
3.1. Heavy Metal(oid) Distribution and Source Apportionment in Soil

The mean concentrations of HMs in soil exhibited a distinct distribution pattern, with Zn showing the highest concentration (82.65 mg/kg), followed by Cr (58.96 mg/kg), Pb (25.01 mg/kg), Ni (22.18 mg/kg), As (2.56 mg/kg), Cd (0.15 mg/kg), and Hg (0.02 mg/kg) (Table 1). Comparative analysis with regional background values [20] revealed significant enrichment of Cd and Zn, while Hg, Ni, and As concentrations were significantly lower. Ni, Cr, and Hg exhibited the highest coefficients of variation among the HMs, indicating their strong spatial heterogeneity.
The Igeo analysis provided further insights into pollution levels (Figure 2), with Cd demonstrating the highest index value (−0.12), followed by Zn (−0.21), Pb (−0.75), Cr (−1.10), Hg (−1.38), Ni (−1.57), and As (−2.68). Although the mean Igeo values indicated no overall pollution, localized contamination was observed, with 45% of samples showing Cd pollution and 30% exhibiting Zn contamination. In contrast, As showed no pollution across all sampling sites.
Ecological risk assessment results highlighted Cd as the primary contributor to potential ecological risk, with 52.5% of samples showing moderate risk levels (Figure 3). Hg also posed moderate risks in 17.5% of samples, while other metal(oid)s exhibited low-risk profiles. The composite risk index (RI) for the study area averaged 88.24, with only 7.5% of samples reaching moderate risk levels. These results indicate that the ecological risk of soil HM was limited, and Cd was the main element contributing to ecological risk.
Source apportionment using PMF modeling identified four major sources contributing to soil HM contamination (Figure 4). The largest contributor (factor 4, 27.75%) was associated with Pb. The second source (factor 2, 26.90%) was dominated by Hg and Cr. The third source (factor 3, 26.17%) primarily contributed to Ni. The smallest contributor (factor 1, 19.18%) was characterized by high loadings of Cd and As.

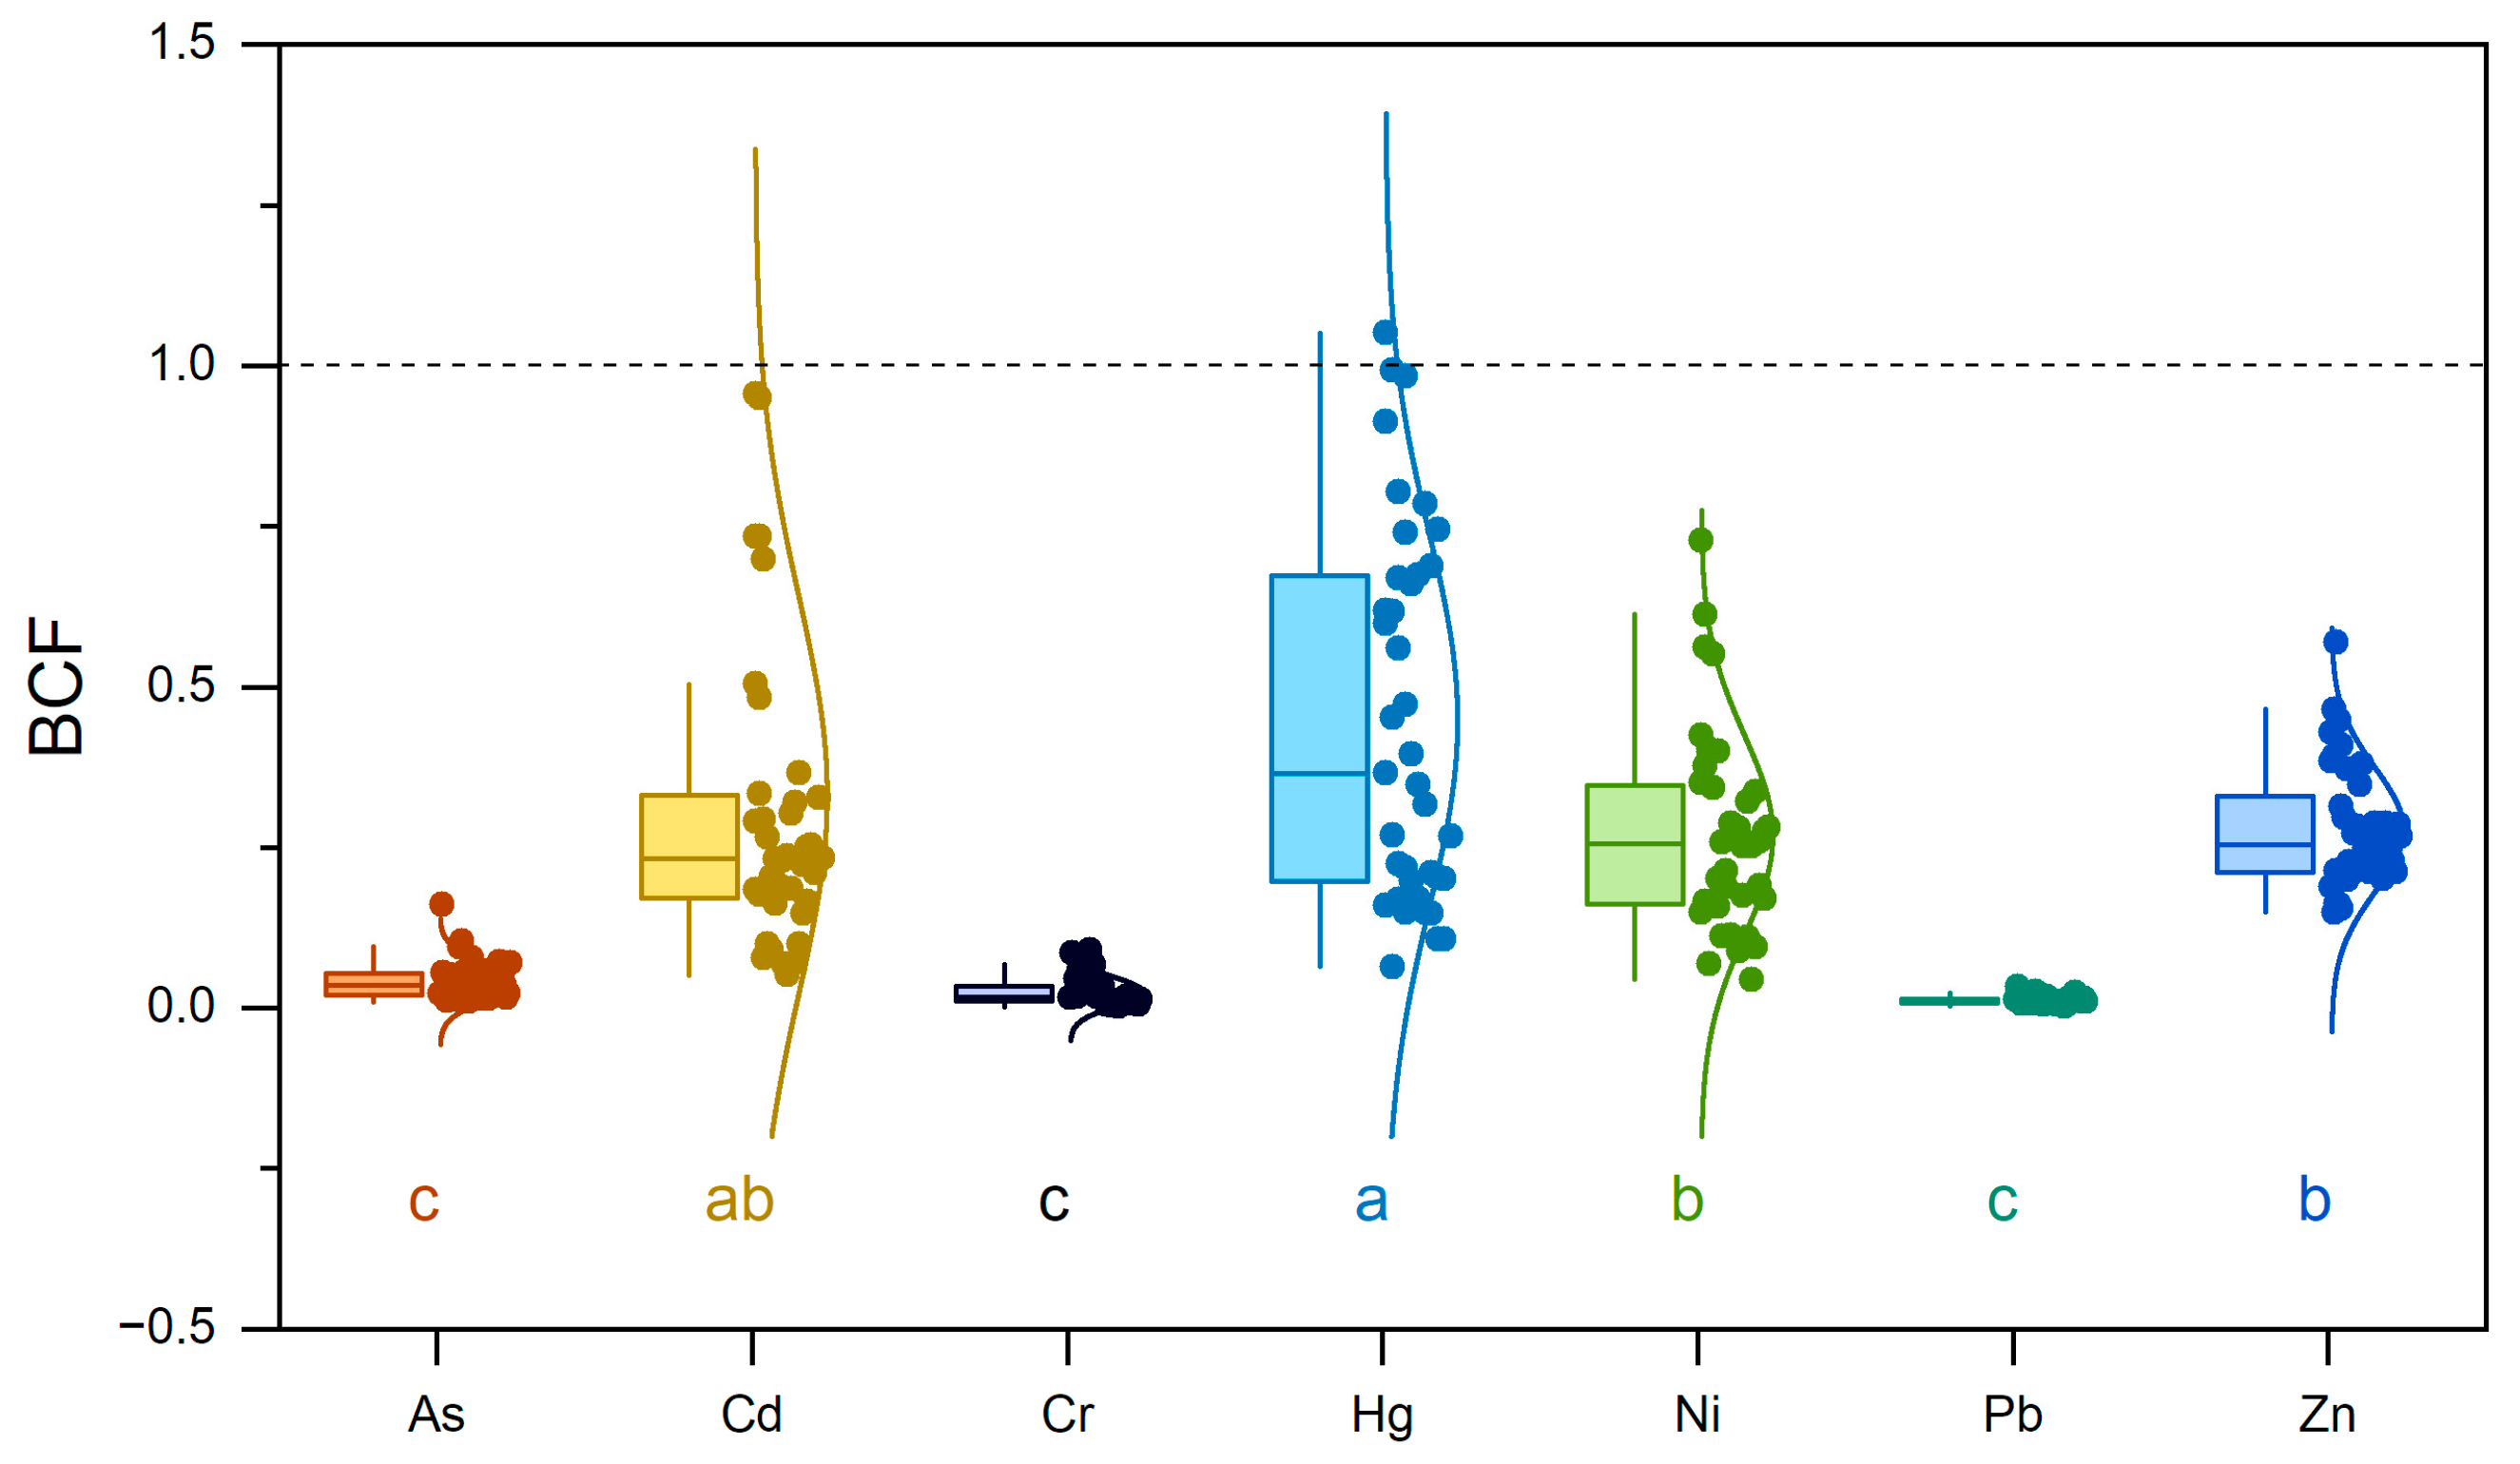
3.2. Heavy Metal(oid) Accumulation in Tea Leaves

In tea leaves, Zn and Ni showed the highest concentrations at 21.58 mg/kg and 4.62 mg/kg, respectively (Table 2). While all samples complied with Chinese food safety standards, isolated cases of As and Pb (only one sample per element) marginally exceeded EU regulatory limits. No other HMs surpassed both Chinese and EU thresholds.
Bioconcentration factor analysis revealed significant variation in HM uptake efficiency, with Hg showing the highest accumulation potential (BCF = 0.45), followed by Cd (0.33) (Figure 5). In contrast, As, Cr, and Pb demonstrated minimal accumulation in tea leaves, with BCF values of 0.04, 0.03, and 0.01, respectively.

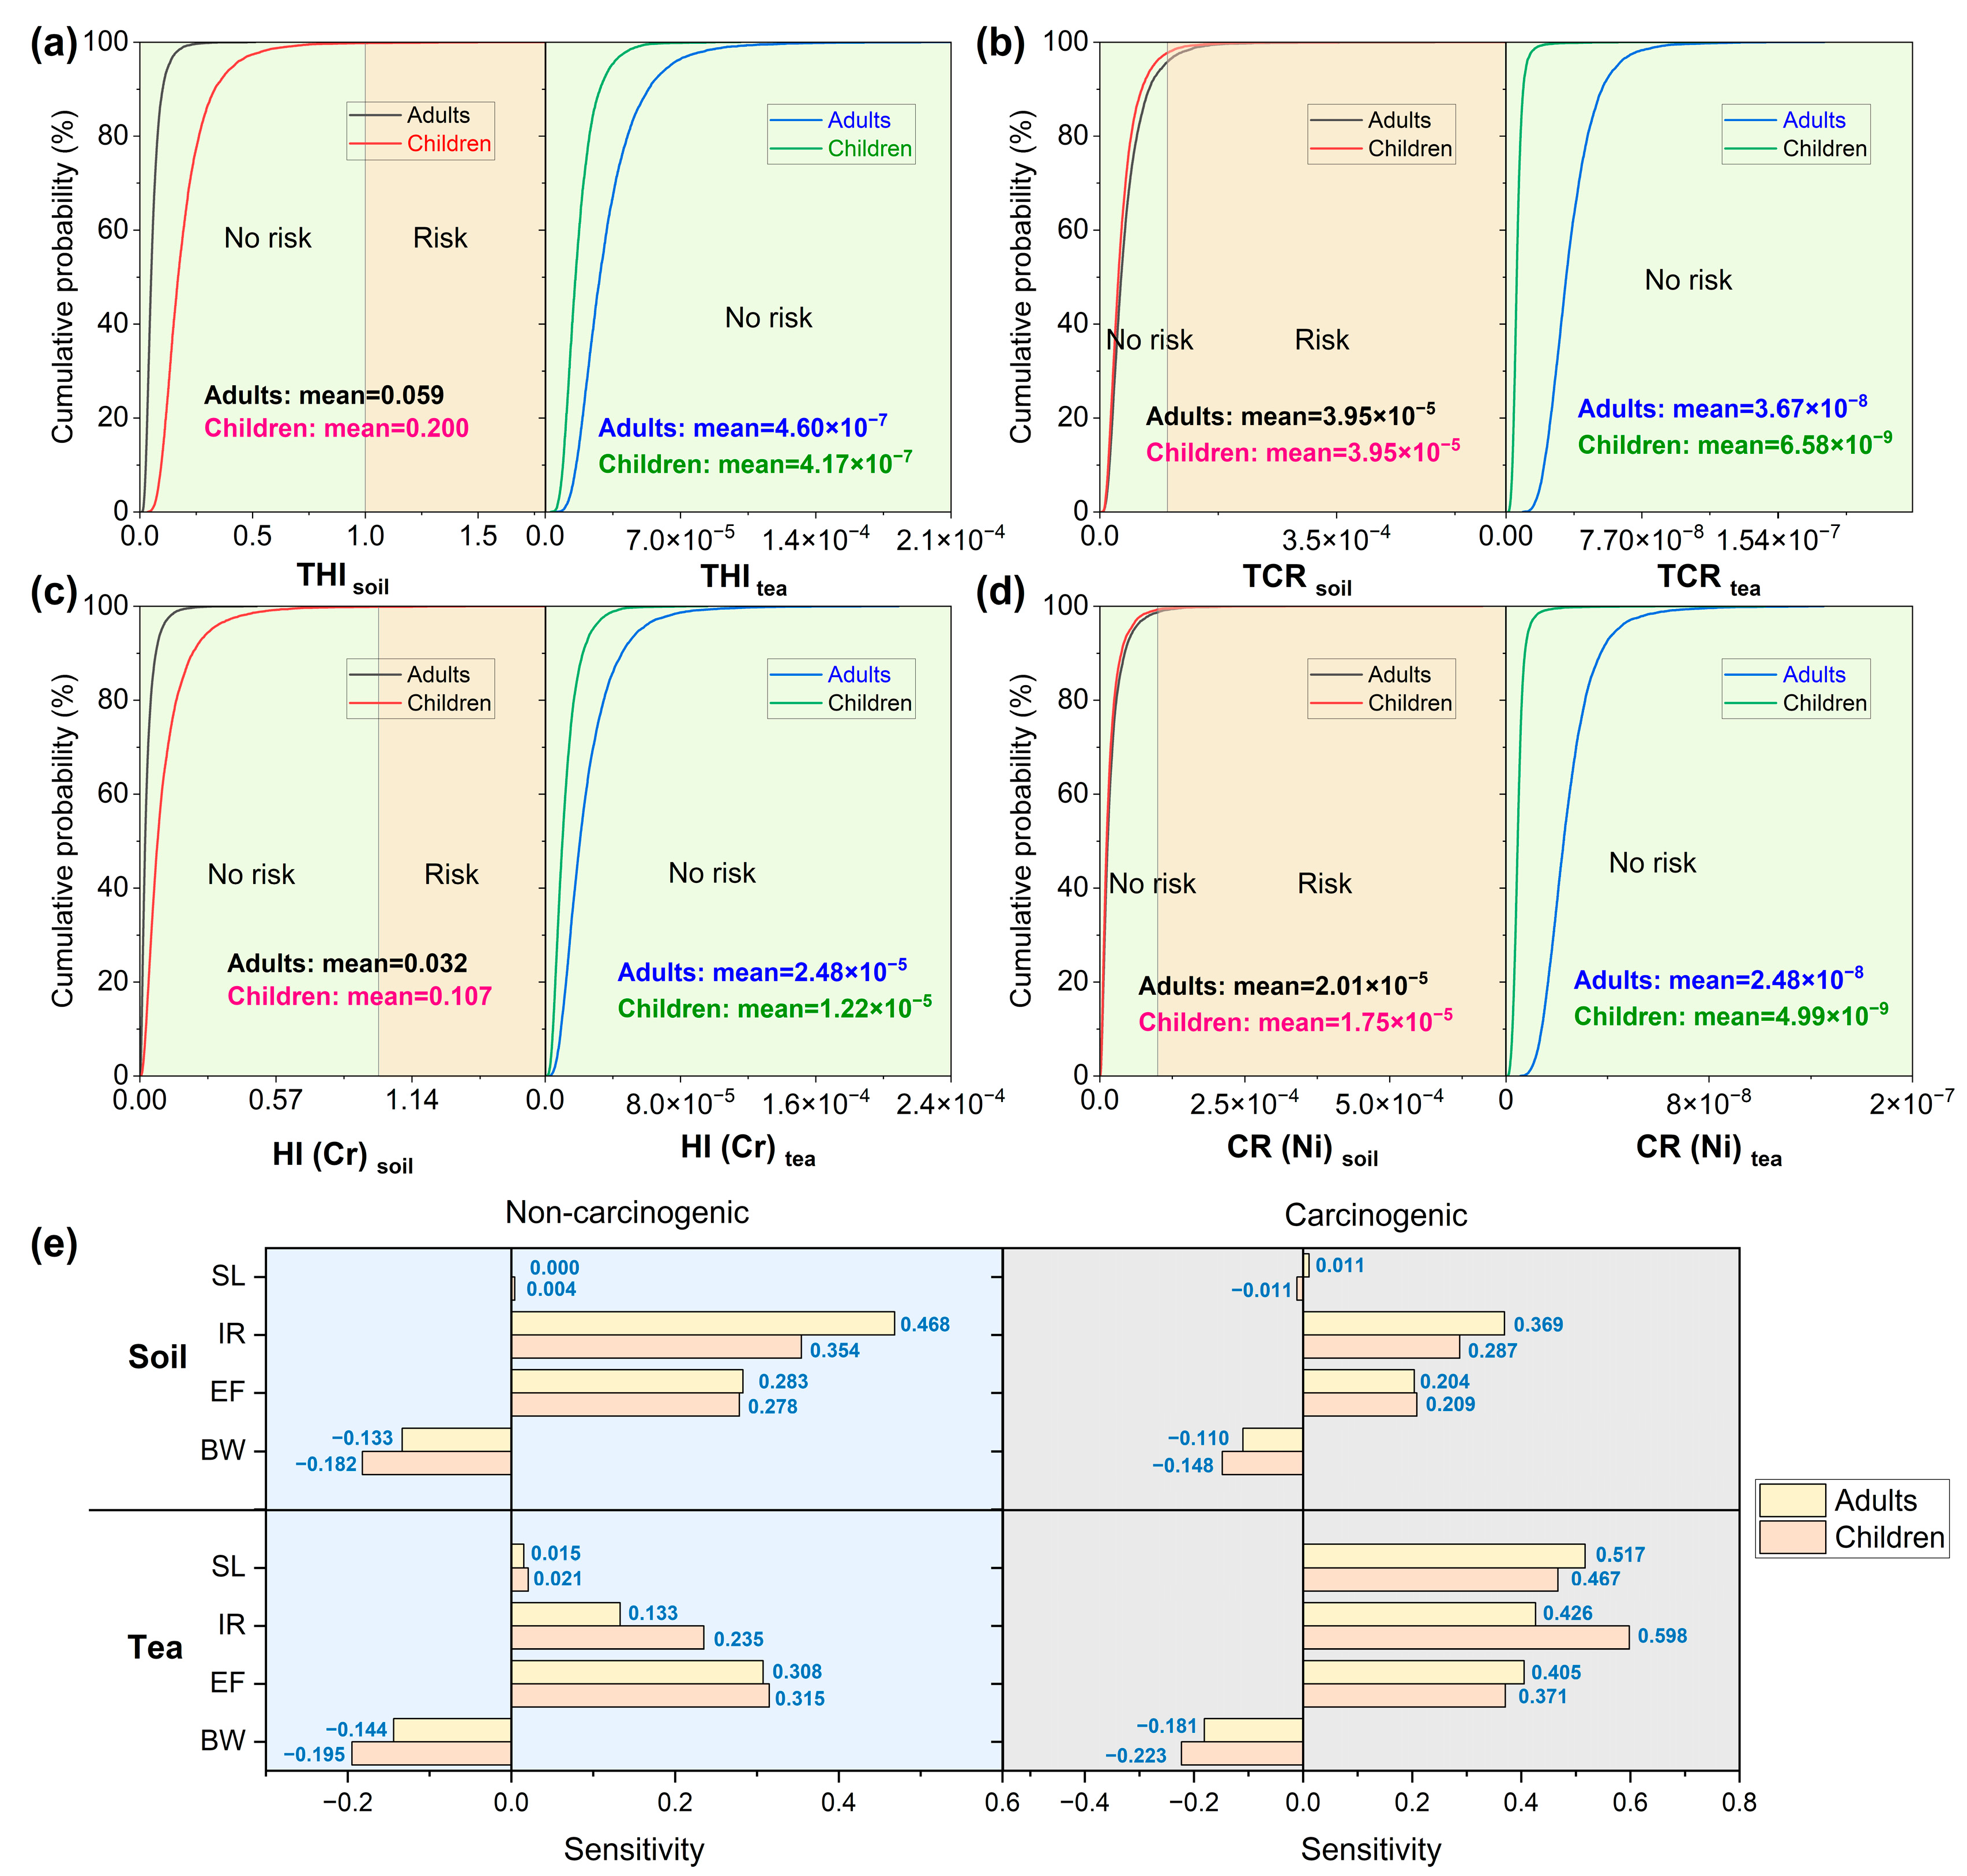
3.3. Health Risk Assessment

Health risk assessment results indicated that both non-carcinogenic and carcinogenic risks from soil exposure remained below safety thresholds for adults and children (Table 3 and Figure 6). The total non-carcinogenic risk values were 5.9 × 10⁻² for adults and 2.0 × 10⁻¹ for children, with Cr being the primary contributor. Carcinogenic risks fell within the acceptable range of 10−6 to 10−4, with values of 3.9 × 10⁻⁵ for adults and 3.4 × 10⁻⁵ for children, predominantly driven by Ni exposure. Tea consumption risks were extremely low, though Cr and Ni emerged as the main contributors to non-carcinogenic and carcinogenic risks, respectively.
Sensitivity analysis identified ingestion rate (IR) as the most influential parameter for soil exposure risks. For tea-related exposure, exposure frequency (EF) was the primary determinant of non-carcinogenic effects, while skin adhesion coefficient (SL) and IR jointly influenced carcinogenic risks. Moreover, children generally showed lower overall risks compared to adults, except for non-carcinogenic risks associated with soil exposure.

3.4. Soil–Tea System Interactions

Significant positive correlations were detected between soil pH and concentrations of Cd, Cr, and Ni (Figure 7). However, no significant relationships were observed between soil pH and HM concentrations in tea leaves or their corresponding BCF values. Among all HMs, only Ni demonstrated a significant cross-medium correlation between soil and tea concentrations. Inter-element correlations were generally stronger in soil than in tea leaves, while BCF values showed positive mutual correlations.

4. Discussion

4.1. Regional-Specific Mechanisms of Heavy Metal(oid) Accumulation in Tea Gardens

The tea garden soils in the study area exhibit acidic to weakly acidic conditions (pH 3.78–7.80). While acidic environments theoretically enhance HM solubility and bioavailability [13,27], our findings reveal no significant correlation between soil pH and either HM concentrations or BCF in tea leaves. This apparent contradiction can be attributed to several mitigating factors that regulate HM mobility in the soil–plant system. First, the presence of soil organic matter plays a crucial role in reducing HM bioavailability through complexation processes, particularly the binding of humic acids with Cd [28]. Second, plants can develop sophisticated physiological barriers that limit HM translocation, including root cell wall entrapment of Pb [29] and vacuolar compartmentalization of As [30]. These restrict HM translocation from soil to plants.
Our study identified Cd and Zn as the most enriched HMs in soils, as evidenced by their elevated Igeo indices, compared to other HMs and concentrations exceeding background values. Spatial analysis reveals Cd hotspots in tea gardens with intensive phosphate fertilizer application, suggesting long-term accumulation from Cd-containing agricultural inputs [31]. In contrast, Zn distribution follows the prevailing northwest–southeast wind direction from nearby lead–zinc mines, suggesting atmospheric deposition as a major input pathway. While the overall ecological risk from soil HMs remains low, Cd and Hg pose priority ecological risks due to their high toxicity coefficients (Cd = 30, Hg = 40) and Cd’s high Igeo values. These findings underscore the need for targeted control measures focusing on Cd mitigation in tea garden soils.

4.2. Source Apportionment and Contribution Analysis of Heavy Metal(oid)s

PMF modeling identified four primary sources contributing to soil HM contamination, with relatively balanced contributions ranging from 19.18% to 27.75%. The dominant source (Factor 4, 27.75%) was characterized by high Pb loading. It represents ore-related and transportation emissions, particularly for Pb, consistent with documented associations between Pb accumulation and traffic/industrial emissions [32,33]. This can be corroborated by the fact that the sampling points are predominantly distributed along the road network (Figure 1). The secondary source (Factor 2, 26.90%) is attributed to agricultural activities, contributing Hg and Cr primarily through pesticide applications and livestock manure amendments [34,35]. This finding can be deduced from global estimates that suggest anthropogenic sources account for approximately 90% of soil Hg pollution [36], while Cr in manure typically originates from feed additives such as potassium dichromate. Field investigations confirmed extensive agricultural land surrounding tea gardens, where HM inputs may occur through runoff and other transport processes.
Similarly, factor 3 (26.17%) was identified as the natural weathering of soil parent material, dominating Ni distribution patterns. This interpretation is supported by regional bedrock composition and the widespread occurrence of serpentine weathering in the Dabie Mountains, consistent with the established understanding that most soil Ni derives from rock weathering [37].
Factor 1 (19.18%), tentatively classified as an industrial source, showed significant contributions to Cd and As. Historical records indicate electronic waste dismantling and smelting activities in the study area, which are known to emit Cd-As pollutants [31,38]. Additional potential sources include coal combustion processes, which can generate Cd and As emissions [38,39,40]. The relatively low contribution of this factor corresponds with the current absence of industrial operations in the area, suggesting these represent legacy industrial impacts rather than ongoing contamination sources. Therefore, factor 1 is classified as the industrial source is reasonable.

4.3. Element-Specific Bioaccumulation Patterns in Tea Leaves

Tea plants demonstrate distinct HM accumulation behaviors, with Hg showing the highest BCF values (mean = 0.45). This enhanced uptake may be attributed to the membrane permeability of methylated Hg forms [41]. Cd exhibited the second-highest accumulation potential (mean BCF = 0.33), likely facilitated by ZIP family transporters that show broad affinity for divalent cations [42]. In contrast, As, Cr, and Pb displayed minimal accumulation (BCF < 0.05), reflecting active exclusion mechanisms in tea plants. For As, this may involve a rapid reduction in As(V) to As(III) following uptake through phosphate transporters, followed by vacuolar sequestration as a detoxification strategy [43]. However, the absence of HM speciation data in our study limits definitive mechanistic interpretations, highlighting an important area for future research.
Notably, only Ni showed a significant correlation between soil and tea concentrations, consistent with its stable geogenic origin. The lack of such relationships for other HMs suggests additional regulatory mechanisms may be operating, such as the entrapment of granular HM by the surface of tea leaves, or the influence of agronomic measures. The stronger inter-element correlations observed in soil compared to tea leaves further confirm the selective absorption and translocation of HMs by tea plants. These findings have important implications for tea garden management, suggesting that soil remediation alone may not always effectively reduce HM accumulation in tea leaves, particularly for elements with complex uptake and translocation dynamics.

4.4. Implications for Risk Management and Quality Control

Health risk assessment reveals minimal HM-related risks from tea consumption across all age groups. While the total carcinogenic risk from soil HM remains within acceptable limits, Ni and Cr emerge as the primary contributing elements. These findings underscore the need for long-term monitoring of these elements, particularly given their cumulative exposure potential. Sensitivity analysis reveals that the ingestion rate represents the most significant source of uncertainty in risk estimation, suggesting behavioral intervention to reduce the health risk. Of particular concern is our observation that children exhibit 3.4-fold higher non-carcinogenic risk from soil exposure (THI = 0.2) compared to adults (THI = 0.059). This substantial difference warrants consideration of establishing restricted activity zones around tea gardens, especially in areas with elevated HM concentrations. The implementation of such protective measures would be particularly relevant for tea-growing regions with child populations.
More importantly, our comparative regulatory analysis highlights a notable discrepancy between EU and Chinese food safety standards, with EU limits being 20× stricter for As and 10× stricter for Pb. Spatial evaluation reveals that samples exceeding EU thresholds are predominantly located downwind of lead–zinc mining operations. These findings support the implementation of targeted monitoring programs and pre-harvest screening protocols for tea gardens adjacent to mining areas. The discrepancy between Chinese and EU standards has a direct impact on the economic well-being of tea farmers. Due to the more stringent EU regulations, certain Chinese tea products may face export restrictions, leading to financial losses. To address this challenge, hierarchical control strategies are recommended. For instance, priority can be given to high-risk areas—such as tea gardens located downwind of mining zones or in historically industrial-polluted regions—by intensifying the frequency of HM monitoring in both soil and tea. Additionally, stricter cultivation management practices or soil remediation techniques to reduce HM bioavailability should be considered. Concurrently, promoting good agricultural practices, such as reducing synthetic fertilizer and pesticide use while increasing organic fertilizer application, should be widely adopted to minimize HM inputs at the source. Furthermore, developing rapid HM detection methods and cost-effective remediation technologies will enable tea farmers to promptly identify and mitigate contamination issues. Despite these regulatory differences, all tested samples demonstrated extremely low health risks when evaluated against US EPA risk benchmarks.
While this investigation provides valuable insights into HM distribution patterns in the soil–tea system, several limitations should be acknowledged. First, the absence of HM morphological analysis constrains our understanding of bioavailability mechanisms and actual plant uptake potential. Second, the single-season sampling design prevents assessment of temporal variations in HM accumulation, because of existing evidence of seasonal influences on plant HM uptake [10]. There are also some seasonal variations in HM fertilization and leaching during the rainy season. Thus, this study is only a preliminary understanding of HM in the soil–tea system. Future research should address these limitations while pursuing two complementary directions: (1) molecular-level investigations of HM-tea plant interactions, particularly focusing on the expression and regulation of key transporter genes; and (2) the development of practical, cost-effective agronomic strategies for HM mitigation in tea plantation systems. Such studies would significantly enhance our ability to predict and manage HM accumulation in tea crops. In addition, HM accumulation and migration pathways are multifaceted, encompassing industrial emissions, urban waste discharge, agrochemical application, atmospheric deposition, and other anthropogenic activities. However, the absence of detailed agricultural and industrial HM input data—including spatial distribution, concentration levels in fertilizers and pesticides, emission inventories, and associated meteorological parameters—impedes precise source apportionment. Existing datasets only permit a generalized assessment of potential HM sources through PMF, rather than enabling source-specific identification for individual HM.

5. Conclusions

This study elucidates the complex distribution characteristics, source apportionment, and migration risks of HM in tea gardens in Dabie Mountain. The results reveal that the soil in the study area displays higher enrichment of Zn (82.65 mg/kg) and Cd (0.15 mg/kg) than other HMs, with Igeo values of −0.21 and −0.12, respectively. Source apportionment through PMF modeling identifies four primary HM contributors: mining and transportation (27.75%), agricultural activities (26.90%), natural soil parent material (26.17%), and industrial emissions (19.18%). The soil–tea system exhibits element-specific translocation behaviors, characterized by high mobility of Hg and Cd contrasted with limited transfer of As, Cr, and Pb. While current health risk assessments indicate that carcinogenic and non-carcinogenic risks from soil exposure and tea consumption remain within acceptable limits, long-term Ni and Cr exposure and child-specific vulnerabilities warrant attention. These findings provide a scientific basis for tea garden management and address trade barriers in acidic soil regions. Future research should incorporate HM morphological and seasonal monitoring to better understand translocation mechanisms in tea plants. Hierarchical control strategies can be adopted to mitigate international trade barriers and promote sustainable management of tea gardens and the economy of tea farmers.

Author Contributions

M.L. (Funding Acquisition and Resources); T.L. (Writing—Review and Editing, Writing—Original Draft, and Data Curation); J.H. (Writing—Review and Editing and Data Curation); H.X. (Writing—Review and Editing, Resources, and Methodology); T.J. (Writing—Review and Editing and Data Curation); X.X. (Writing—Review and Editing and Data curation); Y.Y. (Supervision, Validation, Software, and Methodology). All authors have read and agreed to the published version of the manuscript.

Funding

This work was financially supported by the China Geological Survey Project (DD20242416), the Natural Science Foundation of China (32001298), and the Postgraduate Education and Teaching Reform Project of Hubei University (JGYJS202225).

Data Availability Statement

The data that support the findings of this study are available from the corresponding author upon reasonable request.

Conflicts of Interest

The authors declare that they have no known competing financial interests or personal relationships that could have appeared to influence the work reported in this paper.

Appendix A

Table A1. Grading criteria for heavy metal(oid) pollution and ecological risk indices.
EFPollution StatusIgeoPollution StatusEiRIRisk Level
≤1No≤0No<40<150Low
1~2No to moderate0–1Slight40–80150–300Moderate
2~5Moderate1–2Slight to moderate80–160300–600Moderate to high
5~20Moderate to strong2–3Moderate160–320600–1200High
20~40Strong3–4Strong>320>1200Very high
>40Extremely strong4–5Strong to very strong
≥5Extremely strong
Table A2. Definition and reference value of parameters for human health risk assessment of heavy metal(oid)s. Data is from previous research.
ParameterDefinitionUnitReference Values
AdultChildren
Ringingestion ratemg/day200100
Rinhinhalation ratem3/day157.5
PEFparticle emission factorm3/kg1.36 × 1091.36 × 109
SAsurface area of exposed skincm243501600
AFadhesiveness degree of skinmg/(cm2 day)0.20.2
BWbody weightkg53.115
EDexposure durationyearnon-carcinogenic 24
carcinogenic 24
non-carcinogenic 6 carcinogenic 30
ABSabsorption factor of skin0.0010.001
EFexposure frequencyday/year350350
ATaverage exposure timedaynon-carcinogenic ED × 365 = 8760; carcinogenic 365 × 70 = 25,550non-carcinogenic ED × 365 = 2190; carcinogenic 365 × 70 = 25,550
Table A3. Parameter values of reference dose (RfD) and slope factor (SF) in the assessment model of health risk.
Heavy Metal(oid)RfDingRfDinhRfDderSFingSFinhSFder
As3.00 × 10−43.00 × 10−41.23 × 10−41.50 × 1001.51 × 1013.66 × 100
Cd1.00 × 10−31.00 × 10−51.00 × 10−5
Cr3.00 × 10−32.86 × 10−56.00 × 10−5 4.20 × 101
Hg3.00 × 10−43.00 × 10−42.40 × 10−5
Ni2.00 × 10−22.06 × 10−25.40 × 10−3 8.40E-01
Pb3.50 × 10−33.52 × 10−35.25 × 10−48.50 × 10⁻³
Zn3.00 × 10−13.00 × 10−16.00 × 10−2

References

  1. Xiang, M.; Li, Y.; Yang, J.; Lei, K.; Li, Y.; Li, F.; Zheng, D.; Fang, X.; Cao, Y. Heavy metal contamination risk assessment and correlation analysis of heavy metal contents in soil and crops. Environ. Pollut. 2021, 278, 116911. [Google Scholar] [CrossRef]
  2. Chen, L.; Luo, X.; He, H.; Duan, T.; Zhou, Y.; Yang, L.; Zeng, Y.; Chen, H.; Fang, L. Hg-mining-induced soil pollution by potentially toxic metal(loid)s presents a potential environmental risk and threat to human health: A global meta-analysis. Soil Ecol. Lett. 2024, 6, 240233. [Google Scholar] [CrossRef]
  3. Hakanson, L. An Ecological Risk Index for Aquatic Pollution Control—A Sedimentological Approach. Water Res. 1980, 14, 975–1001. [Google Scholar] [CrossRef]
  4. Meng, F.; Liu, D.; Bu, T.; Zhang, M.; Peng, J.; Ma, J. Assessment of pollution and health risks from exposure to heavy metals in soil, wheat grains, drinking water, and atmospheric particulate matter. J. Environ. Manag. 2025, 376, 124448. [Google Scholar] [CrossRef] [PubMed]
  5. Saha, A.; Gupta, B.S.; Patidar, S.; Hernández-Martínez, J.L.; Martín-Romero, F.; Meza-Figueroa, D.; Martínez-Villegas, N. A comprehensive study of source apportionment, spatial distribution, and health risks assessment of heavy metal(loid)s in the surface soils of a semi-arid mining region in Matehuala, Mexico. Environ. Res. 2024, 260, 119619. [Google Scholar] [CrossRef]
  6. Goncharov, G.; Soktoev, B.; Farkhutdinov, I.; Matveenko, I. Heavy metals in urban soil: Contamination levels, spatial distribution and human health risk assessment (the case of Ufa city, Russia). Environ. Res. 2024, 257, 119216. [Google Scholar] [CrossRef]
  7. Singh, S.; Maiti, S.K.; Raj, D. An approach to quantify heavy metals and their source apportionment in coal mine soil: A study through PMF model. Environ. Monit. Assess. 2023, 195, 306. [Google Scholar] [CrossRef]
  8. Ma, Y.; Sun, Y.; Wang, J.; Liu, Y.; Guo, M.; Hu, C.; Shui, B. Analysis of heavy metal sources and potential ecological risk assessment of mangroves in Aojiang Estuary. Ecol. Indic. 2025, 173, 113343. [Google Scholar] [CrossRef]
  9. Liu, N.; Li, X.; Chen, P.; Yuan, W.; Wang, D.; Wang, X. Climate and vegetation controlling accumulation and translocation of heavy metals in water tower regions of Qinghai-Tibet Plateau. J. Hazard. Mater. 2025, 484, 136752. [Google Scholar] [CrossRef]
  10. Dai, H.; Xiao, J.; Wu, C.; Yu, L. The Accumulation and Physiological Responses of Camellia sinensis to Heavy Metals. Horticulturae 2024, 10, 680. [Google Scholar] [CrossRef]
  11. Lin, S.; Liu, X.; Yan, Q.; Liang, G.; Wang, D. Research on heavy metal enrichment and transportation in tea plant-soil systems of different varieties. Environ. Geochem. Health 2024, 46, 514. [Google Scholar] [CrossRef] [PubMed]
  12. Ju, Y.; Luo, Z.; Bi, J.; Liu, C.; Liu, X. Transfer of heavy metals from soil to tea and the potential human health risk in a regional high geochemical background area in southwest China. Sci. Total Environ. 2024, 908, 168122. [Google Scholar] [CrossRef] [PubMed]
  13. Angon, P.B.; Islam, M.S.; Kc, S.; Das, A.; Anjum, N.; Poudel, A.; Suchi, S.A. Sources, effects and present perspectives of heavy metals contamination: Soil, plants and human food chain. Heliyon 2024, 10, e28357. [Google Scholar] [CrossRef]
  14. GB 15618-2018; Soil environmental quality—Risk control standard for soil contamination of agricultural land. Ministry of Ecology and Environment of the People’s Republic of China: Beijing, China, 2018.
  15. GB 31608-2023; National food safety standards for tea. National Health Commission of the People’s Republic of China: Beijing, China, 2023.
  16. Muller, G. Index of Geoaccumulation in Sediments of the Rhine River. Geo J. 1969, 2, 109–118. [Google Scholar]
  17. Safadoust, A.; Khaleghi, S.; Kolahchi, Z. Environmental risks of heavy metals in railway soils: Challenges to ecosystem management. Sci. Total Environ. 2025, 974, 179217. [Google Scholar] [CrossRef] [PubMed]
  18. Gopal, V.; Krishnamurthy, R.R.; Indhumathi, A.; Sharon, B.T.X.; Priya, T.S.D.; Rathinavel, K.; Bharath, K.M.; Magesh, N.S.; Ayyamperumal, R. Geochemical evaluation, ecological and human health risk assessment of potentially toxic elements in urban soil, Southern India. Environ. Res. 2024, 248, 118413. [Google Scholar] [CrossRef]
  19. Korkanç, S.Y.; Korkanç, M.; Amiri, A.F. Effects of land use/cover change on heavy metal distribution of soils in wetlands and ecological risk assessment. Sci. Total Environ. 2024, 923, 171603. [Google Scholar] [CrossRef]
  20. China National Environmental Monitoring Centre. Background Values of Chinese Soil Elements; China Environmental Science Press: Beijing, China, 1990. [Google Scholar]
  21. De Nicola, F.; Maisto, G.; Alfani, A. Assessment of nutritional status and trace element contamination of holm oak woodlands through analyses of leaves and surrounding soils. Sci. Total Environ. 2003, 311, 191–203. [Google Scholar] [CrossRef] [PubMed]
  22. Xu, Z.; Ni, S.; Tuo, X.; Zhang, C. Calculation of heavy metals’ toxicity coefficient in the evaluation of potential ecological risk index. Environ. Sci. Technol. 2008, 31, 112–115. [Google Scholar]
  23. GB 2762-2022; National food safety standard—Limits of contaminants in food. National Health Commission of the People’s Republic of China: Beijing, China, 2018.
  24. NY 659-2003; Residue imits for chromium, cadmium, mercury, arsenic and fluoride in tea. Ministry of Agriculture of the People’s Republic of China: Beijing, China, 2003.
  25. Paatero, P. Least squares formulation of robust non-negative factor analysis. Chemom. Intell. Lab. Syst. 1997, 37, 23–35. [Google Scholar] [CrossRef]
  26. US EPA; Group, R.C.; Moya, J. Exposure Factors Handbook; BiblioGov: Washington, DC, USA, 1997.
  27. Zhou, L.; Zhao, X.; Teng, M.; Wu, F.; Meng, Y.; Wu, Y.; Byrne, P.; Abbaspour, K.C. Model-based evaluation of reduction strategies for point and nonpoint source Cd pollution in a large river system. J. Hydrol. 2023, 622, 129701. [Google Scholar] [CrossRef]
  28. Lwin, C.S.; Kim, Y.-N.; Lee, M.; Jung, H.-i.; Kim, K.-R. In Situ Immobilization of Potentially Toxic Elements in Arable Soil by Adding Soil Amendments and the Best Ways to Maximize Their Use Efficiency. J. Soil Sci. Plant Nutr. 2024, 24, 115–134. [Google Scholar] [CrossRef]
  29. Jiang, W.; Liu, D. Pb-induced cellular defense system in the root meristematic cells of Allium sativum L. BMC Plant Biol. 2010, 10, 40. [Google Scholar] [CrossRef]
  30. Sharma, S.S.; Dietz, K.J.; Mimura, T. Vacuolar compartmentalization as indispensable component of heavy metal detoxification in plants. Plant Cell Environ. 2016, 39, 1112–1126. [Google Scholar] [CrossRef] [PubMed]
  31. Yuan, Z.; Luo, T.; Liu, X.; Hua, H.; Zhuang, Y.; Zhang, X.; Zhang, L.; Zhang, Y.; Xu, W.; Ren, J. Tracing anthropogenic cadmium emissions: From sources to pollution. Sci. Total Environ. 2019, 676, 87–96. [Google Scholar] [CrossRef] [PubMed]
  32. Yan, G.; Mao, L.; Liu, S.; Mao, Y.; Ye, H.; Huang, T.; Li, F.; Chen, L. Enrichment and sources of trace metals in roadside soils in Shanghai, China: A case study of two urban/rural roads. Sci. Total Environ. 2018, 631–632, 942–950. [Google Scholar] [CrossRef]
  33. Chen, T.; Chang, Q.; Liu, J.; Clevers, J.G.P.W.; Kooistra, L. Identification of soil heavy metal sources and improvement in spatial mapping based on soil spectral information: A case study in northwest China. Sci. Total Environ. 2016, 565, 155–164. [Google Scholar] [CrossRef]
  34. Wang, L.; Zhou, Y.; Sun, X.; Wu, S.; Xia, L.; Sun, J.; Zha, Y.; Yang, P. Retrieval of chromium and mercury concentrations in agricultural soils: Using spectral information, environmental covariates, or a fusion of both? Ecol. Indic. 2024, 167, 112594. [Google Scholar] [CrossRef]
  35. Liu, S.; Pu, S.; Deng, D.; Huang, H.; Yan, C.; Ma, H.; Razavi, B.S. Comparable effects of manure and its biochar on reducing soil Cr bioavailability and narrowing the rhizosphere extent of enzyme activities. Environ. Int. 2020, 134, 105277. [Google Scholar] [CrossRef]
  36. Kung, H.C.; Wu, C.H.; Huang, B.W.; Chang-Chien, G.P.; Mutuku, J.K.; Lin, W.C. Mercury abatement in the environment: Insights from industrial emissions and fates in the environment. Heliyon 2024, 10, e28253. [Google Scholar] [CrossRef]
  37. Spivak-Birndorf, L.J.; Wang, S.-J.; Bish, D.L.; Wasylenki, L.E. Nickel isotope fractionation during continental weathering. Chem. Geol. 2018, 476, 316–326. [Google Scholar] [CrossRef]
  38. Bhardwaj, S.; Soni, R.; Gupta, S.K.; Shukla, D.P. Mercury, arsenic, lead and cadmium in waters of the Singrauli coal mining and power plants industrial zone, Central East India. Environ. Monit. Assess. 2020, 192, 251. [Google Scholar] [CrossRef] [PubMed]
  39. Wang, T.; Yang, Q.; Wang, Y.; Wang, J.; Zhang, Y.; Pan, W.-P. Arsenic release and transformation in co-combustion of biomass and coal: Effect of mineral elements and volatile matter in biomass. Bioresour. Technol. 2020, 297, 122388. [Google Scholar] [CrossRef] [PubMed]
  40. Cui, W.; Meng, Q.; Feng, Q.; Zhou, L.; Cui, Y.; Li, W. Occurrence and release of cadmium, chromium, and lead from stone coal combustion. Int. J. Coal Sci. Technol. 2019, 6, 586–594. [Google Scholar] [CrossRef]
  41. Liu, Y.; Liu, G.; Wang, Z.; Guo, Y.; Yin, Y.; Zhang, X.; Cai, Y.; Jiang, G. Understanding foliar accumulation of atmospheric Hg in terrestrial vegetation: Progress and challenges. Crit. Rev. Environ. Sci. Technol. 2021, 52, 4331–4352. [Google Scholar] [CrossRef]
  42. Liu, C.; Wen, L.; Cui, Y.; Ahammed, G.J.; Cheng, Y. Metal transport proteins and transcription factor networks in plant responses to cadmium stress. Plant Cell Rep. 2024, 43, 218. [Google Scholar] [CrossRef]
  43. Verbruggen, N.; Hermans, C.; Schat, H. Mechanisms to cope with arsenic or cadmium excess in plants. Curr. Opin. Plant Biol. 2009, 12, 364–372. [Google Scholar] [CrossRef]
Figure 1. Location of the sampling sites.
Land 14 01269 g001
Figure 2. Igeo of HMs in soil.
Land 14 01269 g002
Figure 3. Potential ecological risk index (Ei) of individual HMs and composite risk index (RI) of soil HMs. (a) Distribution of RI values in the study area. (b) The Ei values of each HM.
Land 14 01269 g003
Figure 4. Source apportionment results on soil HMs. (a) Source factors of soil HMs in the study area. (b) The contribution rate of each HM in the source factor. (b), the red dots represent the contribution rate of each factor to HM.
Land 14 01269 g004
Figure 5. Bioaccumulation factor (BCF) of HMs in tea. Different letters represent significant differences between HMs (p < 0.05).
Land 14 01269 g005
Figure 6. Non-carcinogenic (a) and carcinogenic (b) probabilistic health risk assessment for all HMs. Figures (c,d) are probabilistic health risk assessments for the HM with the highest contributions to the total non-carcinogenic and carcinogenic risk among all HMs, respectively. (e) is the sensitivity analysis of risk parameters. The bars represent the correlation coefficients of each parameter. SL, skin adhesion coefficient; IR, ingestion rate; EF, exposure frequency; BW, body weight.
Land 14 01269 g006
Figure 7. The correlation between HM concentration in soil and tea (a) and the biological enrichment factor (BCF) of pH and HM (b). The numbers in the figure represent Pearson’s correlation coefficients.
Land 14 01269 g007
Table 1. Overview of soil HM concentration (mg/kg) and pH. The t-value and p-value represent the t-test results between the actual concentration and background value. The background values are derived from “Background values of Chinese soil elements” [20] compiled by the China Environmental Monitoring Station.
AsCdCrHgNiPbZnpH
Min0.560.057.280.002.827.1645.103.78
Max6.910.29294.000.11116.0052.40118.007.80
Mean2.560.1558.960.0222.1825.0182.655.58
SE0.260.019.040.003.601.232.890.15
CV (%)64.8041.9396.9379.27102.6331.2022.1416.50
Background value9.000.1066.500.0334.2026.6062.00
t-value−24.5455.097−0.835−2.924−3.342−1.2877.137
p-value0.0000.0000.4090.0060.0020.2060.000
Table 2. Overview of HM concentrations in tea leaves in the study area (mg/kg). Criteria 1 and 2 are, respectively, derived from Chinese food standards [15,23,24] and EU standards “Regulation (EU) 2023/915” (https://eur-lex.europa.eu/eli/reg/2023/915/oj/eng, accessed on 9 April 2025). Pi is the single factor pollution index and adopts Chinese standards. The over-standard rate is compared to EU standards.
AsCdCrHgNiPbZn
Min0.050.010.240.000.940.1212.10
Max0.180.133.060.0115.400.5432.50
Mean0.070.040.950.014.620.2721.58
SE0.000.000.100.000.460.010.63
CV (%)31.9961.8364.0135.6362.6635.3818.34
Criteria 12.005.005.000.305.0050.00
Criteria 20.100.300.100.50
Pi0.007 ± 0.0010.003 ± 0.0000.061 ± 0.0090.002 ± 0.0010.015 ± 0.0020.322 ± 0.015
Over-standard rate2.5%0%0%2.5%
Table 3. Non-carcinogenic risk index (HI) and carcinogenic risk index (CR) in the health risk assessment of HMs in soil and tea leaves. THI and TCR are the sum of HI and CR of all HMs, respectively.
SourceHMsMinMaxMeanSEContribution (%)MinMaxMeanSEContribution (%)
Non-carcinogenic risks (Adults)Non-carcinogenic risks (Children)
SoilAs8.8 × 10−41.7 × 10−11.3 × 10−29.9 × 10−322.783.2 × 10−34.1 × 10−14.6 × 10−23.2 × 10−222.90
Cd1.1 × 10−53.1 × 10−32.6 × 10−42.1 × 10−40.435.5 × 10−51.7 × 10−28.7 × 10−46.9 × 10−40.44
Cr7.6 × 10−44.9 × 10−13.2 × 10−23.2 × 10−253.934.2 × 10−31.8 × 1001.1 × 10−11.1 × 10−153.41
Hg5.5 × 10−61.8 × 10−31.3 × 10−41.1 × 10−40.222.1 × 10−55.2 × 10−34.4 × 10−43.6 × 10−40.22
Ni3.6 × 10−55.6 × 10−21.7 × 10−32.0 × 10−32.911.2 × 10−41.3 × 10−15.9 × 10−36.5 × 10−32.96
Pb1.7 × 10−34.7 × 10−21.1 × 10−25.0 × 10−319.005.9 × 10−31.6 × 10−13.9 × 10−21.5 × 10−219.33
Zn8.2 × 10−51.2 × 10−34.3 × 10−41.6 × 10−40.733.7 × 10−44.7 × 10−31.5 × 10−34.9 × 10−40.74
THI8.2 × 10−35.1 × 10−15.9 × 10−23.7 × 10−2100.003.3 × 10−21.9 × 1002.0 × 10−11.2 × 10−1100.00
Carcinogenic risks (Adults)Carcinogenic risks (Children)
SoilAs1.3 × 10−71.9 × 10−52.1 × 10−61.5 × 10−65.231.6 × 10−71.7 × 10−51.8 × 10−61.2 × 10−65.27
Cd2.3 × 10−86.4 × 10−65.2 × 10−74.2 × 10−71.332.2 × 10−86.2 × 10−64.5 × 10−73.5 × 10−71.33
Cr2.7 × 10−77.1 × 10−41.7 × 10−51.9 × 10−542.323.1 × 10−72.1 × 10−41.4 × 10−51.4 × 10−541.31
Ni3.0 × 10−73.5 × 10−42.0 × 10−52.2 × 10−550.834.9 × 10−76.6 × 10−41.7 × 10−52.0 × 10−551.81
Pb2.1 × 10−84.7 × 10−71.2 × 10−75.0 × 10−80.292.2 × 10−83.4 × 10−79.8 × 10−83.9 × 10−80.29
TCR3.2 × 10−67.5 × 10−43.9 × 10−53.1 × 10−5100.002.1 × 10−67.1 × 10−43.4 × 10−52.5 × 10−5100.00
Non-carcinogenic risks (Adults)Non-carcinogenic risks (Children)
TeaAs1.8 × 10−77.0 × 10−61.8 × 10−67.9 × 10−75.561.7 × 10−77.0 × 10−61.5 × 10−67.1 × 10−78.65
Cd3.3 × 10−72.3 × 10−52.9 × 10−61.9 × 10−68.991.4 × 10−71.1 × 10−51.4 × 10−69.2 × 10−78.13
Cr1.8 × 10−62.1 × 10−42.5 × 10−51.7 × 10−576.776.2 × 10−79.6 × 10−51.2 × 10−58.2 × 10−669.36
Hg9.1 × 10−81.3 × 10−63.9 × 10−71.6 × 10−71.204.8 × 10−89.4 × 10−72.5 × 10−71.1 × 10−71.42
Ni4.2 × 10−73.2 × 10−61.5 × 10−64.6 × 10−74.541.8 × 10−72.8 × 10−61.3 × 10−64.6 × 10−77.57
Pb7.0 × 10−82.5 × 10−64.9 × 10−72.4 × 10−71.523.8 × 10−82.0 × 10−64.4 × 10−72.3 × 10−72.51
Zn9.4 × 10−81.4 × 10−64.6 × 10−71.7 × 10−71.425.4 × 10−81.2 × 10−64.2 × 10−71.7 × 10−72.37
THI5.5 × 10−62.2 × 10−43.2 × 10−51.7 × 10−5100.002.8 × 10−61.0 × 10−41.8 × 10−58.6 × 10−6100.00
Carcinogenic risks (Adults)Carcinogenic risks (Children)
TeaAs4.8 × 10−111.8 × 10−93.3 × 10−101.5 × 10−100.896.8 × 10−125.3 × 10−106.5 × 10−113.3 × 10−110.99
Cd2.5 × 10−114.8 × 10−95.2 × 10−103.9 × 10−101.402.2 × 10−121.0 × 10−91.1 × 10−108.5 × 10−111.74
Cr8.8 × 10−101.1 × 10−71.1 × 10−87.4 × 10−930.251.2 × 10−101.8 × 10−81.4 × 10−99.9 × 10−1021.43
Ni5.6 × 10−91.2 × 10−72.5 × 10−81.1 × 10−867.435.4 × 10−101.0 × 10−75.0 × 10−93.0 × 10−975.82
Pb9.9 × 10−133.9 × 10−117.1 × 10−123.2 × 10−120.021.6 × 10−135.4 × 10−121.4 × 10−126.6 × 10−130.02
TCR9.4 × 10−91.8 × 10−73.7 × 10−81.4 × 10−8100.001.1 × 10−91.2 × 10−76.6 × 10−93.5 × 10−9100.00
Disclaimer/Publisher’s Note: The statements, opinions and data contained in all publications are solely those of the individual author(s) and contributor(s) and not of MDPI and/or the editor(s). MDPI and/or the editor(s) disclaim responsibility for any injury to people or property resulting from any ideas, methods, instructions or products referred to in the content.

