
Investigating the Serviceability of Urban Green Spaces from a Spatial Perspective: A Comparative Study Across 368 Cities on the Chinese Mainland


Abstract
1. Introduction
2. Study Area and Data
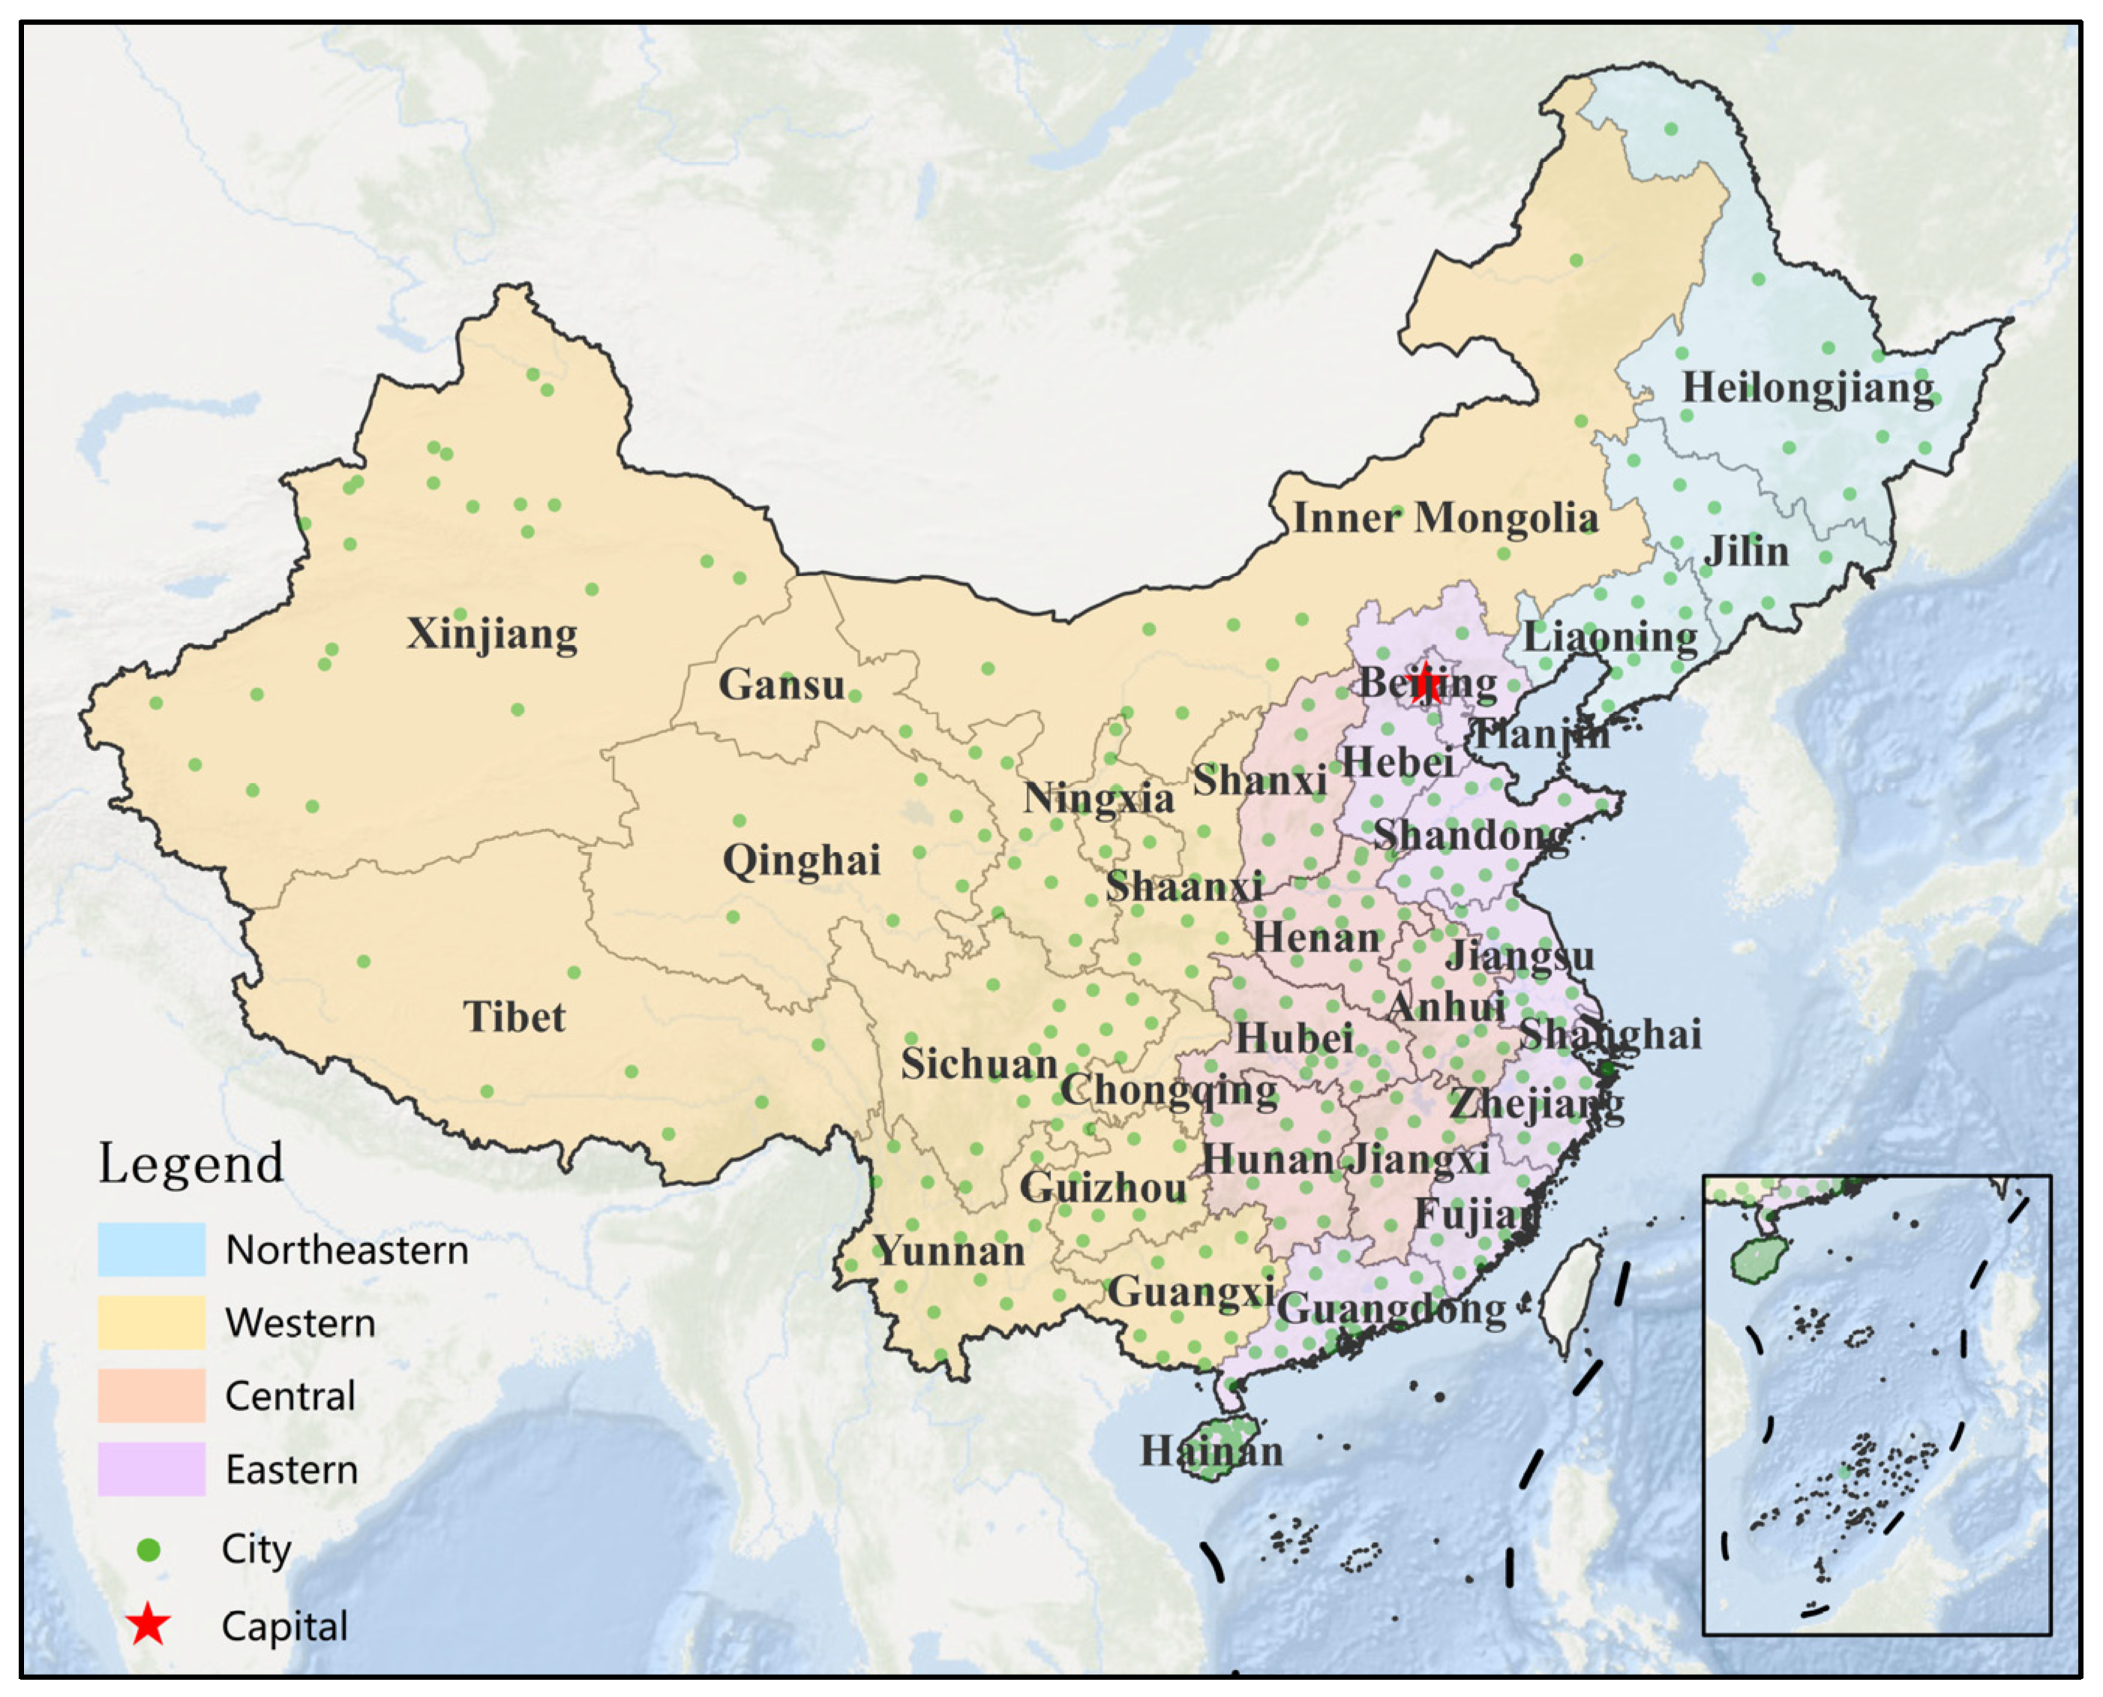
2.1. Study Area
2.2. Dataset
2.2.1. Satellite Imagery
2.2.2. Building Rooftop Area Data
2.2.3. OSM Road Network
2.2.4. Population Data
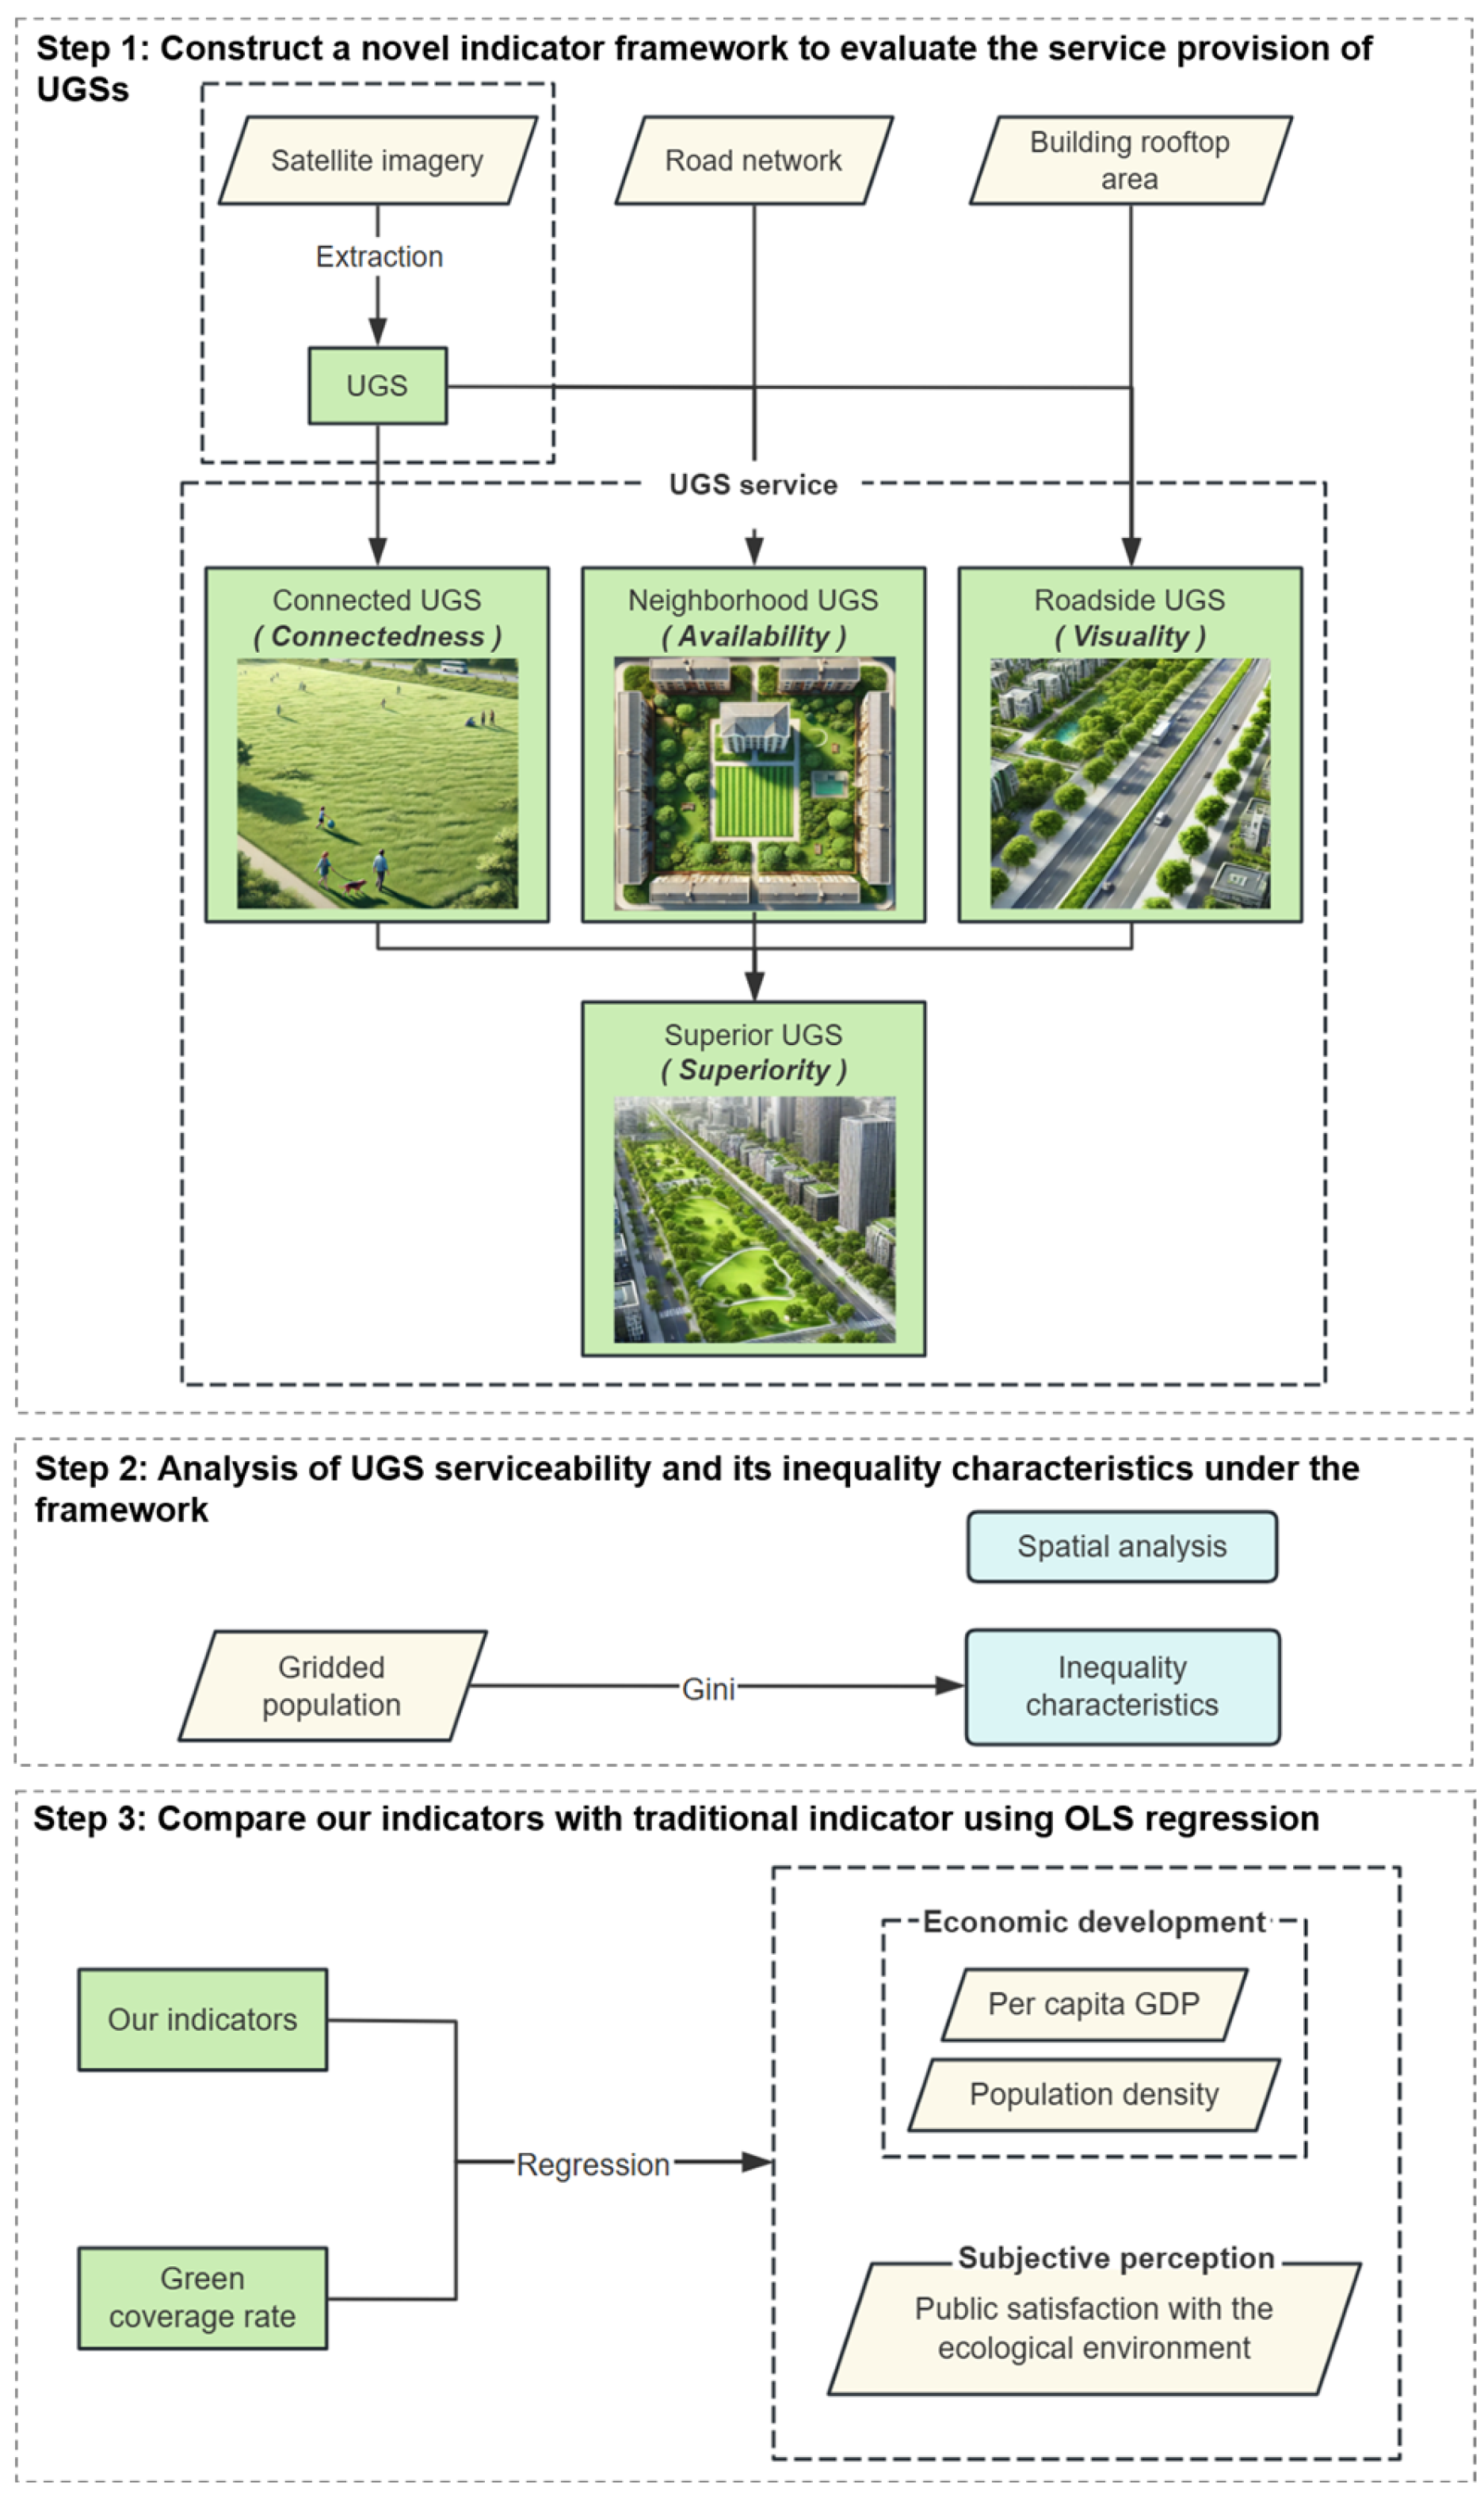
3. Methods
3.1. Extraction of Green Space
3.2. Indicator Framework for UGS Serviceability Assessment
3.2.1. Connectedness
3.2.2. Visuality
3.2.3. Availability
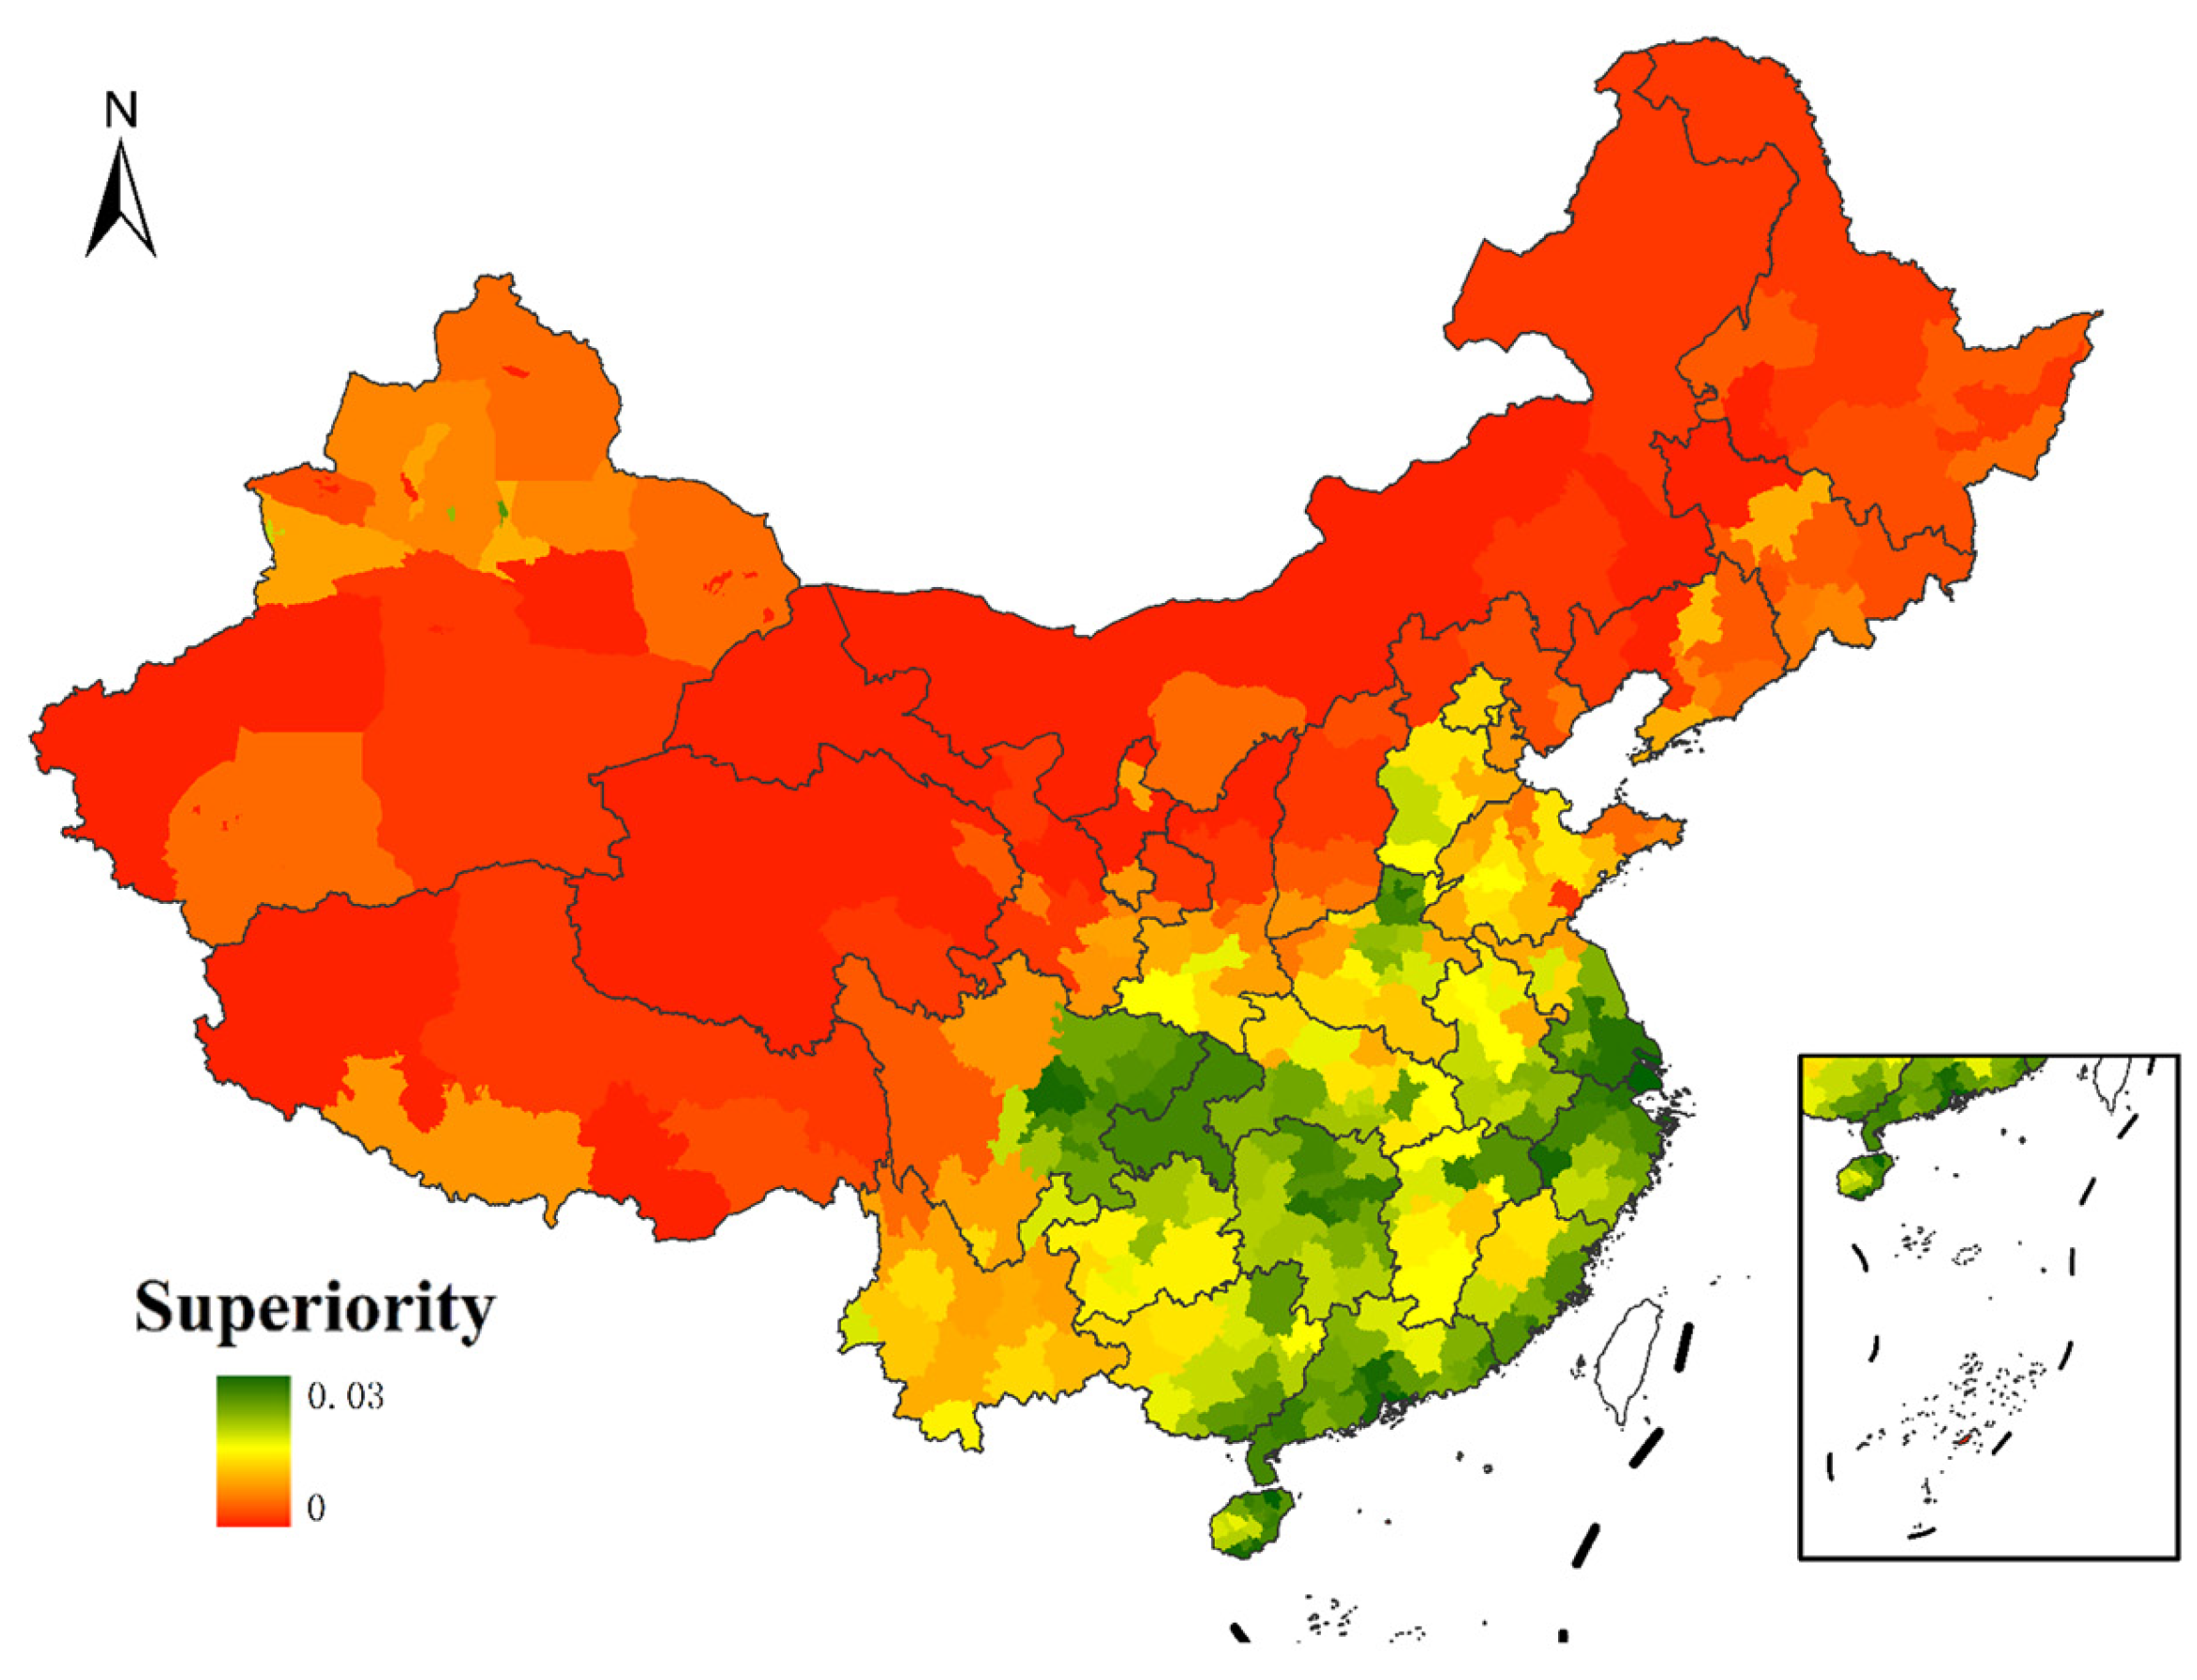
3.2.4. Superiority
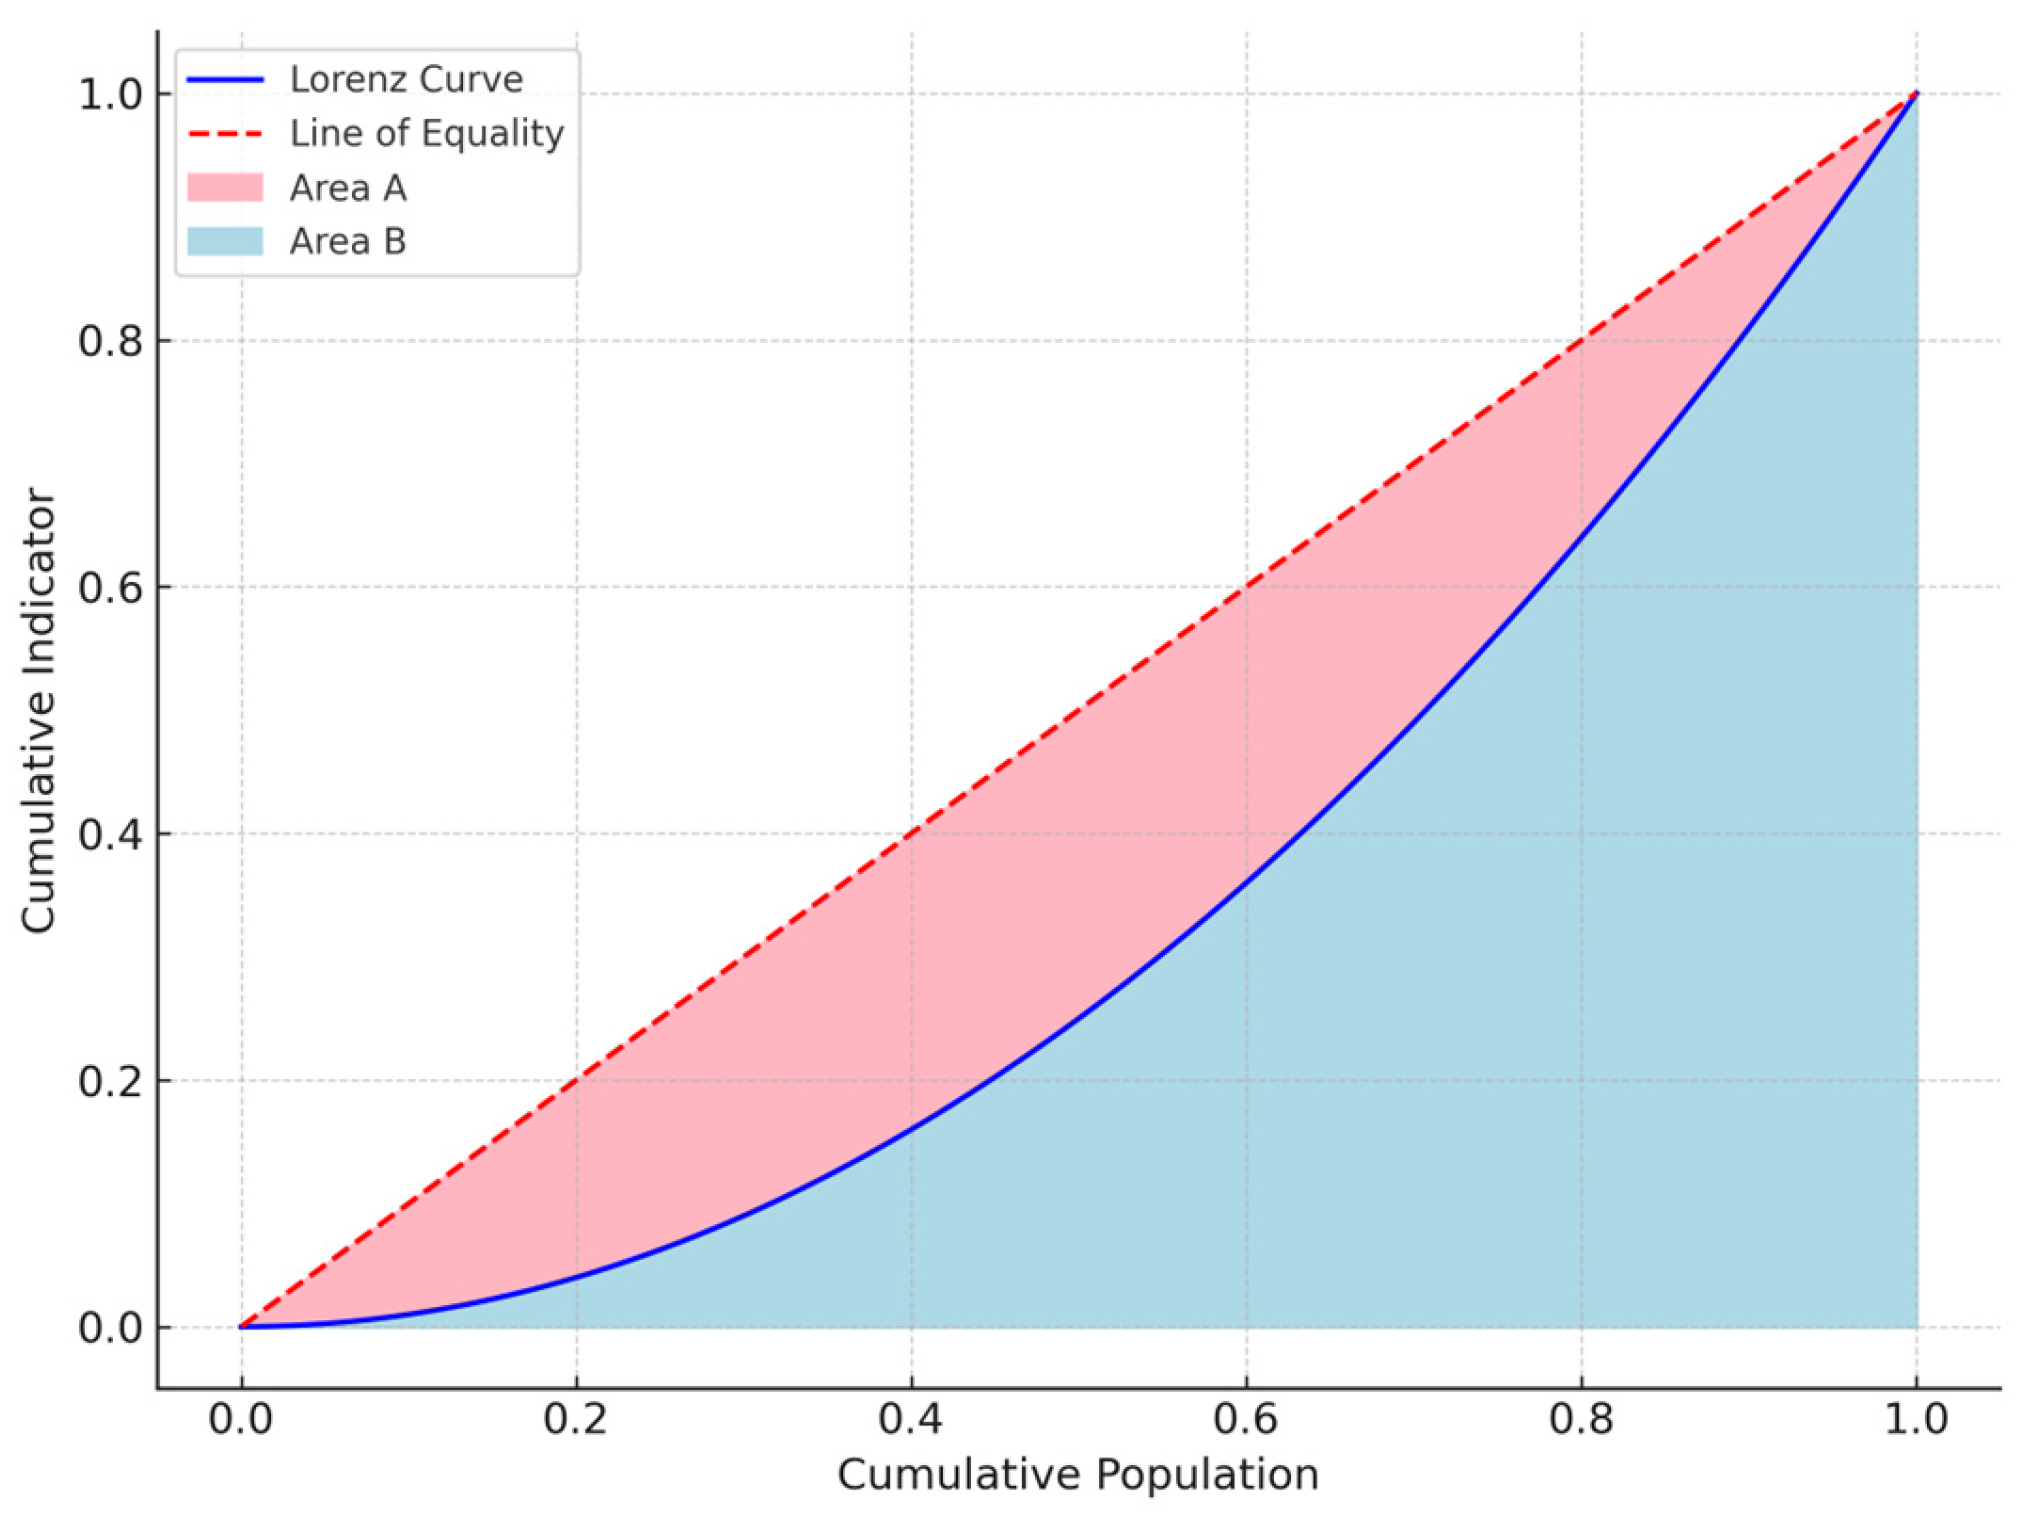
3.3. Spatial Inequality in People’s Utilization of UGS Services
4. Results and Analysis
4.1. Evaluation of UGS Serviceability Under the Indicator Framework
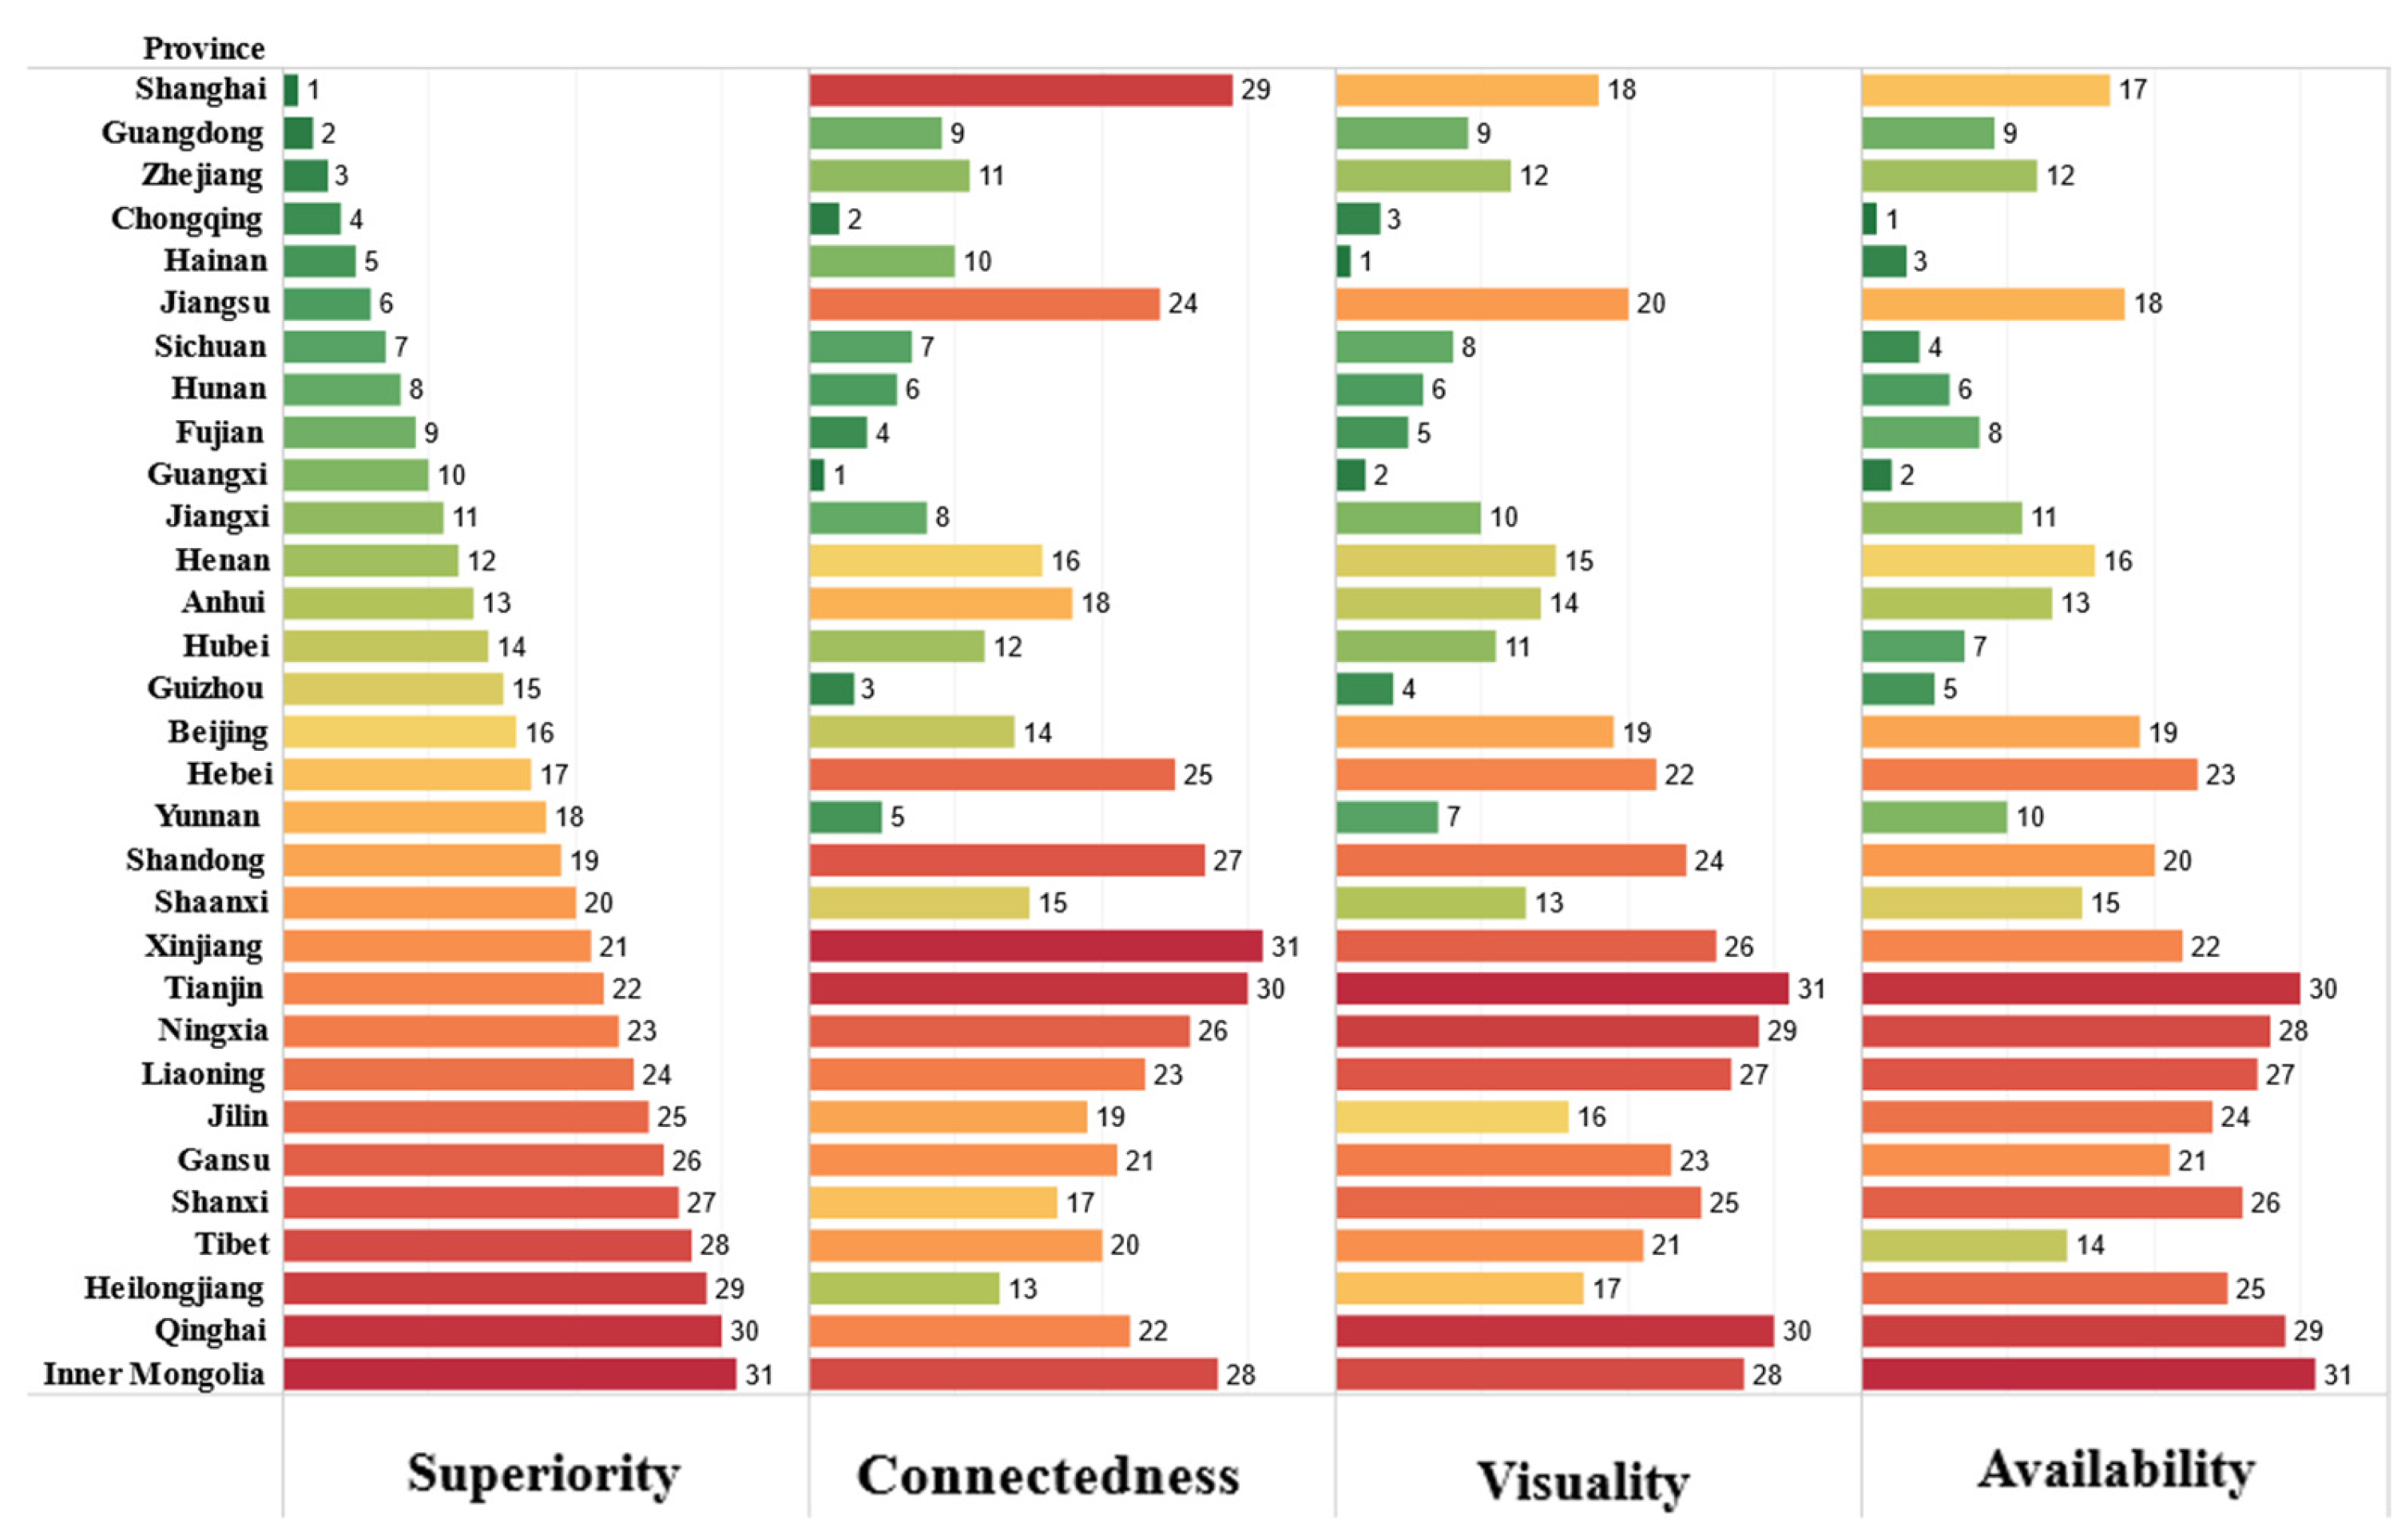
4.1.1. Spatial Analysis on Different Indicators of UGSs
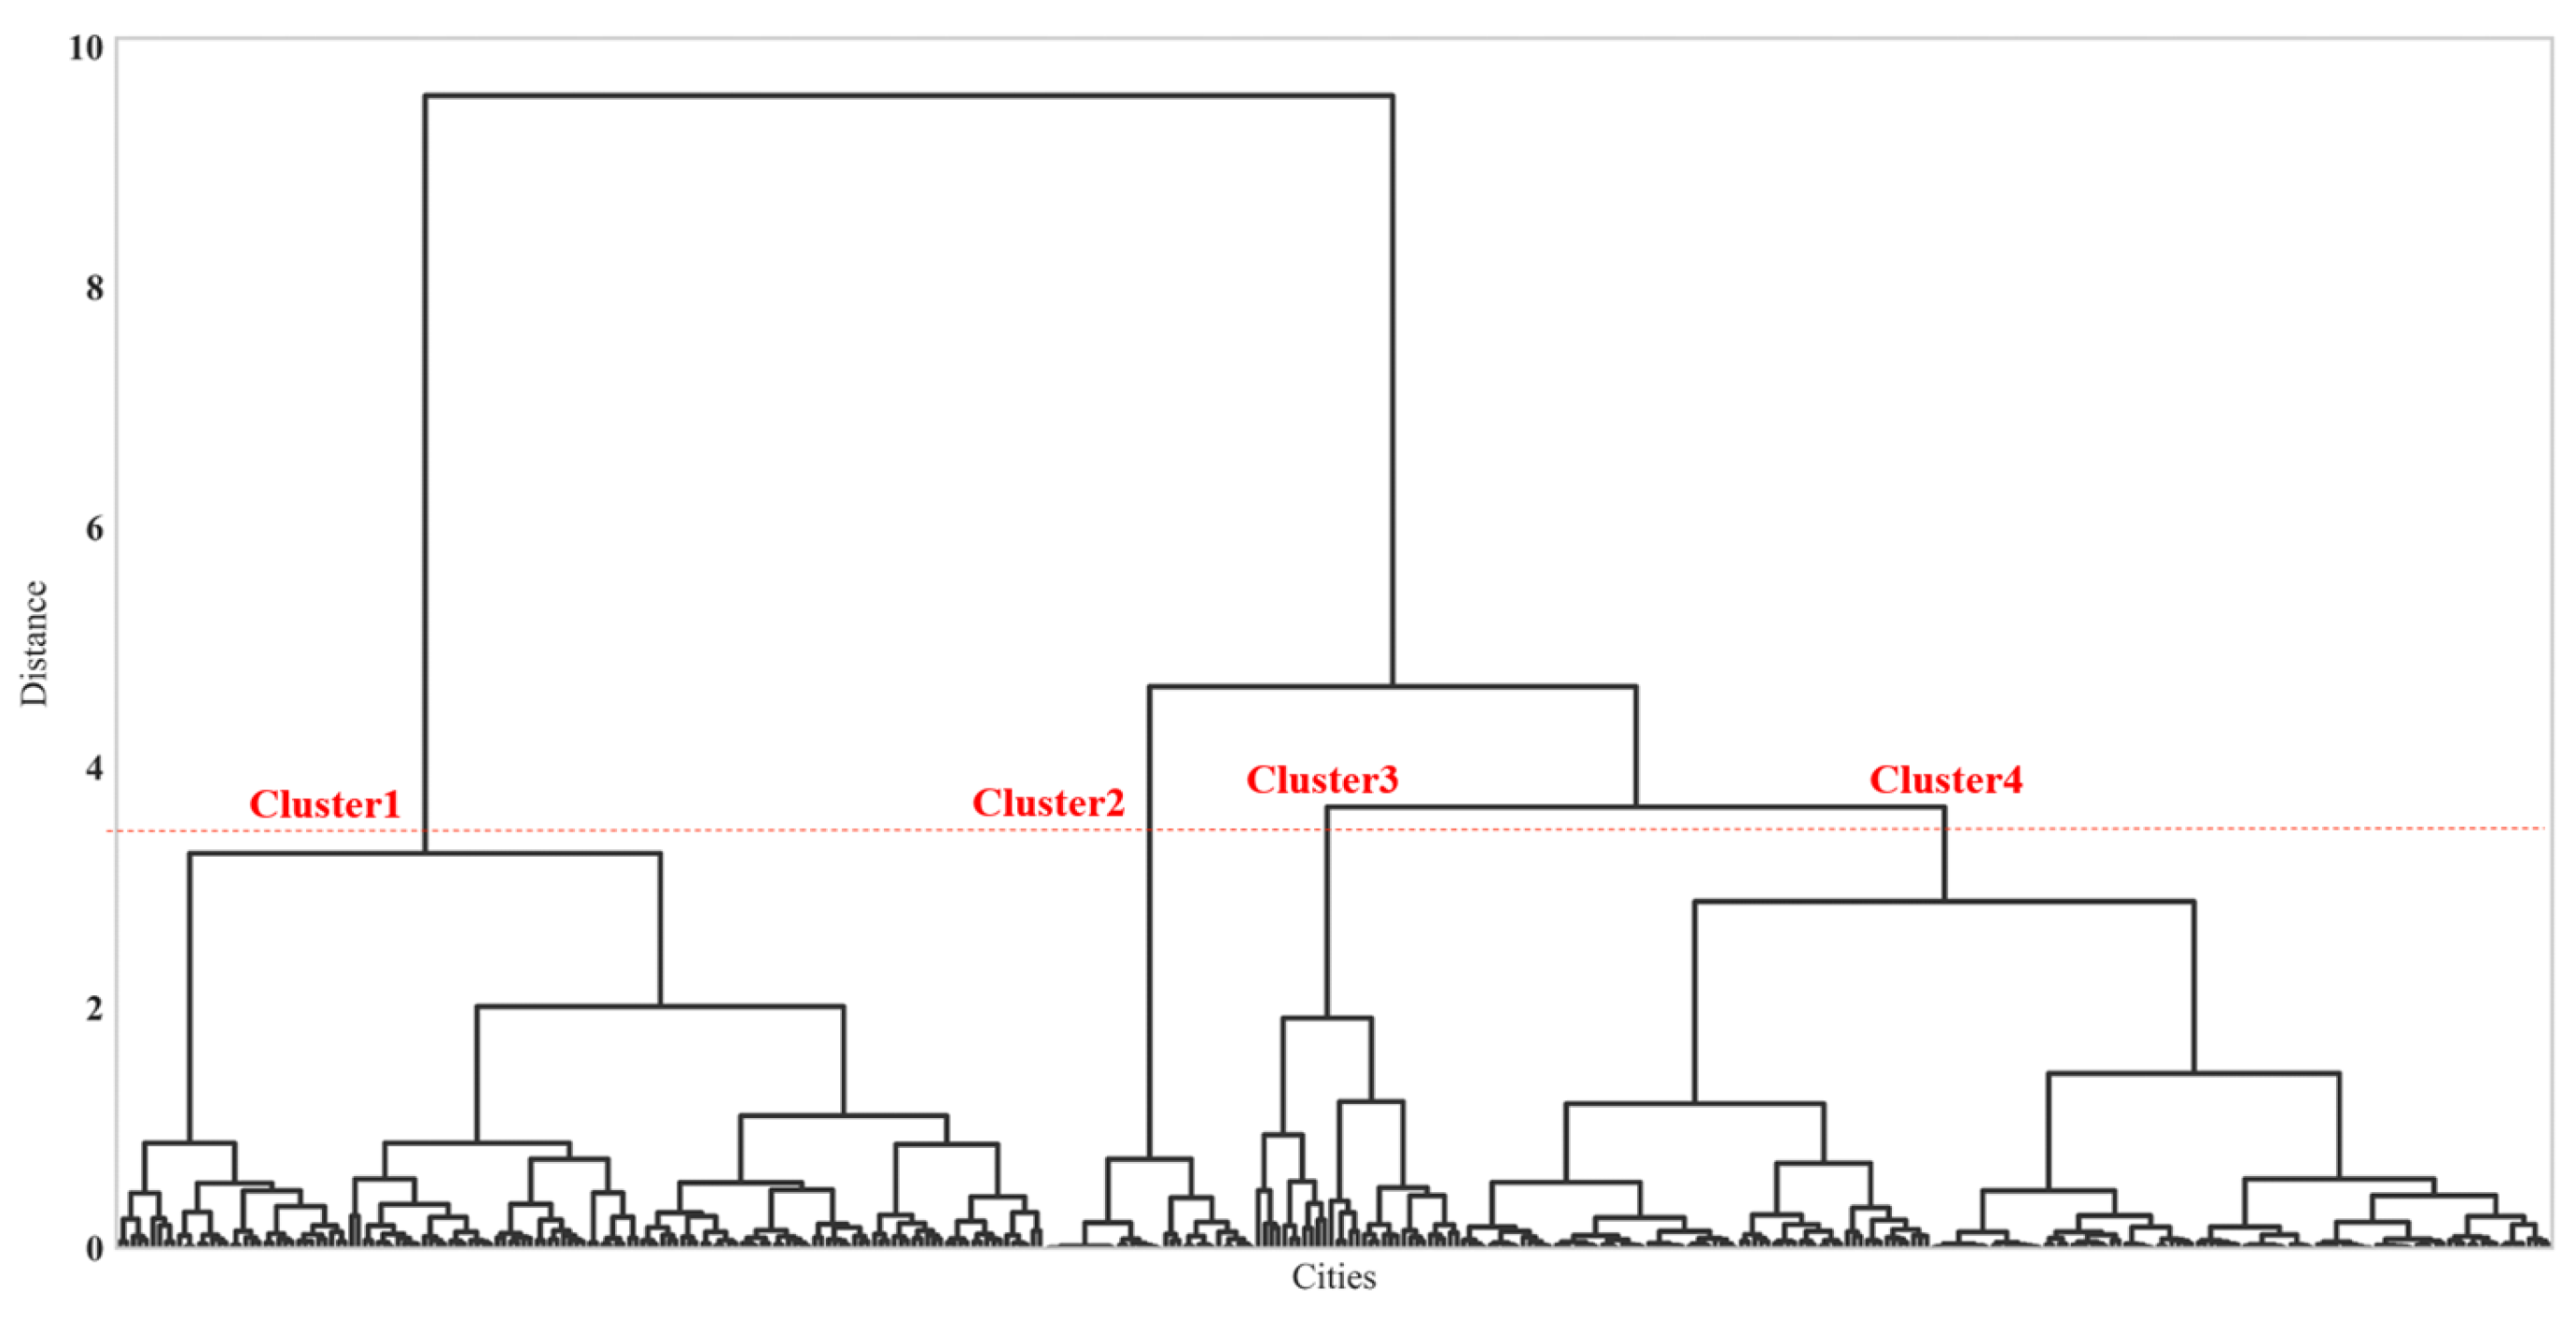
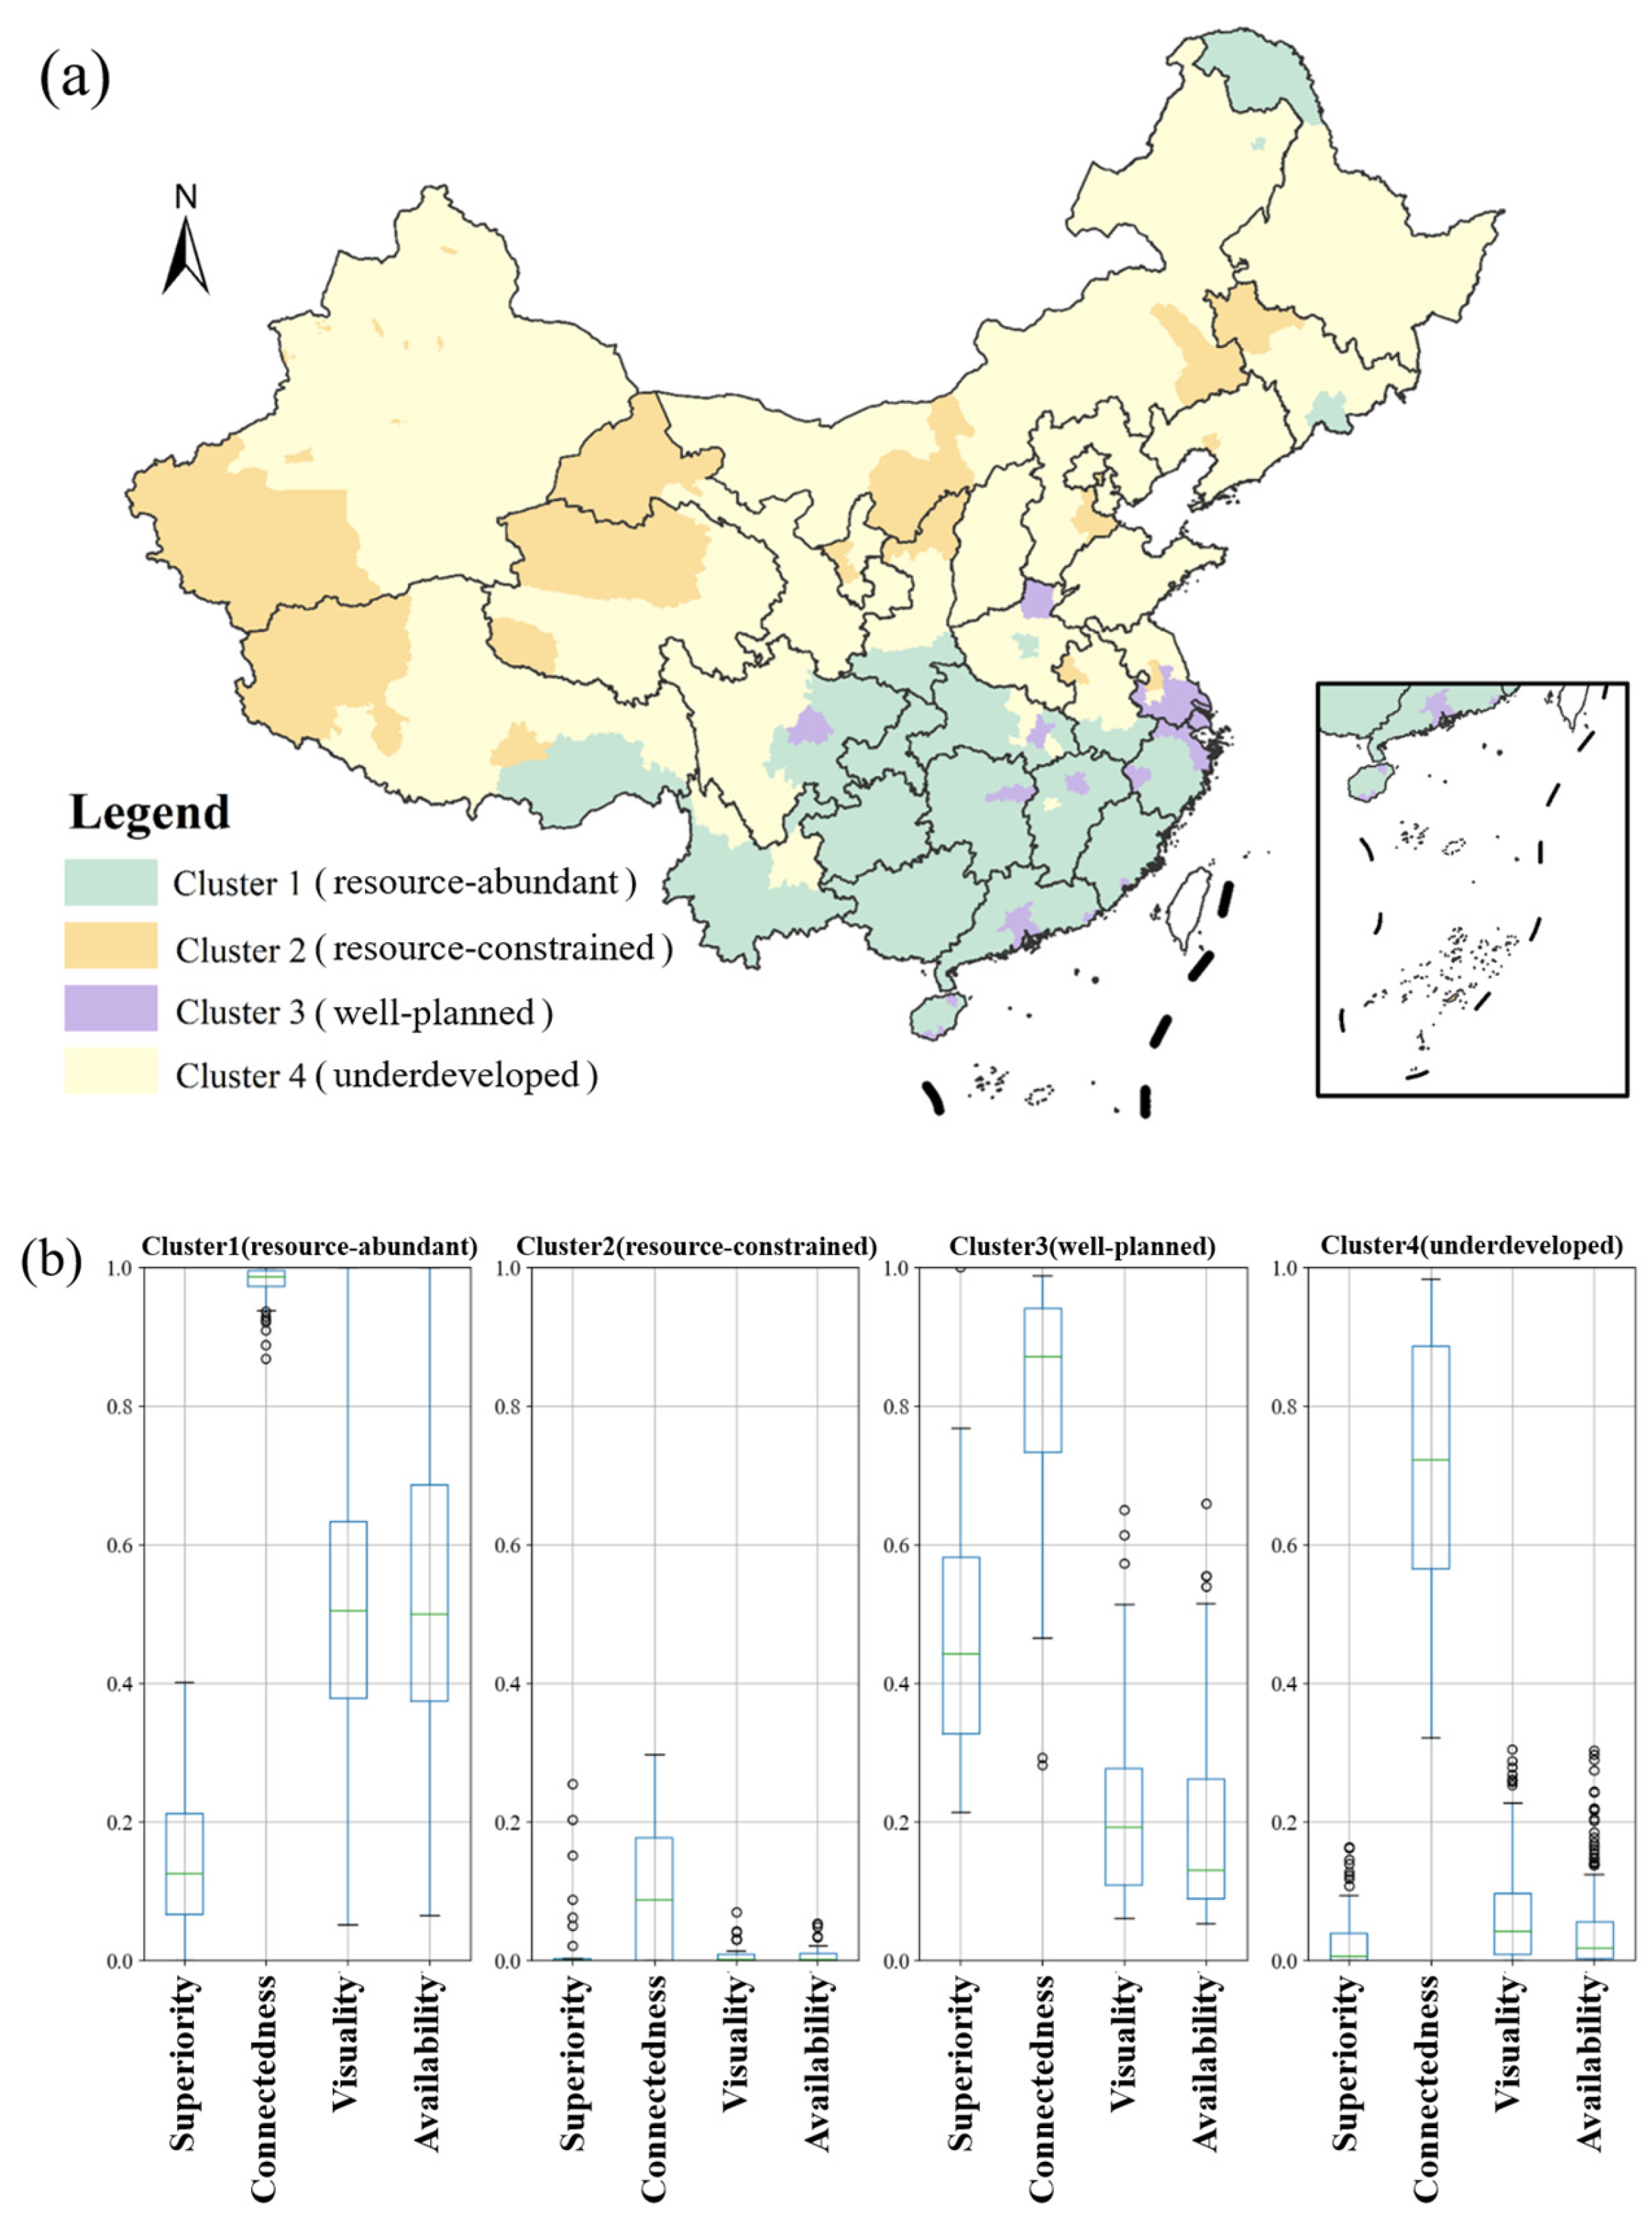
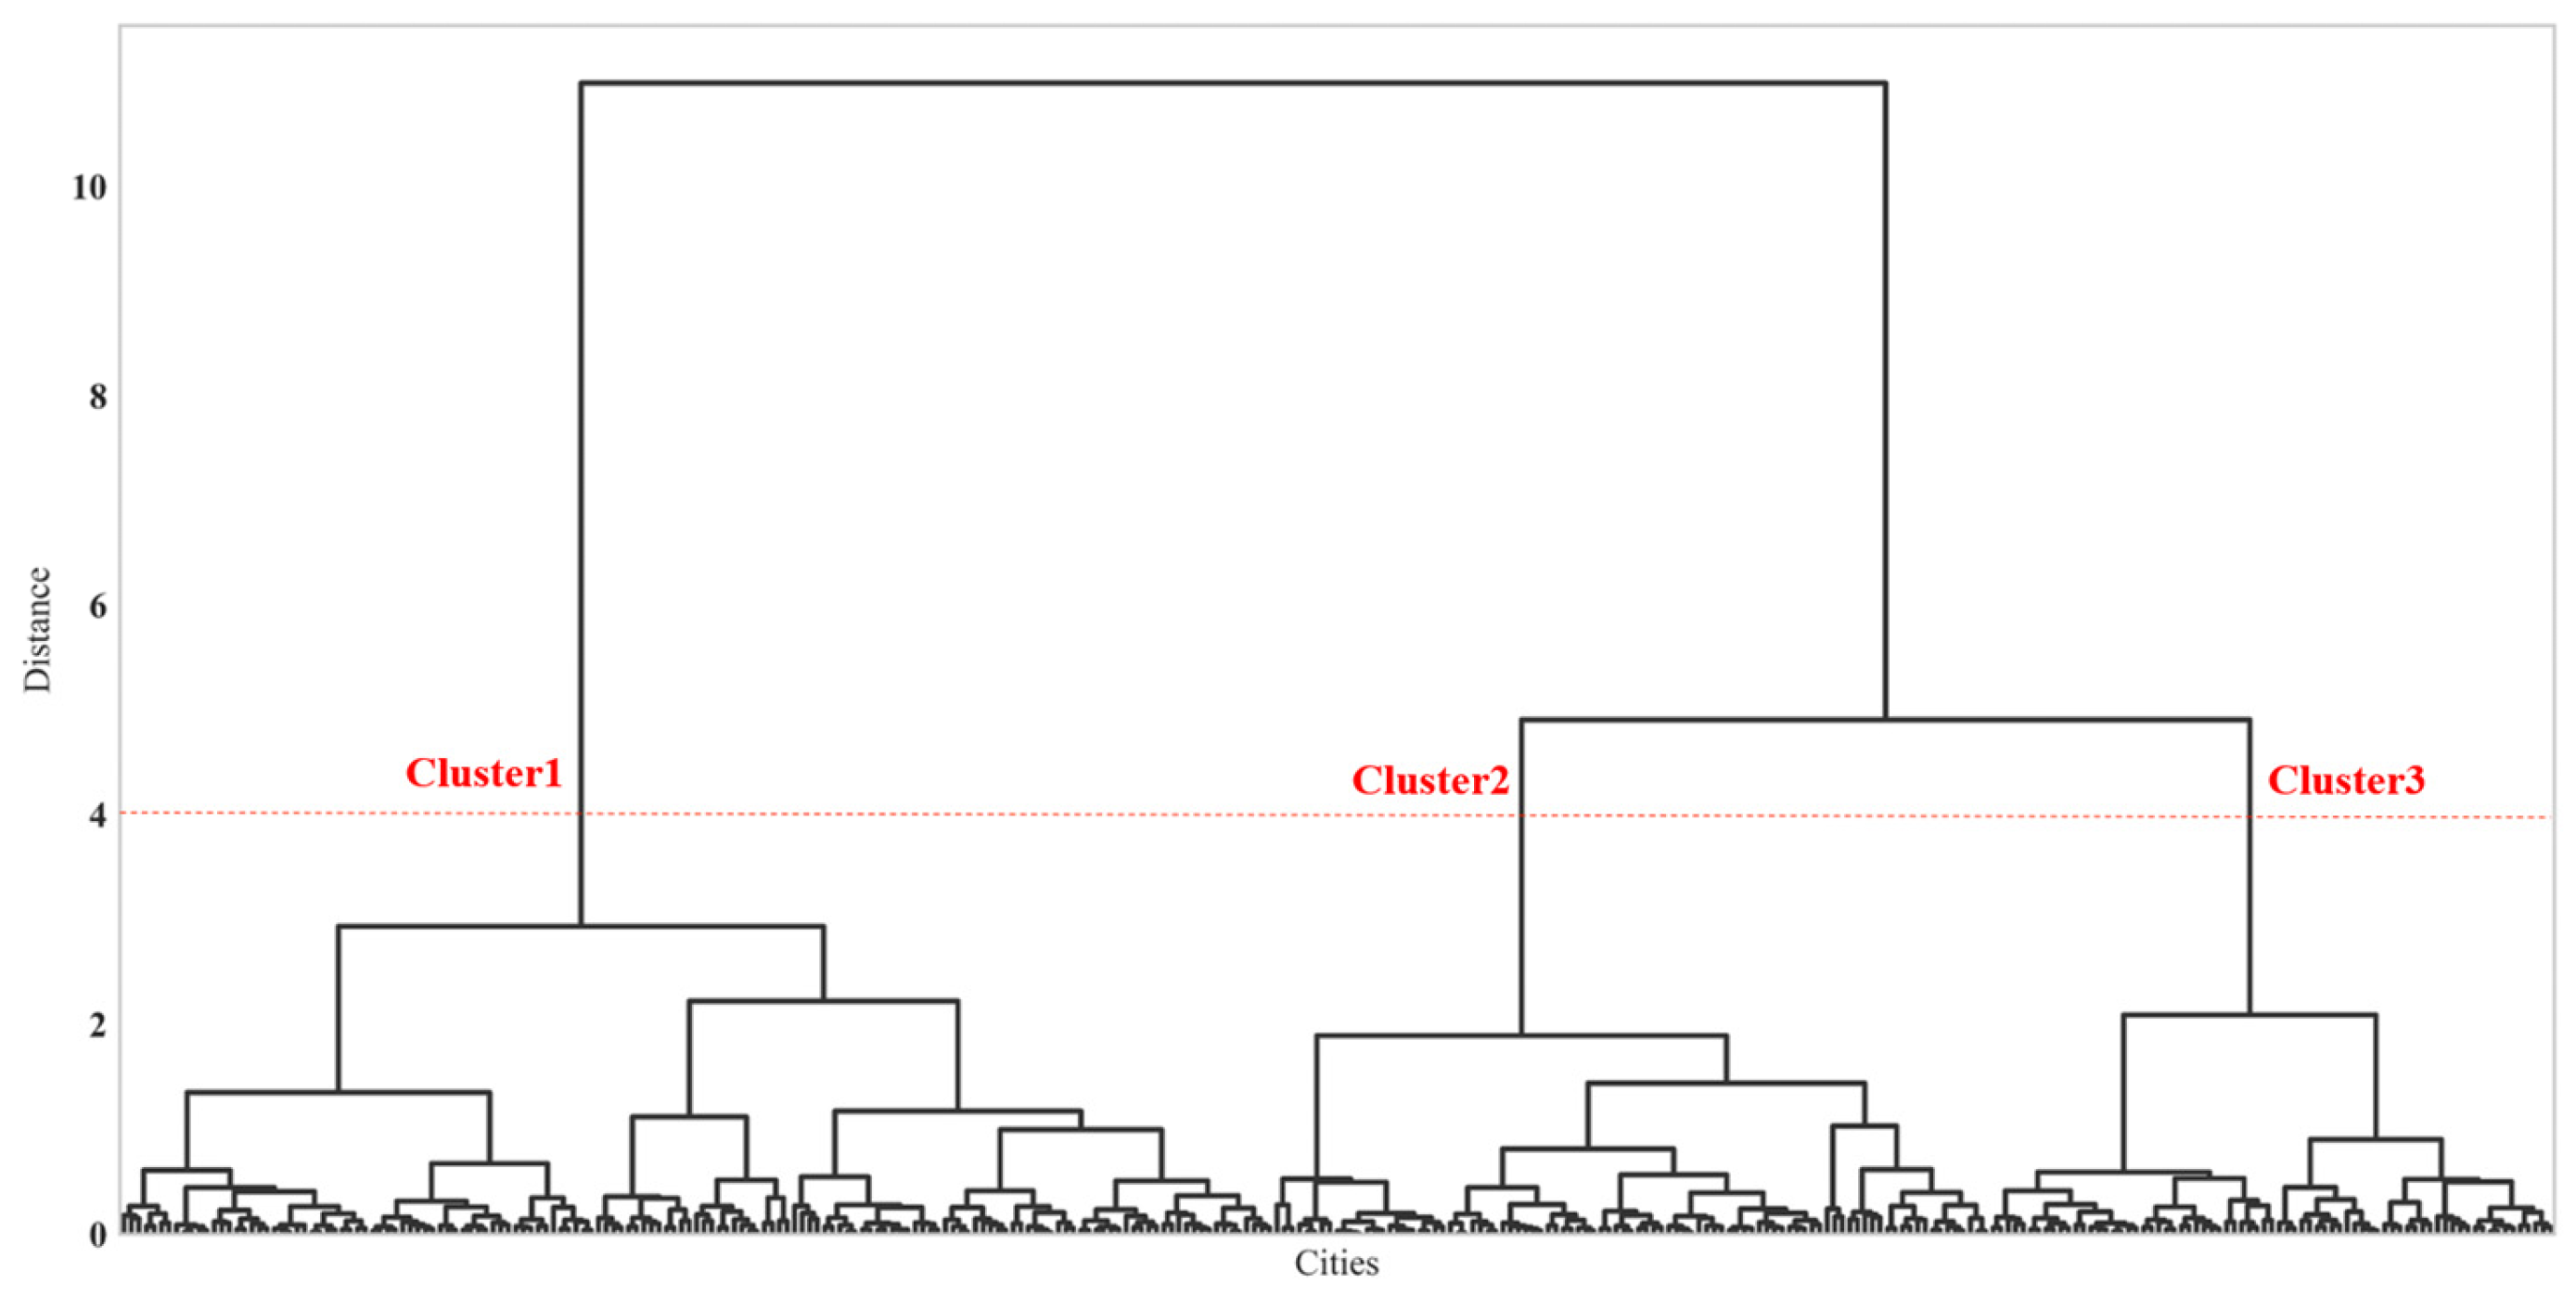
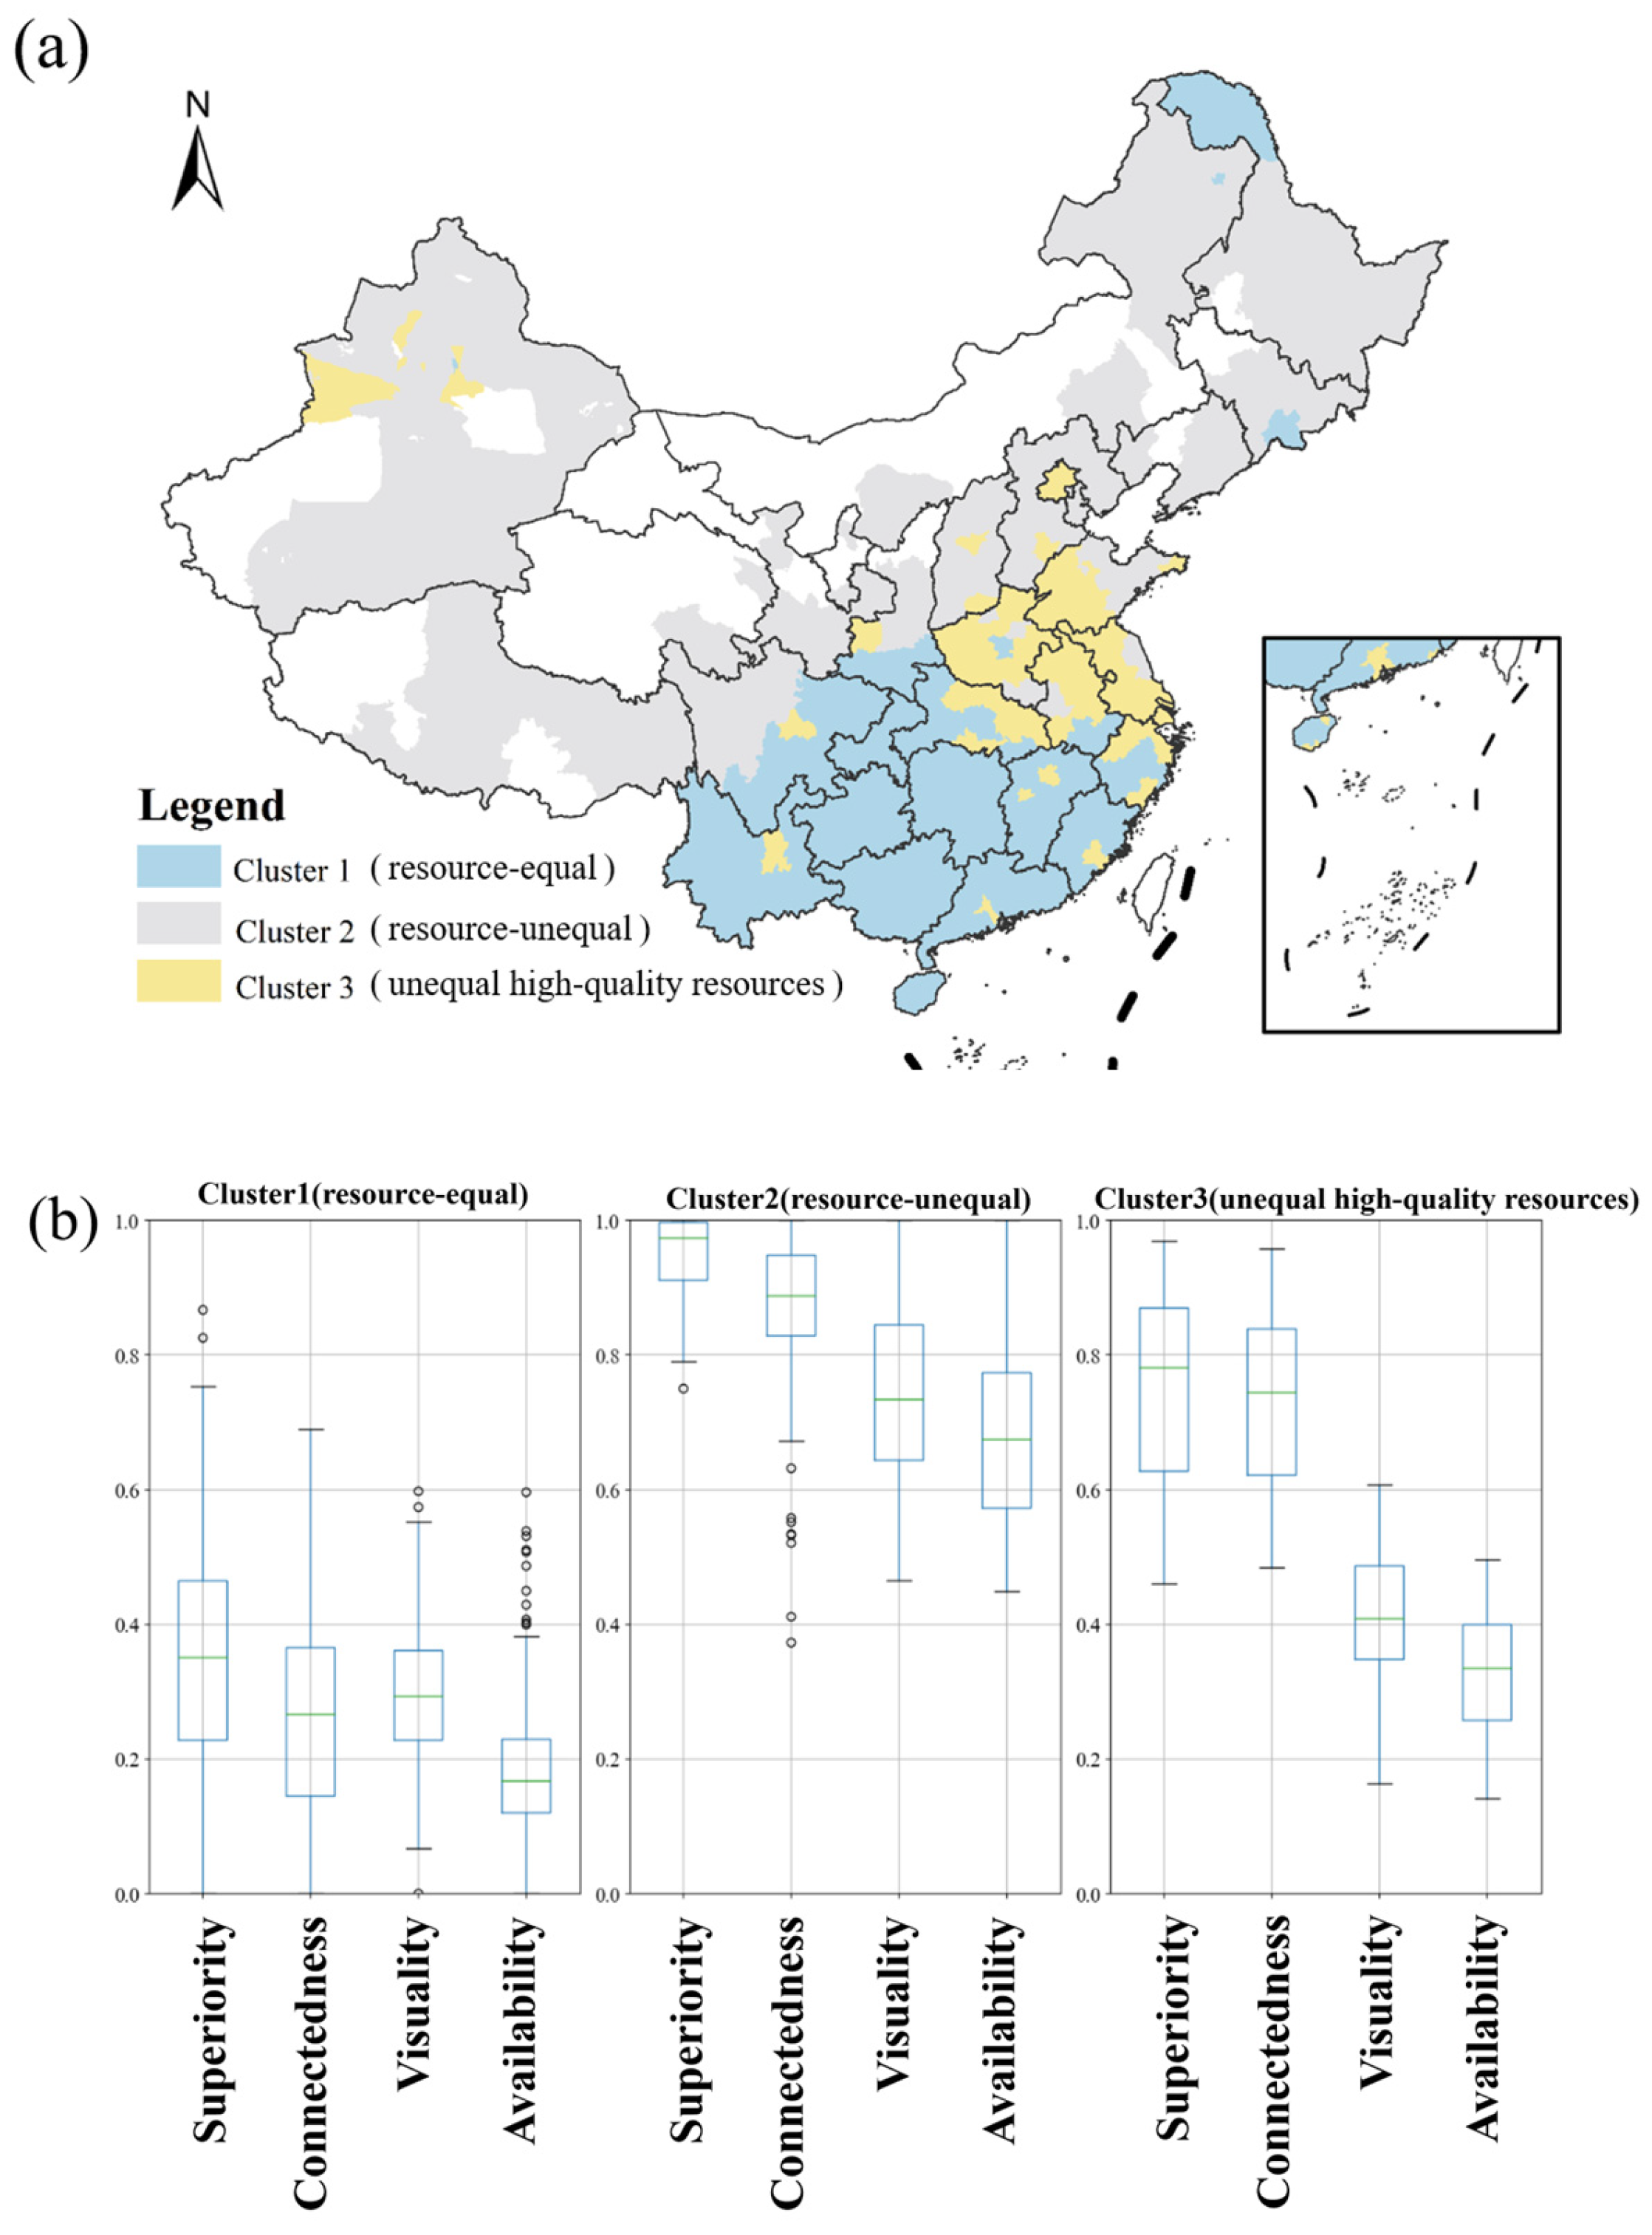
4.1.2. Urban Cluster Characteristics Based on UGS Serviceability Classification
4.2. Inequality Characteristics Associated with UGS Services
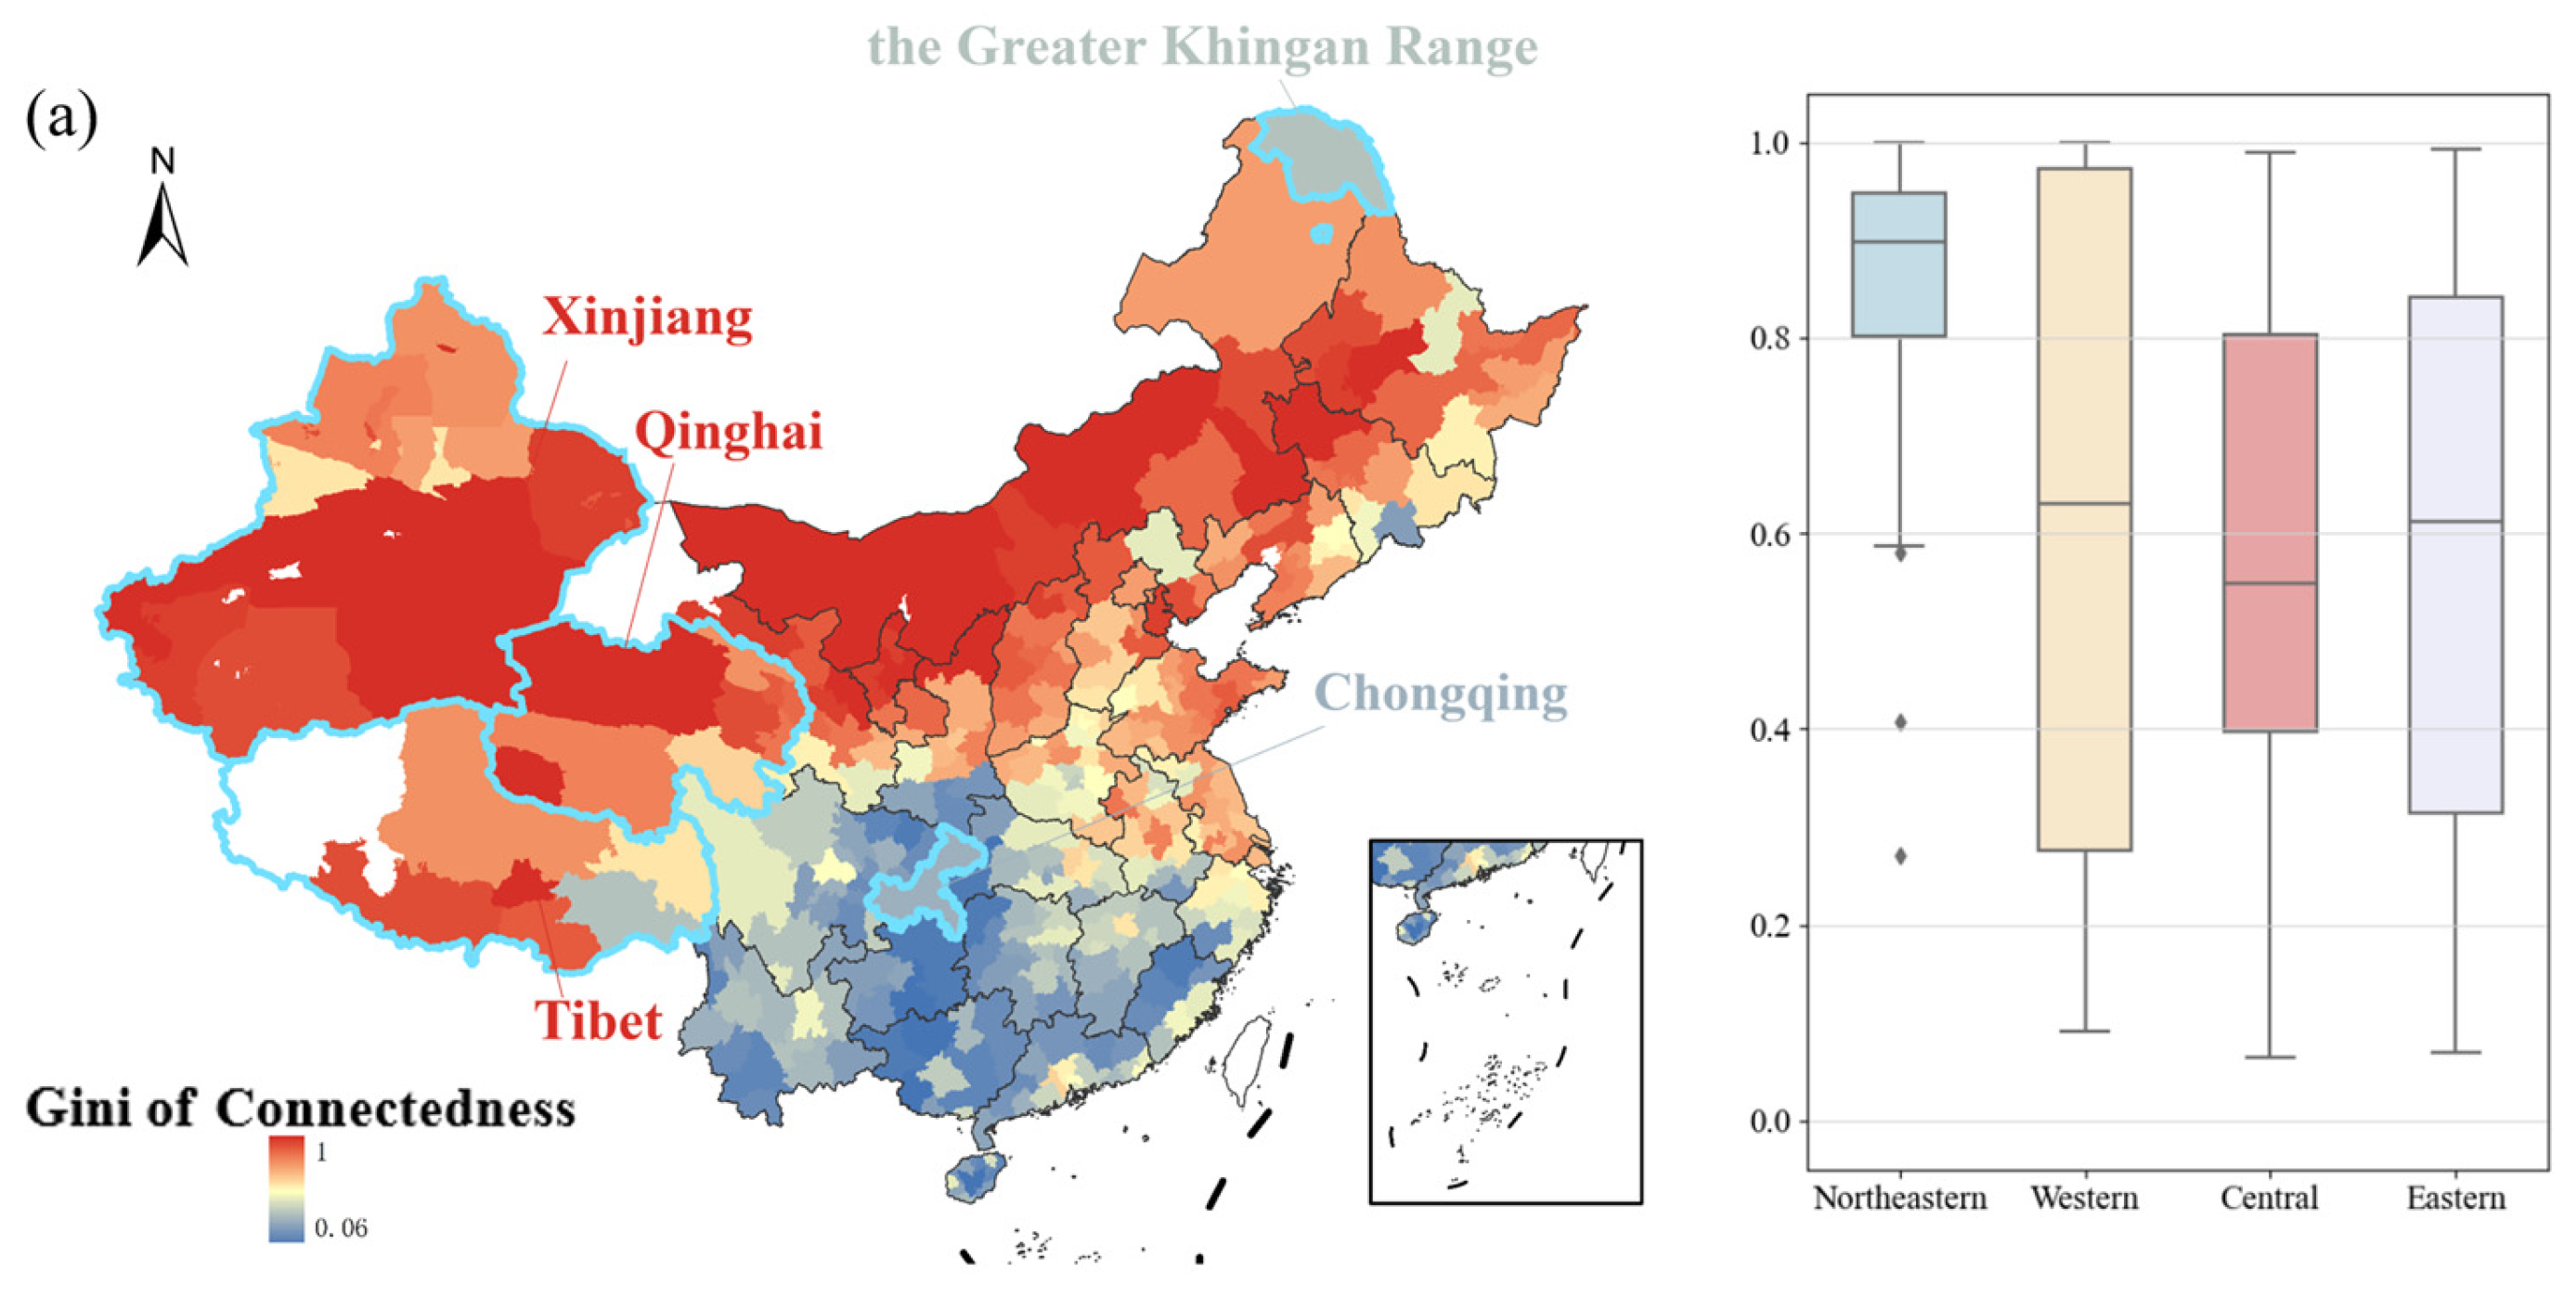
4.2.1. Analysis of Gini Coefficients for Proposed Indicators in Cities
4.2.2. Hierarchical Clustering of UGS Utilization Inequality Across Cities
4.3. Validation of the Rationality of Our Indicator Framework
5. Discussion and Conclusions
Author Contributions
Funding
Data Availability Statement
Conflicts of Interest
References
- Aronson, M.F.; Lepczyk, C.A.; Evans, K.L.; Goddard, M.A.; Lerman, S.B.; MacIvor, J.S.; Nilon, C.H.; Vargo, T. Biodiversity in the City: Key Challenges for Urban Green Space Management. Front. Ecol. Environ. 2017, 15, 189–196. [Google Scholar] [CrossRef]
- Baldauf, R. Air Pollution Mitigation through Vegetation Barriers and Green Space. In Traffic-Related Air Pollution; Elsevier: Amsterdam, The Netherlands, 2020; pp. 437–453. [Google Scholar]
- Margaritis, E.; Kang, J. Relationship between Green Space-Related Morphology and Noise Pollution. Ecol. Indic. 2017, 72, 921–933. [Google Scholar] [CrossRef]
- Koprowska, K.; Laszkiewicz, E.; Kronenberg, J. Is Urban Sprawl Linked to Green Space Availability? Ecol. Indic. 2020, 108, 105723. [Google Scholar] [CrossRef]
- Cheng, M.; Duan, C. The Changing Trends of Internal Migration and Urbanization in China: New Evidence from the Seventh National Population Census. China Popul. Dev. Stud. 2021, 5, 275–295. [Google Scholar] [CrossRef]
- Mao, Q.; Wang, L.; Guo, Q.; Li, Y.; Liu, M.; Xu, G. Evaluating Cultural Ecosystem Services of Urban Residential Green Spaces from the Perspective of Residents’ Satisfaction with Green Space. Front. Public Health 2020, 8, 226. [Google Scholar] [CrossRef]
- Xiao, Y.; Li, Z.; Webster, C. Estimating the Mediating Effect of Privately-Supplied Green Space on the Relationship between Urban Public Green Space and Property Value: Evidence from Shanghai, China. Land Use Policy 2016, 54, 439–447. [Google Scholar] [CrossRef]
- Liang, H.; Yan, Q.; Yan, Y. Evaluating Green Space Provision Development in Shanghai (2012–2021): A Focus on Accessibility and Service Efficiency. Sustain. Cities Soc. 2024, 103, 105269. [Google Scholar] [CrossRef]
- Wang, Y.; Chen, X.; Zhang, Z.; Xue, B.; Lu, C. Cross-City Convergence in Urban Green Space Coverage in China. Sustainability 2019, 11, 4707. [Google Scholar] [CrossRef]
- Yang, J.; Huang, C.; Zhang, Z.; Wang, L. The Temporal Trend of Urban Green Coverage in Major Chinese Cities between 1990 and 2010. Urban For. Urban Green. 2014, 13, 19–27. [Google Scholar] [CrossRef]
- Zhao, J.; Chen, S.; Jiang, B.; Ren, Y.; Wang, H.; Vause, J.; Yu, H. Temporal Trend of Green Space Coverage in China and Its Relationship with Urbanization over the Last Two Decades. Sci. Total Environ. 2013, 442, 455–465. [Google Scholar] [CrossRef]
- Annerstedt Van Den Bosch, M.; Mudu, P.; Uscila, V.; Barrdahl, M.; Kulinkina, A.; Staatsen, B.; Swart, W.; Kruize, H.; Zurlyte, I.; Egorov, A.I. Development of an Urban Green Space Indicator and the Public Health Rationale. Scand. J. Public Health 2016, 44, 159–167. [Google Scholar] [CrossRef] [PubMed]
- Chen, W.Y.; Wang, C.; Su, Y. Urban Forest Planning and Policy in China. In Green Infrastructure in Chinese Cities; Springer: Singapore, 2022; pp. 55–68. [Google Scholar]
- Yuan, L.; Shin, K.; Managi, S. Subjective Well-Being and Environmental Quality: The Impact of Air Pollution and Green Coverage in China. Ecol. Econ. 2018, 153, 124–138. [Google Scholar] [CrossRef]
- Mihara, K.; Hii, D.J.C.; Takasuna, H.; Sakata, K. How Does Green Coverage Ratio and Spaciousness Affect Self-Reported Performance and Mood? Build. Environ. 2023, 245, 110939. [Google Scholar] [CrossRef]
- Chen, W.Y.; Hu, F.Z.Y. Producing Nature for Public: Land-Based Urbanization and Provision of Public Green Spaces in China. Appl. Geogr. 2015, 58, 32–40. [Google Scholar]
- Cetin, M. Using GIS Analysis to Assess Urban Green Space in Terms of Accessibility: Case Study in Kutahya. Int. J. Sustain. Dev. World Ecol. 2015, 22, 420–424. [Google Scholar] [CrossRef]
- Mears, M.; Brindley, P.; Jorgensen, A.; Ersoy, E.; Maheswaran, R. Greenspace Spatial Characteristics and Human Health in an Urban Environment: An Epidemiological Study Using Landscape Metrics in Sheffield, UK. Ecol. Indic. 2019, 106, 105464. [Google Scholar]
- Wu, C.; Gao, P.; Xu, R.; Mu, X.; Sun, W. Influence of Landscape Pattern Changes on Water Conservation Capacity: A Case Study in an Arid/Semiarid Region of China. Ecol. Indic. 2024, 163, 112082. [Google Scholar]
- Xue, S.; Ma, B.; Wang, C.; Li, Z. Identifying Key Landscape Pattern Indices Influencing the NPP: A Case Study of the Upper and Middle Reaches of the Yellow River. Ecol. Model. 2023, 484, 110457. [Google Scholar]
- Ta, N.; Li, H.; Zhu, Q.; Wu, J. Contributions of the Quantity and Quality of Neighborhood Green Space to Residential Satisfaction in Suburban Shanghai. Urban For. Urban Green. 2021, 64, 127293. [Google Scholar] [CrossRef]
- Zhang, J. Inequalities in the Quality and Proximity of Green Space Exposure Are More Pronounced than in Quantity Aspect: Evidence from a Rapidly Urbanizing Chinese City. Urban For. Urban Green. 2023, 79, 127811. [Google Scholar] [CrossRef]
- Ye, Y.; Xiang, Y.; Qiu, H.; Li, X. Revealing Urban Greenspace Accessibility Inequity Using the Carrying Capacity-Based 3SFCA Method and Location Big Data. Sustain. Cities Soc. 2024, 108, 105513. [Google Scholar]
- Monteiro, R.; Ferreira, J.C.; Antunes, P. Green Infrastructure Planning Principles: An Integrated Literature Review. Land 2020, 9, 525. [Google Scholar] [CrossRef]
- Delgado-Serrano, M.M.; Melichová, K.; Mac Fadden, I.; Cruz-Piedrahita, C. Perception of Green Spaces’ Role in Enhancing Mental Health and Mental Well-Being in Small and Medium-Sized Cities. Land Use Policy 2024, 139, 107087. [Google Scholar]
- Lau, K.K.-L.; Yung, C.C.-Y.; Tan, Z. Usage and Perception of Urban Green Space of Older Adults in the High-Density City of Hong Kong. Urban For. Urban Green. 2021, 64, 127251. [Google Scholar]
- Gupta, K.; Roy, A.; Luthra, K.; Maithani, S. Mahavir GIS Based Analysis for Assessing the Accessibility at Hierarchical Levels of Urban Green Spaces. Urban For. Urban Green. 2016, 18, 198–211. [Google Scholar] [CrossRef]
- Song, Y.; Huang, B.; Cai, J.; Chen, B. Dynamic Assessments of Population Exposure to Urban Greenspace Using Multi-Source Big Data. Sci. Total Environ. 2018, 634, 1315–1325. [Google Scholar] [CrossRef]
- Clarke, P.J.; Ailshire, J.A.; House, J.S.; Morenoff, J.D.; King, K.; Melendez, R.; Langa, K.M. Cognitive Function in the Community Setting: The Neighbourhood as a Source of ‘Cognitive Reserve’? J. Epidemiol. Community Health 2012, 66, 730–736. [Google Scholar]
- Wu, Y.-T.; Prina, A.M.; Jones, A.P.; Barnes, L.E.; Matthews, F.E.; Brayne, C. Community Environment, Cognitive Impairment and Dementia in Later Life: Results from the Cognitive Function and Ageing Study. Age Ageing 2015, 44, 1005–1011. [Google Scholar] [PubMed]
- Du, H.; Zhou, F.; Cai, Y.; Li, C.; Xu, Y. Research on Public Health and Well-Being Associated to the Vegetation Configuration of Urban Green Space, a Case Study of Shanghai, China. Urban For. Urban Green. 2021, 59, 126990. [Google Scholar]
- Zhang, J.; Wu, F. China’s Changing Economic Governance: Administrative Annexation and the Reorganization of Local Governments in the Yangtze River Delta. Reg. Stud. 2006, 40, 3–21. [Google Scholar]
- National Bureau of Statistics of the People’s Republic of China. China Statistical Yearbook; China Statistics Press: Beijing, China, 2018.
- Liu, Z.; Tang, H.; Feng, L.; Lyu, S. CBRA: The First Multi-Annual (2016–2021) and High-Resolution (2.5 m) Building Rooftop Area Dataset in China Derived with Super-Resolution Segmentation from Sentinel-2 Imagery. Earth Syst. Sci. Data Discuss. 2023, 15, 3547–3572. [Google Scholar]
- Zhang, Y.; Li, X.; Wang, A.; Bao, T.; Tian, S. Density and Diversity of OpenStreetMap Road Networks in China. J. Urban Manag. 2015, 4, 135–146. [Google Scholar]
- Chen, R.; Yan, H.; Liu, F.; Du, W.; Yang, Y. Multiple Global Population Datasets: Differences and Spatial Distribution Characteristics. ISPRS Int. J. Geo-Inf. 2020, 9, 637. [Google Scholar] [CrossRef]
- Tatem, A.J. WorldPop, Open Data for Spatial Demography. Sci. Data 2017, 4, 170004. [Google Scholar]
- Parsian, S.; Amani, M.; Moghimi, A.; Ghorbanian, A.; Mahdavi, S. Flood Hazard Mapping Using Fuzzy Logic, Analytical Hierarchy Process, and Multi-Source Geospatial Datasets. Remote Sens. 2021, 13, 4761. [Google Scholar] [CrossRef]
- Huete, A.; Didan, K.; Miura, T.; Rodriguez, E.P.; Gao, X.; Ferreira, L.G. Overview of the Radiometric and Biophysical Performance of the MODIS Vegetation Indices. Remote Sens. Environ. 2002, 83, 195–213. [Google Scholar]
- Elbakidze, M.; Dawson, L.; Milberg, P.; Mikusiński, G.; Hedblom, M.; Kruhlov, I.; Yamelynets, T.; Schaffer, C.; Johansson, K.-E.; Grodzynskyi, M. Multiple Factors Shape the Interaction of People with Urban Greenspace: Sweden as a Case Study. Urban For. Urban Green. 2022, 74, 127672. [Google Scholar] [CrossRef]
- Xu, L.; You, H.; Li, D.; Yu, K. Urban Green Spaces, Their Spatial Pattern, and Ecosystem Service Value: The Case of Beijing. Habitat Int. 2016, 56, 84–95. [Google Scholar]
- Chen, Z.; Liu, Q.; Li, M.; Xu, D. A New Strategy for Planning Urban Park Green Spaces by Considering Their Spatial Accessibility and Distributional Equity. Forests 2024, 15, 570. [Google Scholar] [CrossRef]
- Petrova, S.; Nikolov, B.; Velcheva, I.; Angelov, N.; Valcheva, E.; Katova, A.; Golubinova, I.; Marinov-Serafimov, P. Buffer Green Patches around Urban Road Network as a Tool for Sustainable Soil Management. Land 2022, 11, 343. [Google Scholar] [CrossRef]
- Zhang, L.; Chen, P.; Hui, F. Refining the Accessibility Evaluation of Urban Green Spaces with Multiple Sources of Mobility Data: A Case Study in Shenzhen, China. Urban For. Urban Green. 2022, 70, 127550. [Google Scholar] [CrossRef]
- Łaszkiewicz, E.; Sikorska, D. Children’s Green Walk to School: An Evaluation of Welfare-Related Disparities in the Visibility of Greenery among Children. Environ. Sci. Policy 2020, 110, 1–13. [Google Scholar] [CrossRef]
- Ye, Y.; Richards, D.; Lu, Y.; Song, X.; Zhuang, Y.; Zeng, W.; Zhong, T. Measuring Daily Accessed Street Greenery: A Human-Scale Approach for Informing Better Urban Planning Practices. Landsc. Urban Plan. 2019, 191, 103434. [Google Scholar] [CrossRef]
- Zhang, Y.; Van den Berg, A.; Van Dijk, T.; Weitkamp, G. Quality over Quantity: Contribution of Urban Green Space to Neighborhood Satisfaction. Int. J. Environ. Res. Public Health 2017, 14, 535. [Google Scholar] [CrossRef]
- Pan, Z.; He, J.; Liu, D.; Wang, J.; Guo, X. Ecosystem Health Assessment Based on Ecological Integrity and Ecosystem Services Demand in the Middle Reaches of the Yangtze River Economic Belt, China. Sci. Total Environ. 2021, 774, 144837. [Google Scholar]
- Vijaya; Sharma, S.; Batra, N. Comparative Study of Single Linkage, Complete Linkage, and Ward Method of Agglomerative Clustering. In Proceedings of the 2019 International Conference on Machine Learning, Big Data, Cloud and Parallel Computing (COMITCon), Faridabad, India, 14–16 February 2019; pp. 568–573. [Google Scholar]
- Liang, H.; Yan, Y.; Yan, Q.; Zhang, Q. Development of Green Space Provision for Housing Estates at Metropolitan Scale: A Spatiotemporal Assessment of Proximity in a Rapidly Urbanizing Chinese City during the Last 10 Years. Land Use Policy 2024, 140, 107119. [Google Scholar]
- Lu, Y.; Chen, R.; Chen, B.; Wu, J. Inclusive Green Environment for All? An Investigation of Spatial Access Equity of Urban Green Space and Associated Socioeconomic Drivers in China. Landsc. Urban Plan. 2024, 241, 104926. [Google Scholar] [CrossRef]
- Xie, X.; Zhou, H.; Gou, Z.; Yi, M. Spatiotemporal Patterns of the Use of Green Space by White-Collar Workers in Chinese Cities: A Study in Shenzhen. Land 2021, 10, 1006. [Google Scholar] [CrossRef]
- Addas, A. The Importance of Urban Green Spaces in the Development of Smart Cities. Front. Environ. Sci. 2023, 11, 1206372. [Google Scholar]
- Gupta, K.; Kumar, P.; Pathan, S.K.; Sharma, K.P. Urban Neighborhood Green Index–A Measure of Green Spaces in Urban Areas. Landsc. Urban Plan. 2012, 105, 325–335. [Google Scholar]
- Wu, Y.; Cao, Y. Research on the Influence of Ecological Environment Satisfaction and Income Level on Chinese Residents’ Happiness: Empirical Analysis Based on CGSS Data. Sustainability 2023, 15, 8175. [Google Scholar] [CrossRef]
- Chen, M.; Gong, Y.; Li, Y.; Lu, D.; Zhang, H. Population Distribution and Urbanization on Both Sides of the Hu Huanyong Line: Answering the Premier’s Question. J. Geogr. Sci. 2016, 26, 1593–1610. [Google Scholar]
- Song, P.; Kim, G.; Mayer, A.; He, R.; Tian, G. Assessing the Ecosystem Services of Various Types of Urban Green Spaces Based on I-Tree Eco. Sustainability 2020, 12, 1630. [Google Scholar] [CrossRef]
- Williams, T.G.; Logan, T.M.; Zuo, C.T.; Liberman, K.D.; Guikema, S.D. Parks and Safety: A Comparative Study of Green Space Access and Inequity in Five US Cities. Landsc. Urban Plan. 2020, 201, 103841. [Google Scholar]
- Jin, Y.; He, R.; Hong, J.; Luo, D.; Xiong, G. Assessing the Accessibility and Equity of Urban Green Spaces from Supply and Demand Perspectives: A Case Study of a Mountainous City in China. Land 2023, 12, 1793. [Google Scholar] [CrossRef]


| Data Type | Source | Spatial Resolution |
|---|---|---|
| Satellite imagery | Landsat-8 | 30 m |
| Building rooftop area | Sentinel-2 imagery | 2.5 m |
| Road network | OpenStreetMap | N/A |
| Gridded population | WorldPop Project | 100 m |
| Indicator | UGS Category | Calculation Method |
|---|---|---|
| Connectedness | Connected | The ratio of connected green space pixels over 10 hectares to the total area of green space pixels. |
| Visuality | Roadside | The ratio of the green space pixel area in the road buffer to the total area of the urban road buffer. |
| Availability | Neighbourhood | The ratio of the green space pixel area in the building buffer to the total area of the urban building buffer. |
| Superiority | Superior | The ratio of the area of green space satisfying the above three conditions to the total area of green space pixels. |
| Independent Variable | Model 1 | Model 2 |
|---|---|---|
| Connectedness | −0.068 | |
| Visuality | 0.054 | |
| Availability | −0.191 | |
| Superiority | 0.527 | |
| GCR | −0.051 | |
| Constant | 0.139 | 0.133 |
| R-squared | 0.432 | 0.021 |
| Independent Variable | Model 1 | Model 2 |
|---|---|---|
| Connectedness | 0.014 | |
| Visuality | −0.095 | |
| Availability | −0.041 | |
| Superiority | 0.607 | |
| GCR | 0.137 | |
| Constant | 0.097 | 0.011 |
| R-squared | 0.468 | 0.001 |
| Independent Variable | Model 1 | Model 2 | Model 3 |
|---|---|---|---|
| Connectedness | −0.518 | −0.042 | |
| Visuality | −0.159 | 1.119 | |
| Availability | 0.218 | 0.155 | |
| Superiority | −0.119 | −0.236 | |
| GCR | −0.516 | −1.432 | |
| Constant | 0.869 | 0.689 | 0.813 |
| R-squared | 0.299 | 0.291 | 0.423 |
Disclaimer/Publisher’s Note: The statements, opinions and data contained in all publications are solely those of the individual author(s) and contributor(s) and not of MDPI and/or the editor(s). MDPI and/or the editor(s) disclaim responsibility for any injury to people or property resulting from any ideas, methods, instructions or products referred to in the content. |
© 2025 by the authors. Licensee MDPI, Basel, Switzerland. This article is an open access article distributed under the terms and conditions of the Creative Commons Attribution (CC BY) license (https://creativecommons.org/licenses/by/4.0/).
Share and Cite
Qin, Y.; Ma, Y.; Gong, M.; Li, S.; Chen, P. Investigating the Serviceability of Urban Green Spaces from a Spatial Perspective: A Comparative Study Across 368 Cities on the Chinese Mainland. Land 2025, 14, 711. https://doi.org/10.3390/land14040711
Qin Y, Ma Y, Gong M, Li S, Chen P. Investigating the Serviceability of Urban Green Spaces from a Spatial Perspective: A Comparative Study Across 368 Cities on the Chinese Mainland. Land. 2025; 14(4):711. https://doi.org/10.3390/land14040711
Chicago/Turabian StyleQin, Yuetong, Yibin Ma, Mengjie Gong, Shaodong Li, and Pengfei Chen. 2025. "Investigating the Serviceability of Urban Green Spaces from a Spatial Perspective: A Comparative Study Across 368 Cities on the Chinese Mainland" Land 14, no. 4: 711. https://doi.org/10.3390/land14040711
APA StyleQin, Y., Ma, Y., Gong, M., Li, S., & Chen, P. (2025). Investigating the Serviceability of Urban Green Spaces from a Spatial Perspective: A Comparative Study Across 368 Cities on the Chinese Mainland. Land, 14(4), 711. https://doi.org/10.3390/land14040711