Abstract
Assessing the value of ecosystem products over time can reflect the effectiveness of ecosystem protection and serve as a measurable indicator in national park management. This study focuses on the Three-River-Source National Park (TRSNP), located in the Tibetan Plateau, the “Water Tower of China”. We developed an accounting system for ecosystem products in the TRSNP and assessed their value for 2015 and 2020. Key findings include the following. (1) The validation of the system’s scientific basis with a comprehensive indicator framework covering material products, regulating services, and cultural services. (2) The total value of ecosystem products in TRSNP increased by 31.19% from 2015 to 2020. Driven by policies such as grazing bans and the restoration of grasslands, the value of material products saw a decrease during the same period, while the value of regulating services experienced an increase. Notably, among the regulating services, the value associated with soil conservation emerged as the highest. (3) The value of regulating services varies across different regions due to the influences of land use types and soil erosion types. Among these, the value of regulating services per unit area is highest in the Lancang River source region, followed by the Yellow River source region, and the value was the lowest in the Yangtze River source region. (4) Recommendations include enhancing the value of agricultural and animal husbandry products to increase the overall agro-pastoral income, focusing on soil protection and restoration in the Yangtze and Yellow River source regions, and exploring strategies for the trading of ecological resource rights for soil retention in the Lancang River source region. This research offers a pertinent case study for ecosystem product value assessment, contributes a scientific ecological protection effect evaluation system for TRSNP, and provides a relevant scientific basis for the management of TRSNP.
1. Introduction
Protected areas play a critical role in promoting ecological conservation and sustainable development [1]. However, the tension between ecological protection and economic development poses substantial challenges to the management of global protected areas [2]. China’s protected areas, like those in many other countries, face particular challenges in maintaining a balance between ecological conservation and economic development [3]. National parks serve as the principal components of natural protected areas in China. The initial cohort of national parks in the country was officially established in 2021, all situated in critical regions of China’s ecological security strategy. These parks play a vital role in underpinning national ecological security and facilitating the sustainable use of natural resources [4,5]. Most of China’s national parks are located in economically disadvantaged areas, where the conflict between ecological protection and economic development is particularly prominent [6]. The Three-River-Source National Park (TRSNP), established in 2016 as China’s first pilot for the national park system, plays a vital role in implementing the concept of “ecological civilization”. The TRSNP is characterized by its rich water resources, which provide an unparalleled environment for various flora and fauna; thus, it is widely considered a center for alpine genetic resources [7]. The TRSNP, with an elevation exceeding 3844 m, is experiencing significant ecological degradation due to climate change, particularly in the realms of carbon storage, soil conservation, and habitat quality, which are critical ecosystem service capacities [8]. The pathway for realizing the ecological product value of high-altitude fragile ecosystems is characterized by its distinct peculiarities. For instance, the alpine mountain pastures have garnered attention through the development of tourism and mountaineering, which encompasses a well-rounded evolution of agriculture, outdoor recreation, and tourism, providing a typical case for agricultural tourism development in similar regions [9,10]. The TRSNP is currently predominantly characterized by government-led ecological compensation mechanisms. The four counties within the boundaries of TRSNP are impoverished counties, and 90% of the funding for the park comes from subsidies and provincial governments [11]. The Chinese government has invested 24.4 billion yuan for the development of TRSNP, promoting the restoration of degraded ecosystems; however, many important ecosystems and habitats still lack adequate protection [6,12]. TRSNP is facing significant challenges in management.
Ecosystem services (ESs) are the direct or indirect contributions of ecosystems to human well-being [13]. The term gross ecosystem product (GEP) originally refers to the total sum of the net outputs of all physical measurements from various sectors of the ecosystem [14]. With the development of the economic valuation of ES, the concept of gross ecosystem product (GEP), defined as the total value of products and services provided by ecosystems to humanity, was introduced [15]. GEP refers to the total monetary value of ecosystem services utilized within a specific area and accounting period, typically a year [16]. GEP is an accounting indicator used to track the economic value of ES and environmental governance performance, as well as the contribution of ecosystems to socio-economic development, among other aspects [17]. Given the equal importance of protecting ecosystems and generating economic benefits, the monetization of the ecological value of national parks is expected to provide a scientific basis for evaluating the effectiveness of ecological conservation and facilitating ecological product transactions.
GEP accounting comprises two components, biophysical value accounting and monetary value accounting, with the former serving as the basis for the latter [18]. Current methods for assessing physical quantities include biophysical models, the Integrated Valuation of Ecosystem Services and Trade-offs (InVEST) model, and the Multi-Scale Integrated Models of Ecosystem Services (MIMES) model. Biophysical modeling methods are diverse, with variations in data processing and parameter selection. For instance, models applicable to carbon sequestration services include ground-based biomass measurement and net ecosystem productivity methods, which yield different assessments of carbon sequestration [18]. The widely used InVEST model possesses high-precision spatial analysis capabilities, enabling the simulation of changes in the value of ecosystem service functions under varying land-use and land-cover scenarios [19]. The MIMES model allows users to combine statistical data with geographical information for ecosystem service value assessments; however, its complex software structure and reliance on numerous parameters lead to limited practical applications [20,21].
Meanwhile, valuation methods include direct market, substitute market, and value transfer methods, of which direct market methods are more objective, while substitute market and value transfer methods are significantly influenced by subjective factors [18]. Ecosystem products that can be directly traded in the market, such as material products and cultural services, typically use direct market methods for pricing. However, pricing for regulating services is contentious, with significant issues including the availability of multiple substitutes for the same service and ambiguities in localized pricing survey methods [22]. In September 2020, the Ministry of Ecology and Environment released the “Technical Guidelines for Accounting Gross Ecosystem Product (GEP) of Terrestrial Ecosystems” (hereinafter referred to as the “Guidelines”), which is currently considered the primary technical standard for GEP accounting.
To reflect the effectiveness of national park protection and provide a scientific basis for the trade of ecological products in national parks, this study builds upon established frameworks and leverages existing research on GEP, with a focus on the TRSNP. This work’s objective is to analyze the unique ecosystem service functions of the park and to develop a tailored value accounting system and framework that clearly defines the accounting factors and methodologies. Taking 2015 and 2020 as the accounting years, this research evaluates the ecological protection outcomes since the establishment of the TRSNP pilot project. With the findings, this study aims to contribute new insights to the theoretical framework for ecosystem product valuation in national parks, provide technical support and a scientific basis for ecosystem service accounting and conservation effectiveness assessment, and ultimately advance the ecological industrialization of national parks in China.
2. Materials and Methods
2.1. Study Area
Given that the TRSNP serves as a crucial ecological security barrier for China in particular and Asia in general, the park is recognized as a key region for the advancement of ecological civilization in the country. Situated in the heart of the Qinghai–Tibet Plateau (also known as the “Roof of the World”), the TRSNP encompasses diverse topographical features, including high mountain landscapes, glacial formations, and plains and hills. The park is notably the source of three major rivers, the Yangtze River, the Yellow River, and the Lancang River, making it an essential replenishment area for the country’s freshwater resources. Its unique geographical position, coupled with its rich natural resources and diverse ecological functions, underscores its importance as an ecological security barrier [23,24]. The average elevation within the TRSNP exceeds 3844 m, covering an extensive area of 123,100 square kilometers.
The park spans four counties in Qinghai Province, Maduo, Zhido, Zaduo, and Qu Mali, encompassing 12 townships and 52 administrative villages. The predominant land cover type in the park is grassland, alongside other types, such as barren, water, and snow/ice [25]. Renowned for its rich biodiversity, the TRSNP serves as a natural habitat for numerous rare and endangered species and functions as a vital gene pool for plateau flora and fauna. Specifically, the TRSNP is home to approximately 270 species of terrestrial wild vertebrates, which are classified into 4 classes, 29 orders, and 72 families. Notably, 203 of these species are protected, representing about three-quarters of the total vertebrate population in the park [26]. In summary, the TRSNP stands as a vital ecological reservoir that not only supports biodiversity but also plays a critical role in maintaining the ecological balance in a region of significant environmental importance. Thus, continued conservation efforts are essential to preserve its unique ecosystems and the crucial services they provide.
The TRSNP is divided into three regions: the Yangtze River Source, the Yellow River Source, and the Lancang River Source (Figure 1). Among these, the Yangtze River source region is the largest, covering an area of 90,300 km2, which includes the former Hoh Xil National Nature Reserve and the Suojia–Qumahe Nature Reserve of the former Three-River-Source National Nature Reserve. The main conservation focus of the Yangtze River source region is on glaciers, snow-capped mountains, highland rivers, grasslands, and endangered wildlife, with an emphasis on protecting important wildlife habitats and migration routes. The Yellow River source region spans 19,100 km2, encompassing the Gyaring Lake and Ngoring Lake Natural Reserve and the Xingxinghai Natural Reserve from the former Three-River-Source National Nature Reserve. This area is characterized by a multitude of lakes, thereby forming a “Thousand Lakes” landscape. Key conservation objectives in this source region include protecting the source lakes, maintaining the health of grassland ecosystems, and preserving biodiversity. Finally, the Lancang River source region includes the Guozongmucha Natural Reserve and the Angsai Natural Reserve, covering an area of 13,700 km2 from the former Three-River-Source National Nature Reserve. The primary conservation efforts in this region focus on glaciers, snow-capped mountains, glacial land, high mountain canyon forests, and shrub, with an emphasis on integrated pest management, the restoration of degraded grasslands, and the prevention of soil erosion.
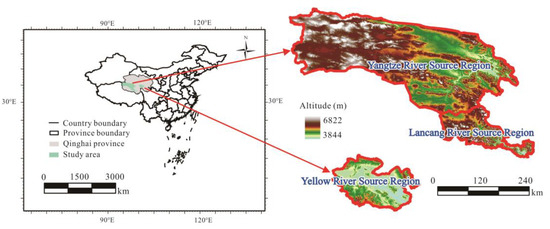
Figure 1.
Location and elevation of the Three-River-Source National Park (TRSNP).
2.2. Data Source
The land use and land cover (LULC) classification data used in this study were sourced from the National Cryosphere Desert Data Center. The land cover types in the study area include forest, shrub, grassland, water, snow/ice, and barren land. The boundary data for the TRSNP were obtained from the Institute of Tibetan Plateau Research, the Chinese Academy of Sciences. Other relevant data, such as evaporation and soil vector data, were also sourced from the aforementioned data centers, as well as the National Earth System Science Data Center, Big Earth Data for Three Poles, and the integrated ecological monitoring data platform of TRSNP (Table 1). To address the issue of missing evaporation data, the Kriging spatial interpolation method was employed, utilizing observational data from surrounding meteorological stations as auxiliary variables for data imputation. In this study, we standardized the raster data to a resolution of 1 km × 1 km. The statistical data are derived from the Qinghai Province Statistical Yearbook, CNKI, and Web of Science. It includes the production volumes of agricultural products (such as wheat, miscellaneous grains, tubers, rapeseed, vegetables, and fungi), animal husbandry products (including meat, dairy, and wool from pigs, cattle, and sheep), and metrics related to tourism such as the number of visitors and tourism revenue. Additionally, the data encompass pollutant emissions and the volume of published academic papers. To ensure the comparability of data between 2015 and 2020, we also adopted the ecosystem product prices for 2020.

Table 1.
Data types and descriptions.
2.3. Research Methods
The present study refers to the framework found in the guidelines, drawing on relevant standards and norms as well as domestic GEP accounting pilot case studies in China. This study combines the characteristics and practical conditions of the TRSNP ecosystem to establish a GEP accounting method and indicator system for the TRSNP, which comprises material products, regulating services, and cultural services. The accounting incorporates the biophysical and the monetary values of ecosystem products. In particular, the calculation of the biophysical value employs various individual methods, including statistical investigation, water balance method, water purification model, universal soil loss equation, carbon sequestration mechanism model, water storage model, evaporation model, and the protected area conservation method (Table 2). To convert products and functional services into monetary terms, this study uses various methods, such as market value, simulated market, shadow engineering, recovery cost, and travel expense methods, as well as the protected area conservation value method. Ultimately, these values are aggregated to derive the GEP.
Table 2.
Estimation index system of the TRSNP’s gross ecosystem product (GEP).
2.3.1. Water Retention, Water Purification, and Soil Retention
In the accounting of biophysical values, the method for calculating the material products is based on statistical investigation. The InVEST model, with its advantages of requiring fewer parameters and providing highly accurate results, has been widely applied in the calculation of water retention, soil retention, and carbon fixation. Its successful application has already been observed in the Three-River-Source region [27,28]. The ecosystem product value is calculated based on the ecosystem product flow of the current year. Therefore, in the accounting of the ecosystem product value in the TRSNP, the InVEST model is employed considering individual aspects, such as water retention, water purification, and soil retention, so the calculation outcomes demonstrate adaptability.
Here, represents the annual water yield (mm) for raster cell (x); P denotes the annual average precipitation (mm); AET refers to the annual actual evapotranspiration (mm); R is the dryness index raster cell, defined as the ratio of potential evapotranspiration to precipitation; indicates the ratio of adjusted annual available water to precipitation; k is the vegetation coefficient determined by the leaf area index; ET represents potential evapotranspiration; RA signifies solar radiation at the top of the atmosphere; is the average of the maximum and minimum temperatures for the day; TD denotes the temperature difference between the maximum and minimum; Z refers to the Zhang coefficient, which is determined based on the reference parameters from [29]; represents the effective available water for vegetation; is the maximum soil depth; indicates the rooting depth, which corresponds to the available water for vegetation; and values represent the percentages of sand, silt, clay, and organic carbon content in the soil [30].
represents the total output of nitrogen and phosphorus nutrients from the watershed (kg/a); denotes the nitrogen and phosphorus nutrient output for grid cell i (kg/a); refers to the nitrogen and phosphorus nutrient loading for surface water in grid cell i (kg/a), derived from the average nutrient loading values for land use and adjusted for local runoff potential index; and indicates the surface nitrogen and phosphorus nutrient delivery efficiency for grid cell i, calculated based on the maximum nutrient retention rate between grid cell i and the river, the terrain index, and the calibration parameter k [30].
represents the soil amount for cell x (t), denotes the potential soil erosion amount (t), refers to the actual soil erosion amount (t), and indicates the sediment amount (t); is the rainfall erosivity factor for grid cell x (MJ mm hm2 h−1 a−1); is the soil erodibility factor for grid cell x (t h MJ−1 mm−1); is the slope length and steepness factor, derived from DEM data; and represent the vegetation and crop management factors and the soil conservation factor, respectively; and and signify the sediment delivery rates for grid cell x and the upslope grid cell z, with the sediment delivery rate for grid cell x being calculated based on the maximum sediment delivery rate , the terrain index , and the calibration parameter [30].
2.3.2. Carbon Fixation and Oxygen Release
The net ecosystem productivity (NEP) model indicates that the carbon sequestration capacity of an ecosystem can be measured by its net primary productivity. Successful cases have been documented in assessing carbon fixation within the Lancang River Basin [31]. Based on the following photosynthesis reaction, 6CO2+ 6H2O → C6H12O6[(CH2O)ₙ] + 6O2, for every mole of carbon dioxide absorbed by plants, one mole of oxygen is released. In the present study, the application of the NEP model to calculate the carbon fixation and oxygen release associated with the ecosystem product value in the TRSNP is deemed reasonable.
represents the carbon stock in terrestrial ecosystems (t·CO2/a); denotes the oxygen release by the ecosystem (t·O2/a); refers to net ecosystem productivity (t C/a); is the conversion coefficient between NEP and PP, determined based on the parameters recommended in the “Guidelines” for Qinghai Province; NPP represents net primary productivity (t · dry matter/a); is the coefficient for converting dry matter to carbon; and is the coefficient for converting CO2 to O2.
2.3.3. Flood Mitigation
The flood mitigation generally comprises reservoir flood mitigation and lake flood mitigation [32]. As there are no constructed reservoirs within the TRSNP, the present study selected the flood storage capacity of lakes as a representative measure of the flood mitigation function. Based on the Lakes of China, the country’s lakes can be categorized into five distinct lake regions: Eastern Plain, Mongolia–Xinjiang Plateau, Yunnan–Guizhou Plateau, Qinghai–Tibet Plateau, and Northeast Plain and Mountain Areas. The TRSNP is located within the Qinghai–Tibet Plateau region [33]. In this study, the method outlined for calculating the flood mitigation capacity is based on the water exchange frequency and replenishment coefficient specifically provided for the Qinghai–Tibet Plateau, thus demonstrating the method’s feasibility.
represents flood storage capacity; A represents lake’s area of TRSNP.
2.3.4. Climate Regulation
Meanwhile, climate regulation is reflected not only in reducing temperature but also in increasing humidity. Therefore, by employing an evapotranspiration model that uses the energy consumed during the ecosystem’s evapotranspiration process and combines it with the energy conversion of air conditioners and humidifiers, we are able to calculate the climate regulation capacity of ecosystem services in the TRSNP. The combination of energy conversion with air conditioning and humidifiers reflects the practical role and value of the ecosystem in reducing temperature and increasing air humidity in daily life.
represents the cooling heat absorption (kJ); denotes the average annual evapotranspiration (mm·a−1); is the density of water under standard conditions, taken as 1000 kg·m−3; A refers to the area of the TRSNP (hm2); is the latent heat of vaporization of water at 20 °C, with a value of 2453 kJ·kg−1; indicates the height of human activities, taken as 100 m; represents the number of days in summer, assumed to be 92 days; is the total number of days in a year, taken as 365 d; and denotes the height of the atmospheric mixing layer, valued at 879 m [34].
denotes the average annual moisture addition (kg·a−1); refers to the average annual evapotranspiration (mm·a−1); A represents the area of TRSNP (hm2); is the density of water under standard conditions, valued at 1000 kg·m−3; indicates the height of human activities, taken as 100 m; and denotes the height of the atmospheric mixing layer, set at 879 m [34].
2.3.5. Statistical Investigation
In the accounting of biophysical values, the method for calculating the material products is based on statistical investigation. In the assessment of material products, the agricultural output is defined as the sum of quantities of wheat, grains, tubers, rapeseed, vegetables, and fungi; the animal husbandry products encompass the totals of meat such as pigs, cows, sheep, dairy products, and wool. The air purification capacity is measured by the emission levels of pollutants such as sulfur dioxide, nitrogen oxides, and particulate matter. The quantification of scientific research outputs is based on the number of papers published in the current year in CNKI and Web of Science concerning the Three-River-Source region. Finally, the tourism value is represented by the number of tourist visits.
2.3.6. Monetary Value Accounting
In monetary value accounting, the value of material products is assessed using the market value method. Several methods are employed for regulating services and cultural services, which do not have direct market prices. These methods include alternative costing, simulated market, shadow engineering, recovery cost, and travel expense methods, as well as the protected area conservation value method. These approaches incorporate water pricing, sewage treatment costs, reservoir dredging expenses, treatment costs for diammonium phosphate and potassium chloride soil, the average transaction price of carbon quotas from China’s carbon trading pilot programs, industrial oxygen production costs, air pollution control costs, and reservoir capacity construction costs. This accounting approach uses market-based unit prices, thus allowing for a more accurate representation of the market value of ecosystem products.
3. Results
3.1. Create the Indicator System
In the TRSNP, the material products encompass agricultural items, notably barley, as well as livestock products, such as yaks. The present study aims to account for both agricultural and livestock products within the framework of material product valuation. The TRSNP is characterized by numerous hydrological flows and extensively distributed glaciers and snow-capped mountains, which are crucial for effective water conservation. The predominant ecosystem within the national park is the grassland ecosystem, wherein herbaceous plants exhibit well-developed root systems that serve to intercept sediments and sustain soil and water retention [35].
Furthermore, the growth of these herbaceous plants plays a significant role in carbon dioxide sequestration via photosynthesis, facilitating the simultaneous release of oxygen into the atmosphere [27,36]. The present research incorporates a comprehensive range of ecosystem services, including water retention, soil retention, carbon fixation and oxygen release, air purification, flood mitigation, climate regulation, and species conservation. To reflect the cultural value of ecosystem products, cultural services that exemplify the harmonious coexistence of humans and nature are quantified through indicators related to leisure tourism and scientific research (Table 2).
3.2. Establishing an Accounting System for the TRSNP’s GEP
The main working procedures for accounting include the following: determining the accounting area for the TRSNP’s GEP based on the accounting objectives and the accounting year; compiling a list of ecosystem products; conducting data collection and social surveys to establish the accounting model, methods, applicable technical parameters, and pricing used; and undertaking the accounting of the biophysical and monetary values of the identified ecosystem products (Figure 2).
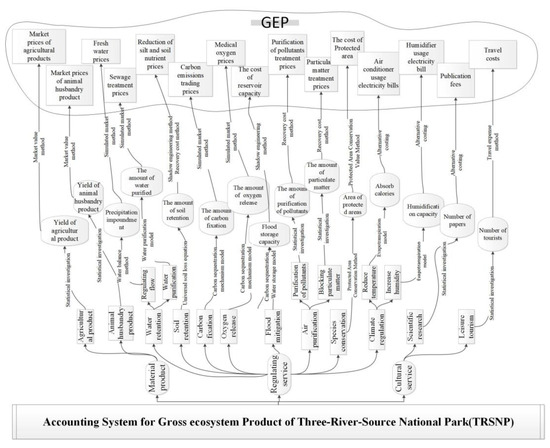
Figure 2.
Accounting system for the TRSNP’s GEP.
3.3. Biophysical Value and Change Characteristics of Ecosystem Products in the TRSNP
In 2020, the yields of agricultural and animal husbandry products were 16,762.00 and 111,902.00 tons, respectively. Both values reflect decreases compared to 2015 values, with reductions of 28.37% and 32.36%, respectively. In terms of regulating services, water regulation and soil conservation reached 38.946 billion m3 in 2020 and 22.969 billion tons, respectively; carbon fixation, oxygen release, and gas pollutant absorption reached 10.8426, 7.8855, and 1.214 million tons, respectively; and retarded particulate matter reached 76,000 tons. Additionally, flood regulation was 5.585 billion m3, and climate regulation energy was 377.752 billion KJ.
Compared to 2015 values, the only decline was observed in air purification metrics, with gas pollutant absorption and retarded particulate matter decreasing by 57.93% and 72.43%, respectively. All other parameters demonstrated increases, with the highest percentage increase noted in soil conservation at 52.53%, followed by water regulation at 43.95%. The percentage increases for carbon fixation, oxygen release, flood regulation, and climate regulation were 14.31%, 14.31%, 8.29%, 7.69%, 6.69%, and 0.01%, respectively.
In the realm of cultural services, 39 papers related to the TRSNP were published in 2020, representing a 225.00% increase from 2015, while recreational service metrics grew by 83.49%.
3.4. Monetary Value and Change Characteristics of Ecosystem Products in the TRSNP
Based on the biophysical value results, monetary value calculations were conducted using the market value method and simulated market method. In 2015, the GEP of the TRSNP was 308.875 billion CNY, with a per-unit-area GEP of 250.91 CNY/hm2. By 2020, the GEP increased to 405.203 billion CNY, with a per-unit-area GEP of 329.17 CNY/hm2. Both GEP and the per-unit-area GEP exhibited upward trends (Table 3).
Table 3.
Gross ecosystem product in TRSNP, 2015–2020.
The value of regulating services occupies the largest proportion of the GEP, with values of 300.498 and 398.509 billion CNY in 2015 and 2020, respectively, accounting for 97.29% and 98.35%. In comparison, the values of material products were 7.729 and 5.564 billion CNY, with proportions of 2.50% and 1.37%, respectively. Cultural services had the lowest share, with values of 649 and 1.130 billion CNY, respectively. Analyzing the changes across service categories, it is evident that the values of material products decreased along with their proportion, while the values and proportions of regulating and cultural services increased (Figure 3).
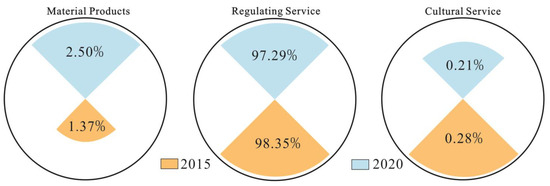
Figure 3.
Changes in the total values of ecosystem products in the TRSNP, 2015–2020.
The individual monetary values of ecosystem products in the TRSNP and their corresponding changes are illustrated in Figure 4. The monetary value of soil retention ranks the highest among the GEP, amounting to 138.222 and 210.834 billion CNY in 2015 and 2020, respectively. Following this, the monetary value of species conservation remained constant at 61.550 billion CNY for both years. Products that exhibited an increase in monetary value included water retention, soil retention, carbon fixation, oxygen release, flood mitigation, climate regulation, scientific research, and leisure tourism, with increases in value amounting to 21.214, 72.613, 0.029, 0.790, 3.438, 0.001, 0.00034, and 0.481 billion CNY, respectively. Conversely, products that experienced a decrease in monetary value included agricultural products, animal husbandry products, and air purification, with reductions of 0.025, 2.141, and 0.274 billion CNY, respectively.
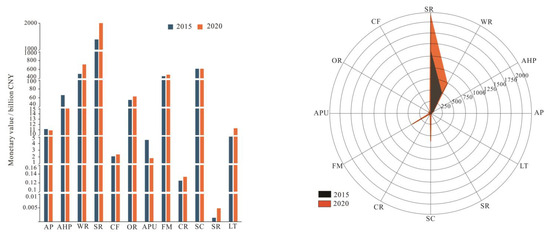
Figure 4.
Changes in various GEPs in the TRSNP, 2015–2020.
3.5. Monetary Values in the Different Parks Within the TRSNP
In the GEP of the TRSNP, the monetary value of regulating services accounts for the highest proportion. In particular, the value of regulating services per unit area in the three regions is shown in Figure 5. The monetary values of other ecosystem products are aggregated for the entire area and cannot be separated for the three regions. As can be seen, the results indicate that the per unit area values for water retention, soil retention, flood mitigation, carbon fixation, oxygen release, and climate regulation have all increased across the three regions of the park. Notably, the Lancang River source region, which did not contain any lakes, showed a flood mitigation value of zero. Although the Lancang River source region is the smallest among the three regions in terms of area, it has the highest per unit area service values. Specifically, the per unit area service value for water retention in 2015 was 86.22 CNY/hm2, which rose to 110.78 CNY/hm2 in 2020. For soil retention, the values increased from 334.58 CNY/hm2 in 2015 to 512.60 CNY/hm2 in 2020. The carbon fixation service value increased from 0.33 CNY/hm2 in 2015 to 0.36 CNY/hm2 in 2020, while the oxygen release value rose from 9.08 CNY/hm2 in 2015 to 9.89 CNY/hm2 in 2020.
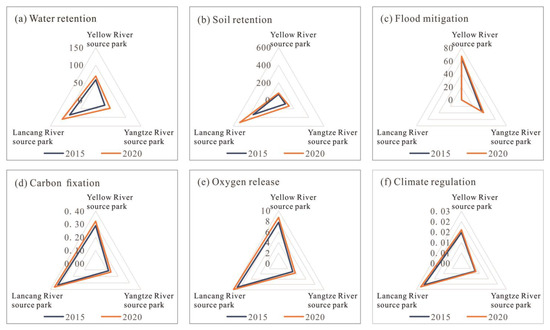
Figure 5.
Area per unit values of regulating services in different regions of the TRSNP (CNY).
The next highest values were those obtained for the Yellow River source region, with water retention valued at 57.60 and 68.38 CNY/hm2 in 2015 and 2020, respectively. Soil retention service values increased from 65.21 CNY/hm2 in 2015 to 79.59 CNY/hm2 in 2020, while carbon fixation values rose from 0.29 CNY/hm2 in 2015 to 0.32 CNY/hm2 in 2020. The oxygen release service value also increased from 7.78 CNY/hm2 in 2015 to 8.70 CNY/hm2 in 2020.
In contrast, the Yangtze River source region exhibited the lowest per unit area service values, with water retention at 29.96 and 47.67 CNY/hm2 in 2015 and 2020, respectively. Soil retention increased from 88.51 CNY/hm2 in 2015 to 138.88 CNY/hm2 in 2020, while carbon fixation values increased from 0.11 CNY/hm2 in 2015 to 0.13 CNY/hm2 in 2020. Finally, the oxygen release service value rose from 3.09 CNY/hm2 in 2015 to 3.65 CNY/hm2 in 2020.
4. Discussion
4.1. Verification of the GEP Accounting Results
In terms of the accounting framework, this study has established an indicator system that encompasses material products, regulating services, and cultural services. Compared to the single service classification based on land use proposed (such as water bodies and grasslands) [37], the nine-service framework focused on grassland ecosystems [38], and the assessments of regulating services [39], this research demonstrates a greater advantage in the comprehensiveness of indicators. The newly added category of “cultural services” (including scientific research and recreational activities) addresses the omission of non-market values in traditional accounting approaches. Reference [39] did not incorporate material and cultural products in their assessment of the ecosystem product value of national parks, Reference [37] lacked a clear delineation of cultural service boundaries, and Reference [38] did not consider other ecosystem types such as bare land and water bodies due to limitations in their research scope. These differences in frameworks contribute to the total GEP value of this study for 2020 (405.203 billion yuan) being significantly higher than Reference [37]’s estimated GEP (393 billion yuan), partly attributable to the value of cultural services (1.130 billion yuan).
Regarding the accounting methods, this study utilizes different calculation models based on the specific types of ecosystem products, complemented by parameter calibration relevant to the TRSNP. This approach is more appropriate for addressing the complex ecosystem characteristics of the high-altitude area compared to the equivalent factor adjustment method employed. For instance, in the assessment of soil conservation value, the InVEST model yielded a soil retention amount of 2.23 billion tons in 2020, representing a 52.53% increase from 2015. In contrast, Reference [38]s’ estimates based on soil retention equivalents do not reflect dynamic changes, while Reference [37]’s method, which relies on land-use conversion probabilities, fails to delineate the underlying soil process mechanisms.
In summary, the strength of this study lies in the establishment of a comprehensive accounting framework that encompasses material products, regulating services, and cultural services. By employing different calculation models and parameter calibration methods tailored to various types of ecological products, this research accurately quantifies the ecosystem product value of TRSNP.
4.2. Analysis of Changes in the TRSNP’s GEP
This study indicates that from 2015 to 2020, the Gross Ecosystem Product (GEP) of TRSNP grew by 31.91%, amounting to an increase of 96.33 billion yuan, primarily driven by the implementation of ecological conservation projects and grazing restrictions. For instance, the Ecological Protection and Construction Phase II project in the Three-River-Source region officially commenced in 2014, with multiple departments, including the TRSNP Administration, launching a series of ecological conservation initiatives such as grassland restoration and the remediation of black beach areas. In 2019 alone, the grassland restoration project covered an area of 300,000 acres, effectively reducing soil erosion through the restoration of vegetation cover. Modeling calculations reveal that the direct contribution to soil retention value in TRSNP from 2015 to 2020 amounted to 72.11 billion yuan over five years. When considering the values of water retention and carbon fixation associated with vegetation restoration, projects such as grassland restoration and black beach remediation contributed 97.13% to GEP growth during this period. Furthermore, grazing prohibitions have alleviated overgrazing pressures, indirectly promoting a 14.30% increase in oxygen release value. Water body conservation initiatives, including lake restoration and wetland rehabilitation, significantly enhanced water conservation value by expanding aquatic areas, contributing an additional 21.214 billion yuan, which accounts for 22.0% of the GEP increment. In addition, the TRSNP Administration has published the “Ecological Experience and Environmental Education Special Plan for TRSNP”, gradually transitioning from pasture contracting to franchising. This initiative includes engaging local herders in ecological experience activities along the Lancang River Grand Canyon and the Yellow River source exploration. Collaborative scientific research with various stakeholders has been fostered to support scientific expeditions into the core areas of the Three-River-Source region, facilitating a comprehensive scientific investigation of the Tibetan Plateau and providing foundational support for research outcomes.
From the perspective of various indicators, the impact of ecological engineering on different categories of ecosystem products exhibits significant variation. In terms of regulating services, the value of soil retention increased by 52.53%, directly benefiting from grassland restoration and black beach remediation efforts. The value of water retention rose by 43.95%, closely associated with water-body-protection initiatives. Additionally, the flood mitigation value increased by 7.69% due to the expansion of lake areas. Conversely, the products have experienced declines as a result of grazing prohibition policies, with agricultural and animal husbandry product yields decreasing by 28.37% and 32.36%, respectively, leading to a reduction in value amounting to 2.17 billion yuan. This reflects the trade-off between ecological conservation and short-term economic returns. In the realm of cultural services, the establishment of the national park has led to an increase in research value, characterized by heightened investment in scientific research and a remarkable 225% growth in the number of published papers.
From the perspective of different regions, soil erosion in the Lancang River source region is primarily dominated by hydraulic erosion in grasslands. The enhancement of the soil retention value can be effectively achieved through natural restoration or artificial intervention measures to control and remediate erosion. In contrast, the Yangtze River source region experiences widespread and extensive erosion in sandy and bare land, while the Yellow River source region is characterized by a broad distribution of wind erosion in grasslands, with localized areas exhibiting intense erosion. These conditions may necessitate a longer duration of management efforts before observable results can be achieved. This disparity in erosion dynamics is also a key reason for the higher soil retention value and more rapid growth observed in the Lancang River source region [40].
Based on this, the following recommendations are made:
- (1)
- Exploring value-added models for agricultural and pastoral products is essential to broaden the income sources for farmers and herders: Under the influence of grazing prohibition policies, the output of agricultural and livestock products in the TRSNP has decreased. The government has provided certain subsidies to herders as supplementary income, which is particularly applicable during the transitional phase of national park development. As the national park evolves, herders should leverage proactive income strategies to promote sustainable economic development. This includes exploring pathways to enhance the value of agricultural and animal husbandry products, such as adopting new technologies to increase productivity and creating ecosystem product brands to raise products’ added value. Such initiatives can augment herders’ proactive income, thereby reducing reliance on government subsidies. Additionally, the establishment of ecological management positions specifically for herders affected by decreased income due to grassland restoration could provide alternative income sources, addressing the conflict between ecological security and the livelihoods of herders.
- (2)
- Implementing differentiated restoration in various regions to explore methods of realizing soil conservation value: Ecological protection and construction projects in the Three-River-Source region have yielded significant results, particularly in soil retention, with the Lancang River source region exhibiting the highest regulatory services among the three major regions. Continued investment in ecological protection and construction projects, such as comprehensive management of black soil grasslands, should be prioritized.
For the Yellow River and Yangtze River source regions, it is crucial to focus on improving the effectiveness of previously employed restoration methods. Enhancements in black soil grassland management techniques and vegetation restoration methodologies are essential for further restoring the health of the national park ecosystems and elevating soil retention value.
Currently, ecological resource rights trading primarily revolves around carbon credit trading and water rights trading, with the carbon credit market gradually improving. However, the trading of other regulatory service values remains minimal. Given that soil retention represents the highest ecosystem product value per unit area in the TRSNP, there exists substantial potential for realizing its economic value. Designing a “Soil Conservation Credit” system that converts the amount of soil stabilization per unit area into tradable indicators—similar to the implementation of carbon sequestration value—could attract investments from water, and mining enterprises. To initiate this process, the Lancang River source region could serve as a pilot area to explore ecological resource rights trading models related to soil conservation.
- (3)
- With the construction of national parks, the attention of research teams and other stakeholders towards ecologically significant areas has increased, subsequently enhancing their research value. This allows for more scientific investigations to be conducted provided that the ecological environment remains undisturbed, thereby laying a foundational basis for further protection and restoration efforts. Following the establishment of national parks, public awareness of the Three-River-Source region’s beautiful environment and rich cultural heritage has deepened, leading to an increase in visitor numbers to the park. However, it is crucial to pay attention to the potential ecological security issues that may arise from the growing influx of tourists. It is recommended to calculate the carrying capacity for visitors to ensure sustainable development of the ecotourism sector, thus achieving a win–win situation that harmonizes ecological protection with economic development.
4.3. Innovations, Limitations, and Future Perspectives
The assessment of GEP in national parks differs methodologically from conventional assessments based on administrative divisions. A review of past studies reveals that most have chosen independent and complete administrative areas as their subjects. This approach allows for the reliance on publicly available official statistics when obtaining data on ecosystem product yields, thus providing ample data support for the research. Additionally, this strategy results in more clearly defined assessment content and facilitates the acquisition of relevant parameters, thereby reducing the difficulty and complexity of the study. In contrast, the assessment of GEP in national parks presents greater challenges because of the extensive geographic scope and the need for coordination and data integration across multiple administrative regions. Furthermore, the ecosystems within national parks are more complex and diverse, resulting in more intricate assessment content and a more challenging process of parameter determination. Therefore, to address the unique complexities and diversity of national parks, a more comprehensive and flexible methodological framework is required when conducting ecosystem product value assessments in these parks [41,42,43,44].
The present study adopts a relatively well-developed model (InVEST) and constructs a value assessment system for ecosystem products in the TRSNP. By comparing our results with existing research, significant differences are found in the value assessment results of ecosystem products in the TRSNP, thus reflecting the uniqueness of this study in terms of evaluation indicators, assessment methods, and pricing parameters.
- (1)
- In contrast to the studies by scholars like Du et al. [39], which focused on the GEP assessments of five national parks, our research includes both material products and cultural service values, resulting in more comprehensive assessment indicators that encompass ecosystem material products, ecosystem regulatory services, and ecosystem cultural services. Unlike the “Guidelines”, this study incorporates scientific research projects into cultural services, facilitating further exploration of cultural service ecosystem products in national parks. The indicators of this study also cover key factors across multiple dimensions of ecosystem products, ensuring a thorough consideration of the comprehensiveness and representativeness of the assessment indicators for TRSNP.
- (2)
- This study incorporates the mature InVEST model for assessing ecosystem service values, broadening the methodological approaches beyond those outlined in the “Guidelines”.
- (3)
- The first batch of localized parameters for the ecosystem product value assessments of the five national parks faced challenges in data acquisition. This research improves real-time accuracy by determining parameters via the correlation of data from relevant monitoring centers, thus enhancing the reliability and precision of the value assessment system for the TRSNP compared to previous studies.
- (4)
- In the assessment of regulating services, this study included local precipitation and NPP factors within the ecosystem product value assessment framework, thereby correcting some of the inaccuracies associated with the equivalency factor method to a certain extent.
Building upon the framework established in the “Guidelines”, the present study integrates various ecosystem service value assessment models, such as the InVEST model, to construct a value assessment system for ecosystem products in TRSNP. The values of ecosystem products for the years 2015 and 2020 in the TRSNP were calculated, yielding scientifically sound results. Dominated by grasslands, the primary land cover type of the TRSNP can be further categorized into high-altitude meadows, high-altitude grasslands, and temperate grasslands. Future research should thus refine these secondary classifications to enhance assessment accuracy. Additionally, the calculation of the species conservation value in this study was based on the area method of nature reserves. As such, future efforts could correlate this with more detailed empirical data to better reflect temporal changes in species conservation value. Regarding the value of cultural services, the current lack of publicly available statistical data hampers the assessment of values related to education and cultural heritage preservation. In the future, it is essential to collaborate with management authorities to establish a specialized monitoring system for cultural services. This system should refine data collection standards, thereby laying a solid foundation for subsequent dynamic assessments.
In terms of research methodology, the InVEST model, carbon sequestration mechanism model, and evapotranspiration model incorporated in this study each have certain limitations. The InVEST model simplifies pollutant loads in water purification calculations as product land use types and distance decay functions, neglecting natural purification mechanisms such as riparian vegetation filtration, soil adsorption, and microbial degradation, which may lead to an overestimation of nitrogen and phosphorus loads entering waterways. Furthermore, when calculating soil conservation amounts, there is a risk of overestimation in the slope length factor for slopes greater than 25 degrees. The carbon sequestration mechanism model has been validated for its feasibility in the Lancang River basin; however, it fails to fully incorporate critical components of the carbon cycle, such as soil respiration, litter decomposition, and heterotrophic respiration, potentially resulting in inaccuracies in estimating net carbon sequestration. The evapotranspiration model faces universal controversies regarding energy conversion coefficients. When equating evapotranspiration energy consumption to that of air conditioning/humidifying devices, it does not account for seasonal variations in equipment energy efficiency ratios and intergenerational differences in technology, leading to potentially inaccurate results. In future research, we plan to couple the InVEST model with high-resolution hydrological models (e.g., Soil and Water Assessment Tool) to address the simplification issues related to water quality purification and soil erosion processes. Additionally, we will consider the seasonal variability of equipment efficiency ratios to further improve the deficiencies of the evapotranspiration model.
According to the newly released “Overall Planning of TRSNP (2023–2030)”, the latest area of TRSNP has expanded to 190,700 km2, encompassing 5 counties and 15 townships (or towns) in Qinghai Province, which marks an increase of 77,600 km2 compared to the original area. This planning connects the source areas of the Yangtze River and the Lancang River into a singular spatial domain. Furthermore, the protection zones have been restructured from three levels (core conservation areas, ecological conservation and restoration areas, and traditional utilization areas) to two levels (core protection areas and general control areas). This restructuring enhances the integrity and connectivity of the TRSNP ecosystem. The continuous monitoring of the updated assessment results for ecosystem product values post-reallocation is essential in improving the dynamic precision of the ecosystem product value assessment and evaluation system. Additionally, this study focuses on the periods of 2015 and 2020, resulting in a relatively short temporal span. Future research should continuously monitor the ecological product value assessment results following the reclassification of the TRSNP in order to enhance the dynamic accuracy of the ecological product value accounting and evaluation system.
5. Conclusions
This study references the “Guidelines” framework and combines established ecosystem service value assessment models (InVEST) to construct a value assessment system for ecosystem products in TRSNP. Assessments of the GEP values for the years 2015 and 2020 reveal an overall enhancement in GEP since the establishment of the TRSNP. Several main conclusions were obtained.
- (1)
- This study has successfully constructed a comprehensive accounting framework that encompasses material products, regulating services, and cultural services. In addressing the inadequacy of existing research indicators and the limited diversity of methodologies, this framework employs different calculation models and parameter calibration methods tailored to various types of ecosystem products, thereby precisely quantifying the ecosystem product value within TRSNP. The constructed accounting system has improved the accuracy of ecosystem product valuation and provided a scientific basis for evaluating the ecological protection effect of TRSNP.
- (2)
- The total value of ecosystem products in TRSNP increased by 31.19% from 2015 to 2020. Driven by policies such as grazing bans and the restoration of grasslands, the value of material products saw a decrease during the same period, while the value of regulating services experienced an increase. Notably, among the regulating services, the value associated with soil conservation emerged as the highest.
- (3)
- The value of regulating services varies across different regions due to the influences of land use types and soil erosion types was highlighted. Among these, the value of regulating services per unit area is highest in the Lancang River source region, followed by the Yellow River source region, and the lowest is in the Yangtze River source region.
- (4)
- Exploring pathways for enhancing the value of agricultural and animal husbandry products is recommended to increase the overall value of agro-pastoral products and broaden income sources for herders. Special attention should be given to soil protection and restoration projects in the Yangtze and Yellow River source regions. Taking the Lancang River source region as a pilot, strategies should be investigated for the trading of ecological resource rights associated with soil retention regulating services to realize the intrinsic value of soil retention.
Overall, this research provides an effective case study for the theoretical framework of ecosystem product value assessment, thus reflecting the ecological environmental state and changes from the pilot phase to the formal establishment of the TRSNP. This article provides scientific basis and support for addressing the main contradictions of unbalanced and insufficient development, as well as for evaluating the effectiveness of national park protection.
Author Contributions
P.J.: Conceptualization, Formal analysis, Funding acquisition, Methodology, Writing—original draft, Writing—review and editing. J.C.: Conceptualization, Methodology, Software, Writing—original draft, Writing—review and editing. D.G.: Conceptualization, Project administration, Supervision. Y.Z.: Writing—review and editing, Supervision. X.W.: Supervision. All authors have read and agreed to the published version of the manuscript.
Funding
This research was financially supported by Major Research Plan of National Social Science Found of China (NSSFC), grant No. 20&ZD096.
Data Availability Statement
The original contributions presented in this study are included in the article. Further inquiries can be directed to the corresponding author.
Acknowledgments
Acknowledgement for the data support from National Cryosphere Desert Data Center, Big Earth Data for Three Poles, National Earth System Science Data Center and Institute of Tibetan Plateau Research, Chinese Academy of Sciences.
Conflicts of Interest
The authors declare no conflicts of interest.
References
- Pekor, A.; Miller, J.R.B.; Flyman, M.V.; Kasiki, S.; Kesch, M.K.; Miller, S.M.; Uiseb, K.; der Merve, V.L.P.A. Fencing Africa’s protected areas: Costs, benefits, and management issues. Biol. Conserv. 2019, 229, 67–75. [Google Scholar] [CrossRef]
- Silva, J.; Dias, T.; Cunha, H.F.A. Funding deficits of protected areas in Brazil. Land Use Policy 2021, 100, 104926. [Google Scholar] [CrossRef]
- Zhang, Y.; Xiao, X.; Cao, R.; Zheng, C.; Guo, Y.; Gong, W.; Wei, Z. How important is community participation to eco-environmental conservation in protected areas? From the perspective of predicting locals’ pro-environmental behaviours. Sci. Total Environ. 2020, 739, 139889. [Google Scholar] [CrossRef] [PubMed]
- Zhang, Y.J. Exploration on the Sinicization o f the National Park Concept. Frontiers 2022, 4, 66–79. [Google Scholar]
- Kang, X.; Du, M.; Zhao, L.; Liu, Q.; Liao, Z.; Su, H.; Xiang, T.; Gou, C.; Liu, N. Integrity-centered framework for determining protected areas boundary: An application in the China’s national park. Ecol. Inform. 2024, 84, 102885. [Google Scholar] [CrossRef]
- Xue, S.; Fang, Z.; Bai, Y.; Alatalo, J.M.; Yang, Y.; Zhang, F. The next step for China’s national park management: Integrating ecosystem services into space boundary delimitation. J. Environ. Manag. 2023, 329, 117086. [Google Scholar] [CrossRef]
- Wei, D.; Feng, A.; Wu, M. Analysis of the resources value of Three-River-Source National Park based on ecological civilization. Int. J. Geoherit. Parks 2020, 8, 173–184. [Google Scholar] [CrossRef]
- Wang, Y.; Lü, Y.; Lü, D.; Yin, L.; Wang, X. Climate change and its ecological risks are spatially heterogeneous in high-altitude region: The case of Qinghai-Tibet plateau. Catena 2024, 243, 108140. [Google Scholar] [CrossRef]
- Chiodo, E.; Fantini, A.; Dickes, L.; Arogundade, T.; Lamie, D.; Assing, L.; Stewart, C.; Salvatore, R. Agritourism in Mountainous Regions-insights from anInternational Perspective. Sustainability 2019, 13, 3715. [Google Scholar] [CrossRef]
- Wanner, A.; Pröbstl-Haider, U.; Feilhammer, M. The future of Alpine pastures—Agricultural or tourism development? Experiences from the German Alps. J. Outdoor Recreat. Tour. 2021, 35, 100405. [Google Scholar] [CrossRef]
- Fu, M.; Tian, J.; Zhu, Y.; Tian, Y.; Zhao, Z.; Li, J. Identification of functional zones and methods of target management in Sanjiangyuan National Park. Biodivers. Sci. 2017, 1, 71–79. [Google Scholar] [CrossRef]
- Wu, J.; Wu, G.; Zheng, T.; Zhang, X.; Zhou, K. Value capture mechanisms, transaction costs, and heritage conservation: A case study of Sanjiangyuan National Park, China. Land Use Policy 2020, 90, 104246. [Google Scholar] [CrossRef]
- Kumar, P. The Economics of Ecosystems and Biodiversity Ecological and Economic Foundations, Publisher; Rensselaer Polytechnic Institute, Department of Economics: Troy, NY, USA, 2011; pp. 123–150. [Google Scholar]
- Hannon, B. The use of analogy in biology and economics: From biology to economics, and back. Struct. Change Econ. Dyn. 1997, 8, 471–488. [Google Scholar] [CrossRef]
- Ouyang, Z.; Zhu, C.Q.; Yang, G.B.; Xu, W.H. Gross ecosystem product: Concept, accounting framework and case study. Acta Ecol. Sin. 2013, 21, 6747–6761. [Google Scholar] [CrossRef]
- Ouyang, Z.; Song, C.; Zheng, H.; Polasky, S.; Xiao, Y.; Bateman, L.J.; Liu, J.; Ruckelshaus, M.; Shi, F.; Xiao, Y.; et al. Using gross ecosystem product (GEP) to value nature in decision making. Proc. Natl. Acad. Sci. USA 2020, 25, 14593–14601. [Google Scholar] [CrossRef] [PubMed]
- Chen, H. At least two accounting systems for Gross Ecosystem Product (GEP) are needed. J. Environ. Manag. 2024, 370, 122429. [Google Scholar] [CrossRef]
- Zhang, L.; Chen, X.; Liang, T.; Wang, H.; Hao, C.; Ren, Y.; Li, Y.; Wu, S. Research Progress, Problems and Prospects of Ecosystem Products Value Accounting in China. Res. Environ. 2023, 4, 743–756. [Google Scholar]
- Li, Y.; Xie, L.M.; Mo, X.; Zhou, S.J.; Zhang, Z.M.; Zhang, M.X. Accounting and Spatio-temporal Dynamic Analysis of the Gross Ecosystem Product (GEP) of Wetlands in Jiangxi Province. J. Ecol. Rural. Environ. 2024, 6, 738–748. [Google Scholar]
- Zhang, W.W.; Liu, Y.; Feng, Q.; Wang, Y.P.; Yang, S.Q. Ecosystem services for coupled human and environment systems. Prog. Geogr. 2018, 37, 139–151. [Google Scholar]
- Boumans, R.; Roman, J.; Altman, I.; Kaufman, L. The Multiscale Integrated Model of Ecosystem Services (MIMES): Simulating the interactions of coupled human and natural systems. Ecosyst. Serv. 2015, 12, 30–41. [Google Scholar] [CrossRef]
- Pei, X.; Yu, Q.R.; Liu, C.L.; Zhang, J.P.; Qiao, Q.; Chen, L.; Liu, X.N. Analysis of Pricing Method of Regulating Service in the Accounting of Ecosystem Products. Environ. Prot. 2024, Z1, 31–35. [Google Scholar]
- Tan, L.; Guo, G.; Li, S. The Sanjiangyuan Nature Reserve Is Partially Effective in Mitigating Human Pressures. Land 2021, 11, 43. [Google Scholar] [CrossRef]
- Zhu, Y.; Jia, P.; Liu, Y. Spatiotemporal evolution effects of habitat quality with the conservation policies in the Upper Yangtze River, China. Sci. Rep. 2025, 15, 5972. [Google Scholar] [CrossRef]
- Hu, X.W.; Lian, E.H.; Zhuoma, C. Optimization of Land Use Structure and Spatial Layout of Sanjiangyuan National Park. Qinghai J. Ethnol. 2022, 2, 190–199. [Google Scholar]
- Zhang, T.; Jiang, F.; Zhang, J.; Cai, Z.; Gao, H.; Gu, H.; Song, P. A review of wildlife conservation and management strategies of Sanjiangyuan National Park. Acta Theriol. Sin. 2023, 43, 193–205. [Google Scholar]
- Zhou, X.T.; Sun, W.Y.; Mu, X.M.; Song, X.Y.; Zhao, G.J. Spatiotemporal variation and influencing factors of water conservation capacity in Three-River Headwaters region from 1990 to 2020. Acta Ecol. Sin. 2023, 23, 9844–9855. [Google Scholar]
- Gao, X.L.; Feng, Q.; Li, Z.X.; Deng, X.H.; Xue, J. Spatio-temporal pattern and influencing factors of water in the Three-River-Source region. Acta Ecol. Sin. 2024, 16, 1–13. [Google Scholar]
- Lv, L.; Ren, T.; Sun, C.; Zheng, D.; Wang, H. Spatial and temporal changes of water supply and water conservation function in Sanjiangyuan National Park from 1980 to 2016. Acta Ecol. Sin. 2020, 40, 993–1003. [Google Scholar]
- Natural Capital Project. InVEST 0.0 User’s Guide. Available online: https://storage.googleapis.com/releases.naturalcapitalproject.org/invest-userguide/latest/zh/index.html# (accessed on 1 July 2024).
- Chen, S.; Li, X.; Qian, Z.; Wang, S.; Wang, M.; Liu, Z.; Li, H.; Xia, H.; Zhao, Z.; Li, T.; et al. Drought trend and its impact on ecosystem carbon sequestration in Lancang-Mekong River Basin. Acta Geogr. Sin. 2024, 79, 747–764. [Google Scholar]
- Rao, E.; Xiao, Y.; Ouyang, Z. Assessment of Flood Regulation Service of Lakes and Reservoirs in China. Prog. Geogr. 2014, 8, 1356–1365. [Google Scholar]
- Fang, J.; Xu, L.; Lu, Q. Ecological security patterns of Chinese lakes based on ecosystem service values assessment and human threat factors evaluation. Ecol. Inform. 2024, 82, 102754. [Google Scholar] [CrossRef]
- Huang, L.; Li, J.; Zhang, H.; Li, Y.; Wang, H.; Fan, J. Accounting and assessment of grassland ecological values. Acta Pratacult. Sin. 2024, 33, 47–63. [Google Scholar]
- Yan, X.; Cao, G.; Cao, S.; Yuan, J.; Zhao, M.; Tong, S.; Li, H. Spatiotemporal variations of water conservation and its influencing factors in the Qinghai Plateau, China. Ecol. Indic. 2023, 155, 111047. [Google Scholar] [CrossRef]
- Baró, F.; Chaparro, L.; Gómez-Baggethun, E.; Langemeyer, J. Contribution of Ecosystem Services to Air Quality and Climate Change Mitigation Policies: The Case of Urban Forests in Barcelona, Spain. J. Hum. Environ. 2014, 43, 466–479. [Google Scholar] [CrossRef]
- Xu, H.; Yang, C.; Li, Q. Spatial-temporal variations of ecosystem service value in Sanjiangyuan National Park. Chin. J. Ecol. 2024, 43, 1881–1890. [Google Scholar]
- He, X. Evaluation of the grassland ecosystem services in the source region of three rivers. Qinghai Pratacult. 2021, 30, 29–36. [Google Scholar]
- Du, A.; Shen, Y.; Xiao, Y.; Ouyang, Z. Research on accounting of ecological products value in National Parks. Acta Ecol. Sin. 2023, 1, 208–218. [Google Scholar]
- Huang, T.; Zhao, H.; Zhao, Y.; Ren, J.; Li, Z.; Li, B. Soil Erosion and Its Spatial Distribution Characteristics in Three-River-Source National Park. Bull. Soil Water Conserv. 2023, 43, 95–103+110. [Google Scholar]
- Song, C.; Ouyang, Z. Gross Ecosystem Product accounting for ecological benefits assessment: A case study of Qinghai Province. Acta Ecol. Sin 2020, 10, 3207–3217. [Google Scholar]
- Wang, L.; Xiao, Y.; Ouyang, Z.; Wei, Q.; Bo, W.; Zhang, J.; Ling, R. Gross ecosystem product accounting in the national key ecological function area: An example of Arxan. China Polulation Resour. Environ. 2017, 27, 146–154. [Google Scholar]
- Pema, D.; Xiao, Y.; Wang, L. Assessment of ecological conservation effect in Xishui county based on gross ecosystem product. Acta Ecol. Sin. 2020, 40, 499–509. [Google Scholar]
- Zhang, C.; Zhang, Y. Evaluation of Ecosystem Services in Qilian Mountain National Park, Qinghai Province. Environ. Prot. 2019, 47, 41–47. [Google Scholar] [CrossRef]
Disclaimer/Publisher’s Note: The statements, opinions and data contained in all publications are solely those of the individual author(s) and contributor(s) and not of MDPI and/or the editor(s). MDPI and/or the editor(s) disclaim responsibility for any injury to people or property resulting from any ideas, methods, instructions or products referred to in the content. |
© 2025 by the authors. Licensee MDPI, Basel, Switzerland. This article is an open access article distributed under the terms and conditions of the Creative Commons Attribution (CC BY) license (https://creativecommons.org/licenses/by/4.0/).