Abstract
In the context of global climate change and carbon neutrality goals, agriculture has emerged as a major source of greenhouse gas (GHG) emissions, and faces the critical challenge of reducing emissions while ensuring food security. However, existing research has rarely focused on dynamic simulation and scenario-based analysis of optimised agricultural layouts and their impact on GHG emissions. Taking the three northeastern provinces (Heilongjiang, Jilin, and Liaoning) of China as the study area, this study quantifies GHG emissions from major grain crops and employs time-series analysis and machine learning methods to conduct a scenario analysis, including three scenarios (Business as Usual, Sustainable Optimisation, and Ecological Priority). Specific policy implications are proposed for optimising agricultural layouts and mitigating GHG emissions. The results indicate that GHG emissions in Northeast China primarily stem from methane emissions in rice cultivation and nitrous oxide emissions from fertiliser use. A scenario analysis reveals that the “Sustainable Optimisation” scenario reduces GHG emissions by 22.0% through optimised planting layouts while maintaining stable crop production. The “Ecological Priority” scenario further enhances emission reductions to 25.2% by increasing the share of low-emission crops, such as corn, and reducing high-emission crops, such as rice. The study provides a practical reference for promoting the low carbonisation of agriculture, and demonstrates that optimising planting layouts and production structures can simultaneously achieve food security and climate change mitigation.
1. Introduction
Addressing climate change, reducing greenhouse gas (GHG) emissions, and promoting sustainable development have become global imperatives. In 2015, the United Nations released the 2030 Agenda for Sustainable Development, outlining 17 Sustainable Development Goals (SDGs) to counter environmental degradation and global warming. The global warming caused by GHG emissions seriously threatens economic and social development [1]. As a vital food supply sector, agriculture must meet society’s fundamental needs and ensure sustainable development by maintaining future productivity and ecosystem stability [2]. Currently, global food security faces multiple challenges, including climate change, geopolitical instability, and economic slowdowns [3].
It is noteworthy that crop production itself is a significant source of GHG emissions [4]. Although the majority of global emissions stem from industrial sectors, the environmental impact of agricultural activities cannot be ignored. Agriculture, forestry, and other land use account for approximately 25% of anthropogenic GHG emissions [5] and CO2, CH4 and N2O are released through soil management, fertilisation, livestock production, and rice cultivation. While agricultural technology has advanced, increased energy input and resource consumption have further driven GHG emissions [6]. Specifically, prolonged chemical usage, intensive farming practices, mechanisation, and land-use changes have made agriculture a key driver of changes in biogeochemical cycles [7]. Under the current sustainable development agenda, balancing food security with environmental quality is a critical global challenge [8].
In recent years, research on GHG emissions and the stability of crop production within agricultural systems has significantly enriched the understanding of agrarian optimisation. Agriculture is a significant source of GHG emissions, accounting for approximately 14% of global GHG emissions and 58% of global non-CO2 GHG emissions [9,10]. In crop production, nitrogen fertilisers, chemical fertilisers, irrigation, and agricultural machinery are recognised as primary sources of carbon emissions. While these inputs support crop growth, they also substantially increase emissions [11]. For example, increased nitrogen fertiliser use typically intensifies emissions of nitrous oxide, a gas with a greenhouse effect far greater than that of carbon dioxide [12]. Consequently, balancing crop production and GHG reduction has become a critical research question. Globally, agricultural GHG emissions mainly stem from soil management, livestock rearing, crop residue burning, and fertiliser production and application [13]. The widespread use of fertilisers, machinery, and agricultural diesel has made agriculture one of the primary contributors to local carbon emissions [14]. This context underscores the urgency of optimising agricultural management practices to reduce emissions and achieve sustainable development in agriculture.
China is a major agricultural country and has a responsibility to ensure food security while reducing GHG emissions. It is estimated that agricultural GHG emissions in China account for 17% of the country’s total emissions [15]. China’s long-term development plans include the global goal of carbon neutrality by 2060, focusing on reducing agricultural GHG emissions as a key objective [16]. The three northeastern provinces (Heilongjiang, Jilin, and Liaoning), as major crop production bases, have experienced soil degradation and increased GHG emissions due to over-cultivation and improper land use [17]. In addition, Fan, et al. [18] pointed out that there are significant differences in the GHG emissions factors for China’s major crops (such as rice, wheat, and corn). Their study highlighted the impact of crop type and farming methods on GHG emissions and suggested that altering crop distribution and optimising farming practices could lead to reduced emissions.
In the global context of climate change mitigation, the sustainability of agriculture in the three northeastern provinces, as a national “granary”, is closely linked to the health of the regional ecological environment. The black soil of Northeast China is rich in organic carbon reserves, a type of highly fertile soil that is rare worldwide and ideal for agricultural use [19]. Although a relatively limited area is covered by black soil globally, it accounts for a substantial portion of global crop production. Statistics show that black soil regions produce more than 50% of the world’s sunflowers and millet, 30% of wheat, 26% of soybeans, and 16% of corn [20]. Therefore, studying the relationship between agricultural distribution and GHG emissions in Northeast China and exploring sustainable agricultural production models is of great significance.
The climatic and geographical characteristics of the three northeastern provinces also bring dual pressures on agricultural production and environmental protection. Agriculture in the northeast region is characterized by high intensification, which leads to the centralization of energy input, fertilizer use and GHG emissions [21]. With climate change, the northward movement of agricultural centres has also increased the pressure on agricultural production in the northeast [22]. Against the background of the national emission reduction strategy, the three northeastern provinces are not only a core area of food security, but also an important battleground for agricultural emission reduction.
To address these environmental challenges, policies that support low-carbon agriculture, including subsidies for black soil conservation and the promotion of low-carbon technologies, have encouraged sustainable practices like conservation tillage and precision fertilisation [23,24,25]. Moreover, studies confirm that optimising nitrogen management, integrating straw incorporation, and adopting precision agriculture can significantly reduce emissions and enhance resource efficiency.
Based on these advancements, researchers have proposed various low-carbon agricultural management practices tailored to the specific conditions of Northeast China. For instance, Chen, et al. [26] conducted a life-cycle assessment and identified nitrogen fertiliser application as a key factor influencing GHG emissions from major crops. In a similar vein, Guo et al. [11] demonstrated that reducing the planting area of high-carbon-emission crops and optimising crop structures significantly support the development of low-carbon agriculture. Additionally, Wang et al. [25] evaluated the balance between crop production potential and GHG reduction through scenario analysis, providing scientific guidance for policy formulation. These studies collectively highlight the effectiveness of practices such as optimised nitrogen management, straw incorporation, conservation tillage, and precision agriculture in reducing emissions and improving resource use efficiency [27]. In addition, remote sensing monitoring and life cycle assessment techniques in recent years have provided important support for agricultural yield, especially for quantifying agricultural GHG emissions from crop cultivation and productions [28].
Despite the progress made, research gaps remain. Current studies often focus on single management measures, rely on historical data, and lack dynamic simulations or future scenario forecasts. Furthermore, the complexity of Northeast China’s agricultural systems necessitates more targeted analyses to assess emission reduction potential through optimised crop distribution and production adjustments. Addressing these gaps can provide robust strategies for achieving sustainable agricultural practices and balancing food security with environmental goals.
This study aims to explore the relationship between crop production and GHG emissions in the three northeastern provinces of China. It aims to find ways to effectively reduce agricultural GHG emissions while ensuring food security (maintaining crop production levels without significant adjustments to agricultural layout and production structure) through strategic planning adjustments. To achieve this objective, this paper will focus on the following tasks: (1) examine the current state and trends of GHG emissions from agricultural production; (2) analyse the existing agricultural production structure and production advantages in the three northeastern provinces; (3) study the trends in agricultural production, project the state of agriculture in 2030, and plan an agricultural layout based on these projections to achieve the goal of reducing GHG emissions from agricultural production while maintaining or even slightly increasing crop production levels.
2. Study Area and Data Source
2.1. Study Area
The three northeastern provinces, i.e., Heilongjiang, Jilin, and Liaoning (Figure 1), were one of China’s critical crop-producing regions, playing a pivotal role in national food security and environmental conservation. Northeast China is endowed with fertile black soil, rich in organic matter and often referred to as the “granary”, supporting high yields of corn, soybeans, and rice [29]. However, the short growing season and harsh winters necessitate intensive planting and efficient management in spring [30]. This pattern leads to high reliance on fertilisation, irrigation, and mechanisation, and exacerbates significant GHG emissions. Meanwhile, over-cultivation and unsustainable practices have degraded this resource, thinning the black soil layer, reducing fertility, and diminishing soil carbon storage [31]. Conservation measures like straw return, conservation tillage, and organic fertilisation are crucial for maintaining productivity and enhancing carbon sequestration [5].
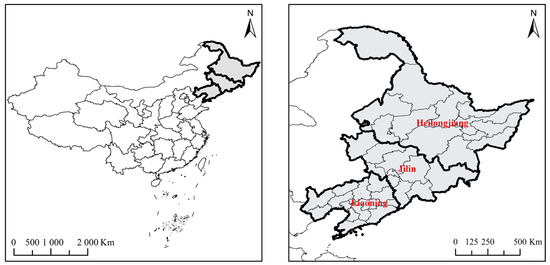
Figure 1.
Location of three northeastern provinces in Northeast China.
The agricultural planting structure in this region is relatively uniform, dominated by corn, soybeans, and rice [32]. The recent northward shift in rice cultivation has enhanced the region’s strategic role in global food security [22]. However, rice cultivation contributes significantly to methane emissions [33], while other crops, such as corn, rely heavily on nitrogen fertilisers and release nitrous oxide [18]. Adjusting the crop structure by reducing high-emission crops and increasing the share of low-emission alternatives can effectively mitigate GHG emissions.
2.2. Data Sources
As shown in Table 1, all agricultural data comprises the sown area and total production of rice, soybeans, wheat, corn, and tubers, as well as inputs of agricultural elements, including nitrogen fertiliser, phosphorus fertiliser, potassium fertiliser, pesticides, agricultural film, and the use of agricultural machinery. These data cover 36 cities across the three northeastern provinces in China and span the period from 2001 to 2022.

Table 1.
Data Source.
3. Methods
3.1. GHG Emissions from Crop Production
The calculation of GHG emissions from crop production is typically categorised into three classes. Primary emissions refer to the GHG emissions generated directly during ploughing, sowing, harvesting, and transport. In contrast, secondary emissions relate to GHG from fertilisers and pesticides during production, packaging, and storage. Tertiary emissions cover GHG emissions from acquiring raw materials, manufacturing agricultural machinery and equipment, and constructing agricultural buildings [34]. According to the IPCC definition, primary emissions are direct emissions, while secondary and tertiary emissions are implied and indirect ones [9]. Since tertiary emissions cover a wide range and the main objective of this study is to explore the differences in GHG emissions from different crop production processes, this paper focuses on GHG emissions in terms of primary emissions (including crop residue combustion, rice cultivation, and on-farm emissions) and secondary emissions (e.g., use of machinery, production of fertilisers, pesticides, and output of agro-films).
3.1.1. Direct GHG Emissions
The formula for calculating GHG emissions from the combustion of crop residues is given below according to Lu et al. [35]:
where represents GHG emissions from crop residue burning in area i in year j. denotes the yield of crop s in area i in year j. is the ratio of straw to grain for s crops; is the ratio of open burning in area i. represents the efficiency of burning. is the emission factor.
According to Yan et al. [33], the GHG emissions from rice cultivation were calculated using the following equation:
where represents the GHG emissions from rice cultivation in area i in year j due to the rice irrigation period. represents the area under rice cultivation in area i in year j. denotes the length of the rice growing period. is the emission factor for rice in area j.
Based on the IPCC Guidelines and studies by others [18,36], N2O emissions from agricultural land are calculated by the following equation:
where denotes the annual GHG emissions from agricultural land in the district. denotes the yearly amount of nitrogen fertiliser applied to agricultural land in the region. and represent the direct and indirect emission factors of N2O due to nitrogen deposition, respectively. is the volatilisation rate of ammonia and N2O from agricultural land. represents the indirect emission factor of N2O due to leaching runoff. is the nitrogen leaching rate and runoff from agricultural fields. S represents the ratio of N2O–N to the relative mass of N2O molecules.
3.1.2. Indirect GHG Emissions
Emissions from fertiliser production, which include energy extraction and transport, fertiliser synthesis, as well as fertiliser manufacturing and transport, are calculated using the following formula:
where denotes the GHG emissions due to fertiliser production in area i in year j. refers to the amount of fertiliser of class i applied in area i in year j. is the emission factor for fertiliser production of class k.
GHG emissions from pesticide production and transport were calculated using the following equation [5]:
where denotes the GHG emissions from pesticide production in province i in year j. denotes the amount of pesticide applied in province i in year j; is the proportion of pesticide active ingredient. is the emission factor for pesticide production.
The following equation [6] was used to calculate GHG emissions from machinery and agricultural film use [18]:
where is the GHG emissions due to machinery and agricultural films in province i in year j. denotes the total power of agricultural machinery; denotes the amount of film used. and are the emission factors for agricultural machinery and agricultural films, respectively. The related emission factors are shown in Appendix A.
3.2. Projections and Planning Optimisation for 2030
In the three northeastern provinces, the long-term adoption of a mono-crop planting structure has constrained the improvement of land fertility and the growth of crop production [37]. Furthermore, each region has not been able to give full play to its advantages in crop production. To address this problem, adjusting the agricultural planting structure in the study area has become a critical link in protecting regional crop production and reducing GHG emissions. This study aims to minimise GHG emissions during crop production by optimising crop allocation.
This study uses machine learning methods to predict the changes in production conditions in each city in the study area by 2030, including the dynamic changes in food productivity and production environment. In time series analysis and future trend prediction, time series models can effectively handle non-stationary data and convert it into stationary series, thereby capturing the trend and periodic characteristics of food productivity changes over time [38,39]. Machine learning prediction methods have shown advantages in terms of high accuracy in short-term and medium-to-long-term predictions [40], providing reliable decision support for policymakers to help optimise agricultural production strategies and improve regional food security.
Based on the prediction results, this study further simulates the optimisation of the food industry layout by setting different scenarios to determine the most suitable crop planting combination with the lowest GHG emissions. The various scenario settings are as follows:
Three scenarios, as shown in Table 2—Business as Usual (BU), Sustainable Optimisation (SO), and Ecological Priority (EP)—explored the balance between food security and the ecological impact of an optimal planting structure and layout. The BU scenario assumes that the planting structure of 2022 will be maintained to verify GHG emissions and the stability of food production under unchanged conditions. The basis for this scenario lies in the region’s historical cropping patterns and current food production policy requirements, while ensuring that total production does not fall below the 2022 level. The SO scenario optimizes crop layout by limiting the excessive expansion of dominant crops, while ensuring that the production levels of all crop types are not lower than those in 2022. The design logic of this scenario is based on balancing food security and ecological protection, allowing for moderate adjustments to the cropping structure to improve diversity and resource use efficiency. The EP scenario optimizes the crop production structure to ensure that by 2030, the production of all crops is at least 85% of the 2022 level, and total production does not fall below the 2022 level. To ensure the scientific validity and practical feasibility of the simulation results, the following constraints were established in this study: (1) the sown area in each city will not increase; (2) the planting area of non-dominant crops should not decrease significantly; (3) the total crop yield within the study area must not fall below the production level of 2022; (4) by 2030, the yield of each type of crop within the study area should not experience a significant decrease. The reason for setting these constraints is to adhere to the historical cropping structure of the region and to be as closely aligned as possible with the traditional farming practices of local farmers. This approach is also essential for ensuring the feasibility of the study results.
Table 2.
Scenario Description.
By integrating predictive data and scenario settings, this study employs a linear optimization algorithm for simulation analysis. The optimization process aims to minimize GHG emissions as the objective function while satisfying the constraints on sowing area and crop yield. The formula is as follows:
where is the sowing area of crop i in city j, denotes the GHG emission intensity of crop j in county i. is the sown area of crop i in 2030. is the sown area of crop i in 2022. and denote the yield of crop i in 2030 and 2022, respectively. and are restrictive adjustment factors.
4. Results
4.1. Variations in Crop Production
The study area (Heilongjiang, Jilin, and Liaoning) is one of China’s major grain-producing regions, accounting for a large proportion of the country’s crops such as rice, corn, and soybeans (Figure 2). The northeast region’s grain production accounted for an increasing proportion of the country’s total grain production from 2001 to 2022. Since 2018, the northeast region’s grain production has accounted for more than 20% of the national total. As a result, the northeast region is essential for ensuring China’s food security.
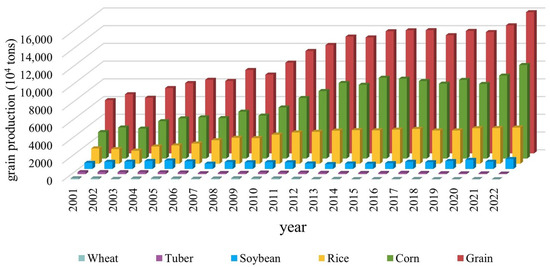
Figure 2.
Major Crop Production in Northeast China during 2001–2022.
The spatial distribution of crop production is shown in Figure 3. Overall, the grain production of the three northeastern provinces has increased from 59.99 million tons to 159.25 million tons over the past 22 years, an increase of 165.43%, with an average annual growth rate of 4.54%. It is worth noting that despite the significant increase in total crop production, the increase in cultivated land area was relatively small, rising from 14.07 million hectares in 2001 to 24.03 million hectares in 2022, an increase of about 70.76%. This phenomenon shows that the three northeastern provinces have improved crop production efficiency per unit area during this period through intensive production. During this research period, the production of corn and soybeans increased significantly, with corn rising from 29.82 million tons to 105.54 million tons and soybeans increasing from 6.85 million tons to 11.13 million tons, highlighting the dominant position of these two crops in the regional agricultural structure. At the same time, the production and acreage of wheat and potato crops showed a downward trend. In particular, wheat production decreased from 1.21 million tons to 1.19 million tons, indicating a significant decline in its status in the agriculture of the three eastern provinces. In addition, rice production also showed a steady growth trend, and its share in the national production increased yearly, reflecting the importance of the three northeastern provinces in national rice production.
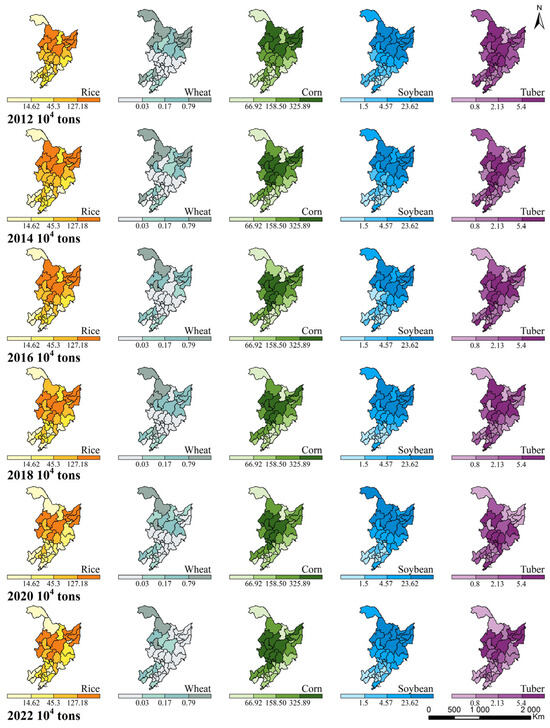
Figure 3.
Spatial Distribution of Crop Production during 2012–2022.
4.2. Changes in GHG Emissions from Crop Production
Over the past decade, Figure 4 illustrates that agricultural production in the three northeastern provinces has undergone exciting changes in GHG emissions. Overall, GHG emissions have shown a trend of first increasing and then decreasing. Direct GHG emissions have remained relatively stable, while emissions from some crops, such as wheat and potatoes, have decreased significantly. In contrast, emissions from corn and soybeans have increased. This increase is closely related to changes in acreage and yields. It is worth noting that the GHG emissions from rice are significant. Using chemical fertilisers and mechanised operations mainly drives indirect GHG emissions. Although emissions from nitrogen fertiliser have decreased, emissions from phosphate and potash fertilisers and the use of machinery have shown an upward trend. Emissions from agricultural films and pesticides fluctuated during this period but generally showed a downward trend.
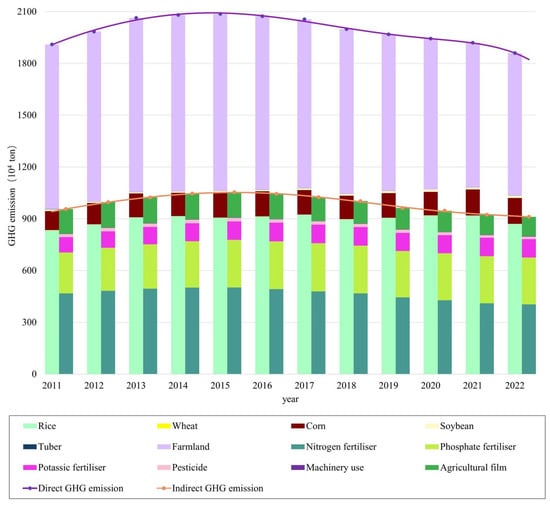
Figure 4.
Direct and indirect GHG emissions during 2011–2022.
The GHG emission levels of each city have declined, with the most significant decrease observed in Heilongjiang Province. Along with the changing trends in crop production, the calculation results show that an increase in grain production does not necessarily imply an increase in GHG emissions. In other words, through specific improvement measures, it is possible to ensure crop production while reducing GHG emissions. This provides a particular foundation and realistic basis for this study.
As shown in Figure 5, judging from the distribution of cities, the level of GHG emissions in each region has mostly remained unchanged. From 2011 to 2016, the intensity of GHG emissions in crop production areas increased in three cities: Shuangyashan in Heilongjiang Province, and Jilin and Liaoyuan in Jilin Province. There were also three cities where the level of GHG emissions decreased, namely Yingkou and Liaoyuan in Liaoning Province, and Mudanjiang in Heilongjiang Province. Among them, Mudanjiang has undergone significant changes, with its GHG emission level dropping by two levels. From 2016 to 2022, there were no cities with an increase in GHG emission intensity. In contrast, there were nine cities with a significant decrease in GHG emission levels, namely Dalian, Fuxin, Panjin, Tieling and Huludao in Liaoning Province, Hegang in Heilongjiang Province, and Jilin, Siping and Liaoyuan in Jilin Province.
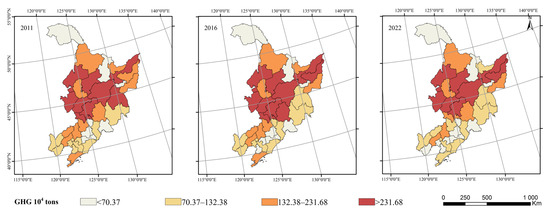
Figure 5.
Spatiotemporal distribution of GHG Emissions from crop production in Northeast China.
4.3. Results of Scenario Analysis
Table 3 and Figure 6 shows the results of scenario. Figure 7 shows the spatial distribution of the crop production and total GHG emissions in 2022 for three scenarios. The BU scenario gives priority to maintaining the current stability of the planting structure. This approach assumes that the crop acreage and distribution will remain consistent with the level of 2022, with no expansion in sowing areas across municipalities. Under this scenario, the total crop production in Northeast China is projected to reach 153.12 million tons, reflecting a 7.8% increase compared to 2022. This increase is mainly due to substantial yield gains in rice, soybeans, and tubers, which increase by 12.4%, 20.3%, and 25.8%, respectively. GHG emissions are expected to decline only moderately, by 8.8%, reaching 25.26 million tons. Compared to other scenarios, BU emphasises yield enhancement but shows a relatively modest decrease in emissions. The SO scenario seeks to maintain the yield of all types of crops while adjusting the planting layout within each municipality. This approach redistributes crops among regions according to local environmental needs and resource availability, optimising resource use efficiency and reducing the risk of over-concentrating dominant crops. To prevent the extensive expansion of certain crop types, the area of any single crop is limited to a reduction of at most 30%. This scenario is designed to enhance agroecosystem resilience by promoting crop diversity, improving land resource utilisation, and minimising challenges associated with monoculture. This approach is projected to reduce GHG emissions to 21.62 million tons—a 22.0% reduction compared to 2022. Although there is decline in crop yield, the optimised agricultural layout and structural adjustments make crop production in Northeast China more sustainable. There are significant emissions reductions, and no regions exhibit excessive emission levels. Compared to the BU scenario, SO achieves a more substantial reduction in GHG emissions. The EP scenario further increases the diversity of crop production by modifying yield structures based on the SO scenario. This design effectively mitigates dependency on dominant crops, bolsters agroecological diversity, and provides a more robust guarantee for food security, thereby reducing the potential negative impacts of climate change or environmental pressures on food supplies. The EP scenario maximises emission reductions while maintaining stable production levels. As shown in Table 3, in this scenario, corn—the dominant crop—shows a significant increase of 7.65%, reaching 100.98 million tons, while rice production decreases by 15% to 31.56 million tons. Wheat and soybean production also decline to 79.8 thousand tons and 8.83 million tons, respectively. GHG emissions in this scenario are anticipated to fall to 20.74 million tons, a reduction of approximately 25.2% compared to 2022, marking the most effective emission reduction outcome among the three scenarios. This scenario demonstrates that substantial GHG reductions can be achieved without compromising overall production by prioritising advantageous crops and reducing those with high environmental burdens.
Table 3.
Crop production and total GHG emissions in 2022 and three scenarios (104 tons).
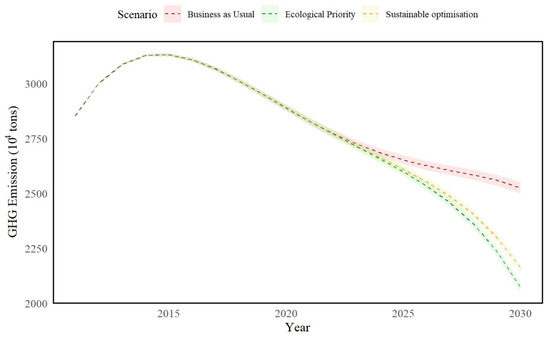
Figure 6.
Change trends in total GHG emissions in three scenarios.
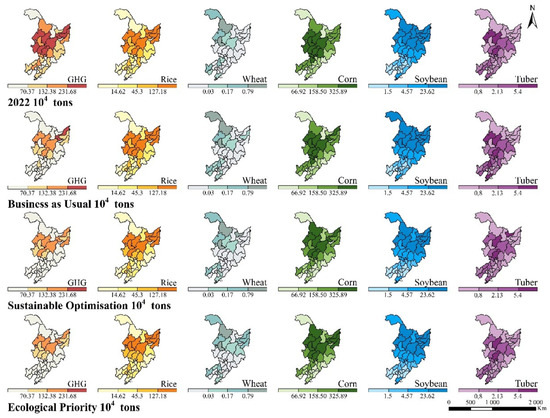
Figure 7.
Distribution of crop production and total GHG emissions in 2022 for three scenarios.
In summary, the three scenarios present a progressive approach to agricultural development, transitioning from steady-state growth to optimised production structures with increasing levels of intervention. At the same time, the Future 6 demonstrates varying degrees of reduction in GHG emissions. The BU scenario supports ecologically sensitive areas with minimal disruption. SO enhances planting diversity and resource efficiency, and the EP scenario focuses on optimising yield structure to strengthen food security. Together, these options provide a flexible framework for regional agricultural policy that balances crop production, GHG reduction, and ecological protection. The BU scenario prioritises natural growth with moderate emission reductions, the SO scenario controls production to achieve significant GHG reductions while maintaining production, and the EP scenario achieves the highest emission reductions by optimising crop structure and promoting advantageous crops.
5. Discussion
5.1. Agricultural Productivity and GHG Emission Challenges
As a major grain-producing region of China, the northeastern provinces of Heilongjiang, Jilin, and Liaoning face the dual challenge of improving agricultural productivity while reducing GHG emissions in the context of global climate change and in pursuit of national emission reduction targets. This analysis highlights the crop production structure in Northeast China, examining crops’ planting status, yield trends, and the GHG emission profiles of key regions. Northeast China benefits from distinctive climate conditions and fertile black soil, enabling it to serve as a significant crop production base, particularly corn, soybeans, and rice [30]. The rich organic matter in the black soil, often called the “granary”, supports high crop yields. However, recent intensification and mechanisation in agricultural practices have led to increased GHG emissions. Critical sources of emissions in the region include enhanced mechanisation, chemical fertiliser use, and changes in land use patterns. The comparative analysis reveals that high-yield crops like corn and rice contribute significantly to GHG emissions, with methane emissions in rice cultivation identified as a primary concern [41]. The agricultural structure in Northeast China is relatively uniform, dominated by corn, soybeans, and rice [32]. While these crops are vital to China’s food security, their production poses varying environmental impacts. For instance, methane emissions from rice cultivation are significant, while corn’s extensive reliance on nitrogen fertilisers contributes to the emission of nitrous oxide, a potent GHG [33]. Adjusting the regional crop structure to reduce high-emission crops, like rice, and increasing low-emission alternatives, such as corn, could lower overall GHG emissions, benefiting regional and national sustainability efforts [18].
This study provides an in-depth analysis of agricultural inputs, production structure, and GHG emissions in Northeast China, employing different scenarios to project future crop production. These scenarios explore how food security can be ensured while scientifically adjusting the planting and production structure of five major food crops to enhance ecological efficiency in production.
5.2. Scenario Analysis of Emissions and Productivity
In the BU scenario, crop production and GHG emission levels in the Northeast are optimistic. By 2030, the agricultural production layout of northeastern China will remain essentially unchanged. With productivity steadily increasing, crop yields are projected to rise by approximately 7.8%, while GHG emissions are expected to decrease by about 8.8%. This projection reflects a favourable outlook on future agroecological efficiency, aligning with the positive expectations for agricultural development expressed by Chen et al. [42]. The primary driver behind this trend is the intensified use of farm machinery and chemical fertilisers. The downward trend in GHG emissions observed after 2015 is anticipated to continue, consistent with findings by Du et al. [43] on the influence of agricultural policy. Despite increased crop yields, cities with a comparative disadvantage in certain crops exhibit a declining trend in production, with GHG emissions declining across all cities. This decline serves as an empirical basis for subsequent scenario comparisons, establishing a benchmark for assessing the impact of agricultural structure optimisation and carbon reduction on GHG emissions.
The significant decrease in GHG emissions under the SO Scenario demonstrates the importance of cultivation restructuring in Northeast China for stabilising food and reducing carbon. This scenario builds on the BU scenario, which optimises agricultural planting structures to maximise GHG reduction without reducing different kinds of crop production. By effectively managing arable land resources and leveraging each city’s agroecological advantages without expanding the cultivation area, this scenario significantly reduces GHG emissions. Specifically, the urban planting area for staple food crops should not decrease by more than 30% compared to 2022, enhancing the study’s practical applicability and guidance. By 2030, GHG emissions are estimated to be 21.62 million tons, a reduction of approximately 6.09 million tons or 22.0% compared to 2022. This demonstrates that agricultural layout optimisation is an effective method for achieving emissions reduction alongside productivity gains.
The EP Scenario, based on the SO Scenario, achieves a further reduction in GHG emissions while ensuring that total production does not decrease by adjusting the crop production structure. This confirms the impact of structural adjustments on GHG emissions. In this scenario, GHG emissions are projected to be 20.89 million tons, representing a 25.2% reduction compared to 2022 and a 4.52 million ton reduction compared to the BU scenario. This confirms that structural optimisation can maximise environmental benefits. Although this strategy may entail balancing yield and environmental protection goals, focusing on the region’s unique crop advantages provides a viable paradigm for sustainable agricultural practices. Compared to the SO scenario, the EP scenario reduces GHG emissions by an additional 720,000 tons. This indicates that the emission reduction effect achieved through production structure optimisation remains limited without drastic adjustments to total production. In particular, this scenario significantly reduces rice cultivation areas, especially in low-yield regions, to further reduce emissions. In contrast, corn production increases in regions with planting advantages. Although corn may not be the crop with the lowest level of GHG emissions, leveraging regional production advantages makes increasing corn production the optimal choice for ensuring food security while reducing GHG emissions. However, the emission reduction effect of such large-scale crop structure adjustments does not significantly exceed the results of the SO scenario, underscoring that while structural adjustments optimise environmental performance in specific cases, the effect is greatly influenced by crop characteristics and regional production advantages.
5.3. Policy Implications for Sustainable Development
Scenario analysis suggests that strategic agricultural planning—mainly through crop structure optimisation and low-carbon farming practices—is essential to balance food security and environmental sustainability. Given Northeast China’s critical role as a major grain producer, the following policy measures should be prioritised. (1) Optimising the crop planting structure has a significant impact on GHG emissions. The northeast region should adjust its planting structure, leverage regional advantages, and achieve the sustainable development goal of stabilising crop production and reducing GHG emissions. It should concentrate on planting high-emission crops (such as rice) in high-efficiency areas, and increasing the proportion of low-emission crops (such as soybeans). A reasonable crop structure can help reduce GHG emissions while maintaining a stable food supply [25]. (2) Protecting and efficiently utilising black soil resources is also an effective policy for ensuring the long-term sustainability of soil health and agricultural production. The rich black soil of Northeast China provides a critical foundation for sustainable agriculture [19]. Policies that support soil conservation, including straw incorporation and organic fertilisation, help maintain soil productivity while sequestering carbon, thus balancing yield increases with reduced environmental impact [24]. Effective soil management policies and technologies are integral to maintaining soil fertility and minimising GHG emissions. (3) Promoting low-carbon agricultural techniques is also an effective way. Policies should encourage the expansion of low-emission crops, such as corn, that align with regional ecological advantages. Additionally, support for low-carbon technologies, including precision fertilisation, conservation tillage, and integrated pest management, is critical for emissions reduction without compromising productivity [5,27]. Research supports that appropriate low-carbon practices reduce the agricultural carbon footprint and enhance resource use efficiency, amplifying ecological benefits.
This study demonstrates that strategic adjustments to agricultural production layouts and crop structures can significantly reduce GHG emissions in Northeast China. By balancing the planting structure between high-emission and low-emission crops and implementing scenario-based low-carbon strategies, Northeast China can achieve a sustainable equilibrium between food security and carbon neutrality objectives. This multi-scenario analysis provides empirical evidence for policymakers, demonstrating the feasibility of agricultural transformation through low-carbon technologies and rational production layouts. It offers a practical framework for crop production and environmental sustainability in Northeast China.
5.4. Directions for Future Research
While this study demonstrates the potential for GHG reduction through crop structure optimisation, future research should incorporate additional variables that impact on the agricultural sustainability, particularly the long-term effects of land-use changes on GHG emissions. Developing region-specific models that account for market dynamics, technological advancements, policy changes, and population demands could yield more precise insights into sustainable agricultural practices. Given the complexity of farming systems in Northeast China, which are influenced by market conditions, policies, technological progress, and climate change, future research should adopt a holistic approach to enhance the scientific rigour and feasibility of policy recommendations.
6. Conclusions
This study conducts an in-depth analysis of how to balance crop production and GHG emissions in the three northeastern provinces of China, examining the impact of various crop production layouts on GHG emissions. Specific strategies for optimising agricultural production layouts are proposed to achieve emission reduction and food security. The findings indicate that optimising the agrarian production structure reduces GHG emissions and enhances agricultural production efficiency to a certain extent, enabling stable growth in grain yield.
The study projects crop production and GHG emissions for the three northeastern provinces in 2030 under three scenarios. In the scenario of BU, which maintains the current production layout, grain yield shows a moderate increase. However, GHG emissions decrease by only about 8.8%, highlighting the limited potential for ecological benefits under traditional models. The scenario of SO achieves a 22.0% reduction in GHG emissions through optimised crop structure while maintaining total sowing area and grain yield, which underscores the emission reduction potential of structural optimisation. The scenario of EP further adjusts the production structure by reducing the cultivation of high-emission crops, like rice and tuber, and increasing the proportion of low-emission crops, like corn, resulting in a 25.2% reduction in GHG emissions. This scenario also projects an 11.2% reduction in overall cultivated area, achieving more intensive land use.
In summary, rational adjustments to agricultural layout and optimisation of crop structure are effective pathways for balancing food security with emission reductions. To achieve carbon neutrality, Northeast China, as a significant crop-producing region, should further explore agricultural technology innovation, enhance resource use efficiency, and adjust crop layouts to drive a low-carbon transition in agriculture.
Author Contributions
Conceptualization, Z.G. and C.W.; methodology, Z.G. and J.X.; data curation, Z.G.; writing—original draft preparation, Z.G.; writing—review and editing, Z.G., J.X., H.H. and C.W.; project administration, C.W. All authors have read and agreed to the published version of the manuscript.
Funding
This research was supported by the research funds the Joint Project of Agricultural Basic Research of Yunnan Province in China (No. 202401BD070001-063).
Data Availability Statement
The original contributions presented in the study are included in the article, further inquiries can be directed to the corresponding author.
Conflicts of Interest
The authors declare no conflict of interest.
Appendix A. Emission Factors for GHG Emissions
| Agricultural Activity | Value | Unit | ||
| Direct emissions | Crop Stover Burning | Yield Stover Ratio Rice | 0.98 | / |
| Yield Stover Ratio Wheat | 1.43 | / | ||
| Yield Stover Ratio Corn | 1.66 | / | ||
| Yield Stover Ratio Soybean | 1.40 | / | ||
| Yield Stover Ratio Tuber | 0.70 | / | ||
| Heilongjiang burning ratio | 0.21 | / | ||
| Jilin burning ratio | 0.21 | / | ||
| Liaoning burning ratio | 0.16 | / | ||
| Emission factor of Crop residue open burning | 3.23 0.008 | g CH4/kg g N2O/kg | ||
| Rice cultivation | growth period | 130 | day | |
| Emission factor | 2 | mg CH4/(m2 × h) | ||
| Cropland emission | Emission factor | 0.01 | kg N2O-N/kg N | |
| Indirect emissions | Nitrogen fertiliser | Emission factor | 1.53 | kg CO2/kg |
| Phosphate fertiliser | Emission factor | 1.63 | kg CO2/kg | |
| Potassic fertiliser | Emission factor | 0.66 | kg CO2/kg | |
| Pesticide | Emission factor | 16.35 | kg CO2/kg | |
| Electricity | Emission factor | 0.85 | kg CO2/KWh | |
| Machinery use | Emission factor | 0.18 | kg/kW | |
| Agricultural film | Emission factor | 5.18 | kg/kg | |
References
- Pachauri, R.K.; Reisinger, A. Climate Change 2007: Synthesis Report. Contribution of Working Groups I, II and III to the Fourth Assessment Report of the Intergovernmental Panel on Climate Change; IPCC: Geneva, Switzerland, 2007. [Google Scholar]
- Foley, J.A.; DeFries, R.; Asner, G.P.; Barford, C.; Bonan, G.; Carpenter, S.R.; Chapin, F.S.; Coe, M.T.; Daily, G.C.; Gibbs, H.K. Global consequences of land use. Science 2005, 309, 570–574. [Google Scholar] [CrossRef]
- Ray, D.K.; Sloat, L.L.; Garcia, A.S.; Davis, K.F.; Ali, T.; Xie, W. Crop harvests for direct food use insufficient to meet the UN’s food security goal. Nat. Food 2022, 3, 367–374. [Google Scholar] [CrossRef] [PubMed]
- Zhang, D.; Shen, J.; Zhang, F.; Li, Y.; Zhang, W. Carbon footprint of grain production in China. Sci. Rep. 2017, 7, 4126. [Google Scholar] [CrossRef]
- Liang, D.; Lu, X.; Zhuang, M.; Shi, G.; Hu, C.; Wang, S.; Hao, J. China’s greenhouse gas emissions for cropping systems from 1978–2016. Sci. Data 2021, 8, 171. [Google Scholar] [CrossRef]
- Bennetzen, E.H.; Smith, P.; Porter, J.R. Decoupling of greenhouse gas emissions from global agricultural production: 1970–2050. Glob. Change Biol. 2016, 22, 763–781. [Google Scholar] [CrossRef] [PubMed]
- Batoukhteh, F.; Darzi-Naftchali, A. A global study on decoupling greenhouse gas emissions from agricultural development. Environ. Dev. Sustain. 2024, 26, 13159–13183. [Google Scholar] [CrossRef]
- Shahmohamadloo, R.S.; Febria, C.M.; Fraser, E.D.; Sibley, P.K. The sustainable agriculture imperative: A perspective on the need for an agrosystem approach to meet the United Nations Sustainable Development Goals by 2030. Integr. Environ. Assess. Manag. 2022, 18, 1199–1205. [Google Scholar] [CrossRef]
- IPCC. Climate Change 2014: Mitigation of Climate Change. Contribution of Working Group III to the Fifth Assessment Report of the Intergovernmental Panel on Climate Change; Cambridge University Press: Cambridge, UK, 2014; Volume 1454, p. 147. [Google Scholar]
- Beach, R.H.; Creason, J.; Ohrel, S.B.; Ragnauth, S.; Ogle, S.; Li, C.; Ingraham, P.; Salas, W. Global mitigation potential and costs of reducing agricultural non-CO2 greenhouse gas emissions through 2030. J. Integr. Environ. Sci. 2015, 12, 87–105. [Google Scholar] [CrossRef]
- Guo, H.; Xie, S.; Pan, C. The impact of planting industry structural changes on carbon emissions in the three northeast provinces of China. Int. J. Environ. Res. Public Health 2021, 18, 705. [Google Scholar] [CrossRef] [PubMed]
- Menegat, S.; Ledo, A.; Tirado, R. Greenhouse gas emissions from global production and use of nitrogen synthetic fertilisers in agriculture. Sci. Rep. 2022, 12, 14490. [Google Scholar]
- Verge, X.; De Kimpe, C.; Desjardins, R. Agricultural production, greenhouse gas emissions and mitigation potential. Agric. For. Meteorol. 2007, 142, 255–269. [Google Scholar] [CrossRef]
- Han, G.; Xu, J.; Zhang, X.; Pan, X. Efficiency and driving factors of Agricultural Carbon emissions: A study in Chinese state farms. Agriculture 2024, 14, 1454. [Google Scholar] [CrossRef]
- Xiong, C.; Yang, D.; Huo, J. Spatial-temporal characteristics and LMDI-based impact factor decomposition of agricultural carbon emissions in Hotan Prefecture, China. Sustainability 2016, 8, 262. [Google Scholar] [CrossRef]
- Xiong, C.; Yang, D.; Xia, F.; Huo, J. Changes in agricultural carbon emissions and factors that influence agricultural carbon emissions based on different stages in Xinjiang, China. Sci. Rep. 2016, 6, 36912. [Google Scholar] [CrossRef]
- Gong, H.; Meng, D.; Li, X.; Zhu, F. Soil degradation and food security coupled with global climate change in northeastern China. Chin. Geogr. Sci. 2013, 23, 562–573. [Google Scholar] [CrossRef]
- Fan, J.; Guo, D.; Han, L.; Liu, C.; Zhang, C.; Xie, J.; Niu, J.; Yin, L. Spatiotemporal dynamics of carbon footprint of main crop production in China. Int. J. Environ. Res. Public Health 2022, 19, 13896. [Google Scholar] [CrossRef] [PubMed]
- Wang, X.; Li, S.; Wang, L.; Zheng, M.; Wang, Z.; Song, K. Effects of cropland reclamation on soil organic carbon in China’s black soil region over the past 35 years. Glob. Change Biol. 2023, 29, 5460–5477. [Google Scholar] [CrossRef] [PubMed]
- IFPRI/IIASA. Global Spatially-Disaggregated Crop Production Statistics Data for 2005 Version 3.1; International Food Policy Research Institute and International Institute for Applied Systems Analysis: Washington, DC, USA, 2017. [Google Scholar] [CrossRef]
- Liu, M.; Guo, Y.; Zhang, X.; Shen, Y.-J.; Zhang, Y.; Pei, H.; Min, L.; Wang, S.; Shen, Y. China’s Black Soil Granary is increasingly facing extreme hydrological drought threats. Sci. Bull. 2023, 68, 481–484. [Google Scholar] [CrossRef]
- Li, Z.; Liu, Z.; Anderson, W.; Yang, P.; Wu, W.; Tang, H.; You, L. Chinese rice production area adaptations to climate changes, 1949–2010. Environ. Sci. Technol. 2015, 49, 2032–2037. [Google Scholar] [CrossRef] [PubMed]
- Li, H.; Yao, Y.; Zhang, X.; Zhu, H.; Wei, X. Changes in soil physical and hydraulic properties following the conversion of forest to cropland in the black soil region of Northeast China. Catena 2021, 198, 104986. [Google Scholar] [CrossRef]
- Zhao, Z.; Deng, X.; Zhang, F.; Li, Z.; Shi, W.; Sun, Z.; Zhang, X. Scenario analysis of livestock carrying capacity risk in farmland from the perspective of planting and breeding balance in northeast China. Land 2022, 11, 362. [Google Scholar] [CrossRef]
- Wang, W.; Deng, X.; Yue, H. Black soil conservation will boost China’s grain supply and reduce agricultural greenhouse gas emissions in the future. Environ. Impact Assess. Rev. 2024, 106, 107482. [Google Scholar] [CrossRef]
- Chen, J.-S.; Li, H.-R.; Tian, Y.-G.; Deng, P.-P.; Oladele, O.P.; Bai, W.; Dang, Y.P.; Zhao, X.; Zhang, H.-L. Greenhouse gas emissions and mitigation potential of crop production in Northeast China. Eur. J. Agron. 2024, 161, 127371. [Google Scholar] [CrossRef]
- Ahmad, S.F.; Dar, A.H. Precision farming for resource use efficiency. In Resources Use Efficiency in Agriculture; Springer: Singapore, 2020; pp. 109–135. [Google Scholar] [CrossRef]
- Khan, S.N.; Li, D.; Maimaitijiang, M. A geographically weighted random forest approach to predict corn yield in the US corn belt. Remote Sens. 2022, 14, 2843. [Google Scholar] [CrossRef]
- Li, B.; Liu, Z.; Huang, F.; Yang, X.; Liu, Z.; Wan, W.; Wang, J.; Xu, Y.; Li, Z.; Ren, T. Ensuring national food security by strengthening high-productivity black soil granary in Northeast China. Bull. Chin. Acad. Sci. (Chin. Version) 2021, 36, 1184–1193. [Google Scholar]
- Yang, X.; Lin, E.; Ma, S.; Ju, H.; Guo, L.; Xiong, W.; Li, Y.; Xu, Y. Adaptation of agriculture to warming in Northeast China. Clim. Chang. 2007, 84, 45–58. [Google Scholar] [CrossRef]
- Gu, Z.; Xie, Y.; Gao, Y.; Ren, X.; Cheng, C.; Wang, S. Quantitative assessment of soil productivity and predicted impacts of water erosion in the black soil region of northeastern China. Sci. Total Environ. 2018, 637, 706–716. [Google Scholar] [CrossRef] [PubMed]
- Xuan, F.; Dong, Y.; Li, J.; Li, X.; Su, W.; Huang, X.; Huang, J.; Xie, Z.; Li, Z.; Liu, H. Mapping crop type in Northeast China during 2013–2021 using automatic sampling and tile-based image classification. Int. J. Appl. Earth Obs. Geoinf. 2023, 117, 103178. [Google Scholar] [CrossRef]
- Yan, X.; Cai, Z.; Ohara, T.; Akimoto, H. Methane emission from rice fields in mainland China: Amount and seasonal and spatial distribution. J. Geophys. Res. Atmos. 2003, 108, 4505. [Google Scholar] [CrossRef]
- Lal, R. Carbon emission from farm operations. Environ. Int. 2004, 30, 981–990. [Google Scholar] [CrossRef]
- Lu, B.; Kong, S.-F.; Han, B.; Wang, X.-Y.; Bai, Z.-P. Inventory of atmospheric pollutants discharged from biomass burning in China continent in 2007. China Environ. Sci. 2011, 31, 186–194. [Google Scholar]
- Eggleston, H.; Buendia, L.; Miwa, K.; Ngara, T.; Tanabe, K. 2006 IPCC Guidelines for National Greenhouse Gas Inventories. 2006. Available online: https://www.osti.gov/etdeweb/biblio/20880391 (accessed on 1 December 2024).
- Song, Z.; Zhu, P.; Gao, H.; Peng, C.; Deng, A.; Zheng, C.; Mannaf, M.; Islam, M.; Zhang, W. Effects of long-term fertilization on soil organic carbon content and aggregate composition under continuous maize cropping in Northeast China. J. Agric. Sci. 2015, 153, 236–244. [Google Scholar] [CrossRef]
- Velicer, W.F.; Fava, J.L. Time series analysis. Res. Methods Psychol. 2003, 2, 628–660. [Google Scholar]
- Momin, B.; Chavan, G. Univariate time series models for forecasting stationary and non-stationary data: A brief review. In Proceedings of the Information and Communication Technology for Intelligent Systems (ICTIS 2017), Ahmedabad, India, 25–26 March 2017; Volume 2, pp. 219–226. [Google Scholar]
- Sirisha, U.M.; Belavagi, M.C.; Attigeri, G. Profit prediction using ARIMA, SARIMA and LSTM models in time series forecasting: A comparison. IEEE Access 2022, 10, 124715–124727. [Google Scholar] [CrossRef]
- Qian, H.; Zhu, X.; Huang, S.; Linquist, B.; Kuzyakov, Y.; Wassmann, R.; Minamikawa, K.; Martinez-Eixarch, M.; Yan, X.; Zhou, F. Greenhouse gas emissions and mitigation in rice agriculture. Nat. Rev. Earth Environ. 2023, 4, 716–732. [Google Scholar] [CrossRef]
- Chen, M.; Cui, Y.; Jiang, S.; Forsell, N. Toward carbon neutrality before 2060: Trajectory and technical mitigation potential of non-CO2 greenhouse gas emissions from Chinese agriculture. J. Clean. Prod. 2022, 368, 133186. [Google Scholar] [CrossRef]
- Du, Y.; Liu, H.; Huang, H.; Li, X. The carbon emission reduction effect of agricultural policy—Evidence from China. J. Clean. Prod. 2023, 406, 137005. [Google Scholar] [CrossRef]
Disclaimer/Publisher’s Note: The statements, opinions and data contained in all publications are solely those of the individual author(s) and contributor(s) and not of MDPI and/or the editor(s). MDPI and/or the editor(s) disclaim responsibility for any injury to people or property resulting from any ideas, methods, instructions or products referred to in the content. |
© 2025 by the authors. Licensee MDPI, Basel, Switzerland. This article is an open access article distributed under the terms and conditions of the Creative Commons Attribution (CC BY) license (https://creativecommons.org/licenses/by/4.0/).