Article

Spatiotemporal Evolution and Influencing Factors of Carbon Footprint in Yangtze River Economic Belt

1
School of Public Policy and Management, China University of Mining and Technology, Xuzhou 221116, China
2
Research Center for Transition Development and Rural Revitalization of Resource-Based Cities in China, China University of Mining and Technology, Xuzhou 221116, China
*
Author to whom correspondence should be addressed.
Land 2025, 14(3), 641; https://doi.org/10.3390/land14030641
Submission received: 21 February 2025 / Revised: 12 March 2025 / Accepted: 17 March 2025 / Published: 18 March 2025
(This article belongs to the Special Issue Global Commons Governance and Sustainable Land Use)

Abstract

:
As an important engine of China’s development, the Yangtze River Economic Belt faces the dual contradiction of economic growth and ecological protection. Addressing the insufficient analysis of the spatiotemporal evolution and driving mechanisms of city-level carbon footprints, this study delves into the concept of carbon footprint from the perspective of ecological footprint theory and carbon cycle dynamics. Using ODIAC and NPP data, it systematically evaluates carbon footprints across 130 cities and examines their spatiotemporal evolution and driving factors using kernel density estimation and the Kaya-LMDI model. The results show (1) a significant growth trend in carbon footprint, with rapid expansion from 2000 to 2012, followed by fluctuating growth from 2012 to 2022; (2) a west-to-east “low–high” spatial pattern, where disparities have narrowed but absolute gaps continue to widen, leading to polarization; and (3) economic growth and urban expansion as the primary drivers of carbon footprint growth, while ecological land use pressure and carbon sequestration capacity played a major role in mitigation, with the impact of carbon sequestration foundations remaining limited. This study conducts precise regional carbon sink accounting and offers a new perspective on the quantitative analysis of carbon footprint drivers. The findings provide insights for low-carbon governance and sustainable urban development in the Yangtze River Economic Belt.

1. Introduction

Since the Industrial Revolution, the widespread use of fossil fuels, such as coal and oil, has driven rapid societal and economic development; however, it has also led to severe environmental challenges. According to the CO2 Emissions in 2023, published by the International Energy Agency, global energy-related CO2 emissions rose by 1.1% year-on-year, an increase of 410 million tons, reaching a record high of 37.4 billion tons, with emissions from coal accounting for over 65% of this rise [1]. Terrestrial ecosystems, which play a crucial role in the global carbon cycle, absorb 31% of the total greenhouse gases emitted by human activities during the same period [2], acting as a key carbon sink for atmospheric carbon dioxide [3]. However, the intensification of human activities, land use changes, deforestation, and ecological degradation have weakened the carbon sink function of some terrestrial ecosystems, even causing them to switch from carbon sinks to sources. This shift has resulted in a rapid increase in CO2 emissions, further exacerbating the global climate crisis [4]. The ongoing intensification of climate warming will give rise to a range of social and ecological problems, including food crises, extreme weather events, and urban diseases, which will seriously threaten human survival and development [5,6,7]. Therefore, from the perspective of carbon sources and sinks, regional carbon footprint analysis, research on influencing factors, and the formulation of targeted policies and measures play a critical role in supporting regional green transformation and low-carbon development.
The concept of the carbon footprint is one of the key extensions of the ecological footprint [8,9,10]. Currently, there are two main definitions of the carbon footprint in both domestic and international academic circles. One definition, based on the life cycle perspective, views the carbon footprint as the total direct and indirect CO2 emissions generated by human activities or products throughout their entire life cycle, with the measurement standard being the “total carbon amount” [11]. From this viewpoint, commonly used calculation methods include life cycle assessment, which is widely applied in fields such as construction, agriculture, and industry, and is suitable for small-to-medium-scale studies of products and sectors [12]. The calculation process is detailed and precise, allowing for a granular estimation of carbon emissions from individual activities. It breaks away from the traditional notion that “pollution only comes from visible sources like smokestacks” and accurately reflects carbon emissions across the entire production chain. However, the definition of system boundaries—such as temporal scope, geographical coverage, and production stages—often involves a degree of subjectivity [13]. Additionally, input–output analysis and its derivative methods are frequently used in large-scale studies of countries, regions, industries, and households [14], as they can track cross-sectoral and cross-regional carbon emission flows at the macro level [15]. However, it mainly reflects average emissions at the macro level, making it difficult to capture product-level details, while input–output data availability and timeliness remain uncertain. The second definition, derived from the ecological footprint perspective, defines the carbon footprint as the biologically productive land area required to absorb the carbon dioxide emitted from fossil fuel combustion, with the unit of measurement being the “total carbon absorption area” [16,17]. From this perspective, the carbon footprint focuses on the balance between carbon sources and sinks and explores their dynamic relationship within the natural cycle. Research in this area employs carbon sequestration methods and improved models based on net primary productivity (NPP) and net ecosystem productivity (NEP) to investigate the dynamic interactions between these two key elements of carbon sources and sinks [18,19].
Building on existing research on carbon footprints, the academic community has expanded its focus to explore the key factors influencing regional carbon footprint changes and their underlying mechanisms. In terms of selecting influencing factors, models such as the IPAT model, the STIRPAT model, and the Kaya identity have proven effective in identifying the deep-level factors driving carbon emissions changes. These models are highly extensible and flexible, making them important tools for studying the factors affecting carbon footprints in recent years [20,21]. In terms of mechanisms, methods such as factor decomposition, decoupling models, system dynamics models, and econometric models are commonly employed [22,23]. By systematically identifying the factors influencing carbon footprints, studies of their mechanisms can reveal the inherent laws and underlying logic of carbon footprint dynamics.
Although carbon footprint research has made significant progress, current studies still exhibit three major limitations. First, carbon sink accounting often neglects soil respiration or relies excessively on a single coefficient (e.g., global average NPP or NEP values), thus undermining the scientific rigor and accuracy of the results [24]. Second, most existing studies focus on the national or provincial scale, lacking exploration at finer spatial resolutions. Finally, the majority of research remains rooted in a life-cycle perspective, paying insufficient attention to the interactions of carbon cycling within the human–land system. In response, this study makes several improvements: (1) an improved net ecosystem productivity (NEP) model is employed to calculate regional carbon sinks, fully accounting for ecological heterogeneity and soil respiration activities, thus providing more accurate carbon sink accounting; (2) the mechanisms underlying carbon footprint formation are examined in greater depth, systematically decomposing and quantitatively analyzing the main influencing factors; and (3) from an ecological footprint perspective, carbon emissions and carbon sinks are quantified based on the carbon cycle, and further used to measure the urban carbon footprint in the study area, while also evaluating spatial effects and regional differences. These enhancements not only improve the precision of the research findings, but also provide a systematic understanding of the dynamic evolution and driving factors of carbon footprints, thereby offering robust scientific support for formulating targeted low-carbon policies and sustainable urban development strategies in the Yangtze River Economic Belt.

2. Materials and Methods
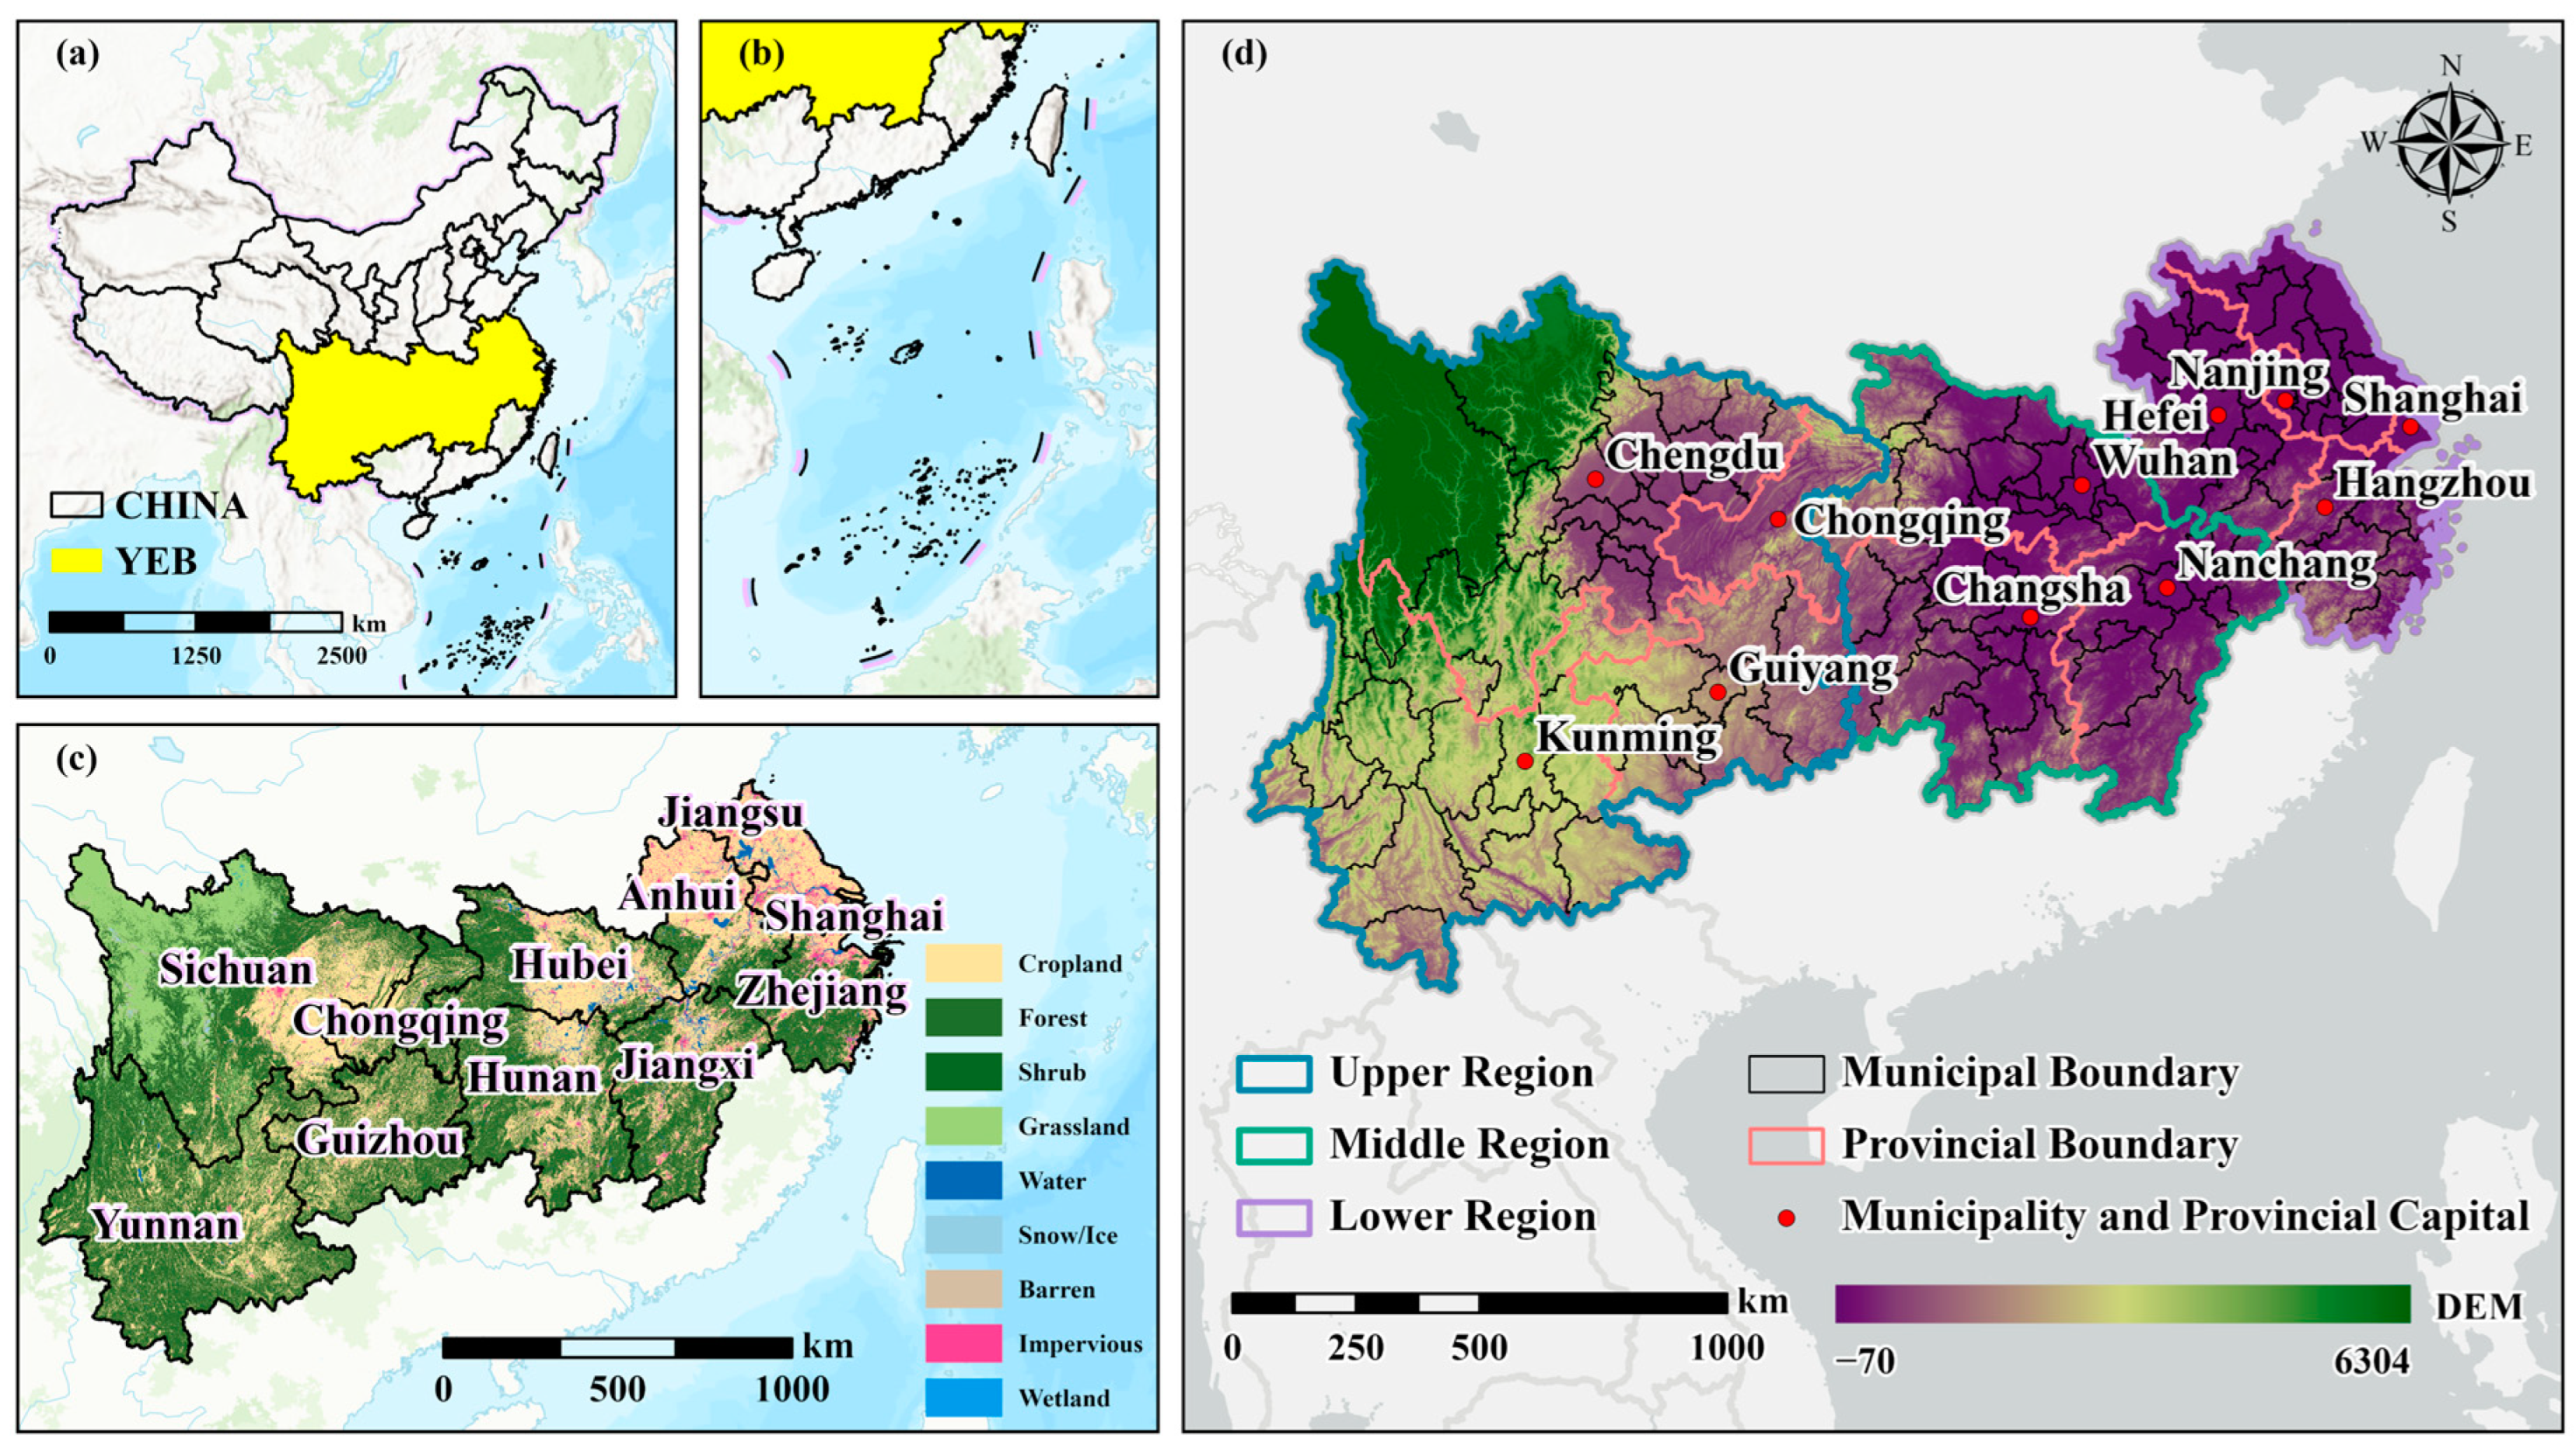
2.1. Study Area

The Yangtze River Economic Belt (YEB) spans the eastern, central, and western regions of China, covering 11 provinces and municipalities (Figure 1). The region is divided into three parts: the upper region, the middle region, and the lower region. The lower region includes Shanghai (SH), Jiangsu (JS), Zhejiang (ZJ), and Anhui (AH); the middle region comprises Jiangxi (JX), Hubei (HB), and Hunan (HN); and the upper region consists of Chongqing (CQ), Sichuan (SC), Guizhou (GZ), and Yunnan (YN). Carrying more than 600 million people and contributing about 45% of China’s GDP, the Yangtze River Economic Belt is a strategic core area that serves as both an economic growth pole and an ecological barrier [25,26]. At the same time, it has a forest coverage rate of 44.93%, contributes 43.2% of the national carbon sink, and maintains the ecological security of the Yangtze River basin [27]. Thus, the geographical, economic, and ecological significance of the YEB positions it as a crucial region for ecological environmental protection and sustainable development in China, making it a representative area for conducting carbon footprint research.
This study utilizes multiple data sources. Carbon emission data are obtained from ODIAC (Open-source Data Inventory for Anthropogenic CO2), which offers high-resolution global carbon emission estimate raster data. The land use data are derived from the China Land Cover Dataset (CLCD) [28]. NPP data are provided by MODIS (Moderate Resolution Imaging Spectroradiometer), specifically the MOD17A3HGF v061 version. Population data, energy consumption data, and built-up area data, along with other socio-economic data, are sourced from the China City Statistical Yearbook and the China Energy Statistical Yearbook. To maintain data consistency and ensure high accuracy, the NPP and CLCD data were resampled to a 30 m resolution prior to analysis, aligning with the spatial analysis requirements. All data cover the study period from 2000 to 2022.

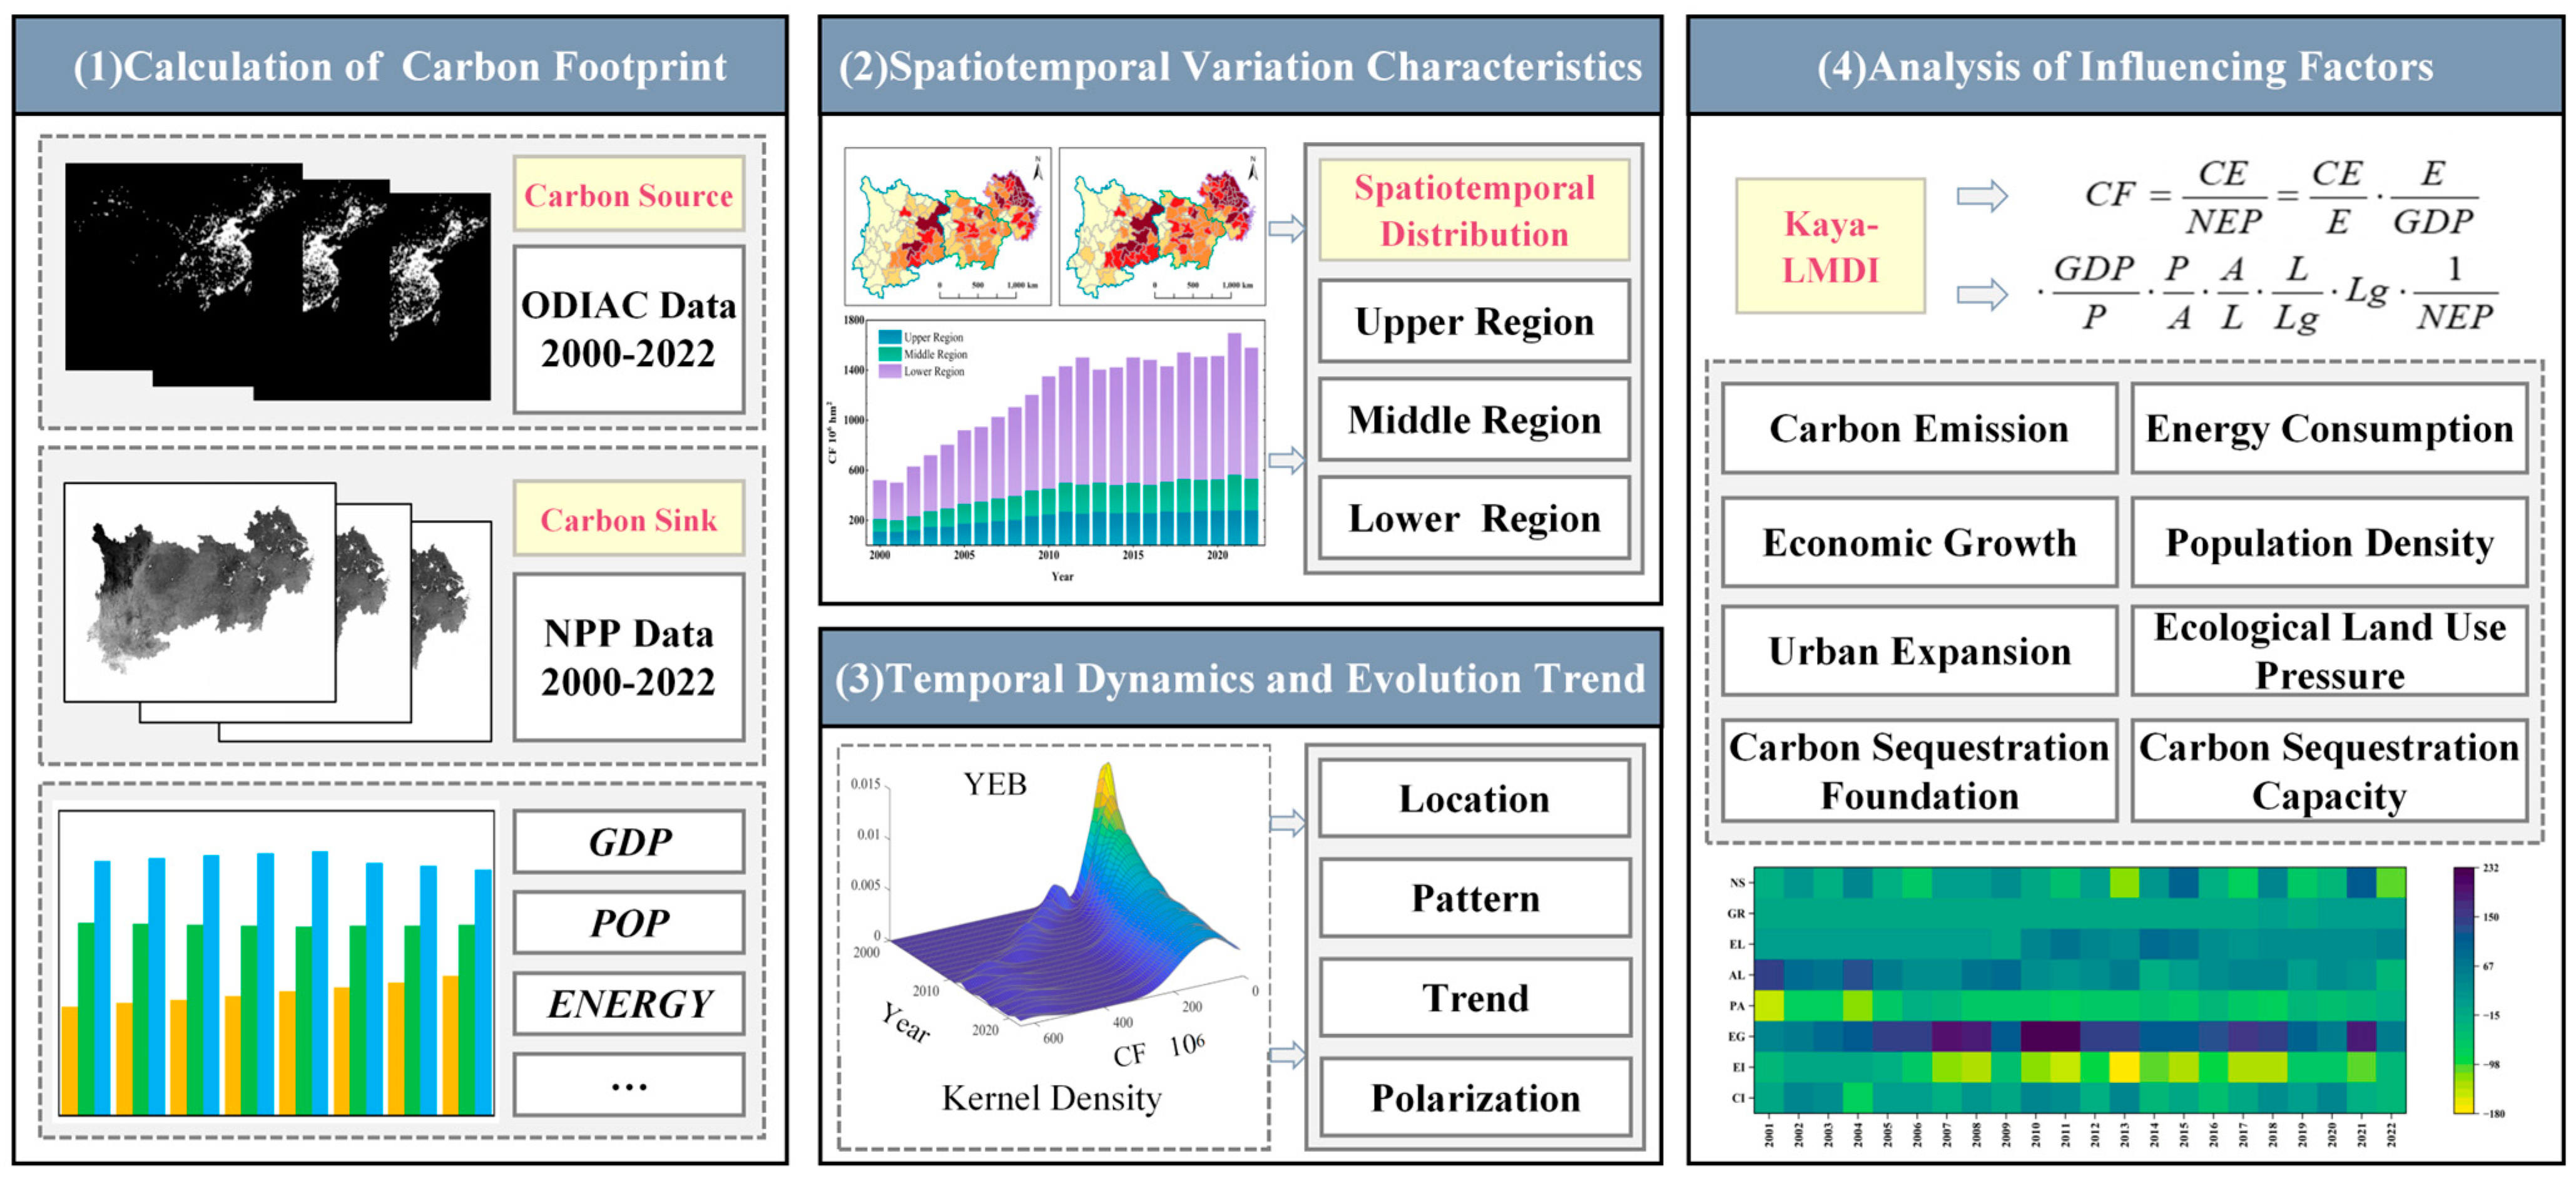
2.2. Conceptual Relationships and Research Framework

In the context of global climate change, carbon sources and carbon sinks are opposing concepts, and their interaction and mechanisms together constitute the flow of carbon on Earth, known as the carbon cycle [29,30] (Figure 2). A carbon source encompasses activities or mechanisms that contribute to the release of greenhouse gases, such as carbon dioxide, into the atmosphere, including industrial processes, transportation, agricultural practices, and energy production. This is currently manifested as a byproduct of economic development and a significant driver of global warming [31]. The expansion of human activities, such as urbanization, coupled with the large-scale burning of fossil fuels, results in substantial greenhouse gas emissions, contributing to the ongoing rise in global temperatures. In contrast, a carbon sink refers to the process, activity, or mechanism by which vegetation, soil, and oceans absorb greenhouse gases from the atmosphere, performing vital functions such as stabilizing ecosystems, regulating the climate, and sequestering carbon dioxide [32]. Vegetation, water bodies, and soil in the natural system all possess some carbon sequestration capacity; however, the carbon sequestration potential varies across different land types and vegetation, influenced by geographical and environmental conditions. Carbon sinks play a crucial role in mitigating global warming and maintaining the carbon balance. In recent years, ecological protection activities have gradually become an important factor influencing carbon sink capacity [33]. The interaction between carbon sources and carbon sinks forms a dynamic carbon cycle, which dictates the trajectory of global climate change and the stability of ecosystems.
This paper constructs a multi-level research framework from the perspective of carbon sources and carbon sinks, as illustrated in Figure 3. (1) The city-scale carbon footprint is calculated using ODIAC carbon source data and NPP data from 2000 to 2022. (2) The temporal and spatial characteristics of the carbon footprint are analyzed based on the changing trends in the upper, middle, and lower reaches of the Yangtze River Economic Belt. (3) A three-dimensional kernel density estimation method is employed to examine the dynamic and evolving characteristics of the carbon footprint distribution across the entire Yangtze River Economic Belt, as well as its upper, middle, and lower regions, focusing on distribution location, distribution form, distribution trends, and polarization phenomena. (4) Finally, the Kaya-LMDI model is used to decompose and analyze the main driving factors affecting the carbon footprint.

2.3. Methods

2.3.1. Carbon Emission Estimation

The ODIAC platform, based on fossil fuel carbon emission data provided by CDIAC (Carbon Dioxide Information and Analysis Center), employs an innovative emission modeling approach that integrates DMSP/OLS data, power station emission intensity, and geographical location data. It leads the way in estimating the high-resolution spatial distribution of fossil fuel CO2 emissions on a global scale. The platform provides global carbon emission data at a resolution of 1 km × 1 km, offering robust support for academic research and related fields [34,35]. In summary, although the ODIAC database has some data biases in spatial allocation, particularly in developing countries, it offers higher resolution and more timely data updates, representing a significant improvement over traditional energy statistics. Leveraging these data, this study conducts a detailed carbon emission analysis across regional and temporal dimensions to assess fossil fuel combustion emissions in different geographical areas [36].
C E = M i
In this formula, CE represents the total regional carbon emission (t) and Mi represents the monthly carbon emission data.

2.3.2. Carbon Sink Estimation

(1)
NEP calculation of different land use types
Net primary productivity (NPP) measures the amount of carbon fixed by vegetation through photosynthesis, serving as a fundamental parameter for evaluating an ecosystem’s carbon sequestration capacity. Building on that, net ecosystem productivity (NEP) further accounts for soil microbial respiration within the ecosystem, thus providing a more accurate estimate of net carbon sequestration. The band extraction and image mosaicking were completed using HEG v 2.15. The CLCD and NPP raster data were processed on the ArcGIS Pro 3.1 platform for projection transformation, spatial clipping, resampling, and zonal statistics. This resulted in NPP outcomes for different land use types across cities in the Yangtze River Economic Belt. Furthermore, the carbon sequestration of various land use types was calculated based on the conversion coefficient between NEP and NPP, as follows:
N E P i = α i × N P P i
In this formula, NEPi is the net ecosystem productivity of the ith land use type (t⋅C/hm2/year); α is the NEP and NPP conversion coefficient of the ith land use type (Table 1); and NPPi is the net primary productivity of the ith land use type (t⋅C/hm2/year). The conversion coefficient is referenced from the Technical Guideline on Gross Ecosystem Product (GEP) (version 1.0) published by the Research Center for Eco-Environmental Sciences and Chinese Academy of Environmental Planning. The conversion coefficient for cultivated land is sourced from the IUEMS (Intelligent Urban Ecosystem Management System, https://www.iuems.com/eco/index.html, accessed on 18 January 2025), specifically from the Carbon Sequestration Oxygen Release Module [37,38].
(2)
Carbon Sequestration Estimation.
After obtaining the NEP of different land use types, the carbon sequestration (carbon sink) for each type can be calculated as follows:
C S i = M C O 2 M C × N E P i
In this formula, CSi denotes the carbon sequestration of the ith land use type, expressed in units of tCO2/year; M C O 2 M C represents the mass ratio of carbon dioxide to carbon, with a value of 44/12.

2.3.3. Carbon Footprint

Based on the definition of carbon footprint from the perspective of ecological footprint, and based on the above carbon emission and NEP calculation results, this study constructs the carbon footprint calculation formula based on the carbon source and carbon sink, which is as follows [39,40]:
C F = C E × i = 1 n P i N E P i
In this formula, CF represents the regional carbon footprint, reflecting the demand for ecosystem resources caused by carbon emissions within the region, expressed in units of hm2; Pi represents the carbon sequestration proportion of the ith land use type, expressed as the area proportion of each land use type; and NEPi denotes the net ecosystem productivity of the ith land use type.

2.3.4. Kernel Density Estimation

Kernel density estimation is a non-parametric statistical method that can directly estimate the probability distribution of random variables based on a given data sample and reveal the estimation of the probability density of random variables [41,42,43]. Based on the carbon footprint calculation results of the YEB, this study uses Gaussian kernel function and the Matlab R2024b platform to calculate the kernel density and determine the dynamic evolution characteristics of regional carbon footprint distribution. The expression is as follows:
f x = 1 N h i = 1 N K C F i C F ¯ h
K x = 1 2 π exp x 2 2
Formulas (5) and (6) are the calculation formula of nuclear density, where CFi represents the carbon footprint of different cities; f(x) stands for nuclear density; N indicates the number of cities; h stands for bandwidth; C F ¯ represents the average carbon footprint; and K(x) stands for Gaussian kernel function.

2.3.5. Kaya-LMDI Model

The Kaya identity can explore the underlying factors driving changes in carbon emissions and offers good extensibility and flexibility [44,45]. The LMDI model, on the other hand, can handle zero and negative values, avoid unexplained residuals during the decomposition process, improve analytical accuracy, and is highly applicable [5]. The Kaya-LMDI model is adopted because it can systematically and flexibly decompose the driving forces of the carbon footprint while providing a comprehensive quantitative analysis. Based on the regional characteristics of the YEB and the concept of carbon footprint from the perspective of ecological footprint, this paper enhances the Kaya identity by incorporating factors such as built-up area and land area. The improved Kaya identity is as follows:
C F = C E N E P = C E E E G D P G D P P P A A L L L g L g 1 N E P
In the formula, CF represents the carbon footprint, CE represents total carbon emissions, NEP represents net ecosystem productivity, E represents total energy consumption, GDP represents the gross domestic product, P represents the total population, A represents the built-up area, L represents the total land area, and Lg represents the green land area.
The LMDI model’s additive form is used to decompose the factors contributing to the comprehensive effect of carbon footprint ΔCF, as shown in the following equation:
Δ C F = C F t C F 0 = Δ C I + Δ E I + Δ E G + Δ P A + Δ A L + Δ E L + Δ G R + Δ N S
In the formula, t and 0 represent the end and base period of the study period, respectively. Δ C I = C E E represents carbon emission intensity (CI); Δ E I = E G D P represents energy consumption intensity (EI); Δ E G = G D P P represents economic growth (EG); Δ P A = P A represents population density (PA); Δ A L = A L represents urban expansion (AL); Δ E L = L L g represents ecological land use pressure (EL); Δ G R = L g represents carbon sequestration foundation (GR); Δ N S = 1 N E P represents carbon sequestration capacity (NS).
Δ X = C F t C F 0 ln C F t ln C F t l n X t X 0 , X { C I , E I , E G , P A , A L , E L , G R , N S }
R X = Δ X Δ C F × 100 %
For the calculation of the contribution value and contribution rate of each factor, X represents one of the influencing factors and R represents the contribution rate of the influencing factors.

3. Results

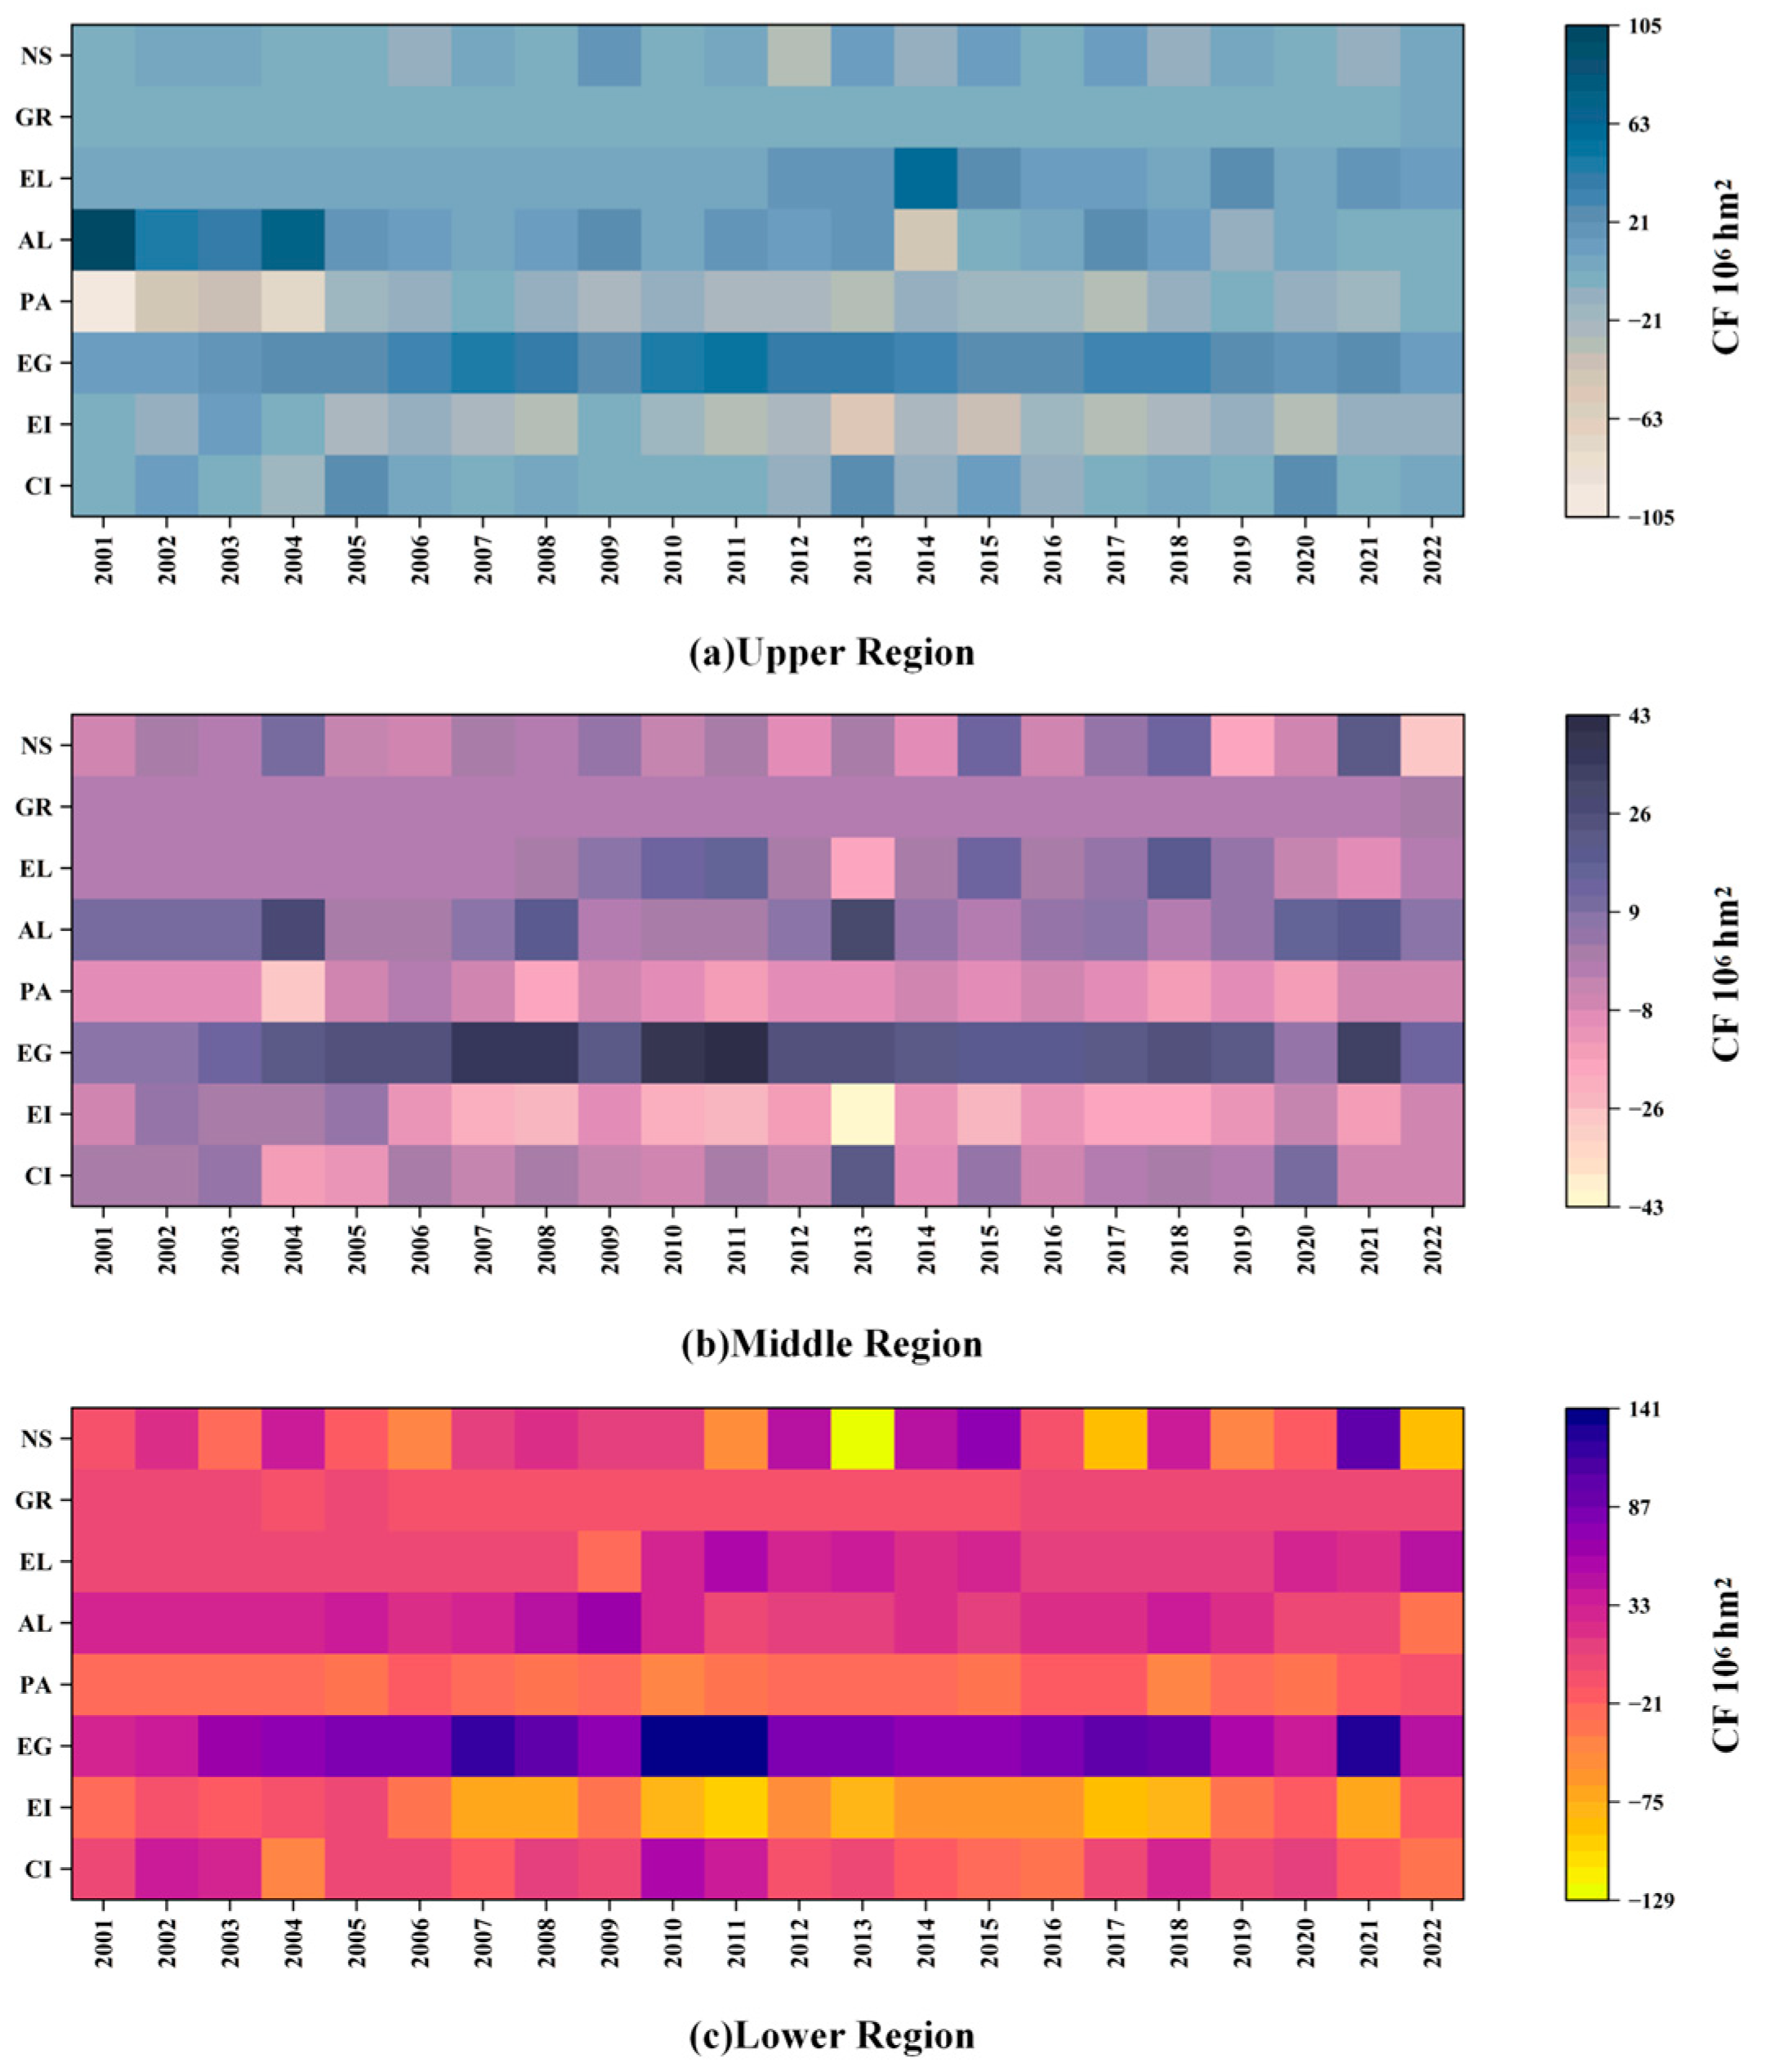
3.1. Spatiotemporal Variation Characteristics

To visually demonstrate the spatiotemporal variation characteristics of the carbon footprint in the 130 cities of the YEB, this study selected four key time nodes: 2005, 2010, 2015, and 2022. The carbon footprint results were divided into intervals using the quintile method. The division includes five levels: Low-Carbon-Footprint Area (Low), Low–Middle-Carbon-Footprint Area (Low–Mid), Moderate-Carbon-Footprint Area (Moderate), Middle–High-Carbon-Footprint Area (Mid–High), and High-Carbon-Footprint Area (High). Figure 4 shows the spatial distribution of carbon footprints in the YEB at different time points.
From 2000 to 2022, the total carbon footprint of the YEB showed an overall upward trend, which can roughly be divided into two stages based on the carbon footprint calculation results (Figure 4e). From 2000 to 2012, there was a rapid growth phase, with a significant increase in carbon footprint, rising from 520.98 × 10⁶ hm2 to 1501.79 × 106 hm2, a growth rate of 187.7%. Notably, the growth rates in 2002 (25.71%) and 2010 (12.34%) were the most significant. The sharp increase in carbon footprint in 2002 might be closely related to the rapid economic expansion, accelerated industrialization, and increased energy demand. The carbon footprint in 2010 was likely influenced by the global economic recovery, resulting in a high growth rate. From 2013 to 2022, the growth slowed and fluctuated. After 2013, the growth rate of the carbon footprint gradually slowed down, and fluctuations occurred. Although the total carbon footprint continued to rise, the growth rate significantly slowed. The carbon footprint grew from 1404.59 × 106 hm2 to 1579.92 × 106 hm2, an increase of 12.5%. Notably, the carbon footprint decreased in 2013 (−6.47%) and 2017 (−3.50%). The fluctuating growth of the carbon footprint may be related to economic structural adjustments, industrial optimization, and the implementation of environmental protection regulations. In 2021 (12.04%), the carbon footprint growth rate rebounded, likely due to the economic recovery following the pandemic. Overall, during this stage, the total carbon footprint showed a fluctuating increase.
From 2000 to 2022, the carbon footprint in the YEB exhibited a clear growth trend, particularly in the middle and lower regions. Specifically, the proportion of cities in the Low area decreased annually, from about 31% in 2005 to about 23% in 2022, reflecting a continuous reduction in the proportion of the Low area in the overall region. Meanwhile, the proportion of cities in the Low–Mid and Moderate areas fluctuated. The Low–Mid area decreased from about 31% in 2005 to 25% in 2022, while the Moderate area remained stable from 2010 to 2022 at around 23%. In contrast, the proportion of cities in the Mid–High and High areas increased annually. The proportion of cities in the Mid–High area increased from about 19% in 2005 to 29% in 2022, and the proportion in the High area increased from about 19% to 30%. This trend reflects the continuous rise in carbon emission intensity and carbon footprint levels, particularly in the economically developed middle and lower regions, driven by economic growth, industrialization, and urbanization.
From Figure 4a (2005) to Figure 4d (2022), the carbon footprint in the upper region showed a relatively low spatial distribution. Most cities were predominantly in the Low to Low–Mid areas, reflecting the relatively low level of economic activity and urbanization in the upper region at that time. As industrialization accelerated and economic activities increased in the 2010s (Figure 4b,c), some cities’ carbon footprints gradually moved into the Low–Mid and Moderate areas. By 2022, the carbon footprint in the upper region had noticeably increased, with some areas reaching the Mid–High or High areas. However, the increase in total carbon footprint in the upper region was relatively slow. For example, the carbon footprint of CQ increased from 16.13 × 10⁶ hm2 in 2005 to 25.88 × 10⁶ hm2 in 2022, and Chengdu’s increase was more gradual, rising from 8.39 × 10⁶ hm2 to 12.95 × 10⁶ hm2. The upper region, including YN, GZ, SC, and CQ, is located in the southwestern part of China. The Southwest Forest Area, as an important ecological safety barrier, is China’s second-largest forest area and has strong carbon sequestration capacity [46]. The ecosystem here is less disturbed by human activities and plays a crucial role in maintaining the stability of China’s natural resource ecosystems and their service functions [47]. Despite the rich carbon sinks in the upper region, the carbon footprint has been gradually increasing with the growing frequency of economic and human activities.
In 2005, the carbon footprint in the middle region was mainly concentrated in the Low and Low–Mid areas, with the overall carbon footprint slightly higher than that of the upper region. By 2010 and 2015, the carbon footprint in the middle region gradually shifted from the Low–Mid to the Moderate area, with some cities entering the Mid–High area. Overall, the carbon footprint in the middle region has long been dominated by the Moderate area, while the proportion of the Mid–High area has gradually increased. By 2022, the carbon footprint in the middle region further increased, and some cities, such as Changsha, Changde, Nanchang, and Wuhan, had reached the High area. However, it is worth noting that the number of cities in the High area in the middle region is smaller than that in the upper region, with only four cities compared to six in the upper region. With the acceleration of urbanization, population inflows, and infrastructure development, the carbon emission pressure in the middle region has become more significant, particularly in the transportation and industrial sectors, making the growth of carbon footprints more prominent.
The carbon footprint changes in the lower region were the most significant between 2000 and 2022. At the start of the study, most cities in the lower region already had carbon footprints in the Moderate or even the Mid–High areas. With rapid economic growth, especially in large cities such as Shanghai and Nanjing, the carbon footprint levels sharply increased in 2010 and 2015. The carbon footprint of Shanghai increased from 76.66 × 10⁶ hm2 in 2000 to 105.56 × 10⁶ hm2 in 2010, continuing to rise to 132.63 × 10⁶ hm2 in 2022, a 73% increase. Nanjing’s carbon footprint also rose from 36.52 × 10⁶ hm2 in 2000 to 58.56 × 10⁶ hm2 in 2022, a growth of 60.4%. By 2022, the carbon footprint in the lower region generally remained in the High area, mainly due to the intensive industrialization, urbanization, and high energy consumption economic model in the region. With the continuous upgrading of industrial structures and increased energy demand, the carbon emission pressure in the lower region remains high, and promoting low-carbon transformation will be a key issue for the region in the future.

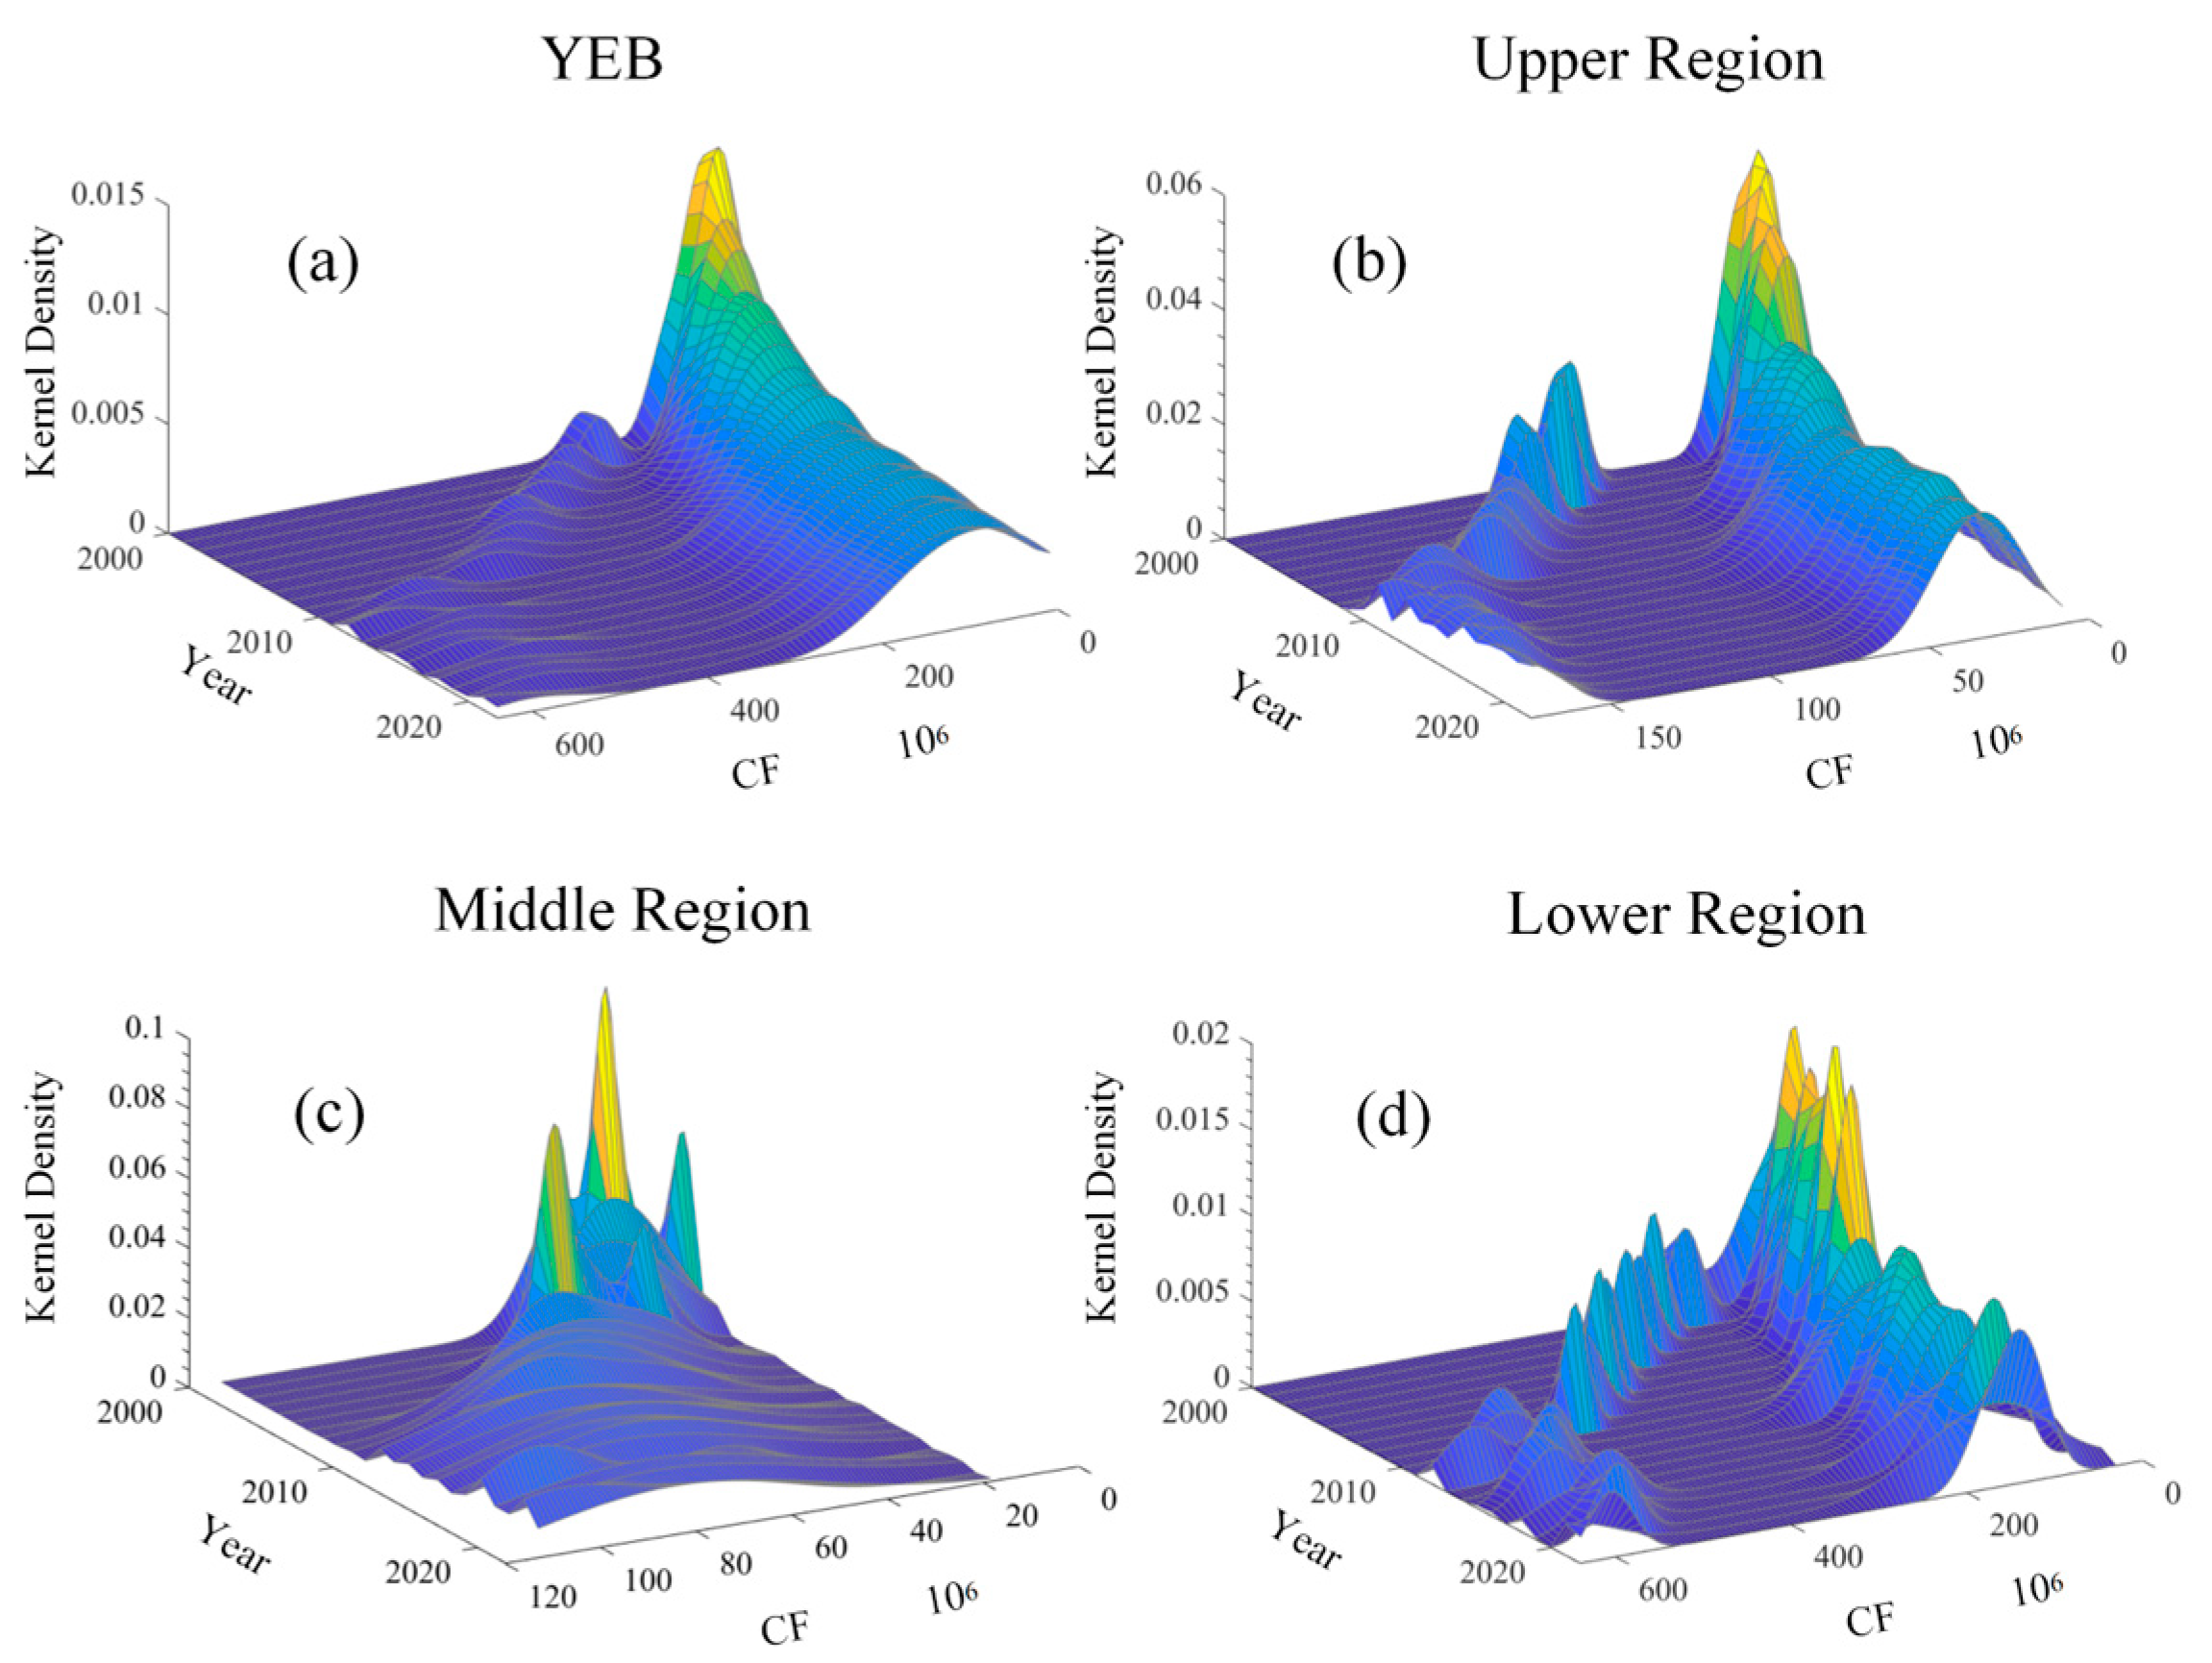
3.2. Temporal Dynamics and Evolution Trend

The kernel density estimation of the carbon footprint in the Yangtze River Economic Belt is shown in Figure 5. The following paragraphs will reveal and describe in detail the dynamic distribution and evolutionary characteristics of the carbon footprint in the overall YEB and its upper, middle, and lower regions from 2000 to 2022, focusing on four aspects: distribution location, distribution pattern, distribution trend, and polarization phenomena [48,49].
The overall carbon footprint three-dimensional kernel density analysis result for the YEB is shown in Figure 5a. Specifically, (1) from the distribution location, the curve of the carbon footprint generally shifts to the left, indicating that the carbon footprint continuously increased from 2000 to 2022. (2) From the distribution pattern, the overall kernel density curve of the YEB shows a unimodal shape. Over time, the peak of the kernel density gradually decreases, and the left tail extends, indicating that the spatial disparity of the regional carbon footprint is narrowing. (3) From the polarization phenomena, the peak of the overall region decreases annually, and the width expands, suggesting that the absolute disparity in the region’s carbon footprint continues to increase. (4) From the distribution trend, overall, the distribution trend of the carbon footprint in the YEB presents a continuing upward trajectory, with the proportion of high carbon footprint areas increasing.
As shown in Figure 5b, the carbon footprint kernel density curve in the upper region exhibited significant dynamic changes. From 2000 to 2010, multiple side peaks emerged, and the main peak elongated, forming a bimodal shape, which indicates a multi-polarization phenomenon in the upper region’s carbon footprint. From 2010 to 2022, the peak decreased and its width expanded, signifying the ongoing increase in the absolute disparity of carbon footprints in the upper region, while the multi-polarization phenomenon weakened. As shown in Figure 5c, the early carbon footprint distribution in the middle region displayed a distinct multi-peaked shape, reflecting a pronounced multi-polarization trend in the carbon footprint distribution. After 2010, the distribution shifted from bimodal to unimodal, with the peak reducing significantly and its width widening notably, signaling the weakening of the multi-polarization trend. However, regional internal differences grew significantly. As shown in Figure 5d, the carbon footprint distribution in the lower region was clearly evident, with multiple peaks appearing in the kernel density curve. From 2000 to 2010, the peak decreased, accompanied by the emergence of several side peaks. From 2010 to 2022, the peak stabilized, and its width slightly increased, suggesting a notable multi-polarization phenomenon in the lower region, with little change in the absolute disparity of carbon footprints.
Overall, the dynamic distribution and evolutionary trends of the carbon footprint across different sections of the YEB exhibit some variations. The spatial absolute disparity in carbon footprints in the upper and middle regions continues to grow, while the polarization phenomenon weakens. In the lower region, the spatial absolute disparity stabilizes, but the polarization phenomenon remains more pronounced compared to the upper and middle regions.

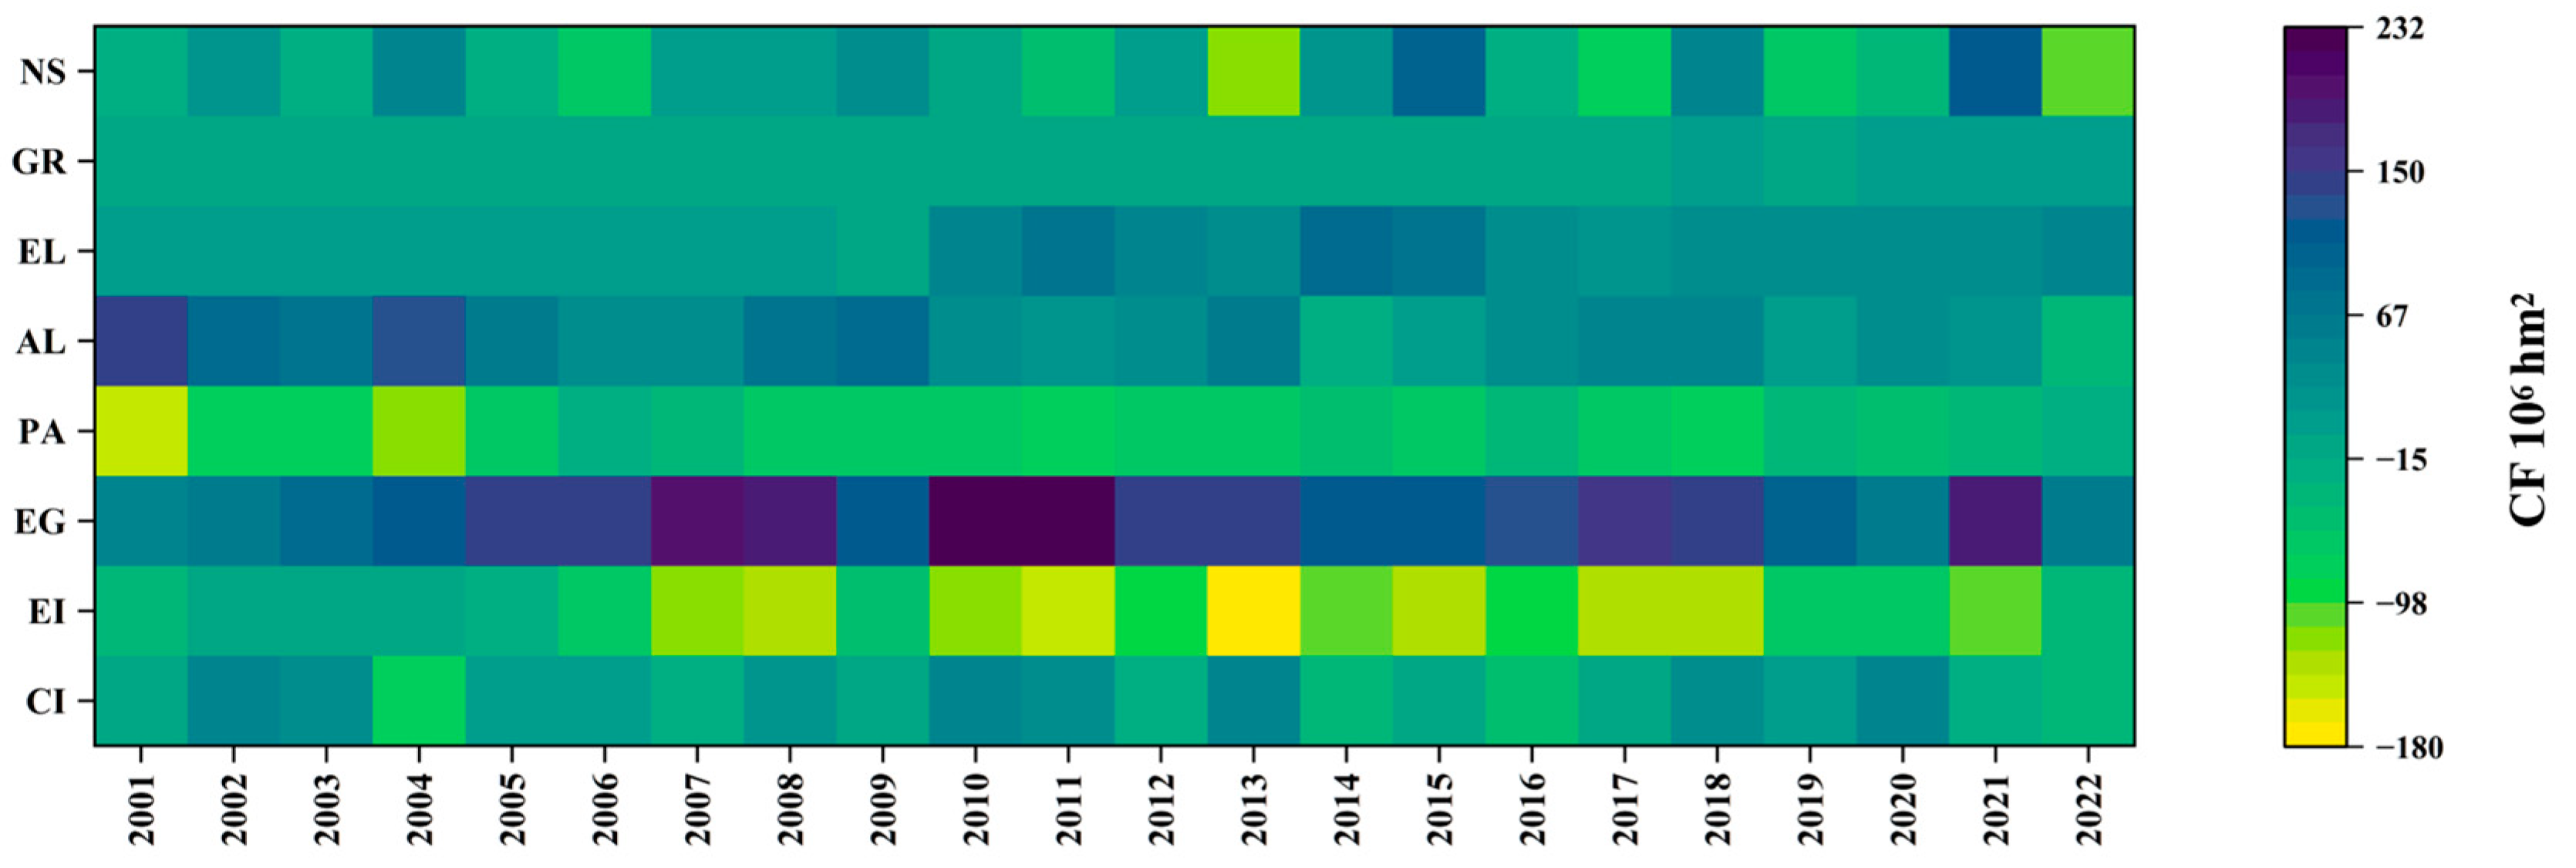
3.3. Analysis of Influencing Factors

The carbon footprint of the YEB is decomposed into the factors of carbon emission intensity (CI), energy consumption intensity (EI), economic growth (EG), population density (PA), urban expansion (AL), ecological land use pressure (EL), carbon sequestration foundation (GR), and carbon sequestration capacity (NS). Using 2000 as the base year, the annual and cumulative effects of each driving factor on the carbon footprint of the YEB are calculated (Table 2).
The period from 2000 to 2005 was the early stage of China’s rapid economic growth. As an important part of China’s economy, the YEB benefited from national reforms and the industrialization process, leading to significant economic development. The contribution rate of CI to the carbon footprint was −188.22%, indicating that during this period, CI had a suppressive effect on changes in the carbon footprint. In 2002, China proposed the “sustainable development” strategy, gradually strengthening efforts in environmental protection and energy conservation. However, with the acceleration of EG (+198.97%), the total carbon footprint still increased. Notably, the contribution rate of AL (+102.33%) ranks second only to EG, indicating that the driving impact of urban expansion on carbon emissions had already begun to emerge. In contrast with the relatively inhibitory influence of PA (−132.22%) during the same period, large-scale infrastructure development linked to urban land use directly increased energy consumption, making it a more pivotal driving mechanism at this stage. The AL factor (+102.33%) had a noticeable positive impact on the carbon footprint during this period. As urbanization progressed, a large number of construction and infrastructure projects sprang up, directly increasing energy consumption and carbon emissions. The change in PA (−132.22%) was small. Although the population gradually concentrated in cities, the relatively low urbanization rate meant that the impact of PA on the carbon footprint was not significant. However, GR (1.76%) and NS (138.67%) did not suppress the carbon footprint and failed to offset the pressure from EG and urbanization.
The period from 2005 to 2010 was a critical period for further economic development in China. During this stage, the YEB continued to benefit from the national reform and opening-up policies and accelerated its economic modernization process. With the acceleration of globalization and the deepening of industrialization, the economic growth in the YEB showed strong momentum. During this period, EG’s contribution to the regional carbon footprint increased significantly (+1436.46%), with the strong economic growth trend, especially the acceleration of industrial and infrastructure development, becoming the main driver of carbon footprint growth. The acceleration of urbanization and the land development activities it brought led to an increase in EL, positively driving the carbon footprint. The synergistic effects of AL (+227.75%) and EL (+193.52%) suggest that urban expansion not only directly increases carbon emissions through land development but also weakens carbon sink capacity by encroaching upon ecological spaces. In sharp contrast to PA’s inhibiting effect (−369.27%), this finding indicates that spatial restructuring in the current phase of urbanization exerts a stronger environmental impact than mere population aggregation. GR (−7.05%) and NS (−92.53%) had a negative pull on the carbon footprint. The enhancement of the ecosystem’s carbon sequestration capacity was limited, but overall, it slowed the growth of the carbon footprint. Some ecological protection measures may have been implemented during this stage.
From 2010 to 2015, although China proposed the “green development” concept and the ecological civilization construction strategy, there was still a significant contradiction between economic growth and ecological protection. The contribution rate of CI to the carbon footprint was +615.81%, indicating that CI had a positive driving effect on changes in the carbon footprint, with significant carbon emission growth. The economic growth rate slowed, and EG played a suppressive role, with a contribution rate of −620.76%, reflecting the industrial structure adjustment and the contraction of high-energy-consuming industries in the YEB. The contribution of AL was 45.81%, which showed a slowdown compared to the previous rapid growth but remained one of the key drivers of the increase in carbon footprint. PA’s contribution was +177.05%, suggesting that during this period, more people moved into large cities and core urban clusters, further increasing the carbon emission burden. The changes in GR (−7.01%) were moderate, while the contribution rate of NS was +716.66%, indicating that the region’s carbon sequestration capacity was significantly impacted, leading to a reduction in carbon sequestration capacity, reflecting the transitional growing pains the region was experiencing.
From 2015 to 2022, China’s “carbon peak and carbon neutrality” goals guided the nationwide low-carbon transformation development. However, the contribution rate of CI to the carbon footprint reached +1761.52%, consistent with the trend of carbon emission peak and closely related to the economic recovery after the pandemic. The contribution of EG (+820.10%) still had a significant impact on the carbon footprint. The growth of the carbon footprint during this stage was still somewhat linked to economic growth, especially as the development of service and high-tech industries had not yet fully compensated for the carbon emissions from traditional high-energy-consuming industries. The contribution rate of AL reached an astonishing +2995.14%, primarily due to the large-scale lockdowns at the beginning of the pandemic, which led to a sharp decline in urban activities. After the pandemic was controlled, the economic rebound resulted in an extremely high contribution rate for 2020. Due to the lockdown and restrictions caused by the pandemic, population movement and concentration decreased, which somewhat alleviated the increase in carbon emissions due to population concentration. The contribution of PA reached −2547.38%. During the pandemic, economic activities and land development slowed, which reduced the ecological land use pressure to some extent. Additionally, ecological protection measures began to show results, and the overall carbon sequestration capacity improved effectively, with EL, GR, and NS having a suppressive effect on the carbon footprint in the Yangtze River Economic Belt.
The heat map of the driving factors of the carbon footprint in the YEB from 2000 to 2022 is shown in Figure 6. First, AL and EG had a significant positive impact on the carbon footprint in most years, particularly in 2015 and 2021, indicating that the rapid urbanization process and economic growth were the main drivers of the increase in carbon footprint. More specifically, urban land development influences the carbon footprint through a threefold mechanism: (1) directly driving carbon emissions in the construction sector, (2) increasing transportation energy demand via spatial restructuring, and (3) reducing carbon sink areas, which leads to the degradation of ecological regulation functions. In comparison, PA mostly serves as a moderating factor, and its influence shifts in different ways as urban development progresses. Second, NS and EL had a suppressive effect on the carbon footprint in several years. The contributions in 2020 and 2015 were higher, showing that ecological protection measures and the enhancement of carbon sequestration capacity played a significant role in alleviating the carbon footprint. The strengthening of carbon sequestration capacity helped absorb a large amount of CO2, thereby reducing the pressure on carbon footprint growth. The alleviation of EL reflects that ecological protection measures during land development were strengthened, effectively reducing the environmental burden of land development. The impact of PA on the carbon footprint was relatively moderate. EI and CI had high contribution values in several years, particularly in 2009 and 2011, indicating that the increase in energy consumption and carbon emission intensity still had a significant driving effect on the carbon footprint. This phenomenon highlights that, despite continuous efforts to promote low-carbon technology applications, the optimization of the energy structure and the improvement of energy efficiency still face significant challenges. Despite policies pushing for low-carbon technology adoption, the continued reliance on traditional high-energy-consuming industries and the growth in energy demand led to an increase in CI, thus driving the growth of the carbon footprint.

4. Discussion

4.1. Analysis of Influencing Factors of Different Regions

The above results indicate that EG and AL are the primary drivers of the carbon footprint growth in the Yangtze River Economic Belt, consistent with other research findings [40]. Similarly to Wei et al. [50], who identified urban expansion (AL) as a key driver of land development and infrastructure growth, our analysis shows that AL’s triple pathway mechanism (direct carbon emissions, indirect carbon emissions, and carbon sink reductions) contributes more than the macro magnitude of emissions. Notably, compared to Zhang’s conclusion that economic scale dominates industrial emissions (75.28–87.46% contribution) [51], the YEB demonstrates similar dependency but with stronger spatial heterogeneity, which far exceeds typical industrial patterns, suggesting amplified urbanization effects in mega-city clusters. Unexpectedly, CI and EI suppressed the growth of the carbon footprint for nearly half of the time, while GR had a weak impact. EL and NS mainly had a suppressive effect. These comparative insights underscore the necessity for region-specific strategies. Based on this, this paper provides a detailed analysis of the specific driving factors behind the carbon footprint in the upper, middle, and lower regions (Figure 7).
In the middle and lower regions, the growth of the carbon footprint is primarily driven by EG and AL, a trend closely aligned with the overall development trajectory of the region. Particularly in the lower region, the acceleration of economic activities and urbanization significantly increased carbon emissions. In contrast, the growth of carbon emissions in the upper region is relatively slower, suggesting that economic and urban development in this region is more constrained or lagging. Over time, the influence of CI and EI on the carbon footprint becomes more pronounced, especially in the lower region, where these two factors exert a notable promoting effect. Specifically, as energy consumption increases and CI rises, the growth rate of the carbon footprint accelerates, particularly in the lower region, where economic and industrial activities are concentrated. However, the impact of NS and GR on suppressing carbon emissions in the lower region remains limited. In contrast, NS in the upper region has a stronger suppressive effect on the growth of the carbon footprint. The natural ecosystems and carbon sink functions in the upper region have, to some extent, alleviated the carbon emission pressure caused by increased economic activities and energy consumption.

4.2. Policy Recommendation

Based on the above research findings, the following policy recommendations are proposed. Firstly, cities in the upper region of the Yangtze River Economic Belt, as well as some cities in the middle region, possess abundant ecological resources and strong carbon sink potential. However, they still rely on an extensive economic model based on resource development. The upper region should prioritize combining ecological protection with carbon sink development, stabilizing and enhancing ecosystem carbon storage capacity, and establishing an ecologically oriented path toward sustainable development. Local governments should encourage and support ecological compensation and green finance mechanisms to guide social capital into ecological protection efforts, thereby fostering green industrial clusters with upstream characteristics. Secondly, although the middle region has a lower level of economic development and weaker ecological endowment compared to the lower region, its economic growth rate is high, and it faces the urgent task of industrial restructuring. Therefore, support for green technologies and industrial upgrading should be increased. Leveraging the region’s transportation advantages, emerging industries such as new energy vehicles and green buildings should be attracted to create an industrial system with local characteristics. Efforts should be made to help energy-intensive industries transition toward higher value-added and low-carbon models, promoting the transformation and development of energy efficiency and the low-carbon economy. In the lower region, which already has a higher level of economic development but faces greater carbon emission pressure, the focus should be on the development of low-carbon technologies and the promotion of green efficiency. Policy-wise, strict environmental regulations should be implemented. For energy-intensive enterprises, tax incentives and financing support should be provided to encourage green technological transformation and the shift toward low-carbon and green industries.

4.3. Contributions, Limitations, and Prospects

NEP can be obtained by subtracting heterotrophic respiration (Rh, representing carbon emissions from soil microbial decomposition) from NPP or by converting NPP using an empirical conversion coefficient related to NEP. The traditional method is based on a direct representation of the ecological carbon balance process. Its advantage lies in dynamically capturing the spatiotemporal heterogeneity of ecosystem carbon sources and sinks. However, it is constrained by the high cost of Rh observations and uncertainties caused by the sensitivity of model parameters. In contrast, this study simplifies NEP calculation by utilizing a conversion coefficient calibrated with empirical data from the Technical Guideline on Gross Ecosystem Product (GEP) (version 1.0), reducing it to a direct multiplicative relationship between NPP and the coefficient. This approach circumvents the technical bottleneck of obtaining Rh data, making it particularly suitable for large-scale or long-term carbon sink assessments. In addition, this study considers the ecological characteristics and land use differences in various regions in the Yangtze River Economic Belt, adopts region-specific conversion factors to calculate carbon sinks, avoids the use of fixed or global average values commonly used in many studies, and fully takes into account the unique environmental conditions of each region. As a result, the accuracy and regional applicability of carbon sink accounting are significantly enhanced. This study can, therefore, provide more precise carbon sink estimates by reflecting the carbon sequestration capacity of different land types, thereby avoiding potential calculation errors that may arise from a single conversion factor. This provides a more reliable basis for future research. It is important to note that, compared to studies using specific or average values for calculations, the NEP values obtained in this study are smaller, resulting in relatively lower carbon sink values. Consequently, the carbon footprint results appear higher in comparison with similar studies. However, some limitations remain in the calculation of cultivated land carbon sink. In this study, the IUEMS Carbon Sequestration Oxygen Release model was used to estimate the carbon sequestration of cultivated land by applying the conversion coefficient of shrubland. This does not fully capture the difference in carbon sequestration capacity between cropland and shrubland. Therefore, future research should aim to further refine the carbon sink accounting framework, particularly for cultivated land, by exploring more accurate conversion coefficients or employing other advanced calculation methods to enhance the scientific rigor and accuracy of carbon sink accounting.

5. Conclusions

This study is based on the ODIAC database and NPP data to calculate the carbon emissions and carbon sink data for 130 prefecture-level cities in the YEB from 2000 to 2022. It conducts comprehensive accounting and analysis of the carbon footprint and uses kernel density estimation and Kaya-LMDI decomposition methods to examine the spatiotemporal differences, dynamic trends, and driving factors of the carbon footprint. The main conclusions are as follows:
(1) In terms of spatiotemporal differences, the carbon footprint of the YEB consistently rose from 2000 to 2022, with a rapid growth phase from 2000 to 2012 and a fluctuating upward phase from 2012 to 2022. The middle and lower regions experienced the fastest increase, whereas the upper region showed relatively slow growth. Overall, a “low–high” alternating pattern emerged from west to east. (2) In terms of dynamic trends, the spatial disparity of the carbon footprint across the YEB decreased during the study period, but the absolute disparity continued to expand, showing a certain polarization trend, with the proportion of high carbon footprint areas constantly increasing. (3) In terms of driving factors, EG and AL were the key factors driving the growth of the carbon footprint in the YEB. CI and EI had a suppressive effect on carbon footprint growth in the earlier part of the study period, but in the latter half, they showed a significant positive driving effect. GR had a limited impact on the carbon footprint, while EL and NS mainly played a suppressive role.
This study deepens the understanding of the concept of carbon footprint from the perspective of ecological footprint and provides detailed accounting. It also analyzes the driving factors of the carbon footprint from a relatively novel perspective. The results of this study can provide a reference for regional carbon emission management and the formulation of regional emission reduction strategies. Building on these findings, future research could further refine our understanding of carbon footprints and guide more targeted emission reduction measures by (1) conducting detailed analyses of carbon sources and sinks across various land use types, (2) revealing the spatial interplay among industrial relocation, transportation networks, and carbon footprints in different city clusters, and (3) exploring the relationship between land development intensity and carbon footprints, including any threshold behaviors that may exist.

Author Contributions

Conceptualization, Z.S. and J.C.; methodology, Z.S.; software, Y.G.; validation, Z.S., J.C. and Y.G.; formal analysis, Z.S.; investigation, Z.S.; resources, X.Z.; data curation, X.Z.; writing—original draft preparation, Z.S.; writing—review and editing, K.Z.; visualization, K.Z.; supervision, J.Z.; project administration, J.Z.; funding acquisition, X.L. All authors have read and agreed to the published version of the manuscript.

Funding

This work was supported by the National Natural Science Foundation of China (72474214 and 71874192), the Postgraduate Research Practice Innovation Program of Jiangsu Province (KYCX24_2966), the Graduate Innovation Program of China University of Mining and Technology (2024WLKXJ122), and the Fundamental Research Funds for the Central Universities.

Data Availability Statement

Data are contained within the article.

Conflicts of Interest

The authors declare no conflicts of interest.

References

  1. IEA. CO2 Emissions in 2023; IEA: Paris, France, 2024. [Google Scholar]
  2. Friedlingstein, P.; O’Sullivan, M.; Jones, M.W.; Andrew, R.M.; Hauck, J.; Olsen, A.; Peters, G.P.; Peters, W.; Pongratz, J.; Sitch, S.; et al. Global Carbon Budget 2020. Earth Syst. Sci. Data 2020, 12, 3269–3340. [Google Scholar] [CrossRef]
  3. Piao, S.; He, Y.; Chen, F. Estimation of China’s Terrestrial Ecosystem Carbon Sink: Methods, Progress and Prospects. Sci. China Earth Sci. 2022, 52, 1010–1020. [Google Scholar] [CrossRef]
  4. Mo, L.; Zohner, C.M.; Reich, P.B.; Liang, J.; de Miguel, S.; Nabuurs, G.-J.; Renner, S.S.; van den Hoogen, J.; Araza, A.; Herold, M.; et al. Integrated Global Assessment of the Natural Forest Carbon Potential. Nature 2023, 624, 92–101. [Google Scholar] [CrossRef]
  5. Lin, B.; Jiang, Z. Environmental Kuznets Curve Prediction and Influencing Factors Analysis of Carbon Dioxide in China. Manag. World 2009, 4, 27–36. [Google Scholar] [CrossRef]
  6. Ward, M.; Tulloch, A.I.T.; Radford, J.Q.; Williams, B.A.; Reside, A.E.; Macdonald, S.L.; Mayfield, H.J.; Maron, M.; Possingham, H.P.; Vine, S.J.; et al. Impact of 2019–2020 Mega-Fires on Australian Fauna Habitat. Nat. Ecol. Evol. 2020, 4, 1321–1326. [Google Scholar] [CrossRef] [PubMed]
  7. Kaufman, D.S.; Broadman, E. Revisiting the Holocene Global Temperature Conundrum. Nature 2023, 614, 425–435. [Google Scholar] [CrossRef]
  8. Ramaswami, A.; Tong, K.; Fang, A.; Lal, R.M.; Nagpure, A.S.; Li, Y.; Yu, H.; Jiang, D.; Russell, A.G.; Shi, L.; et al. Urban Cross-Sector Actions for Carbon Mitigation with Local Health Co-Benefits in China. Nat. Clim. Change 2017, 7, 736–742. [Google Scholar] [CrossRef]
  9. Heinonen, J.; Ottelin, J.; Ala-Mantila, S.; Wiedmann, T.; Clarke, J.; Junnila, S. Spatial Consumption-Based Carbon Footprint Assessments—A Review of Recent Developments in the Field. J. Clean. Prod. 2020, 256, 120335. [Google Scholar] [CrossRef]
  10. Ju, H.; Zeng, G.; Zhang, S. Inter-Provincial Flow and Influencing Factors of Agricultural Carbon Footprint in China and Its Policy Implication. Environ. Impact Assess. Rev. 2024, 105, 107419. [Google Scholar] [CrossRef]
  11. Wiedmann, T.; Minx, J. A Definition of Carbon Footprint. Ecol. Econ. Res. Trends 2008, 2, 55–65. [Google Scholar]
  12. Fang, K.; Heijungs, R.; de Snoo, G. The Footprint Family: Comparison and Interaction of the Ecological, Energy, Carbon and Water Footprints. Rev. Metall.-Cah. Inf. Tech. 2013, 110, 77–86. [Google Scholar] [CrossRef]
  13. Guinée, J.B.; Heijungs, R.; Huppes, G.; Zamagni, A.; Masoni, P.; Buonamici, R.; Ekvall, T.; Rydberg, T. Life Cycle Assessment: Past, Present, and Future. Environ. Sci. Technol. 2011, 45, 90–96. [Google Scholar] [CrossRef]
  14. Hertwich, E.G.; Peters, G.P. Carbon Footprint of Nations: A Global, Trade-Linked Analysis. Environ. Sci. Technol. 2009, 43, 6414–6420. [Google Scholar] [CrossRef] [PubMed]
  15. Leontief, W.W. Input-Output Economics; Oxford University Press: New York, NY, USA, 1986; ISBN 978-0-19-503525-4. [Google Scholar]
  16. Caglar, A.E.; Balsalobre-Lorente, D.; Akin, C.S. Analysing the Ecological Footprint in EU-5 Countries under a Scenario of Carbon Neutrality: Evidence from Newly Developed Sharp and Smooth Structural Breaks in Unit Root Testing. J. Environ. Manag. 2021, 295, 113155. [Google Scholar] [CrossRef]
  17. Mikhailova, E.A.; Lin, L.; Hao, Z.; Zurqani, H.A.; Post, C.J.; Schlautman, M.A.; Post, G.C. Contribution of Land Cover Conversions to Connecticut (USA) Carbon Footprint. Geographies 2022, 2, 286–302. [Google Scholar] [CrossRef]
  18. Quan, Q.; He, N.; Zhang, R.; Wang, J.; Luo, Y.; Ma, F.; Pan, J.; Wang, R.; Liu, C.; Zhang, J.; et al. Plant Height as an Indicator for Alpine Carbon Sequestration and Ecosystem Response to Warming. Nat. Plants 2024, 10, 890–900. [Google Scholar] [CrossRef]
  19. Xue, Y.; Bai, X.; Zhao, C.; Tan, Q.; Li, Y.; Luo, G.; Wu, L.; Chen, F.; Li, C.; Ran, C.; et al. Spring Photosynthetic Phenology of Chinese Vegetation in Response to Climate Change and Its Impact on Net Primary Productivity. Agric. For. Meteorol. 2023, 342, 109734. [Google Scholar] [CrossRef]
  20. Khan, M.A. Analyzing Three Zeros (Zero Poverty, Unemployment, and Carbon Emissions) in Asia and the Pacific Region: Assessment of Sustainable Development Goals through the STIRPAT Model. Sustain. Dev. 2024, 32, 4782–4799. [Google Scholar] [CrossRef]
  21. York, R.; Rosa, E.A.; Dietz, T. STIRPAT, IPAT and ImPACT: Analytic Tools for Unpacking the Driving Forces of Environmental Impacts. Ecol. Econ. 2003, 46, 351–365. [Google Scholar] [CrossRef]
  22. Riveros, J.A.; Shahbaz, M. Decomposition and Decoupling: A Case Study of Colombia’s Energy Consumption and Economic Growth. Energy 2024, 312, 133523. [Google Scholar] [CrossRef]
  23. Cansino, J.M.; Sanchez-Braza, A.; Rodriguez-Arevalo, M.L. Driving Forces of Spain’s CO2 Emissions: A LMDI Decomposition Approach. Renew. Sustain. Energy Rev. 2015, 48, 749–759. [Google Scholar] [CrossRef]
  24. Chen, J.; Gao, M.; Cheng, S.; Hou, W.; Song, M.; Liu, X.; Liu, Y.; Shan, Y. County-Level CO2 Emissions and Sequestration in China during 1997–2017. Sci. Data 2020, 7, 391. [Google Scholar] [CrossRef]
  25. Chen, D.; Hu, W.; Li, Y.; Zhang, C.; Lu, X.; Cheng, H. Exploring the Temporal and Spatial Effects of City Size on Regional Economic Integration: Evidence from the Yangtze River Economic Belt in China. Land Use Policy 2023, 132, 106770. [Google Scholar] [CrossRef]
  26. Zhang, N.; Sun, F.; Hu, Y. Carbon Emission Efficiency of Land Use in Urban Agglomerations of Yangtze River Economic Belt, China: Based on Three-Stage SBM-DEA Model. Ecol. Indic. 2024, 160, 111922. [Google Scholar] [CrossRef]
  27. Shi, Y.; Yang, C.; Zhu, J.; Chang, J.; Zhao, X.; Sun, W.; Huang, M.; Yu, Y.; Guo, K.; Gu, F.; et al. Estimation of National and Provincial Carbon Emissions, Terrestrial Carbon Sinks and Their Relative Contribution to Emission Reductions during 1980~2020. Sci. Sin. Vitae 2024, 54, 2459–2478. (In Chinese) [Google Scholar] [CrossRef]
  28. Yang, J.; Huang, X. The 30 m Annual Land Cover Dataset and Its Dynamics in China from 1990 to 2019. Earth Syst. Sci. Data 2021, 13, 3907–3925. [Google Scholar] [CrossRef]
  29. Zhang, Y.; Meng, W.; Yun, H.; Xu, W.; Hu, B.; He, M.; Mo, X.; Zhang, L. Is Urban Green Space a Carbon Sink or Source?—A Case Study of China Based on LCA Method. Environ. Impact Assess. Rev. 2022, 94, 106766. [Google Scholar] [CrossRef]
  30. Fatichi, S.; Pappas, C.; Zscheischler, J.; Leuzinger, S. Modelling Carbon Sources and Sinks in Terrestrial Vegetation. New Phytol. 2019, 221, 652–668. [Google Scholar] [CrossRef]
  31. Wu, J.; Jia, P.; Feng, T.; Li, H.; Kuang, H.; Zhang, J. Uncovering the Spatiotemporal Impacts of Built Environment on Traffic Carbon Emissions Using Multi-Source Big Data. Land Use Policy 2023, 129, 106621. [Google Scholar] [CrossRef]
  32. Fernández-Martínez, M.; Peñuelas, J.; Chevallier, F.; Ciais, P.; Obersteiner, M.; Rödenbeck, C.; Sardans, J.; Vicca, S.; Yang, H.; Sitch, S.; et al. Diagnosing Destabilization Risk in Global Land Carbon Sinks. Nature 2023, 615, 848–853. [Google Scholar] [CrossRef]
  33. Shi, Y.; Zhang, B.; Liang, L.; Wang, S.; Zhang, H.; Sun, H.; Han, X. Unfolding the Effectiveness of Ecological Restoration Programs in Enhancing Vegetation Carbon Sinks across Different Climate Zones in China. Resour. Conserv. Recycl. 2025, 212, 107974. [Google Scholar] [CrossRef]
  34. Oda, T.; Maksyutov, S.; Andres, R.J. The Open-Source Data Inventory for Anthropogenic CO2, Version 2016 (ODIAC2016): A Global Monthly Fossil Fuel CO2 Gridded Emissions Data Product for Tracer Transport Simulations and Surface Flux Inversions. Earth Syst. Sci. Data 2018, 10, 87–107. [Google Scholar] [CrossRef] [PubMed]
  35. Oda, T.; Maksyutov, S. A Very High-Resolution (1 km × 1 km) Global Fossil Fuel CO2 Emission Inventory Derived Using a Point Source Database and Satellite Observations of Nighttime Lights. Atmos. Chem. Phys. 2011, 11, 543–556. [Google Scholar] [CrossRef]
  36. Jin, C.; Xue, Y.; Yuan, T.; Zhao, L.; Jiang, X.; Sun, Y.; Wu, S.; Wang, X. Retrieval Anthropogenic CO2 Emissions from OCO-2 and Comparison with Gridded Emission Inventories. J. Clean. Prod. 2024, 448, 141418. [Google Scholar] [CrossRef]
  37. Intelligent Urban Ecosystem Management System. Available online: https://www.iuems.com/eco/index.html (accessed on 18 January 2025).
  38. Chinese Academy of Environmental Planning; Research Center for Eco-Environmental Sciences. The Technical Guideline on Gross Ecosystem Product (GEP) (1.0 Version). Available online: http://www.caep.org.cn/zclm/sthjyjjhszx/zxdt_21932/202101/W020210122402035975103.pdf (accessed on 18 January 2025).
  39. Song, M.; Zhang, L.; Gao, Y.; Li, E. Spatiotemporal Evolution and Influence Mechanism of the Carbon Footprint of Energy Consumption at County Level in the Yellow River Basin. Sci. Total Environ. 2023, 883, 163710. [Google Scholar] [CrossRef]
  40. Chen, J.; Fan, W.; Li, D.; Liu, X.; Song, M. Driving Factors of Global Carbon Footprint Pressure: Based on Vegetation Carbon Sequestration. Appl. Energy 2020, 267, 114914. [Google Scholar] [CrossRef]
  41. Sun, P. A Study on the Spatio-Temporal Disparities and Evolution of Distribution of Chinese-Style Modernization in the Yangtze River Economic Belt. Resour. Environ. Yangtze Basin 2024, 33, 1369–1381. [Google Scholar]
  42. Du, J.; Shen, Z.; Song, M.; Vardanyan, M. The Role of Green Financing in Facilitating Renewable Energy Transition in China: Perspectives from Energy Governance, Environmental Regulation, and Market Reforms. Energy Econ. 2023, 120, 106595. [Google Scholar] [CrossRef]
  43. Xu, L.; Yang, J.; Cheng, J.; Dong, H. How Has China’s Low-Carbon City Pilot Policy Influenced Its CO2 Abatement Costs? Analysis from the Perspective of the Shadow Price. Energy Econ. 2022, 115, 106353. [Google Scholar] [CrossRef]
  44. Kaya, Y. Impact of Carbon Dioxide Emission Control on GNP Growth: Interpretation of Proposed Scenarios. In Proceedings of the Response Strategies Working Group, Paris, France, 1989. [Google Scholar]
  45. Zhong, S.; Jiao, Y.; Yan, C.; Wang, W. The impact mechanism of spatial agglomeration of construction land resources on the synergistic reduction of pollutants and CO2. ACTA Geogr. Sin. 2024, 79, 688–711. [Google Scholar]
  46. Cao, Y.; Chen, Z.; Mo, J.; Sun, Y.; Yan, H. Study on the spatial-temporal evolution characteristics and driving factors of forest NEP in Southwest China. ACTA Ecol. Sin. 2025, 7, 1–15. [Google Scholar] [CrossRef]
  47. Wu, Y.; Meng, J. Quantifying the spatial pattern for the importance of natural resource ecosystem services in China. J. Nat. Resour. 2022, 37, 17–33. [Google Scholar] [CrossRef]
  48. Sun, P. Research on the Spatio-temporal Patterns and Interactive Effects of Manufacturing Carbon Emissions and IFDI in the Yangtze River Economic Belt. Resour. Environ. Yangtze Basin 2025, 34, 252–267. [Google Scholar]
  49. Zhao, Z.; Ru, S.; Xue, F. Spatio-Temporal Pattern and Dynamic Evolution of Ecological Resilience in The Yellow River Basin: Based on the Analysis of Emergy Ecological Footprint Model. China Popul. Resour. Environ. 2024, 34, 136–147. [Google Scholar]
  50. Wei, Z.; Jian, Z.; Sun, Y.; Pan, F.; Han, H.; Liu, Q.; Mei, Y. Ecological Sustainability and High-Quality Development of the Yellow River Delta in China Based on the Improved Ecological Footprint Model. Sci. Rep. 2023, 13, 3821. [Google Scholar] [CrossRef]
  51. Zhang, H.; Li, S. Research on the Factors Influencing CO2 Emission Reduction in High-Energy-Consumption Industries under Carbon Peak. Sustainability 2023, 15, 13437. [Google Scholar] [CrossRef]
Figure 1. Study area. (a) The location of the YEB in China; (b) the south sea of China; (c) land use types based on CLCD in the YEB in 2022; (d) administrative division and digital elevation model map of the YEB.
Land 14 00641 g001
Figure 2. Conceptual relationships of the interaction between carbon sources and sinks in achieving carbon balance.
Land 14 00641 g002
Figure 3. Research framework for the spatiotemporal evolution and influencing factors of the carbon footprint.
Land 14 00641 g003
Figure 4. Spatial and temporal distribution of carbon footprint in the YEB. (ad) Spatial distribution of carbon footprint in the YEB in 2005, 2010, 2015, and 2022. (e) Trends in carbon footprint changes in the upper, middle, and lower regions of the YEB (2000–2022).
Land 14 00641 g004
Figure 5. The kernel density curve of the CF. (ad) The kernel density curve of the whole Yangtze River Economic Belt and its upper, middle, and lower regions (2000–2022).
Land 14 00641 g005
Figure 6. Contribution of various factors to the carbon footprint of the YEB from 2000 to 2022.
Land 14 00641 g006
Figure 7. Contribution of each influencing factor to the carbon footprint of the upper, middle, and lower regions from 2000 to 2022.
Land 14 00641 g007
Table 1. Conversion coefficients of NEP and NPP.
Geographical
Regions
AreaCroplandForestShrubGrasslandWetland
EastSH0.1160.1490.1160.0150.059
JS0.0820.140.0820.0940.069
ZJ0.1510.1580.1510.1120.052
AH0.1120.1630.1120.1290.045
JX0.0850.1120.0850.1180.065
Central and SouthHB0.130.1620.130.1130.038
HN0.070.0970.070.0840.084
SouthwestCQ0.1830.1760.1830.170.082
SC0.2030.2550.2030.2870.146
YN0.1630.2260.1630.1360.08
GZ0.0080.0490.0080.060.01
Table 2. Decomposition results of carbon footprint factors in the YEB during 2000–2022.
PeriodCIEIEGPAALELGRNS
2000–2005−188.22%198.97%380.47%−132.22%102.33%−1.76%1.76%138.67%
2005–2010−95.35%−793.51%1436.46%−369.27%227.75%193.52%−7.05%−92.53%
2010–2015615.81%−202.79%−620.76%177.05%45.81%−224.77%−7.01%716.66%
2015–20221761.52%−873.07%820.10%−2547.38%2995.14%−834.53%−38.81%−582.97%
Disclaimer/Publisher’s Note: The statements, opinions and data contained in all publications are solely those of the individual author(s) and contributor(s) and not of MDPI and/or the editor(s). MDPI and/or the editor(s) disclaim responsibility for any injury to people or property resulting from any ideas, methods, instructions or products referred to in the content.

