
Detecting Symptoms and Dispersal of Pine Tortoise Scale Pest in an Urban Forest by Remote Sensing

 ,
,  , , and
Abstract
1. Introduction
2. Material and Methods
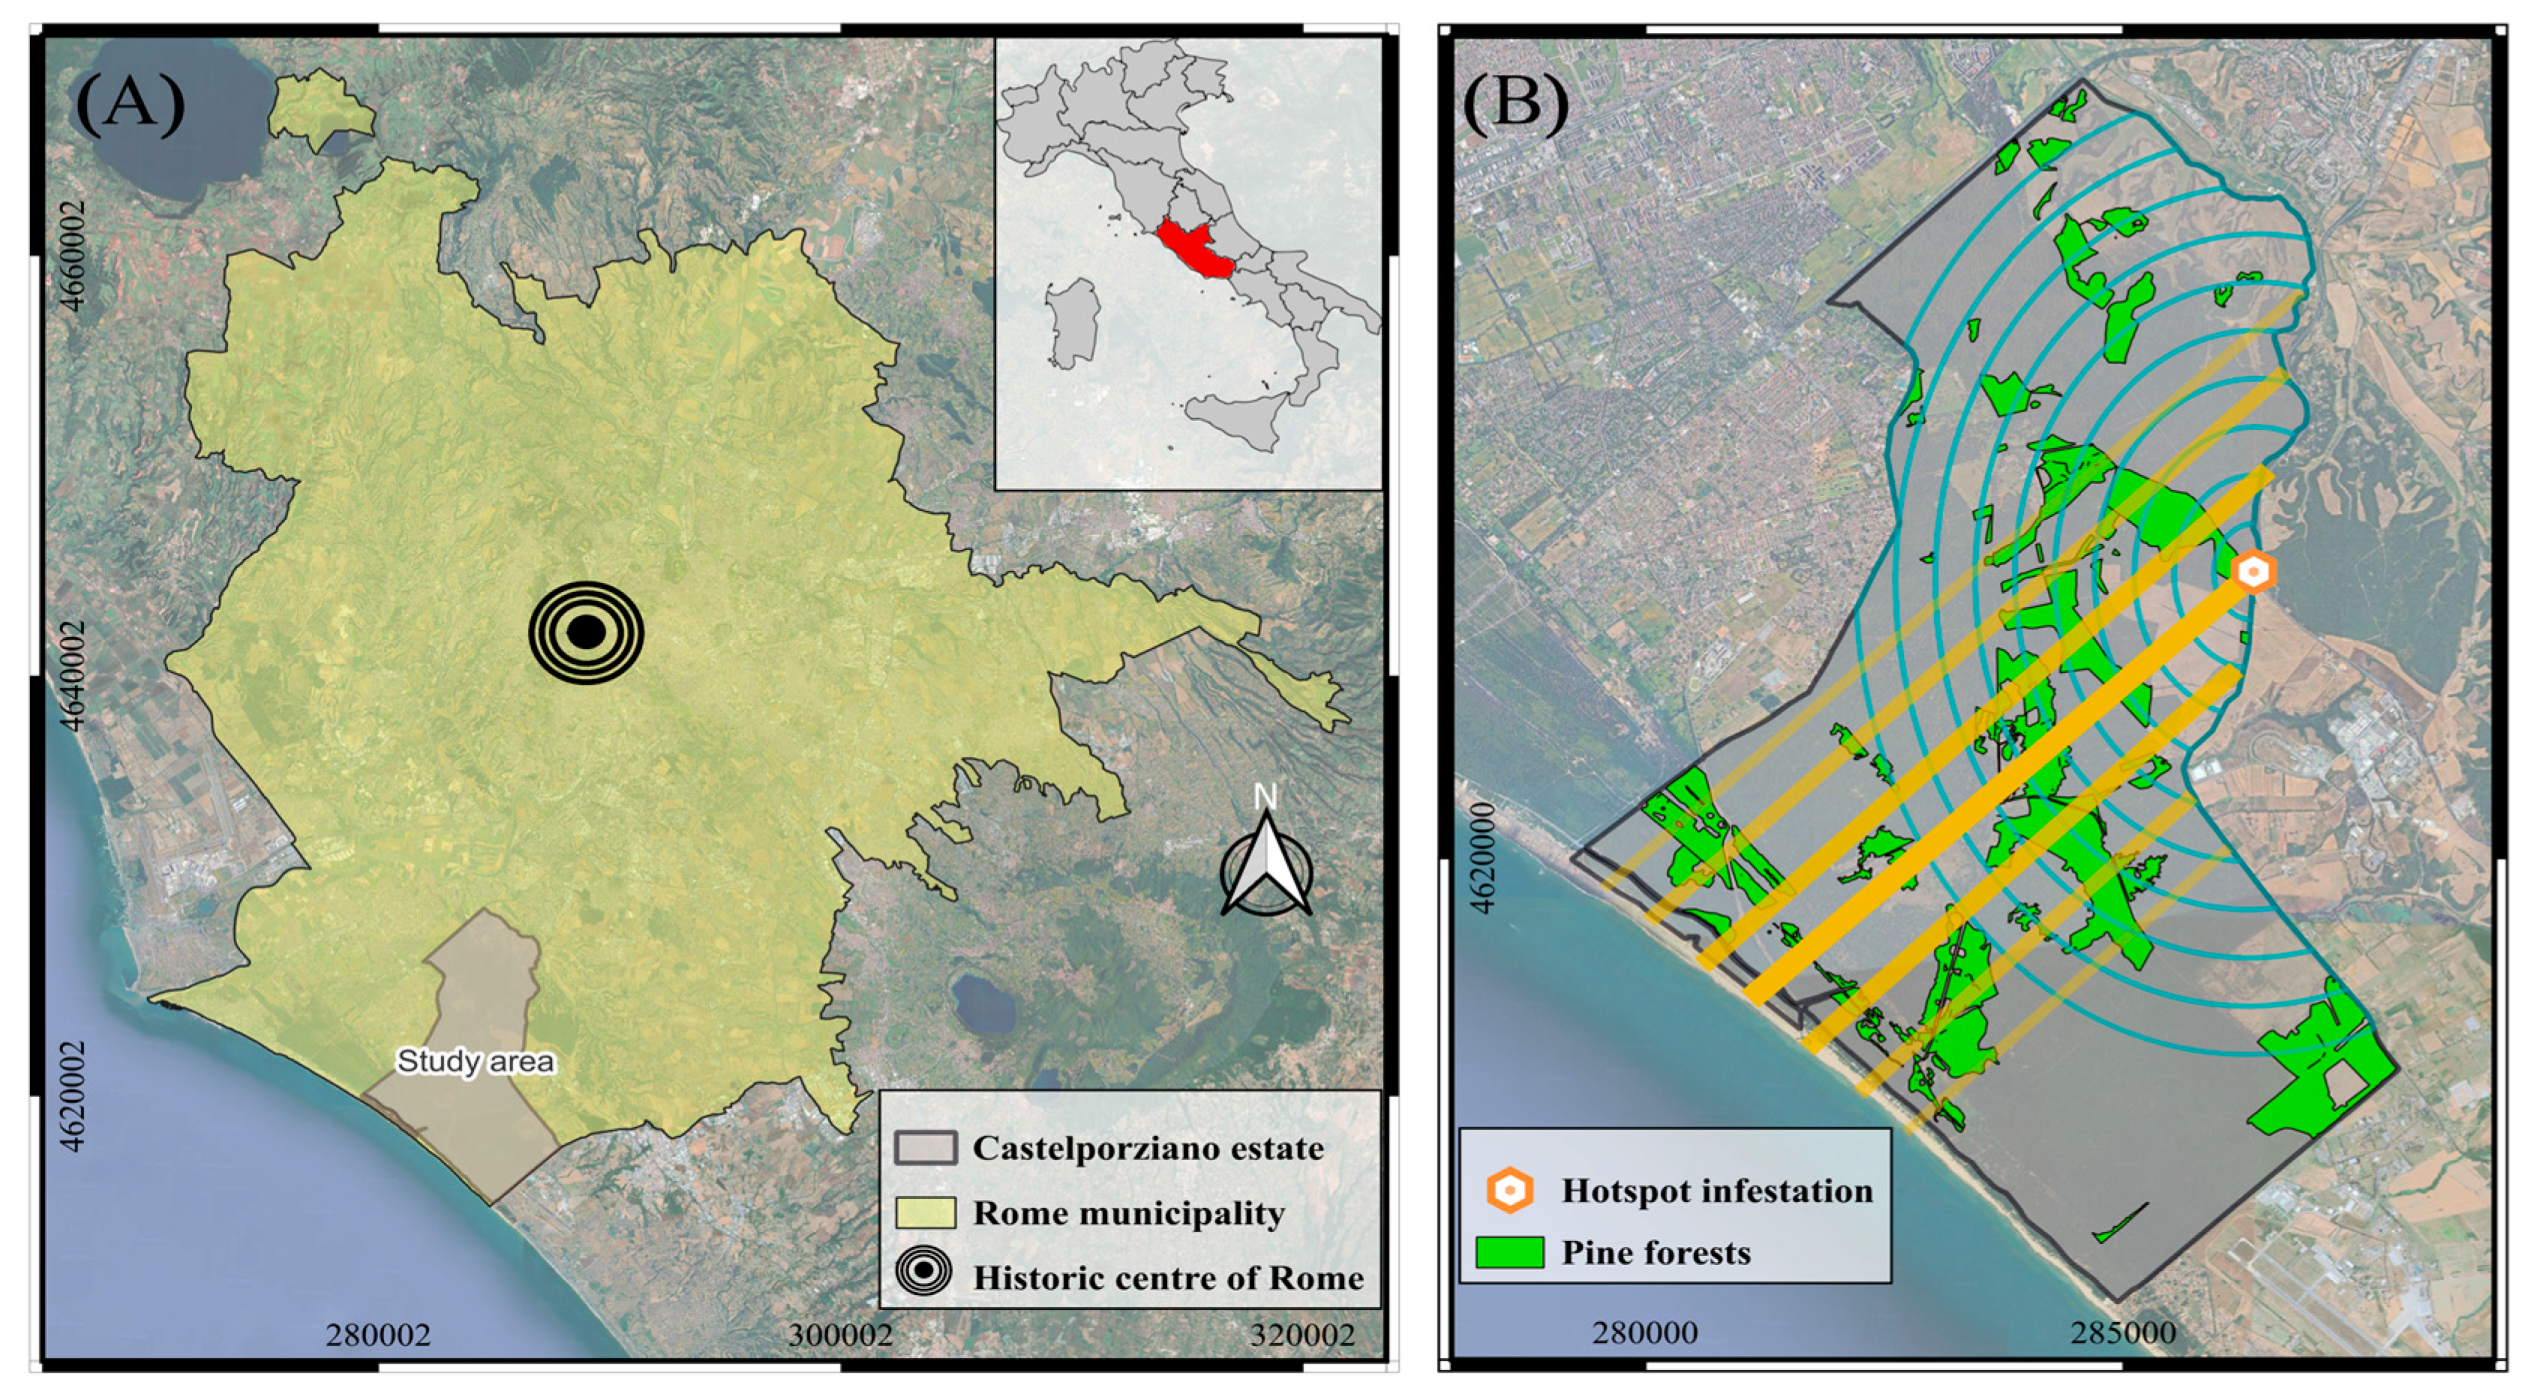
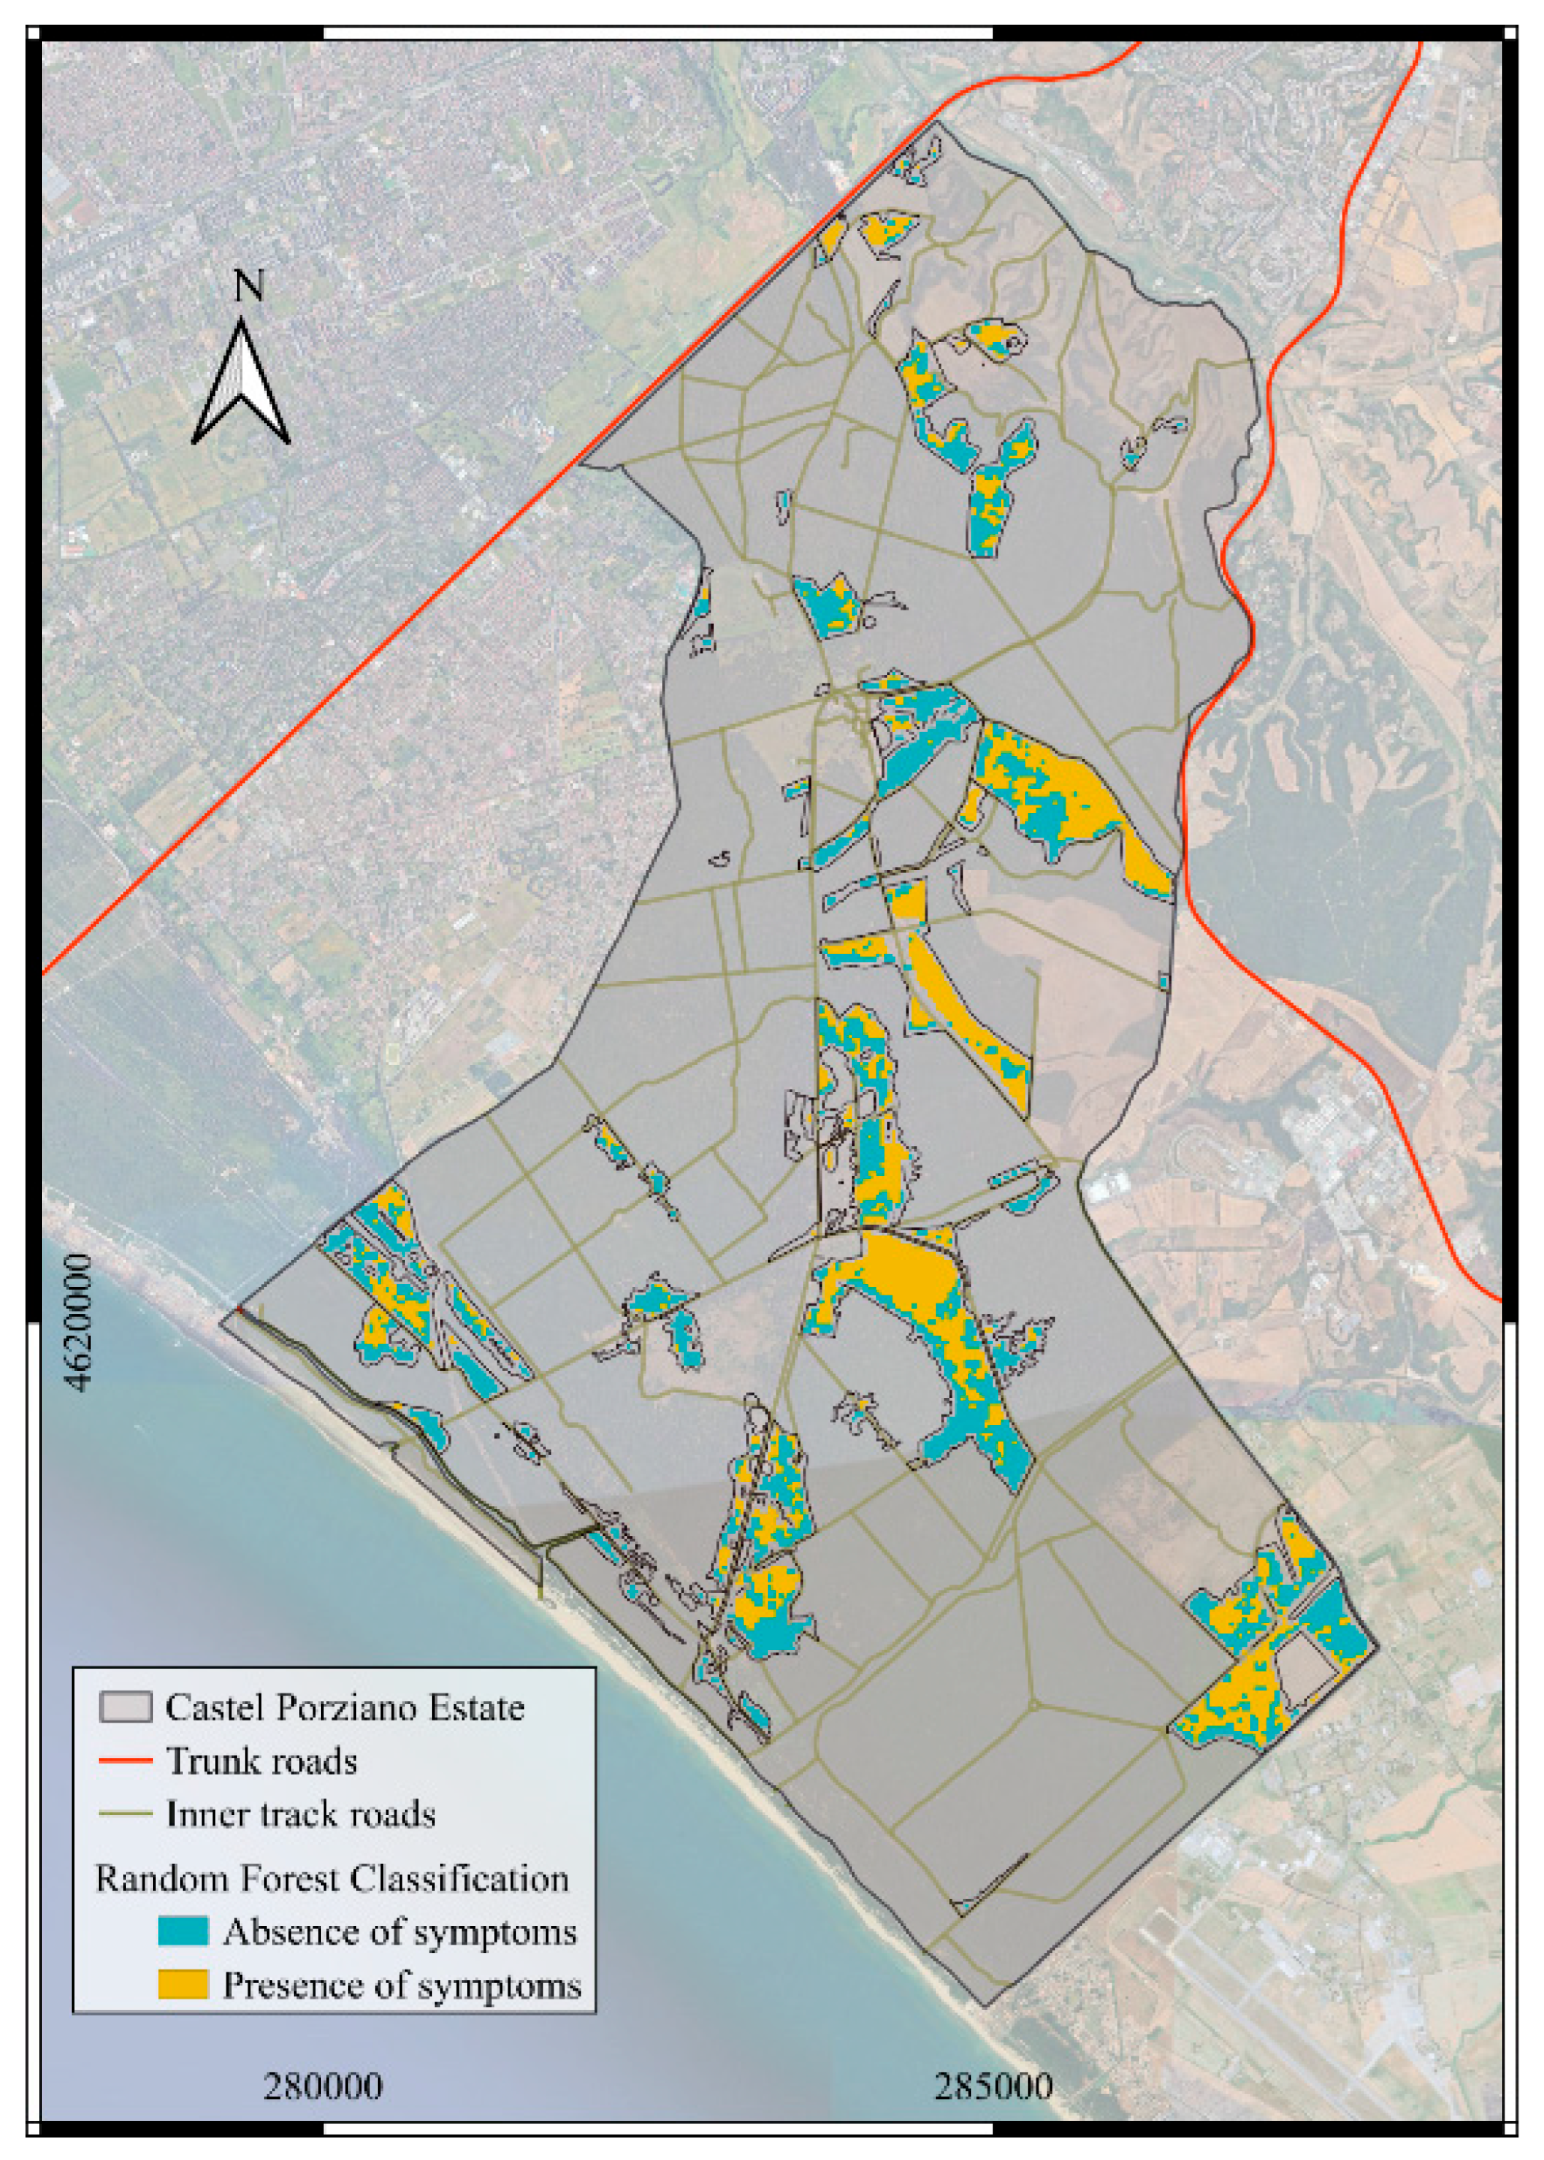
2.1. Study Site
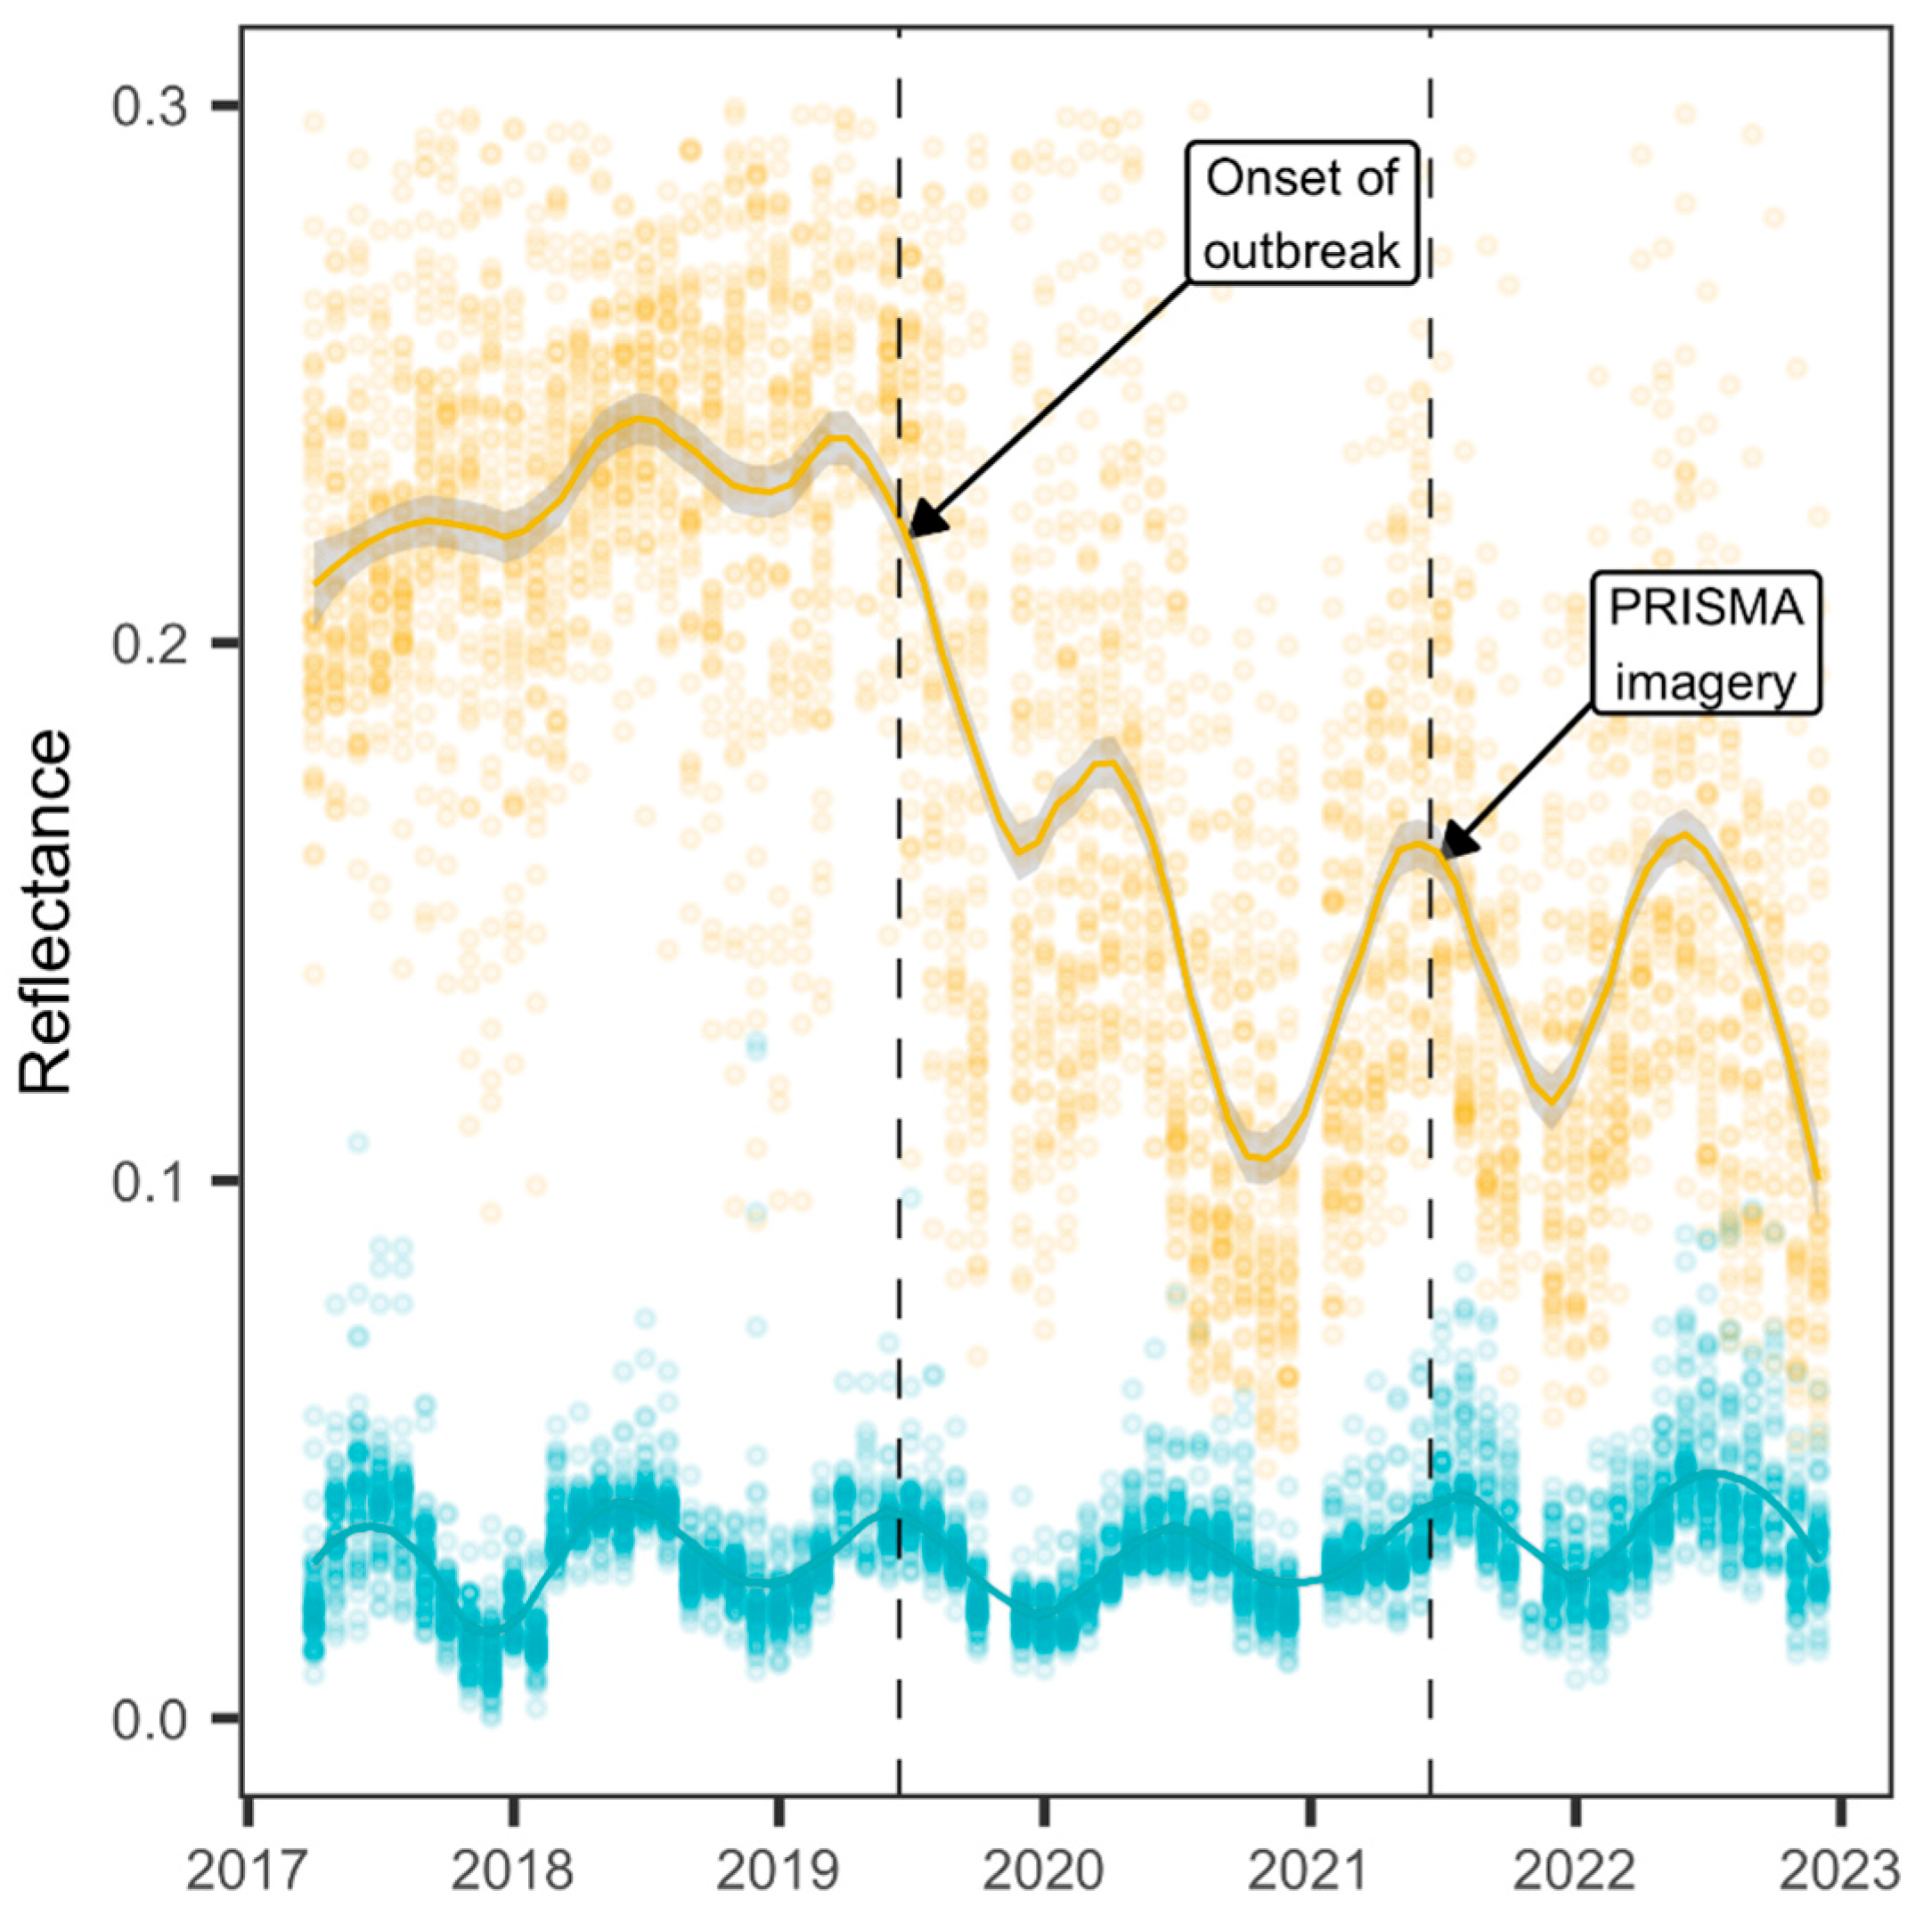
2.2. Phenological Dataset
2.3. Detection Dataset and Model
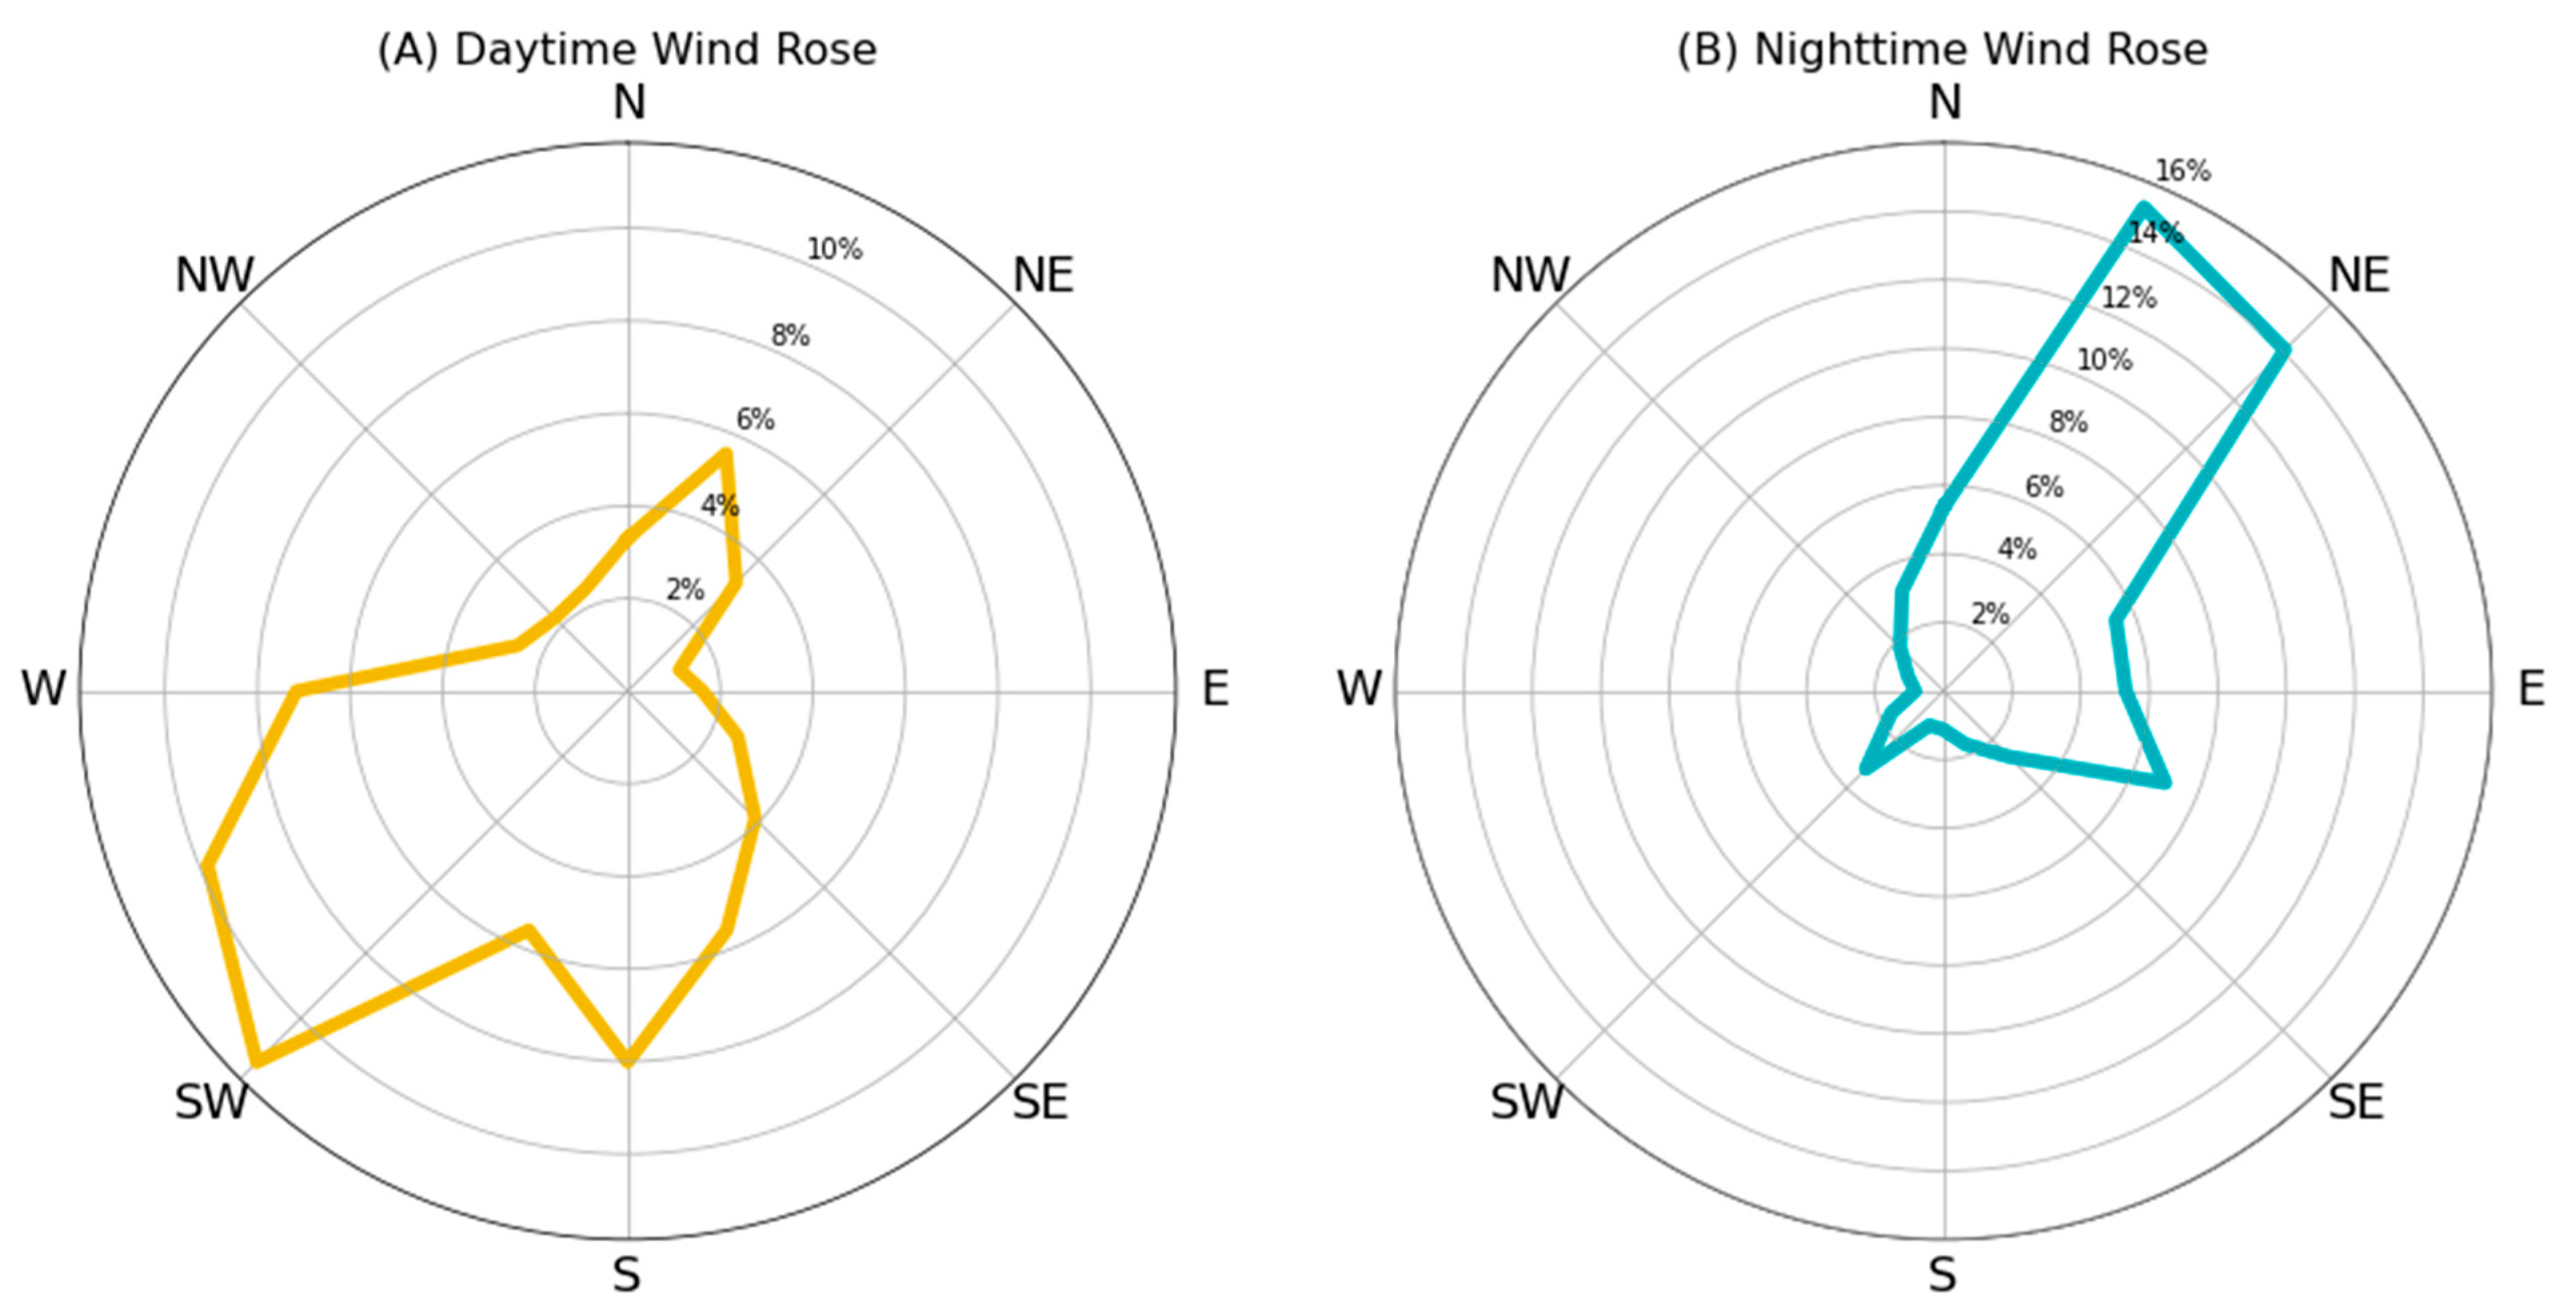
2.4. Wind Dispersion Dataset and Model
3. Results
4. Discussion
5. Conclusions
Author Contributions
Funding
Data Availability Statement
Acknowledgments
Conflicts of Interest
Abbreviations
| PTS | Pine tortoise scale Toumeyella parvicornis (Cockerell) (Hemiptera: Coccidae, hereafter “PTS”) |
| PRISMA | Hyperspectral Precursor of the Application Mission |
| RF | Random Forest |
| VIS | Visible |
| NIR | Near-Infrared Reflectance |
| SWIR | Short-Wave Infrared Reflectance |
| GLMM | Generalized Linear Mixed Model |
| UDM | Uniform Dispersion Model |
| PWDM | Prevailing Wind Dispersion Model |
Appendix A

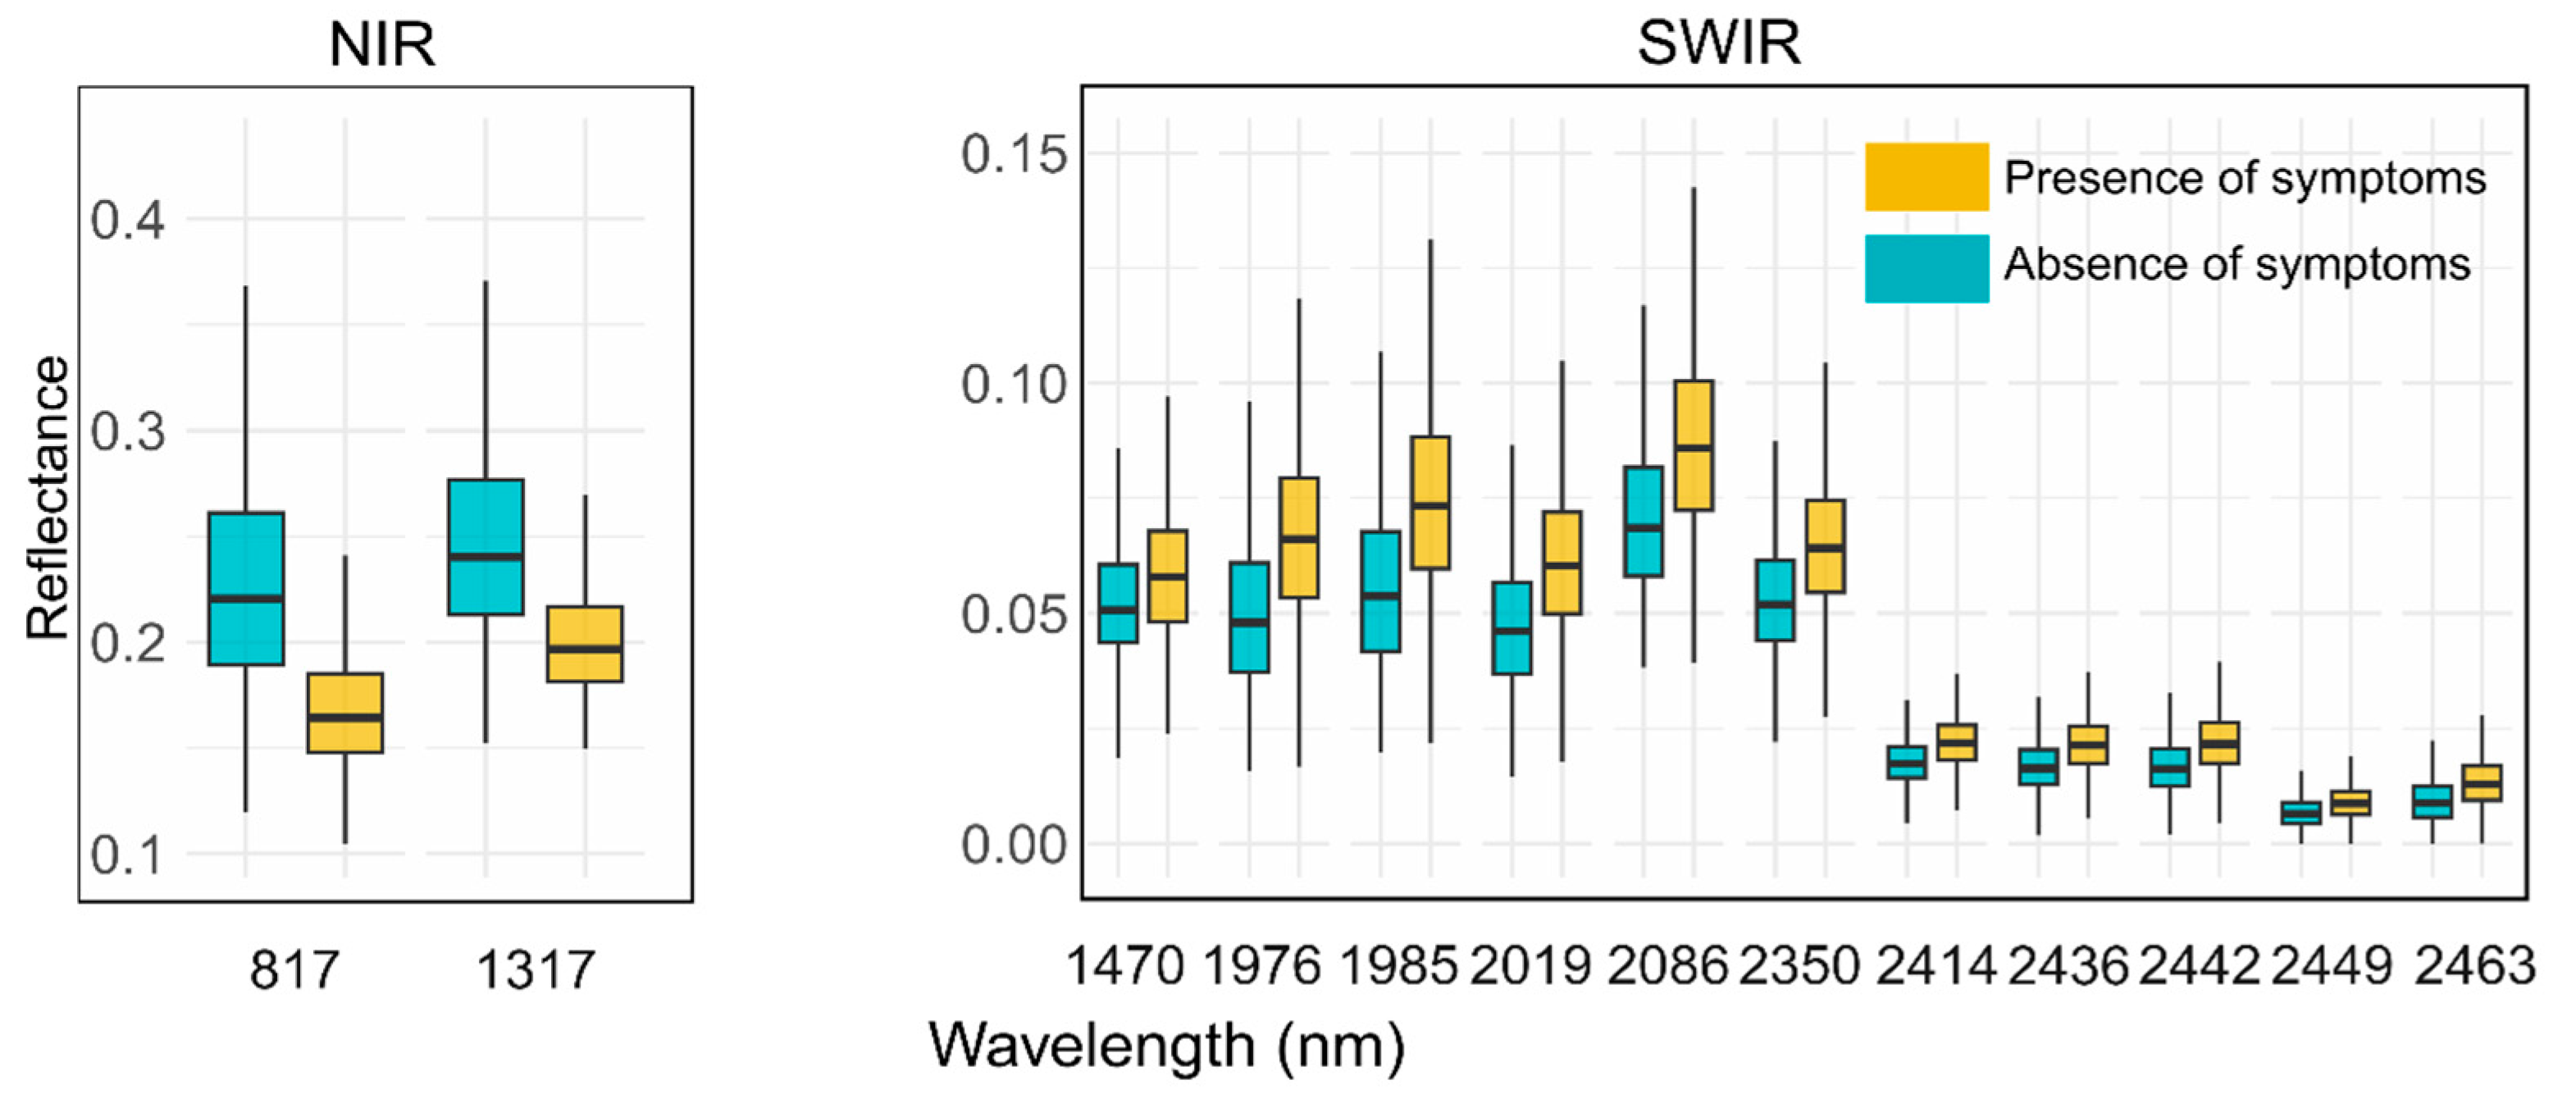
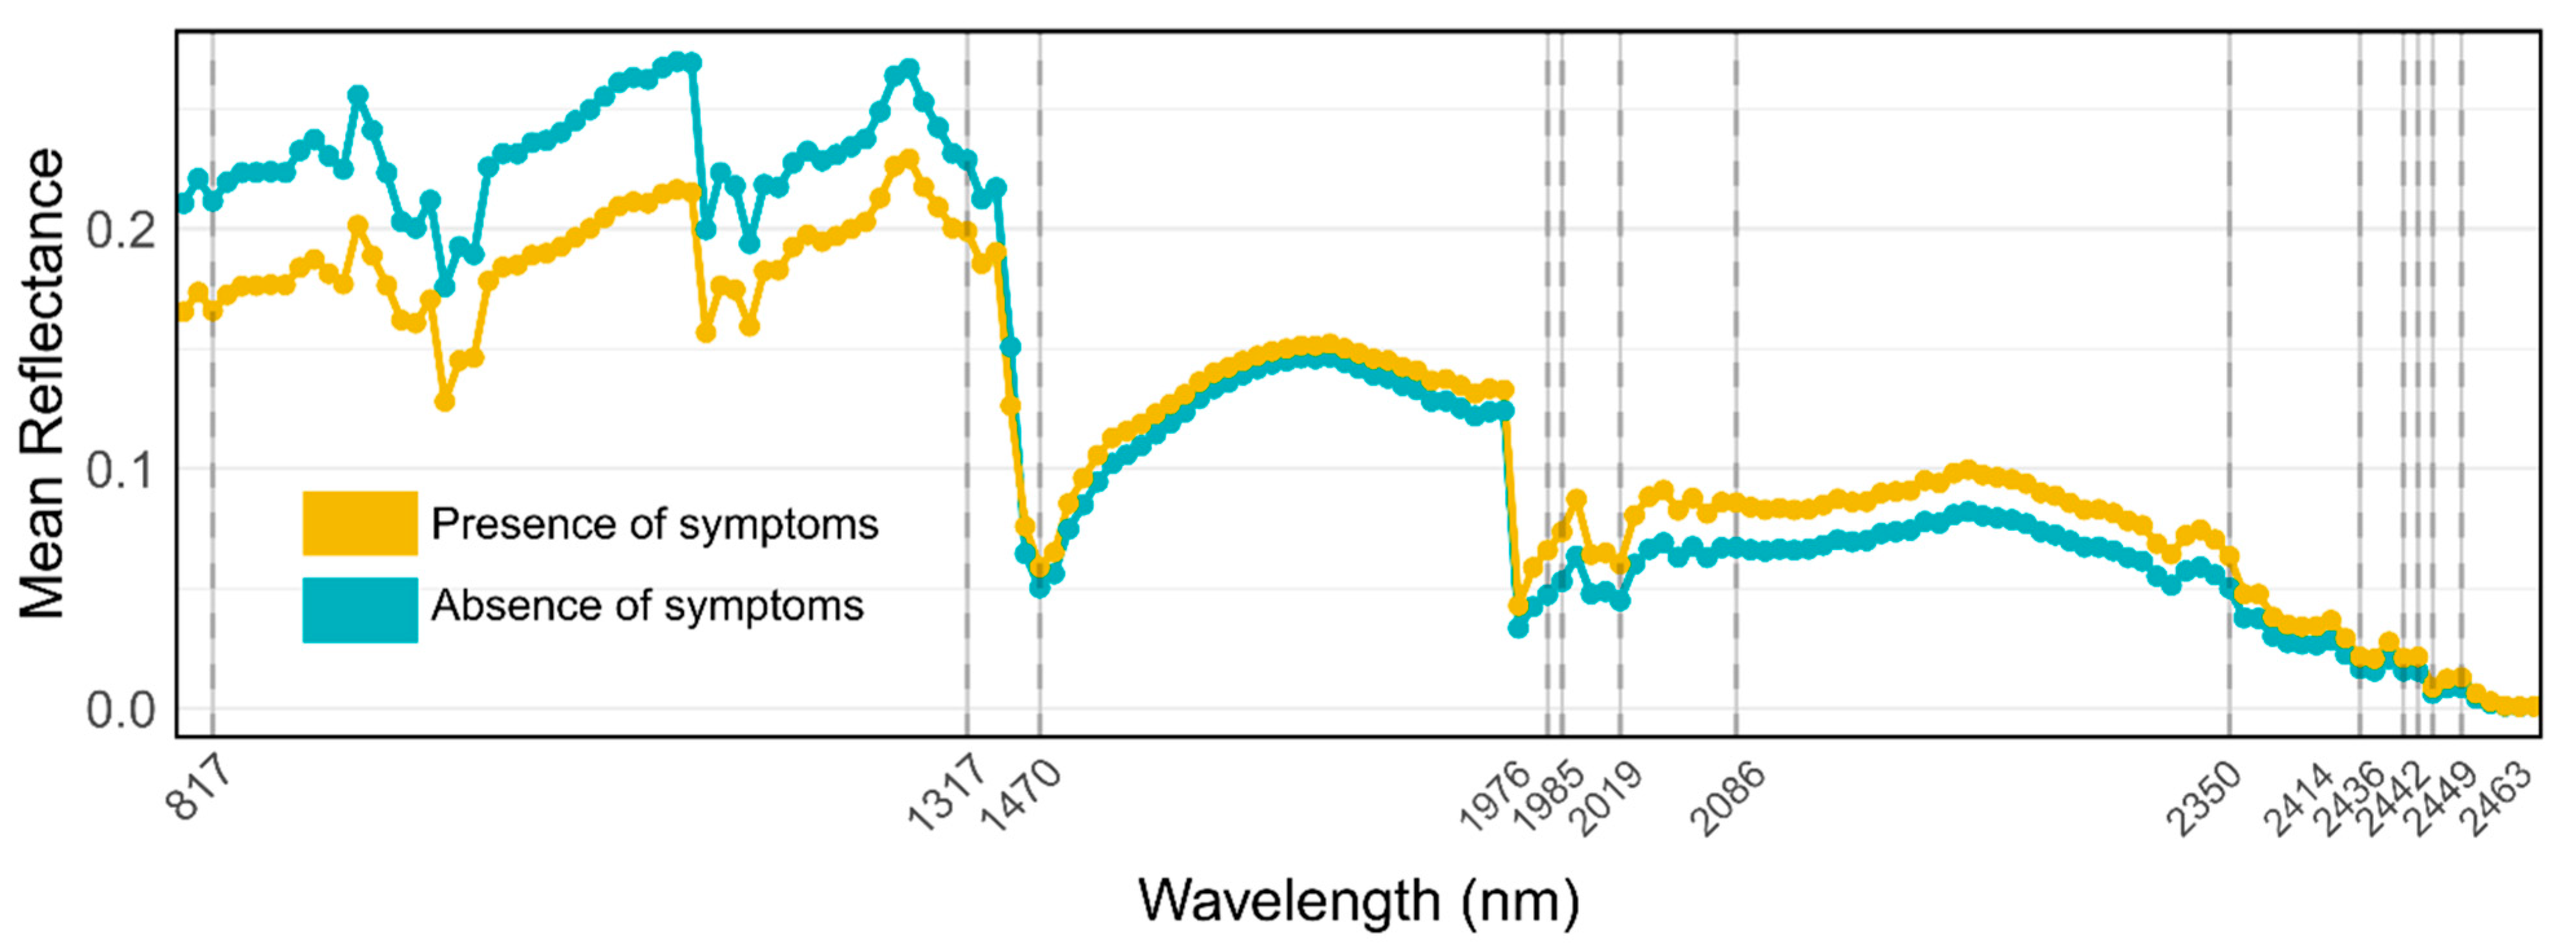
| PRISMA Band | Wavelength (nm) | Spectral Region | Average Reflectance Data | |
|---|---|---|---|---|
| Symptomatic Forest | Asymptomatic Forest | |||
| 48 | 817 | NIR | 0.161 | 0.234 |
| 105 | 1317 | NIR | 0.198 | 0.251 |
| 119 | 1470 | SWIR | 0.062 | 0.053 |
| 171 | 1976 | SWIR | 0.070 | 0.049 |
| 172 | 1985 | SWIR | 0.079 | 0.055 |
| 176 | 2019 | SWIR | 0.064 | 0.047 |
| 184 | 2086 | SWIR | 0.091 | 0.071 |
| 218 | 2350 | SWIR | 0.067 | 0.053 |
| 227 | 2414 | SWIR | 0.023 | 0.018 |
| 230 | 2436 | SWIR | 0.022 | 0.016 |
| 231 | 2442 | SWIR | 0.023 | 0.016 |
| 232 | 2449 | SWIR | 0.009 | 0.007 |
| 234 | 2463 | SWIR | 0.014 | 0.009 |
References
- Bellard, C.; Jeschke, J.M.; Leroy, B.; Mace, G.M. Insights from Modeling Studies on How Climate Change Affects Invasive Alien Species Geography. Ecol. Evol. 2018, 8, 5688–5700. [Google Scholar] [CrossRef] [PubMed]
- Pilli, R.; Vizzarri, M.; Chirici, G. Combined Effects of Natural Disturbances and Management on Forest Carbon Sequestration: The Case of Vaia Storm in Italy. Ann. For. Sci. 2021, 78, 46. [Google Scholar] [CrossRef]
- Patacca, M.; Lindner, M.; Lucas-Borja, M.E.; Cordonnier, T.; Fidej, G.; Gardiner, B.; Hauf, Y.; Jasinevičius, G.; Labonne, S.; Linkevičius, E.; et al. Significant Increase in Natural Disturbance Impacts on European Forests since 1950. Glob. Change Biol. 2023, 29, 1359–1376. [Google Scholar] [CrossRef] [PubMed]
- Usbeck, T.; Wohlgemuth, T.; Dobbertin, M.; Pfister, C.; Bürgi, A.; Rebetez, M. Increasing Storm Damage to Forests in Switzerland from 1858 to 2007. Agric. For. Meteorol. 2010, 150, 47–55. [Google Scholar] [CrossRef]
- Bascietto, M.; Bajocco, S.; Ferrara, C.; Alivernini, A.; Santangelo, E. Estimating Late Spring Frost-Induced Growth Anomalies in European Beech Forests in Italy. Int. J. Biometeorol. 2019, 63, 1039–1049. [Google Scholar] [CrossRef]
- Hentschel, K.; Borken, W.; Matzner, E. Repeated Freeze–Thaw Events Affect Leaching Losses of Nitrogen and Dissolved Organic Matter in a Forest Soil. J. Plant Nutr. Soil Sci. 2008, 171, 699–706. [Google Scholar] [CrossRef]
- Sangüesa-Barreda, G.; Di Filippo, A.; Piovesan, G.; Rozas, V.; Di Fiore, L.; García-Hidalgo, M.; García-Cervigón, A.I.; Muñoz-Garachana, D.; Baliva, M.; Olano, J.M. Warmer Springs Have Increased the Frequency and Extension of Late-Frost Defoliations in Southern European Beech Forests. Sci. Total Environ. 2021, 775, 145860. [Google Scholar] [CrossRef]
- Schuldt, B.; Buras, A.; Arend, M.; Vitasse, Y.; Beierkuhnlein, C.; Damm, A.; Gharun, M.; Grams, T.E.E.; Hauck, M.; Hajek, P.; et al. A First Assessment of the Impact of the Extreme 2018 Summer Drought on Central European Forests. Basic Appl. Ecol. 2020, 45, 86–103. [Google Scholar] [CrossRef]
- Senf, C.; Buras, A.; Zang, C.S.; Rammig, A.; Seidl, R. Excess Forest Mortality Is Consistently Linked to Drought across Europe. Nat. Commun. 2020, 11, 6200. [Google Scholar] [CrossRef]
- Haynes, K.J.; Allstadt, A.J.; Klimetzek, D. Forest Defoliator Outbreaks under Climate Change: Effects on the Frequency and Severity of Outbreaks of Five Pine Insect Pests. Glob. Change Biol. 2014, 20, 2004–2018. [Google Scholar] [CrossRef]
- Crossley, M.S.; Smith, O.M.; Barman, A.K.; Croy, J.R.; Schmidt, J.M.; Toews, M.D.; Snyder, W.E. Warmer Temperatures Trigger Insecticide-associated Pest Outbreaks. Pest Manag. Sci. 2024, 80, 1008–1015. [Google Scholar] [CrossRef] [PubMed]
- Adams, H.D.; Zeppel, M.J.B.; Anderegg, W.R.L.; Hartmann, H.; Landhäusser, S.M.; Tissue, D.T.; Huxman, T.E.; Hudson, P.J.; Franz, T.E.; Allen, C.D.; et al. A Multi-Species Synthesis of Physiological Mechanisms in Drought-Induced Tree Mortality. Nat. Ecol. Evol. 2017, 1, 1285–1291. [Google Scholar] [CrossRef] [PubMed]
- Hui, D.; Deng, Q.; Tian, H.; Luo, Y. Climate Change and Carbon Sequestration in Forest Ecosystems. In Handbook of Climate Change Mitigation and Adaptation; Chen, W.-Y., Suzuki, T., Lackner, M., Eds.; Springer: New York, NY, USA, 2015; pp. 1–40. ISBN 978-1-4614-6431-0. [Google Scholar]
- Lorenz, K.; Lal, R. Carbon Sequestration in Forest Ecosystems; Springer: Dordrecht, The Netherlands, 2010; ISBN 978-90-481-3265-2. [Google Scholar]
- Hulme, P.E.; Bacher, S.; Kenis, M.; Klotz, S.; Kühn, I.; Minchin, D.; Nentwig, W.; Olenin, S.; Panov, V.; Pergl, J.; et al. Grasping at the Routes of Biological Invasions: A Framework for Integrating Pathways into Policy. J. Appl. Ecol. 2008, 45, 403–414. [Google Scholar] [CrossRef]
- Hulme, P.E. Trade, Transport and Trouble: Managing Invasive Species Pathways in an Era of Globalization. J. Appl. Ecol. 2009, 46, 10–18. [Google Scholar] [CrossRef]
- Altieri, M.A.; Letourneau, D.K.; Risch, S.J. Vegetation Diversity and Insect Pest Outbreaks. Crit. Rev. Plant Sci. 1984, 2, 131–169. [Google Scholar] [CrossRef]
- Clarke, S.R. Pine Tortoise Scale; US Department of Agriculture, Forest Service, Pacific Northwest Region (R6): Portland, OR, USA, 2013.
- Garonna, A.P.; Scarpato, S.; Vicinanza, F.; Espinosa, B. First Report of Toumeyella parvicornis (Cockerell) in Europe (Hemiptera: Coccidae). Zootaxa 2015, 3949, 142. [Google Scholar] [CrossRef]
- EPPO Global Database. Toumeyella parvicornis (TOUMPA) Reporting Service Articles. Available online: https://gd.eppo.int/taxon/TOUMPA/reporting (accessed on 1 August 2024).
- Di Sora, N.; Contarini, M.; Rossini, L.; Turco, S.; Brugneti, F.; Metaliaj, R.; Vejsiu, I.; Peri, L.; Speranza, S. First Report of Toumeyella parvicornis (Cockerell) (Hemiptera: Coccidae) in Albania and Its Potential Spread in the Coastal Area of the Balkans. EPPO Bull. 2024, 54, 160–165. [Google Scholar] [CrossRef]
- Garonna, A.; Foscari, A.; Russo, E.; Jesu, G.; Somma, S.; Cascone, P.; Guerrieri, E. The Spread of the Non-Native Pine Tortoise Scale Toumeyella parvicornis (Hemiptera: Coccidae) in Europe: A Major Threat to Pinus Pinea in Southern Italy. iForest-Biogeosci. For. 2018, 11, 628–634. [Google Scholar] [CrossRef]
- Sciarretta, A.; Marziali, L.; Squarcini, M.; Marianelli, L.; Benassai, D.; Logli, F.; Roversi, P.F. Adaptive Management of Invasive Pests in Natural Protected Areas: The Case of Matsucoccus feytaudi in Central Italy. Bull. Entomol. Res. 2016, 106, 9–18. [Google Scholar] [CrossRef]
- Boselli, M.; Vai, N.; Mirotti, A.; Mazzini, F.; Mazzoni, F.; Mosti, M.; Foschi, S.; Scapini, C. Crisococcus Pini (Homoptera, Pseudococcidae) in Emilia Romagna: Delimitazione Dell’area Infestata e Piano Di Controllo. In Proceedings of the Atti Giornate Fitopatologiche. ATTI Giornate Fitopatol. 2018, 1, 265–272. [Google Scholar]
- Bonari, G.; Acosta, A.T.R.; Angiolini, C. EU Priority Habitats: Rethinking Mediterranean Coastal Pine Forests. Rendiconti Lincei Sci. Fis. E Nat. 2018, 29, 295–307. [Google Scholar] [CrossRef]
- Chazdon, R.L.; Brancalion, P.H.S.; Laestadius, L.; Bennett-Curry, A.; Buckingham, K.; Kumar, C.; Moll-Rocek, J.; Vieira, I.C.G.; Wilson, S.J. When Is a Forest a Forest? Forest Concepts and Definitions in the Era of Forest and Landscape Restoration. Ambio 2016, 45, 538–550. [Google Scholar] [CrossRef]
- Leone, V.; Lovreglio, R. Conservation of Mediterranean Pine Woodlands: Scenarios and Legislative Tools. Plant Ecol. 2004, 171, 221–235. [Google Scholar] [CrossRef]
- Orenstein, D.E. The Cultural Ecosystem Services of Mediterranean Pine Forests. In Pines and Their Mixed Forest Ecosystems in the Mediterranean Basin; Ne’eman, G., Osem, Y., Eds.; Springer International Publishing: Cham, Switzerland, 2021; pp. 631–655. ISBN 978-3-030-63625-8. [Google Scholar]
- Pasek, J.E. Influence of Wind and Windbreaks on Local Dispersal of Insects. Agric. Ecosyst. Environ. 1988, 22–23, 539–554. [Google Scholar] [CrossRef]
- Gullan, P.J.; Kosztarab, M. ADAPTATIONS IN SCALE INSECTS. Annu. Rev. Entomol. 1997, 42, 23–50. [Google Scholar] [CrossRef]
- Rabkin, F.B.; Lejeune, R.R. Some Aspects of the Biology and Dispersal of the Pine Tortoise Scale, Toumeyella numismaticum (Pettit and McDaniel) (Homoptera: Coccidae). Can. Entomol. 1954, 86, 570–575. [Google Scholar] [CrossRef]
- Malumphy, C.; Hamilton, M.A.; Sanchez, M.D.; Green, P.W.C. Trapping Confirms Aerial Recruitment of Pine Tortoise Scale (Toumeyella parvicornis (Cockerell)) (Hemiptera: Coccidae) in the Turks and Caicos Islands. Entomol. Mon. Mag. 2016, 152, 193–200. [Google Scholar]
- Duarte, A.; Borralho, N.; Cabral, P.; Caetano, M. Recent Advances in Forest Insect Pests and Diseases Monitoring Using UAV-Based Data: A Systematic Review. Forests 2022, 13, 911. [Google Scholar] [CrossRef]
- Mngadi, M.; Germishuizen, I.; Mutanga, O.; Naicker, R.; Maes, W.H.; Odebiri, O.; Schroder, M. A Systematic Review of the Application of Remote Sensing Technologies in Mapping Forest Insect Pests and Diseases at a Tree-Level. Remote Sens. Appl. Soc. Environ. 2024, 36, 101341. [Google Scholar] [CrossRef]
- Kautz, M.; Dworschak, K.; Gruppe, A.; Schopf, R. Quantifying Spatio-Temporal Dispersion of Bark Beetle Infestations in Epidemic and Non-Epidemic Conditions. For. Ecol. Manag. 2011, 262, 598–608. [Google Scholar] [CrossRef]
- Gordo, O.; Sanz, J.J. Long-Term Temporal Changes of Plant Phenology in the Western Mediterranean. Glob. Change Biol. 2009, 15, 1930–1948. [Google Scholar] [CrossRef]
- Fischbein, D.; Corley, J.C. Population Ecology and Classical Biological Control of Forest Insect Pests in a Changing World. For. Ecol. Manag. 2022, 520, 120400. [Google Scholar] [CrossRef]
- Ge, Y.; Atefi, A.; Zhang, H.; Miao, C.; Ramamurthy, R.K.; Sigmon, B.; Yang, J.; Schnable, J.C. High-Throughput Analysis of Leaf Physiological and Chemical Traits with VIS–NIR–SWIR Spectroscopy: A Case Study with a Maize Diversity Panel. Plant Methods 2019, 15, 66. [Google Scholar] [CrossRef]
- Homolová, L.; Malenovský, Z.; Clevers, J.G.P.W.; García-Santos, G.; Schaepman, M.E. Review of Optical-Based Remote Sensing for Plant Trait Mapping. Ecol. Complex. 2013, 15, 1–16. [Google Scholar] [CrossRef]
- Ensminger, I. Fast Track Diagnostics: Hyperspectral Reflectance Differentiates Disease from Drought Stress in Trees. Tree Physiol. 2020, 40, 1143–1146. [Google Scholar] [CrossRef] [PubMed]
- Ollinger, S.V. Sources of Variability in Canopy Reflectance and the Convergent Properties of Plants. New Phytol. 2011, 189, 375–394. [Google Scholar] [CrossRef]
- Francini, S.; Chirici, G. A Sentinel-2 Derived Dataset of Forest Disturbances Occurred in Italy between 2017 and 2020. Data Brief 2022, 42, 108297. [Google Scholar] [CrossRef]
- Guarini, R.; Loizzo, R.; Longo, F.; Mari, S.; Scopa, T.; Varacalli, G. Overview of the Prisma Space and Ground Segment and Its Hyperspectral Products. In Proceedings of the 2017 IEEE International Geoscience and Remote Sensing Symposium (IGARSS), Fort Worth, TX, USA, 23–28 July 2017; pp. 431–434. [Google Scholar]
- Storch, T.; Honold, H.-P.; Chabrillat, S.; Habermeyer, M.; Tucker, P.; Brell, M.; Ohndorf, A.; Wirth, K.; Betz, M.; Kuchler, M.; et al. The EnMAP Imaging Spectroscopy Mission towards Operations. Remote Sens. Environ. 2023, 294, 113632. [Google Scholar] [CrossRef]
- Guanter, L.; Kaufmann, H.; Segl, K.; Foerster, S.; Rogass, C.; Chabrillat, S.; Kuester, T.; Hollstein, A.; Rossner, G.; Chlebek, C.; et al. The EnMAP Spaceborne Imaging Spectroscopy Mission for Earth Observation. Remote Sens. 2015, 7, 8830–8857. [Google Scholar] [CrossRef]
- Coppo, P.; Brandani, F.; Faraci, M.; Sarti, F.; Dami, M.; Chiarantini, L.; Ponticelli, B.; Giunti, L.; Fossati, E.; Cosi, M. Leonardo Spaceborne Infrared Payloads for Earth Observation: SLSTRs for Copernicus Sentinel 3 and PRISMA Hyperspectral Camera for PRISMA Satellite. Appl. Opt. 2020, 59, 6888. [Google Scholar] [CrossRef]
- Fares, S.; Mereu, S.; Mugnozza, G.S.; Vitale, M.; Manes, F.; Frattoni, M.; Ciccioli, P.; Gerosa, G.; Loreto, F. The ACCENT-VOCBAS Field Campaign on Biosphere-Atmosphere Interactions in a Mediterranean Ecosystem of Castelporziano (Rome): Site Characteristics, Climatic and Meteorological Conditions, and Eco-Physiology of Vegetation. Biogeosciences 2009, 6, 1043–1058. [Google Scholar] [CrossRef]
- Gratani, L.; Bonito, A.; Crescente, M.F.; Catoni, R.; Varone, L.; Tinelli, A. The Use of Maps as a Monitoring Tool of Protected Area Management. Rend. Lincei 2015, 26, 325–335. [Google Scholar] [CrossRef]
- Bonari, G.; Těšitel, J.; Migliorini, M.; Angiolini, C.; Protano, G.; Nannoni, F.; Schlaghamerský, J.; Chytrý, M. Conservation of the Mediterranean Coastal Pine Woodlands: How Can Management Support Biodiversity? For. Ecol. Manag. 2019, 443, 28–35. [Google Scholar] [CrossRef]
- Chirici, G. Detection of Toumeyella parvicornis Infestation Hotspot by High-Resolution Remote Sensing in the Casteporziano Presidential Estate. Unpublished Data. 2024. [Google Scholar]
- Drusch, M.; Del Bello, U.; Carlier, S.; Colin, O.; Fernandez, V.; Gascon, F.; Hoersch, B.; Isola, C.; Laberinti, P.; Martimort, P.; et al. Sentinel-2: ESA’s Optical High-Resolution Mission for GMES Operational Services. Remote Sens. Environ. 2012, 120, 25–36. [Google Scholar] [CrossRef]
- Gorelick, N.; Hancher, M.; Dixon, M.; Ilyushchenko, S.; Thau, D.; Moore, R. Google Earth Engine: Planetary-Scale Geospatial Analysis for Everyone. Remote Sens. Environ. 2017, 202, 18–27. [Google Scholar] [CrossRef]
- Sheykhmousa, M.; Mahdianpari, M.; Ghanbari, H.; Mohammadimanesh, F.; Ghamisi, P.; Homayouni, S. Support Vector Machine Versus Random Forest for Remote Sensing Image Classification: A Meta-Analysis and Systematic Review. IEEE J. Sel. Top. Appl. Earth Obs. Remote Sens. 2020, 13, 6308–6325. [Google Scholar] [CrossRef]
- Rousset, F.; Ferdy, J. Testing Environmental and Genetic Effects in the Presence of Spatial Autocorrelation. Ecography 2014, 37, 781–790. [Google Scholar] [CrossRef]
- Breslow, N.E.; Clayton, D.G. Approximate Inference in Generalized Linear Mixed Models. J. Am. Stat. Assoc. 1993, 88, 9–25. [Google Scholar] [CrossRef]
- Magee, L. R2 Measures Based on Wald and Likelihood Ratio Joint Significance Tests. Am. Stat. 1990, 44, 250–253. [Google Scholar] [CrossRef]
- EFSA Panel on Plant Health (PLH); Bragard, C.; Baptista, P.; Chatzivassiliou, E.; Di Serio, F.; Gonthier, P.; Jaques Miret, J.A.; Fejer Justesen, A.; Magnusson, C.S.; Milonas, P.; et al. Pest Categorisation of Toumeyella parvaicornis. EFSA J. 2022, 20, e07146. [Google Scholar] [CrossRef]
- Hommay, G.; Wiss, L.; Chadoeuf, J.; Le Maguet, J.; Beuve, M.; Herrbach, E. Gone with the Wind: Aerial Dispersal of Parthenolecanium Corni Crawlers in a Newly Planted Grapevine Plot. Ann. Appl. Biol. 2019, 174, 372–387. [Google Scholar] [CrossRef]
- Grace, J.; Nichol, C.; Disney, M.; Lewis, P.; Quaife, T.; Bowyer, P. Can We Measure Terrestrial Photosynthesis from Space Directly, Using Spectral Reflectance and Fluorescence? Glob. Change Biol. 2007, 13, 1484–1497. [Google Scholar] [CrossRef]
- Peddle, D.R.; Peter White, H.; Soffer, R.J.; Miller, J.R.; LeDrew, E.F. Reflectance Processing of Remote Sensing Spectroradiometer Data. Comput. Geosci. 2001, 27, 203–213. [Google Scholar] [CrossRef]
- Xue, J.; Su, B. Significant Remote Sensing Vegetation Indices: A Review of Developments and Applications. J. Sens. 2017, 2017, 1353691. [Google Scholar] [CrossRef]
- Badgley, G.; Anderegg, L.D.L.; Berry, J.A.; Field, C.B. Terrestrial Gross Primary Production: Using NIRV to Scale from Site to Globe. Glob. Change Biol. 2019, 25, 3731–3740. [Google Scholar] [CrossRef]
- Badgley, G.; Field, C.B.; Berry, J.A. Canopy Near-Infrared Reflectance and Terrestrial Photosynthesis. Sci. Adv. 2017, 3, e1602244. [Google Scholar] [CrossRef] [PubMed]
- Kaufman, Y.J.; Tanre, D. Atmospherically Resistant Vegetation Index (ARVI) for EOS-MODIS. IEEE Trans. Geosci. Remote Sens. 1992, 30, 261–270. [Google Scholar] [CrossRef]
- Niccoli, F.; Kabala, J.P.; Altieri, S.; Faugno, S.; Battipaglia, G. Impact of Toumeyella parvicornis Outbreak in Pinus Pinea L. Forest of Southern Italy: First Detection Using a Dendrochronological, Isotopic and Remote Sensing Analysis. For. Ecol. Manag. 2024, 566, 122086. [Google Scholar] [CrossRef]
- Nicoletti, R.; De Masi, L.; Migliozzi, A.; Calandrelli, M.M. Analysis of Dieback in a Coastal Pinewood in Campania, Southern Italy, through High-Resolution Remote Sensing. Plants 2024, 13, 182. [Google Scholar] [CrossRef]
- Vangi, E.; D’Amico, G.; Francini, S.; Giannetti, F.; Lasserre, B.; Marchetti, M.; Chirici, G. The New Hyperspectral Satellite PRISMA: Imagery for Forest Types Discrimination. Sensors 2021, 21, 1182. [Google Scholar] [CrossRef]
- Lazzeri, G.; Frodella, W.; Rossi, G.; Moretti, S. Multitemporal Mapping of Post-Fire Land Cover Using Multiplatform PRISMA Hyperspectral and Sentinel-UAV Multispectral Data: Insights from Case Studies in Portugal and Italy. Sensors 2021, 21, 3982. [Google Scholar] [CrossRef]
- Bozzini, A.; Brugnaro, S.; Morgante, G.; Santoiemma, G.; Deganutti, L.; Finozzi, V.; Battisti, A.; Faccoli, M. Drone-Based Early Detection of Bark Beetle Infested Spruce Trees Differs in Endemic and Epidemic Populations. Front. For. Glob. Change 2024, 7, 1385687. [Google Scholar] [CrossRef]
- Shaik, R.U.; Periasamy, S.; Zeng, W. Potential Assessment of PRISMA Hyperspectral Imagery for Remote Sensing Applications. Remote Sens. 2023, 15, 1378. [Google Scholar] [CrossRef]
- Orusa, T.; Viani, A.; Borgogno-Mondino, E. IRIDE, the Euro-Italian Earth Observation Program: Overview, Current Progress, Global Expectations, and Recommendations. Environ. Sci. Proc. 2024, 29, 74. [Google Scholar] [CrossRef]
- Celesti, M.; Rast, M.; Adams, J.; Boccia, V.; Gascon, F.; Isola, C.; Nieke, J. The Copernicus Hyperspectral Imaging Mission for the Environment (Chime): Status and Planning. In Proceedings of the IGARSS 2022—2022 IEEE International Geoscience and Remote Sensing Symposium, Kuala Lumpur, Malaysia, 17 July 2022; IEEE: Piscataway, NJ, USA; pp. 5011–5014. [Google Scholar]
- Watanabe, M.; Koyama, C.N.; Hayashi, M.; Nagatani, I.; Tadono, T.; Shimada, M. Refined Algorithm for Forest Early Warning System with ALOS-2/PALSAR-2 ScanSAR Data in Tropical Forest Regions. Remote Sens. Environ. 2021, 265, 112643. [Google Scholar] [CrossRef]
- Minařík, R.; Langhammer, J.; Lendzioch, T. Detection of Bark Beetle Disturbance at Tree Level Using UAS Multispectral Imagery and Deep Learning. Remote Sens. 2021, 13, 4768. [Google Scholar] [CrossRef]
- Ranson, M.; Kousky, C.; Ruth, M.; Jantarasami, L.; Crimmins, A.; Tarquinio, L. Tropical and Extratropical Cyclone Damages under Climate Change. Clim. Change 2014, 127, 227–241. [Google Scholar] [CrossRef]
| UAs | Predicted Symptom Condition | ||||
|---|---|---|---|---|---|
| Total | Absence | Presence | |||
| 91% | 48 | 4 | 44 | Presence | Actual symptom condition |
| 82% | 62 | 51 | 11 | Absence | |
| 110 | 54 | 56 | Total | ||
| ACC: 87% K: 0.72 | 92% | 80% | PAs | ||
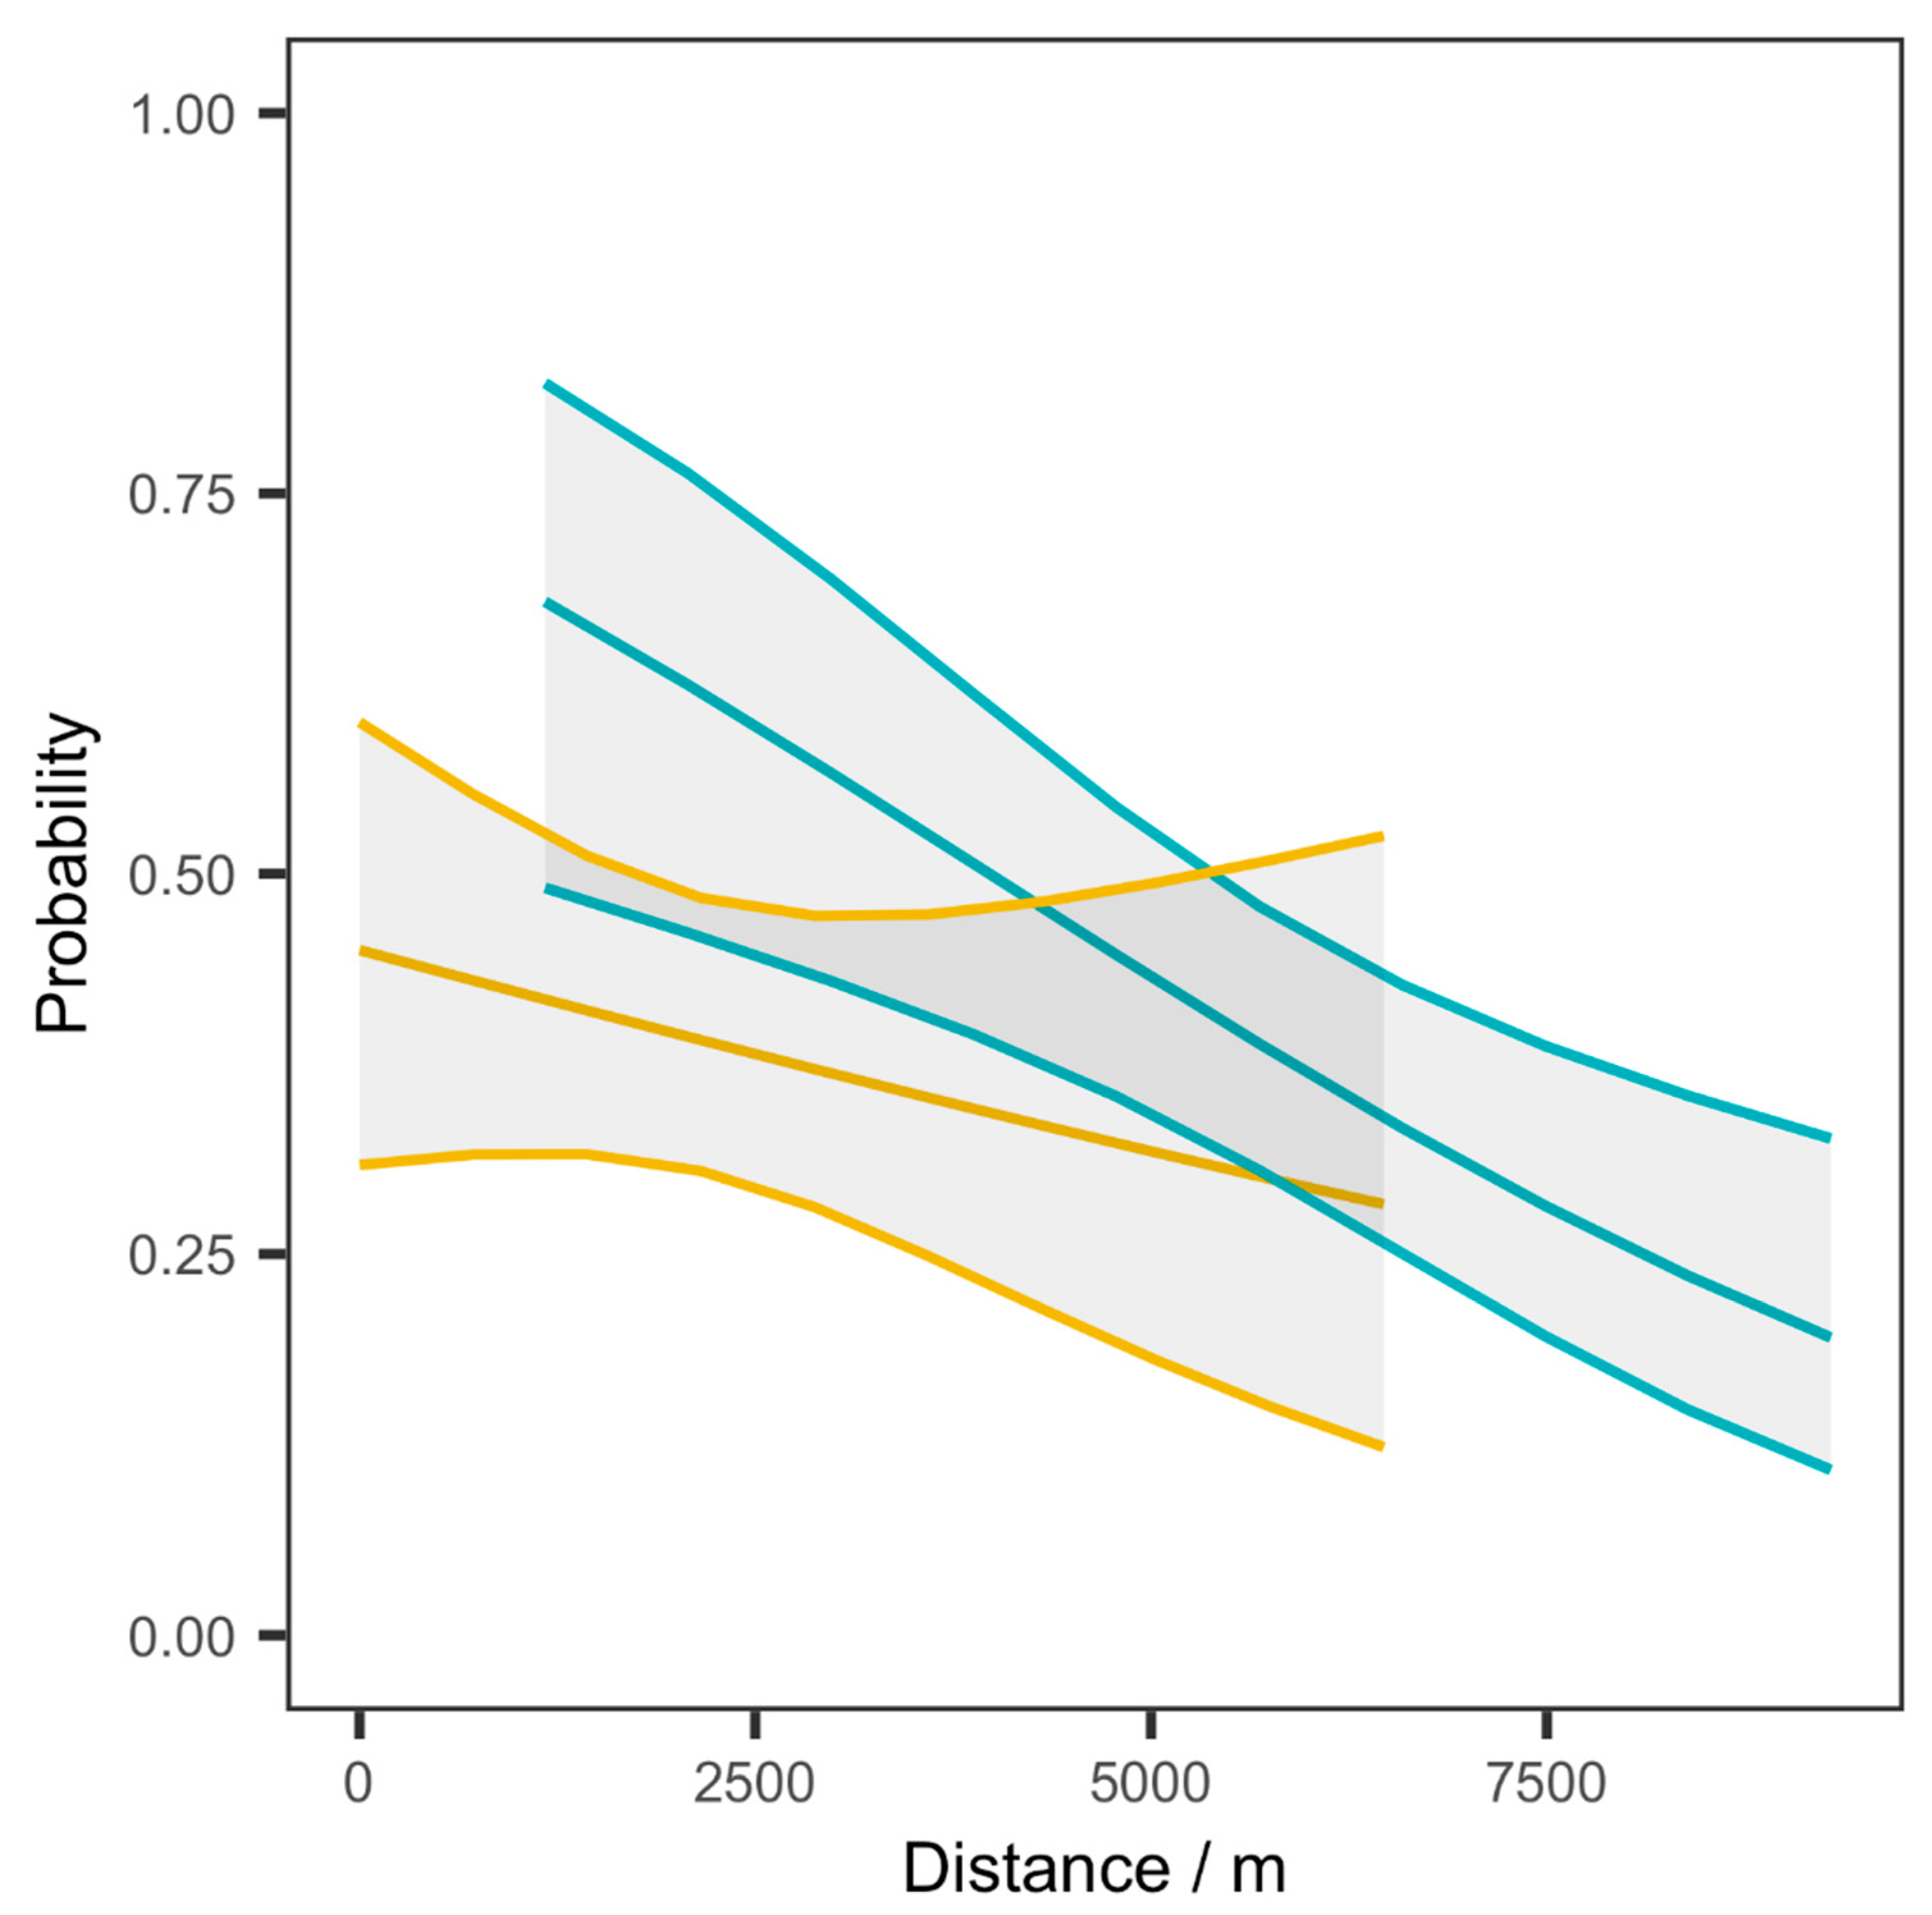
| UDM | PWDM | |
|---|---|---|
| Distance effect coefficient | ||
| Estimate | −0.267 | −0.113 |
| 95% confidence interval | −0.571–0.037 | −0.539–0.313 |
| t-value | −1.75 | −0.529 |
| Model efficiency | ||
| Coefficient of determination | 0.219 | 0.216 |
Disclaimer/Publisher’s Note: The statements, opinions and data contained in all publications are solely those of the individual author(s) and contributor(s) and not of MDPI and/or the editor(s). MDPI and/or the editor(s) disclaim responsibility for any injury to people or property resulting from any ideas, methods, instructions or products referred to in the content. |
© 2025 by the authors. Licensee MDPI, Basel, Switzerland. This article is an open access article distributed under the terms and conditions of the Creative Commons Attribution (CC BY) license (https://creativecommons.org/licenses/by/4.0/).
Share and Cite
Bascietto, M.; Chirici, G.; Mastrogregori, E.; Oreti, L.; Palma, A.; Tiberini, A.; Bertin, S. Detecting Symptoms and Dispersal of Pine Tortoise Scale Pest in an Urban Forest by Remote Sensing. Land 2025, 14, 630. https://doi.org/10.3390/land14030630
Bascietto M, Chirici G, Mastrogregori E, Oreti L, Palma A, Tiberini A, Bertin S. Detecting Symptoms and Dispersal of Pine Tortoise Scale Pest in an Urban Forest by Remote Sensing. Land. 2025; 14(3):630. https://doi.org/10.3390/land14030630
Chicago/Turabian StyleBascietto, Marco, Gherardo Chirici, Emma Mastrogregori, Loredana Oreti, Adriano Palma, Antonio Tiberini, and Sabrina Bertin. 2025. "Detecting Symptoms and Dispersal of Pine Tortoise Scale Pest in an Urban Forest by Remote Sensing" Land 14, no. 3: 630. https://doi.org/10.3390/land14030630
APA StyleBascietto, M., Chirici, G., Mastrogregori, E., Oreti, L., Palma, A., Tiberini, A., & Bertin, S. (2025). Detecting Symptoms and Dispersal of Pine Tortoise Scale Pest in an Urban Forest by Remote Sensing. Land, 14(3), 630. https://doi.org/10.3390/land14030630