
Migration and Accumulation Mechanisms of Heavy Metals in Soil from Maoniuping Rare Earth Elements Mining, Southwest China
 ,
,
Abstract
1. Introduction

| Deposits | Locations | Pollutants | Environmental Consequences | References |
|---|---|---|---|---|
| Bayan Obo REE mine | Inner Mongolia, China. | Polymetallic contamination. | Topsoil was affected by waste rock and tailings, with the Cd exhibiting 9.18 times higher than the control value. | [1] |
| Bayan Obo REE mine | Inner Mongolia, China. | REE, Cd, Pb, and Ag. | Multiple heavy metals have reached concerning levels of pollution, with REE posing the most significant threat. | [2] |
| Bayan Obo REE mine | Inner Mongolia, China. | REE. | The elemental pollution level in dust has reached severe or extreme pollution. | [11,12] |
| Bayan Obo REE mine | Inner Mongolia, China. | REE, Mn, Zn, Co, and Ni. | Groundwater pollution is mainly caused by high concentrations of heavy metals and REE, while surface water is polluted by high concentrations of REE and ammonia nitrogen. | [16] |
| IAT-Res mine | Jiangxi Province, China. | Pb, Zn, Ni, Mn, and Co. | Topsoil metals exceed the background reference for the province. | [3] |
| IAT-Res mine | Northern Guangdong Province, China. | Mn, Zn, Cd, and Pb. | Cd and Mn identified as the primary contaminants. | [23] |
| IAT-Res mine | Dingnan County, Ganzhou City. | Ce and Eu. | Contamination mainly coming from abandoned tailings. | [17] |
| IAT-Res mine | Dingnan County, Ganzhou City. | Pb. | The abandoned mine site and the surrounding soils are heavily contaminated with Pb. | [21] |
| IAT-Res mine | Dingnan and Longnan Counties, China. | REE, ammonium, and sulfates, etc. | The lower concentrations of REE were dozens of times higher than control point. | [15] |
| IAT-Res mine | Changting County, Fujian Province, China. | REE. | Mean value reaches 255.34 mg/kg, which accumulated from hilly areas to rice fields in the watershed. | [24]. |
| IAT-Res mine | Changting County, Fujian Province, China. | Cd, Cu, and As. | The average value of Cd is 3.51, exceeding the standard by 10.7 times, and the soil environment is generally in the intensity of ecological risk. | [22] |
| IAT-Res mine | Liancheng County, Fujian Province, China. | REE. | The range of REE of the Downstream soil was 727.96 mg/kg, which was 3.26 times of the background value of Fujian Province and posed a strong ecological risk. | [19] |
| Xinlong REE mine | Anyuan County, Jiangxi Province, China. | Total nitrogen, Mn, and REE. | Wate bodies exhibited elevated levels of total N, Mn, and REE. Mining caused 88% of pond and stream water unsuitable for agricultural purposes. | [25] |
| WCED-REO mine | Longnan County, Jiangxi Province, China. | Ammonia nitrogen pollution. | Soil acidification is severe, and the ammonia–nitrogen content in deep soil is 12~40 times higher than the soil background level. | [14] |
| Nuodong REE mine | Wuzhou City, Guangxi Province, China. | Ammonia-nitrogen pollutant. | The highest ammonia nitrogen pollutant in the monitoring area can reach 139.15 mg/L, with a cumulative pollution area of 1.95 km2. The water quality of streams and reservoirs has been seriously affected. | [26] |
| Wenfang REE mine | Liancheng County, Fujian Province, China. | Ammonia-nitrogen pollutant. | Significant increase in total nitrogen contents in the surface soil and water around the mining area, posing ecological risks. | [27] |
| 815# REE mine | Heping County, Guangdong Province, China. | Soil destruction and waste. | Exposed soil turned into a sandy landfill, causing soil destruction and waste, and preventing plants from growing. | [8] |
| - | Southern Jiangxi Province, China. | Land degradation. | Between 1988 and 2010, REE mining degraded 4281.8 hectares of land, with 2416.6 hectares severely impacted. | [28] |
| REE mine | Irma and Lovozero Rivers, Russia. | REE. | Average values reached 561 and 736 mg/kg, respectively. | [18] |
| Mountain Pass REE mine | California, USA. | Radioactive contamination. | Over 60 wastewater leakage incidents occurred between 1984 and 1998, releasing over 600,000 gallons of wastewater. | [20] |
2. Regional Setting and Method
2.1. Maoniuping REE Deposit and Mining History
2.2. Nanhe Basin
2.3. Sample Collection and Analysis
| Attributes | Description | Sources |
|---|---|---|
| Topsoil | Mixed soil samples (0~20 cm) of arable land in the Nanhe Basin were collected and analyzed for pH, Cd, Pb, Cr, Cu, Ni, Zn, Hg, and As, performing national standards [45]. Soil type is predominantly Anthrosols. | Field investigation in the Nanhe Basin. |
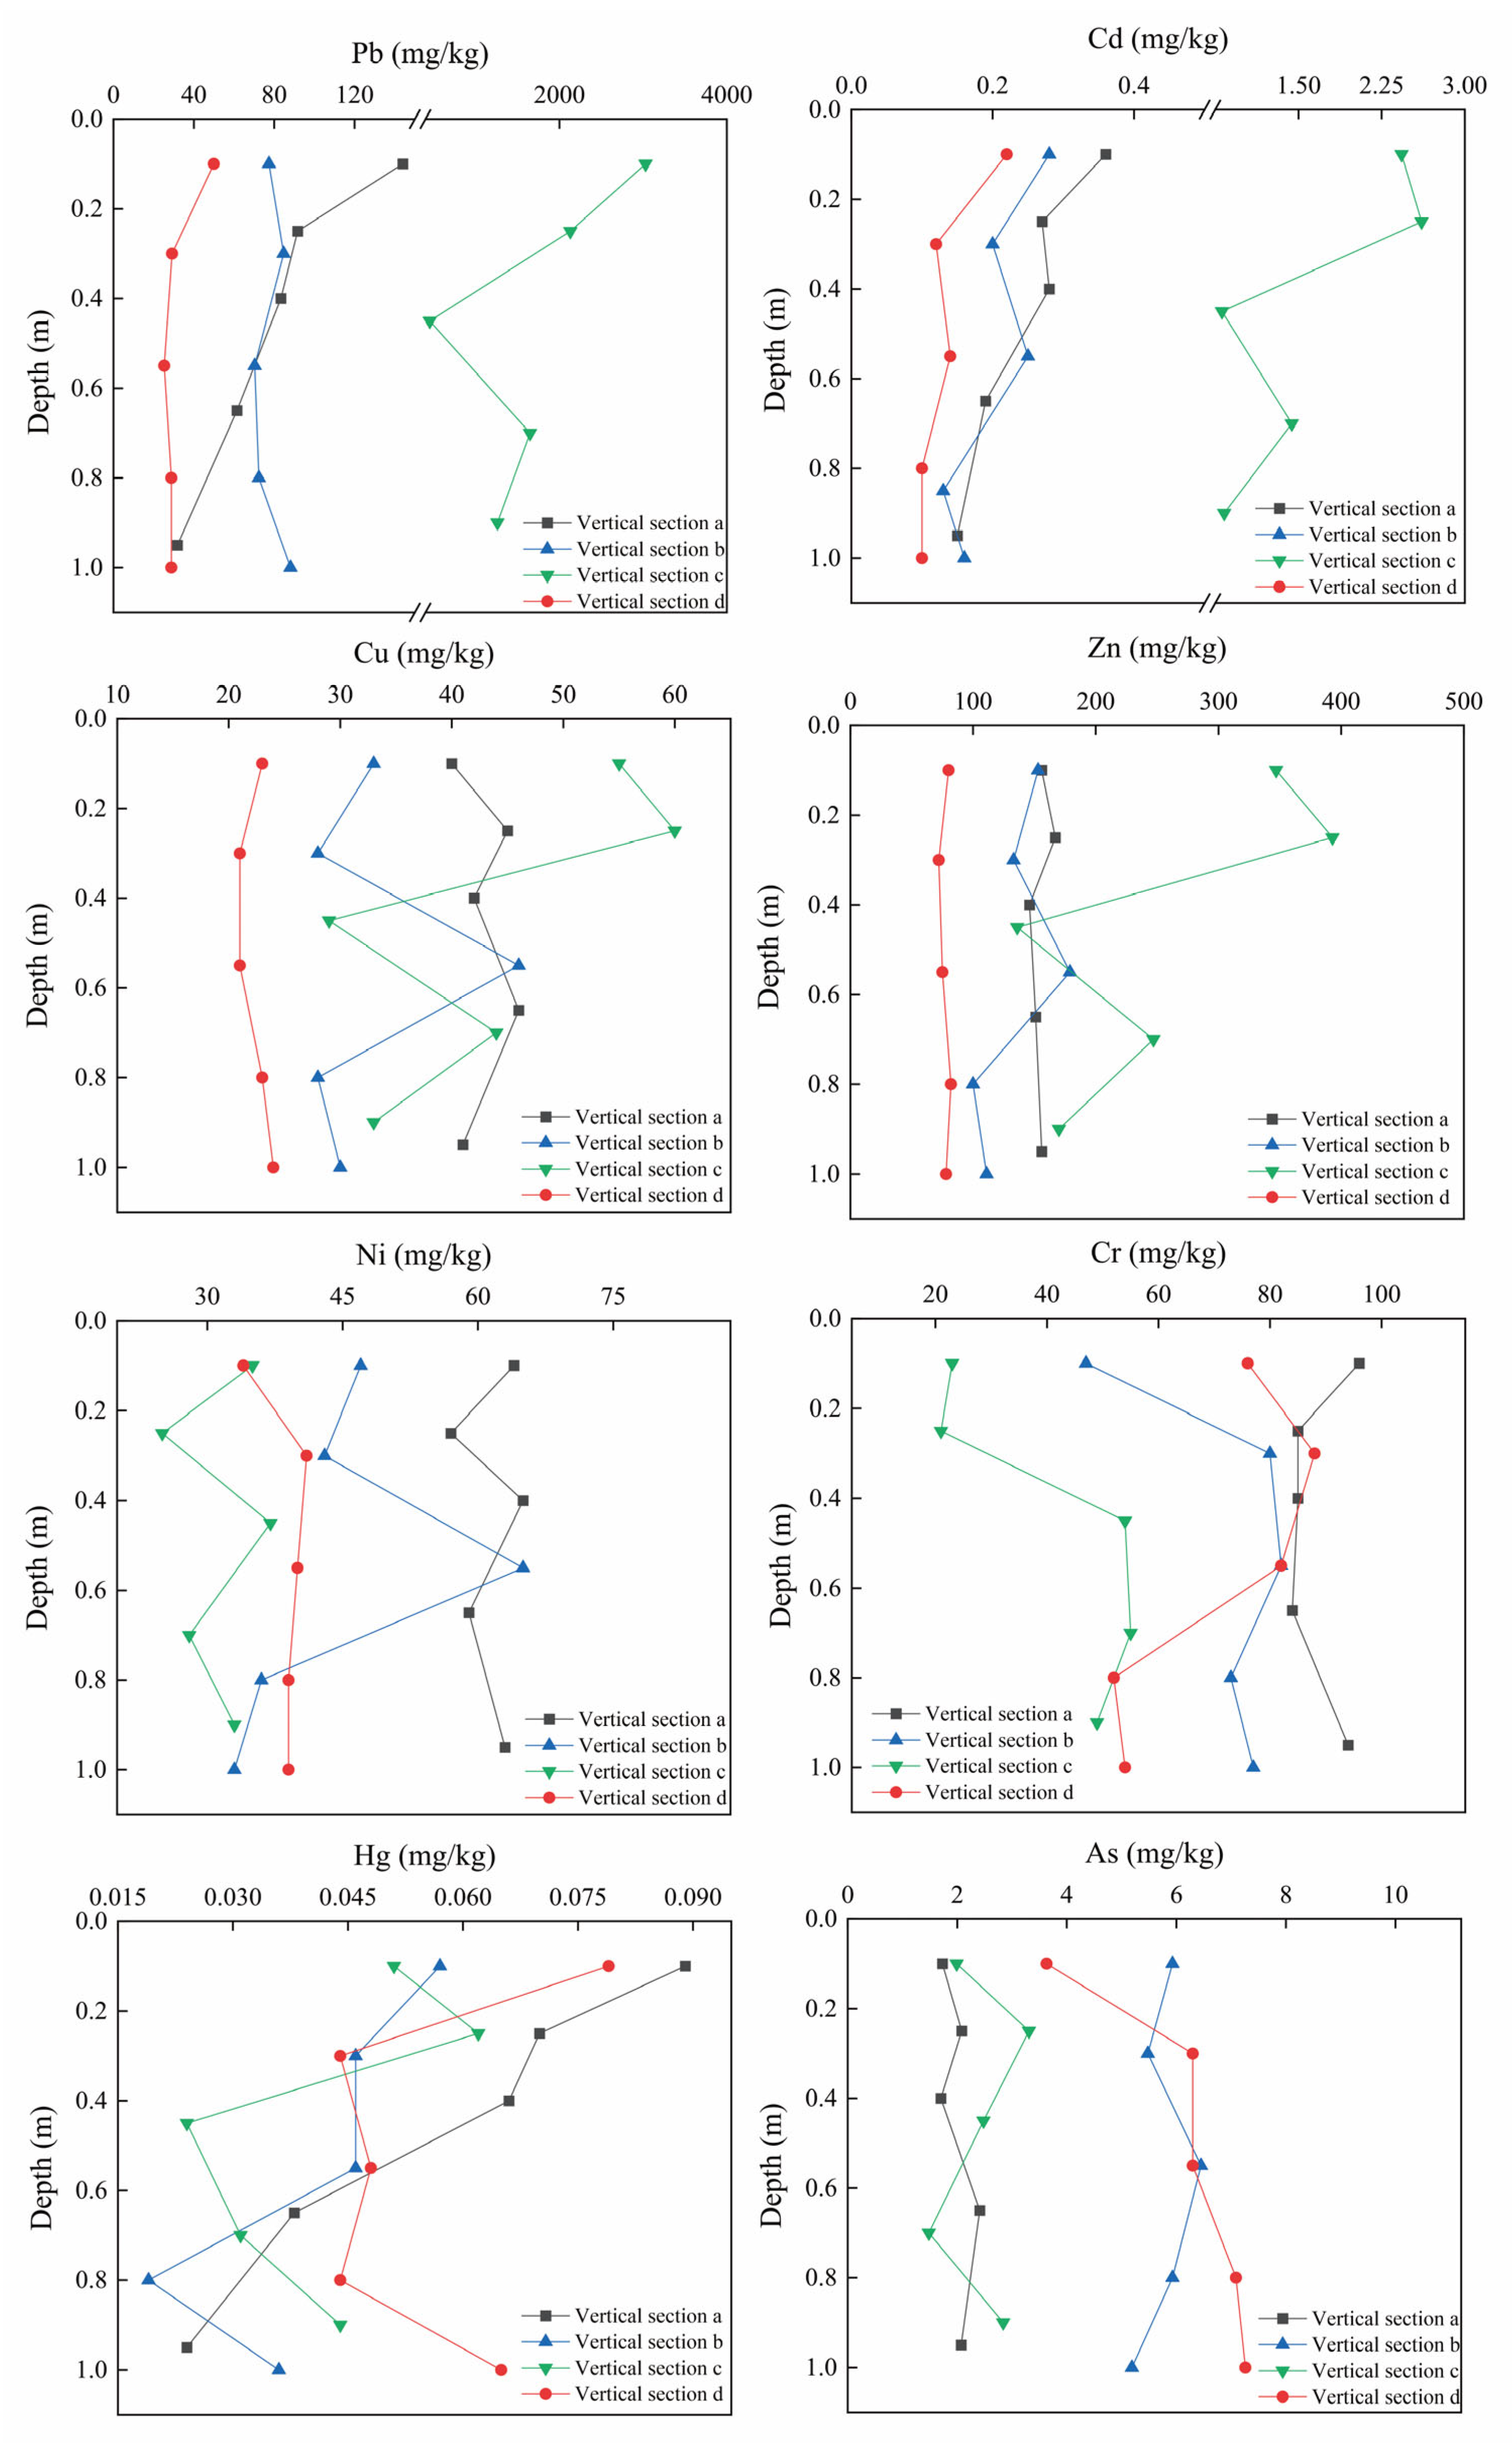
| Vertical soil section | Samples (vertical soil section a, b, c, and d) were collected from the bottom to the surface at a depth of ~1 m, 10–30 cm intervals. The four vertical soil sections are positioned at ~4.4, ~6.09, ~7.10, and ~10.79 km from the Maoniuping REE deposit, respectively. | |
| Elevation, slope, and slope direction | The Digital Elevation Model (DEM) was derived from the aerial dataset. The slope and slope direction are extrapolated from the DEM dataset. | Shuttle Radar Topography Mission [46], the most complete and highest-resolution DEM. The 2000 Project was a joint endeavor of NASA, the National Geospatial-Intelligence Agency, and the German and Italian Space Agencies [47]. |
| River | The Nanhe Basin consists of the main river channel, tributary streams, and both natural and artificial canals. | Field survey and mapping from remote sensing images. |
| Mine area | The land occupation of Maoniuping REE Mine (~5.80 km2). | |
| Tailings ponds | The mineral dressing residue in the Maoniuping REE mine comprises four non-standard waste dumps (28°24′36″ N; 102°00′37″ E) and one tailings pond (Figure 1, 28°26′36″ N, 102°00′57″ E). | |
| REE smelter | Metallurgy and ancillary facilities for concentrates of REE minerals (28°32′4″ N, 102°9′0″ E). | |
| Stratum | Pleistocene and Holocene sedimentary strata, intrusive rocks of the Yanshanian period in the Nanhe Basin | Manual extraction of 250,000 geological maps from the National Basic Geographic Information Database, China. |
2.4. Kriging Interpolation
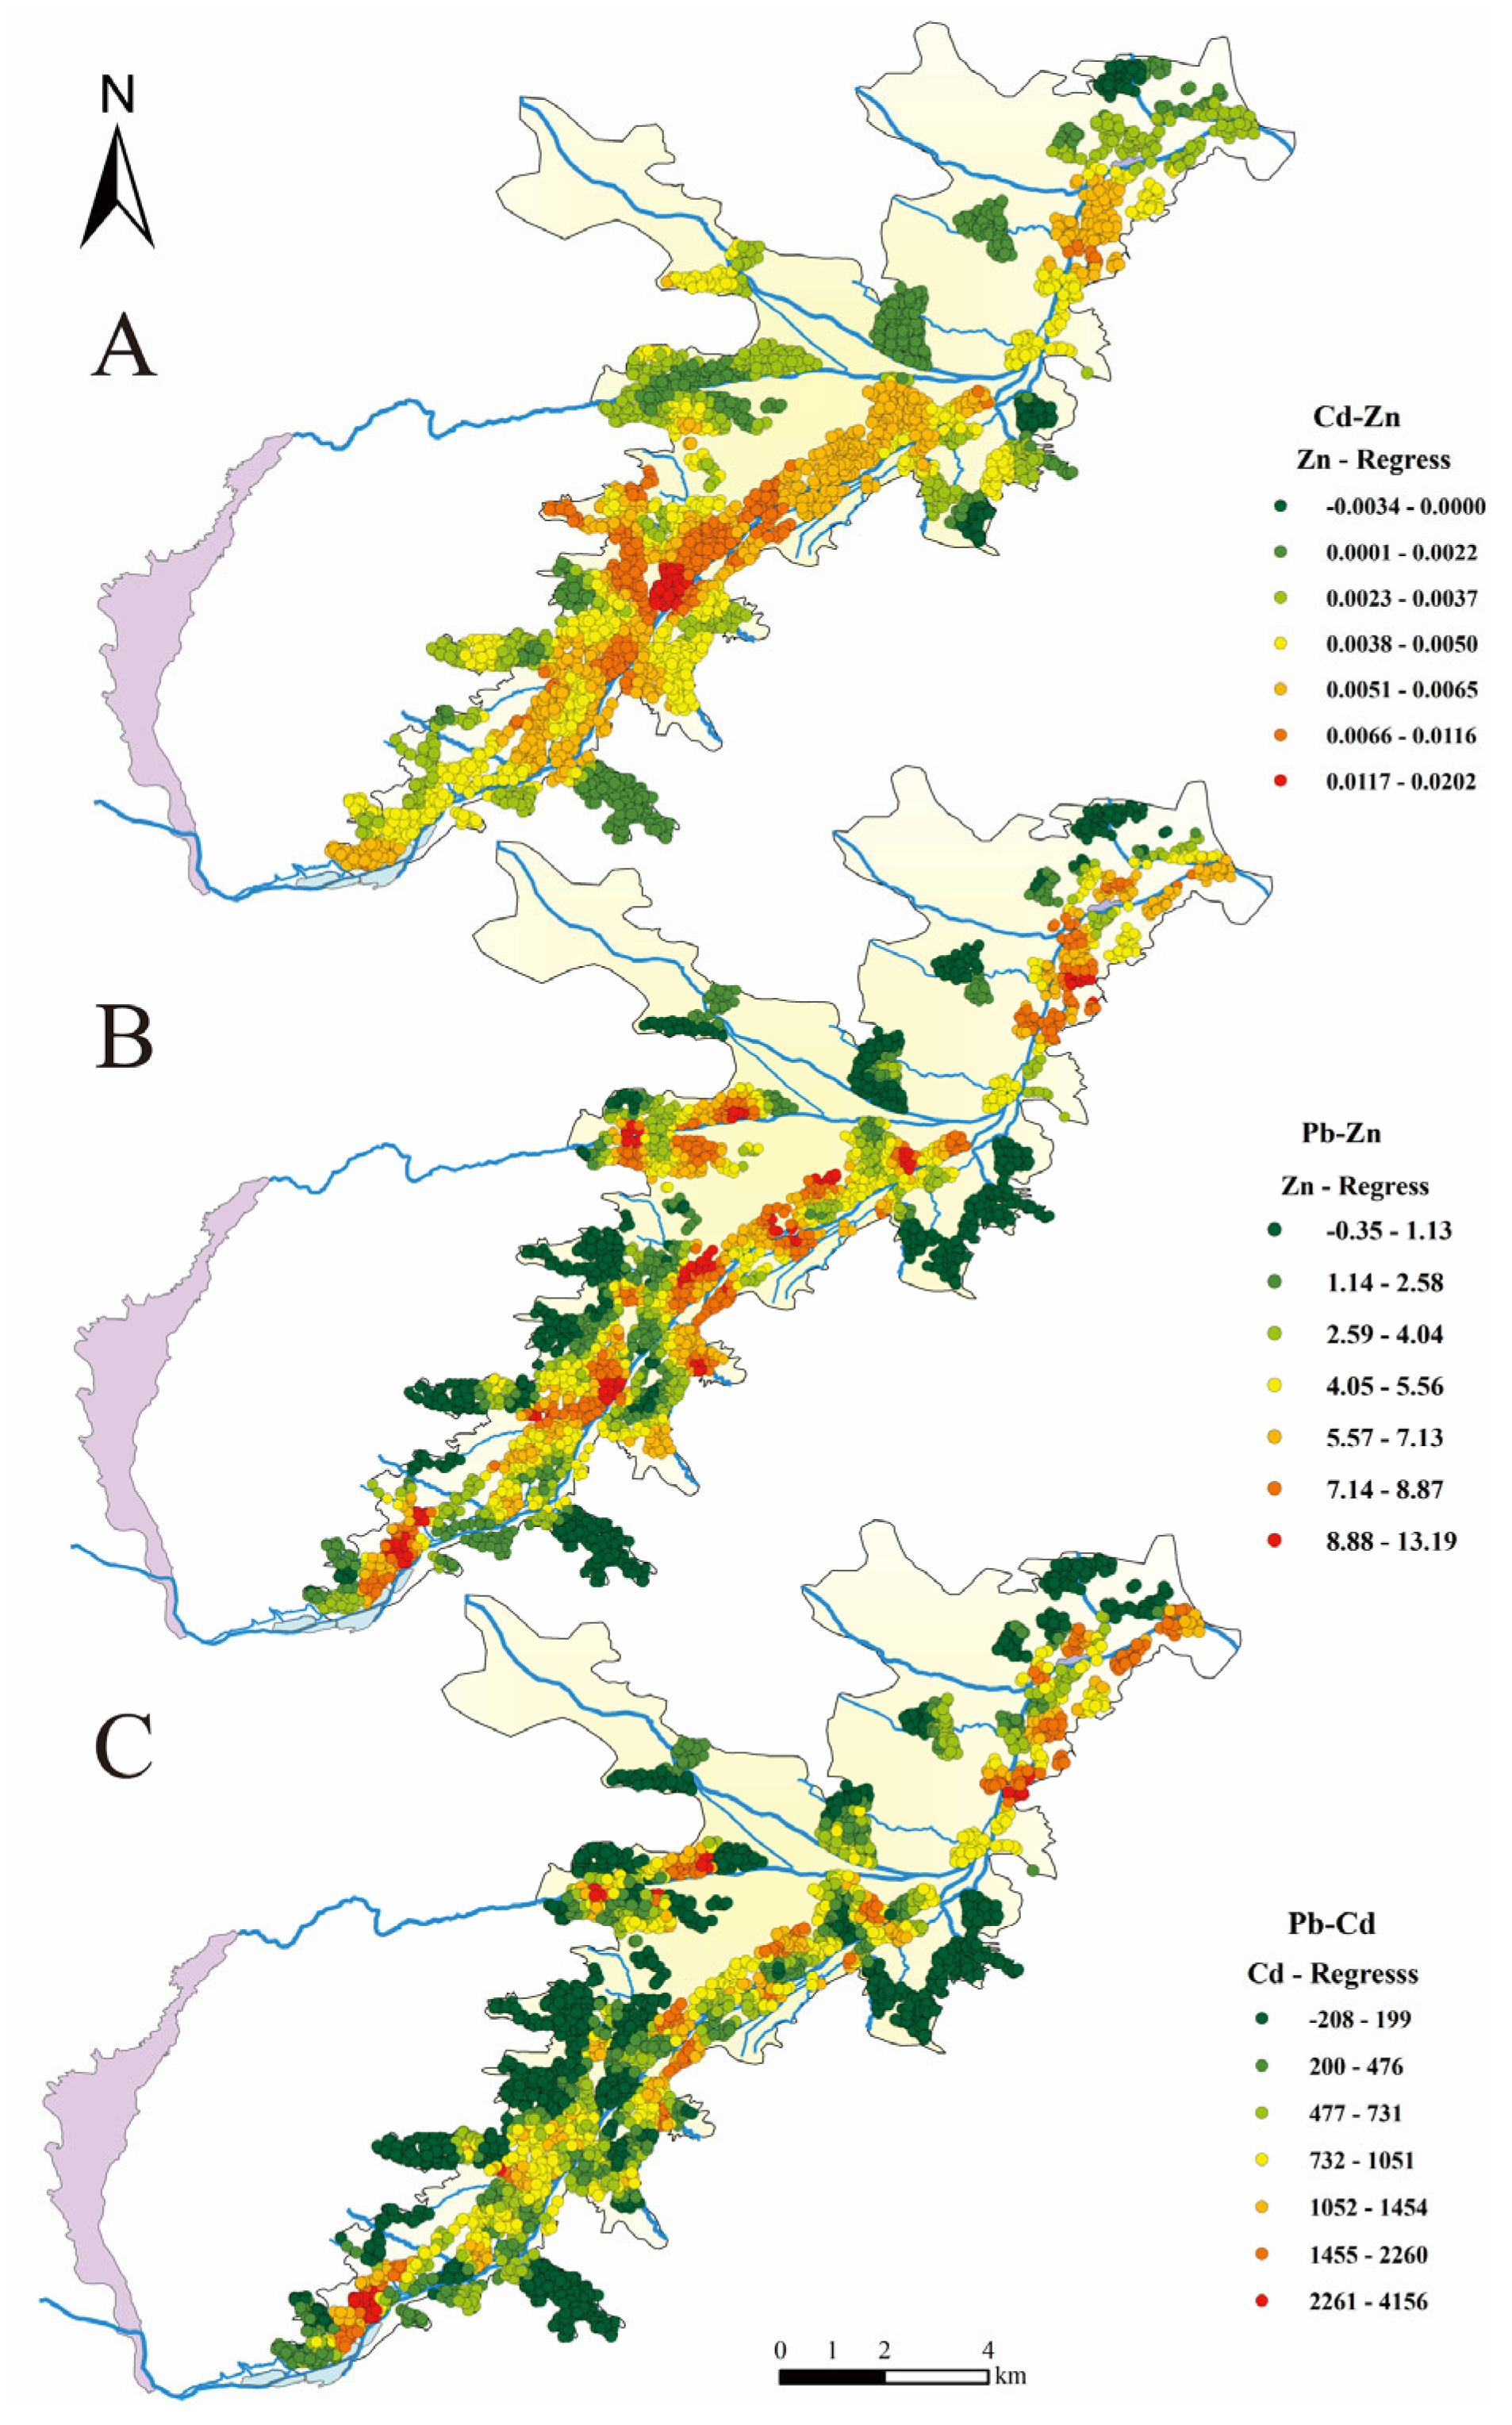
2.5. Geographically Weighted Regression
2.6. Geo-Accumulation of Heavy Metals
2.7. Potential Ecological Risk Index
2.8. Multivariate and Geostatistical Analysis
3. Results
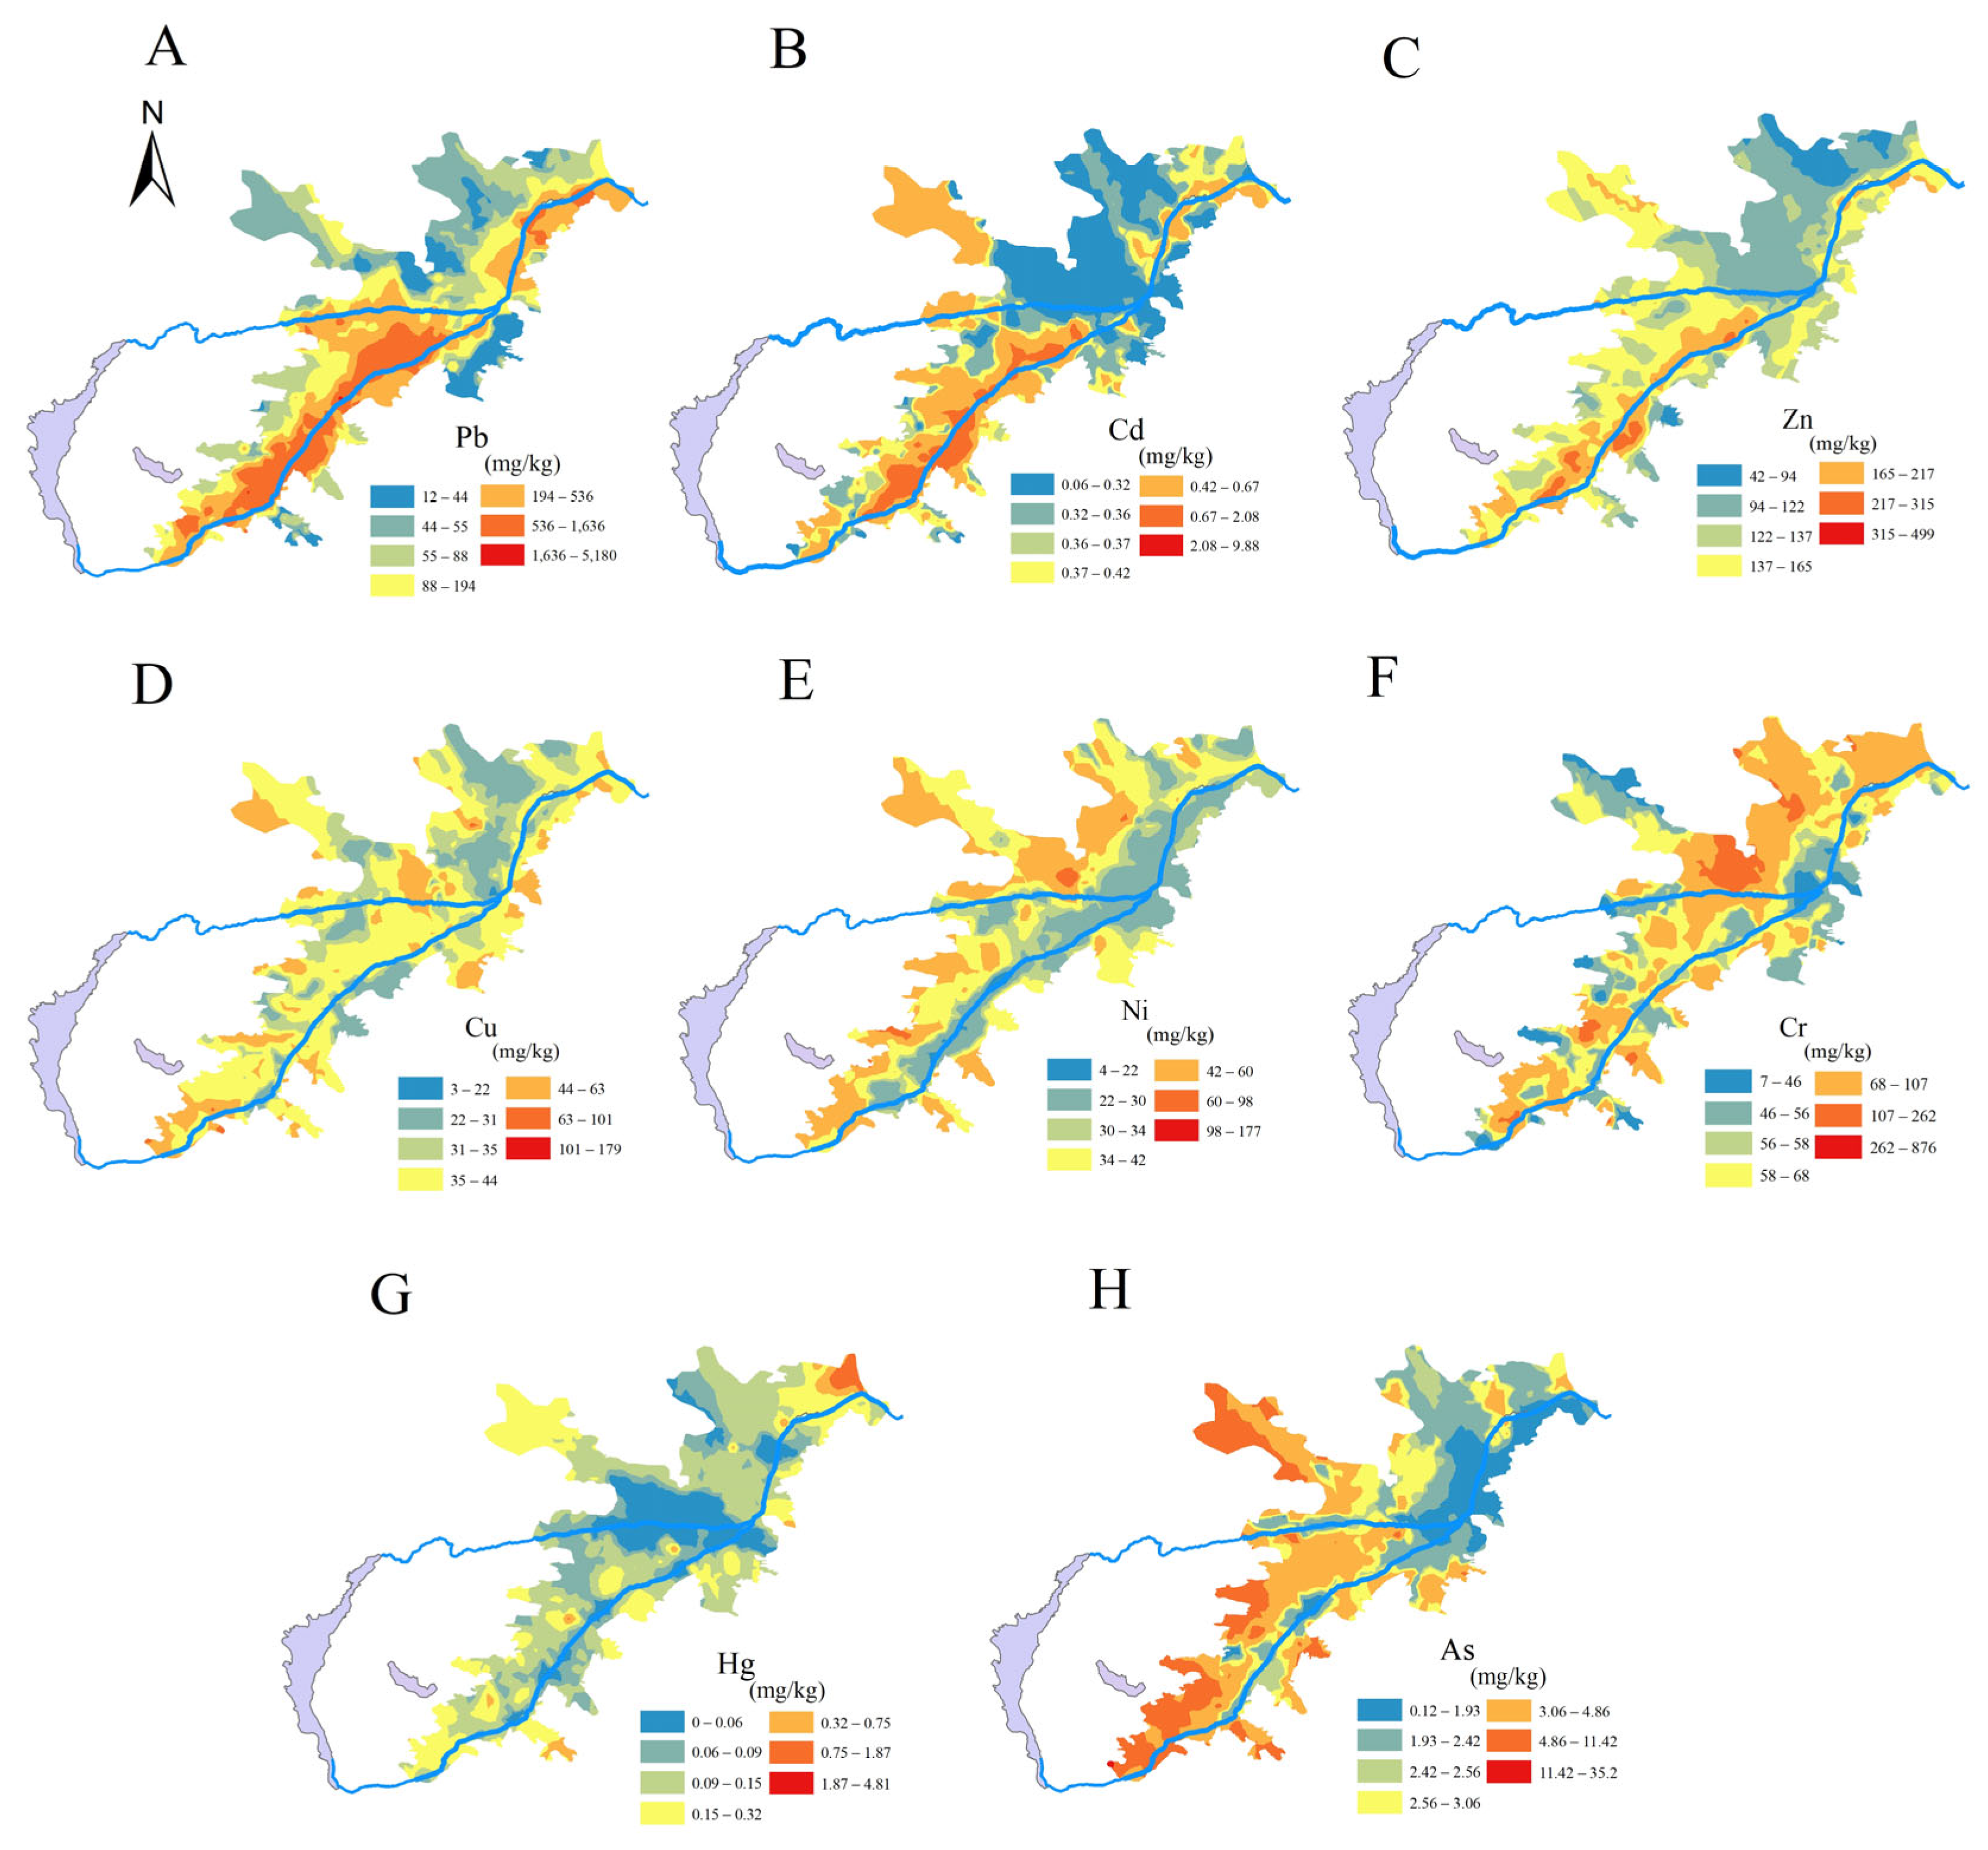
3.1. Topsoil
3.2. Vertical Soil Sections
3.3. Risk Assessment of Heavy Metals
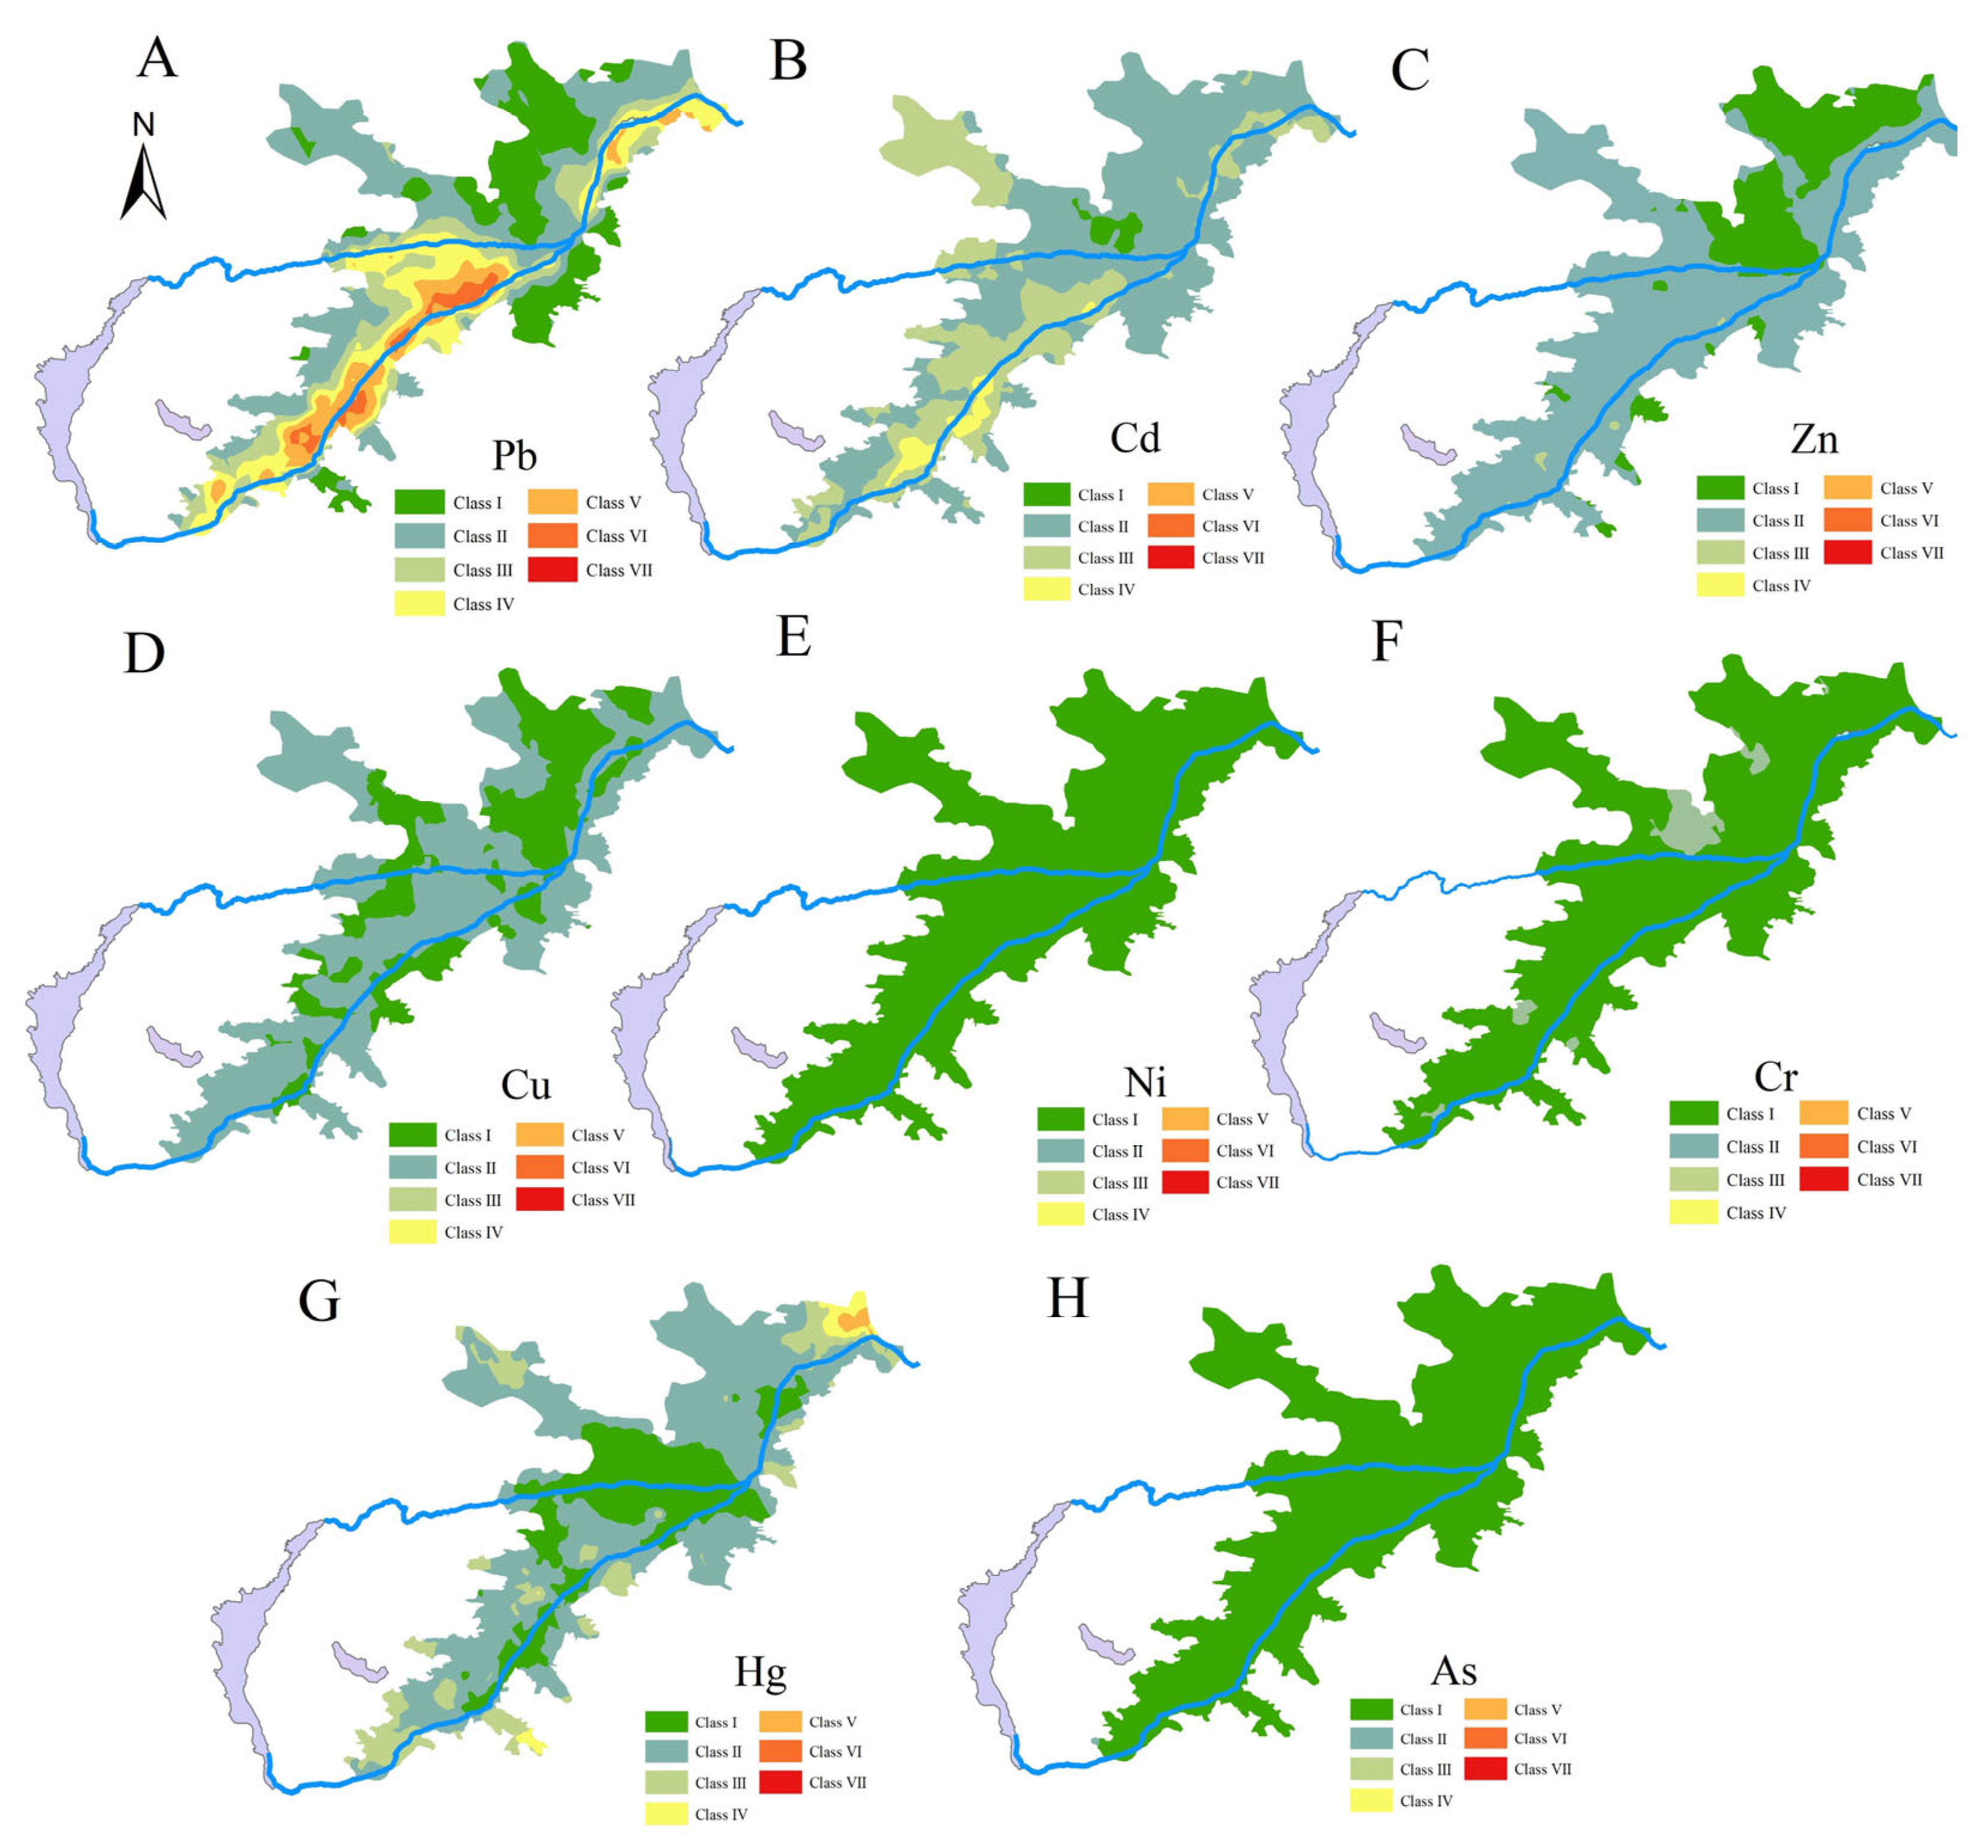
3.3.1. Geo-Accumulation Index
3.3.2. Potential Ecological Risk Assessment
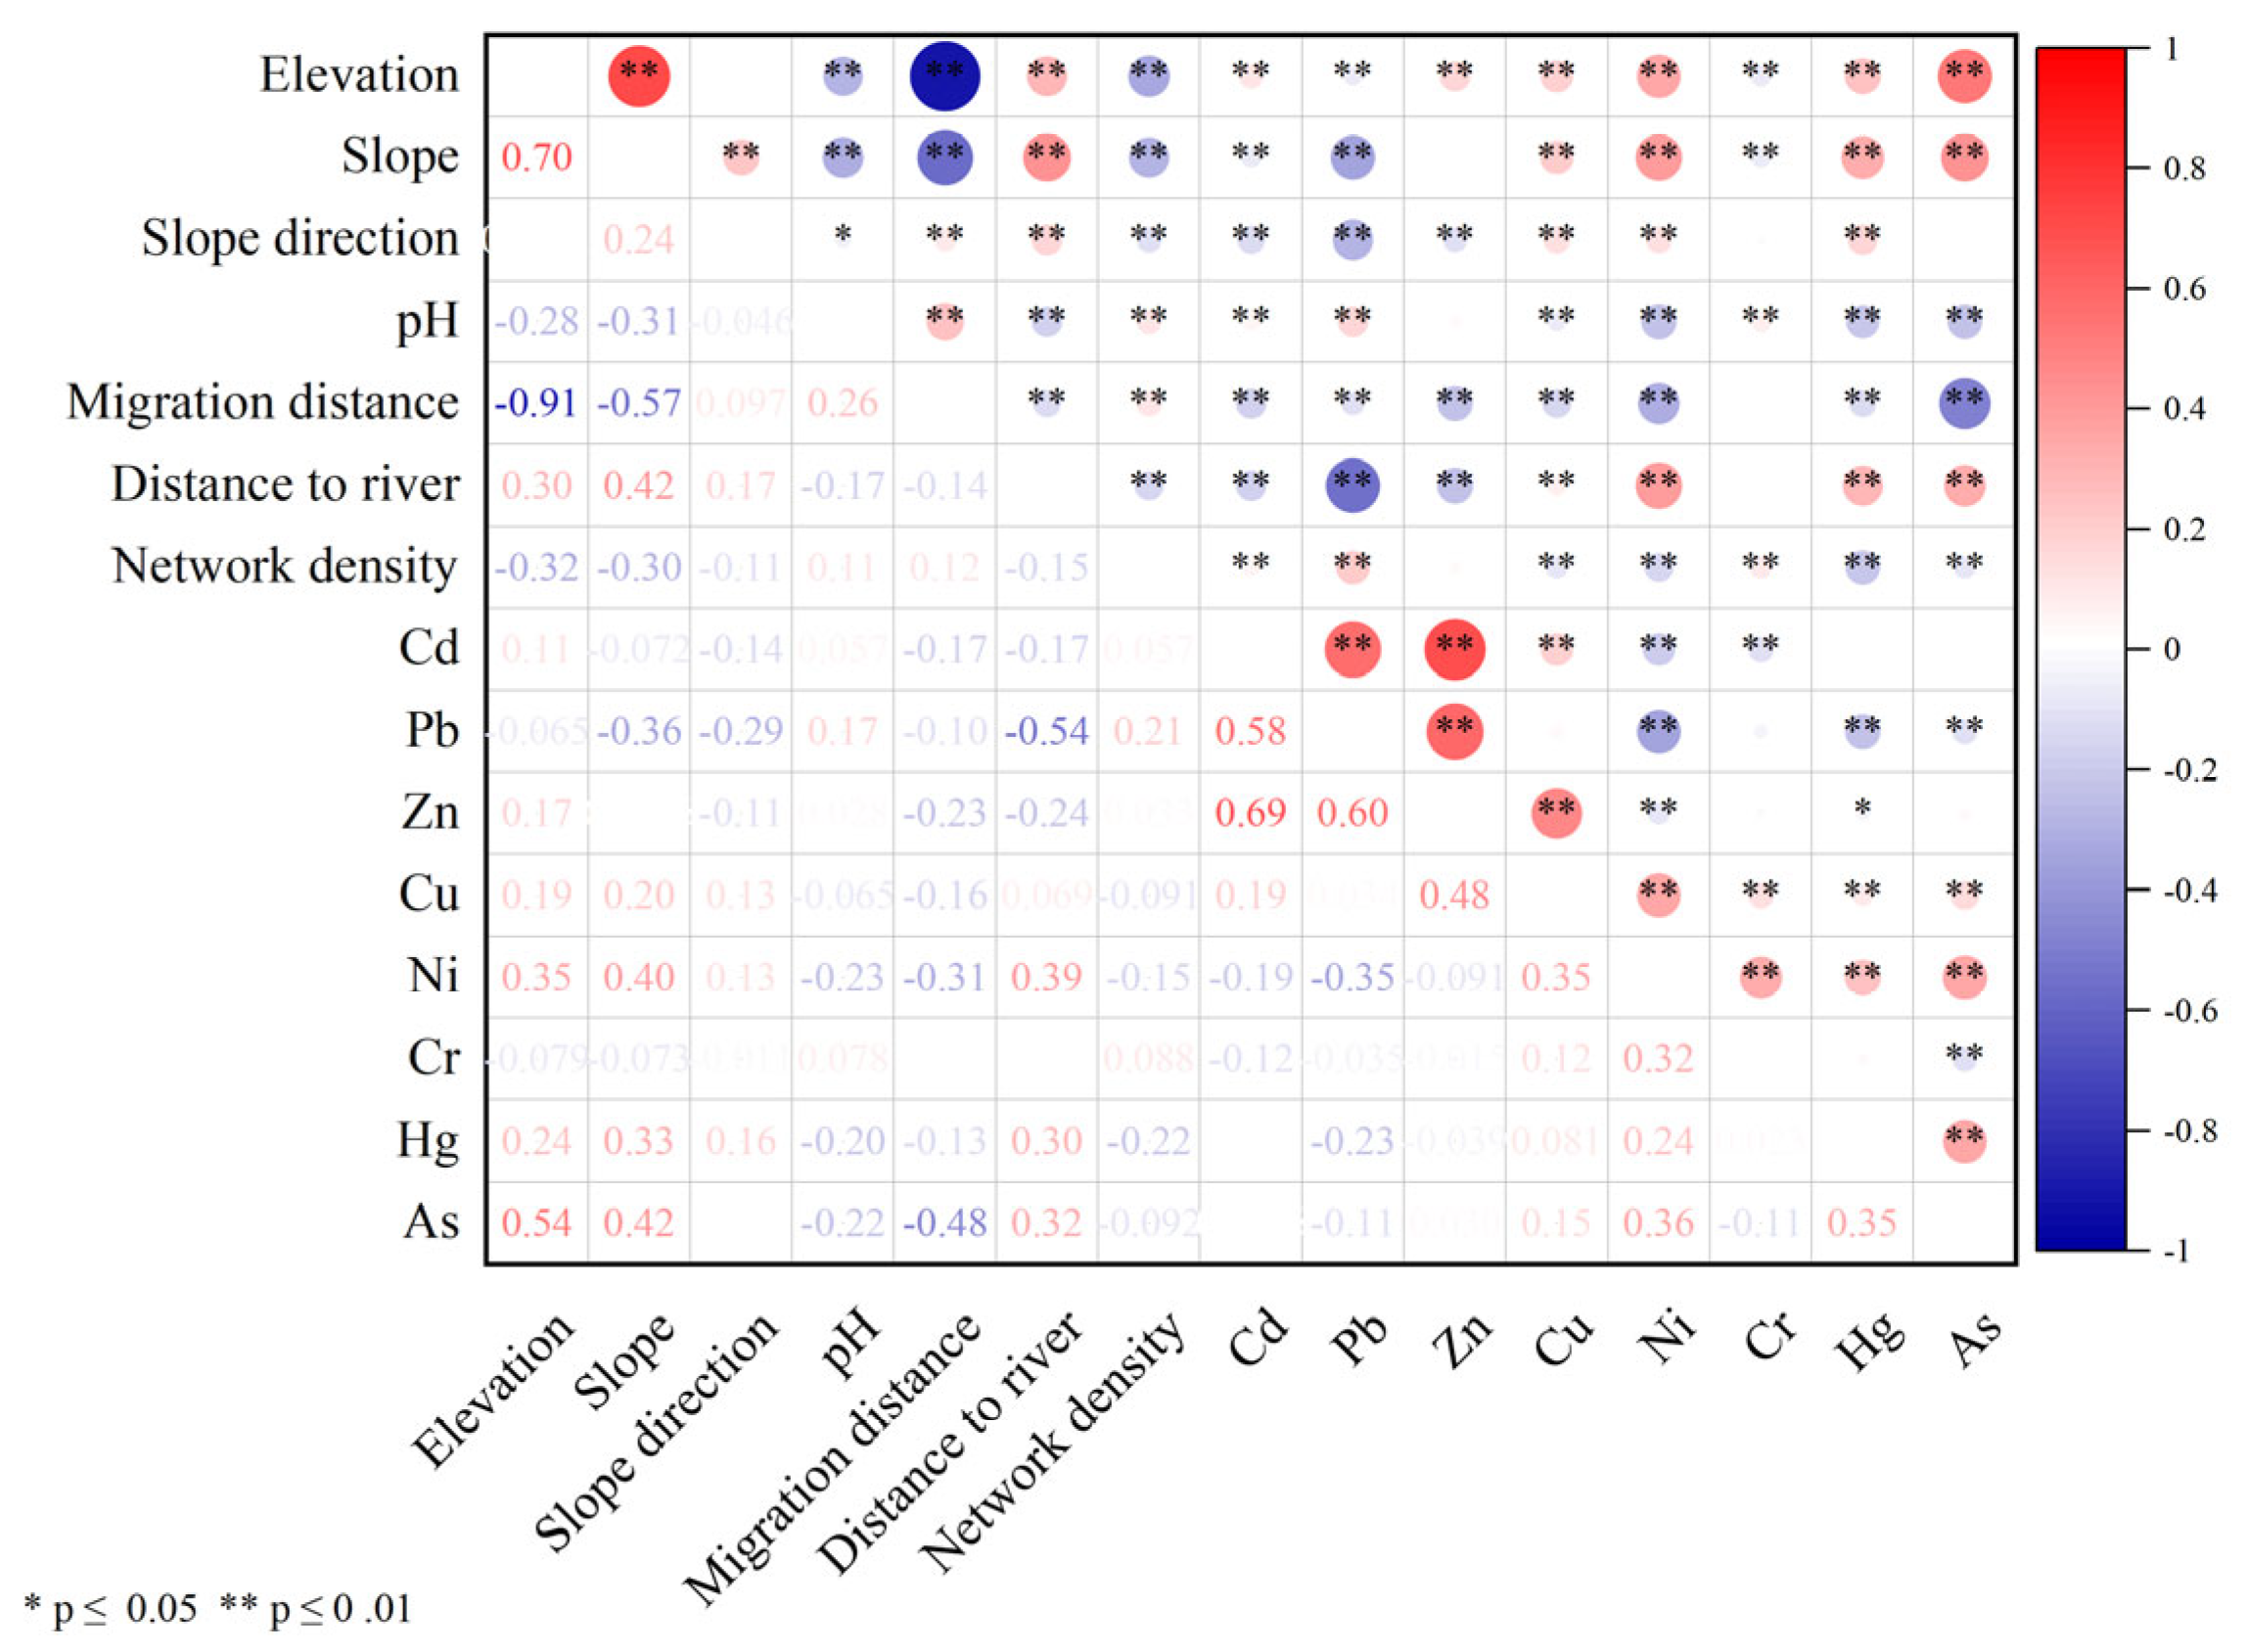
3.4. Provenance of Heavy Metals
3.5. Migration of Heavy Metals from Mining
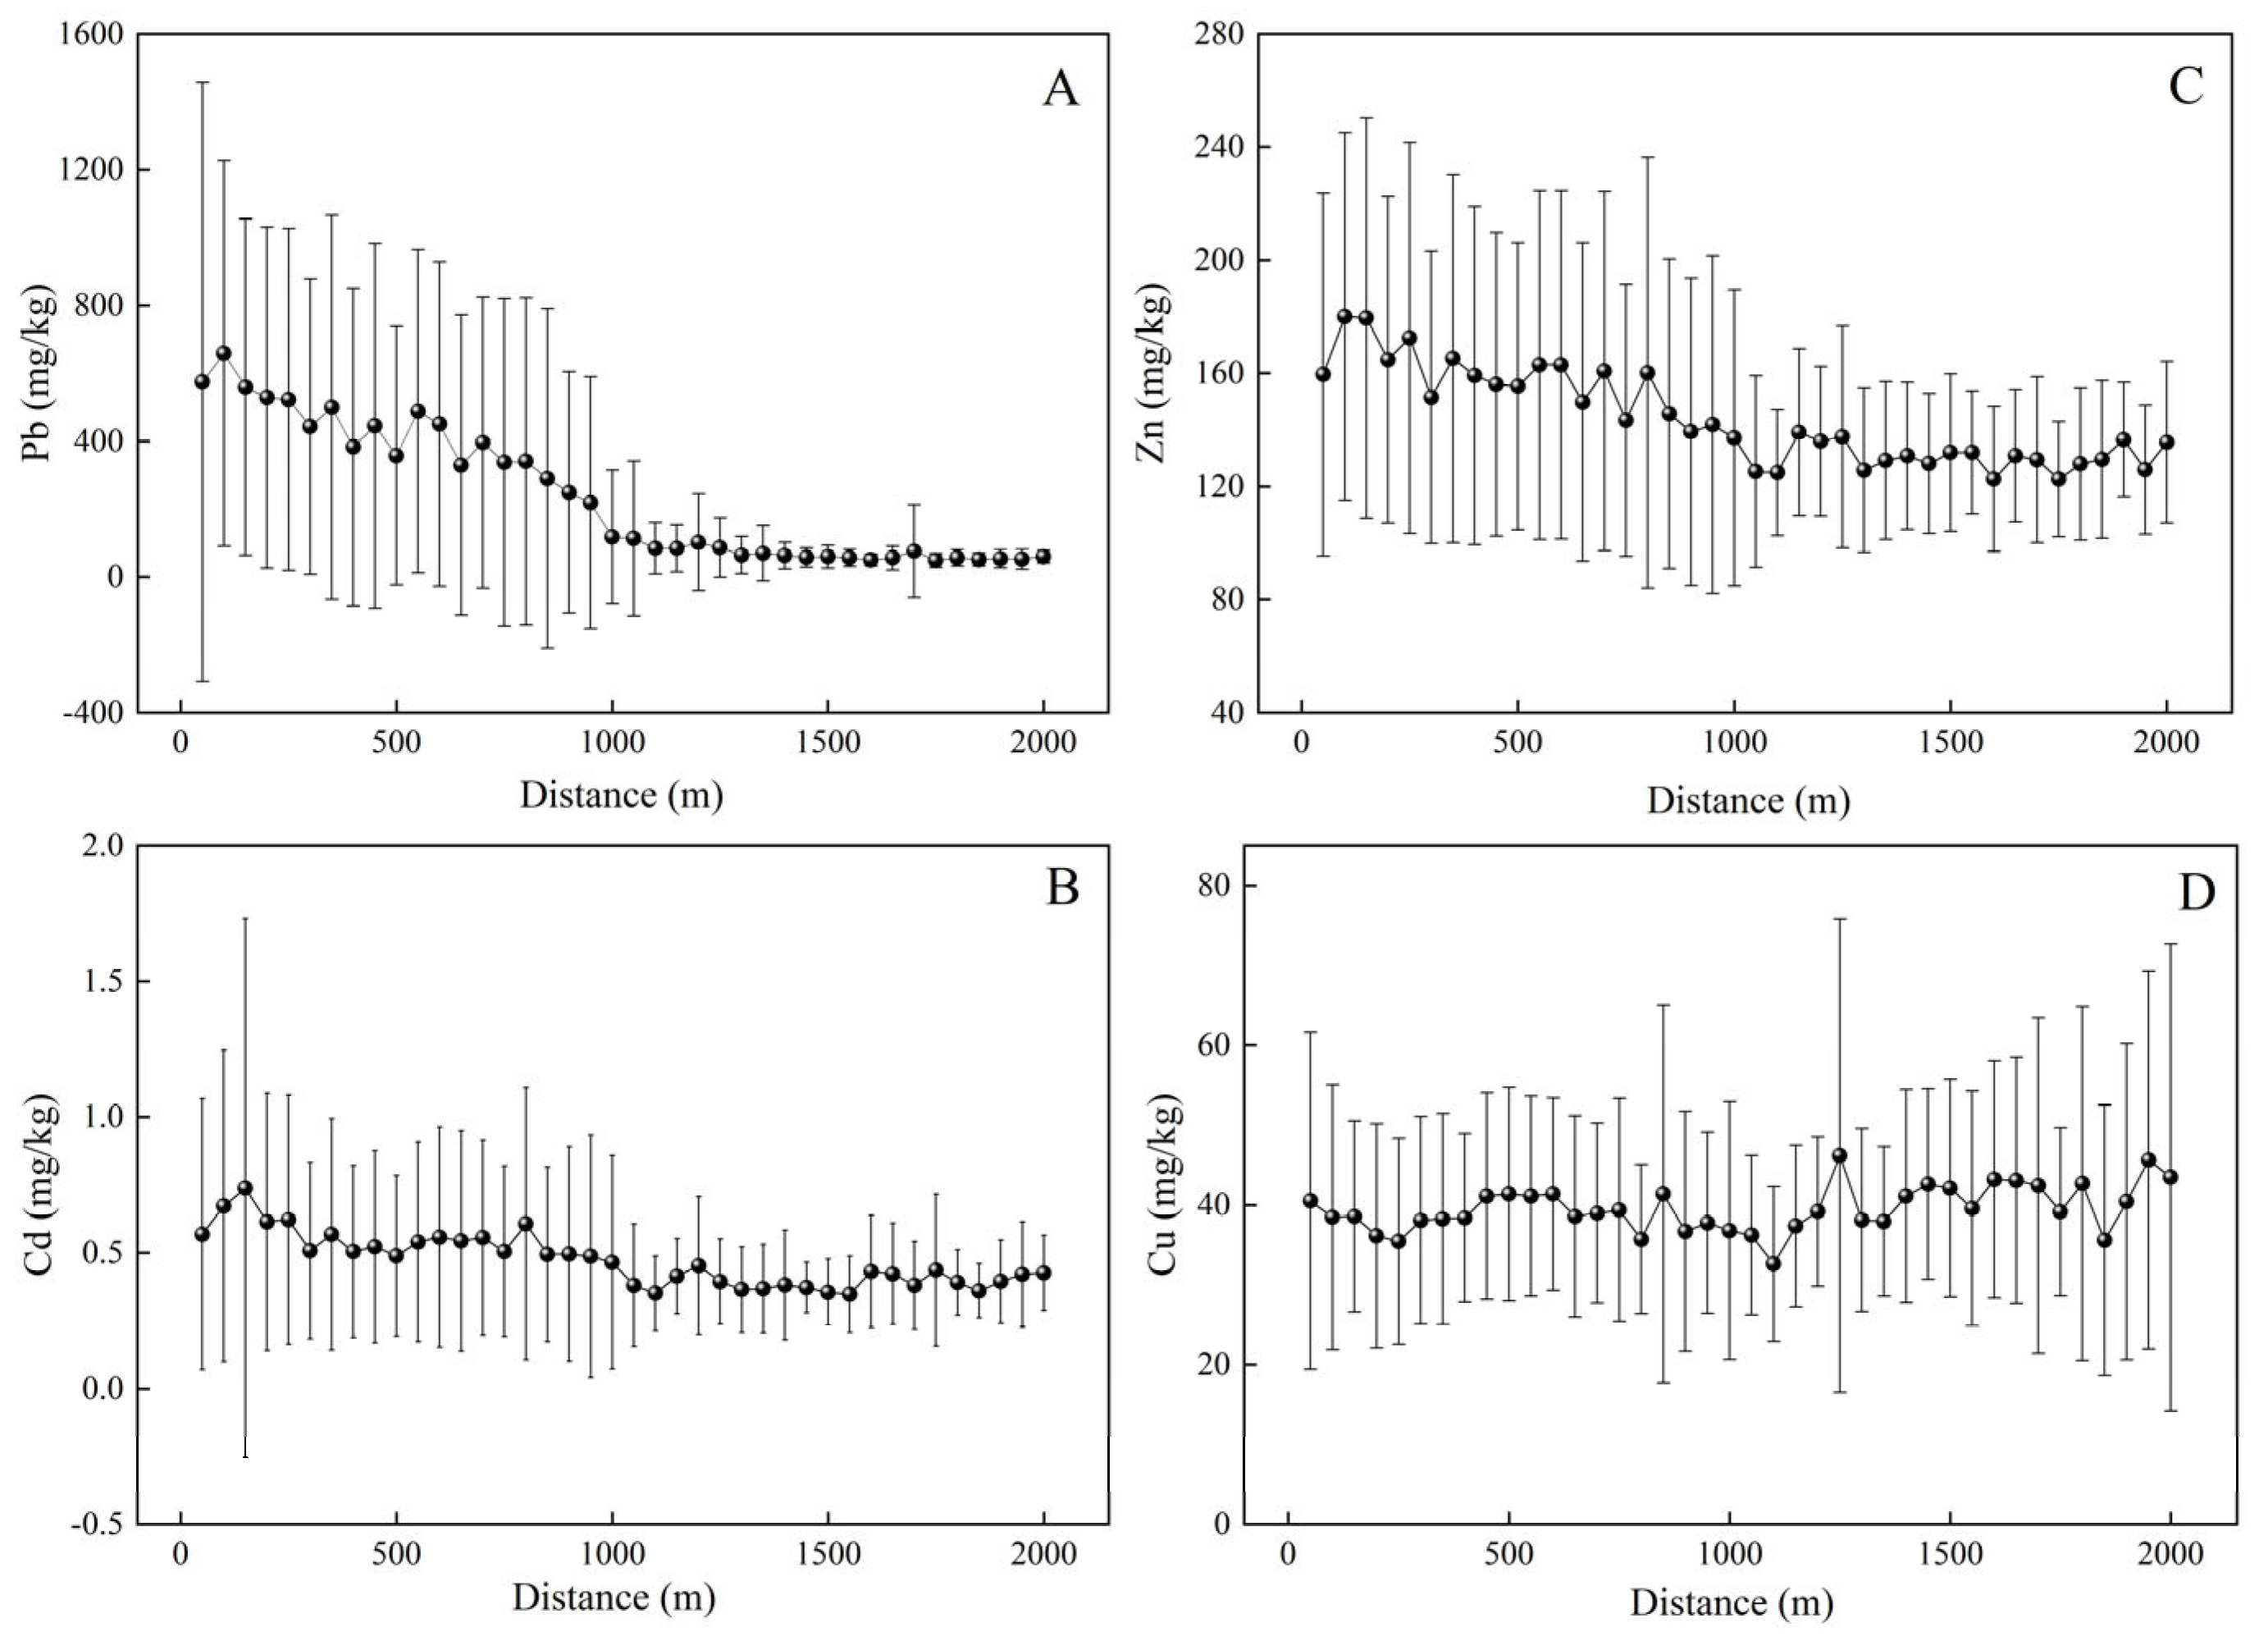
3.5.1. Lateral Migration Along the River
3.5.2. Longitudinal Migration of Heavy Metals
4. Discussion
4.1. Heavy Metal Pollution and Sources
4.2. Factors Affecting Heavy Metal Migration
4.2.1. pH
4.2.2. Distance to River
4.2.3. Impact of Geographical Attributes
4.2.4. Differences in Heavy Metal Migration Capabilities
4.3. Heavy Metals Accumulation
5. Conclusions
Author Contributions
Funding
Data Availability Statement
Conflicts of Interest
References
- Wang, Z.; Luo, Y.; Zheng, C.; An, C.; Mi, Z. Spatial distribution, source identification, and risk assessment of heavy metals in the soils from a mining region: A case study of Bayan Obo in northwestern China. Hum. Ecol. Risk Assess. 2020, 27, 1276–1295. [Google Scholar] [CrossRef]
- Tian, S.; Liang, T.; Li, K.; Wang, L. Source and path identification of metals pollution in a mining area by PMF and rare earth element patterns in road dust. Sci. Total Environ. 2018, 633, 958–966. [Google Scholar] [CrossRef] [PubMed]
- Fan, J.; Deng, L.; Wang, W.; Yi, X.; Yang, Z. Contamination, Source Identification, Ecological and Human Health Risks Assessment of Potentially Toxic-Elements in Soils of Typical Rare-Earth Mining Areas. Int. J. Environ. Res. Public Health 2022, 19, 15105. [Google Scholar] [CrossRef]
- Shi, Z.; Xu, W. Heavy metal patterns and potential hazards of river sediments in the Maoniuping REE mining area. Acta Mineral. Sin. 2013, 33, 707–708. [Google Scholar] [CrossRef]
- Weng, Z.; Jowitt, S.; Mudd, G.; Haque, N. Assessing rare earth element mineral deposit types and links to environmental impacts. Appl. Earth Sci. 2013, 122, 83–96. [Google Scholar] [CrossRef]
- Yin, X.; Martineau, C.; Demers, I.; Basiliko, N.; Fenton, N.J. The potential environmental risks associated with the development of rare earth element production in Canada. Environ. Rev. 2021, 29, 354–377. [Google Scholar] [CrossRef]
- Chen, H.; Chen, Z.; Chen, H. Impacts of Ion Adsorption Type Rare Earth Mining Techniques on Topsoil in Mining Area. Pol. J. Environ. Stud. 2024, 33, 1585–1594. [Google Scholar] [CrossRef]
- Zhou, L.; Li, Z.; Liu, W.; Liu, S.; Zhang, L.; Zhong, L.; Luo, X.; Liang, H. Restoration of rare earth mine areas: Organic amendments and phytoremediation. Environ. Sci. Pollut. Res. 2015, 22, 17151–17160. [Google Scholar] [CrossRef]
- Yang, M.; Ma, D.; Chen, Y. An Approach about Water-stone Flow Hazards Occurred in July 18th, 2013 in Maoniuping Rare Earth Mining Area in Mianning, Sichuan. Mt. Res. 2014, 32, 732–738. [Google Scholar]
- Yang, X.; Huang, J.; Tian, L.; Liu, Z.; Han, L. A discussion on comprehensive governance of mine environment based on high resolution remote sensing data: A case of Maoniuping REE deposit, Mianning County. Remote Sens. Land Resour. 2015, 27, 115–121. [Google Scholar]
- Han, X.; Xiong, Z.; Wang, S.; Wang, L.; Liang, T. Long-term open-pit mining activities at the world’s largest light rare earth mine significantly affect light rare earth elements in road dust over long distances. J. Hazard. Mater. 2024, 480, 136287. [Google Scholar] [CrossRef] [PubMed]
- Li, Z.; Liang, T.; Li, K.; Wang, P. Exposure of children to light rare earth elements through ingestion of various size fractions of road dust in REEs mining areas. Sci. Total Environ. 2020, 743, 140432. [Google Scholar] [CrossRef]
- Zhang, p.; Xie, H.; Cao, G.; Ji, Y.; Liu, Y.; Sun, R.; Feng, Y. Current status of research on soil and groundwater contamination by ammonium sulfate leaching of ionic rare earth ores. Min. Metall. 2021, 30, 95–101+110. [Google Scholar]
- Zhang, Q.; Ren, F.; Li, F.; Chen, G.; Yang, G.; Wang, J.; Du, K.; Liu, S.; Li, Z. Ammonia nitrogen sources and pollution along soil profiles in an in-situ leaching rare earth ore. Environ. Pollut. 2020, 267, 115449. [Google Scholar] [CrossRef]
- Liu, W.; Wu, L.-L.; Zheng, M.; Chao, Y.; Zhao, C.; Zhong, X.; Ding, K.; Huot, H.; Zhang, M.; Tang, Y.-T.; et al. Controls on rare-earth element transport in a river impacted by ion-adsorption rare-earth mining. Sci. Total Environ. 2019, 660, 697–704. [Google Scholar] [CrossRef]
- He, X.; Yuan, T.; Jiang, X.; Yang, H.; Zheng, C.L. Effects of contaminated surfacewater and groundwater from a rare earth mining area on the biology and the physiology of Sprague-Dawley rats. Sci. Total Environ. 2021, 761, 144123. [Google Scholar] [CrossRef]
- Liu, W.-S.; Guo, M.-N.; Liu, C.; Yuan, M.; Chen, X.-T.; Huot, H.; Zhao, C.-M.; Tang, Y.-T.; Morel, J.L.; Qiu, R.-L. Water, sediment and agricultural soil contamination from an ion-adsorption rare earth mining area. Chemosphere 2019, 216, 75–83. [Google Scholar] [CrossRef]
- Krasavtseva, E.; Sandimirov, S.; Elizarova, I.; Makarov, D. Assessment of Trace and Rare Earth Elements Pollution in Water Bodies in the Area of Rare Metal Enterprise Influence: A Case Study-Kola Subarctic. Water 2022, 14, 3406. [Google Scholar] [CrossRef]
- Chen, H.; Chen, H.; Chen, Z. Risk Characteristics of Rare Earth Elements in Surface Soil of Paddy Field Downstream of Ionic Rare Earth in-situ Leaching Area. Pol. J. Environ. Stud. 2024, 33, 89–99. [Google Scholar] [CrossRef]
- Ali, S.H. Social and Environmental Impact of the Rare Earth Industries. Resources 2014, 3, 123–134. [Google Scholar] [CrossRef]
- Xu, Y.; Li, Y.; Chen, H. Determination of the Content of Heavy Metal Elements Pb, Cr and Cu in Soil from Abandoned Rare Earth Mine in Dingnan County. Guangdong Trace Elem. Sci. 2012, 19, 10–14. [Google Scholar] [CrossRef]
- Li, X.; Chen, Z.; Chen, Z.; Zhang, Y.; Wang, Q.; HUang, M. Concentrations and Health Risk Assessment of Heavy Metals in Soil and Vegetables from REEs Mining Area, Fujian Province. J. Soil Water Conserv. 2013, 27, 146–151. [Google Scholar] [CrossRef]
- Yuan, P.; Wang, L.; He, P.; Wang, Y. Distribution and Risk Assessment of Heavy Metals in Soil and Surface Water of an Ion-Absorbed Rare Earth Mine in Northern Guangdong. Environ. Monit. China 2023, 39, 146–158. [Google Scholar]
- Chen, H.; Chen, Z.; Chen, Z.; Ma, Q.; Zhang, Q. Rare earth elements in paddy fields from eroded granite hilly land in a southern China watershed. PLoS ONE 2019, 14, e0222330. [Google Scholar] [CrossRef]
- Hao, X.; Wang, D.; Wang, P.; Wang, Y.; Zhou, D. Evaluation of water quality in surface water and shallow groundwater: A case study of a rare earth mining area in southern Jiangxi Province, China. Environ. Monit. Assess. 2016, 188, 24. [Google Scholar] [CrossRef]
- He, H.; Shan, H.; Mo, D.; Liu, Y.; Peng, S.; Cheng, Y.; Chen, M.; Yan, Z. Simulation Study on the Environmental Impact of Rare Earth Ore Development on Groundwater in Hilly Areas: A Case Study in Nuodong, China. Water 2023, 15, 263. [Google Scholar] [CrossRef]
- Gao, P.; Qu, X.; Chen, Z. There is a significant increase in total nitrogen content in the surface soil and water around the mining area, posing ecological risks. Chin. Rare Earths 2022, 43, 19–27. [Google Scholar] [CrossRef]
- Xie, L.; Wu, W.; Huang, X.; Ou, P.; Lin, Z.; Wang, Z.; Song, Y.; Lang, T.; Huangfu, W.; Zhang, Y.; et al. Mining and Restoration Monitoring of Rare Earth Element (REE) Exploitation by New Remote Sensing Indicators in Southern Jiangxi, China. Remote Sens. 2020, 12, 3558. [Google Scholar] [CrossRef]
- Wang, D.H.; Yang, J.M.; Yan, S.H.; Xu, J.; Chen, Y.C.; Pu, G.P.; Luo, Y.N. A special orogenic-type rare earth element deposit in Maoniuping, Sichuan, China: Geology and geochemistry. Resour. Geol. 2001, 51, 177–188. [Google Scholar] [CrossRef]
- Ma, Y.; He, H.; Li, L.; Luo, S. Ecological environment status of Maoniuping rare earth mining area and suggestions on management. Sichuan Environ. 2012, 31, 71–75. [Google Scholar] [CrossRef]
- Liu, Y.; Chakhmouradian, A.R.; Hou, Z.; Song, W.; Kynicky, J. Development of REE mineralization in the giant Maoniuping deposit (Sichuan, China): Insights from mineralogy, fluid inclusions, and trace-element geochemistry. Miner. Depos. 2019, 54, 701–718. [Google Scholar] [CrossRef]
- Zhang, W.; Chen, W.T.; Zhang, X.C.; Tang, Y.-W. The trace element chemistry of quartz in carbonatite-related REE deposits: Implication for REE exploration. Ore Geol. Rev. 2022, 149, 105068. [Google Scholar] [CrossRef]
- Sun, M.; Luo, Q.; Zhang, B. Rare earth mineralization laws and resource evaluation in Sichuan Province. Sci. Press 2017, 2. [Google Scholar]
- Zhao, L. Maoniuping: The mine is dressed in green again. Sichuan Daily, 2019. [Google Scholar]
- Pengpai News. Sichuan’s Largest Light Rare Earth Resource Base Achieved Significant Breakthroughs in Increasing Reserves and Production, and was Integrated into China REEs Group Last Year; Pengpai News: Shanghai, China, 2024. [Google Scholar]
- Xu, W. Recent Deposition Environmental Quality Evolution of the Anning River in Western Sichuan Province. Ph.D. Thesis, Chengdu University of Technology, Chengdu, China, 2015. [Google Scholar]
- Liao, C.; SHI, Z.; Wang, W.; Zhang, F.; Xu, W.; Tang, L. Water chemical characteristics and the subtance provenance in Anning River Basin of Sichuan Province. Earth Environ. 2020, 48, 680–688. [Google Scholar] [CrossRef]
- Yang, Z.; Jones, A.E.; Pu, G. Gelogical features of Maoniuping ree deposit, Sichuan, China. Miner. Rock 2000, 28–34. [Google Scholar] [CrossRef]
- DZT 0295-2016; Specification of Land Quality Geochemical Assessment. Ministry of Land Resources: Beijing, China, 2016.
- HJ/T 166-2004; Technical Specification for Soil Environmental Monitoring. China Environmental Monitoring Station: Beijing, China, 2004.
- NY/T 1377-2007; Determination of pH in Soil. Ministry of Agriculture: Beijing, China, 2007.
- GB/T 17141-1997; Soil Quality-Determination of Lead, Cadminum-Graphite Furnace Atomic Absorption Spectrophotometry. State Environmental Protection Administration: Beijing, China, 1997.
- HJ 491-2019; Soil and Sediment-Determination of Copper, Zinc, Lead, Nickel and Chromium-Flame Atomic Absorption Spectrophotometry. Ministry of Ecology and Environment: Beijing, China, 2019.
- HJ 680-2013; Soil and Sedimen-Determination of Mercury, Arsenic, Selenium, Bismuth, Antimony-Microwave Dissolution/Atomic Fluorescence Spectrometry. Ministry of Environmental Protection: Beijing, China, 2013.
- GB 15618; Soil Environmental Quality Soil Pollution Risk Control Standards for Agricultural Land. Ministry of Ecology and Environment: Beijing, China, 2018.
- Farr, T.G.; Rosen, P.A.; Caro, E.; Crippen, R.; Duren, R.; Hensley, S.; Kobrick, M.; Paller, M.; Rodriguez, E.; Roth, L.; et al. The shuttle radar topography mission. Rev. Geophys. 2007, 45. [Google Scholar] [CrossRef]
- Hennig, T.A.; Kretsch, J.L.; Pessagno, C.J.; Salamonowicz, P.H.; Stein, W.L. The shuttle radar topography mission. In Proceedings of the Digital Earth Moving: First International Symposium, DEM 2001, Manno, Switzerland, 5–7 September 2001; pp. 65–77. [Google Scholar]
- Huo, X.-N.; Li, H.; Sun, D.-F.; Zhou, L.-D.; Li, B.-G. Combining Geostatistics with Moran’s I Analysis for Mapping Soil Heavy Metals in Beijing, China. Int. J. Environ. Res. Public Health 2012, 9, 995–1017. [Google Scholar] [CrossRef]
- Muller, G. Index of Geoaccumulation in Sediments of the Rhine River. GeoJournal 1969, 2, 109–118. [Google Scholar]
- Wei, B.; Yang, L. A review of heavy metal contaminations in urban soils, urban road dusts and agricultural soils from China. Microchem. J. 2010, 94, 99–107. [Google Scholar] [CrossRef]
- GB 15618-2018; Soil Environmental Quality—Risk Control Standard for Soil Contamination of Agricultural Land. Ministry of Ecology: Beijing, China, 2018.
- Zhang, C.P.; Li, F.X. Spatial distribution and potential ecological risk assessment of heavy metals in sediments of Yalu River estuary wetland mudflat. Chin. J. Appl. Ecol. 2016, 27, 2884–2890. [Google Scholar] [CrossRef]
- Zhang, J.; Xu, X. Spatial Distribution Characteristics and Potential Risk Assessment of Heavy Metals in Sludge of Shanghai Sewage Treatment Plant: A Case Study. Sustainability 2023, 15, 3465. [Google Scholar] [CrossRef]
- Wu, Y.-G.; Xu, Y.-N.; Zhang, J.-H.; Hu, S.-H. Evaluation of ecological risk and primary empirical research on heavy metals in polluted soil over Xiaoqinling gold mining region, Shaanxi, China. Trans. Nonferrous Met. Soc. China 2010, 20, 688–694. [Google Scholar] [CrossRef]
- Hakanson, L. An ecological risk index for aquatic pollution control. A sedimentological approach. Water Res. 1980, 14, 975–1001. [Google Scholar] [CrossRef]
- Saha, A.; Gupta, B.S.; Patidar, S.; Martinez-Villegas, N. Spatial distribution based on optimal interpolation techniques and assessment of contamination risk for toxic metals in the surface soil. J. South Am. Earth Sci. 2022, 115, 103763. [Google Scholar] [CrossRef]
- Gao, H.-R.; Zhou, Y.; Liu, J.-K.; Cheng, X.-M.; Guo, S.; Jiang, Y.; Tan, H.-X. Spatial and Temporal Distribution and Source Variation of Heavy Metals in Cultivated Land Soil of Xiangzhou District Based on EBK Interpolation Prediction and GDM Model. Environ. Sci. 2022, 43, 5180–5191. [Google Scholar] [CrossRef]
- Zhuang, S.; Lu, X. Determining environmental risk and source of heavy metal(loid)s in the surrounding farmland soil of a zinc smelter in water source area, Northwest China. Environ. Earth Sci. 2022, 81, 67. [Google Scholar] [CrossRef]
- Schober, P.; Boer, C.; Schwarte, L.A. Correlation Coefficients: Appropriate Use and Interpretation. Anesth. Analg. 2018, 126, 1763–1768. [Google Scholar] [CrossRef]
- Li, X.; Yang, H.; Zhang, C.; Zeng, G.; Liu, Y.; Xu, W.; Wu, Y.; Lan, S. Spatial distribution and transport characteristics of heavy metals around an antimony mine area in central China. Chemosphere 2017, 170, 17–24. [Google Scholar] [CrossRef]
- Shan, Y.; Tysklind, M.; Hao, F.; Ouyang, W.; Chen, S.; Lin, C. Identification of sources of heavy metals in agricultural soils using multivariate analysis and GIS. J. Soils Sediments 2013, 13, 720–729. [Google Scholar] [CrossRef]
- Wang, X.; Lai, J.; Lu, Y.; Li, D.; Zhou, J.; Wang, J. Main Source of Soil Heavy Metal Pollution Based on Factor Analysis in Taiyuan. Ecol. Environ. Sci. 2008, 17, 671–676. [Google Scholar] [CrossRef]
- Nawshad, H.; Anthony, H.; Seng, L.; Chris, V. Rare Earth Elements: Overview of Mining, Mineralogy, Uses, Sustainability and Environmental Impact. Resources 2014, 3, 614–635. [Google Scholar] [CrossRef]
- Hu, Y.; Wang, N.; Cao, Z.; Zhang, W. Research progress on rare earth ore metallurgy and separation technology in China. Conserv. Util. Miner. Resour. 2020, 40, 151–161. [Google Scholar] [CrossRef]
- Shule, Q.; Xue, B.; Jianguo, C.; Peng, C.; Wenyuan, W. Clean metallurgy and technical progress of light rare earth minerals. Can. Metall. Q. 2024, 63, 538–550. [Google Scholar] [CrossRef]
- Shuai, X. Distribution and discharge of lead during extracting and refining of the rare earth ore. Environ. Sci. Surv. 2013, 32, 61–63. [Google Scholar] [CrossRef]
- Wu, P. Migration and Transformation of Different Medium Elements in Water System of Mianning Rare Earth Mine. Master’s Thesis, Chengdu University of Technology, Chengdu, China, 2020. [Google Scholar]
- Lu, D.; Zhang, C.; Zhou, Z.; Huang, D.; Qin, C.; Nong, Z.; Ling, C.; Zhu, Y.; Chai, X. Pollution characteristics and source identification of farmland soils in Pb-Zn mining areas through an integrated approach. Environ. Geochem. Health 2023, 45, 2533–2547. [Google Scholar] [CrossRef]
- Wang, J.; He, Z.; Shi, H.; Liu, A.; Zhao, Y.; Liu, X.; Yan, T.; Li, L.; Dai, X. Sustainability Assessment and Source Apportionment of Soil Heavy Metals in a Mineral Aggregation Area of Datian County, South China. Sustainability 2024, 16, 5553. [Google Scholar] [CrossRef]
- Wang, F.; Guan, Q.; Tian, J.; Lin, J.; Yang, Y.; Yang, L.; Pan, N. Contamination characteristics, source apportionment, and health risk assessment of heavy metals in agricultural soil in the Hexi Corridor. Catena 2020, 191, 104573. [Google Scholar] [CrossRef]
- Rodriguez, L.; Ruiz, E.; Alonso-Azcarate, J.; Rincon, J. Heavy metal distribution and chemical speciation in tailings and soils around a Pb-Zn mine in Spain. J. Environ. Manag. 2009, 90, 1106–1116. [Google Scholar] [CrossRef]
- Wang, D.; Zheng, L.; Ren, M.; Li, C.; Dong, X.; Wei, X.; Zhou, W.; Cui, J. Zinc in soil reflecting the intensive coal mining activities: Evidence from stable zinc isotopes analysis. Ecotoxicol. Environ. Saf. 2022, 239, 113669. [Google Scholar] [CrossRef]
- Hu, W.; Wang, H.; Dong, L.; Huang, B.; Borggaard, O.K.; Hansen, H.C.B.; He, Y.; Holm, P.E. Source identification of heavy metals in peri-urban agricultural soils of southeast China: An integrated approach. Environ. Pollut. 2018, 237, 650–661. [Google Scholar] [CrossRef] [PubMed]
- Huang, S.S.; Liao, Q.L.; Hua, M.; Wu, X.M.; Bi, K.S.; Yan, C.Y.; Chen, B.; Zhang, X.Y. Survey of heavy metal pollution and assessment of agricultural soil in Yangzhong district, Jiangsu Province, China. Chemosphere 2007, 67, 2148–2155. [Google Scholar] [CrossRef]
- Xie, W.; Peng, C.; Wang, H.; Chen, W. Bioaccessibility and source identification of heavy metals in agricultural soils contaminated by mining activities. Environ. Earth Sci. 2018, 77, 606. [Google Scholar] [CrossRef]
- Solgi, E.; Solgi, M.; Rodriguez Martin, J.A. Spatial variability of heavy metal concentrations in vineyard soils on Malayer Plains (Iran). Environ. Forensics 2016, 17, 87–96. [Google Scholar] [CrossRef]
- Liu, W.H.; Zhao, J.Z.; Ouyang, Z.Y.; Söderlund, L.; Liu, G.H. Impacts of sewage irrigation on heavy metal distribution and contamination in Beijing, China. Environ. Int. 2005, 31, 805–812. [Google Scholar] [CrossRef]
- Ding, Q.; Cheng, G.; Wang, Y.; Zhuang, D. Effects of natural factors on the spatial distribution of heavy metals in soils surrounding mining regions. Sci. Total Environ. 2017, 578, 577–585. [Google Scholar] [CrossRef]
- Xu, Y.; Bi, R.; Li, Y. Effects of anthropogenic and natural environmental factors on the spatial distribution of trace elements in agricultural soils. Ecotoxicol. Environ. Saf. 2023, 249, 114436. [Google Scholar] [CrossRef] [PubMed]
- Liu, S.; Wang, D.; Shi, Z.; Tang, L.; Zhang, F.; Liao, C.; Li, X.; Xu, W. Geochemical Characteristics and Source Apportionment of Soil Elements in an Urban-rural Integration Area: A Case Study in the Qinglong Area of Tianfu New District. Environ. Sci. 2022, 43, 1535–1545. [Google Scholar] [CrossRef]
- Thornton, I. Geochemistry of cadmium. In Cadmium in the Environment; Birkhäuser: Basel, Switzerland, 1986; Volume 50. [Google Scholar]
- Liu, Y.; Xiao, T.; Zhu, Z.; Ma, L.; Li, H.; Ning, Z. Geogenic pollution, fractionation and potential risks of Cd and Zn in soils from a mountainous region underlain by black shale. Sci. Total Environ. 2021, 760, 143426. [Google Scholar] [CrossRef]
- Guo, Z.; Wang, Y. Research advances on the distribution, migration and transformation of cadmium in the environment. Adv. Environ. Prot. 2019, 3, 365–370. [Google Scholar] [CrossRef]
- Gomes, P.C.; Fontes, M.P.F.; da Silva, A.G.; Mendonça, E.D.; Netto, A.R. Selectivity sequence and competitive adsorption of heavy metals by Brazilian soils. Soil Sci. Soc. Am. J. 2001, 65, 1115–1121. [Google Scholar] [CrossRef]
- Misono, M.; Ochiai, E.i.; Saito, Y.; Yoneda, Y. A new dual parameter scale for the strength of Lewis acids and bases with the evaluation of their softness. J. Inorg. Nucl. Chem. 1967, 29, 2685–2691. [Google Scholar] [CrossRef]
- Anderson, P. Distribution coefficients of Cd, Co, Ni, and Zn in soils. Eur. J. Soil Sci. 1988, 39, 15–22. [Google Scholar] [CrossRef]
- Usman, A.R.A. The relative adsorption selectivities of Pb, Cu, Zn, Cd and Ni by soils developed on shale in New Valley, Egypt. Geoderma 2008, 144, 334–343. [Google Scholar] [CrossRef]
- Shaheen, S.M. Sorption and lability of cadmium and lead in different soils from Egypt and Greece. Geoderma 2009, 153, 61–68. [Google Scholar] [CrossRef]
- Shaheen, S.M.; Tsadilas, C.D.; Rinklebe, J. A review of the distribution coefficients of trace elements in soils: Influence of sorption system, element characteristics, and soil colloidal properties. Adv. Colloid Interface Sci. 2013, 201, 43–56. [Google Scholar] [CrossRef]
- Tang, L.; Werner, T.T. Global mining footprint mapped from high-resolution satellite imagery. Commun. Earth Environ. 2023, 4, 134. [Google Scholar] [CrossRef]
- Sonter, L.J.; Dade, M.C.; Watson, J.E.M.; Valenta, R.K. Renewable energy production will exacerbate mining threats to biodiversity. Nat. Commun. 2020, 11, 4174. [Google Scholar] [CrossRef]
- Alonzo, M.; Van Den Hoek, J.; Ahmed, N. Capturing coupled riparian and coastal disturbance from industrial mining using cloud-resilient satellite time series analysis. Sci. Rep. 2016, 6, 35129. [Google Scholar] [CrossRef]
- Caballero Espejo, J.; Messinger, M.; Román-Dañobeytia, F.; Ascorra, C.; Fernandez, L.E.; Silman, M. Deforestation and Forest Degradation Due to Gold Mining in the Peruvian Amazon: A 34-Year Perspective. Remote Sens. 2018, 10, 1903. [Google Scholar] [CrossRef]
- Barenblitt, A.; Payton, A.; Lagomasino, D.; Fatoyinbo, L.; Asare, K.; Aidoo, K.; Pigott, H.; Som, C.K.; Smeets, L.; Seidu, O. The large footprint of small-scale artisanal gold mining in Ghana. Sci. Total Environ. 2021, 781, 146644. [Google Scholar] [CrossRef] [PubMed]
- Tang, L.; Tim, T.W.; Xie, H.; Yang, J.; Shi, Z. A global-scale spatial assessment and geodatabase of mine areas. Glob. Planet. Change 2021, 204, 103578. [Google Scholar] [CrossRef]
- Shao, M. It took 1127 days for the Taihe Tunnel of Dabiao Reservoir Irrigation District Phase II Project to pass through. Sichuan Daily, 4 March 2024. [Google Scholar]


| Ei Classification Ranges | RI Classification Ranges | Pollution Level |
|---|---|---|
| Ei < 40 | RI < 150 | Low risk |
| 40 ≤ Ei < 80 | 150 ≤ RI < 300 | Moderate risk |
| 80 ≤ Ei < 160 | 300 ≤ RI < 600 | Considerable risk |
| 160 ≤ Ei < 320 | 600 ≤ RI | High risk |
| 320 ≤ Ei | Very high risk |
| Soil | Parameters | pH | Heavy Metal Concentrations in the Soil (mg/kg) | |||||||
|---|---|---|---|---|---|---|---|---|---|---|
| Cd | Pb | Cu | Zn | Ni | Cr | Hg | As | |||
| Topsoil (2946 samples) | Min | 4.12 | 0.06 | 11 | 3 | 42 | 4 | 7 | 0.01 | 0.12 |
| Max | 7.79 | 9.88 | 5180 | 179 | 499 | 177 | 876 | 4.81 | 35.2 | |
| Mean | 5.6 | 0.52 | 339 | 39 | 152 | 38 | 69 | 0.13 | 3.45 | |
| Median | 5.6 | 0.4 | 117 | 37 | 139 | 36 | 63 | 0.09 | 2.79 | |
| CVs (%) | 8.5 | 83.3 | 135.9 | 36.8 | 36.7 | 42.8 | 61.5 | 115.3 | 70.9 | |
| Exceeding rate (%) | / | 62.5 | 53.2 | 15.8 | 12 | 3.3 | 2.5 | 1.2 | 0 | |
| Parameters | Potential Risk Index Rating (%) | |||||||
|---|---|---|---|---|---|---|---|---|
| Min | Max | Mean | Low Risk | Moderate Risk | Considerable Risk | High Risk | Very High Risk | |
| Cd | 13.2 | 2179.4 | 114.6 | 5.5 | 41.3 | 41.5 | 13.6 | 3.6 |
| Pb | 1.8 | 798.9 | 52.3 | 65.4 | 11.4 | 13.4 | 9.1 | 0.6 |
| Cu | 0.7 | 40.7 | 8.8 | 99.9 | 0.1 | 0.0 | 0.0 | 0.0 |
| Ni | 0.5 | 22.7 | 4.8 | 100.0 | 0.0 | 0.0 | 0.0 | 0.0 |
| Zn | 0.5 | 6.4 | 2.0 | 100.0 | 0.0 | 0.0 | 0.0 | 0.0 |
| Cr | 0.2 | 25.0 | 2.0 | 100.0 | 0.0 | 0.0 | 0.0 | 0.0 |
| Hg | 6.4 | 3435.7 | 91.5 | 19.7 | 40.3 | 27.5 | 10.9 | 1.6 |
| As | 0.2 | 57.6 | 5.6 | 99.8 | 0.2 | 0.0 | 0.0 | 0.0 |
| RI | 56.7 | 3673.0 | 281.6 | 14.0 | 53.2 | 28.3 | 4.5 | - |
| Heavy Metals | Factor 1 | Factor 2 | Factor 3 |
|---|---|---|---|
| Cd | 0.834 | −0.074 | 0.008 |
| Pb | 0.826 | −0.117 | −0.185 |
| Zn | 0.925 | 0.078 | 0.003 |
| Cu | 0.374 | 0.738 | 0.191 |
| Ni | −0.250 | 0.837 | 0.234 |
| Cr | −0.138 | 0.780 | −0.278 |
| Hg | −0.079 | −0.045 | 0.650 |
| As | −0.027 | 0.130 | 0.796 |
| Eigenvalue | 2.5 | 1.9 | 1.0 |
| Variance interpretation (%) | 30.8 | 23.7 | 15.7 |
| Cumulative variance explanation rate (%) | 30.778 | 54.498 | 70.230 |
Disclaimer/Publisher’s Note: The statements, opinions and data contained in all publications are solely those of the individual author(s) and contributor(s) and not of MDPI and/or the editor(s). MDPI and/or the editor(s) disclaim responsibility for any injury to people or property resulting from any ideas, methods, instructions or products referred to in the content. |
© 2025 by the authors. Licensee MDPI, Basel, Switzerland. This article is an open access article distributed under the terms and conditions of the Creative Commons Attribution (CC BY) license (https://creativecommons.org/licenses/by/4.0/).
Share and Cite
He, S.; Li, Y.; Tang, L.; Yang, F.; Xie, Y.; Liu, X.; Xu, L. Migration and Accumulation Mechanisms of Heavy Metals in Soil from Maoniuping Rare Earth Elements Mining, Southwest China. Land 2025, 14, 611. https://doi.org/10.3390/land14030611
He S, Li Y, Tang L, Yang F, Xie Y, Liu X, Xu L. Migration and Accumulation Mechanisms of Heavy Metals in Soil from Maoniuping Rare Earth Elements Mining, Southwest China. Land. 2025; 14(3):611. https://doi.org/10.3390/land14030611
Chicago/Turabian StyleHe, Sijie, Yang Li, Liang Tang, Fang Yang, Yuan Xie, Xuemin Liu, and Lei Xu. 2025. "Migration and Accumulation Mechanisms of Heavy Metals in Soil from Maoniuping Rare Earth Elements Mining, Southwest China" Land 14, no. 3: 611. https://doi.org/10.3390/land14030611
APA StyleHe, S., Li, Y., Tang, L., Yang, F., Xie, Y., Liu, X., & Xu, L. (2025). Migration and Accumulation Mechanisms of Heavy Metals in Soil from Maoniuping Rare Earth Elements Mining, Southwest China. Land, 14(3), 611. https://doi.org/10.3390/land14030611