Article

Integrating Street View Images, Deep Learning, and sDNA for Evaluating University Campus Outdoor Public Spaces: A Focus on Restorative Benefits and Accessibility

School of Architecture, Southeast University, Nanjing 210096, China
*
Author to whom correspondence should be addressed.
Land 2025, 14(3), 610; https://doi.org/10.3390/land14030610
Submission received: 12 February 2025 / Revised: 3 March 2025 / Accepted: 11 March 2025 / Published: 13 March 2025
(This article belongs to the Section Land, Biodiversity, and Human Wellbeing)

Abstract

:
The mental health of university students has received much attention due to the various pressures of studies, life, and employment. Several studies have confirmed that campus public spaces contain multiple restorative potentials. Yet, the campus public space is still not ready to meet students’ new need for restorative percetions. Renewal practices for campus public spaces that integrate multi-issues are becoming more important, and further clarification of the measurement methods and optimization pathways is also needed. This study applied the semantic segmentation technique of the deep learning model to extract the feature indicators of outdoor public space based on street view image (SVI) data. The subjective evaluation of small-scale SVIs was obtained using the perceived restorative scale-11 (PRS-11) questionnaire. On this basis, restorative benefit evaluation models were established, including the explanatory and predictive models. The explanatory model used Pearson’s correlation and multiple linear regression analysis to identify the key indicators affecting restorative benefits, and the predictive model used the XGBoost 1.7.3 algorithm to predict the restorative benefit scores on the campus scale. The accessibility results from sDNA were then overlayed to form a comprehensive assessment matrix of restoration benefits and accessibility dimensions to identify further “areas with optimization potential”. In this way, three types of spatial dimensions (LRB-HA, HRB-LA, and LRB-LA) and sequential orders of temporal dimensions (short-term, medium-term, and long-term) were combined to propose optimization pathways for campus public space with the dual control of restorative benefits and accessibility. This study provides methodological guidelines and empirical data for campus regeneration and promotes outdoor public space efficiency. In addition, it can offer positive references for neighborhood-scale urban design and sustainable development.

1. Introduction

The development of university campuses in China has gradually shifted from “incremental development” to a new stage of “stock renewal”, with quality improvement and human-oriented consideration becoming the popular guides for universities and cities [1]. It has become the consensus to promote the creation of a human-centered urban built environment. The university campus itself is just like a small community. It fully possesses the social, economic, and cultural characteristics of the city where it is located, and can be understood as a “small city” or “miniature city” [2]. It can be an experimental field for empirical research on new data and technologies, thereby offering valuable references for the study and practice of new urban design. In addition, university campuses have been recognized as high-pressure environments prone to “information overload” [3]. University students spend much more time studying and participating in research than other groups. Consequently, they are at higher risk of experiencing attention fatigue and stress, which may exert negative effects on their mental health [4]. A survey conducted by the World Health Organization (WHO) found that mental health problems are widespread among university students [5]. Meanwhile, according to the “2022 Survey Report on the Mental Health Status of College Students” in China, it was indicated that nearly 90% of students are currently suffering from varying degrees of psychological stress in academics, employment, and interpersonal relationships [6]. As the mainstay of social development, excessive psychological pressure on university students can lead to anxiety, depression, and other mental health problems, and even affect their studies and future career development. The issue of how to relieve students’ stress and promote their physical and mental health has become a widespread concern in society.
Public spaces in university campuses serve as crucial elements in enhancing environmental quality and actively contribute to university students’ physical and mental well-being. They play an active role in improving mood, relieving psychological stress, and bettering academic performance [7]. According to the principles of health geography, the local environment deeply influences human health during the healing process [8]. Thus, the outdoor open space on university campuses is regarded as a potentially restorative environment [9,10,11]. This underscores the urgent need to optimize campus public spaces to improve students’ mental health and overall well-being.
In the early 21st century, Chinese higher education and its campuses both experienced rapid growth. By December 2023, enrollment in China’s higher education institutions reached nearly 47,631,900 students across 3074 colleges and universities [12]. This explosive increase in the number of students and the rapid construction of campuses have led to a multitude of space problems, including poor design quality, low vitality, disorganization, and the unequal distribution of spatial resources [13]. At the current stage, the contradiction between the current campus outdoor public spaces and growing demands from students is becoming increasingly prominent. Also, accessibility, the most widely used metric for assessing the relationship between supply and demand, fails to encompass the emerging demand for restorative perceptoins.
Therefore, optimizing campus public spaces that integrate restorative benefits with accessibility has become one of the prominent issues in contemporary campus renewal practices. Meanwhile, combining new data and technologies enables a profound and nuanced exploration of environmental experience information, such as human perception and behavior, and achieves robust data computation and visualization capabilities [14,15]. This approach offers inspiring new perspectives for public space research. By employing data analysis, modeling, and prediction, this study focuses on the human scale and spatial characteristics to enhance the scientificity of spatial optimization design with empirical data. This is also in line with the United Nations Sustainable Development Goals (SDGs), specifically promoting “good health and well-being (SDG3)” and fostering “sustainable cities and communities (SDG11)” [16].

2. Literature Review

2.1. Outdoor Public Spaces on University Campuses

Urban public space can be defined as “open places where people go to participate in group or individual activities” [17], encompassing typical examples such as streets, squares, and parks. The composition of outdoor public space on university campuses is like that of urban public space, including roads, green/blue spaces, sports spaces, and service facilities. However, the target audience is mainly the students and faculty. These spaces provide students and faculty with locales for daily work, study, and life activities and serve as the spatial medium for most physical facilities and activities correlated with students’ psychological well-being. These areas’ spatial characteristics and qualities can also influence students’ restorative perceptions [18].
The quality of campus outdoor public spaces has emerged as a critical component in promoting the physical and mental health and well-being of university students, and it represents a key link in realizing the sustainable development of the campus environment. Therefore, the current practice of optimizing campus public spaces should also consider enhancing restorative benefits to promote the overall physical and mental health and well-being of university students [19]. However, the restorative potential of university campus environments has not been sufficiently explored, and research has mainly focused on the benefits provided by green spaces [20,21,22], natural elements [23,24], and the characteristics and qualities of public spaces [18,25]. These studies have focused on assessing and comparing the restorative benefits of different types of landscape spaces, but the lack of systematic evaluation at the campus level has hindered the overall understanding and prediction. The principle of “wholeness” in Gestalt psychology suggests that the influence of individual local features cannot replace the impact of the whole environment [26]. Concurrently, previous studies have also been deficient in fundamental quantitative data and evaluation indicators. As a result, their guidance for the fine-grained practice of campus regeneration is limited.
In addition, university campuses differ from parks and green spaces, which are mainly used for leisure activities. The higher the restorative benefits, the better is not the objective of the optimization design. Therefore, the optimization of campus public spaces should also consider not only the supply of the space itself, but also other relevant factors. This integrated consideration is essential for effective research and the quality of campus renewal practices.

2.2. Measuring the Restorative Benefits of the Built Environment

Several important theoretical frameworks have been proposed to explain the restorative benefits of the environment, mainly including Attention Restoration Theory (ART) [27] and Stress Reduction Theory (SRT) [28]. These theories emphasize that natural and partially built environments can provide individuals with positive psychological benefits and promote physical and mental health. Numerous subsequent studies have further supported these theories. Among the most extensive and fundamental studies are those comparing natural and urban environments [29]. With the increasing depth and expansion of multidisciplinary research endeavors, the restorative potential of various urban spaces and environmental types has been empirically verified. These include blue/green spaces [30], pedestrian spaces [31,32], and urban third spaces represented by art galleries and cafes [33], as well as historical landmarks and sites [34]. Furthermore, the campus, as an important component of the urban space, has garnered increasing scholarly attention, with its restorative potential being supported by more scholarly research [9,10,35].
Various methods and tools have been developed for the quantitative measurement of restorative benefits. Scholars have integrated on-site or virtual scenarios to measure and evaluate environmental restorative benefits from multiple dimensions. These dimensions encompass overall environmental types, environmental characteristics, spatial characteristics, and specific elements. The scope of these assessments ranges from individual psychological perception to physiological responses, from individual subjective evaluations to assessments of objective environmental factors, and from single data points to comprehensive evaluation models based on multi-source data. In summary, the relevant measurement methods can mainly be classified into three types:
  • On-site measurements in real-world environments based on small data. This type includes methods such as subjective scale questionnaires [36] and physiological signal indicators [37,38,39]. It is a classic method that has been widely recognized and applied. Still, these studies are generally small-scale experimental explorations that lack broad representativeness. The experimental costs are high and inefficient, making it challenging to present a holistic picture of spatial perception in a broader range of areas, like neighborhoods;
  • Two ways of measurement in laboratory environments. This type includes big data, such as street view images (SVIs) with artificial intelligence (AI) technology [40,41], and small data, such as physiological signal indicators or subjective scale questionnaires with virtual reality (VR) and other technologies [42,43,44,45,46]. The introduction of new data and technologies has greatly improved research efficiency. Still, both the big data and small data approaches have the disadvantage of being unable to reproduce all the information in the real environment;
  • Mixed measurements based on multi-source data and a combination of techniques. Combining real-world and laboratory environments’ measurement advantages makes data acquisition more comprehensive, accurate, and efficient. It can better respond to the current needs of increasingly complex urban built environment research. Mixed measures combining multi-source data and multiple analysis methods have gradually become a new hot research topic [47,48,49,50], while integrating big and small data also shows great research potential.

2.3. Accessibility of Public Spaces

In 1959, Hansen first proposed the concept of accessibility, which he defined as the scale of opportunities for nodes in a transportation network to interact with each other [51]. Accessibility serves as a spatial “opportunity potential” that evaluates the correspondence between the supply of public spatial services and the demand from individuals within a defined spatial domain. This assessment is conducted across both spatial and functional dimensions by quantifying the cost distance from a given point in a space to another point within the street network [52]. The concept of accessibility has garnered widespread application across a multitude of disciplines, encompassing urban design, landscape architecture, geographic information, and urban planning. Meanwhile, the relevant research hotspots have gradually shifted from the initial relationship between physical activity and spatial accessibility to public health, environmental justice, and green space equity. The correlation between public space accessibility and residents’ physical and mental health has emerged as a prominent research focus. It has been found that better public space accessibility can reduce the risk of physical and mental diseases and promote overall health and well-being.
Good walking accessibility serves as the spatial foundation of a campus, which covers diverse activities such as the restorative behaviors of students. Currently, there are many methods to measure accessibility, such as buffer analysis, network analysis, and gravity modeling, etc., among which the network analysis represented by space syntax is one of the most widely used measurement methods [53]. Hillier’s (1984) spatial syntax theory and model based on the principle of “visibility and accessibility” has been proven to be effective [54]. However, in the face of more complex urban areas, distance is no longer the main factor affecting people’s wayfinding, and the integration degree of spatial syntax cannot be directly used to express the potential of pedestrian or vehicular flow. To overcome this limitation, Chris Webster and Alain Chiaradia of Cardiff University (UK) developed the software for spatial design network analysis (sDNA 4.0.3, https://sdna.cardiff.ac.uk/sdna/ (accessed on 5 June 2024)) based on the connectivity method [55]. sDNA shows superior adaptability for walk accessibility analysis. It is capable of depicting spatial accessibility in a more detailed way. Moreover, sDNA exhibits excellent compatibility with ArcGIS 10.6 software [56] and has been widely applied in the field of urban design in recent years. Meanwhile, the current accessibility measurement method mainly evaluates the space from the perspective of supply, but still lacks the measurement of human needs. Relying on the ArcGIS platform, research on the relationship between supply and demand has become a trend [57]. Consequently, a comprehensive analysis framework that integrates multi-source data has been developed. This framework aims to change the previous research situation of “supply over demand”, providing a more detailed and accurate assessment of urban spatial accessibility.

2.4. Research Combined Street View Images (SVIs) with Deep Learning

The human-centered perspective of images, serving as a visualization medium, has been extensively employed in empirical studies concerning spatio-temporal perceptions of the built environment [58,59]. Images also provide an efficient and replicable research tool for urban design practices. While randomly collected image data tend to lack comprehensive and coordinated information, as well as overall consideration of the environment, a large amount of geographically coordinated SVI data have shown their great advantages. This type of data brings new possibilities for studies on human perceptions of the built environment. Various studies have revealed the potential of combining SVIs with deep learning to conduct large-scale, high-precision, and high-efficiency research on the relationship between environmental characteristics and subjective perceptions [60,61].
SVIs, combined with deep learning, have gradually become a medium for integrating traditional design theories and investigative methods with artificial intelligence techniques. Scholars like Rundle et al. [62] and Kang et al. [63] have proven that the evaluation of spatial perception based on SVI data is consistent with the results of on-site perceptions. In recent years, exploring the interaction mechanism between built environments and human perceptions has become a new research trend. By capturing the complex relationship between the built environment and human perceptions, the evaluation and prediction of different groups in different scales can be realized [64,65,66]. Also, the application of SVI data to assess restorative benefits has received increasing attention [49]. In general, most current research focuses on analyzing the urban macro-scale. The research framework combining SVIs and deep learning can be introduced into the neighborhood scale (e.g., university campuses). The exploration of the correlation between objective characteristics and subjective perceptions also provides more types of empirical data and methodological support for fine-grained urban regeneration practices.

2.5. Research Objective

Although research on the restorative benefits of natural or built environments has been carried out from different perspectives, and there are relatively rich research results, we still find the following shortcomings:
  • Previous studies on the restorative benefits are based on different theories, techniques, and methods. They have not yet constructed a clear and scientific evaluation methodology for campuses, and the key indicators are unclear, which results in a lack of further verification of the method’s applicability;
  • The results derived from the existing evaluation methods, whether subjective or objective, can only delineate the degree of restorative benefits associated with a specific environment type. However, these methods are deficient in the overall assessment of the environment, making it difficult to support campus renewal practices;
  • The optimization of campus public space to improve restorative benefits should seek a balance between the space supply and the behavioral accessibility of students, which should also be a key concern in this study.
Given the above research gaps and available methodologies, we aim to address the following research objectives:
  • Establish restorative benefit evaluation models for the urban neighborhood scale represented by the university campus. The framework is based on street view image data and combines small-scale scoring evaluation with deep learning techniques to construct restorative benefit evaluation models for outdoor public spaces, identifying key indicators and realizing high-precision prediction on the campus scale.
  • Explore the optimization pathways of university campus public spaces with the dual control of restorative benefits and accessibility. After clarifying the two-dimensional characteristics, an overlay analysis is carried out to explore optimization pathways that combine multiple types in the spatial dimension and sequential order in the temporal dimension.
By addressing these two fundamental issues, this study adopts the improvement of restorative benefits as the research entry point. It focuses on the human scale and is based on spatial characteristics, aiming to establish efficient and precise tools for the evaluation and prediction of restorative benefits. Through the empirical evidence of data, it seeks to enhance the scientificity of the optimization design, thereby providing new ideas for the planning and decision-making process of campus regeneration.

3. Materials and Methods

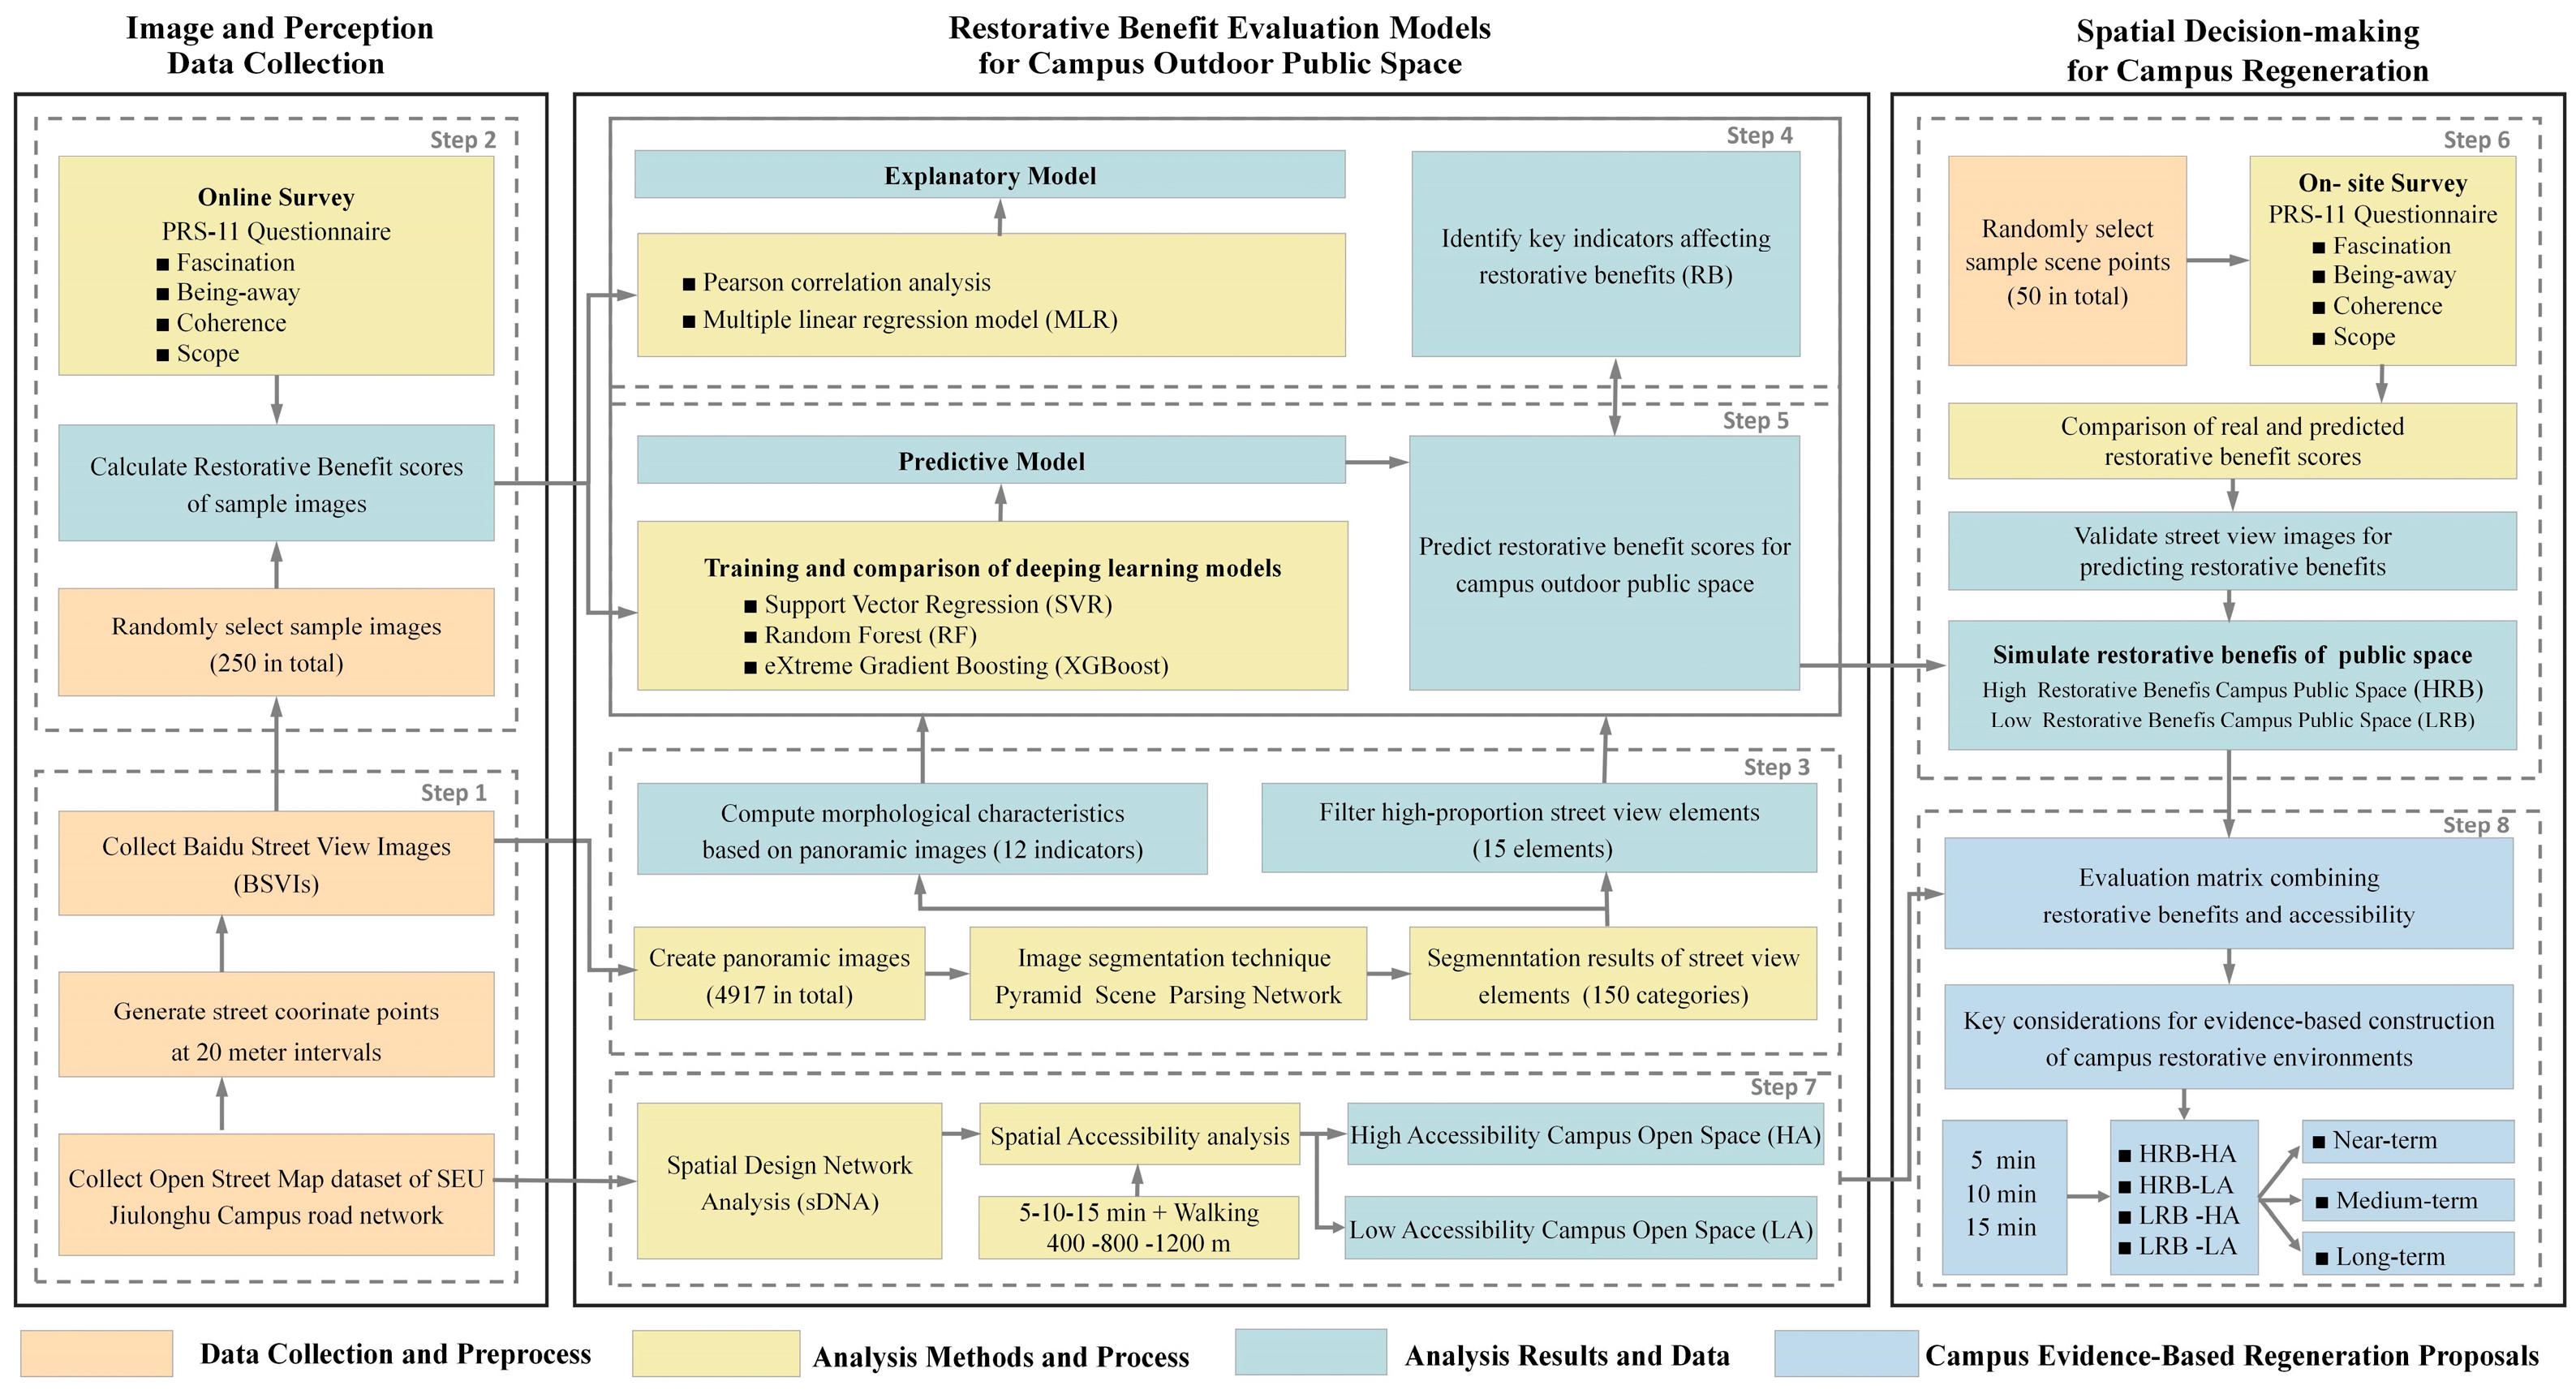
3.1. Research Framework

This study established restorative benefit evaluation models for outdoor public spaces on university campuses that integrate street view image data, deep learning algorithms, and sDNA methods. Based on the above results, optimization pathways for campus outdoor public spaces were proposed with the dual control of restorative benefits and accessibility, which can be used to support spatial decision-making processes for campus regeneration (Figure 1). The main steps are as follows:
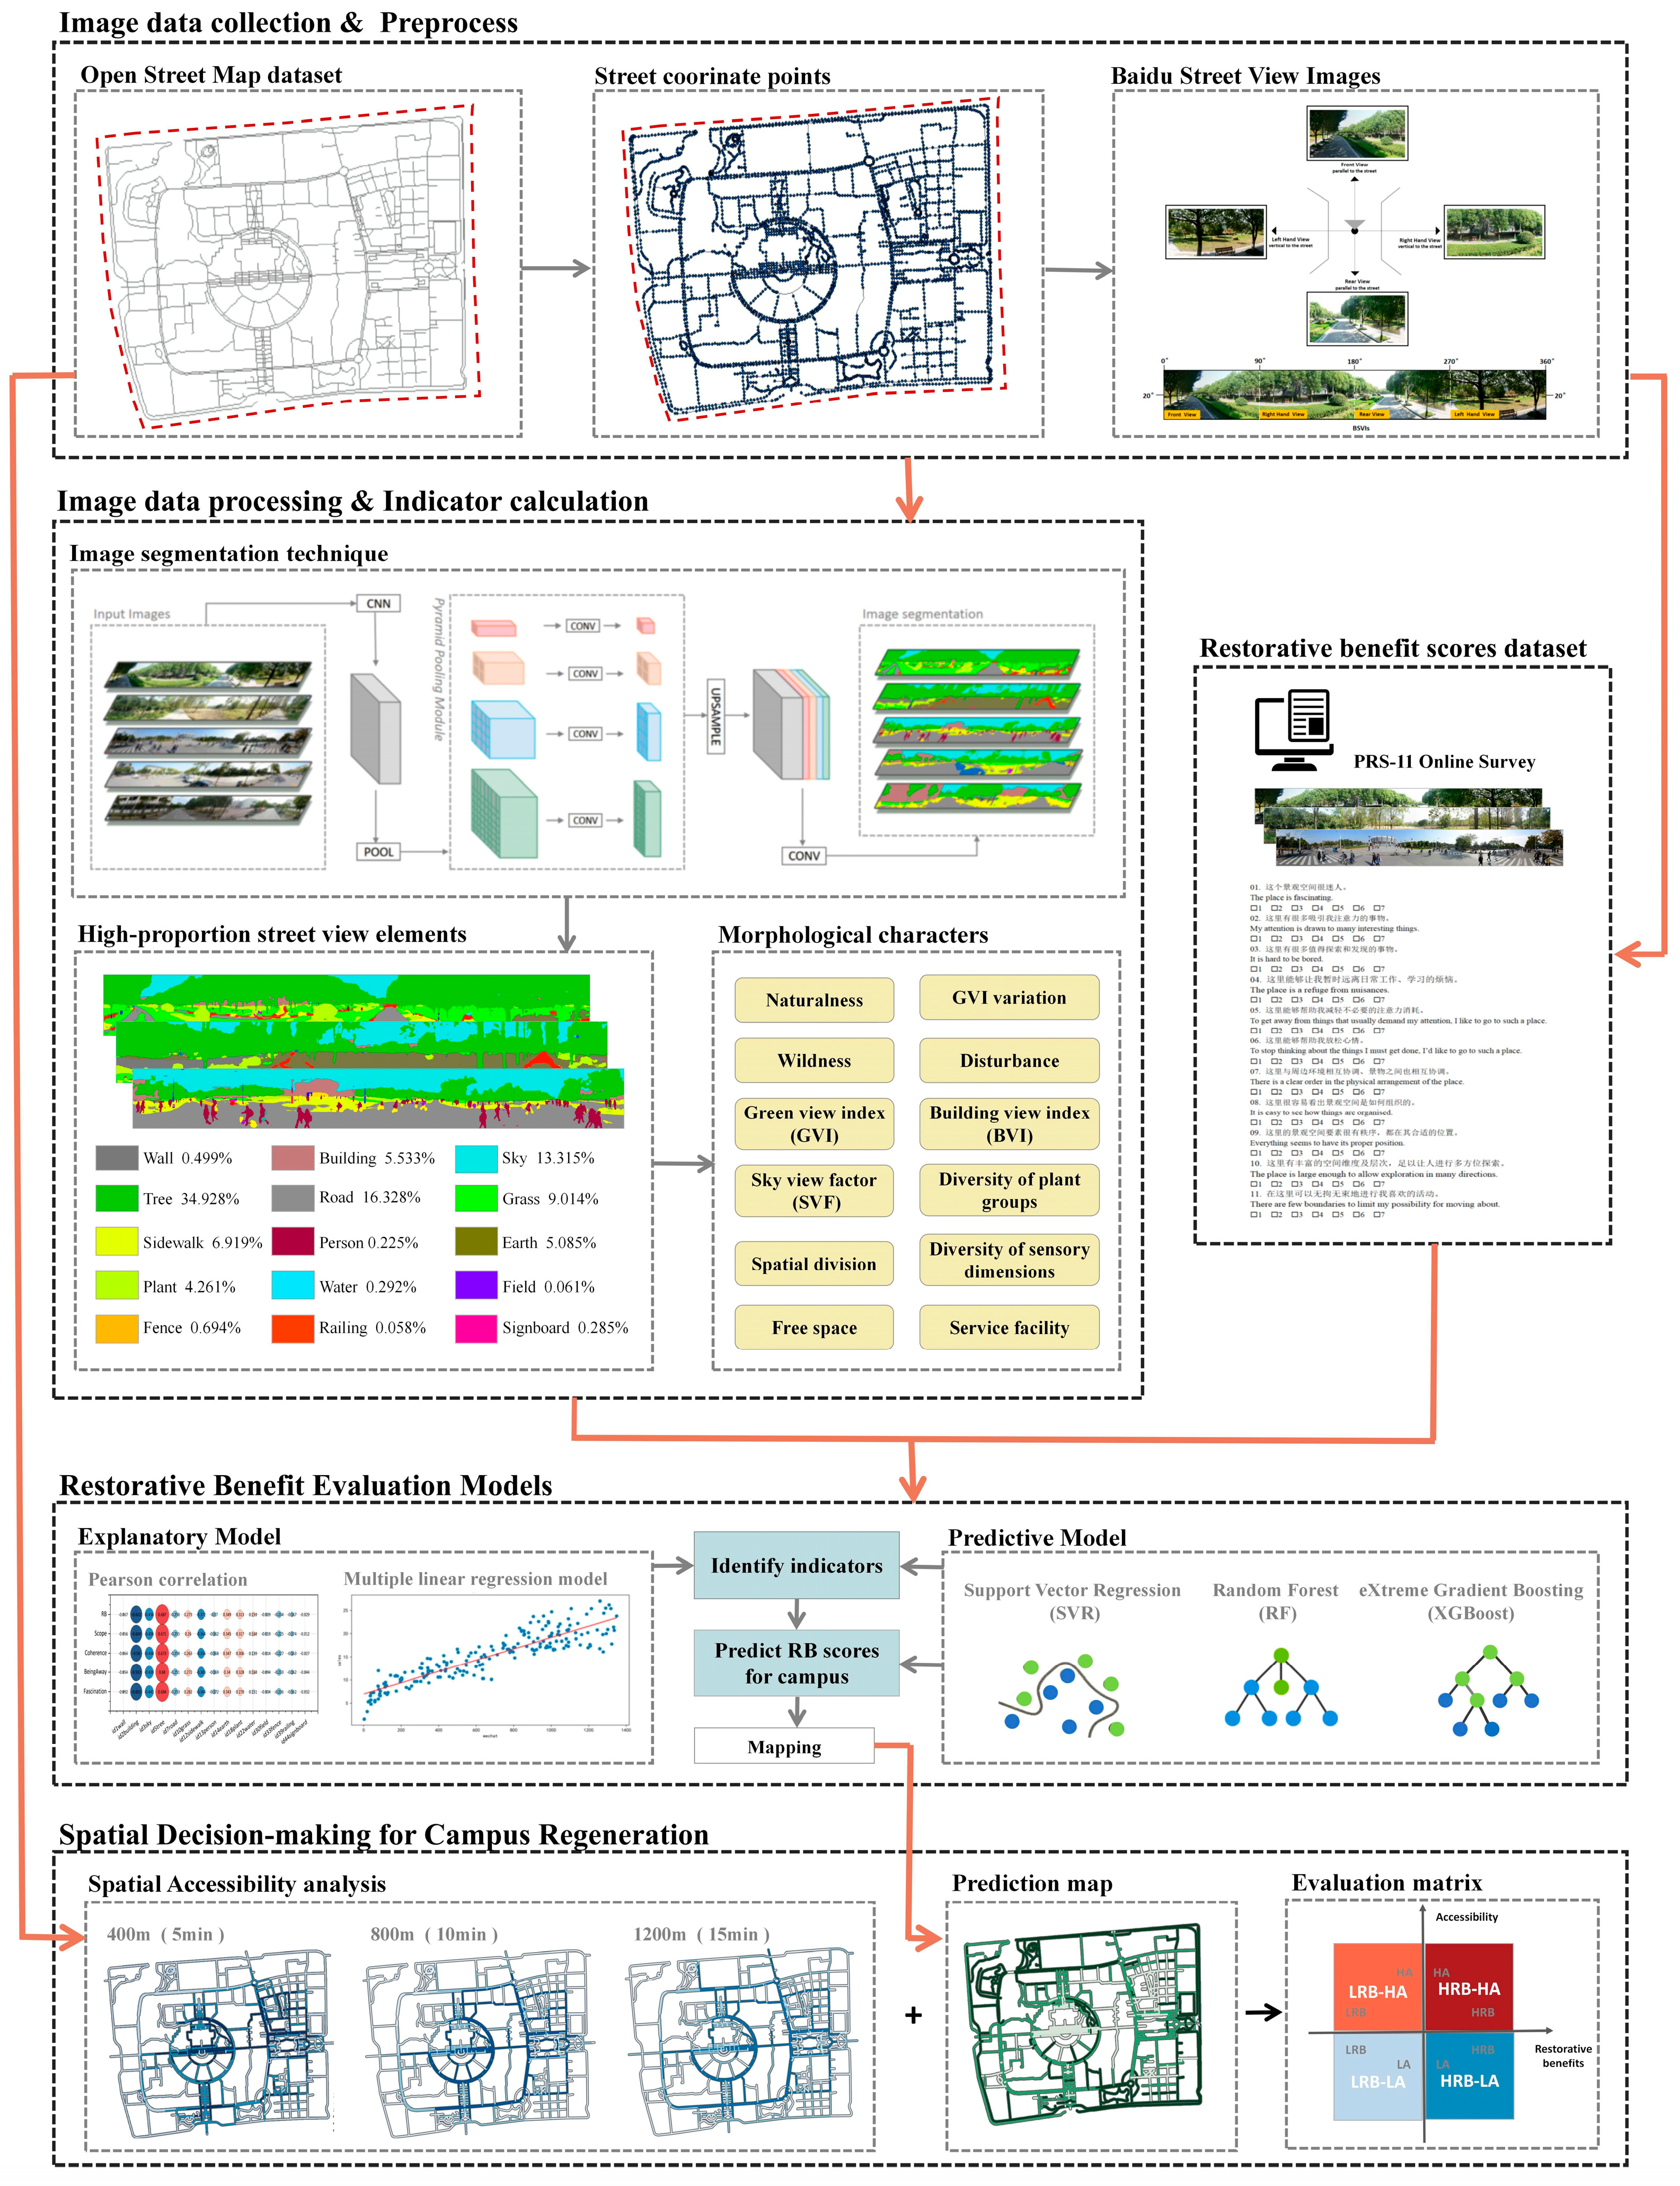
  • Data Acquisition and Character Extraction: Open Street Map (OSM) and Baidu Map API platforms were used to acquire the campus street view image (SVI) data from a human perspective in batches. Computer vision technology (e.g., image semantic segmentation technology) was used to measure spatial elements and morphological indicators in SVIs quantitatively. Based on the PRS-11 scale questionnaire and Baidu SVI data, an online survey was used to score and label the restorative benefits of 250 randomly selected sample images;
  • Modeling and Spatial Prediction: Models for evaluating the restorative benefits of outdoor public spaces on university campuses were established and divided into explanatory and predictive models. The explanatory model uses Pearson’s correlation, multiple linear regression, and other analytical methods to identify the key spatial indicators that affect the restorative benefits. For the predictive model, the SVR, RF, and XGBoost algorithms were compared and selected to achieve the best comprehensive prediction of the overall campus. The spatial mapping of the results was visualized with the help of ArcGIS software;
  • Overlay Analysis and Optimization Pathway: The results of spatial accessibility analysis based on OSM and sDNA were overlayed to form an evaluation matrix, with two dimensions of restorative benefits and accessibility. Four different areas were identified: high restorative benefits and high accessibility (HRB-HA), high restorative benefits but low accessibility (HRB-LA), low restorative benefits but high accessibility (LRB-HA), and low restorative benefits and low accessibility (LRB-LA). Based on the results above, the optimization pathways with the dual control of restorative benefits and accessibility for campus outdoor public spaces were constructed by combining the three types (LRB-HA, HRB-LA, and LRB-LA) of the spatial dimension and the sequential order (near-term, medium-term, and long-term) of the temporal dimension.
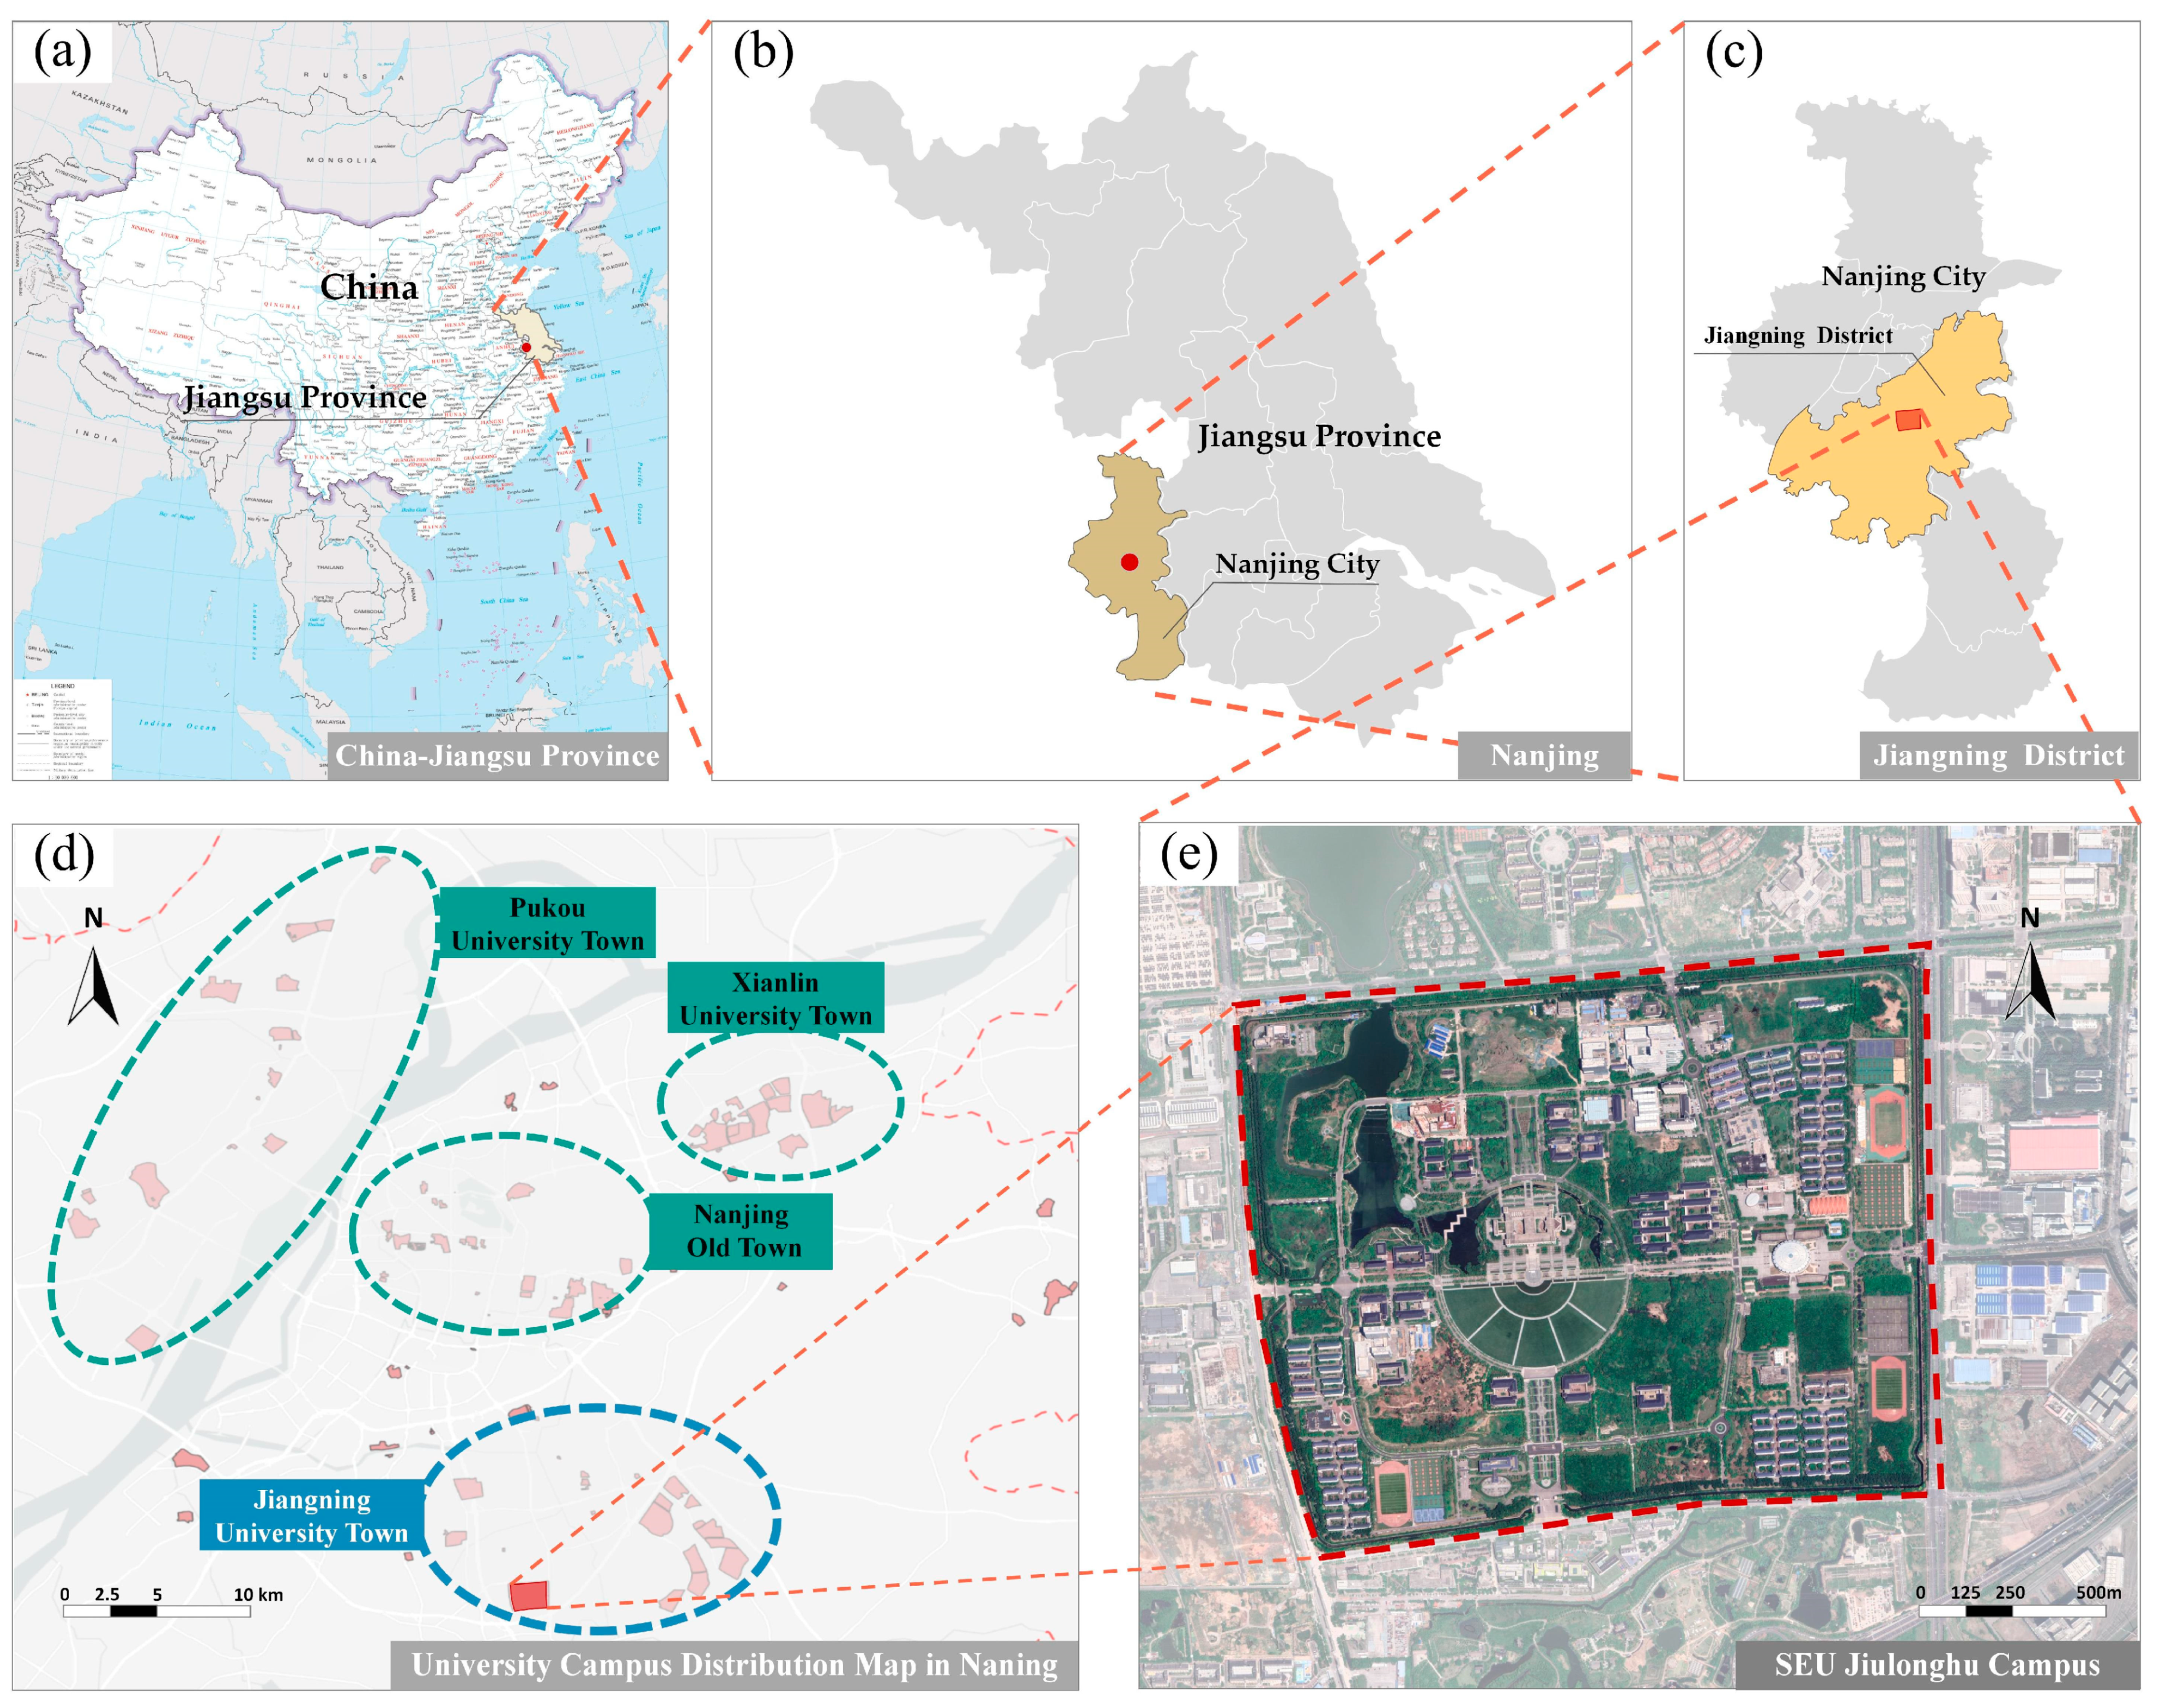
Figure 1. The analytical framework of the study.
Land 14 00610 g001
The specific research workflow can be seen in Figure 2.

3.2. Study Area

Nanjing is one of China’s most important science and education centers, ranking 5th among the world’s top 20 research cities in 2023 [67]. There are 51 colleges and universities in Nanjing [68], and the number of university campuses is more than 100, with a complete range and a wide span of construction years. Four educational districts have been formed: Old City, Xianlin University Town, Jiangning University Town, and Pukou University Town (Figure 3d). The number of campuses built around 2000 and after accounts for nearly 60%, and these are the focus of current campus renewal practices.
The Jiulonghu campus of Southeast University is a typical representative of the new campuses built after 2000 in Nanjing. The study area is located in the Jiangning District of Nanjing, China, covering an area of nearly 2.5 km2, and was put into use in September 2006 (Figure 3). The overall campus space is well organized and rigorous, combining the place’s character, culture, and functional needs, taking the library and the large lawn in front of it as the center and setting up the centralized teaching area, the faculty research area, and the living area around it. The introduction of water systems in the landscape design creates an open and modern campus landscape. The research results can provide technical support and a positive reference for other Chinese universities.

3.3. Data Collection

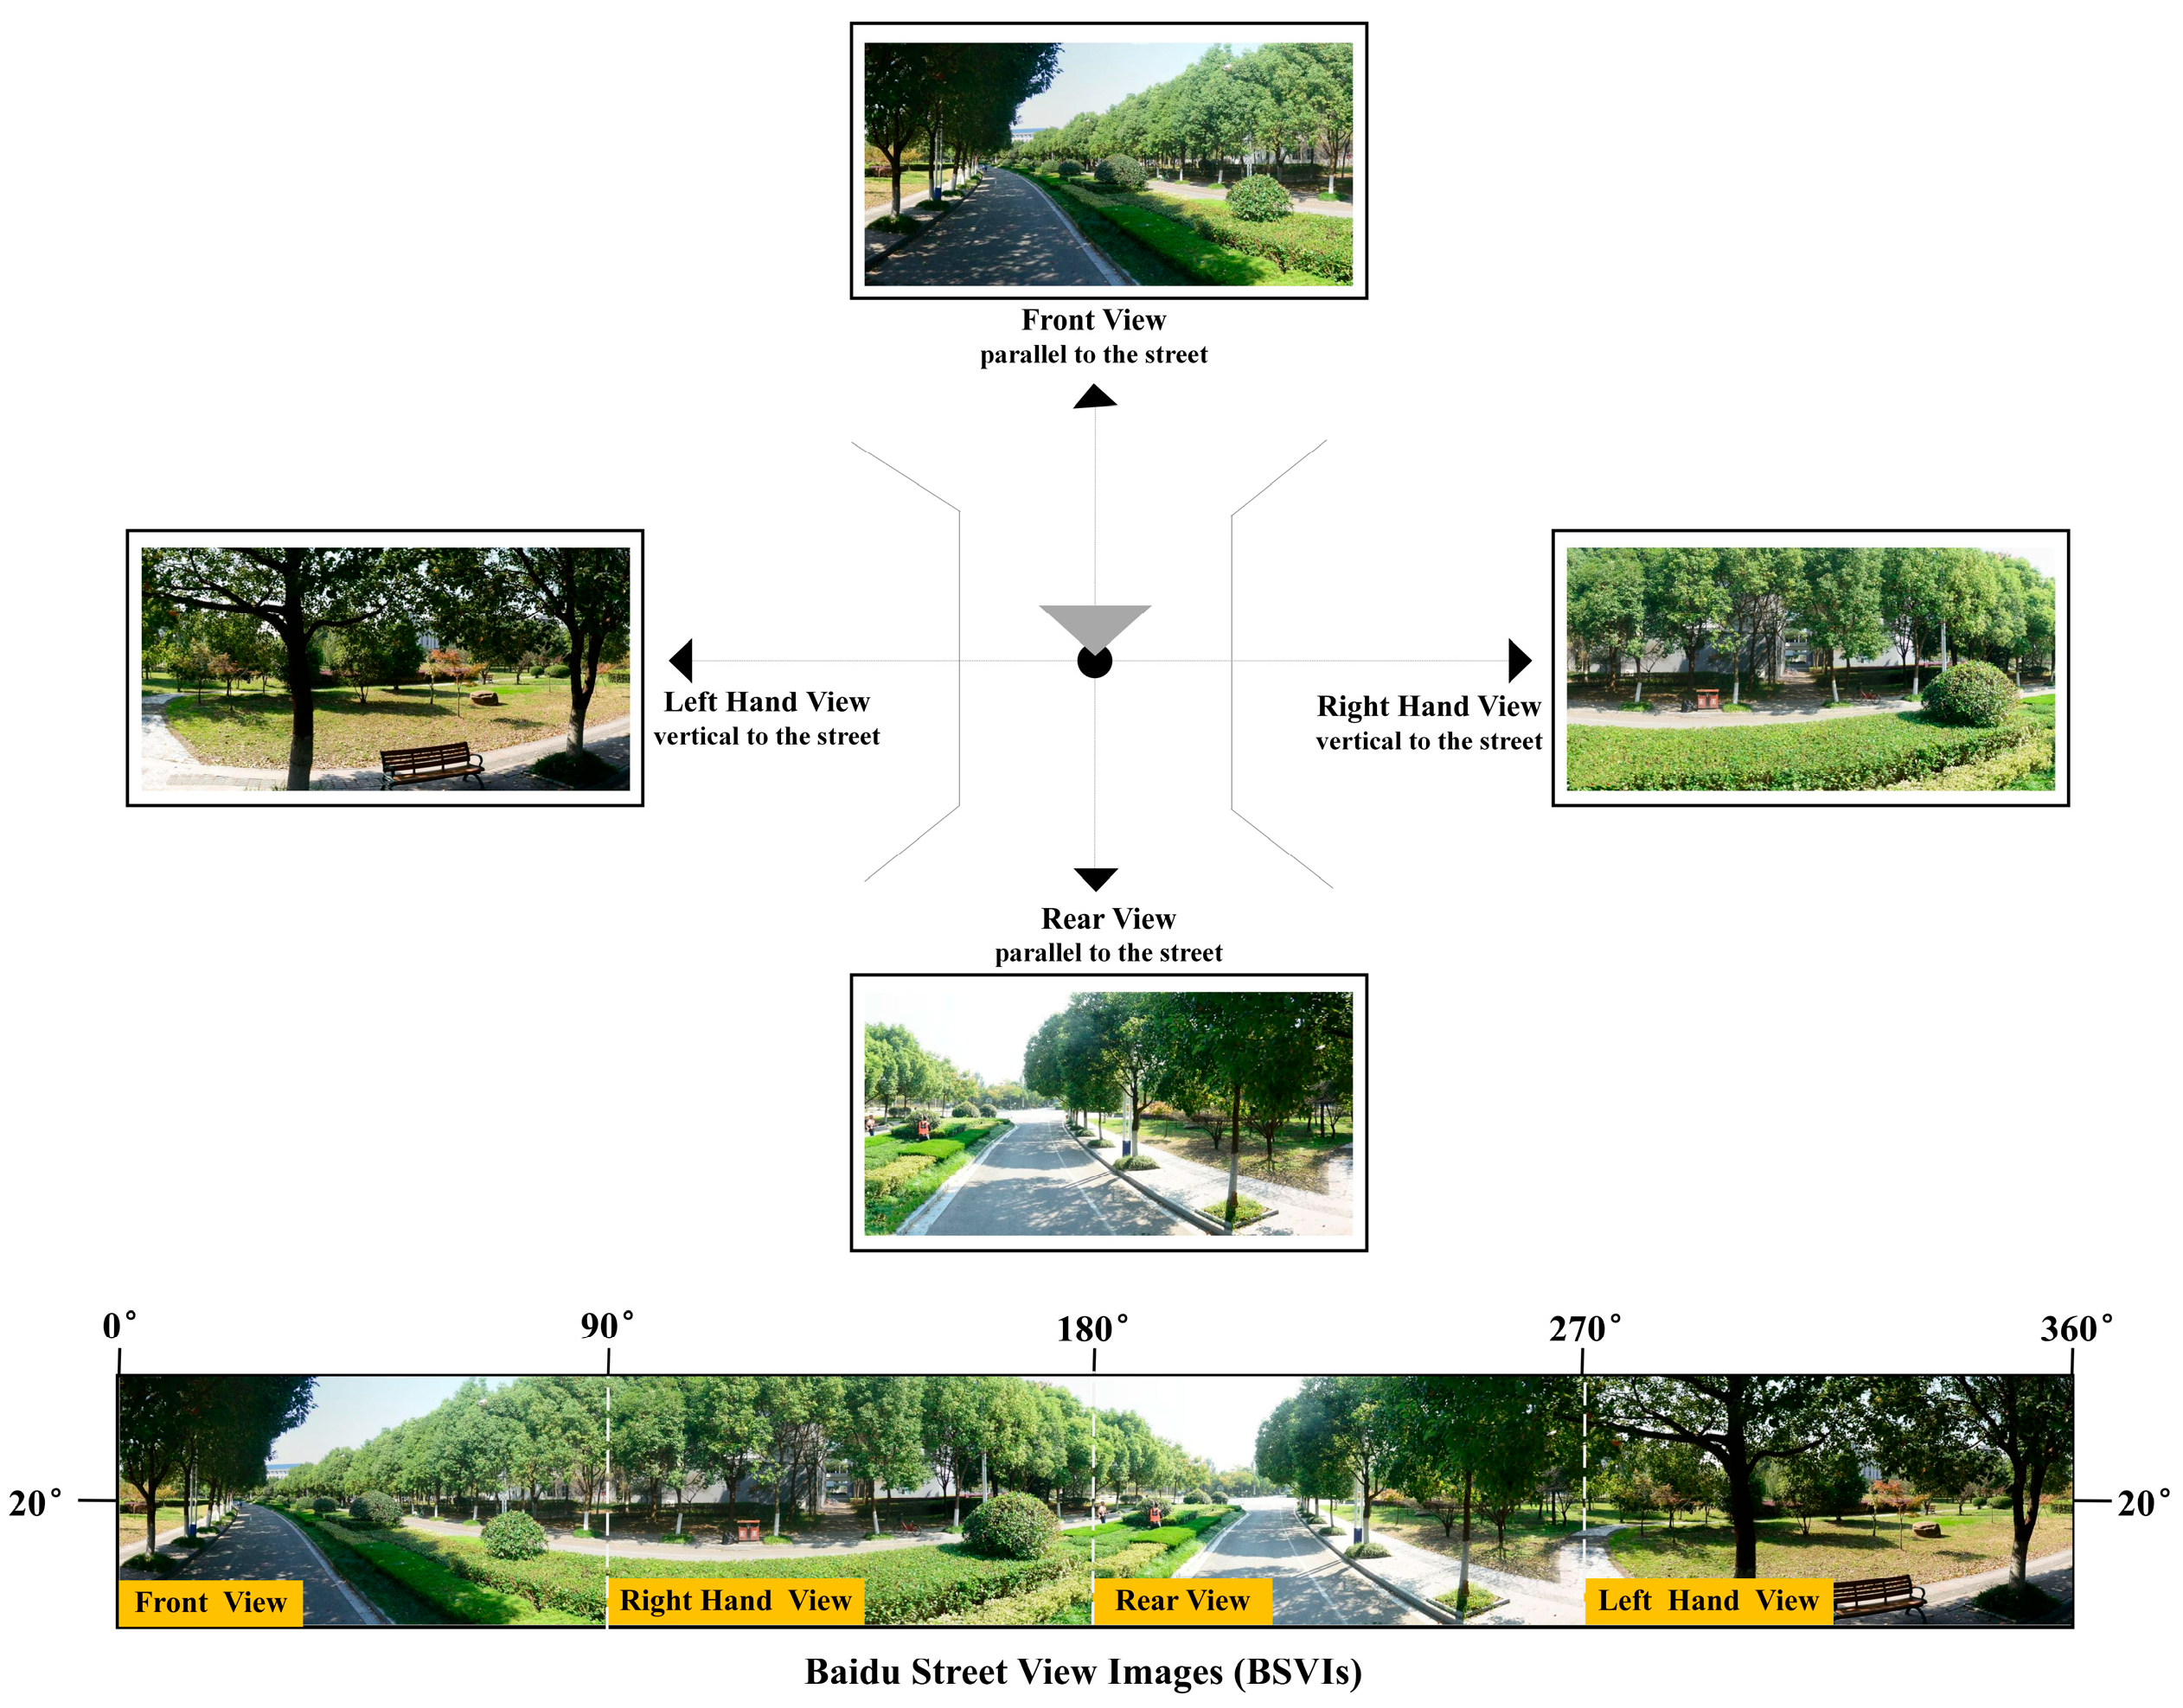
3.3.1. Baidu Street View Image Data Collection

The big data of street view images provide a way to measure the “absence” of the built environment centered on the individual [69]. In this study, SVIs are used as convenient and effective data sources for obtaining information about the campus environment. In addition, it has been shown that 87% of university students receive their main details on the campus environment through visual means, and that visual stimuli influence 75% to 90% of their behaviors [70]. To provide a comprehensive measure of restorative perceptions, this study collected street view images on the Jiulonghu campus of Southeast University in August 2024, collecting and producing street coordinate point data at 20 m intervals. A total of 5346 coordinate points were generated by integrating road network data obtained from OSM with ArcGIS. These points were utilized to calculate the road network topology based on the viewpoints of each sampling point. This approach was employed to ensure that all SVIs were aligned parallel to the spatial long-axis direction of the road.
To accurately simulate the perception of the human perspective, the acquisition parameters were set specifically as follows: after the coordinate data of these sample points are converted to the BD09 coordinate system, the pitch angle is set to 20°, the horizontal field of view (fov) is set to 90°, and the maximum number of pixels in the image is set to 1024 × 512 [71]. The street views in four orientations (front, right hand, rear, and left hand) were acquired using the Baidu Map API (https://api.map.Baidu.com/panorama/v2?ak=YOURKEY (accessed on 3 August 2024)) and stitched together to form a 360° panoramic image of the sampling point (Figure 4). On this basis, the 21,388 street view images obtained were cleaned to remove invalid street view image data. Finally, 4917 panoramic images and 19,668 street view images were collected to ensure reliability and accuracy for follow-up analysis.

3.3.2. Selected Spatial Indicators and Online Survey

(1)
Spatial Indicators
The selection of spatial indicators is meticulously conducted with dual considerations. Firstly, it considers the indicators’ capacity to reflect the key characteristics of human perceptions comprehensively. Secondly, it evaluates whether the indicators are quantifiable. This dual consideration is crucial for enabling precise measurement and comparison, thereby ensuring the effectiveness and objectivity of the evaluation. In this study, the selected indicators are mainly spatial elements and morphological indicators, which comprehensively explore the relationship between the objective environment and subjective perception.
Drawing on previous studies [59,72,73,74,75], we selected 15 spatial elements and 12 morphological indicators to objectively measure the restorative benefits of campus public spaces. Among them, the 15 spatial element indicators come from the results of panoramic image semantic segmentation and focus on selecting the top 15 average proportions of the different spatial elements. The 12 spatial morphology indicators are the results of the comprehensive effects of multiple elements, mainly referred to as the quantitative indicators proposed by Zhang et al. [75] based on the conceptual framework of perceived sensory dimensions (PSDs) [76]. The morphological indicators selected for this study are shown in Table 1 and Table S2 (Supplementary Materials: Table S2. The related street view elements of the morphological indicators and their original names of items in ADE20K) and their relevance to restorative benefits has been confirmed [77].
(2)
Online Survey
We used Baidu SVIs as a data source for the restorative perception evaluation, and previous studies have demonstrated the applicability of images as a proxy for real environments [78]. From the Baidu SVIs database, we randomly selected 250 images as samples to evaluate the campus restorative benefits through an online questionnaire. We excluded images with poor weather conditions or low contrast to ensure high image quality and visual appeal. In addition, the selected images also considered factors such as the distribution of different regions and a wide range of environmental types to ensure a representative sample and the generalizability of the study (Supplementary Materials: Figure S1. Location map of the 250 online questionnaire points).
In the studies of subjective perception evaluation, most have used the perceived restorative scale (PRS) questionnaire developed by Hartig et al. [79] in 1996 based on Attention Restoration Theory (ART). The higher the PRS score, the higher the restorative benefits of the environment. Afterward, scholars continuously optimized and developed the questionnaire, and the simplified questionnaire also proved to have high reliability [80]. We used the PRS-11 as the main tool for the online survey, which was improved and optimized from the original PRS questionnaire by Pasini et al. [81]. The PRS-11 has obvious application advantages due to its simplicity and accuracy [49,82,83].
For this purpose, a 7-level Likert scale questionnaire was developed on the Wenjuanxing platform (https://www.wjx.cn/ (accessed on 15 September 2024)). The restorative benefits of multiple scenes were evaluated through a month-long online survey from 15 September to 15 October 2024. To ensure equality and consistency, each respondent was randomly assigned five panoramic images, each with the same frequency of occurrence (about 13 times on average). Also, to avoid respondents’ forgetfulness, each questionnaire page showed only one scene and related questions. The questionnaire asked respondents to imagine themselves in a particular scene while being asked to assign a score between 1 and 7 to each question, indicating how well their actual perception matched the image they saw. All questions were presented bilingually in Chinese and English to ensure respondents fully understood the questionnaire and minimize potential misunderstandings.

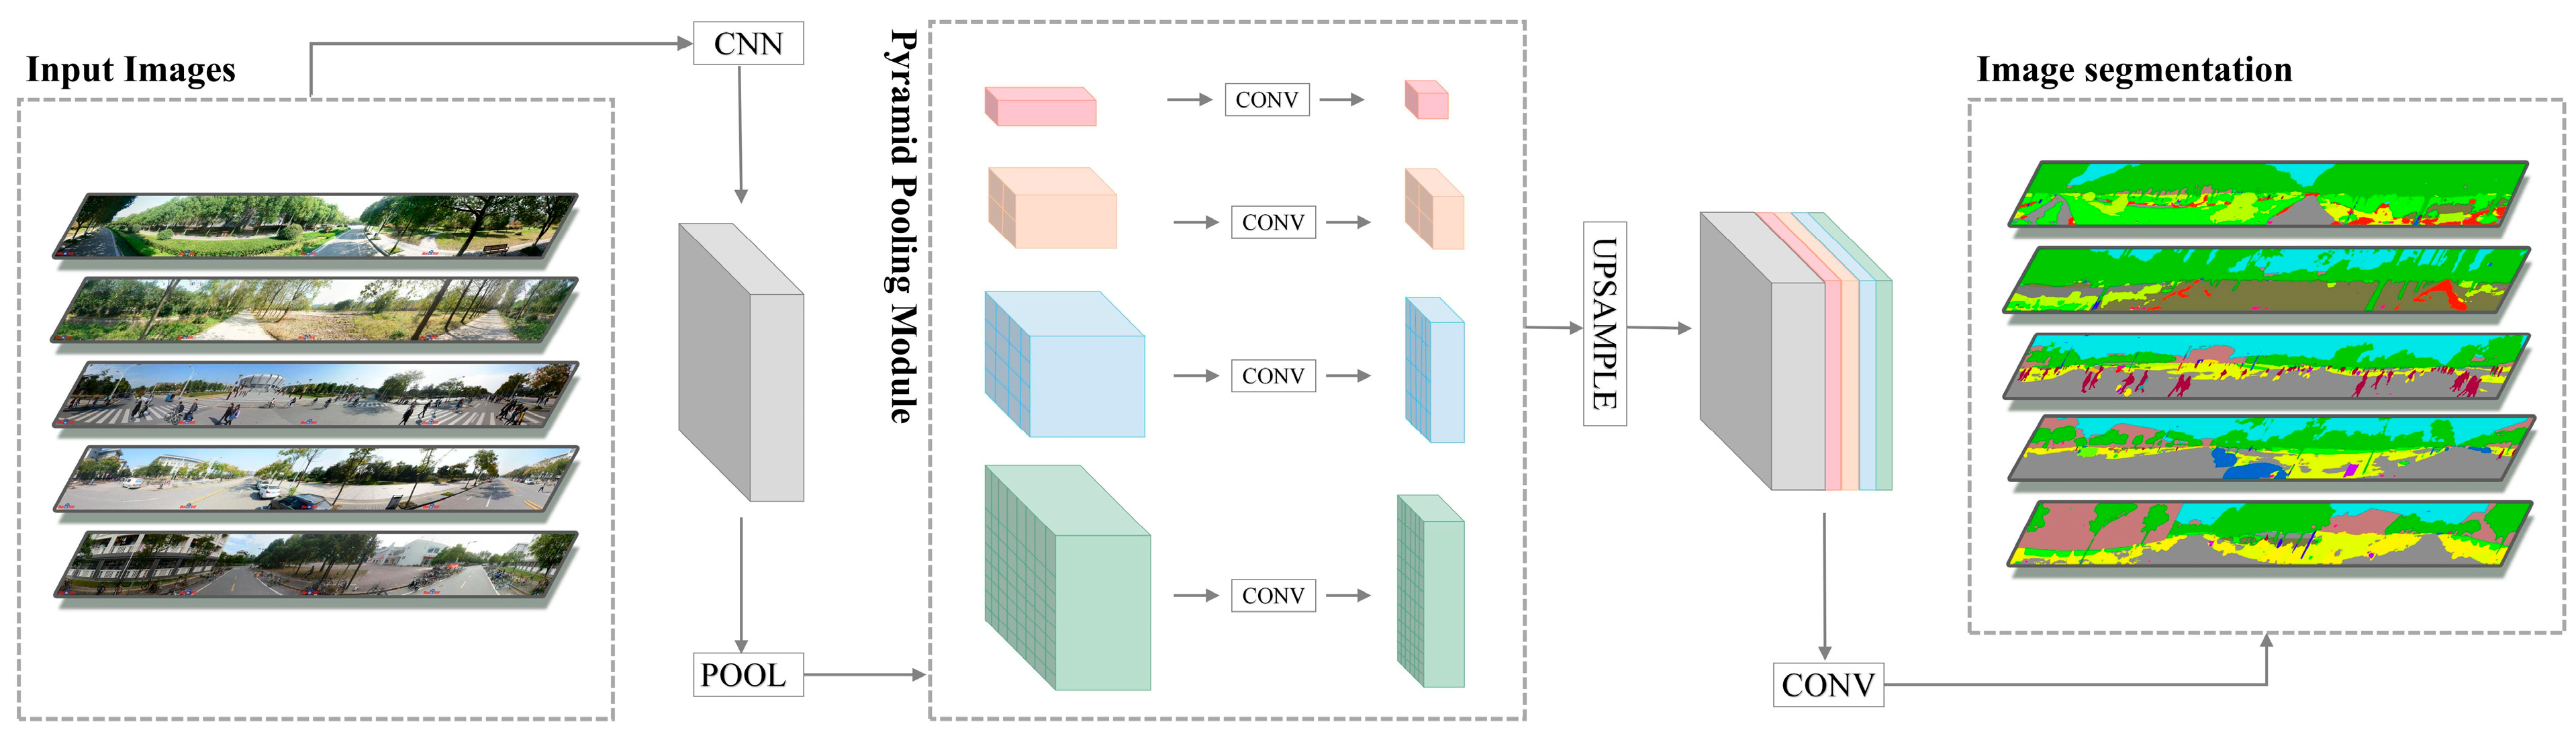
3.4. Semantic Segmentation and Spatial Character Extraction

In recent years, various types of artificial intelligence and spatial evaluation algorithms have helped to enable smarter data processing and analysis [84]. Image semantic segmentation algorithms can assign each pixel in an image to its corresponding object category, thus permitting the accurate segmentation of different target objectives in an image [74]. Due to the widespread application of deep learning in computer vision, semantic segmentation techniques have been significantly improved, and there are mainly algorithmic models such as FCN, U-Net, SegNet, and Deeplab. The Pyramid Scene Parsing Network (PSPNet) model was utilized for the semantic segmentation of panoramic image data (Figure 5). The PSPNet model, which is improved on the Fully Convolutional Network (FCN), achieved an accuracy of 80.04% after being trained on the ADE20K database [85,86]. It has been widely applied in many studies [49,75]. We calibrated the semantic segmentation results of the PSPNet model to the 150 object categories in the ADE20K database, covering all the elements on the campus. Objective metrics of the panoramic images were also computed, considering the mean or standard deviation of the different views.
With the help of computer vision algorithms, the panoramic images are quickly and efficiently segmented, thereby obtaining the 15 spatial elements and 12 morphological indicators. This approach enables large-scale, high-precision objective measurements of campus public spaces. Regarding spatial element indicators, we selected the top 15 street view elements with the highest average proportions: trees, sky, roads, grass, sidewalks, buildings, earth, plants, etc., (Table 2). In terms of spatial morphology indicators, we calculated them based on the spatial indicator equations selected in Section 3.3.2.

3.5. Modeling of Restorative Benefits Evaluation

Objective spatial indicators and subjective perception data were used to scientifically evaluate the restorative benefits of campus public spaces and to establish explanatory and predictive models. These two models can complement each other to promote a comprehensive and systematic study. The explanatory model aims to identify the potential factors that promote the restorative benefits of the campus environment [87]. Statistical methods of Pearson’s correlation analysis and multiple linear regression analysis were used to elucidate the relationship between spatial elements, morphological characters, and university students’ restorative perceptions. These are the most commonly used methods for human perception evaluation, and the results can provide important insights for decision-making on campus regeneration, such as which spatial elements should be prioritized during the construction of campus restorative environments [88].
On the other hand, the predictive model based on deep learning algorithms, such as RF and XGBoost, aims to achieve a large-scale, high-precision predictive evaluation of restorative benefits. High-complexity nonlinear models have been shown to exhibit higher accuracy and evaluation efficiency. Without focusing on reasoning about complex data interactions and patterns, the predictive model can accurately estimate the restorative benefits of different scenes by using spatial metrics as predictors, thereby providing valuable technical support for campus optimization practices [89].

3.6. Overlay Analysis of Restorative Benefits and Accessibility

In this study, sDNA based on the ArcGIS platform was used to quantify the walking potential by combining the walking distance and perceived distance while considering the shortest metric distance and the angle change [90]. For the specific analysis, street path centerline maps were extracted from OSM as the basic network data. The “betweenness” index was used to measure the accessibility of each street. In spatial network analysis, the accessibility results at different analysis radii correspond to the travel potential of different behaviors. Based on the walking behavioral modes of university students, the network radius was set at 400 m, 800 m, and 1200 m [91], which characterized the suitable walking distance of 5 min, 10 min, and 15 min, respectively. This approach was employed to simulate and visualize the extent of students’ daily travel activities, thereby identifying the spatial character of the distribution of spatial accessibility. Furthermore, we overlayed the results of the above three accessibility analyses. We selected the overlapping part as an important reference for the accessibility analysis related to space optimization.
The optimization of campus public spaces to improve their restorative benefits is of paramount necessity. Still, it is also necessary to consider the balance between the space supply and the demands of students’ behaviors. Combining the overlay analysis of restorative benefits and spatial network accessibility, the evaluation matrix of restorative benefits and accessibility was used to evaluate the campus public space, which can effectively support the spatial optimization practice.

4. Results

4.1. Online Survey Results

We analyzed the complete database of 670 respondents, which included all 3350 records with their restorative benefit scores for 250 scenes, each of which garnered responses from at least 10 respondents. We recruited a sample of university students currently enrolled in Nanjing, which comprised 330 females (49.25%) and 340 males (50.75%). Specifically, 344 students (51.34%) lived and studied at the Jiulonghu campus, while the remaining 326 students (48.66%) did not. The demographic distribution of the respondents was well balanced, ensuring the representativeness of the sample. Internal consistency evaluation was conducted on the reliability of the questionnaire, resulting in a Cronbach’s α value of 0.989, indicating the reliability of the data [92].
Across all 250 sample images, the mean restorative benefit score was 4.473, the median was 4.584, the maximum was 6.417, the minimum was 1.250, and the standard deviation was 1.542. The mean and median scores were more than half of the maximum 7.

4.2. Explanatory Model: Identifying Key Indicators Affecting RBs

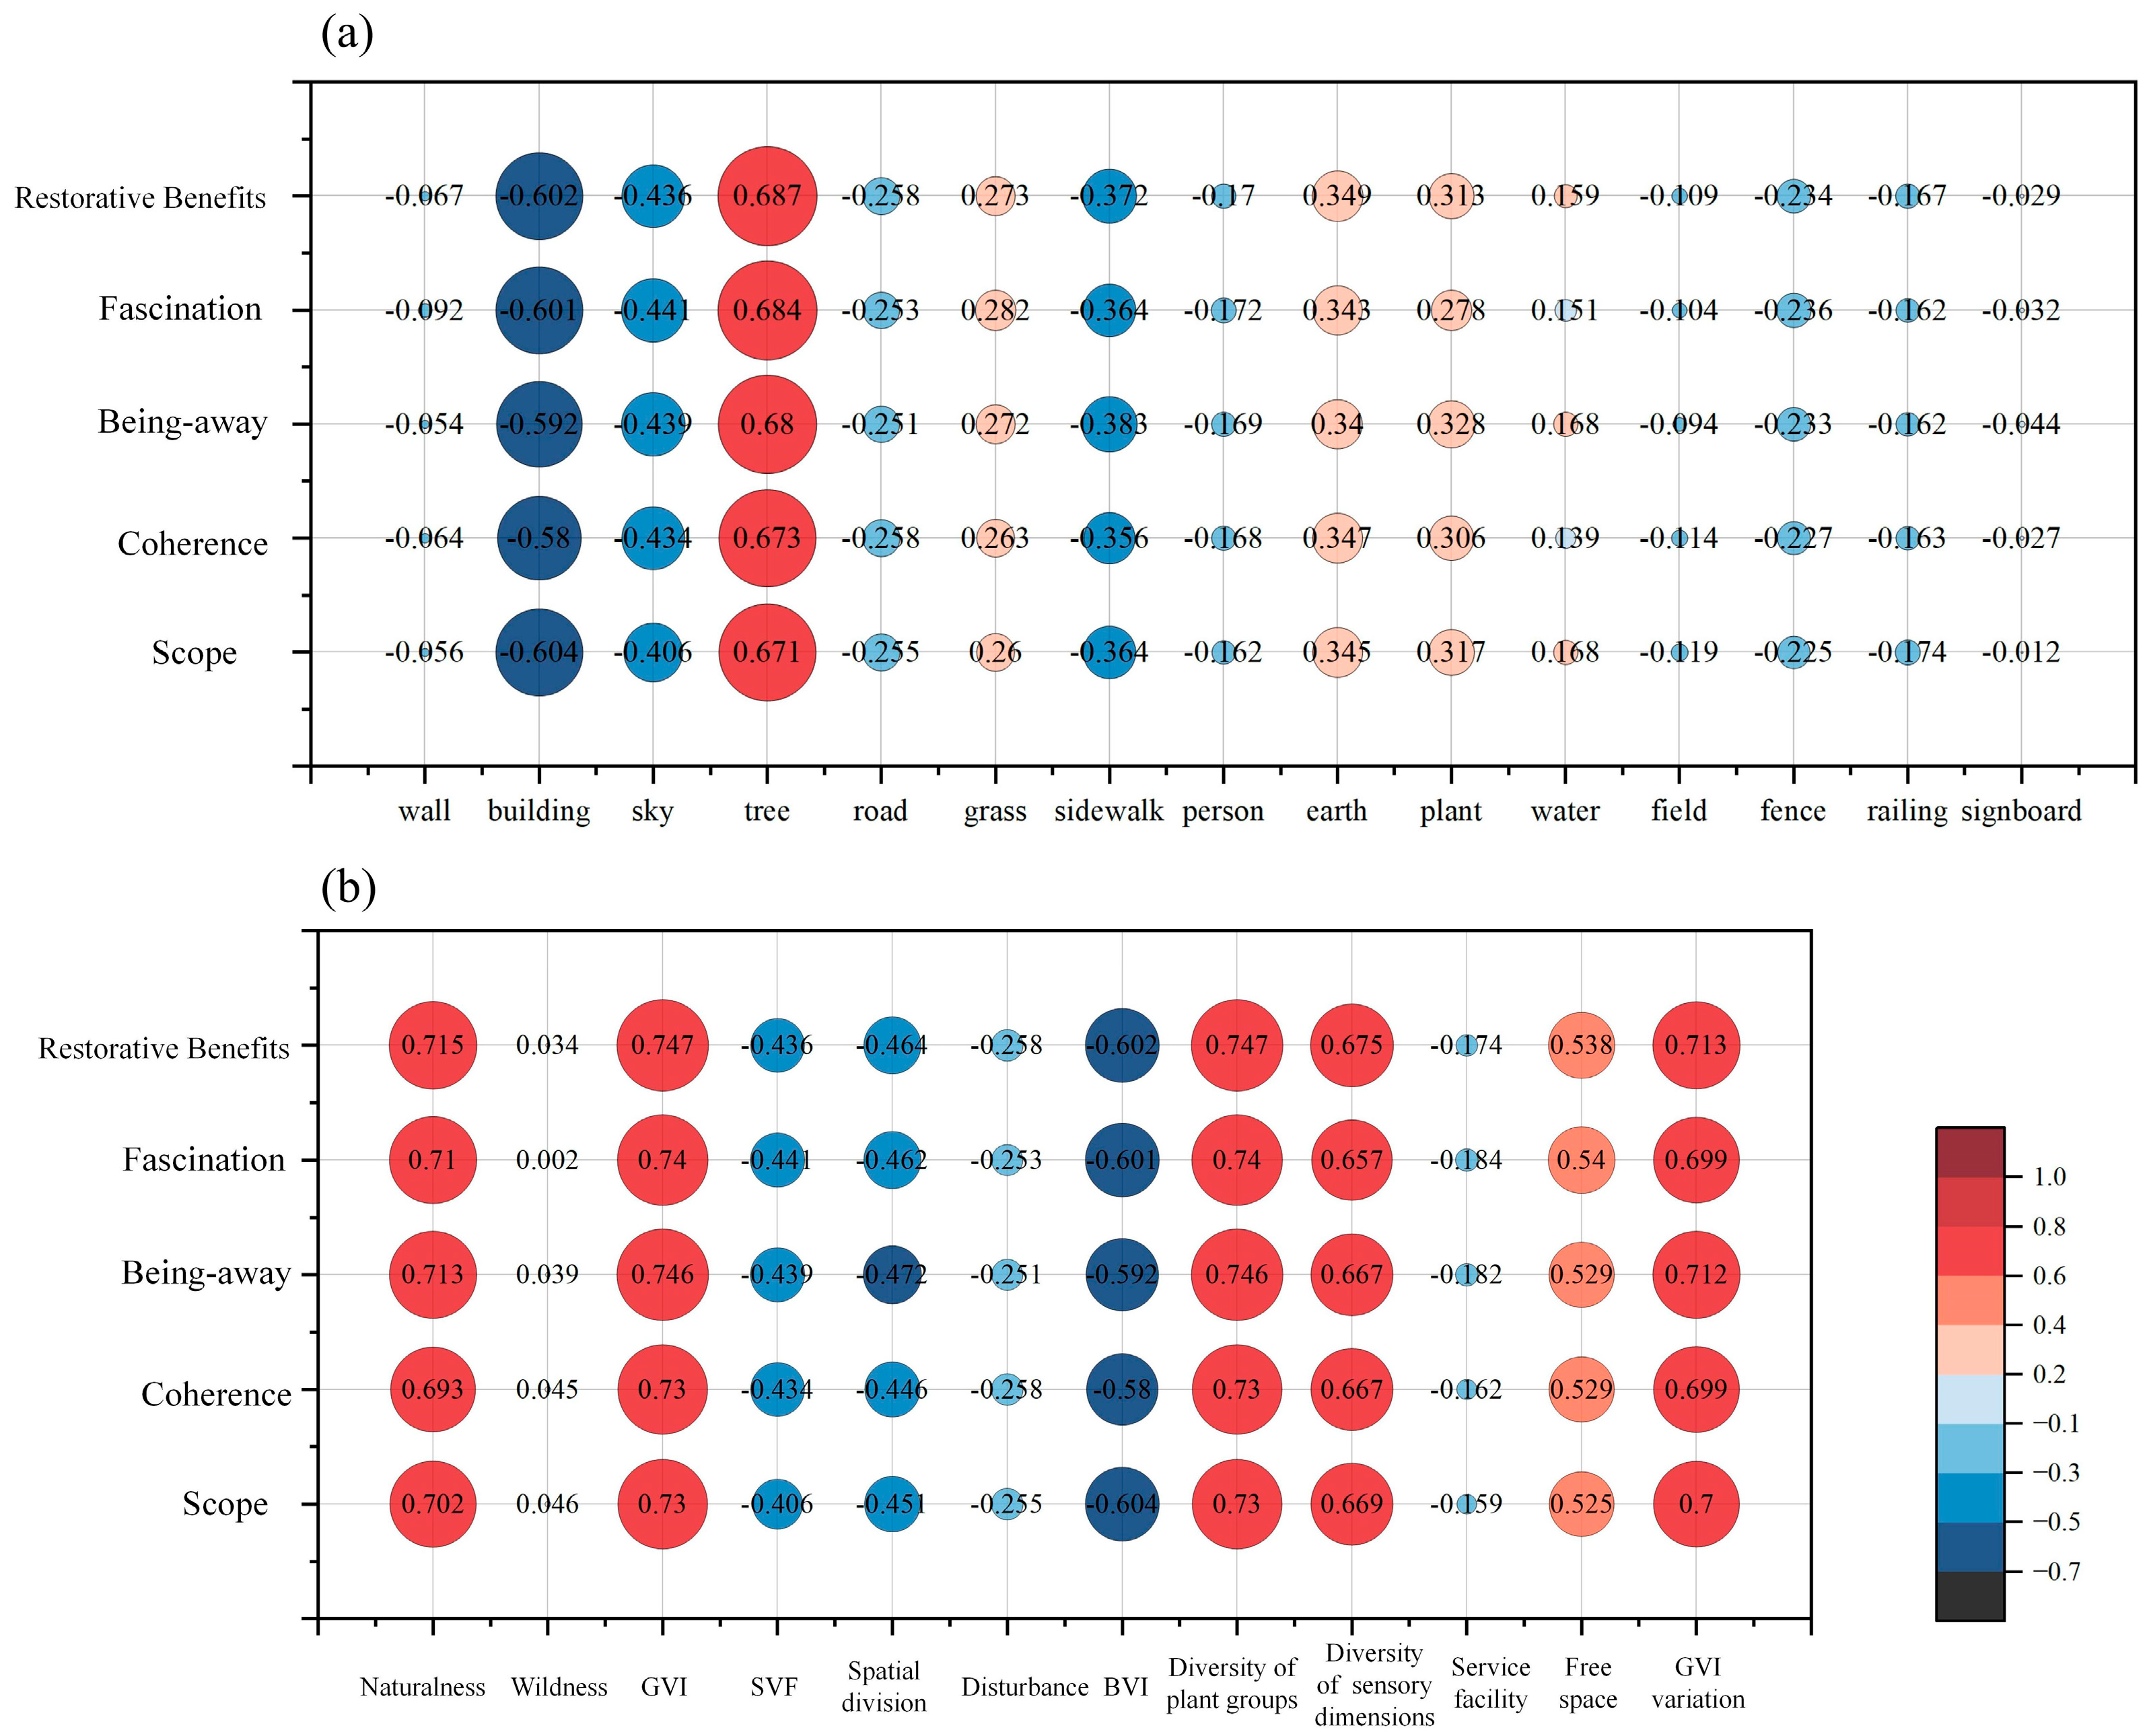
4.2.1. Correlation Analysis

We assessed Pearson’s correlation coefficients between objective environmental characteristics and subjective restorative perceptions. First, data normalization was performed on the quantitative measurement data for each sample scene to eliminate variations in units and amplitudes between different databases. We used objective spatial elements and morphological indicators as independent variables and four dimensions of restorative perceptions (being away, coherence, scope, and fascination) and the restorative benefit scores as dependent variables for correlation analyses in SPSS (v.27.0) software. Positive and negative correlations were used to characterize each element’s promoting or depressing effects on restorative perceptions.
We found significant correlations (p < 0.05) between most spatial elements, morphological indicators, and restorative benefits (Figure 6). The results showed that in terms of spatial element indicators, trees, earth, plants, and grass, etc., showed a strong positive correlation with restorative benefits, while buildings, sky, sidewalks, and roads, etc., showed a negative correlation in Figure 6a. In terms of morphological indicators, naturalness, GVI, GVI variation, diversity of plant groups, diversity of sensory dimensions, and free space, etc., showed significant positive effects on restorative benefits. In contrast, BVI, spatial division, and SVF, etc., showed a strong negative correlation in Figure 6b.

4.2.2. Multiple Linear Regression (MLR) Analysis

The correlation results indicated that the restorative benefits are the outcome of the collaborative interaction of multiple indicators. Multiple linear regression analysis was employed to effectively illuminate the relationships between the numerous independent and dependent variables. To eliminate multicollinearity, stepwise multiple linear regression was applied. The stepwise method introduces independent variables one by one, while each new independent variable is introduced to test the old ones one by one and remove other interrelated indicators, which best explains the changes in restorative benefits and, at the same time, improves the interpretability of the model and reduces the risk of overfitting. In this approach, we used data from 15 spatial elements and 12 morphological indicators of 250 sample scenes as independent variables and subjective restorative benefit scores as dependent variables, respectively, to build two MLR models. This helped to identify the key indicators that positively or negatively affect RBs. Adj R2 was also used to evaluate the model’s performance. Model parameter testing and the model regression coefficients are shown in Table 3 and Table 4.
The analysis results showed that in the spatial element model, there was a strong correlation between tree, building, grass, plant, earth, person, fence, and restorative benefits, with an Adj R2 value of 0.690, exceeding the conventional threshold of 0.3, as shown in Table 3. Then, in the model of morphological indicators and restorative benefits, RBs were mainly affected by the variables of GVI, BVI, free space, wildness, and service facility, with the Adj R2 value of 0.672 in Table 4. The tolerance value of all variables exceeded 0.2, and the variance inflation factors (VIFs) were less than 5, indicating that there was no multicollinearity in this regression. The presence of autocorrelation within the sample was assessed using the Durbin–Watson (DW) test. A DW value between 1.5 and 2.5 generally indicates the absence of autocorrelation. The DW values of the two regression models were 1.666 and 1.683, respectively, confirming the satisfactory independence of the sample data. In addition, the regression models successfully passed the F-test with a highly significant p-value at 0.000. The above proves that the two regression models developed are reasonable.
Among the spatial element variables considered, plant (β = 9.968), grass (β = 6.746), and tree (β = 4.134) showed the most significant positive effects on RBs, while person (β = −29.113) and building (β = −7.813) showed significant negative effects. Among the spatial character variables considered, GVI (β = 5.098) showed the most significant positive effect, indicating that an increase in greenery, such as trees, plants, etc., is associated with higher RBs. Free space (β = 3.996) showed the second most important positive effect on RBs, which means that spaces such as grasslands characterized by enhanced openness tend to have higher RBs. Conversely, BVI (β = −6.682) and service facility (β = −31.510) showed significant and negative effects on RBs, which suggests that more buildings and appurtenances in public spaces correspond to lower RBs.

4.3. Predictive Model: Large-Scale and Efficient Prediction of RBs

4.3.1. Multiple Model Comparison and Selection for Prediction and Mapping

The predictive performance of the explanatory model may be limited by its reliance on a simple linear approach and incomplete metric information. For predicting RBs, algorithms such as Support Vector Regression (SVR) [93], Random Forest (RF) [94], and eXtreme Gradient Boosting (XGboost) [95] in the field of deep learning are more effective at accurately predicting the dependent variable by capturing complex nonlinear relationships, compared to the MLR model [96]. This study focused on applying the above three algorithms to train evaluation models and verify which algorithm performs best under the same parameter settings, in order to achieve a large-scale and high-precision restorative benefit prediction of campus outdoor public spaces. The model’s predictive performance was assessed based on parameters including the MSE, RMSE, MAE, and R2 [97].
A database containing 250 sample scenes was generated for predictive modeling using subjective restorative benefit scores and objective spatial metrics, of which 30% was used as a test set and 70% as a training set. K-fold difference validation, where the data are divided into k-folds and each data is used as a test set, is used to validate the model. K = 5 was used in this study. For each metric, we calculated the average of the results of five repetitions. Table 5 shows the results of the different algorithms. Overall, both the RF model and the XGBoost model performed better, but the XGBoost model performed the best on every metric, with an R2 of 0.761, an MSE of 0.594, an RMSE of 0.770, and an MAE of 0.599. The SVR model performed the worst on all metrics.
As a result, we selected a prediction model based on the XGBoost algorithm. The performance of the XGBoost model on small databases is usually superior to that of models such as GBDT and RF, mainly due to its unique regularization techniques and second-order derivative optimization [98]. The restorative benefits of the overall campus space were quantitatively predicted with the help of the campus panoramic image database, and the results were spatially visualized and represented using ArcGIS 10.6 software.
The areas with high RBs of the campus are mainly located in the northwest waterfront space, the green space of the Meiyuan near the south gate, and athletic fields around the southeastern, which have fascinating landscapes and expansive views (Figure 7). The waterfront space in the northwest area exhibits higher RBs, and the water body contributes to the positive microclimate regulation of the surroundings, thereby creating a pleasant environment for meditation or enjoying the view [99]. The Meiyuan area, recently designed as a key campus green space, is modeled on the classical gardens of Jiangnan. The park is characterized by abundant plant species and expansive, open vistas, collectively contributing to the area’s high RBs. In addition, campus athletic fields are the preferred space for students to engage in outdoor activities. Engaging in outdoor activities can help alleviate academics stress and aid in attention restoration [100]. In contrast, campus dormitory areas surrounded by buildings appear to have lower RBs, such as the Northeast Taoyuan dormitory area, Southwest Juyuan dormitory area, and Southeast Meiyuan dormitory area.

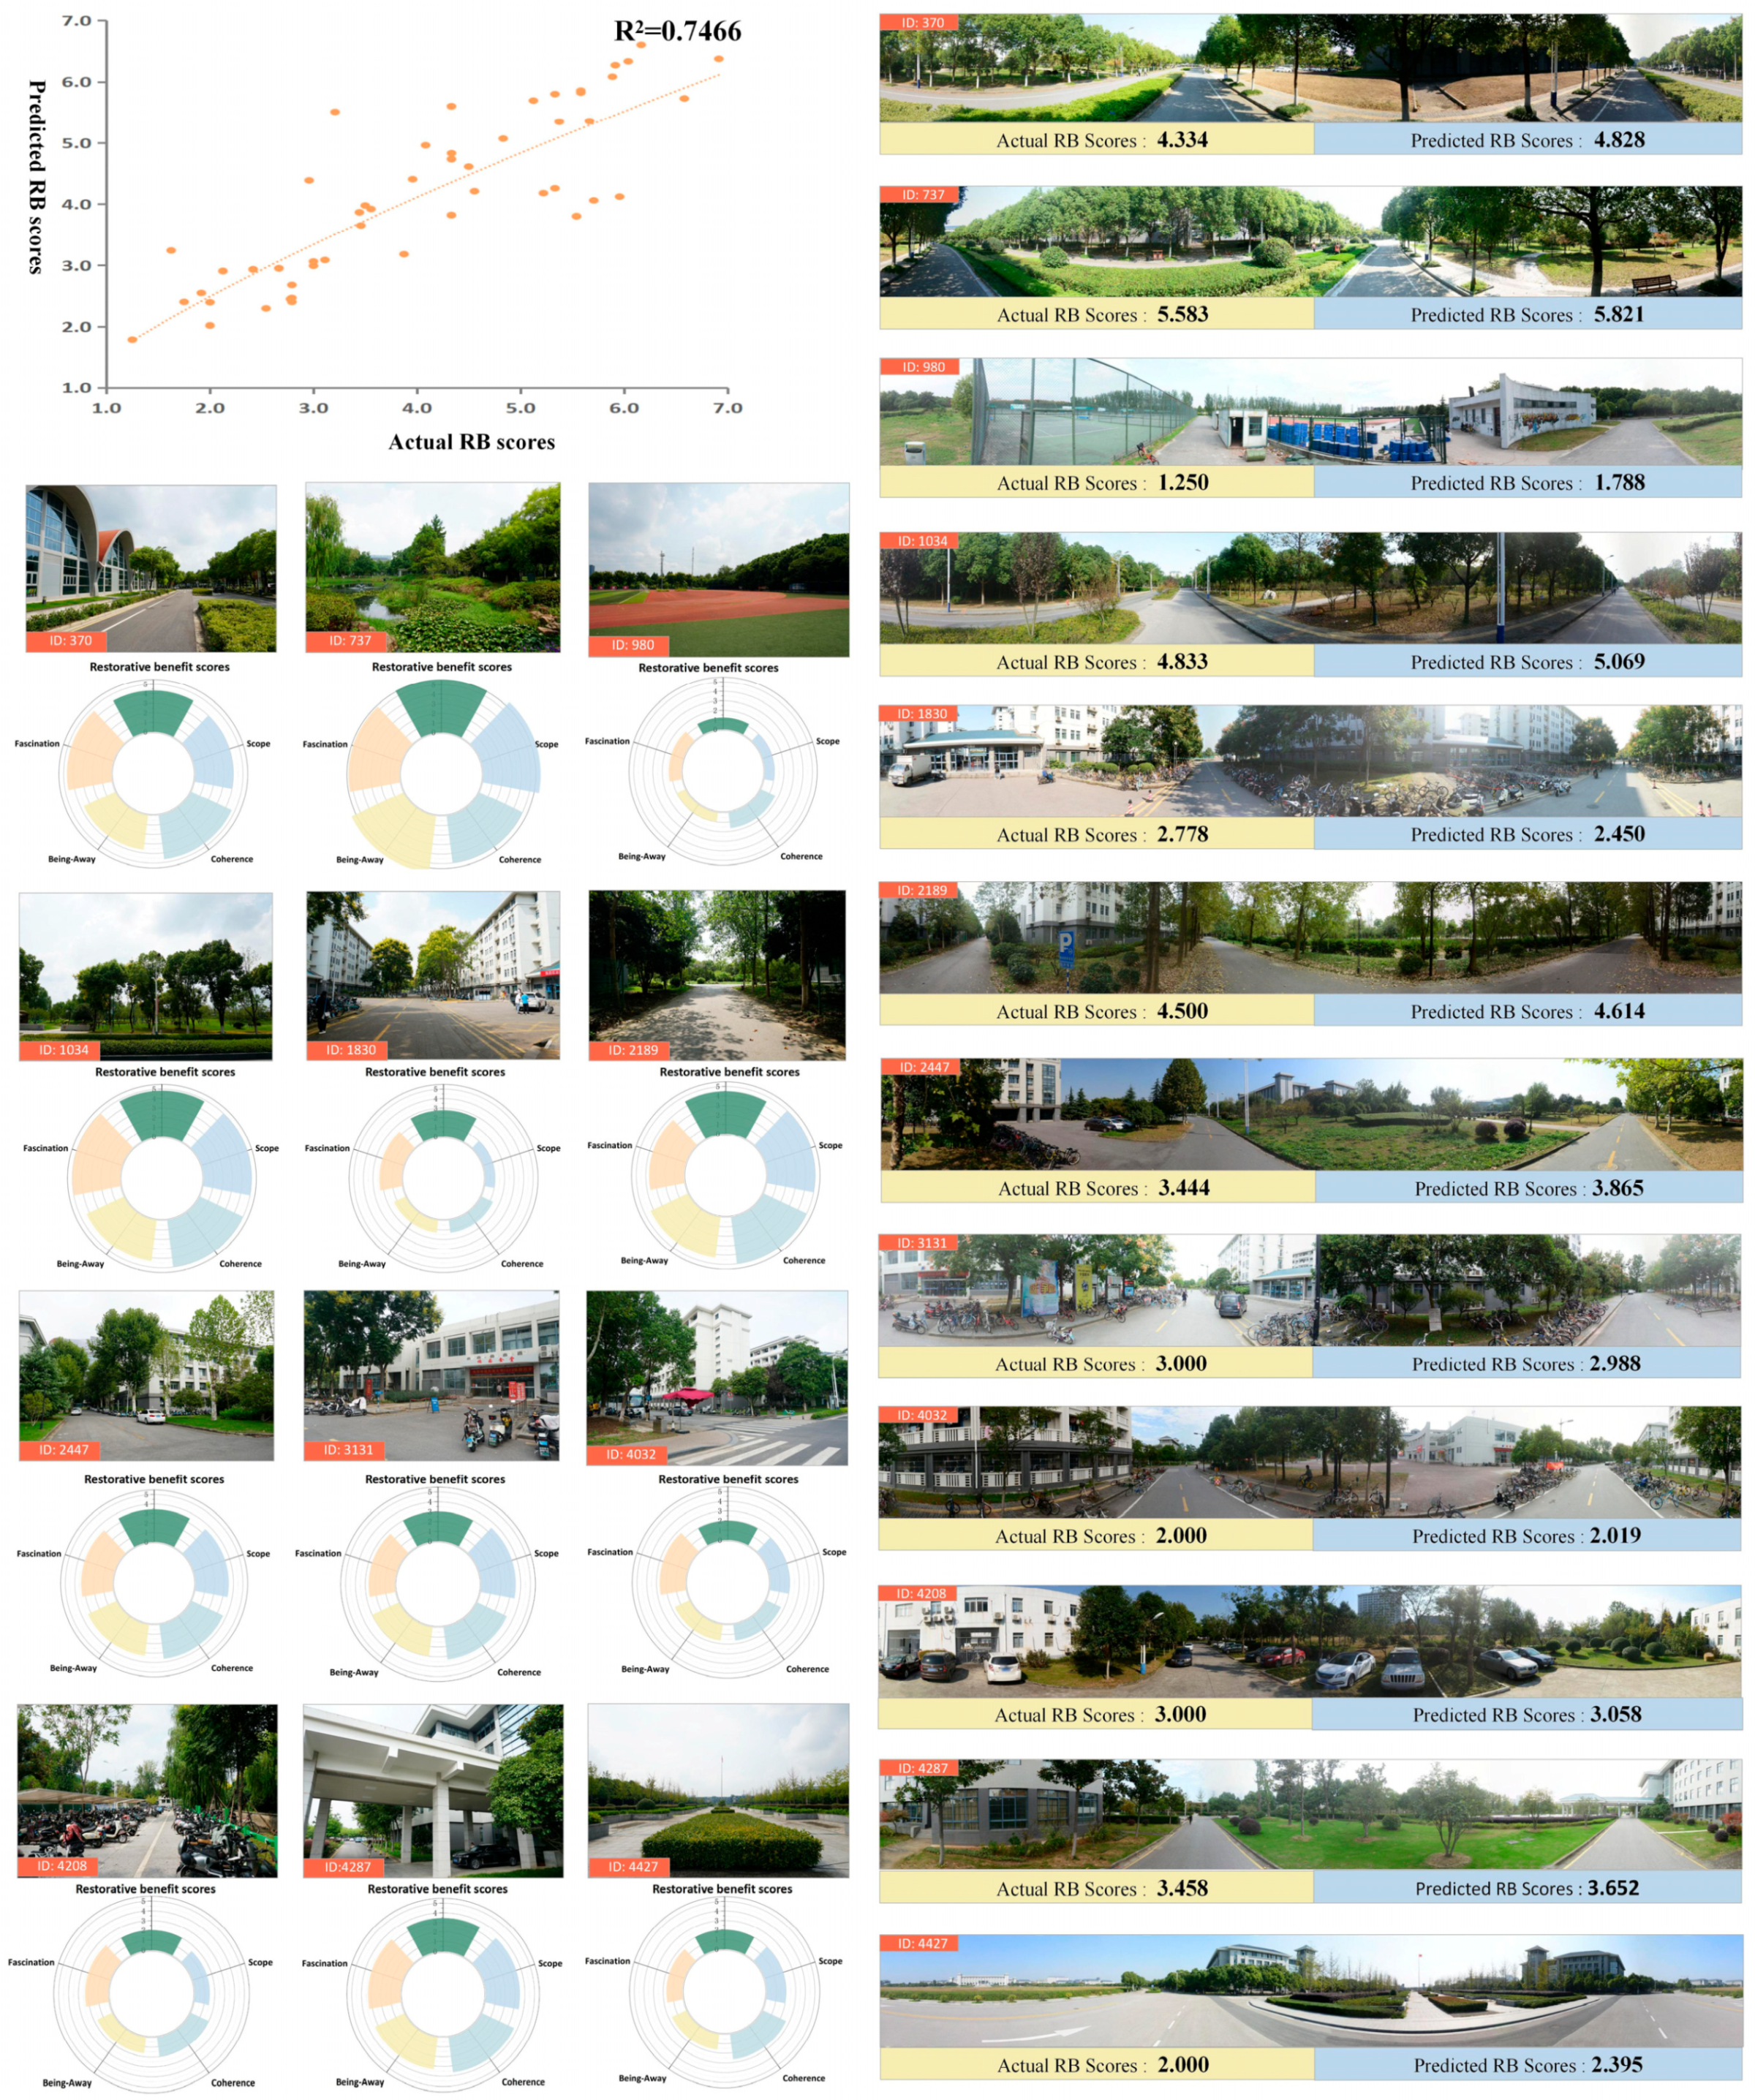
4.3.2. Validation of the Predictive Model’s Effectiveness

Considering that RBs is an intangible and difficult-to-measure environmental feature, the most effective way to validate the framework is by comparing the deep learning-based prediction results with subjective restorative evaluations from student groups. Therefore, we compared the prediction results based on Baidu SVI data and the XGBoost algorithm with students’ restorative scores in the real-world environment. Fifty scene points were randomly selected as the validation database at the Jiulonghu campus of Southeast University (Supplementary Materials: Figure S2: Location map of the 50 on-site questionnaire points).
We used the PRS-11 questionnaire to evaluate on-site restorative perceptions of the campus environment, with scores ranging from 1 to 7. A total of 118 Southeast University students (63 males and 55 females) were invited to 5 of the randomized points from 15 to 21 September 2024, and each point was evaluated by at least 10 students. After obtaining the validation database of the 50 on-site points, the mean restorative benefit score was calculated to be 4.035 (Supplementary Materials: Table S1. The restorative benefit scores for 50 on-site points). Students’ subjective restorative scores of the actual campus environments generally agreed with the results from the predictive model, and the correlation between them is shown in Figure 8, with R2 = 0.7466. This further confirms the methodological reliability of using SVI data and the XGBoost algorithm to predict the restorative perceptions of the campus.

4.4. Optimization of Campus Public Space Based on the Dual Control of Restorative Benefits and Accessibility

In the overlaying analysis, based on the quantile method of ArcGIS, the restorative benefits and accessibility were divided into three categories, respectively, according to the scores from high to low. The first third with the highest accessibility were classified as high accessibility areas, and the last third as low. Similarly, the areas in the first third and the last third of the restorative benefit scores were classified as high and low restorative benefits, respectively (Figure 9a–c). Based on these classifications, a four-quadrant matrix based on two dimensions of the restorative benefits (HRBs and LRBs) and accessibility (HA and LA) was constructed. The four different spatial types were identified as high restorative benefits and high accessibility (HRB-HA), high restorative benefits but low accessibility (HRB-LA), low restorative benefits but high accessibility (LRB-HA), and low restorative benefits and low accessibility (LRB-LA). These spaces’ specific distributions and compositions are shown in Figure 9d–f and Table 6.
The “areas with optimization potential” of the campus were identified through the overlay analysis of the results under 400 m, 800 m, and 1200 m conditions. Then, the optimization pathways were constructed by combining multiple types in the spatial dimension and the sequential order of “near-medium–long-term” in the temporal dimension in Figure 10 to achieve the dual control of restorative benefits and accessibility for the optimization practices. This is also conducive to facilitating stress relief, attention restoration, and enhancing learning efficiency among university students. Furthermore, it promotes their physical and mental well-being, thereby establishing a new balance between the students and the campus environment.

5. Discussion

5.1. Effects of Spatial Types Dominated by Different Spatial Indicators on Restorative Benefits

Identifying the spatial indicators that affect the restorative benefits can help to enhance the restorative perceptions of campus environments, create human-oriented public spaces, and promote physical and mental health. The key spatial indicators identified using the explanatory model mainly include spatial element indicators such as tree, building, grass, plant, and earth, and morphological indicators like green view index (GVI), building view index (BVI), and free space. A strong correlation was also observed between the two types of indicators and campus space types. Elements such as tree, grass, and plant correspond to the indicator GVI of campus green space, while building corresponds to the indicator BVI of campus gray space, and earth and grass correspond to the indicator free space of campus athletic fields. The indicator water may not be reflected due to the small proportion of water in the overall campus outdoor environment. However, the predicted map revealed that the northwest waterfront areas exhibit high RB. Therefore, waterfront spaces dominated by the element water were included in the discussion.
Indicators related to green and blue spaces have a significant positive impact on restorative benefits. Campus spaces with low RB typically lack greenery and have high building densities. Low visibility levels of green spaces reduce the attractiveness of the space, while also affecting the perceived restorative benefits [101,102]. Recent neuropsychological research using mobile electroencephalography (EEG) has shown that the presence of buildings negatively impacts perceived restorative potential and promotes positive behavior. In spaces with high RB, comfortable road proportions and plentiful trees increase friendliness and fascination [103]. An appropriate GVI can effectively promote the transition of students from the high-pressure study environment to restore their attention and relieve psychological pressure [7]. It reveals that the indicators tree, plant, and grass are important spatial elements that alleviate university students’ academic stress. This also reaffirms that GVI is a key indicator affecting RB within a specific threshold range. Our findings are consistent with several studies using biosensor measurements that found that viewing green landscapes produces high levels of relaxation and anxiety-reducing effects [104,105]. Waterfront spaces with the element water contribute to the quality of psychological recovery. This is due to their high visibility, which enhances the spatial richness and visual attraction [106]. This is consistent with previous findings, where physiological measurements have shown that the element water positively affects people’s perceived restoration, effectively reducing sympathetic nervous system activity [107].
The athletic fields dominated by indicators like earth, grass, and free space are also important spatial media for promoting students’ outdoor activities, and a higher degree of openness can also lead to pleasant psychological responses. Previous studies have confirmed a significant correlation between the quantity, type, and color of vegetation and the restorative benefits in sports field areas [108]. Conversely, areas with hard surfaces corresponding to the elements road and sidewalk show significant negative correlations with RB. Recent studies employing eye-tracking and physiological measures, including heart rate variability and skin conductance responses, have supported these findings [37].
Additionally, an unexpected finding emerged, revealing that the element person exhibited a robust negative correlation in both the correlation analysis and the multiple regression model. The number of pedestrians attracted to a space is often considered an important indicator of spatial vitality. Many studies have found that a vibrant public space may not necessarily be a restorative environment for space users to alleviate their negative emotions and restore their cognitive resources [109]. Some studies demonstrate that traveling alone or in a group is also an important factor affecting subjective restorative perceptions [110]. However, space optimization practices with the goal of vitality or restorative benefit improvement are dedicated to creating environments beneficial to physical and mental health. Two optimal design goals are proposed to address different problems in the urban built environment to meet various needs and preferences. The correlation between campus public spaces’ vitality and restorative benefits is yet to be further explored.

5.2. Campus Renewal Practices with the Dual Control of Restorative Benefits and Accessibility

The optimization practices of campus public spaces to improve restorative benefits require a balance between the supply of space itself and the behavioral needs of students. Good walkability is the spatial medium for campus activities, including restorative behaviors. We established a quantitative measurement method based on restorative benefits and accessibility to comprehensively analyze the relationship between spatial supply and human-oriented demand. This can provide additional support for spatial guidance and strategies for campus regeneration. Based on the above analysis results, the sequential order of temporal dimensions and the multiple types of spatial dimensions intertwine to jointly realize the dual control of the restorative benefits and accessibility in optimization practices.
The sequential orders for the temporal dimension of campus renewal practices were developed primarily based on the problems of the three spatial types. The specific pathways are as follows:
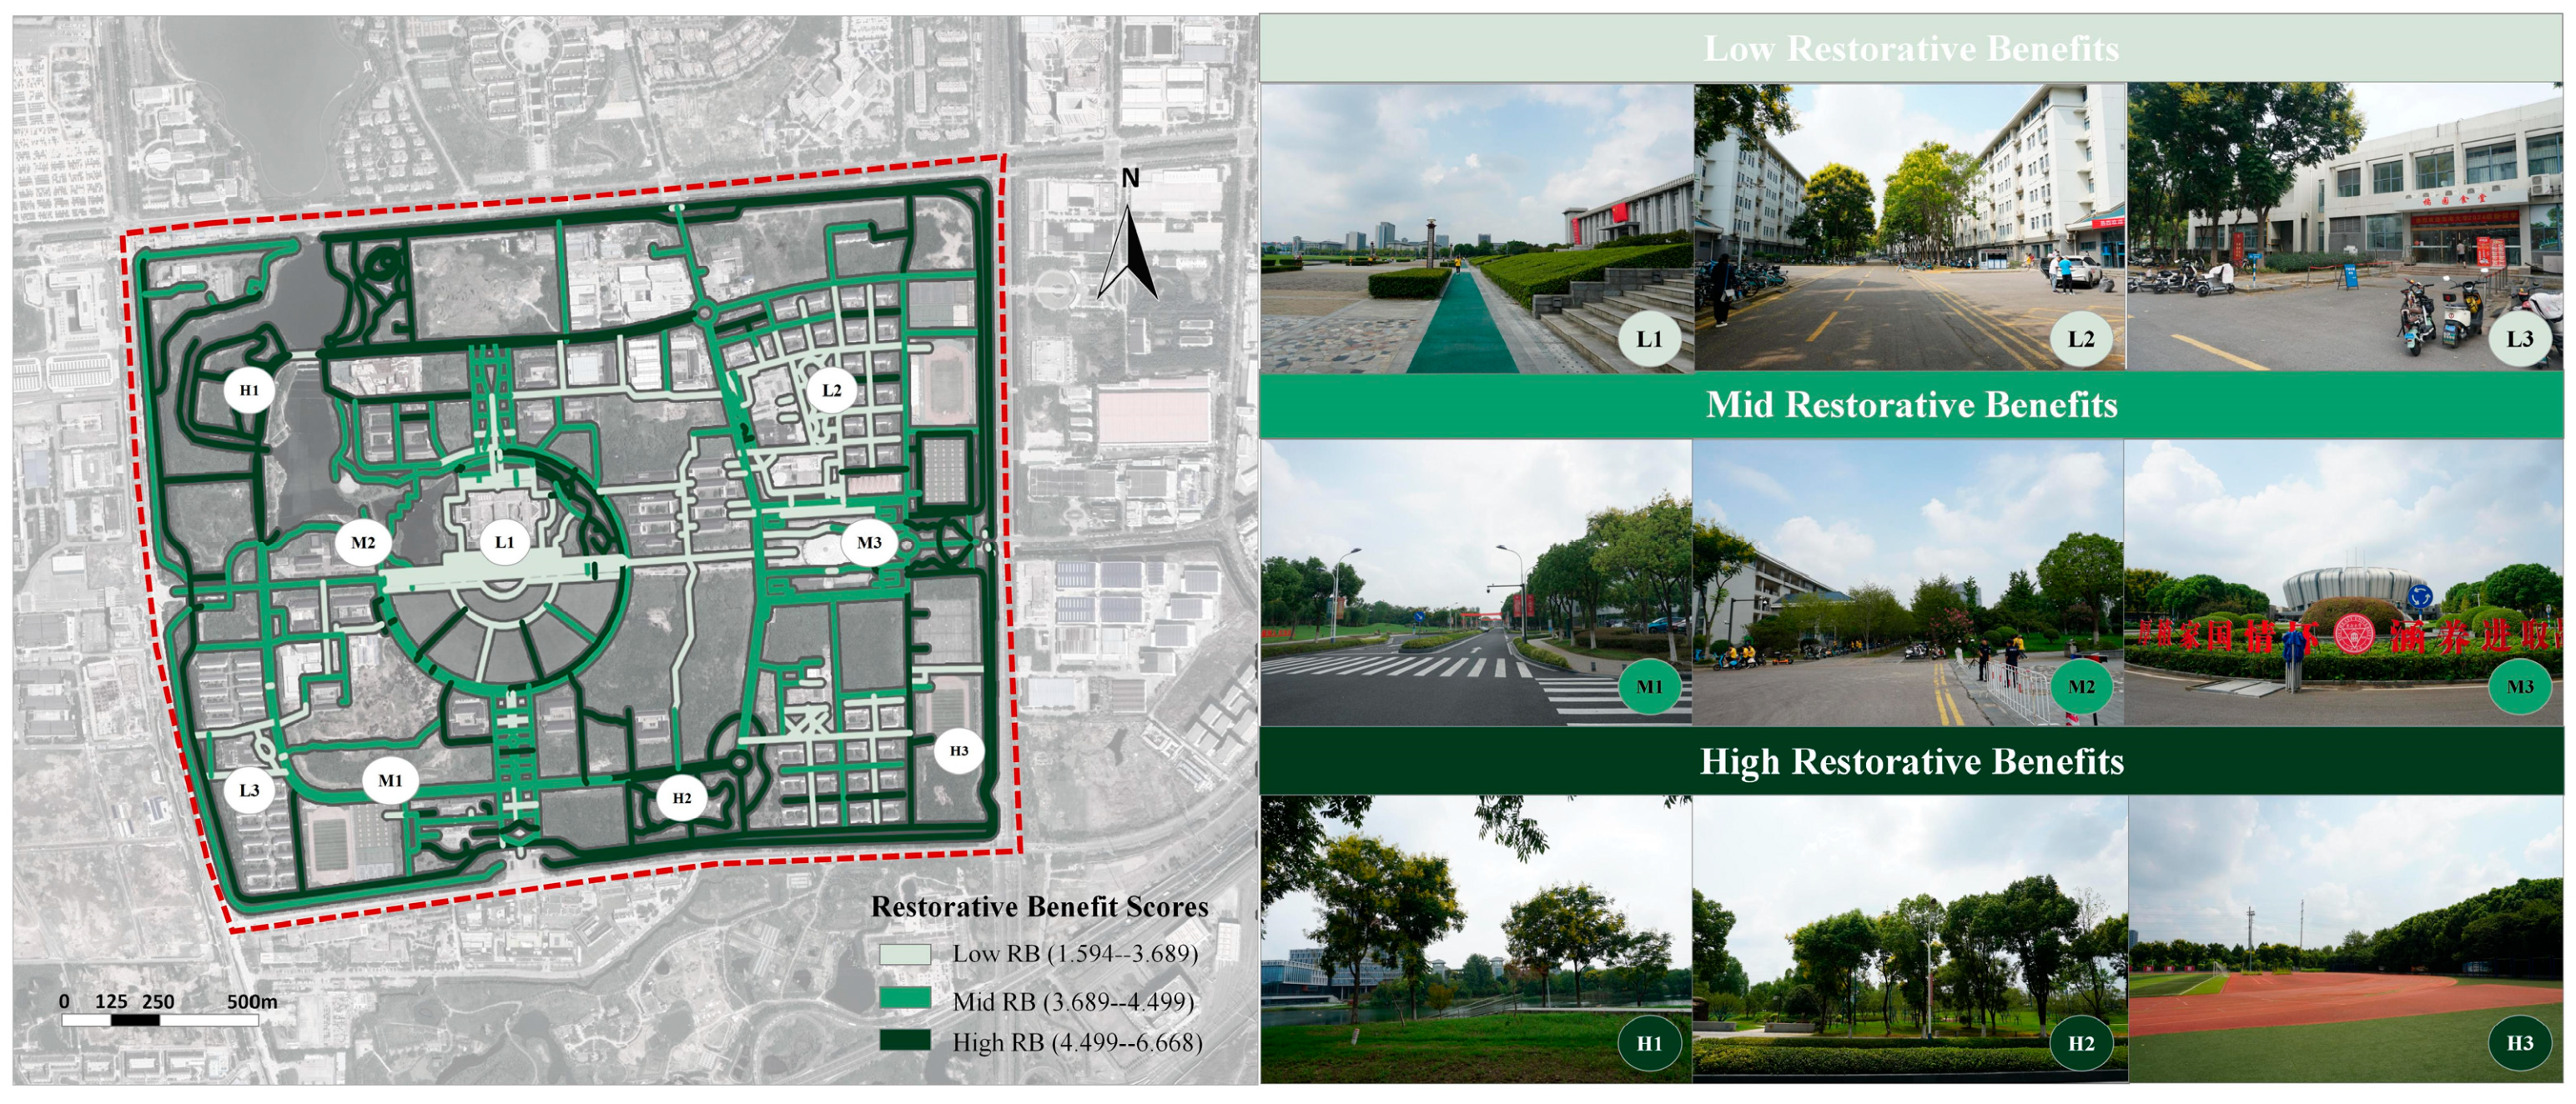
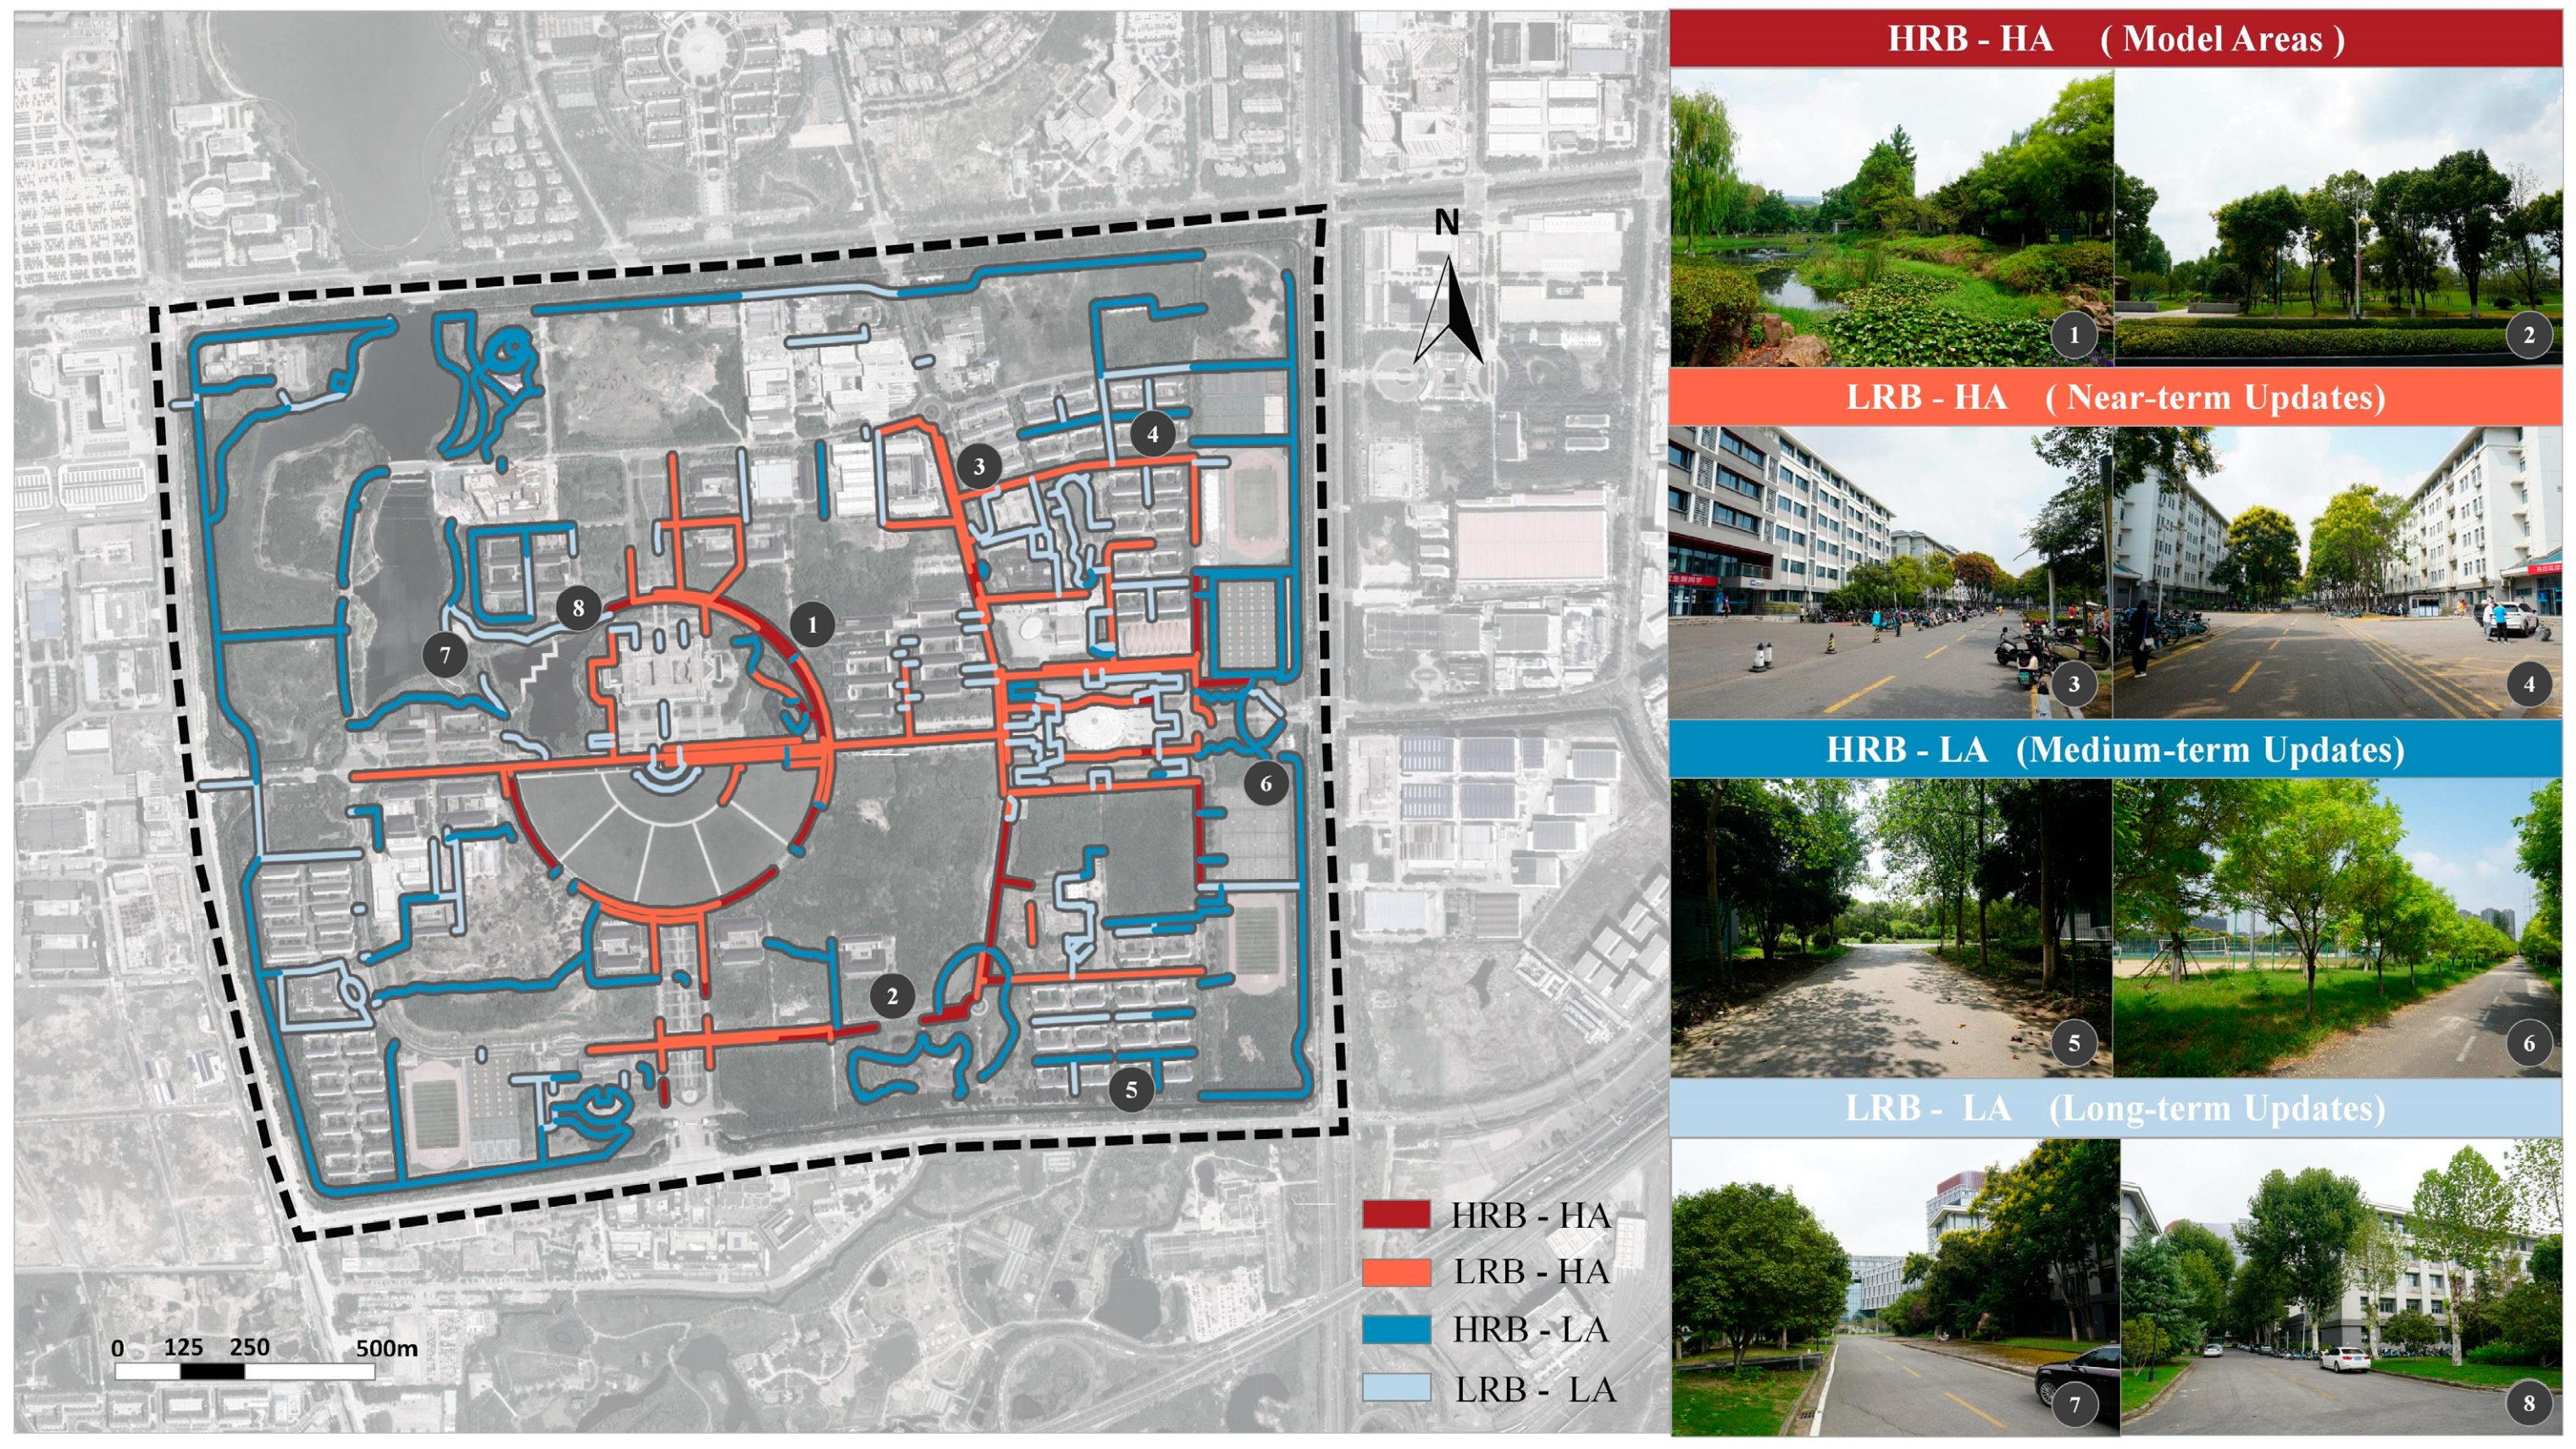
  • The HRB-HA areas (5.652%) can serve as models for campus outdoor public spaces. In the short term, the focus can be on improving restorative benefits in LRB-HA areas. They have the largest proportion among the three space types of “areas with optimization potential”, accounting for 18.505% (Table 6). Consequently, these areas have emerged as the focal point and prioritized part of campus optimization practices;
  • In the medium term, attention can be directed towards the HRB-LA areas, which constitute 11.486% of the total area and represent a secondary priority in optimization practices. For areas with low accessibility, subsequent efforts could focus on improving accessibility by optimizing the campus road network. As for the renewal practices in these areas, they may be temporarily postponed;
  • Renewal of the LRB-LA areas (12.671%) needs to improve both restorative benefits and accessibility. It may involve the unnecessary waste of resources and can be used as a long-term pathway (Figure 11).

5.3. Scientific Contributions of Research Methods

This study established restorative benefit evaluation models for university campus outdoor public spaces with SVIs as the database, image semantic segmentation as the quantization tool, and deep learning as the technical support. Firstly, the SVI database was established, and the image semantic segmentation model was applied to quantify the spatial elements in SVIs. Then, the subjective evaluation of small-scale SVIs was obtained using the PRS-11 questionnaire. Finally, the restorative benefit scores of large-scale SVIs were predicted by using the XGBoost model with deep learning algorithms. With the support of new data and technologies, this framework realized an overall high-precision graphical analysis on the neighborhood scale and identified “what are the potential problems” in different areas, which is different from the previous big data models on the urban scale or the embodied small data analysis on the individual scale. The breakthrough of this study is to contribute to the practice of human-oriented urban regeneration on the neighborhood scale and to support the implementation of more effective design strategies scientifically and quantitatively. The follow-up study can combine small data from EEG, eye-tracking, and other embodied perception data with specific spatial scenes to explore “why such a problem occurred” in depth. Integrating big and small data can provide more comprehensive spatial optimization strategies for campus renewal practices.
Another highlight of this study is the formation of a four-quadrant matrix of campus outdoor public space types based on the overlay analysis of restorative benefits and accessibility dimensions, thus constructing optimization pathways with dual control. The optimization pathways are both prospective and practical, which can help the university to maintain continuous inner dynamics and realize high-quality and sustainable campus development.

5.4. Research Limitations

The application of SVIs has significantly improved the study efficiency, but some problems and limitations still deserve further exploration. Firstly, the issue of spatial and temporal variables and errors in environmental restoration benefits is of concern. Campus landscapes may arouse different psychological responses in different seasons, and relying on visual indicators alone to predict urban perceptions is inherently limited. Although vision is the predominant modality in perceptual experiences, other sensory modalities, such as the soundscape, may also influence the restorative benefits [111,112]. However, the SVI data only capture the visual scene at a specific moment and lack auditory information. Secondly, due to the limitations of data sources and techniques, the views of the SVI data collected in the driveway deviate from those in the campus walking space. In addition, the evaluation model of this study is established on the single case of Jiulonghu campus, which lacks relevant data and analysis in the longitudinal dimension of time, and also ignores the differences between campus types (e.g., campuses located in the old city or campuses in university towns).
Finally, in this study, the respondent group only considered the proportional balance of factors (e.g., male or female, and studying or not studying on the Jiulonghu campus). It did not analyze other potential factors (e.g., age, major, or grade). Future studies are pending to continue the dynamic tracking and assessment of campus spaces with the support of new data and technologies, expand the evidence-based research to include more variables, and optimize the evaluation methodologies in the dimension of spatio-temporal intersection.

6. Conclusions

Campus outdoor public spaces serve as a spatial medium for university students’ study, living, and socialization activities, potentially having multiple restorative benefits. However, current campus renewal practices often neglect the growing needs of students, including stress relief and attention restoration. Consequently, the improvement of restorative benefits has become one of the most important goals in the regeneration of human-oriented campus spaces, aiming to find a new balance between the supply of the space itself and the behaviors and needs of students. This study focuses on the campus on a meso-neighborhood scale within the city and selects the Jiulonghu campus of Southeast University for evidence-based research. We innovatively established a research framework that integrates street view images, deep learning, and sDNA to identify key indicators affecting restorative benefits and conducted a comprehensive assessment and prediction on the campus scale. Meanwhile, by overlaying the accessibility results from sDNA, an evaluation matrix with the two dimensions of restorative benefits and accessibility was presented. The optimization pathways were proposed by combining multiple types in the spatial dimension and sequential order in the temporal dimension, ensuring dual control of restorative benefits and accessibility. Therefore, this study can provide new research perspectives and technical support for campus renewal practices.
This study preliminarily verified the validity of the research framework and identified the key indicators according to the explanatory model. The results can better reflect the correlation between the campus environment and the restorative perceptions of students. Based on the predictive model, the restorative benefits of the overall campus space can be quantitatively predicted with the help of the campus SVI database, and the results can be visualized intuitively. On this basis, the results of accessibility were overlayed to determine the priorities of campus optimization practices. This study contributes to bridging the gap between previous research, where restorative benefits have been under-considered. It also provides important methodological support and practical guidance for sustainable campus development and the promotion of the overall health of university students.

Supplementary Materials

The following supporting information can be downloaded at: https://www.mdpi.com/article/10.3390/land14030610/s1. Figure S1: Location map of the 250 online questionnaire points; Figure S2: Location map of the 50 on-site questionnaire points; Table S1: The restorative benefit scores for 50 on-site points from the real-world environments and model predictions; Table S2: The related street view elements of the morphological indicators and their original names of items in ADE20K.

Author Contributions

Conceptualization, T.W., D.L. and J.W.; methodology, T.W. and J.W.; software, D.L. and Y.C.; formal analysis, T.W., D.L. and Y.C.; investigation, T.W., D.L. and Y.C.; writing—original draft, T.W.; writing—review and editing, D.L. and J.W.; funding acquisition, J.W. All authors have read and agreed to the published version of the manuscript.

Funding

This research was funded by the National Natural Science Foundation of China (52078113).

Institutional Review Board Statement

Ethical review and approval were waived for this study due to the absence of sensitive data and the processing of data with the assurance of the confidentiality and anonymization of the personal information of all the subjects involved in the study.

Informed Consent Statement

Not applicable.

Data Availability Statement

The original contributions presented in the study are included in the article, further inquiries can be directed to the corresponding author.

Acknowledgments

The authors are extremely thankful to all the respondents who presented the needed data with great patience, as well as to the surveyors and interviewers who did their best in terms of data collection. All authors agree with this acknowledgment.

Conflicts of Interest

The authors declare no conflicts of interest.

Abbreviations

The following abbreviations are used in this manuscript:
sDNASpatial design network analysis
SDGsSustainable Development Goals
ARTAttention Restoration Theory
SRTStress Reduction Theory
OSMOpen Street Map
HRB-HAHigh restorative benefits and high accessibility
HRB-LAHigh restorative benefits but low accessibility
LRB-HALow restorative benefits but high accessibility
LRB-LALow restorative benefits and low accessibility
RBsRestorative benefits
SVIsStreet view images
GVIGreen view index
SVFSky view factor
BVIBuilding view index
PRS-11Perceived restorative scale-11
PSPNetPyramid Scene Parsing Network
SVRSupport Vector Regression
RFRandom Forest
XGBoosteXtreme Gradient Boosting
MLRMultiple linear regression
MSEMean square error
RMSERoot mean square error
MAEMean absolute error
R2Coefficient of determination

References

  1. Wang, J. The Digital Presentation of Human-Oriented Urban Design. Sustain. Cities Soc. 2023, 97, 104746. [Google Scholar] [CrossRef]
  2. Ransom, J. Future of Cities: Universities and Cities. Available online: https://assets.publishing.service.gov.uk/government/uploads/system/uploads/attachment_data/file/477295/future-cities-universities.pdf (accessed on 23 January 2025).
  3. Josef, G. Restorative Campus Landscapes: Fostering Education Through Restoration; Kansas State University: Manhattan, KS, USA, 2013. [Google Scholar]
  4. Brahmin, A.K.; Kelly, S.J.; Adams, C.E.; Glazebrook, C. A Systematic Review of Studies of Depression Prevalence in University Students. J. Psychiatr. Res. 2013, 47, 391–400. [Google Scholar] [CrossRef]
  5. World Health Organization. 2022 World Mental Health Report: Transforming Mental Health for All. Available online: https://www.who.int/publications/i/item/9789240049338 (accessed on 23 January 2025).
  6. People’s Daily Health APP. The 2022 National Depression Blue Book. Available online: https://mp.weixin.qq.com/s?__biz=MzA4ODE1MDA5Nw==&mid=2649753385&idx=1&sn=b8e71eac58f6a11125ec29a704ae1bd3&chksm=882a3e17bf5db701433357188cf6d2ac8f8da448cdc30d7cdbd49ac996ef3951ece0a62dbd98&scene=27 (accessed on 18 December 2024).
  7. Hodson, C.B.; Sander, H.A. Green Urban Landscapes and School-Level Academic Performance. Landsc. Urban Plan. 2017, 160, 16–27. [Google Scholar] [CrossRef]
  8. Kearns, R.; Milligan, C. Placing Therapeutic Landscape as Theoretical Development in Health & Place. Health Place 2020, 61, 102224. [Google Scholar] [CrossRef]
  9. Ning, W.; Yin, J.; Chen, Q.; Sun, X. Effects of Brief Exposure to Campus Environment on Students’ Physiological and Psychological Health. Front. Public Health 2023, 11, 1051864. [Google Scholar] [CrossRef]
  10. Aghabozorgi, K.; Jagt, A.V.D.; Bell, S.; Smith, H. How University Blue and Green Space Affect Students’ Mental Health: A Scoping Review. Urban For. Urban Green. 2024, 97, 128394. [Google Scholar] [CrossRef]
  11. Li, H.; Du, J.; Chow, D. Perceived Environmental Factors and Students’ Mental Wellbeing in Outdoor Public Spaces of University Campuses: A Systematic Scoping Review. Build. Environ. 2024, 265, 112023. [Google Scholar] [CrossRef]
  12. China’s Ministry of Education. Basic National Education Development in 2023. Available online: https://www.moe.gov.cn/fbh/live/2024/55831/sfcl/202403/t20240301_1117517.html (accessed on 23 January 2025).
  13. Gong, P.; Liang, S.; Carlton, E.J.; Jiang, Q.; Wu, J.; Wang, L.; Remais, J.V. Urbanisation and Health in China. Lancet 2012, 379, 843–852. [Google Scholar] [CrossRef]
  14. Zhang, F.; Zhou, B.; Liu, L.; Liu, Y.; Fung, H.H.; Lin, H.; Ratti, C. Measuring Human Perceptions of a Large-Scale Urban Region Using Machine Learning. Landsc. Urban Plan. 2018, 180, 148–160. [Google Scholar] [CrossRef]
  15. Ye, Y.; Richards, D.; Lu, Y.; Song, X.; Zhuang, Y.; Zeng, W.; Zhong, T. Measuring Daily Accessed Street Greenery: A Human-Scale Approach for Informing Better Urban Planning Practices. Landsc. Urban Plan. 2019, 191, 103434. [Google Scholar] [CrossRef]
  16. UN. Sustainable Development Goals. Available online: https://sdgs.un.org/goals (accessed on 1 December 2024).
  17. Mehta, V. Evaluating Public Space. J. Urban Des. 2014, 19, 53–88. [Google Scholar] [CrossRef]
  18. Wen, H.; Lin, H.; Liu, X.; Guo, W.; Yao, J.; He, B.-J. An Assessment of the Psychologically Restorative Effects of the Environmental Characteristics of University Common Spaces. Environ. Impact Assess. Rev. 2025, 110, 107645. [Google Scholar] [CrossRef]
  19. Yusli, N.A.N.M.; Roslan, S.; Zaremohzzabieh, Z.; Ghiami, Z.; Ahmad, N. Role of Restorativeness in Improving the Psychological Well-Being of University Students. Front. Psychol. 2021, 12, 646329. [Google Scholar] [CrossRef] [PubMed]
  20. Stepansky, K.; Delbert, T.; Bucey, J.C. Active Student Engagement within a University’s Therapeutic Sensory Garden Green Space: Pilot Study of Utilization and Student Perceived Quality of Life. Urban For. Urban Green. 2022, 67, 127452. [Google Scholar] [CrossRef]
  21. Van Dijk-Wesselius, J.E.; Maas, J.; Hovinga, D.; Van Vugt, M.; Van Den Berg, A.E. The Impact of Greening Schoolyards on the Appreciation, and Physical, Cognitive and Social-Emotional Well-Being of Schoolchildren: A Prospective Intervention Study. Landsc. Urban Plan. 2018, 180, 15–26. [Google Scholar] [CrossRef]
  22. Ding, Y.; Lee, C.; Chen, X.; Song, Y.; Newman, G.; Lee, R.; Lee, S.; Li, D.; Sohn, W. Exploring the Association between Campus Environment of Higher Education and Student Health: A Systematic Review of Findings and Measures. Urban For. Urban Green. 2024, 91, 128168. [Google Scholar] [CrossRef]
  23. Gulwadi, G.B.; Mishchenko, E.D.; Hallowell, G.; Alves, S.; Kennedy, M. The Restorative Potential of a University Campus: Objective Greenness and Student Perceptions in Turkey and the United States. Landsc. Urban Plan. 2019, 187, 36–46. [Google Scholar] [CrossRef]
  24. Hipp, J.A.; Gulwadi, G.B.; Alves, S.; Sequeira, S. The Relationship Between Perceived Greenness and Perceived Restorativeness of University Campuses and Student-Reported Quality of Life. Environ. Behav. 2016, 48, 1292–1308. [Google Scholar] [CrossRef]
  25. Huang, K.; Wang, T.; Li, X.; Zhang, R.; Dong, Y. Predicting and Optimizing Restorativeness in Campus Pedestrian Spaces Based on Vision Using Machine Learning and Deep Learning. Land 2024, 13, 1308. [Google Scholar] [CrossRef]
  26. Ellis, W.D. A Source Book of Gestalt Psychology; Routledge: New York, NY, USA, 2013. [Google Scholar]
  27. Kaplan, S. The Restorative Benefits of Nature: Toward an Integrative Framework. J. Environ. Psychol. 1995, 15, 169–182. [Google Scholar] [CrossRef]
  28. Ulrich, R.S.; Simons, R.F.; Losito, B.D.; Fiorito, E.; Miles, M.A.; Zelson, M. Stress Recovery During Exposure to Natural and Urban Environments. J. Environ. Psychol. 1991, 11, 201–230. [Google Scholar] [CrossRef]
  29. Davies, J.L.; Stevanov, J.; Leonards, U. Rethinking the Nature vs. Urban Environment Dichotomy: Aligning Research Classifications with Human Visual Perception. J. Environ. Psychol. 2025, 101, 102507. [Google Scholar] [CrossRef]
  30. Li, H.; Browning, M.H.E.M.; Rigolon, A.; Larson, L.R.; Taff, D.; Labib, S.M.; Benfield, J.; Yuan, S.; McAnirlin, O.; Hatami, N.; et al. Beyond “Bluespace” and “Greenspace”: A Narrative Review of Possible Health Benefits from Exposure to Other Natural Landscapes. Sci. Total Environ. 2023, 856, 159292. [Google Scholar] [CrossRef]
  31. Lindal, P.J.; Hartig, T. Effects of Urban Street Vegetation on Judgments of Restoration Likelihood. Urban For. Urban Green. 2015, 14, 200–209. [Google Scholar] [CrossRef]
  32. Han, X.; Wang, L.; He, J.; Jung, T. Restorative Perception of Urban Streets: Interpretation Using Deep Learning and MGWR Models. Front. Public Health 2023, 11, 1141630. [Google Scholar] [CrossRef]
  33. Staats, H.; Jahncke, H.; Herzog, T.R.; Hartig, T. Urban Options for Psychological Restoration: Common Strategies in Everyday Situations. PLoS ONE 2016, 11, e0146213. [Google Scholar] [CrossRef]
  34. Nordh, H.; Stahl Olafsson, A.; Kajosaari, A.; Præstholm, S.; Liu, Y.; Rossi, S.; Gentin, S. Similar Spaces, Different Usage: A Comparative Study on How Residents in the Capitals of Finland and Denmark Use Cemeteries as Recreational Landscapes. Urban For. Urban Green. 2022, 73, 127598. [Google Scholar] [CrossRef]
  35. Lee, N. Third Place and Psychological Well-Being: The Psychological Benefits of Eating and Drinking Places for University Students in Southern California, USA. Cities 2022, 131, 104049. [Google Scholar] [CrossRef]
  36. Ji, T.; Chen, J.-H.; Wei, H.-H.; Su, Y.-C. Towards People-Centric Smart City Development: Investigating the Citizens’ Preferences and Perceptions about Smart-City Services in Taiwan. Sustain. Cities Soc. 2021, 67, 102691. [Google Scholar] [CrossRef]
  37. Liu, L.; Qu, H.; Ma, Y.; Wang, K.; Qu, H. Restorative Benefits of Urban Green Space: Physiological, Psychological Restoration and Eye Movement Analysis. J. Environ. Manag. 2022, 301, 113930. [Google Scholar] [CrossRef]
  38. Guo, L.; Gong, X.; Li, Y.; Zhang, D.; Elsadek, M.; Yun, J.; Ahmad, H.; Yao, M.; Li, N. Multisensory Health and Well-Being of Chinese Classical Gardens: Insights from Humble Administrator’s Garden. Land 2025, 14, 317. [Google Scholar] [CrossRef]
  39. Chen, Y.; Wu, J.; Zou, Y.; Dong, W.; Zhou, X. Optimal Design and Verification of Informal Learning Spaces (ILS) in Chinese Universities Based on Visual Perception Analysis. Buildings 2022, 12, 1495. [Google Scholar] [CrossRef]
  40. Rossetti, T.; Lobel, H.; Rocco, V.; Hurtubia, R. Explaining Subjective Perceptions of Public Spaces as a Function of the Built Environment: A Massive Data Approach. Landsc. Urban Plan. 2019, 181, 169–178. [Google Scholar] [CrossRef]
  41. Shao, Y.; Yin, Y.; Ma, D. Evaluating the Equity of Urban Streetscapes in Promoting Human Health—Taking Shanghai Inner City as an Example. Land 2023, 13, 48. [Google Scholar] [CrossRef]
  42. Brancato, G.; Van Hedger, K.; Berman, M.G.; Van Hedger, S.C. Simulated Nature Walks Improve Psychological Well-Being along a Natural to Urban Continuum. J. Environ. Psychol. 2022, 81, 101779. [Google Scholar] [CrossRef]
  43. Luo, S.; Shi, J.; Lu, T.; Furuya, K. Sit down and Rest: Use of Virtual Reality to Evaluate Preferences and Mental Restoration in Urban Park Pavilions. Landsc. Urban Plan. 2022, 220, 104336. [Google Scholar] [CrossRef]
  44. Chen, D.; Yin, J.; Yu, C.-P.; Sun, S.; Gabel, C.; Spengler, J.D. Physiological and Psychological Responses to Transitions between Urban Built and Natural Environments Using the Cave Automated Virtual Environment. Landsc. Urban Plan. 2024, 241, 104919. [Google Scholar] [CrossRef]
  45. Sun, K.; Li, Z.; Zheng, S.; Qu, H. Quantifying Environmental Characteristics on Psychophysiological Restorative Benefits of Campus Window Views. Build. Environ. 2024, 262, 111822. [Google Scholar] [CrossRef]
  46. Zhai, Y.; Fan, B.; Yu, J.; Gong, R.; Yin, J. Effects of Spatial Type and Scale of Small Urban Open Spaces on Perceived Restoration: An Online Survey-Based Experiment. Land 2024, 13, 1370. [Google Scholar] [CrossRef]
  47. Le, Q.H.; Kwon, N.; Nguyen, T.H.; Kim, B.; Ahn, Y. Sensing Perceived Urban Stress Using Space Syntactical and Urban Building Density Data: A Machine Learning-Based Approach. Build. Environ. 2024, 266, 112054. [Google Scholar] [CrossRef]
  48. Ma, H.; Zhang, Y.; Liu, P.; Zhang, F.; Zhu, P. How Does Spatial Structure Affect Psychological Restoration? A Method Based on Graph Neural Networks and Street View Imagery. Landsc. Urban Plan. 2024, 251, 105171. [Google Scholar] [CrossRef]
  49. Wu, Y.; Liu, Q.; Hang, T.; Yang, Y.; Wang, Y.; Cao, L. Integrating Restorative Perception into Urban Street Planning: A Framework Using Street View Images, Deep Learning, and Space Syntax. Cities 2024, 147, 104791. [Google Scholar] [CrossRef]
  50. Wu, T.; Wu, J.; Yang, Y.; Dong, W. A Bibliometric Review of Perceptions of the Built Environment Supported by Multi-Source Data. J. Asian Archit. Build. 2024, 13, 1–16. [Google Scholar] [CrossRef]
  51. Hansen, W.G. How Accessibility Shapes Land Use. J. Am. Inst. Plan. 1959, 25, 73–76. [Google Scholar] [CrossRef]
  52. Van Herzele, A.; Wiedemann, T. A Monitoring Tool for the Provision of Accessible and Attractive Urban Green Spaces. Landsc. Urban Plan. 2003, 63, 109–126. [Google Scholar] [CrossRef]
  53. Gupta, K.; Roy, A.; Luthra, K.; Maithani, S. Mahavir GIS Based Analysis for Assessing the Accessibility at Hierarchical Levels of Urban Green Spaces. Urban For. Urban Green. 2016, 18, 198–211. [Google Scholar] [CrossRef]
  54. Hillier, B. Space Is Machine: A Configurational Theory of Architecture; Cambridge University Press: Cambridge, UK, 1984. [Google Scholar]
  55. sDNA. A Software for Spatial Design Network Analysis. Available online: https://www.cardiff.ac.uk/sdna (accessed on 5 June 2024).
  56. Song, X.; Tao, Y.; Pan, J.; Xiao, Y. A Comparison of Analytical Methods for Urban Street Network: Taking Space Syntax, sDNA and UNA as Examples. Urban Plan. Forum 2020, 2, 19–24. [Google Scholar]
  57. Lee, G.; Hong, I. Measuring Spatial Accessibility in the Context of Spatial Disparity Between Demand and Supply of Urban Park Service. Landsc. Urban Plan. 2013, 119, 85–90. [Google Scholar] [CrossRef]
  58. Tabrizian, P.; Baran, P.K.; Smith, W.R.; Meentemeyer, R.K. Exploring Perceived Restoration Potential of Urban Green Enclosure Through Immersive Virtual Environments. J. Environ. Psychol. 2018, 55, 99–109. [Google Scholar] [CrossRef]
  59. Huang, J.; Liang, J.; Yang, M.; Li, Y. Visual Preference Analysis and Planning Responses Based on Street View Images: A Case Study of Gulangyu Island, China. Land 2022, 12, 129. [Google Scholar] [CrossRef]
  60. Biljecki, F.; Ito, K. Street View Imagery in Urban Analytics and GIS: A Review. Landsc. Urban Plan. 2021, 215, 104217. [Google Scholar] [CrossRef]
  61. Danish, M.; Labib, S.M.; Ricker, B.; Helbich, M. A Citizen Science Toolkit to Collect Human Perceptions of Urban Environments Using Open Street View Images. Comput. Environ. Urban Syst. 2025, 116, 102207. [Google Scholar] [CrossRef]
  62. Rundle, A.G.; Bader, M.D.M.; Richards, C.A.; Neckerman, K.M.; Teitler, J.O. Using Google Street View to Audit Neighborhood Environments. Am. J. Prev. Med. 2011, 40, 94–100. [Google Scholar] [CrossRef] [PubMed]
  63. Kang, Y.; Abraham, J.; Ceccato, V.; Duarte, F.; Gao, S.; Ljungqvist, L.; Zhang, F.; Näsman, P.; Ratti, C. Assessing Differences in Safety Perceptions Using GeoAI and Survey Across Neighbourhoods in Stockholm, Sweden. Landsc. Urban Plan. 2023, 236, 104768. [Google Scholar] [CrossRef]
  64. Wang, R.; Liu, Y.; Lu, Y.; Zhang, J.; Liu, P.; Yao, Y.; Grekousis, G. Perceptions of Built Environment and Health Outcomes for Older Chinese in Beijing: A Big Data Approach with Street View Images and Deep Learning Technique. Comput. Environ. Urban Syst. 2019, 78, 101386. [Google Scholar] [CrossRef]
  65. Shao, C.; Chung, W. The Impact of Park Environmental Characteristics and Visitor Perceptions on Visitor Emotions from a Cross-Cultural Perspective. Urban For. Urban Green. 2024, 102, 128575. [Google Scholar] [CrossRef]
  66. Cai, Q.; Abdel-Aty, M.; Zheng, O.; Wu, Y. Applying Machine Learning and Google Street View to Explore Effects of Drivers’ Visual Environment on Traffic Safety. Transp. Res. Part C Emerg. Technol. 2022, 135, 103541. [Google Scholar] [CrossRef]
  67. Half of the Top 20 Science Cities Are Now in China—And Regional City Growth is the Key. Available online: http://www.nature.com/articles/d41586-024-03521-z (accessed on 13 January 2025).
  68. Ministry of Education of the People’s Republic of China. List of National Ordinary Schools of Higher Education (by 15 June 2023). Available online: http://www.moe.gov.cn/jyb_xxgk/s5743/s5744/A03/202306/t20230619_1064976.html (accessed on 23 January 2025).
  69. Rzotkiewicz, A.; Pearson, A.L.; Dougherty, B.V.; Shortridge, A.; Wilson, N. Systematic Review of the Use of Google Street View in Health Research: Major Themes, Strengths, Weaknesses and Possibilities for Future Research. Health Place 2018, 52, 240–246. [Google Scholar] [CrossRef]
  70. Ulrich, R.S. Visual Landscapes and Psychological Well-being. Landsc. Res. 1979, 4, 17–23. [Google Scholar] [CrossRef]
  71. Zhao, J.; Wu, J.; Wang, H. Characteristics of Urban Streets in Relation to Perceived Restorativeness. J. Expo. Sci. Environ. Epidemiol. 2020, 30, 309–319. [Google Scholar] [CrossRef]
  72. Gong, F.-Y.; Zeng, Z.-C.; Zhang, F.; Li, X.; Ng, E.; Norford, L.K. Mapping Sky, Tree, and Building View Factors of Street Canyons in a High-Density Urban Environment. Build. Environ. 2018, 134, 155–167. [Google Scholar] [CrossRef]
  73. Liu, P.; Zhao, T.; Luo, J.; Lei, B.; Frei, M.; Miller, C.; Biljecki, F. Towards Human-Centric Digital Twins: Leveraging Computer Vision and Graph Models to Predict Outdoor Comfort. Sustain. Cities Soc. 2023, 93, 104480. [Google Scholar] [CrossRef]
  74. Biljecki, F.; Zhao, T.; Liang, X.; Hou, Y. Sensitivity of Measuring the Urban Form and Greenery Using Street-Level Imagery: A Comparative Study of Approaches and Visual Perspectives. Int. J. Appl. Earth Obs. 2023, 122, 103385. [Google Scholar] [CrossRef]
  75. Zhang, X.; Lin, E.S.; Tan, P.Y.; Qi, J.; Ho, R.; Sia, A.; Waykool, R.; Song, X.P.; Olszewska-Guizzo, A.; Meng, L.; et al. Beyond Just Green: Explaining and Predicting Restorative Potential of Urban Landscapes Using Panorama-Based Metrics. Landsc. Urban Plan. 2024, 247, 105044. [Google Scholar] [CrossRef]
  76. Stoltz, J.; Grahn, P. Perceived Sensory Dimensions: An Evidence-Based Approach to Greenspace Aesthetics. Urban For. Urban Green. 2021, 59, 126989. [Google Scholar] [CrossRef]
  77. Yakınlar, N.; Akpınar, A. How Perceived Sensory Dimensions of Urban Green Spaces Are Associated with Adults’ Perceived Restoration, Stress, and Mental Health? Urban For. Urban Green. 2022, 72, 127572. [Google Scholar] [CrossRef]
  78. Dijkstra, N.; Bosch, S.E.; Van Gerven, M.A.J. Shared Neural Mechanisms of Visual Perception and Imagery. Trends Cogn. Sci. 2019, 23, 423–434. [Google Scholar] [CrossRef]
  79. Hartig, T.; Korpela, K.; Evans, G.W.; Gärling, T. Validation of a measure of perceived environmental restorativeness. Göteb. Psychol. Rep. 1996, 26, 1–64. [Google Scholar]
  80. Berto, R.; Baroni, M.R.; Zainaghi, A.; Bettella, S. An Exploratory Study of the Effect of High and Low Fascination Environments on Attentional Fatigue. J. Environ. Psychol. 2010, 30, 494–500. [Google Scholar] [CrossRef]
  81. Pasini, M.; Berto, R.; Brondino, M.; Hall, R.; Ortner, C. How to Measure the Restorative Quality of Environments: The PRS-11. Procedia—Soc. Behav. Sci. 2014, 159, 293–297. [Google Scholar] [CrossRef]
  82. Wilkie, S.; Clements, H. Further Exploration of Environment Preference and Environment Type Congruence on Restoration and Perceived Restoration Potential. Landsc. Urban Plan. 2018, 170, 314–319. [Google Scholar] [CrossRef]
  83. Ma, H.; Xu, Q.; Zhang, Y. High or Low? Exploring the Restorative Effects of Visual Levels on Campus Spaces Using Machine Learning and Street View Imagery. Urban For. Urban Green. 2023, 88, 128087. [Google Scholar] [CrossRef]
  84. Li, X.; Feng, M.; Ran, Y.; Su, Y.; Liu, F.; Huang, C.; Shen, H.; Xiao, Q.; Su, J.; Yuan, S.; et al. Big Data in Earth System Science and Progress towards a Digital Twin. Nat. Rev. Earth Environ. 2023, 4, 319–332. [Google Scholar] [CrossRef]
  85. Zhao, H.; Shi, J.; Qi, X.; Wang, X.; Jia, J. Pyramid Scene Parsing Network. In Proceedings of the 2017 IEEE Conference on Computer Vision and Pattern Recognition (CVPR), Honolulu, HI, USA, 21–26 July 2017; IEEE: Piscataway, NJ, USA; pp. 6230–6239. [Google Scholar]
  86. Zhou, B.; Zhao, H.; Puig, X.; Xiao, T.; Fidler, S.; Barriuso, A.; Torralba, A. Semantic Understanding of Scenes Through the ADE20K Dataset. Int. J. Comput. Vis. 2019, 127, 302–321. [Google Scholar] [CrossRef]
  87. Zhang, W.; Zeng, H. Spatial Differentiation Characteristics and Influencing Factors of the Green View Index in Urban Areas Based on Street View Images: A Case Study of Futian District, Shenzhen, China. Urban For. Urban Green. 2024, 93, 128219. [Google Scholar] [CrossRef]
  88. Akpinar, A.; Barbosa-Leiker, C.; Brooks, K.R. Does Green Space Matter? Exploring Relationships Between Green Space Type and Health Indicators. Urban For. Urban Green. 2016, 20, 407–418. [Google Scholar] [CrossRef]
  89. Sainani, K.L. Explanatory Versus Predictive Modeling. PmR 2014, 6, 841–844. [Google Scholar] [CrossRef]
  90. Shatu, F.; Yigitcanlar, T.; Bunker, J. Shortest Path Distance vs. Least Directional Change: Empirical Testing of Space Syntax and Geographic Theories Concerning Pedestrian Route Choice Behaviour. J. Transp. Geogr. 2019, 74, 37–52. [Google Scholar] [CrossRef]
  91. Luscher, D. Introducing the 15-Minute City Project: Putting People at the Center of Urban Transformation. Available online: https://www.15minutecity.com/blog/hello (accessed on 23 January 2025).
  92. Hinton, P. Statistics Explained: A Guide for Social Science Students; Routledge: New York, NY, USA, 2004. [Google Scholar]
  93. Yeh, C.-Y.; Huang, C.-W.; Lee, S.-J. A Multiple-Kernel Support Vector Regression Approach for Stock Market Price Forecasting. Expert Syst. Appl. 2011, 38, 2177–2186. [Google Scholar] [CrossRef]
  94. Ho, T.K. Random Decision Forests. In Proceedings of the Third International Conference on Document Analysis and Recognition, Montreal, QC, Canada, 14–16 August 1995; Volume 1, pp. 278–282. [Google Scholar] [CrossRef]
  95. Chen, T.; Guestrin, C. XGBoost: A Scalable Tree Boosting System. In Proceedings of the 22nd ACM SIGKDD International Conference on Knowledge Discovery and Data Mining, San Francisco, CA, USA, 13 August 2016; ACM: New York, NY, USA, 2016; pp. 785–794. [Google Scholar]
  96. Li, X.; Wang, X.; Jiang, X.; Han, J.; Wang, Z.; Wu, D.; Lin, Q.; Li, L.; Zhang, S.; Dong, Y. Prediction of Riverside Greenway Landscape Aesthetic Quality of Urban Canalized Rivers Using Environmental Modeling. J. Clean. Prod. 2022, 367, 133066. [Google Scholar] [CrossRef]
  97. Singh, S.; Gupta, S. Prediction of diabetes using ensemble learning model. In Machine Intelligence and Soft Computing; Bhattacharyya, D., Thirupathi, R., Eds.; Springer: Singapore, 2021; pp. 39–59. [Google Scholar]
  98. Liu, X.; Chen, X.; Potoglou, D.; Tian, M.; Fu, Y. Travel Impedance, the Built Environment, and Customized-Bus Ridership: A Stop-to-Stop Level Analysis. Transp. Res. Part D Transp. Environ. 2023, 122, 103889. [Google Scholar] [CrossRef]
  99. Osborne, T. Restorative and Afflicting Qualities of the Microspace Encounter: Psychophysiological Reactions to the Spaces of the City. Ann. Am. Assoc. Geogr. 2022, 112, 1461–1483. [Google Scholar] [CrossRef]
  100. McCormack, G.R.; Rock, M.; Toohey, A.M.; Hignell, D. Characteristics of Urban Parks Associated with Park Use and Physical Activity: A Review of Qualitative Research. Health Place 2010, 16, 712–726. [Google Scholar] [CrossRef] [PubMed]
  101. Labib, S.M.; Lindley, S.; Huck, J.J. Spatial Dimensions of the Influence of Urban Green-Blue Spaces on Human Health: A Systematic Review. Environ. Res. 2020, 180, 108869. [Google Scholar] [CrossRef]
  102. Halecki, W.; Stachura, T.; Fudała, W.; Stec, A.; Kuboń, S. Assessment and Planning of Green Spaces in Urban Parks: A Review. Sustain. Cities Soc. 2023, 88, 104280. [Google Scholar] [CrossRef]
  103. Asim, F.; Chani, P.S.; Shree, V.; Rai, S. Restoring the Mind: A Neuropsychological Investigation of University Campus Built Environment Aspects for Student Well-Being. Build. Environ. 2023, 244, 110810. [Google Scholar] [CrossRef]
  104. Elsadek, M.; Deshun, Z.; Liu, B. High-Rise Window Views: Evaluating the Physiological and Psychological Impacts of Green, Blue, and Built Environments. Build. Environ. 2024, 262, 111798. [Google Scholar] [CrossRef]
  105. Yin, J.; Ramanpong, J.; Chang, J.; Wu, C.-D.; Chao, P.-H.; Yu, C.-P. Effects of Blue Space Exposure in Urban and Natural Environments on Psychological and Physiological Responses: A Within-Subject Experiment. Urban For. Urban Green. 2023, 87, 128066. [Google Scholar] [CrossRef]
  106. Bulut, Z.; Yilmaz, H. Determination of Waterscape Beauties Through Visual Quality Assessment Method. Environ. Monit. Assess. 2009, 154, 459–468. [Google Scholar] [CrossRef]
  107. Deng, L.; Li, X.; Luo, H.; Fu, E.-K.; Ma, J.; Sun, L.-X.; Huang, Z.; Cai, S.-Z.; Jia, Y. Empirical Study of Landscape Types, Landscape Elements and Landscape Components of the Urban Park Promoting Physiological and Psychological Restoration. Urban For. Urban Green. 2020, 48, 126488. [Google Scholar] [CrossRef]
  108. St-Jean, P.; Clark, O.G.; Jemtrud, M. A Review of the Effects of Architectural Stimuli on Human Psychology and Physiology. Build. Environ. 2022, 219, 109182. [Google Scholar] [CrossRef]
  109. Nordh, H.; Østby, K. Pocket Parks for People—A Study of Park Design and Use. Urban For. Urban Green. 2013, 12, 12–17. [Google Scholar] [CrossRef]
  110. Staats, H.; Hartig, T. Alone or with a Friend: A Social Context for Psychological Restoration and Environmental Preferences. J. Environ. Psychol. 2004, 24, 199–211. [Google Scholar] [CrossRef]
  111. Ratcliffe, E.; Gatersleben, B.; Sowden, P.T. Bird Sounds and Their Contributions to Perceived Attention Restoration and Stress Recovery. J. Environ. Psychol. 2013, 36, 221–228. [Google Scholar] [CrossRef]
  112. Xu, W.; Xu, S.; Shi, R.; Chen, Z.; Lin, Y.; Chen, J. Exploring the Impact of University Green Spaces on Students’ Perceived Restoration and Emotional States Through Audio-Visual Perception. Ecol. Inform. 2024, 82, 102766. [Google Scholar] [CrossRef]
Figure 2. Research workflow that integrates street view image data, deep learning algorithms, and sDNA methods.
Land 14 00610 g002
Figure 3. Overview of the study area: (a) location of Jiangsu province in China, (b) location of Nanjing in Jiangsu province, (c) SEU Jiulonghu campus in Jiangning district, (d) university campus distribution map in Nanjing, and (e) satellite map of Jiulonghu campus.
Land 14 00610 g003
Figure 4. Example of the Baidu SVI collection process.
Land 14 00610 g004
Figure 5. Schematic of image semantic segmentation using PSPNet.
Land 14 00610 g005
Figure 6. Correlation analysis between objective spatial elements (a); morphological indicators (b); and subjective restorative perception scores.
Land 14 00610 g006
Figure 7. Map of predicted restorative benefits for campus public spaces and schematic of representative spaces.
Land 14 00610 g007
Figure 8. Comparison of restorative benefit scores between real-world environment and model prediction.
Land 14 00610 g008
Figure 9. Results of accessibility analysis: 400 m (a), 800 m (b), and 1200 m (c); overlay analysis of accessibility and restoration benefits: 400 m (d), 800 m (e), and 1200 m (f).
Land 14 00610 g009
Figure 10. Optimization pathways of campus public space with the dual control of restorative benefits and accessibility.
Land 14 00610 g010
Figure 11. The sequential order of campus public spaces with dual control of restorative benefits and accessibility.
Land 14 00610 g011
Table 1. The 12 morphological indicators using SVIs for calculation.
Morphological IndicatorCalculation Method
NaturalnessThe arctangent of the ratio of natural elements (tree, grass, plant, water, etc.) to gray infrastructure (building, sidewalk, path, wall, etc.)
N a t u r a l n e s s = A r c t a n ( [ n a t u r a l   e l e m e n t s ] [ g r e y   i n f r a s t r u c t u r e ] )
WildnessThe arctangent of the ratio of flora (plant, flora, etc.) to the sum of grass and all the non-natural elements (building, sidewalk, path, wall, etc.)
W i l d n e s s = A r c t a n ( [ f l o r a ] [ g r a s s ] + [ n o n n a t u r a l   e l e m e n t s ] )
Green view index (GVI)Sum of the area proportions of all greenery elements (tree, grass, plant, etc.)
Sky view factor (SVF)Proportion of sky in the image
Spatial divisionSum of the area proportions of elements (road, path, wall, etc.) dividing a coherent and integral space for activity
Free spaceSum of the area proportions of places (grass, ground, earth, etc.) for free activity
GVI variationStandard deviation of GVI in the four views
DisturbanceSum of the area proportions of the disturbing components (road, car, bicycle, etc.)
Building view index (BVI)Proportion of buildings in the image
Diversity of plant groupsShannon diversity index based on the area proportions of trees, grass, plants, and palms
Diversity of sensory dimensionsShannon diversity index based on the area proportions of natural elements (trees, grass, plants, water, etc.), buildings, service facilities (benches, sculptures, signboards, pitches, etc.), the sky, spatial divisions (roads, paths, walls, etc.)
Service facilitySum of the area proportions of service facilities (benches, sculptures, signboards, pitches, etc.) for use and decoration
Table 2. The top 15 street view elements with the highest average proportions.
WallBuildingSkyTreeRoadGrassSidewalkPersonEarthPlantWaterFieldFenceRailingSignboard
Occurrence rate %92.27295.66810010099.85899.69596.05571.14196.29999.49251.23025.28089.87259.71199.939
Average rate %0.4995.53313.31534.92816.3289.0146.9190.2255.0854.2610.2920.0610.6940.0580.285
Table 3. Multiple linear regression model of spatial element indicators and restorative benefits. (Adj R2 = 0.690, DW = 1.666).
Element IndicatorBetaStd. BetaStd. Errort ValueSig.95%CIToleranceVIF
LowerUpper
Tree4.1340.3020.7065.8540.0002.7435.5250.4662.146
Building−7.813−0.3081.178−6.6320.000−10.134−5.4920.5781.729
Grass6.7460.3080.8647.8120.0005.0458.4480.7981.253
Plant9.9680.2541.4316.9670.0007.15012.7860.9331.072
Earth4.2870.2690.6806.3040.0002.9475.6270.6821.466
Person−29.113−0.1447.157−4.0680.000−43.210−15.0160.9941.006
Table 4. Multiple linear regression model of morphological indicators and restorative benefits. (Adj R2 = 0.672, DW = 1.683).
Morphological IndicatorBetaStd. BetaStd. Errort ValueSig.95%CIToleranceVIF
LowerUpper
GVI5.0980.4820.5119.9790.0004.0926.1040.5651.771
BVI−6.682−0.2631.121−5.9580.000−8.891−4.4730.6751.481
Free space3.9960.2550.6715.9530.0002.6745.3180.7181.393
Wildness0.6610.1780.1404.7150.0000.3850.9370.9271.079
Service facility−31.510−0.09911.789−2.6730.008−54.731−8.2890.9601.041
Table 5. Results of predictive performance metrics for different algorithmic models.
ModelTraining (n = 70%)Testing (n = 30%)
MSERMSEMAER2MSERMSEMAER2
SVR0.6160.7850.5870.7530.7490.8650.6300.676
RF0.1540.3930.2940.9330.6140.7840.6270.753
XGBoost0.1580.2410.1930.9750.5940.7700.5990.761
Note. MSE: mean square error. RMSE: root mean square error. MAE: mean absolute error. R2: coefficient of determination.
Table 6. Analysis of four spatial types and percentages based on the dimensions of restorative benefits and accessibility.
Types400 m (5 min)800 m (10 min)1200 m (15 min)Overlaying
HRB-HA6.199%9.207%8.933%5.652%
HRB-LA15.861%15.314%13.309%11.486%
LRB-HA26.436%23.063%21.878%18.505%
LRB-LA19.234%19.964%21.057%12.671%
Disclaimer/Publisher’s Note: The statements, opinions and data contained in all publications are solely those of the individual author(s) and contributor(s) and not of MDPI and/or the editor(s). MDPI and/or the editor(s) disclaim responsibility for any injury to people or property resulting from any ideas, methods, instructions or products referred to in the content.

