Article

Defining Rural Types Nearby Large Cities from the Perspective of Urban–Rural Integration: A Case Study of Xi’an Metropolitan Area, China

1
College of Architecture, Xi’an University of Architecture and Technology, Xi’an 710055, China
2
School of Future Technology, Xi’an University of Architecture and Technology, Xi’an 710055, China
3
College of Architecture and Urban Planning, Tongji University, Shanghai 200092, China
4
Department of Architecture and Civil Engineering, City University of Hong Kong, Hong Kong 999077, China
*
Authors to whom correspondence should be addressed.
Land 2025, 14(3), 602; https://doi.org/10.3390/land14030602
Submission received: 23 February 2025 / Revised: 10 March 2025 / Accepted: 11 March 2025 / Published: 13 March 2025

Abstract

:
Urban–rural integration (URI) is essential to achieving sustainable development. However, the rural areas surrounding large cities typically have a large scale and significant differences in development conditions. It is necessary to formulate rural development policies by category to better promote the integrated development between urban and rural areas, stimulate rural vitality, and create more significant opportunities for rural development. This study constructs an evaluation system for rural areas under URI, using the Xi’an metropolitan area as a case study. A clustering algorithm enhanced by the random forest (RF)–principal component analysis (PCA)–partitioning around medoids (PAM) method is applied to evaluate rural integration comprehensively. Key findings in this study include the following: (i) URI should be decoupled from administrative divisions, considering the complex impacts of multi-town functional spillover; (ii) ecological environment, economic development, public service allocation, and construction land supply are key factors influencing URI; (iii) the overall URI index in the Xi’an metropolitan area presents a “high in the center, low in the east and west” pattern. The rural areas with high URI index are around Xi’an and Xianyang, while other cities show insufficient communication with neighboring villages; (iv) rural areas can be categorized into four types of integration: ecological, ecological–economic, ecological–social–spatial, and ecological–economic–social–spatial, which exhibit an outward expansion of layers and extension along the east–west axis in the spatial structure of integration. Finally, differential development policies and suggestions for promoting urban–rural integration are put forward because of the different types of rural villages. This paper provides a framework for formulating rural development policies, significantly deepening urban–rural integration.

1. Introduction

Urban–rural integration (URI) development aims to enhance the close connections between urban and rural areas, facilitating the healthy bidirectional flow of resources and providing direction for the collaborative development relationship between cities and villages [1,2]. From the 19th National Congress of the Communist Party of China in 2017, which proposed to “establish and improve the system and policy framework for urban-rural integration”, to the Third Plenary Session of the 20th Central Committee in 2023, which pointed out that “urban-rural integration is an inevitable requirement for Chinese-style modernization”, and further to the Central Committee of the Communist Party of China and the State Council issuing the “Comprehensive Rural Revitalization Plan (2024–2027)” in early 2025, emphasizing the need to “promote urban-rural integration development” and “advance comprehensive rural revitalization in a classified manner”, the development of URI in China has gained increasing attention. It has become an essential sustainable and collaborative development strategy in urban and rural areas.
URI results from the evolution of urban–rural relations through theory and practice. Its theoretical basis has experienced three main paradigm evolutions: first, Marxist dialectics emphasizes the existence and resolution of urban–rural contradictions [3]; second, the new economic geography model reveals the interactive relationship between urban and rural areas by quantifying factor flows [4]; and third, cross-border governance and transaction cost analysis under the perspective of institutional economics provide a new framework for understanding urban–rural integration [5]. Notably, performance theory in European urban–rural relations research offers a new perspective on deconstructing the quality of urban–rural interaction through a multi-dimensional performance evaluation system [6]. It breaks through the traditional urban–rural dualism and emphasizes viewing urban and rural areas as dynamic functional network systems. Urban–rural relations gradually shift towards resource allocation, factor flow, mutual influence between urban and rural areas, and integrated development.
Many previous studies have focused on the theme of URI, covering various aspects such as conceptual analysis and theoretical framework construction [7,8], current status evolution and impact analysis [9,10], and holistic evaluation [11]. In recent years, an increasing number of scholars have also researched the classification of rural types [12,13,14] to provide a basis for differentiated development path selection for different villages. For example, Europe has a rich rural classification experience [15], showing concern for the causes and effects of social changes and attaching importance to the heterogeneity between rural areas [16]. However, there is currently a lack of research analyzing rural type classification in the frontier areas of URI—peri-urban areas.
The areas at the interface of metropolitan and rural areas are the regions where the flow of urban and rural elements and spatial transformations are the most intense and crucial zones for URI development [17]. In the “Rural Revitalization Strategic Plan (2018–2022)”, villages are categorized into four types: aggregation enhancement, urban–rural integration, characteristic protection, and relocation and dismantling, without further subdivision, making it difficult to provide precise guidance for formulating development strategies tailored to peri-urban villages. Due to their conditions and varying degrees of influence from nearby urban developments, different villages often exhibit differences in economic, social, spatial, and ecological integration during the URI process. As Ji and Tian (2024) point out, villages’ spatial characteristics, land use patterns, and development potential vary significantly across regions [18]. Rural areas near big cities, as transitional zones, are transforming from passively accepting spillovers to actively restructuring functions. Different rural regions need differentiated development policies, but current policy-making lacks scientific classification criteria, making it hard to meet diverse rural development needs precisely. Therefore, formulating rural development plans for peri-urban areas and scientifically conducting rural classification from the perspective of URI is fundamental and essential.
The classification of rural types often requires a comprehensive and objective evaluation index system. Some scholars have already conducted rural classification studies based on the characteristics of specific research areas, selecting evaluation indicators that cover various dimensions such as natural resources [19,20], economic and industrial development [21,22], social demographics [11,23], and public services [24]. However, most of these indicators are static and lack an understanding of the dynamics and trends of village development. Additionally, most existing research on rural classification is based on administrative jurisdiction units [25,26,27], with little consideration of the impacts of urban–rural and rural–rural interactions across administrative boundaries on village development; this situation is more pronounced in peri-urban areas. This cross-administrative interaction is crucial for accurately assessing urban–rural integration and policy effectiveness, and ignoring it may weaken URI policy implementation. Therefore, it is evident that the construction of evaluation indicators for rural classification that consider both static and dynamic characteristics from the perspective of URI and empirical analysis is urgently needed.
To this end, this paper constructs an evaluation index system for rural classification under the perspective of URI, encompassing four dimensions: ecological, economic, social, and spatial, based on the existing literature. Using the Xi’an Metropolitan Region as the geographical foundation for this study, we selected 3804 peri-urban villages (i.e., villages exhibiting URI characteristics) as analysis samples. Subsequently, we calculated the villages’ dimensional and comprehensive URI indices, identified rural clusters based on the evaluation indicators, and clarified the clustering implications in conjunction with the dimensional characteristics. Finally, we propose differentiated development strategies for villages in this region to promote the realization of URI and rural revitalization.

2. Study Area, Data, and Measurements
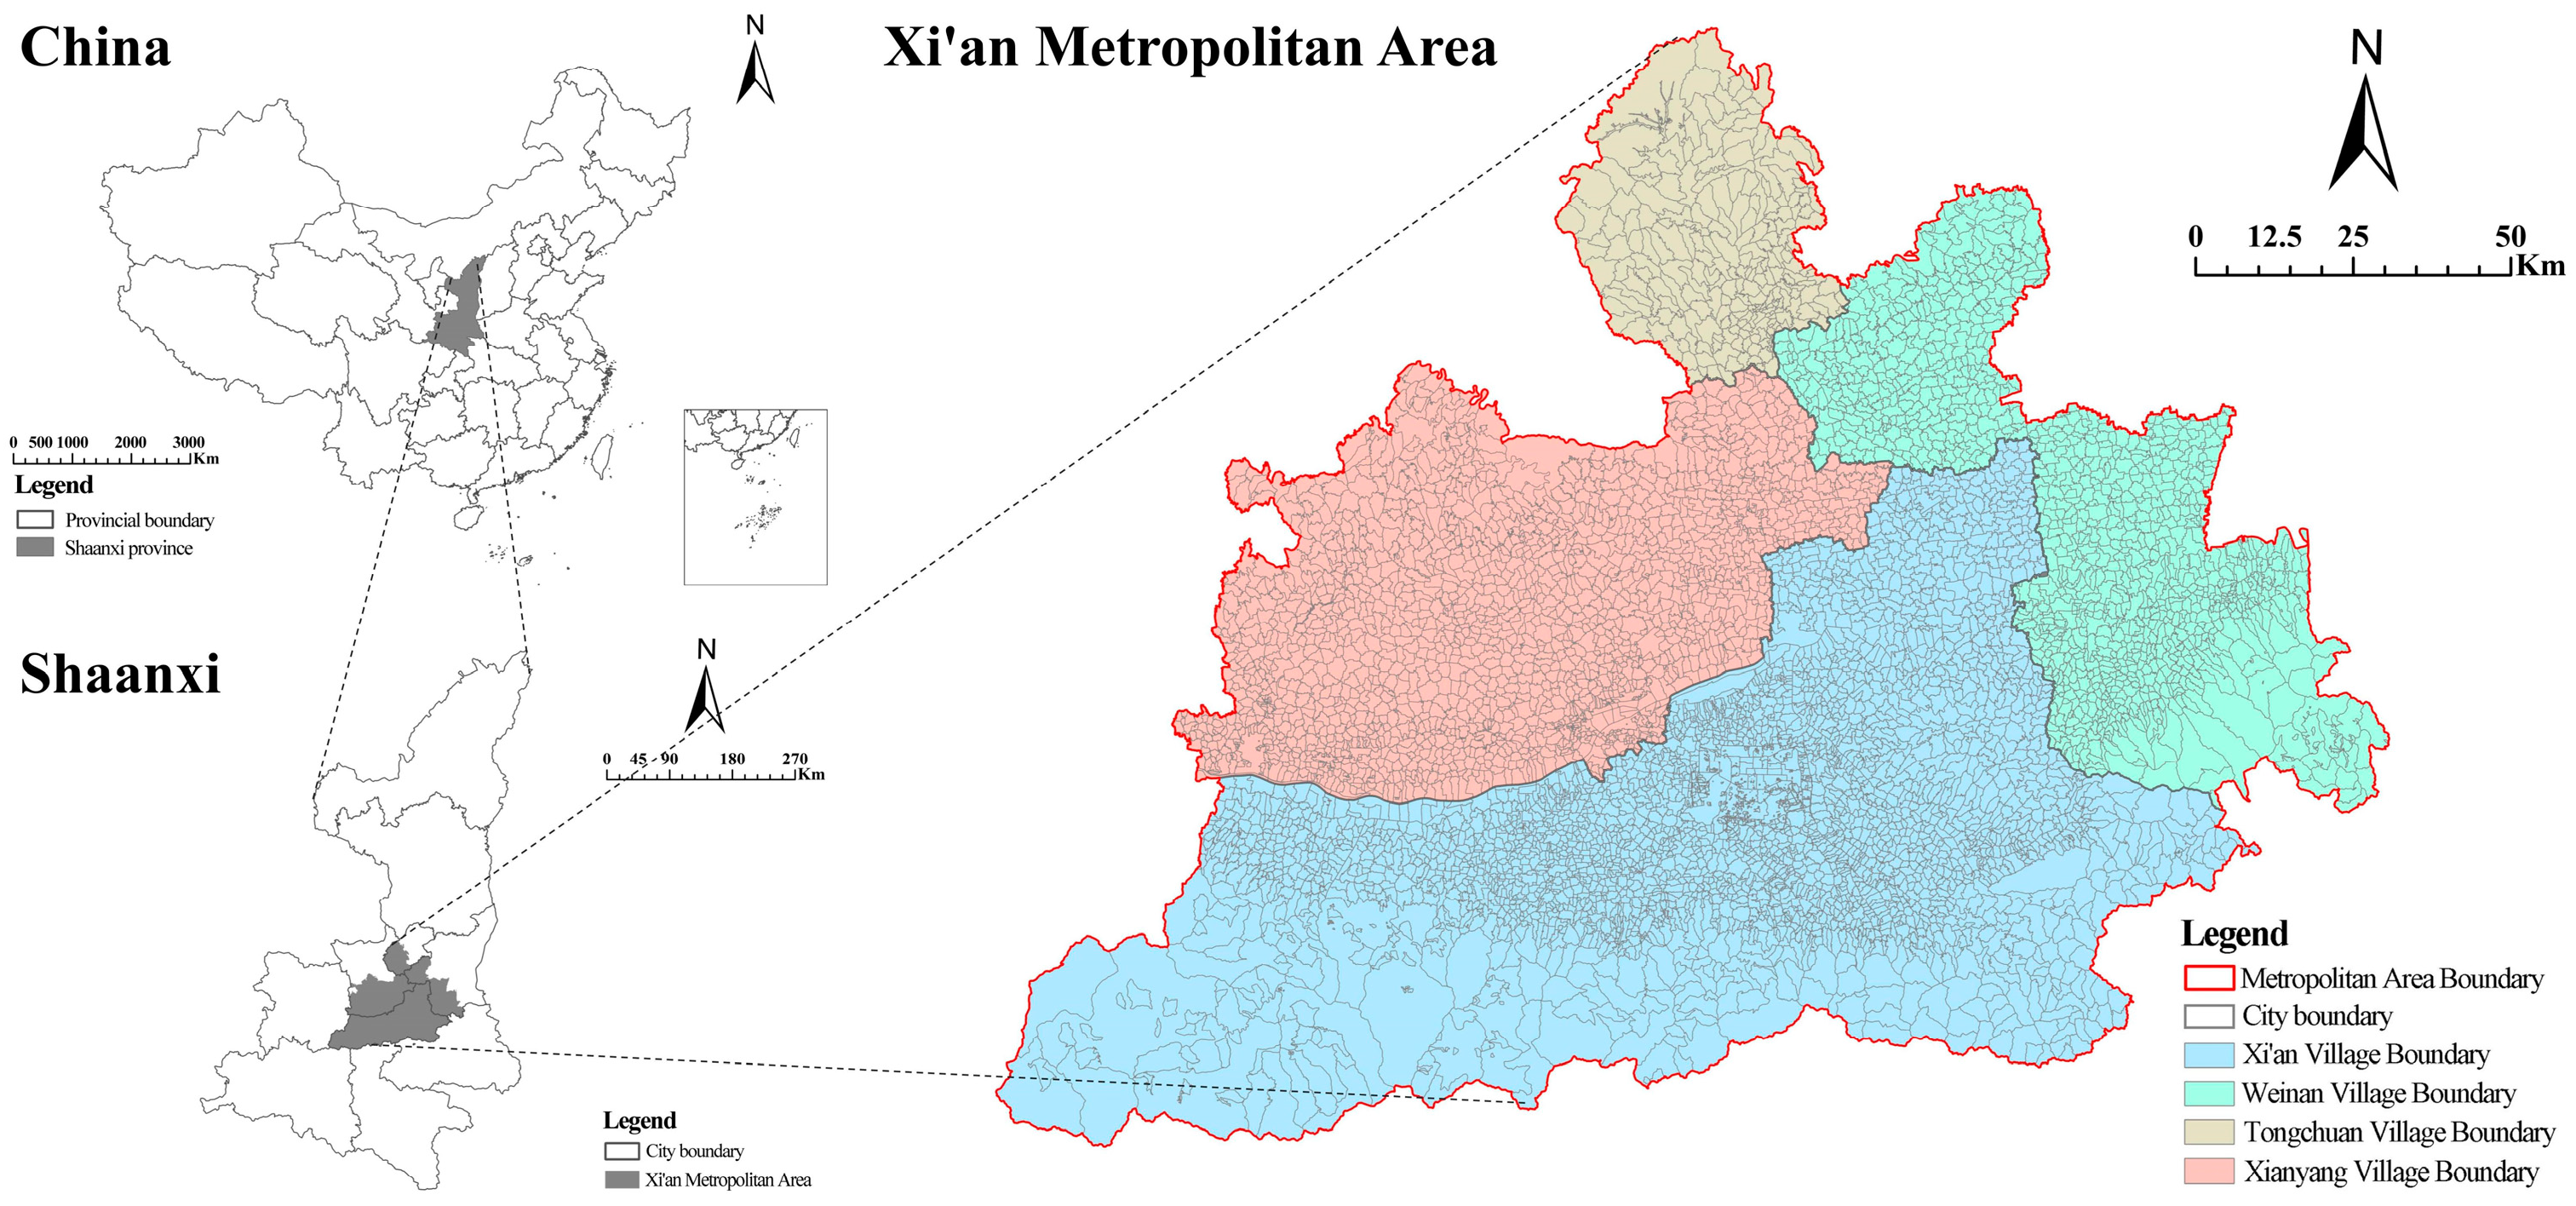
2.1. Study Area

Rural areas within metropolitan regions or urban agglomerations are often simultaneously influenced by functional spillovers from multiple cities. As the core city of the Guanzhong Urban Agglomeration, Xi’an exerts its influence on rural areas beyond its municipal administrative boundaries, necessitating an analysis of urban–rural integration within a broader regional context. Therefore, this study established a research area based on the Xi’an Metropolitan Region, from which suitable villages were selected for analysis. This region encompasses parts of Tongchuan to the north, Weinan to the northeast, and Xianyang to the northwest, spanning four prefecture-level cities (Figure 1).
Within this defined scope, selecting villages potentially exhibiting urban–rural integration characteristics surrounding Xi’an was conducted based on established methodologies. The urban–rural gradient division method proposed by Li Ruipeng et al. [28] and the population density threshold approach developed by Zhou Xiaochi et al. [29] were employed as primary references. Villages with impervious surface coverage ranging from 8% to 60% were categorized as peri-urban villages (Figure 2a). These areas were subsequently overlaid with regions exhibiting population densities between 1000 and 5000 persons/km2 (Figure 2b). The preliminary selection was further refined through spatial optimization, incorporating considerations of population distribution patterns (Figure 2c) and arable land configurations (Figure 2d), while maintaining the principle of spatial continuity. This methodological process identified 3804 villages within the Xi’an Metropolitan Region as the final study samples (Figure 2e).

2.2. Data Collection and Pre-Processing

The data employed in this study were primarily categorized into three domains: socio-economic indicators, land use and built environment, and topographic features. For socio-economic analysis, Point of Interest (POI) data from 2012 to 2022 were acquired from Baidu Maps (https://map.baidu.com/) and Amap (https://ditu.amap.com), with particular emphasis on the scale and growth patterns of enterprises, healthcare facilities, and public infrastructure. Night-time light data were obtained from Chen et al.’s continuous time-series dataset of Chinese regions from 1992 to 2023, derived through DMSP-OLS and SNPP-VIIRS algorithms [30], which effectively captured the temporal variations in night-time illumination. GDP data were sourced from Zhao et al.’s predictive model that integrated night-time light time series and population imagery to estimate China’s GDP [31]. Electricity consumption data were derived from Chen’s high-resolution 1 km × 1 km grid data generated through spatial downscaling, providing insights into energy utilization patterns [32]. Age-specific population data were extracted from the 2020 Constrained Individual Countries dataset, developed by Bondarenko M et al., which offered global population estimates at the grid square level based on the Built-Settlement Growth Model, with detailed demographic breakdowns by gender and age groups. Additionally, mobile base station data were collected from OpenCelliD.
The foundational data were derived from multiple authoritative sources regarding land use and the built environment. The primary dataset included China’s first 1 m resolution national-scale land cover map, which was developed by Li et al. [33] through the integration of open-access remote sensing data. Additionally, the urban built-up area dataset for Chinese cities in 2020 established by Zhongchang Sun et al. [34] and the building vector data generated by Shi et al. [35] through a comprehensive large-scale mapping framework were incorporated. Furthermore, the road network data were obtained from the Open Street Map (OSM).
For topographic characterization, slope gradient and surface relief data were obtained from the European Space Agency. Ecological-related foundational data included the Normalized Difference Vegetation Index (NDVI) sourced from NASA Earth Data, along with the high-resolution, high-quality PM2.5 dataset for China (2000–2023) developed by Wei Jing et al. [36].
All fundamental data were aggregated and statistically analyzed at the village-level analytical unit. The data pre-processing was conducted using the min–max normalization method in ArcGIS Pro 3.0.1.

2.3. Measurements

Element flow is the foundation of URI. The flow space theory suggests that “flow space” refers to the location where various flow elements (such as people, capital, goods, information, and technology) exist and move, which, when mapped onto geographical space, forms a flow network composed of nodes such as cities, regions, and even countries [37,38]. From this perspective, URI is reflected as the spatiotemporal flow of elements that transforms the heterogeneous dual structure of urban and rural areas into a homogeneous unified structure, ultimately harmonizing economic, social, spatial, and ecological dimensions.
Guided by this theoretical foundation, this paper constructs an indicator system covering four dimensions: (i) economic integration is represented by night-time light index and electricity consumption to reflect economic vitality, GDP and the number of enterprises to measure economic strength, and the growth rate of the number of enterprises to indicate industrial development potential; (ii) social integration is analyzed through population size, aging rate, and the proportion of the labor force to understand population structure, and public service facilities’ equalization is reflected by the number of primary and secondary schools per thousand people, medical facilities and their growth, and infrastructure construction is shown through mobile base stations and public facilities; (iii) spatial integration emphasizes the territorial continuity between urban and rural areas, measured by the amount and growth rate of construction land, building density to assess spatial integration, and road network density to reflect the spatiotemporal “compression” effect; and (iv) ecological integration is assessed through slope and surface roughness to evaluate ecological foundations, with vegetation coverage and PM index reflecting environmental quality. The selection of indicators balances data availability with a combination of static and dynamic principles, aligning with the core aspects of flow space theory. The main considerations for our indicator selection are as follows:
(i)
Economic integration. Due to its high data accuracy, the night-time light index, a key indicator for economic activity intensity and spatial differences in urban–rural development, can capture informal economic activities and infrastructure distribution. The night-time light data are crucial for evaluating economic integration in data-scarce rural areas [39]. GDP reflects regional economic size, and the number of enterprises indicates industrial spatial agglomeration. Both are core indicators for assessing urban–rural economic integration [40].
(ii)
Social integration. Population indicators and labor force size are directly linked to social service needs, a significant factor in urban–rural social integration [41]. Indicators related to educational and healthcare facilities measure public service equalization, a prerequisite for narrowing the urban–rural welfare gap [42].
(iii)
Spatial integration. We chose the proportion and growth rate of construction land. Land use changes reflect spatial integration intensity and a high construction land growth rate signifies urban and rural land expansion demands [43].
(iv)
Ecological integration. The vegetation coverage index, acting as a proxy for ecosystem service provision, assesses the environmental condition of urban and rural systems [44].
Furthermore, the dynamic index selection spans from 2012 to 2022 for two main reasons. The first is data availability; socio-economic and geographic data have had reliable official sources since 2012. The second is policy continuity. The urban–rural integration strategy proposed at the 18th National Congress of the Communist Party of China in 2012, along with the 2014 National New-Type Urbanization Plan and the 2017 Rural Revitalization Strategy, forms a cohesive policy framework. These policies have driven long-term, in-depth urban–rural integration. The details of specific indicators of each dimension are in Table 1.

3. Methodology

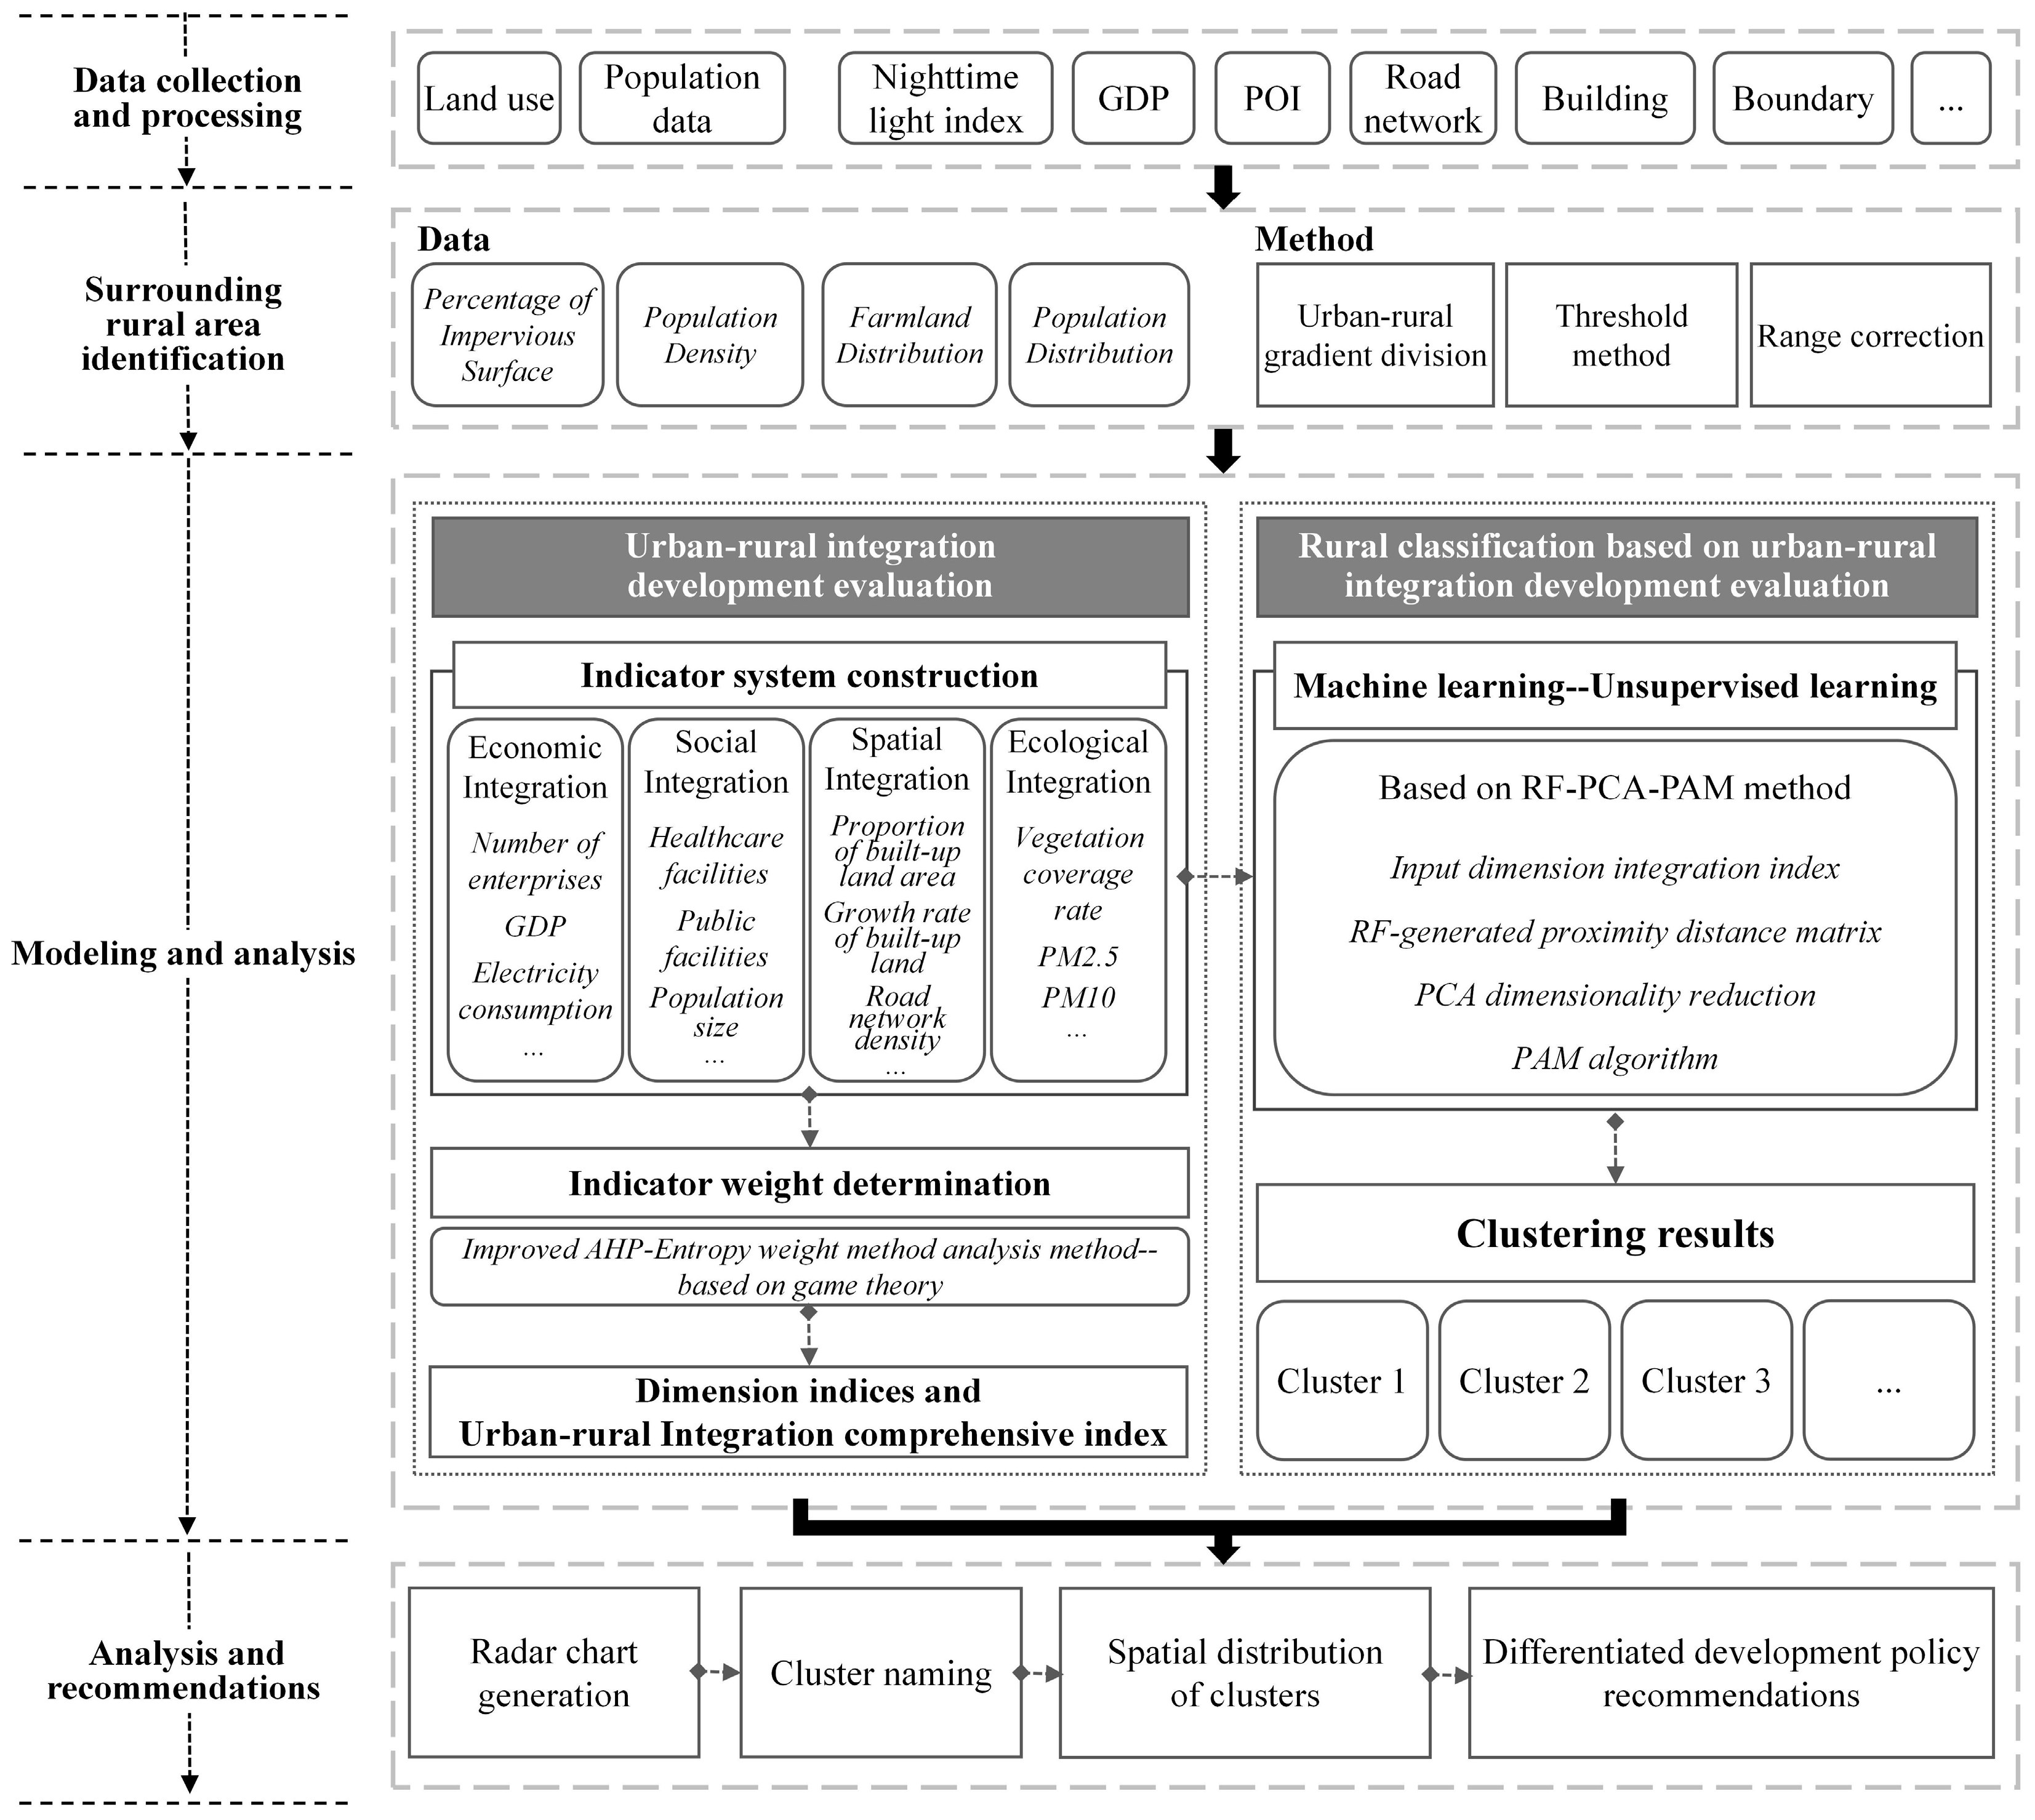
3.1. Study Framework

Figure 3 illustrates the research framework of this study, which primarily consists of four steps. First, we collected and pre-processed multi-source data as the basis for sample selection and indicator extraction. Next, we identified the villages included in this study through multi-layer overlay analysis. Then, based on relevant theories of URI (such as the theory of factor flow), we developed a URI development evaluation indicator system encompassing four dimensions: economy, society, space, and ecology. A combined weight method was employed to derive the comprehensive index of URI. Simultaneously, an enhanced algorithm combining random forest–principal component analysis–partitioning around medoids (RF-PCA-PAM) was used for village clustering calculations. Finally, based on the radar chart of the fractal URI index, we synthesized the clustering characteristics, identified rural types, and proposed differentiated development strategies and recommendations in conjunction with the spatial distribution characteristics of the clusters. All these analyses were conducted in R 4.2.3.

3.2. Study Method

3.2.1. Weighting Methods

(1)
Analytic Hierarchy Process (AHP)
AHP is a multi-criteria decision-making approach that involves creating a hierarchical model consisting of three levels: the goal, criterion, and solution [76]. The calculation process is outlined as follows:
  • Establish a weighted evaluation model based on evaluation indicators of urban–rural integration.
  • Construct a judgment matrix using the Saaty 1–9 scale method, represented as A = { A 1 , A 2 , , A n } .
  • Perform a consistency check on the judgment matrix.
  • Compute the subjective weight W 1 j for the j-th evaluation indicator.
I C = λ m x n n 1
I C R = I C I R
where n is the order of the matrix, λ m a x is the most significant or principal eigenvalue of the matrix. I C denotes the consistency index, an I C R is the randomized consistency test.
W 1 j = 1 n j = 1 n α j k k = 1 n α j k
where j = 1, 2, 3, …, n, and a j k represents the relative scale of indicator j to indicator k.
(2)
Entropy Weight Method (EWM)
The essence of entropy is the degree of internal chaos in a system [77]. The entropy method quantifies the uncertainty and variability of indicators by measuring the amount of information through information entropy [78]. The method removes the impact of human factors on subjective weight assignment and helps prevent information overlap among multiple indicators. The calculation process is outlined as follows:
  • Calculate of the share of village i under indicator j in the calculation of the indicator: in which i = 1 , 2 , , m , j = 1 , 2 , , n .
    Y i j = X i j i = 1 m X i j
  • Normalize the indicators.
    P i j = x i j i = 1 m x i j
  • Calculate the entropy e j of the j-th indicator based on the normalization matrix Y = ( y i j ) m : in which k = 1 ln ( m ) .
    e j = k i = 1 m P i j l n P i j
  • Calculate the j-th indicator’s entropy weight.
    W j = 1 e j j = 1 n ( 1 e j )
(3)
Composite Weighting Based on Game Theory
In order to obtain an optimal solution, this study applied game theory principles [79], treating subjective and objective weights as the two opposing parties in the game. The combination coefficients were derived by minimizing the total deviation between the final weights and the subjective and objective weights, resulting in comprehensive weights that balance the strengths of both subjective and objective aspects. The calculation process is outlined as follows:
  • Formulate a fundamental set of weight vectors.
By applying both subjective and objective weighting methods to m indicators, we obtain the weight set W = { ω 1 , ω 2 } . Subsequently, any linear combination of these two vectors can be represented as W :
W = a 1 ω 1 T + a 2 ω 2 T
where a 1 and a 2 denote the combination coefficients for the subjective and objective weights, respectively.
ii
Optimize a 1 and a 2 .
Optimize a 1 and a 2 to minimize the total deviation between the weight vector W and ω 1 , ω 2 .
m i n ( i = 1 2 j = 1 2 a j ω j T ω i T 2 )
Based on the properties of matrix differentiation, in order to satisfy the above equation, its first-order derivative must satisfy the following linear equation:
ω 1 ( ω 1 ) T ω 1 ( ω 2 ) T ω 2 ( ω 1 ) T ω 2 ( ω 2 ) T a 1 a 2 = ω 1 ( ω 1 ) T ω 2 ( ω 2 ) T
iii
Obtain the ultimate optimal combined weight vector, W .
W = i = 1 2 α i ω i T / j = 1 2 α j
(4)
Comprehensive index of URI
After obtaining the final weights from the game theory, normalized data were used to calculate the corresponding indices for URI development evaluation. These included the economic integration index E , social integration index S o , spatial integration index S p , and ecological integration index E c for each dimension. The calculation formulas are as follows:
E i = j = 1 n W j X i j
where E i is the economic integration index of the i -th village; W j and X i j represent the weight and normalized value of the j -th indicator and i -th village, and n is the number of villages. The calculation formulas for the social integration index S o , spatial integration index S p , and ecological integration index E c are the same. After obtaining the dimension indices, the comprehensive index U is calculated based on the corresponding weights:
U i = E i W E + S o i W S o + S p i W S p + E c i W E c

3.2.2. Enhanced Clustering Method

We employed an unsupervised random forest (RF) algorithm to obtain the proximity matrix between the computation samples, subsequently incorporating principal component analysis (PCA) to capture the intrinsic structure of the data. Finally, clustering analysis was conducted based on the dimensionality-reduced indices.
(1)
Random Forest and Adjacency Matrix
The random forest model, introduced by Breiman [80], is a machine learning algorithm that combines multiple classification trees to overcome the instability and overfitting issues typically associated with a single decision tree. The model is robust and has strong generalization capabilities, enabling it to handle many input features and data samples without easily overfitting [81]. It does not require assumptions about the data following a specific probability distribution or being generated from a particular model. Additionally, it demonstrates high interpretability and tolerance for data outliers and noise, effectively avoids multicollinearity issues, and can assess the importance of each feature, providing reliable predictive performance. The equation for the model is shown as follows:
i m i = 1 n t v S x i G a i n X i , v
The adjacency matrix is used in graph theory to represent a graph. The adjacency matrix represents the edges between nodes. The adjacency matrix is a square matrix whose elements indicate the connectivity between nodes in the graph. The adjacency matrix is as follows:
A = 0 1 0 1 0 1 0 1 0
(2)
Principal Component Analysis (PCA)
Principal component analysis (PCA) was initially introduced by Porter [82] and later independently developed by Hotelling [83]. A linear transformation technique creates a new dataset from the original one. The central concept behind PCA is to reduce the dimensionality of a dataset while preserving as much of the variability in the data as possible. The mathematical foundation of PCA is primarily based on the following steps:
  • Data Centering
    X ¯ = 1 n i = 1 n x i j , j = 1 , 2 , , d
    X c e n t e r e d = X X ¯
    where X ¯ is a mean vector, and where each column represents the mean of the corresponding feature.
  • Calculate the covariance matrix.
    C = 1 n 1 X c e n t e r e d T X c e n t e r e d
    where C R d × d is a symmetric matrix, and C i j represents the covariance between feature i and feature j .
  • Calculate the eigenvalues and eigenvectors of the covariance matrix.
      C v = λ v
    where v is the eigenvector of the covariance matrix, and λ is the corresponding eigenvalue.
  • Select the eigenvectors corresponding to the largest eigenvalues as the principal components.
(3)
Partitioning Around Medoid (PAM)
Partitioning around medoid clustering is a commonly used clustering algorithm in data analysis [84], developed by Kaufman and Rousseuw in 1987. The algorithm is based on the classical partitioning process of clustering. It initially selects k-medoids and then iteratively swaps the medoid with non-medoid objects, thereby improving the overall quality of the clusters [85]. The PAM algorithm is generally more robust than K-Means, particularly in the presence of noise or outliers. The PAM algorithm aims to partition the dataset into a pre-specified number of clusters, selecting each cluster’s most centrally located object as the cluster center. PAM clustering is primarily based on the following steps by Tagaram Soni Madhulatha [86]:
  • Select the initial cluster centers: randomly select some objects from the dataset as the initial representative objects for the clusters.
  • Assign data points to the nearest medoid: assign each remaining object to the cluster represented by the nearest centroid.
  • Update the cluster centers: check if other points can serve as the new medoid for each cluster.
  • Repeat steps until there is no change in the medoid.

4. Study Results

4.1. Comparison of Models’ Performance

Table 2 describes the models’ overall performance before and after RF and PCA’s introduction. It can be observed that after incorporating the proximity matrix generated by the unsupervised RF and adding PCA, Model 3 achieved a significant increase in the Silhouette Coefficient, reaching 0.305, indicating a relatively good clustering effect (a Silhouette Coefficient between 0.3 and 0.5 suggests acceptable clustering performance) [87]. Model 2 exhibited a negative Silhouette Coefficient, indicating poor clustering performance, with samples likely being assigned to incorrect clusters. Compared to Model 1, Model 3 has a larger Calinski–Harabasz Index, suggesting better separation between clusters, while the Davies–Bouldin Index is more minor, indicating a higher degree of compactness within clusters. Therefore, the overall results of Model 3 are more reliable.

4.2. Descriptive Statistics by RF-PAC-PAM Approach

From Table 3, it can be observed that the top 10 indicators, in order, are GDP, vegetation coverage rate, distribution of healthcare facilities, number of enterprises, number of public facilities, proportion of construction land area, number of enterprises, electricity consumption, number of primary and secondary schools per thousand people, and the number of mobile phone base stations, which reflect their significant impact on the degree of URI. According to the standard deviation data for each indicator, electricity consumption, population size, distribution of healthcare facilities, and GDP have more significant standard deviations, indicating a higher degree of dispersion, with significant differences between villages. Overall, the weights for the social, economic, ecological, and spatial integration indices decrease sequentially, at 0.3611, 0.2868, 0.2072, and 0.1449, respectively, indicating that their roles in the comprehensive URI degree decrease progressively.

4.3. Comprehensive and Dimensional URI Indices

Based on the combined weights analyzed in Section 4.2, further calculations and analysis of the URI degree of the sample villages were conducted. Figure 4 shows the spatial distribution of URI at each dimension and comprehensive level.
From a general perspective (Figure 4e), the spatial distribution of the comprehensive URI index shows a “high in the center, low in the east and west” pattern. Villages with the highest comprehensive indices are primarily located in the main urban area of Xi’an, the Gaoling District, and the built-up areas of Xianyang, as well as the central and northern parts of the Xi’an region. This reflects the close connections between these villages and Xi’an and Xianyang. In contrast, the integration levels of villages in the central areas of Weinan, Yangling, Fuping, Xingping, and Yanliang with surrounding villages are generally lower.
At the dimensional level, spatial integration (Figure 4c) and social integration (Figure 4b) generally show a pattern where the degree of integration increases the closer the area is to the core built-up areas of Xi’an and Xianyang. The spatial pattern of economic integration (Figure 4a) is similar to that of the comprehensive integration index, with the central region relatively higher than other areas, particularly Xi’an’s northern and central regions. Villages with higher ecological integration indices are mainly distributed in the west and northeast edges of the study area.

4.4. Clustering Distribution and Definition

4.4.1. Spatial Distribution of Clusters

We applied the RF-PCA-PAM method to obtain four clusters, with the orange (cluster 1), green (cluster 2), blue (cluster 3), and red (cluster 4) clusters containing 2093, 846, 603, and 262 villages. The spatial distribution of the clustering results is shown in Figure 5. The results reveal a typified layer structure that expands outward from the core urban areas of Xi’an and Xianyang. Additionally, urban and rural areas exhibit a continuous integration pattern in the east–west direction, demonstrating a particular integration axis. Specifically:
  • In terms of the layer structure, the villages located in the central area belong to the comprehensive integration type (red cluster), mainly distributed between the main urban area of Xi’an City, the Gaoling District, and the built-up areas of Xianyang City, influenced by the radiative impact of urban functions. Surrounding the red cluster are villages with relatively good ecological–social–spatial integration (blue cluster); these villages are located near the main urban areas of Xi’an City, Xianyang City, and the Gaoling District, with favorable location conditions and frequent cultural, population, and material exchanges with cities. The third layer consists of villages with better ecological–economic integration (orange cluster), located on the outskirts of the main urban area, near county-level urban areas, and concentrated in regions surrounding the main urban area of Xi’an, such as the areas between Xingpin City, the Yanliang District, and Weinan City. The outermost layer comprises villages relatively far from the urban built-up areas, concentrated in the east and west, belonging to the green cluster.
  • Along the east–west axis, the cluster of villages in the eastern yellow region has a larger contiguous area and a higher level of integration, closely linking Weinan City, Fuping County, the Yanliang District, and the central urban areas of Xi’an and Xianyang Cities. In contrast, the villages around the western areas of the Yangling District and Xingping City have lower degrees of contiguous clustering.
  • Except for the main urban areas of Xi’an, Gaoling, and the built-up areas of Xianyang City, the degree of social and spatial integration between other urban core areas and surrounding villages is relatively low.
  • Villages of the red and blue types show a few cases that are not adjacent to the main urban areas of Xi’an, the Gaoling District, and Xianyang City, indicating that these villages, while somewhat distant from the core urban areas, still maintain strong economic, social, or spatial connections.

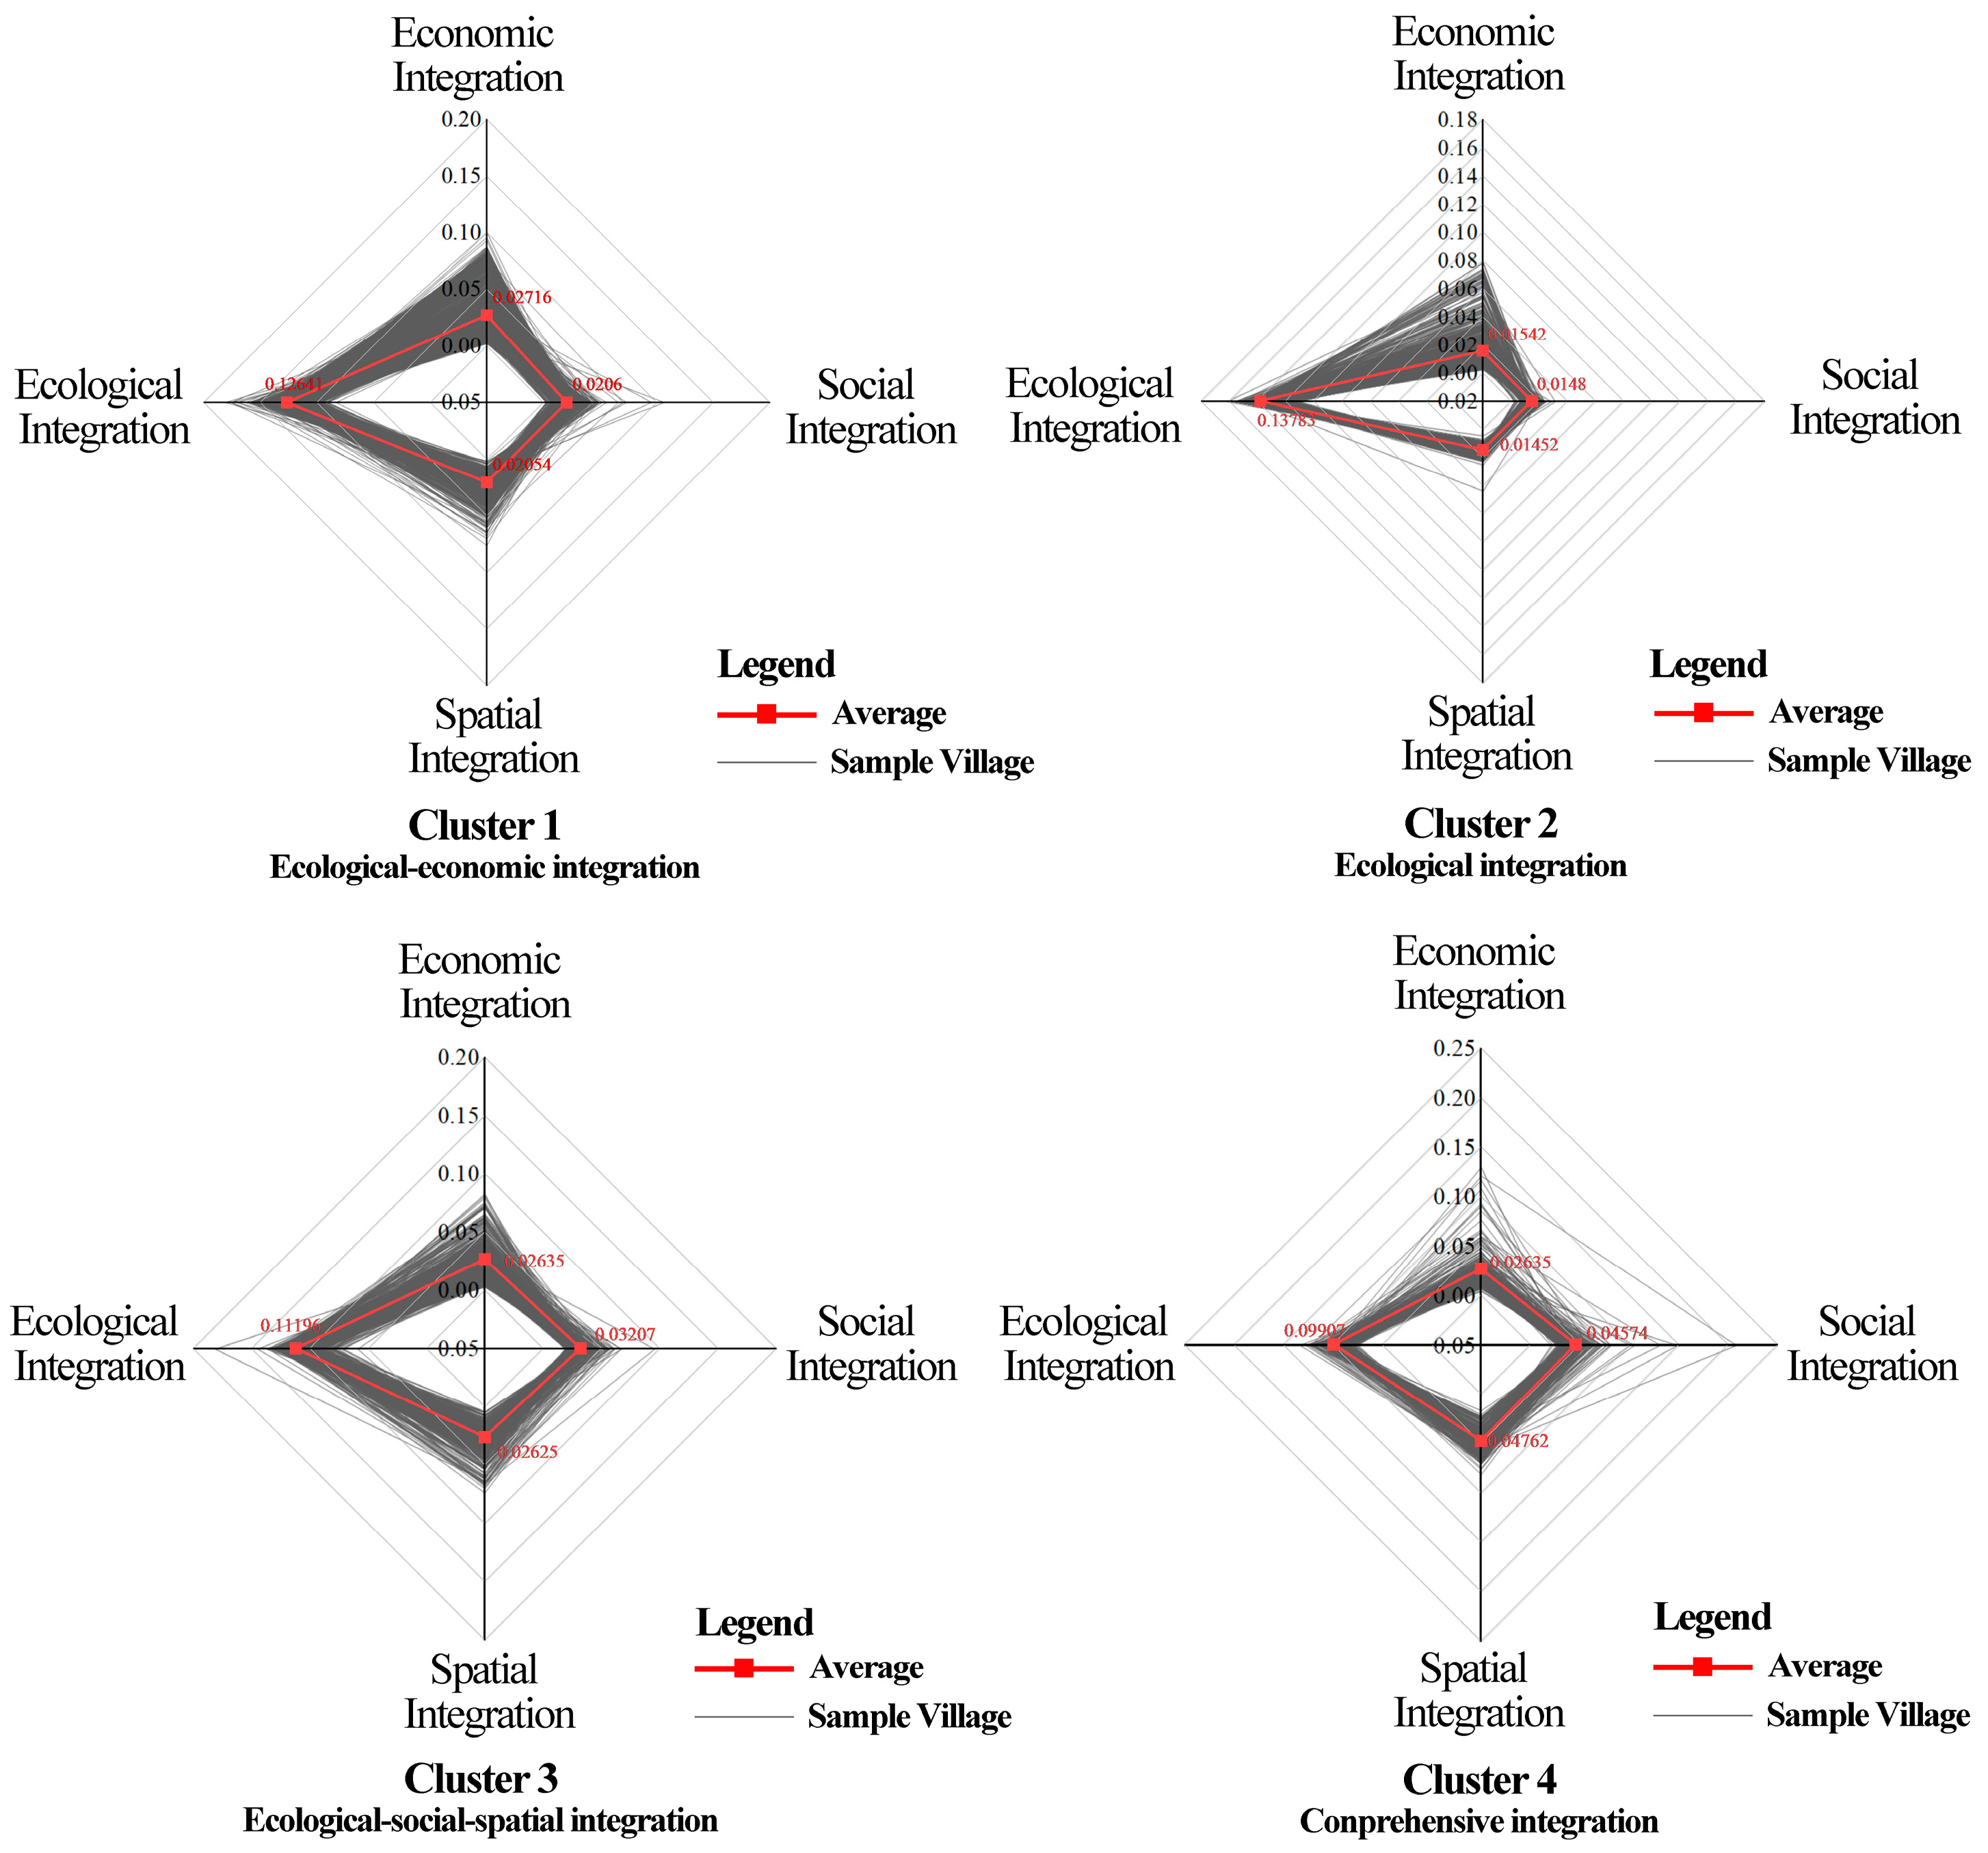
4.4.2. Characteristics and Definition of Clusters

We further plotted radar charts based on the integration indices of each cluster in different dimensions, using the mean values to represent the overall characteristics and to define the clusters. From Figure 6, we can observe the following: (i) all clusters performed well in ecological integration, indicating that most villages have likely established good collaborative relationships with cities in terms of ecological protection and utilization; (ii) compared to clusters 2 and 3, cluster 1 shows better performance in the economic dimension, with an average integration index 0.0117 and 0.0008 higher than those of clusters 2 and 3; (iii) cluster 3 has higher social and spatial integration indices than both clusters 1 and 2; and (iv) all integration indices for cluster 4 are at a high level, with the spatial integration and social integration indices ranking first, and the economic integration index ranking second.
Based on the characteristics observed in the above radar chart, we define the four clusters as follows: ecological–economic integration type (cluster 1, orange), ecological integration type (cluster 2, green), ecological–social–spatial integration type (cluster 3, blue), and comprehensive integration type (cluster 4, red).

5. Discussion and Conclusions

Our research considers the inherent characteristics of rural areas and incorporates representative indicators of interaction and communication between urban and rural areas, establishing a comprehensive integration index evaluation system of peri-urban villages. Based on this framework, we employed an improved machine learning-enhanced classification algorithm for village categorization and utilized radar charts of dimensional features to determine clustering implications. This approach reveals the spatial pattern characteristics of URI and guides the formulation of differentiated development strategies for villages. This study identified significant heterogeneity in the degree of URI and its spatial distribution among 3804 villages surrounding the Xi’an metropolitan area. It also determined key influencing factors that promote rural development under urban–rural integration.
The functional radiation brought by large cities often impacts neighboring villages in an overlapping and complex multi-dimensional manner, a phenomenon commonly observed in urban agglomeration areas or urban corridors. The Growth Pole Theory posits that cities (growth poles) exert polarization and diffusion effects on surrounding villages [91], indicating that the relationship between urban and rural areas results from a composite network of mutual influences. From a performance theory perspective, these interactions dynamically shape rural socio-economic outputs. When policies align with local conditions, urban spillovers can boost rural industrial efficiency and labor allocation [92]. Consequently, the varying impacts of different cities in proximity may transcend administrative boundaries. Considering this characteristic, this study focuses on the Xi’an Metropolitan Region and incorporates the “urban-rural gradient” method to identify the villages included in the analysis. Unlike previous studies that classified villages based solely on singular administrative divisions [13,27,67], our empirical analysis conducted in Xi’an aligns more closely with objective realities, making the analytical results potentially more reliable.
Ecological conservation, industrial development, and infrastructure enhancement are crucial in promoting rural–urban integration by facilitating the flow of capital and population during rural revitalization. Firstly, ecological foundations constitute the fundamental basis for rural sustainability [93], while economic industries drive continuous rural development [94]. As emphasized by China’s “Two Mountains Theory”, “lucid waters and lush mountains are invaluable assets”. Peri-urban rural areas can actively develop ecological industries, such as eco-technological agriculture, green farming, and leisure tourism, with dynamic monitoring through indicators including the number of rural green enterprises and their growth rates and rural green vegetation coverage. Secondly, improving rural physical spatial environments is essential for enhancing living quality and supporting industrial development. Providing more industrial land and relevant preferential policies facilitates the attraction of urban enterprises, thereby promoting township industrial development [95,96,97]. Simultaneously, more pleasant rural living environments and comprehensive service facilities provide fundamental guarantees for people returning to rural areas for employment and residence [98]. These improvements also have the potential to attract potential urban populations, injecting new vitality into rural spatial revitalization [99,100,101].
This study found that villages in the central area of the Xi’an Metropolitan Region exhibit significantly higher levels of URI compared to those in the eastern and western parts of the region. The spatial structural characteristics are closely related to the urban system pattern of the metropolitan region. Xi’an and Xianyang, two major cities, have much larger scales and capacities than other towns; they are located centrally and considerably drive the development of surrounding rural areas. For example, villages between the two cities have formed a “near-airport and cultural-tourism” composite economic corridor, contributing to an annual output value growth of over 15% in 21 surrounding villages [102]. Villages with higher levels of social and spatial integration also tend to be closer to the city center, reflecting the frequent flow and interaction of urban and rural populations and the higher demand for better living standards among villagers. The increasing demand of urban residents for proximity to nature has made suburban tourism a vital means of relaxation and recreation [103]. Tourism-centered industry chain development has become essential for transforming peri-urban villages [104,105]. In contrast, economic integration does not require proximity to large metropolitan areas as much as the social and spatial dimensions. This may be related to Xi’an’s highly developed transportation infrastructure [106], the large-scale land demand for major economic industries, such as high-end manufacturing [107], and the attributes of external markets [108].
We found that rural clusters exhibit a general spatial pattern characterized by a central core centered around Xi’an and Xianyang, with a gradient diffusion effect. Similar rural spatial structure patterns have been found in Paris [109] and around central cities in Sweden [6]. The rural areas between the main urban area of Xi’an, Xianyang, and the Gaoling District of Xi’an displayed a multi-dimensional integrated state of economic, social, spatial, and ecological fusion. Critical infrastructure, such as Xianyang International Airport, and strategic policies, such as the national-level development zone, Xixian New Area, provide opportunities for the deep integration of urban and rural development in this region. The interaction and integration of capital, people, materials, and technology between urban and rural areas have fostered the vigorous development of rural areas [110], making this region a supporting rural hinterland for Xi’an’s “northward expansion” development [111]. An ecological–social–spatial integration type primarily characterized other villages adjacent to the main urban built-up areas. These areas were often more significantly impacted by urban disturbances [112], with intense changes in population mobility, rural space, and social network relationships [113,114]. Further outwards, there are rural areas with an ecological–economic integration type. These areas exhibited distinct contiguous patterns in the east–west direction, with the contiguous area in the eastern region being larger than that in the western region. The economic integration in these areas is also quite prominent, which may be related to the more developed township economies, the differentiated functional division between towns, and the spillover effects of coordinated development [115,116]. Some scholars have also observed varying degrees of integration and differentiation in the rural areas surrounding Wuhan [2,67,112]. However, the spatial distribution pattern they found differs from the results of this study, as it does not exhibit a concentric structure [67]. An interesting finding is that a few integrated rural areas show a “satellite” distribution, where they are spatially located at a certain distance from the built-up areas of large cities. The digital development of rural areas [117] and the growth in the number and quality of specialized enterprises [118] may have diminished the absolute importance of geographical location. For example, Huangliang Village has become a well-known “internet celebrity village” and art village based on its unique cultural development. It actively fosters and develops new rural industries, establishing a close market and leisure cultural experience with Xi’an.
Furthermore, we provide a practical evaluation framework and methodology to support the formulation of differentiated rural development policies. By systematically reviewing and summarizing the relevant literature on URI, we identified integration evaluation indicators from the perspective of rural development, attempting to construct an indicator system more suitable for classifying villages around metropolitan areas, which provides the foundation for the assessment. Then, we applied the RF-PCA-PAM combination for clustering analysis, which improves dimensionality reduction accuracy [119] and reduces data noise [120]. Our study found that the combined model outperforms the PAM and PCA-PAM models, contributing to more reliable evaluation results.
Based on the findings, we propose rural development policy suggestions to promote URI: (i) emphasize the current heterogeneity of URI, adopt differentiated development strategies by classification and region, and increase focus on rural areas with insufficient integration; (ii) focus on ecological environment protection, economic industries, local public service infrastructure, and construction land supply as key factors in promoting URI; and (iii) leverage non-traditional factors, such as rural e-commerce, to reduce the dominance of geographical location and enhance URI.
However, this study still has some limitations. First, the evaluation framework and methodology developed in this study were applied to the Xi’an Metropolitan Region, but further empirical analysis is needed to verify and obtain more universal research conclusions. Second, our study used a restricted set of dynamic indicators due to data availability limitations. Future research could reasonably incorporate more dynamic indicators to better reflect the changes urban–rural integration brought to rural areas. Third, due to the limitation of the applicability of PAM in extensive sample analysis [121], the research method in this study needs to be further developed. Additionally, some machine learning algorithms, such as extreme gradient boosting (XGBoost), have advantages in avoiding overfitting and improving analytical precision [122] and may be more suitable for classification based on semi-supervised learning.
Overall, previous research has rarely focused on the differences in types between peri-urban and hinterland villages. Our classification of village types from the perspective of URI is an innovative research exploration. The rural evaluation indicators and methods based on URI established in this study and the empirical results from the Xi’an Metropolitan Region provide valuable experience for the differentiated development of villages in surrounding urban areas, offering a positive reference for achieving rural revitalization.

Author Contributions

Conceptualization, X.J., Z.L. and D.Y.; methodology, J.S. and Q.L.; software, Q.L. and J.S.; formal analysis, J.S., Y.M. and W.Q.; resources and data curation, J.S., Q.L. and T.Z.; writing—original draft preparation, X.J., J.S. and T.Z.; writing—review and editing, X.J. and D.Y.; visualization, J.S. and T.Z.; supervision, D.Y. and Z.L.; funding acquisition, Z.L. All authors have read and agreed to the published version of the manuscript.

Funding

This research was funded by National Key R&D Program of China (grant number 2022YFC3802801), Xi’an University of Architecture and Technology Talent Research Initiation Project (grant number 1960324011), and Youth Observation Programme on New Urbanization (grant number 2024GCJH34).

Data Availability Statement

The original contributions presented in the study are included in the article; further inquiries can be directed to the corresponding author.

Conflicts of Interest

The authors declare no conflicts of interest.

References

  1. Tacoli, C. The links between urban and rural development. Environ. Urban. 2003, 15, 3–12. [Google Scholar] [CrossRef]
  2. Zheng, Y.; Tan, J.; Huang, Y.; Wang, Z. The governance path of urban–rural integration in changing urban–rural relationships in the metropolitan area: A case study of Wuhan, China. Land 2022, 11, 1334. [Google Scholar] [CrossRef]
  3. Mili, S. Logical evolution of Marxist thought of urban-rural integration and development. MFSSR 2019, 2019, 959–963. [Google Scholar]
  4. Meardon, S.J. Modeling agglomeration and dispersion in city and country: Gunnar Myrdal, Francois Perroux, and the New Economic Geography. Am. J. Econ. Sociol. 2001, 60, 25–57. [Google Scholar] [CrossRef]
  5. Harrison, J.; Heley, J. Governing beyond the metropolis: Placing the rural in city-region development. Urban Stud. 2015, 52, 1113–1133. [Google Scholar] [CrossRef]
  6. Hedlund, M. Mapping the Socio-economic Landscape of Rural Sweden: Towards a Typology of Rural Areas. Reg. Stud. 2016, 50, 460–474. [Google Scholar] [CrossRef]
  7. Davoudi, S.; Stead, D. Urban-rural relationships: An introduction and brief history. Built Environ. 2002, 28, 269–277. [Google Scholar]
  8. Natsuda, K.; Igusa, K.; Wiboonpongse, A.; Thoburn, J. One Village One Product–rural development strategy in Asia: The case of OTOP in Thailand. CJDS 2012, 33, 369–385. [Google Scholar] [CrossRef]
  9. Yin, Z.H.; Choi, C.H. Does e-commerce narrow the urban–rural income gap? Evidence from Chinese provinces. Internet Res. 2022, 32, 1427–1452. [Google Scholar] [CrossRef]
  10. Zhang, X.; Fang, C.; Ma, H.; Hu, X. How does digital economy affect urban-rural integration? An empirical study from China. Habitat Int. 2024, 154, 103229. [Google Scholar] [CrossRef]
  11. Boudet, F.; MacDonald, G.K.; Robinson, B.E.; Samberg, L.H. Rural-urban connectivity and agricultural land management across the Global South. Glob. Environ. Change 2020, 60, 101982. [Google Scholar] [CrossRef]
  12. Pan, Y.; Zhao, X.; Zhang, Y.; Luo, H. A large-scale village classification model for tailored rural revitalization: A case study of Hubei province, China. J. Geogr. Sci. 2024, 34, 2364–2392. [Google Scholar] [CrossRef]
  13. Wang, Y.; Cao, X. Village evaluation and classification guidance of a county in southeast Gansu based on the rural revitalization strategy. Land 2022, 11, 857. [Google Scholar] [CrossRef]
  14. Zhou, Y.; Yao, Y.; Chu, Z.; Lei, Z.; Zheng, Y. A New Approach to Rural Classification Based on the Filter-Method System: An Empirical Study in Nanning, South China. Sustainability 2024, 16, 10052. [Google Scholar] [CrossRef]
  15. Wu, Q.; Xue, W. Research Progress of Rural Classification in Europe and Its Enlightenment to China. Urban Plan. Int. 2024, 39, 50–57. [Google Scholar]
  16. van den Berg, L.; Wintjes, A. New ‘rural lifestyle estates’ in The Netherlands. Landsc. Urban Plan. 2000, 48, 169–176. [Google Scholar] [CrossRef]
  17. Dadashpoor, H.; Ahani, S. A conceptual typology of the spatial territories of the peripheral areas of metropolises. Habitat Int. 2019, 90, 102015. [Google Scholar] [CrossRef]
  18. Ji, D.; Tian, J.; Zhang, J.; Zeng, J.; Namaiti, A. Identification and Spatiotemporal Evolution Analysis of the Urban–Rural Fringe in Polycentric Cities Based on K-Means Clustering and Multi-Source Data: A Case Study of Chengdu City. Land 2024, 13, 1727. [Google Scholar] [CrossRef]
  19. Ren, K. Following Rural Functions to Classify Rural Sites: An Application in Jixi, Anhui Province, China. Land 2021, 10, 418. [Google Scholar] [CrossRef]
  20. Zou, L.; Liu, Y.; Yang, J.; Yang, S.; Wang, Y.; Hu, X. Quantitative identification and spatial analysis of land use ecological-production-living functions in rural areas on China’s southeast coast. Habitat Int. 2020, 100, 102182. [Google Scholar] [CrossRef]
  21. Bai, B.; Chen, F.; Zhou, G. Functions of village classification based on POI data and social practice in rural revitalization. Arab. J. Geosci. 2021, 14, 1690. [Google Scholar] [CrossRef]
  22. Guo, X.D.; Ma, L.; Zhang, Q. The spatial distribution characteristics and the basic types of rural settlement in loess hilly area: Taking Qin’an county of Gansu province as a case. Sci. Geogr. Sin. 2013, 33, 45–51. [Google Scholar]
  23. Bibby, P.; Brindley, P. The 2011 Rural-Urban Classification for Small Area Geographies: A User Guide and Frequently Asked Questions; v1. 0; Office for National Statistics: Newport, RI, USA, 2013. [Google Scholar]
  24. Dai, L.; Qiao, W.; Feng, T.; Li, Y. Research on Village Type Identification and Development Strategy under the Background of Rural Revitalization: A Case of Gaochun District in Nanjing, China. Int. J. Environ. Res. Public Health 2022, 19, 6854. [Google Scholar] [CrossRef] [PubMed]
  25. Gajić, A.; Krunić, N.; Protić, B. Classification of rural areas in Serbia: Framework and implications for spatial planning. Sustainability 2021, 13, 1596. [Google Scholar] [CrossRef]
  26. Li, Z.; Miao, X.; Wang, M.; Jiang, S.; Wang, Y. The classification and regulation of mountain villages in the context of rural revitalization—The example of Zhaotong, Yunnan Province. Sustainability 2022, 14, 11381. [Google Scholar] [CrossRef]
  27. Wang, J.; Wang, Y.; Lin, G. Study on Rural Classification and Resilience Evaluation Based on PSR Model: A Case Study of Lvshunkou District, Dalian City, China. Sustainability 2024, 16, 6708. [Google Scholar] [CrossRef]
  28. Li, R.; Xu, Q.; Yu, J.; Chen, L.; Peng, Y. Multiscale assessment of the spatiotemporal coupling relationship between urbanization and ecosystem service value along an urban–rural gradient: A case study of the Yangtze River Delta urban agglomeration, China. Ecol. Indic. 2024, 160, 111864. [Google Scholar] [CrossRef]
  29. Xiaochi, Z.; Yongmei, L.; Haijuan, Y. Spatial Recognition and Boundary Region Division of Urban Fringe Area in Xi’an City. J. Geo-Inf. Sci. 2017, 19, 1327–1335. [Google Scholar]
  30. Chen, Z.; Yu, B.; Yang, C.; Zhou, Y.; Qian, X.; Wang, C.; Wu, B.; Wu, J. An extended time-series (2000–2018) of global NPP-VIIRS-like night-time light data from a cross-sensor calibration. Earth Syst. Sci. Data Discuss. 2020, 13, 889–906. [Google Scholar] [CrossRef]
  31. Zhao, N.; Liu, Y.; Cao, G.; Samson, E.L.; Zhang, J. Forecasting China’s GDP at the pixel level using night-time lights time series and population images. GIScience Remote Sens. 2017, 54, 407–425. [Google Scholar] [CrossRef]
  32. Chen, J.; Gao, M.; Cheng, S.; Hou, W.; Song, M.; Liu, X.; Liu, Y. Global 1 km × 1 km gridded revised real gross domestic product and electricity consumption during 1992–2019 based on calibrated night-time light data. Sci. Data 2022, 9, 202. [Google Scholar] [CrossRef] [PubMed]
  33. Li, Z.; He, W.; Cheng, M.; Hu, J.; Yang, G.; Zhang, H. SinoLC-1: The first 1-meter resolution national-scale land-cover map of China created with the deep learning framework and open-access data. Earth Syst. Sci. Data Discuss. 2023, 15, 4749–4780. [Google Scholar] [CrossRef]
  34. Sun, J.; Sun, Z.; Guo, H.; Wang, J.; Jiang, H.; Gao, J. A dataset of built-up areas of Chinese cities in 2020. China Sci. Data 2022, 7, 190–204. [Google Scholar] [CrossRef]
  35. Shi, Q.; Zhu, J.; Liu, Z.; Guo, H.; Liu, M.; Liu, Z.; Liu, X. A First High-Quality Vector Data of Buildings in East Asian Countries Based on a Comprehensive Large-Scale Mapping Framework [Data set]. Zenodo 2023. [Google Scholar] [CrossRef]
  36. Wei, J.; Li, Z.; Lyapustin, A.; Sun, L.; Peng, Y.; Xue, W.; Su, T.; Cribb, M. Reconstructing 1-km-resolution high-quality PM2. 5 data records from 2000 to 2018 in China: Spatiotemporal variations and policy implications. Remote Sens. Environ. 2021, 252, 112136. [Google Scholar] [CrossRef]
  37. Meijers, E. From central place to network model: Theory and evidence of a paradigm change. Tijdschr. Voor Econ. En Soc. Geogr. 2007, 98, 245–259. [Google Scholar] [CrossRef]
  38. Taylor, P.; Derudder, B. World city network: A global urban analysis. Int. Soc. Sci. J. 2007, 31, 641–642. [Google Scholar]
  39. Huang, S.; Yu, L.; Cai, D.; Zhu, J.; Liu, Z.; Zhang, Z.; Nie, Y.; Fraedrich, K. Driving mechanisms of urbanization: Evidence from geographical, climatic, social-economic and night-time light data. Ecol. Indic. 2023, 148, 110046. [Google Scholar] [CrossRef]
  40. Zhao, Y.; Li, J.; Liu, K.; Shang, C. Impact of urban-rural development and its industrial elements on regional economic growth: An analysis based on provincial panel data in China. Heliyon 2024, 10, e36221. [Google Scholar] [CrossRef]
  41. Yang, Y.; Bao, W.; Wang, Y.; Liu, Y. Measurement of urban-rural integration level and its spatial differentiation in China in the new century. Habitat Int. 2021, 117, 102420. [Google Scholar] [CrossRef]
  42. Xu, J.; Zeng, Z.; Xi, Z.; Peng, Z.; Chen, G.; Zhu, X.; Chen, X. Research on Sustainable Urban–Rural Integration Development: Measuring Levels, Influencing Factors, and Exploring Driving Mechanisms—Taking Eight Cities in the Greater Bay Area as Examples. Sustainability 2024, 16, 3357. [Google Scholar] [CrossRef]
  43. Yang, Z.; Shen, N.; Qu, Y.; Zhang, B. Association between Rural Land Use Transition and Urban–Rural Integration Development: From 2009 to 2018 Based on County-Level Data in Shandong Province, China. Land 2021, 10, 1228. [Google Scholar] [CrossRef]
  44. Peng, L.; Zhang, L.; Li, X.; Wang, P.; Zhao, W.; Wang, Z.; Jiao, L.; Wang, H. Spatio-temporal patterns of ecosystem services provided by urban green spaces and their equity along urban–rural gradients in the Xi’an Metropolitan Area, China. Remote Sens. 2022, 14, 4299. [Google Scholar] [CrossRef]
  45. Wang, L.; Wang, S.; Zhou, Y.; Liu, W.; Hou, Y.; Zhu, J.; Wang, F. Mapping population density in China between 1990 and 2010 using remote sensing. Remote Sens. Environ. 2018, 210, 269–281. [Google Scholar] [CrossRef]
  46. Xia, C.; Yeh, A.G.-O.; Zhang, A. Analyzing spatial relationships between urban land use intensity and urban vitality at street block level: A case study of five Chinese megacities. Landsc. Urban Plan. 2020, 193, 103669. [Google Scholar] [CrossRef]
  47. Zhang, C.; Zhou, K.; Yang, S.; Shao, Z. On electricity consumption and economic growth in China. Renew. Sustain. Energy Rev. 2017, 76, 353–368. [Google Scholar] [CrossRef]
  48. Lin, V.S.; Qin, Y.; Ying, T.; Shen, S.; Lyu, G. Night-time economy vitality index: Framework and evidence. Tour. Econ. 2022, 28, 665–691. [Google Scholar] [CrossRef]
  49. Costanza, R.; Hart, M.; Talberth, J.; Posner, S. Beyond GDP: The need for new measures of progress. Pardee Pap. 2009, 4, 1–37. [Google Scholar]
  50. Dynan, K.; Sheiner, L. GDP as a Measure of Economic Well-Being. In The Measure of Economies; Marshall, B.R., Louise, S., Eds.; University of Chicago Press: Chicago, IL, USA, 2024; pp. 9–50. [Google Scholar]
  51. Taiwo, M.A.; Ayodeji, A.M.; Yusuf, B.A. Impact of small and medium enterprises on economic growth and development. Am. J. Bus. Manag. 2012, 1, 18–22. [Google Scholar] [CrossRef]
  52. Erdin, C.; Ozkaya, G. Contribution of small and medium enterprises to economic development and quality of life in Turkey. Heliyon 2020, 6, e03215. [Google Scholar] [CrossRef]
  53. Cyriac, S. Dichotomous classification and implications in spatial planning: A case of the Rural-Urban Continuum settlements of Kerala, India. Land Use Policy 2022, 114, 105992. [Google Scholar] [CrossRef]
  54. Hu, Z.; Li, Y.; Long, H.; Kang, C. The evolution of China’s rural depopulation pattern and its influencing factors from 2000 to 2020. Appl. Geogr. 2023, 159, 103089. [Google Scholar] [CrossRef]
  55. Keyes, C.L.M.; Ryff, C.D. Generativity in adult lives: Social structural contours and quality of life consequences. In Generativity and Adult Development: How and Why We Care for the Next Generation; American Psychological Association: Washington, DC, USA, 1998; pp. 227–263. [Google Scholar]
  56. Eckert, P. Age as a sociolinguistic variable. In The Handbook of Sociolinguistics; Wiley-Blackwell: Hoboken, NJ, USA, 2017; pp. 151–167. [Google Scholar]
  57. Granovetter, M. The sociological and economic approaches to labor market analysis: A social structural view. In Industries, Firms, and Jobs; Routledge: New York, NY, USA, 2017; pp. 187–216. [Google Scholar]
  58. Maestas, N.; Mullen, K.J.; Powell, D. The effect of population aging on economic growth, the labor force, and productivity. Am. Econ. J. Macroecon. 2023, 15, 306–332. [Google Scholar] [CrossRef]
  59. Capolongo, S.; Gola, M.; Di Noia, M.; Nickolova, M.; Nachiero, D.; Rebecchi, A.; Settimo, G.; Vittori, G.; Buffoli, M. Social sustainability in healthcare facilities: A rating tool for analysing and improving social aspects in environments of care. Ann. Dell’istituto Super. Sanita 2016, 52, 15–23. [Google Scholar]
  60. Sun, A.; Huang, Y.; Yang, L.; Huang, C.; Xiang, H. Assessment of the Impact of Basic Public Service Facility Configuration on Social–Spatial Differentiation: Taking the Zhaomushan District of Chongqing, China. Sustainability 2023, 16, 196. [Google Scholar] [CrossRef]
  61. Saini, M.; Sengupta, E.; Singh, M.; Singh, H.; Singh, J. Sustainable Development Goal for Quality Education (SDG 4): A study on SDG 4 to extract the pattern of association among the indicators of SDG 4 employing a genetic algorithm. Educ. Inf. Technol. 2023, 28, 2031–2069. [Google Scholar] [CrossRef]
  62. Cousin, M.-E.; Siegrist, M. The public’s knowledge of mobile communication and its influence on base station siting preferences. Health Risk Soc. 2010, 12, 231–250. [Google Scholar] [CrossRef]
  63. Wang, D.; Zhou, T.; Wang, M. Information and communication technology (ICT), digital divide and urbanization: Evidence from Chinese cities. Technol. Soc. 2021, 64, 101516. [Google Scholar] [CrossRef]
  64. Crouch, G.I.; Ritchie, J.B. Tourism, competitiveness, and societal prosperity. J. Bus. Res. 1999, 44, 137–152. [Google Scholar] [CrossRef]
  65. Niu, B.; Ge, D.; Sun, J.; Sun, D.; Ma, Y.; Ni, Y.; Lu, Y. Multi-scales urban-rural integrated development and land-use transition: The story of China. Habitat Int. 2023, 132, 102744. [Google Scholar] [CrossRef]
  66. Zhao, P.; Wan, J. Land use and travel burden of residents in urban fringe and rural areas: An evaluation of urban-rural integration initiatives in Beijing. Land Use Policy 2021, 103, 105309. [Google Scholar] [CrossRef]
  67. Tian, Y.; Qian, J.; Wang, L. Village classification in metropolitan suburbs from the perspective of urban-rural integration and improvement strategies: A case study of Wuhan, central China. Land Use Policy 2021, 111, 105748. [Google Scholar] [CrossRef]
  68. De Bellefon, M.-P.; Combes, P.-P.; Duranton, G.; Gobillon, L.; Gorin, C. Delineating urban areas using building density. J. Urban Econ. 2021, 125, 103226. [Google Scholar] [CrossRef]
  69. Surya, B.; Salim, A.; Hernita, H.; Suriani, S.; Menne, F.; Rasyidi, E.S. Land use change, urban agglomeration, and urban sprawl: A sustainable development perspective of Makassar City, Indonesia. Land 2021, 10, 556. [Google Scholar] [CrossRef]
  70. Wang, S.; Zhao, M.; Ding, W.; Yang, Q.; Li, H.; Shao, C.; Wang, B.; Liu, Y. Ecological Suitability Evaluation of City Construction Based on Landscape Ecological Analysis. Sustainability 2024, 16, 9178. [Google Scholar] [CrossRef]
  71. Jiang, Y.; Zhou, L.; Wang, B.; Zhang, Q.; Gao, H.; Wang, S.; Cui, M. The impact of gradient expansion of urban–rural construction land on landscape fragmentation in typical mountain cities, China. Int. J. Digit. Earth 2024, 17, 2310093. [Google Scholar] [CrossRef]
  72. Nie, T.; Dong, G.; Jiang, X.; Lei, Y. Spatio-temporal changes and driving forces of vegetation coverage on the loess plateau of Northern Shaanxi. Remote Sens. 2021, 13, 613. [Google Scholar] [CrossRef]
  73. Zhou, T.; Liu, H.; Gou, P.; Xu, N. Conflict or Coordination? measuring the relationships between urbanization and vegetation cover in China. Ecol. Indic. 2023, 147, 109993. [Google Scholar] [CrossRef]
  74. Chen, C.-W.; Tseng, Y.-S.; Mukundan, A.; Wang, H.-C. Air pollution: Sensitive detection of PM2. 5 and PM10 concentration using hyperspectral imaging. Appl. Sci. 2021, 11, 4543. [Google Scholar] [CrossRef]
  75. Xing, Q.; Sun, M. Characteristics of PM2. 5 and PM10 Spatio-Temporal Distribution and Influencing Meteorological Conditions in Beijing. Atmosphere 2022, 13, 1120. [Google Scholar] [CrossRef]
  76. Siva Bhaskar, A.; Khan, A. Comparative analysis of hybrid MCDM methods in material selection for dental applications. Expert Syst. Appl. 2022, 209, 118268. [Google Scholar] [CrossRef]
  77. Wei, L.R.; Zhao, X.J.; Lu, J.X. Measuring the Level of Urban-Rural Integration Development and Analyzing the Spatial Pattern Based on the New Development Concept: Evidence from Cities in the Yellow River Basin. Int. J. Environ. Res. Public Health 2023, 20, 15. [Google Scholar] [CrossRef] [PubMed]
  78. Zhao, J.C.; Ji, G.X.; Tian, Y.; Chen, Y.L.; Wang, Z. Environmental vulnerability assessment for mainland China based on entropy method. Ecol. Indic. 2018, 91, 410–422. [Google Scholar] [CrossRef]
  79. Neumann, J.V. On the Theory of Games of Strategy. In Contributions to the Theory of Games, Volume IV; Albert William, T., Robert Duncan, L., Eds.; Princeton University Press: Princeton, NJ, USA, 1959; pp. 13–42. [Google Scholar]
  80. Yu, Z.; Kanwal, Q.; Wang, M.; Nurdiawati, A.; Al-Ghamdi, S.G. Spatiotemporal dynamics and key drivers of carbon emissions in regional construction sectors: Insights from a Random Forest Model. Clean. Environ. Syst. 2025, 16, 100257. [Google Scholar] [CrossRef]
  81. Cui, L.; Wang, J.; Sun, L.; Lv, C. Construction and optimization of green space ecological networks in urban fringe areas: A case study with the urban fringe area of Tongzhou district in Beijing. J. Clean. Prod. 2020, 276, 124266. [Google Scholar] [CrossRef]
  82. Pearson, K. LIII. On lines and planes of closest fit to systems of points in space. Lond. Edinb. Dublin Philos. Mag. J. Sci. 1901, 2, 559–572. [Google Scholar] [CrossRef]
  83. Hotelling, H. Analysis of a complex of statistical variables into principal components. J. Educ. Psychol. 1933, 24, 498–520. [Google Scholar] [CrossRef]
  84. Ismi, D. Clustering based feature selection using Partitioning Around Medoids (PAM). J. Inform. 2020, 14, 50. [Google Scholar] [CrossRef]
  85. Pandya, S.; Saket, S. An overview of partitioning algorithms in clustering techniques. Int. J. Electr. Comput. Eng. 2020, 5, 1943–1946. [Google Scholar]
  86. Madhulatha, T.S. Comparison between K-Means and K-Medoids Clustering Algorithms. In Proceedings of the Advances in Computing and Information Technology, Berlin, Heidelberg, 15–17 July 2011; pp. 472–481. [Google Scholar]
  87. Supandi, A.; Saefuddin, A.; Sulvianti, I.D. Two step cluster application to classify villages in Kabupaten Madiun based on village potential data. Xplore J. Stat. 2021, 10, 12–26. [Google Scholar] [CrossRef]
  88. Bagirov, A.M.; Aliguliyev, R.M.; Sultanova, N. Finding compact and well-separated clusters: Clustering using silhouette coefficients. Pattern Recognit. 2023, 135, 109144. [Google Scholar] [CrossRef]
  89. Gagolewski, M.; Bartoszuk, M.; Cena, A. Are cluster validity measures (in) valid? Inf. Sci. 2021, 581, 620–636. [Google Scholar] [CrossRef]
  90. Ros, F.; Riad, R.; Guillaume, S. PDBI: A partitioning Davies-Bouldin index for clustering evaluation. Neurocomputing 2023, 528, 178–199. [Google Scholar] [CrossRef]
  91. Perroux, F. Economic space: Theory and applications. Q. J. Econ. 1950, 64, 89–104. [Google Scholar] [CrossRef]
  92. He, S.; Fang, B.; Xie, X. Temporal and spatial evolution and driving mechanism of urban ecological welfare performance from the perspective of high-quality development: A case study of Jiangsu Province, China. Land 2022, 11, 1607. [Google Scholar] [CrossRef]
  93. Selman, P. Landscape ecology and countryside planning: Vision, theory and practice. J. Rural Stud. 1993, 9, 1–21. [Google Scholar] [CrossRef]
  94. Liu, Z.; Liu, S.; Jin, H.; Qi, W. Rural population change in China: Spatial differences, driving forces and policy implications. J. Rural Stud. 2017, 51, 189–197. [Google Scholar] [CrossRef]
  95. Li, Y.; Westlund, H.; Liu, Y. Why some rural areas decline while some others not: An overview of rural evolution in the world. J. Rural Stud. 2019, 68, 135–143. [Google Scholar] [CrossRef]
  96. Jiang, G.; Ma, W.; Zhou, D.; Zhao, Q.; Zhang, R. Agglomeration or dispersion? Industrial land-use pattern and its impacts in rural areas from China’s township and village enterprises perspective. J. Clean. Prod. 2017, 159, 207–219. [Google Scholar] [CrossRef]
  97. Wang, G.; Li, X.; Gao, Y.; Zeng, C.; Wang, B.; Li, X.; Li, X. How does land consolidation drive rural industrial development? Qualitative and quantitative analysis of 32 land consolidation cases in China. Land Use Policy 2023, 130, 106664. [Google Scholar] [CrossRef]
  98. Zhou, Y.; Gu, H. Enhancing rural resilience through the rural revitalisation strategy in rural China: Evidence from Wushi Village, Hunan Province. J. Rural Stud. 2025, 113, 103493. [Google Scholar] [CrossRef]
  99. Zhou, Y.; Li, Y.; Xu, C. Land consolidation and rural revitalization in China: Mechanisms and paths. Land Use Policy 2020, 91, 104379. [Google Scholar] [CrossRef]
  100. Gao, J.; Yang, J.; Chen, C.; Chen, W. From ‘forsaken site’to ‘model village’: Unraveling the multi-scalar process of rural revitalization in China. Habitat Int. 2023, 133, 102766. [Google Scholar] [CrossRef]
  101. Zhang, R.; Jiang, G.; Zhang, Q. Does urbanization always lead to rural hollowing? Assessing the spatio-temporal variations in this relationship at the county level in China 2000–2015. J. Clean. Prod. 2019, 220, 9–22. [Google Scholar] [CrossRef]
  102. Wang, X.; Liu, Y.; Shao, Y.; Li, S. Evolution pattern and mechanism of rural areal functions in Xi’an metropolitan area, China. Habitat Int. 2024, 148, 103088. [Google Scholar] [CrossRef]
  103. Bielska, A.; Borkowski, A.S.; Czarnecka, A.; Delnicki, M.; Kwiatkowska-Malina, J.; Piotrkowska, M. Evaluating the potential of suburban and rural areas for tourism and recreation, including individual short-term tourism under pandemic conditions. Sci. Rep. 2022, 12, 20369. [Google Scholar] [CrossRef]
  104. Chen, P.; Kong, X. Tourism-led commodification of place and rural transformation development: A case study of Xixinan Village, Huangshan, China. Land 2021, 10, 694. [Google Scholar] [CrossRef]
  105. Liu, Y.; Dai, L.; Long, H.; Woods, M.; Fois, F. Rural vitalization promoted by industrial transformation under globalization: The case of Tengtou village in China. J. Rural Stud. 2022, 95, 241–255. [Google Scholar] [CrossRef]
  106. Glaeser, E.L.; Kohlhase, J.E. Cities, regions and the decline of transport costs. Pap. Reg. Sci. 2004, 83, 197–228. [Google Scholar] [CrossRef]
  107. Woltjer, J. A global review on peri-urban development and planning. J. Perenc. Wil. Dan Kota 2014, 25, 1–16. [Google Scholar] [CrossRef]
  108. Li, X.; Tan, Y.; Xue, D. From world factory to global city-region: The dynamics of manufacturing in the Pearl River Delta and its spatial pattern in the 21st century. Land 2022, 11, 625. [Google Scholar] [CrossRef]
  109. Montagné Villette, S.; Hardill, I. Spatial peripheries, social peripheries: Reflections on the “suburbs” of Paris. Int. J. Sociol. Soc. Policy 2007, 27, 52–64. [Google Scholar] [CrossRef]
  110. Li, S.; Yang, R.; Long, H.; Lin, Y.; Ge, Y. Rural spatial restructuring in suburbs under capital intervention: Spatial construction based on nature. Habitat Int. 2024, 150, 103112. [Google Scholar] [CrossRef]
  111. Agency, X.N. Ancient Xi’an: The City’s “Northern Span” Embraces the Development of the River. Available online: http://xadrc.xa.gov.cn/xwzx/dtyw/642e6cd9f8fd1c163f7371ec.html (accessed on 10 February 2025).
  112. Zeng, C.; Yin, Y.; Guo, L.; Liu, C.; Zhang, Y.; Huang, Z. Integrating the administrative spillover effect into the spatial governance system to revisit land development: A study in urban-rural fringe areas of Wuhan and neighboring cities, China. Land Use Policy 2024, 139, 107060. [Google Scholar] [CrossRef]
  113. Sharp, J.S.; Clark, J.K. Between the Country and the Concrete: Rediscovering the Rural–Urban Fringe. City Community 2008, 7, 61–79. [Google Scholar] [CrossRef]
  114. Yang, Y.; Bao, W.; Liu, Y. Scenario simulation of land system change in the Beijing-Tianjin-Hebei region. Land Use Policy 2020, 96, 104677. [Google Scholar] [CrossRef]
  115. Fan, J.; Li, S.; Sun, Z.; Guo, R.; Zhou, K.; Chen, D.; Wu, J. The functional evolution and system equilibrium of urban and rural territories. J. Geogr. Sci. 2022, 32, 1203–1224. [Google Scholar] [CrossRef]
  116. Tang, C.; Lu, X.; Lei, J.; Sun, W. Characteristics and Formation Mechanism of Urban-rural Multi-dimensional Spatial Conflict in Metropolitan Fringe:Take Zhuanxi Village in Shaoguan City as an Example. Econ. Geogr. 2022, 42, 79–89. [Google Scholar]
  117. Zhang, P.; Li, W.; Zhao, K.; Zhao, Y.; Chen, H.; Zhao, S. The Impact Factors and Management Policy of Digital Village Development: A Case Study of Gansu Province, China. Land 2023, 12, 616. [Google Scholar] [CrossRef]
  118. Negash, T.; Etsay, H.; Aregay, M.; Kidu, G.; Machine, Z. Livelihood options of landless rural households in Tigrai Region, Northern Ethiopia: Evidence from selected districts. Agric. Food Secur. 2023, 12, 6. [Google Scholar] [CrossRef]
  119. Verikas, A.; Gelzinis, A.; Bacauskiene, M. Mining data with random forests: A survey and results of new tests. Pattern Recognit. 2011, 44, 330–349. [Google Scholar] [CrossRef]
  120. Cao, L.; Chua, K.S.; Chong, W.K.; Lee, H.P.; Gu, Q. A comparison of PCA, KPCA and ICA for dimensionality reduction in support vector machine. Neurocomputing 2003, 55, 321–336. [Google Scholar] [CrossRef]
  121. Nayyar, A.; Puri, V. Comprehensive analysis & performance comparison of clustering algorithms for big data. Rev. Comput. Eng. Res. 2017, 4, 54–80. [Google Scholar]
  122. González, S.; García, S.; Del Ser, J.; Rokach, L.; Herrera, F. A practical tutorial on bagging and boosting based ensembles for machine learning: Algorithms, software tools, performance study, practical perspectives and opportunities. Inf. Fusion 2020, 64, 205–237. [Google Scholar] [CrossRef]
Figure 1. The location of the study area.
Land 14 00602 g001
Figure 2. The village selection process and the samples analyzed in this study.
Land 14 00602 g002
Figure 3. Study framework of this study.
Land 14 00602 g003
Figure 4. Comprehensive and dimensional URI indices mapping. Note: CBA means central built-up area.
Land 14 00602 g004
Figure 5. Clustering mapping. Note: CBA means central built-up area.
Land 14 00602 g005
Figure 6. Radar charts of each cluster.
Land 14 00602 g006
Table 1. Urban–rural integration measurement indicator system.
DimensionsFactorsIndicatorsCalculation MethodsRemarksReferences
EconomicEconomic vitalityNight-time light indexGIS Zonal Statistics as a table tool to obtain ALL valuesStatic[45,46]
Electricity consumptionGIS Zonal Statistics as a table tool to obtain ALL valuesStatic[47,48]
Economic strengthGDPGIS Zonal Statistics as a table tool to obtain ALL valuesStatic[49,50]
Number of enterprisesTotal number of enterprise POI pointsStatic[51,52]
Enterprise growthPOI points (2022)–POI points (2012)Dynamic
SocialSocial structurePopulation sizeGIS Zonal Statistics as a table tool to obtain ALL valuesStatic[53,54]
Aging ratePopulation aged ≥60/Total populationStatic[55,56]
Proportion of the labor forcePopulation aged 15–64/Total populationStatic[57,58]
Social securityDistribution of healthcare facilitiesStatistical total number of healthcare POI points after hierarchical accessibility analysisStatic[59,60]
Growth in healthcare facilitiesPOI points (2022)–POI points (2012)Dynamic
Number of primary and secondary schools per thousand peopleNumber of primary and secondary schools/School-age population (6–18 years)/1000Static[41,61]
Social infrastructureNumber of mobile base stationsTotal number of mobile base station POI pointsStatic[62,63]
Number of public facilitiesTotal number of public service facility POI pointsStatic[24,64]
Growth in public facilitiesPOI points (2022)–POI points (2012)Dynamic
SpatialUrban spatial expansionGrowth rate of construction landRural construction land (2022)–Rural construction land (2012)/Rural construction land (2012)Dynamic[41,65]
Proportion of construction land areaConstruction land area/Total land areaStatic
Intensity of spatial developmentRoad network densityTotal length of road centerlines/Land areaStatic[66,67]
Building densityArea of building outline/Total land areaStatic[68,69]
EcologicalTerrain flatnessTerrain slopeArea with slope > 15°/Total areaStatic[70,71]
Surface roughnessGIS Zonal Statistics as a table tool to obtain mean valuesStatic
Ecological environmental qualityVegetation coverageGIS Zonal Statistics as a table tool to obtain mean valuesStatic[72,73]
PM2.5GIS Zonal Statistics as a table tool to obtain mean valuesStatic[74,75]
PM10GIS Zonal Statistics as a table tool to obtain mean valuesStatic
Table 2. Comparison of PAM, PCA-PAM, and RF-PCA-PAM Models.
ModelsSilhouette CoefficientCalinski–Harabasz IndexDavies–Bouldin Index
Model 1: PAM0.023247.8712.445
Model 2: PCA-PAM−0.04118,999.910.577
Model 3: RF-PCA-PAM0.3051820.0261.261
Note: The Silhouette Coefficient measures the compactness of data points within clusters and the separation between clusters, with higher values indicating better performance [88]; the Calinski–Harabasz Index is based on the ratio of between-cluster to within-cluster variance, with larger values indicating better clustering performance [89]; the Davies–Bouldin Index measures the separation and compactness of clusters, with smaller values indicating better clustering performance [90].
Table 3. Descriptive statistics of all indicators in this study.
First LevelSecond LevelThird Level
Descriptive ParametersWeight Calculation
DimensionsAHP-EWMFactorsAHP-EWMIndicatorsMinMaxMeanSDAHPEWMAHP-EWM
Social0.3611Social security0.1561Distribution of healthcare facilities4.000043,990.0000254.8159993.20890.08700.04120.0782
Growth in healthcare facilities−5.0000140.00001.66725.99020.02040.04810.0257
Number of primary and secondary schools per thousand people0.000076.92310.76763.01610.05580.03670.0522
Social infrastructure0.1348Number of public facilities0.000039.00000.56961.79430.06640.03810.0610
Growth in public facilities−2.000035.00000.44411.54070.01580.04850.0220
Number of mobile base stations0.0000243.00001.35437.37100.05600.03420.0518
Social structure0.0702Population size6.000058,766.00002790.38294229.13810.01390.04570.0200
Aging rate0.11690.19230.17560.01340.00820.04740.0158
Proportion of the labor force0.64460.78460.70010.02210.03110.04860.0344
Economic0.2868Economic strength0.2035GDP0.00114690.2358102.1404262.78230.09550.04250.0854
Enterprise growth−12.0000642.00005.081420.07010.06760.04790.0638
Number of enterprises0.0000642.00005.753820.91130.05760.04050.0543
Economic vitality0.0833Electricity consumption39,409.228522,134,927.00003,748,178.38315,544,468.65970.05460.04380.0525
Night-time light index0.260963.000023.773217.55340.02680.04760.0308
Ecological0.2072Ecological environmental quality0.1512Vegetation coverage0.15120.65060.46890.05730.08930.04900.0816
PM2.530.075053.900046.90163.28430.04310.04850.0441
PM1066.4667106.266793.73685.55660.02000.04860.0255
Terrain flatness0.056Surface roughness0.919352.61713.91514.40940.02370.04910.0286
Terrain slope0.00000.01520.00140.00240.02230.04900.0274
Spatial0.1449Urban spatial expansion0.0952Proportion of construction land area0.00010.98460.21400.17070.05640.04770.0547
Growth rate of construction land−0.91275.04000.10130.31000.03850.04890.0405
Intensity of spatial development0.0497Road network density0.001325.61633.11642.76930.02120.04720.0262
Building density0.0000429.88230.11806.97540.02880.00120.0235
Disclaimer/Publisher’s Note: The statements, opinions and data contained in all publications are solely those of the individual author(s) and contributor(s) and not of MDPI and/or the editor(s). MDPI and/or the editor(s) disclaim responsibility for any injury to people or property resulting from any ideas, methods, instructions or products referred to in the content.

