1. Introduction
The urban–rural relationship refers to the pervasive interaction, influence, and mutual restriction between urban and rural areas, encompassing economic, social, political, cultural, and ecological domains. Since 1949, the Chinese government has implemented the “Agricultural–Industrial Price Scissors” policy (where the agricultural sector provides products to the industrial sector at prices below their value, while the industrial sector sells its products to the agricultural sector at prices above their value), which has significantly advanced the country’s industrialization process and accelerated the transformation of the economic structure. However, it has also exacerbated the imbalance between urban and rural areas to a certain extent. Indeed, from the year 2000 onward, the Chinese government has prioritized and initiated efforts to rectify the enduring disparity in urban–rural development, enacting a range of significant policy interventions. For instance, the government introduced the “Coordinated Development of Urban–Rural Economies and Societies” in 2002, abolished agricultural taxes in 2004, and introduced the “Rural Revitalization Strategy” in 2018. The enforcement of these policies has provided strong guarantees for the improvement and development of China’s urban–rural relations. However, the development gap between urban and rural areas remains a problem that cannot be overlooked. Overall, the development disparity between urban and rural areas is gradually widening, rendering the promotion of URI a crucial undertaking for national and regional economic and social development [
1,
2]. The urban–rural gap is not only reflected in the economic development of urban and rural areas but also includes public services, culture, and the ecological environment. The integrated development of urban and rural areas helps to break the urban–rural dual structure, promoting the free flow and equal exchange of urban and rural elements. It drives the coordinated development of urban and rural industries, the interconnection of infrastructure, and the joint construction and sharing of public services. This not only aids in narrowing the urban–rural gap, enhancing the living standards and happiness of farmers, but also contributes to the comprehensive, coordinated, and sustainable development of the economy and society.
Urban agglomerations serve as crucial platforms for regional economic integration and URI, leveraging their unique spatial organization and resource concentration advantages to substantially support and facilitate rural development and accelerate URI [
3,
4]. Firstly, urban agglomerations promote industrial collaborative upgrading through optimized resource allocation, injecting new vitality into the rural economy. Effective integration and efficient utilization of resources not only enhance the internal competitiveness of urban agglomerations but also drive the economic development of surrounding rural areas, fostering a positive scenario of urban–rural economic interaction. Secondly, urban agglomerations play a significant role in strengthening social ties and promoting the equalization of public services, thereby facilitating deeper URI. Through measures such as improving transportation networks, enhancing public service levels, and fostering cultural exchanges, these agglomerations help break down barriers between urban and rural areas. This enhances mutual understanding and recognition among residents, laying a solid social foundation for URI [
5,
6]. As a core strategy of the Chinese government to promote regional coordinated development and deepen the URI, the construction of urban agglomerations plays a crucial role. By strengthening the functional division of labor and complementary advantages among cities, urban agglomerations not only facilitate close economic interconnection and efficient collaboration within the region, giving rise to highly competitive urban agglomeration economies, but also provide robust support for the integration of urban–rural areas [
7].
In 2015, the Chinese government approved the “BTH Collaborative Development Plan Outline”, proposing the strategic plan for the development of the BTH urban agglomeration. As one of China’s most dynamic northern economic regions, the BTH urban agglomeration has four strategic roles: a world-class agglomeration centered on Beijing, a regional coordination and reform leader, a national innovation-driven growth engine, and an ecological restoration demonstration area [
8,
9].
In recent years, with the deepening implementation of the BTH collaborative development strategy, the urban agglomeration has made significant progress in infrastructure construction, industrial upgrading, and ecological environmental protection. However, issues of unbalanced and uncoordinated urban–rural development remain prominent. These issues not only affect the quality of life and well-being of urban and rural residents but also constrain the sustained and healthy development of the regional economy. Therefore, promoting urban–rural integrated development in the BTH urban agglomeration is crucial to achieving comprehensive, coordinated, and sustainable regional economic and social development.
The integration of urban and rural areas (URI) emerged as a focal point in academic research, yielding a wealth of scholarly findings. In the study of URI levels in China, Yang (2021) developed a BDG framework to analyze URI levels from 2000 to 2018, revealing an overall trend of higher URI levels in the eastern regions compared to the western regions of China [
10]. Wei (2023) constructed an evaluation system for URI based on five dimensions—innovative, coordinated, green, open, and shared development—to examine URI levels across 94 Chinese cities, finding significant regional disparities in the development of URI [
11].
Some scholars conducted research based on specific regions. For instance, Shan (2022) utilized nighttime light data to examine the spatial pattern of URI levels in Shandong Province [
12]. Yun (2023) employed panel data from Zaozhuang City spanning from 2009 to 2019 and constructed an evaluation system for URI across three dimensions: economic, spatial, and social [
13]. As urbanization accelerates, the development gap between urban and rural areas widens, prompting scholars to turn their attention to the urbanization development of urban agglomerations and URI.
In the realm of pattern research, Zheng examined the governance path of URI in the Wuhan metropolitan area and proposed a development model for the Wuhan Metropolitan Area based on this case study [
7]. Lu (2018) conducted an in-depth analysis of Chengdu’s URI strategy since 2007 and posited that systemic cost is a key factor in the process of URI [
14].
In the study of URI within urban agglomerations, scholars analyzed the spatial distribution characteristics of China’s 13 major urban agglomerations and assessed their leading role in regional economic development [
8]. Cui et al. predicted the level of urban–rural integrated development in the Chang-Zhu-Tan urban agglomeration through multi-scenario simulations based on population, land, and industry [
15]. Lin et al. examined spatiotemporal patterns and response mechanisms of URI development in the Yangtze River Urban Agglomeration using a multidimensional index encompassing production, living, and ecology. The study reveals an upward trend in the rural regional functions within the Yangtze Economic Belt [
16]. Wei et al. established separate indicator systems for urban and rural functions and found that, from 2009 to 2019, the urban–rural functional index in the middle reaches of the Yangtze River urban agglomeration shows an overall upward trend, with a continuous narrowing of regional differences in rural functions [
17].
In the study of the BTH urban agglomeration, Su et al. examined the evolutionary patterns of rural development in the region, suggesting that the “urban-driven rural development” model is a main factor in the comprehensive development of rural areas on the North China Plain [
18]. Li et al. also noted that the rural evolution in the BTH region has formed a spatiotemporal pattern of continuous expansion from core cities such as Beijing, Tianjin, Shijiazhuang, and Baoding; however, the issue of unbalanced urban–rural development in the region remains significant [
19].
Existing research scholars on URI have contributed valuable insights by focusing on development theory, levels, models, and paths. This research provides a useful reference for this study, but there are still some shortcomings. Specifically, firstly, scholars researching the level of URI predominantly conduct research from a national perspective or focus on a particular province. Analysis of URI development levels within urban agglomerations, especially the BTH region, is relatively limited. Secondly, scholars examining the evaluation of URI levels have developed indicator evaluation systems from various perspectives. They have further analyzed the spatial variations in URI levels. Only a few scholars have examined the dynamic coupling between URI subsystems.
Based on this, the study constructs an evaluation index system from the economic, social, and ecological dimensions to measure the level of URI in the BTH urban agglomeration. It analyzes the dynamic changes of URI through the dynamic coupling of URI subsystems. Furthermore, the study delves into the primary obstacles that constrain the development of URI. The findings of this research aim to provide policy recommendations for URI development within the BTH urban agglomeration. This facilitates comprehensive and sustainable regional development.
3. Results Analysis
3.1. Analysis of the URI Level in the BTH Urban Agglomeration
The study employed the entropy method to calculate the level of URI and the integration levels of the economic, social, and ecological subsystems within the BTH urban agglomeration (
Figure 2). Overall, the level of URI in the BTH urban agglomeration exhibited a significant upward trend during the study period. The integration level increased from 0.377 in 2010 to 0.543 in 2022, indicating substantial progress in URI within the agglomeration. During the period from 2010 to 2018, the level of URI of urban agglomerations has steadily increased. Although there was a brief decline in the integration level after 2018, it subsequently resumed an upward trend. This fluctuation may have been due to short-term economic volatility or policy adjustments. However, in the long term, the level of URI maintains a positive development trajectory.
From the perspective of the economic integration subsystem, the level of economic integration within the urban agglomeration has maintained relatively stable growth during the study period, increasing from 0.143 in 2010 to 0.150 in 2022, with a modest growth rate. Regarding the social integration subsystem, the level of social integration in the urban agglomeration has seen a rapid growth rate, rising from 0.067 in 2010 to 0.115 in 2022. This indicates that the urban agglomeration has achieved positive outcomes in promoting social equity, improving the living standards of residents, and advancing the integrated development of urban and rural areas. In terms of the ecological integration subsystem, the level of ecological integration in the urban agglomeration has seen a significant increase, from 0.160 in 2010 to 0.242 in 2022, signifying a notable improvement in the quality of the ecological environment. Although the level of ecological integration continued to rise after 2018, the growth rate was relatively limited. This may be due to the increasing difficulty of environmental improvement, necessitating more sustained and in-depth governance measures to further enhance the level of ecological integration. Overall, the BTH agglomeration has advanced in URI across all three subsystems.
In order to study the dynamic evolution characteristics of URI in BTH urban agglomeration from a holistic perspective, the kernel density estimation of URI and economic, social, and ecological integration subsystems of urban agglomeration was made by using Stata 17.0 software (
Figure 3).
Figure 3 reveals that the center of the kernel density curve for URI in the urban agglomeration shifts progressively to the right each year, indicating an overall upward trend in the level of URI within the study period. The shape of the curves shows steep declines in 2010 and 2014, contrasting with the more gradual declines in 2018 and 2022, suggesting a broader distribution and increasing disparities in URI levels within the urban agglomeration.
The kernel density curve for economic integration of urban agglomeration shows a shift first to the left and then to the right, indicating fluctuations in the level of economic integration during the study period. Specifically, the curve peaks around 0.15 in 2010, suggesting that the economic integration level for most regions was concentrated in this range at that time. In 2014, the peak of the curve is slightly higher than that of 2010 but shifts to the left overall, indicating an increasing disparity in the level of economic integration within the urban agglomeration. From 2014 to 2022, the kernel density curve shifts to the right, signifying a continuous improvement in the level of economic integration. Observing the curve’s shape, we can see that it becomes flatter and develops a rightward tail starting from 2010, indicating that while the disparities in economic integration levels are gradually narrowing, significant extremes still exist.
The kernel density curve for social integration of BTH urban agglomeration shows an overall shift to the right, indicating a continuous improvement in the level of social integration during the study period. The curve’s shape, with a steep left side and a flatter right side, suggests that the values for most cities in the urban agglomeration are higher than the central value. The appearance of twin peaks in the curve for 2018 and 2022 indicates a trend toward a multipolar development pattern in the level of social integration within the urban agglomeration. The kernel density curve for ecological integration of BTH urban agglomeration shows an overall shift to the right, indicating a continuous improvement in the level of ecological integration over the study period. The curve exhibits a steep slope and considerable fluctuation, signifying a gradual convergence of regional disparities in ecological integration within urban agglomerations over the study period, alongside uneven integration dynamics across different years. In 2022, the curve peaks around 0.24; however, the density value is higher compared to 2018, indicating that while the level of ecological integration in the urban agglomeration continues to improve, its distribution becomes more aggregated.
3.2. Temporal Evolution of URI Levels Across the BTH Urban Agglomeration
Using ArcGIS, we mapped the URI levels of the 14 cities in the BTH urban agglomeration for 2010, 2013, 2016, 2018, 2020, and 2022 (
Figure 4).
Figure 4 illustrates significant spatial variations in integration levels, with Beijing and Tianjin, the regional cores, consistently leading and promoting collaborative development through radiative and spillover effects.
In 2010, the URI levels across the BTH agglomeration were generally low, exhibiting a clear core–periphery structure. Beijing had a relatively high level of URI, while Tianjin also showed certain advantages; however, surrounding cities like Langfang and Tangshan were still in the initial stages of urban–rural integrated development, with overall integration levels in need of improvement. By 2013, interactions and cooperation within the urban agglomeration had intensified. Tianjin’s URI level experienced significant growth during this period, gradually aligning with Beijing to form a dual-engine driving the development of the urban agglomeration. Simultaneously, cities around Beijing, such as Langfang and Tangshan, under the dual influence of policy promotion and regional coordinated development, began to show a marked increase in URI levels, progressively narrowing the gap with the core cities.
In 2016, the urban–rural integrated development within the BTH urban agglomeration accelerated further. The level of URI in Beijing and Tianjin continued to rise, and the internal levels of the agglomeration began to show a more balanced development trend, with a narrowing gap. By 2018, Baoding, as an emerging central city in the BTH urban agglomeration, started to see a rapid increase in its URI level, becoming a new highlight of urban–rural integrated development within the agglomeration. This change not only reflects the healthy competition and collaboration among cities within the agglomeration but also highlights the role of policy and market mechanisms. In 2020 and 2022, the BTH urban agglomeration integration development became more robust and balanced. The leading position of Beijing and Tianjin remained evident, while the integration levels of surrounding cities also continued to improve, leading to a more comprehensive pattern of urban–rural integrated development within the agglomeration. In summary, the development and changes in the level of URI in the BTH urban agglomeration over the past decade have fully demonstrated the central role of urban agglomerations in promoting URI. Through the comprehensive use of policy guidance, regional coordination, industrial upgrading, infrastructure improvement, and other means, the URI development within the urban agglomeration has achieved remarkable results.
The global trend surface of the BTH urban agglomeration, mapped using ArcGIS software, further reveals the spatial distribution and changing trends of URI levels within the agglomeration (
Figure 5). In the east–west direction (
X-axis), the fitting curve opens downward, with the Z-values of western cities significantly lower than those in the central and eastern regions. The trend indicates that the gap between the central, eastern, and western parts is widening over time. In the north–south direction (
Y-axis), the fitting curve also opens downward, with the Z-values in the central area higher than those in the southern and northern regions. Over time, the Z-values of northern cities have increased, transitioning from a pattern of “higher in the middle and lower on the sides” to one characterized by “higher in the north and lower in the west”.
Trend surface analysis reveals a shift in the core of URI within the BTH agglomeration, moving from central–east to central–north, signifying an upward trend. The central and eastern regions, benefiting from proximity to Beijing and Tianjin, have received preferential policies and resource investments, enhancing integration levels. Despite rapid integration growth in Shijiazhuang, the southern central city, its impact lags Beijing and Tianjin, likely due to disparities in size, economic strength, and policy influence.
3.3. Analysis of the Dynamic Coupling Degree of Urban–Rural Integrated Development in the BTH Urban Agglomeration
Within the academic community, coupling coordination degrees are classified in various ways. Scholars typically distinguish between two main types—disequilibrium and coordination—each with further subdivisions. Drawing on existing research and the content of this study [
23], the coupling coordination types of the URI subsystems in the BTH urban agglomeration are categorized into six types based on the magnitude of the coordination values. A higher coordination value indicates a better level of coordination. The specific classification and characteristics of each type are detailed in
Table 2.
The coupling coordination degree model was applied to calculate the coordination levels of the URI development’s economic, social, and ecological subsystems within the BTH urban agglomeration, and a dynamic change map was made by ArcGIS software (
Figure 6), which depicts increasing coordination among the 14 cities’ urban–rural subsystems.
In terms of coordination types, most areas exhibit mild disequilibrium or primary coordination, with the central and northern regions showing higher coordination levels. This reflects the uneven development within the urban agglomeration. As core cities, Beijing and Tianjin demonstrate good performance in coordination, becoming a significant force in leading the coordinated development of the urban agglomeration. Specifically, in 2010, only Beijing’s coordination exceeded 0.4; by 2013, Tianjin’s urban–rural integrated subsystem was the first to enter the primary coordination stage. Meanwhile, surrounding cities such as Chengde and Tangshan also experienced significant improvements, indicating the mutual influence and driving effect among cities within the urban agglomeration. In 2016, five cities reached the primary coordination stage, all of which were near Beijing and Tianjin. This trend continued in 2018, with Beijing and Tianjin further enhancing their coordination degrees, although they had not yet reached the moderate coordination level, significant progress was made. Meanwhile, Shijiazhuang also saw a rapid increase in its coordination degree, emerging as a new highlight of coordinated development within the urban agglomeration. After 2018, the coordination degrees of the urban–rural integrated subsystems in the BTH urban agglomeration improved, but the magnitude of the improvement was not substantial.
In summary, the coordination within the urban–rural integrated subsystems of the BTH urban agglomeration is improving, despite the regional disparities. Core cities like Beijing and Tianjin exhibit a significant driving effect, while other cities are gradually enhancing their own coordination levels. This suggests that further policy support and resource investment may be necessary to foster more comprehensive URI and regional coordinated development.
3.4. Analysis of Obstacle Factors in the Development of URI Levels in the BTH Urban Agglomeration
3.4.1. Dynamic Changes in Systemic Obstacles
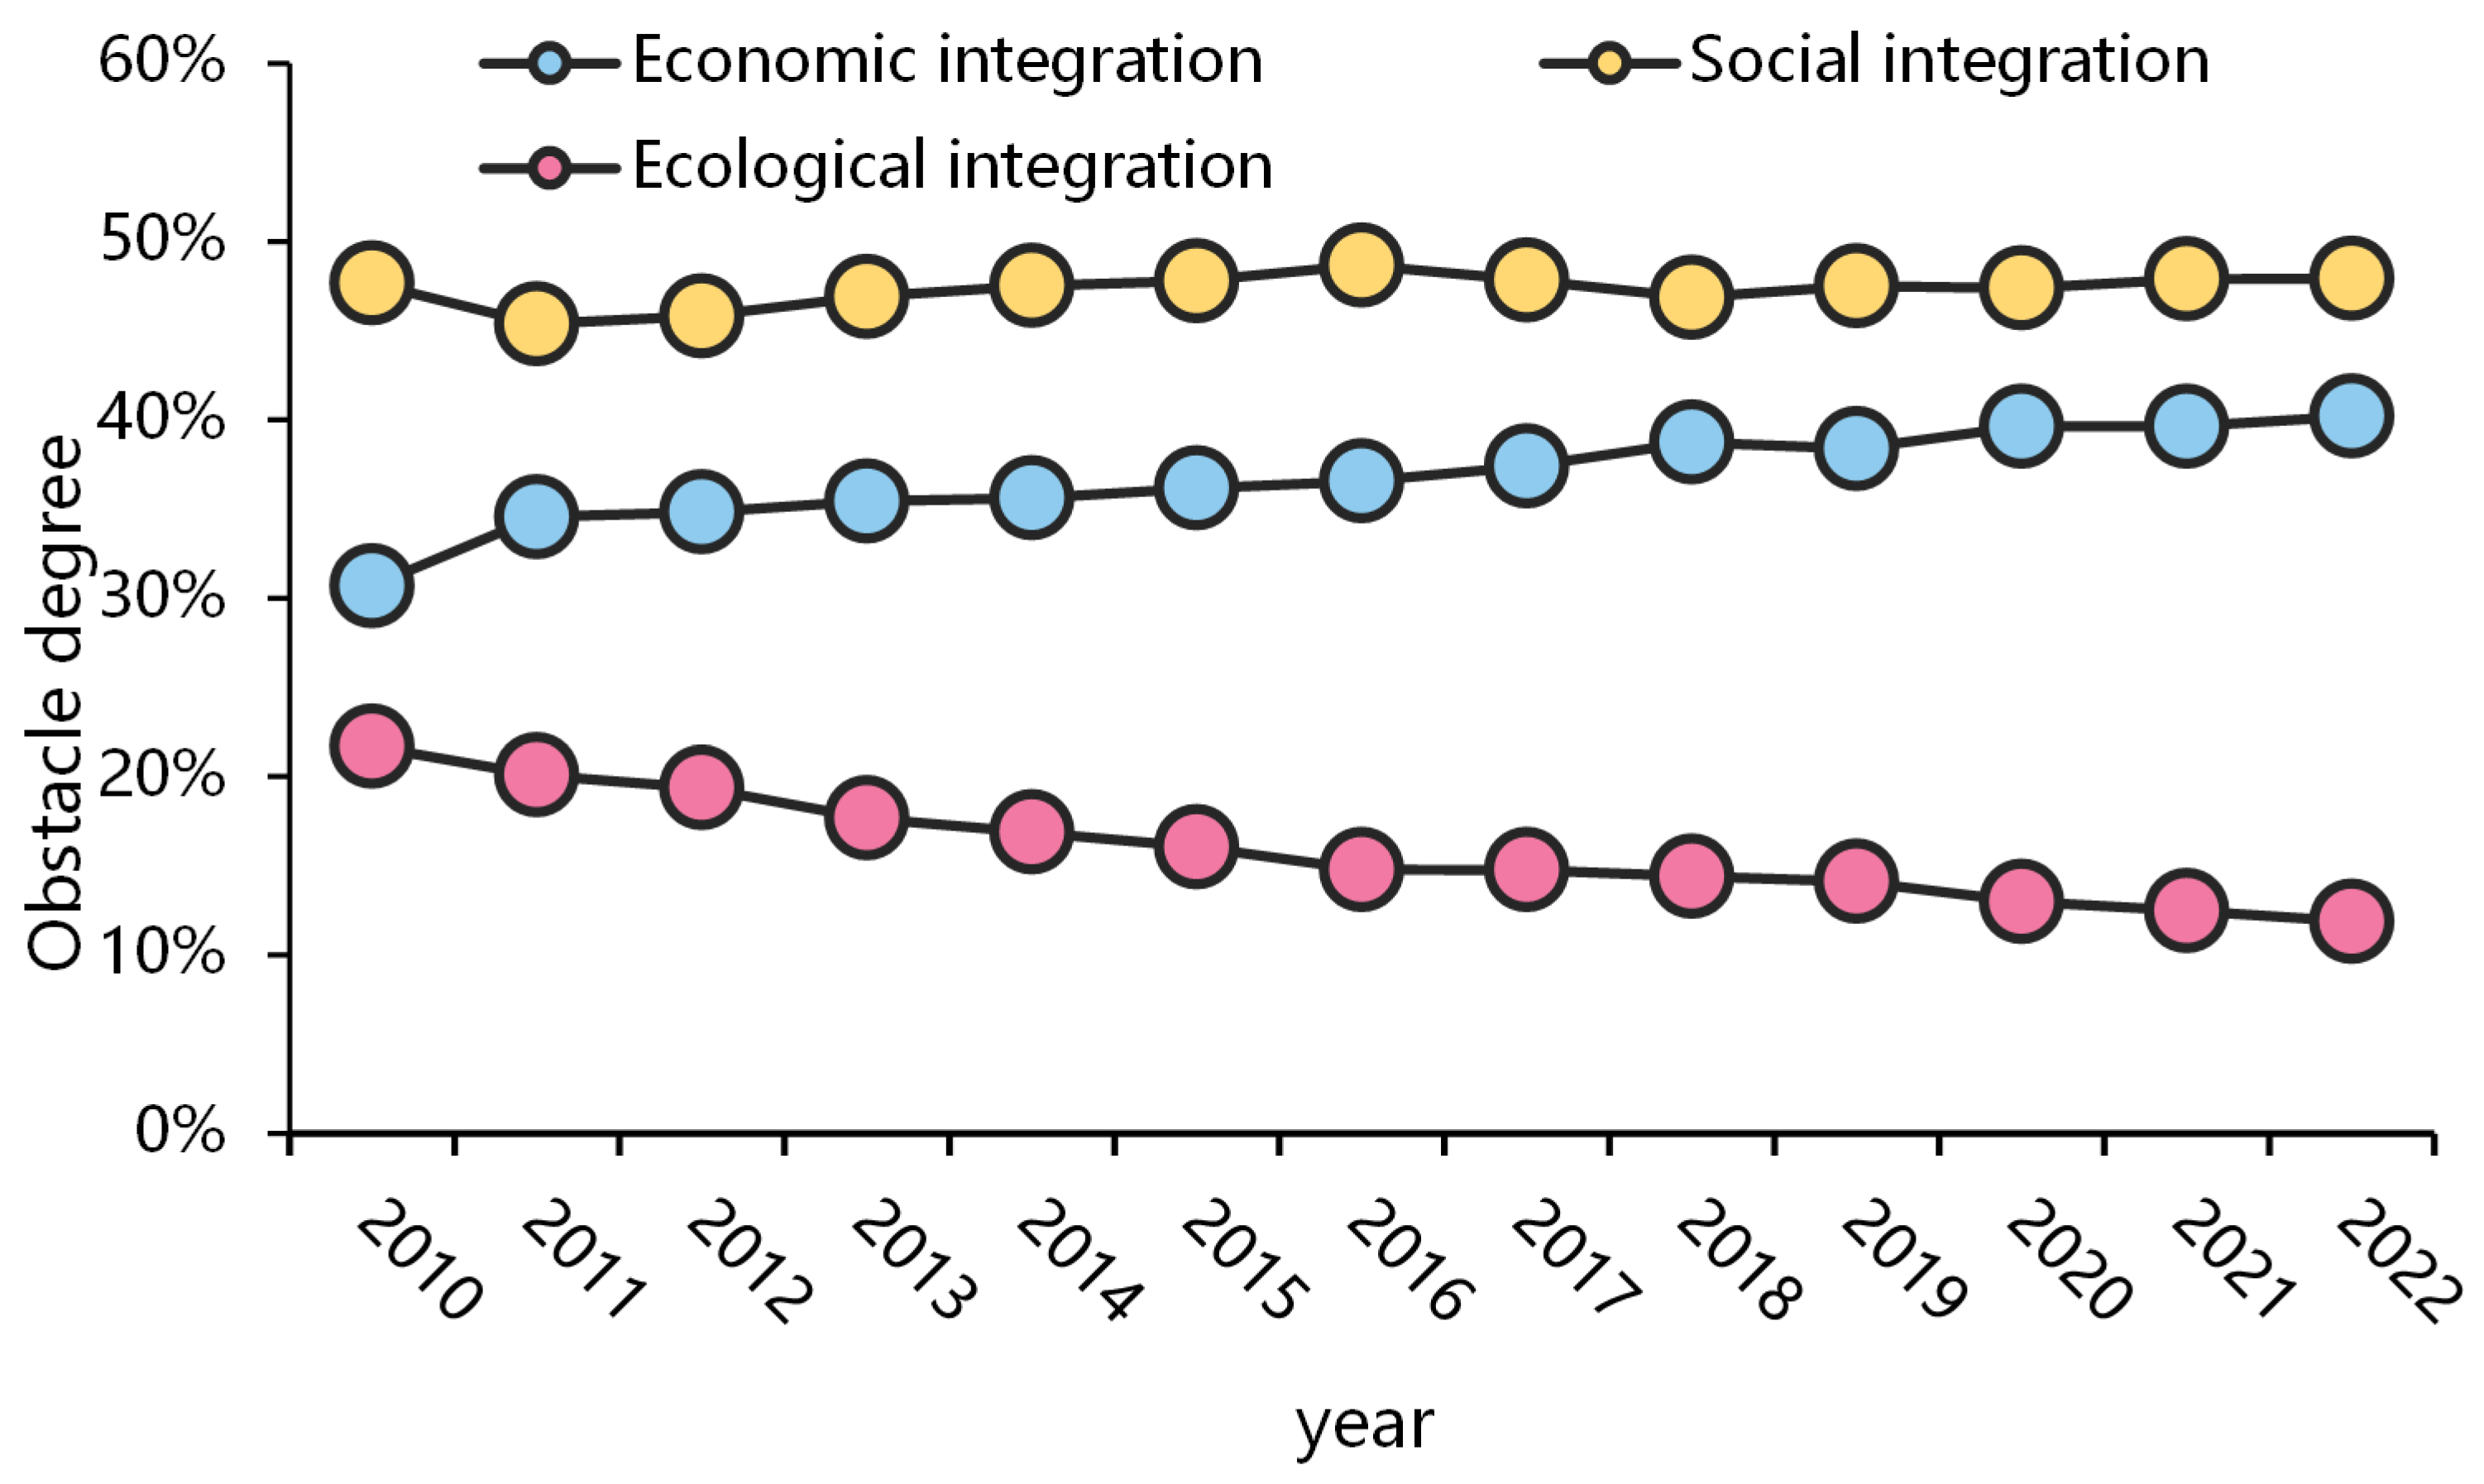
To further analyze the URI levels in the BTH urban agglomeration and promote the rapid development of these levels, an obstacle degree model was employed to calculate the obstacle degrees of the indicators for urban–rural integrated development from 2010 to 2022. This was performed to identify the key obstacle layers and factors hindering the improvement of URI levels in the agglomeration. The trends in obstacle degrees for the economic, social, and ecological subsystems of URI in the BTH urban agglomeration are presented in
Figure 7.
Overall, the obstacle degree of the economic integration system shows an upward trend, while the obstacle degree of the social integration system exhibits a fluctuating pattern, with little overall change. The obstacle degree of the ecological integration system generally trends downward. The economic subsystem obstacle degree rose significantly from 0.307 to 0.402, indicating a relatively rapid growth rate. The increasing obstacle degree of the economic integration system suggests that the economic development of the BTH urban agglomeration has become a key factor constraining the improvement of URI levels. The social subsystem obstacle degree remained relatively stable, increasing marginally from 0.477 to 0.479. The relatively minimal change but high overall obstacle degree indicates that, despite no significant deterioration or improvement trend, the development of the social integration system relatively remains a major obstacle to ecological integration within the agglomeration. The obstacle degree of the ecological integration system decreased from 0.217 to 0.119, demonstrating a marked downward trend. This indicates that the BTH urban agglomeration has made positive progress in environmental protection and sustainable development, effectively reducing the obstacle degree of the ecological integration system.
3.4.2. Analysis of Obstacle Factors
To further analyze the degree of obstacles to economic, social, and ecological integration within urban agglomerations, we calculated the obstacle factors for each indicator within the economic, social, and ecological subsystems of urban–rural integration across urban agglomerations from 2010 to 2022, based on Equations (4)–(6). The top five obstacle factors are presented in
Table 3.
Overall, the top five obstacle factors are predominantly composed of factors related to economic and social integration systems, which represent the main obstacles to the enhancement of ecological integration within the urban agglomeration. Despite government infrastructure investments, urban–rural transportation integration (B2) has consistently been among the top three obstacles from 2012 to 2022, highlighting the persistent challenge in this area. The urban–rural investment level factor (A5) has ranked second from 2012 to 2022, reflecting the pronounced disparities in investment between urban and rural areas. Urban areas, benefiting from developed economies, dense populations, and comprehensive infrastructure, tend to attract more investment support, while rural areas may face underinvestment. This investment disparity exacerbates the economic divide. The urban–rural economic development factor (A1) has ranked among the top three from 2010 to 2020, indicating that the imbalance in economic development levels between urban and rural areas is a crucial factor hindering integrated development.
In 2010, the urban–rural Internet development gap (B5) in social integration was the top obstacle, signifying that the disparity in internet development between urban and rural areas was the primary impediment to integrated development at that time. By 2022, this factor had dropped to fourth, reflecting a narrowing of the internet development gaps between urban and rural areas. This change is likely related to the information and digital divides between urban and rural regions, which have resulted in rural areas being at a distinct disadvantage in accessing information and utilizing network services. The urban–rural economic development factor (A1) was the second-highest obstacle in 2010. Although its ranking decreased by 2022, the obstacle degree increased, indicating that the disparity in economic development levels between urban and rural areas is also a significant factor hindering integrated development, and this economic gap is widening. In 2010, urban–rural transportation integration (B2) was the third obstacle factor, but it no longer posed a significant challenge to the BTH urban agglomeration’s integration post-2012. This reflects a decade of government investment in transportation infrastructure, transportation networks, and public transportation service enhancements that have effectively alleviated the inconvenience of travel between urban and rural areas, leading to significant improvements in transportation conditions. Urban–rural educational development (B4) was the fourth obstacle in 2010, with an obstacle degree of 10.37%. This figure highlights the significant imbalance in educational development between urban and rural areas within the urban agglomeration at that time. By 2022, this obstacle dropped to 8.43%, showing progress in the BTH region, yet it remains a key obstacle. Since 2012, the level of urban–rural investment (A5) has emerged as a critical obstacle, with a rising trend in its obstacle degree, reaching 13.96% by 2022.
The analysis above indicates that urban–rural integrated development involves the interaction of multiple systemic factors. To promote such development, it is necessary to consider various aspects, including economic, social, and ecological factors comprehensively. Integrated measures should be adopted to advance this process in a coordinated manner.
4. Discussion
4.1. Spatial Evolution Characteristics of URI Levels in the Urban Agglomeration
In terms of the overall growth trend of URI within the BTH urban agglomeration, this urban agglomeration serves as the core engine driving the development of URI, playing a significant role. The collaborative development and optimized resource allocation among cities within the urban agglomeration have not only propelled the process of URI but also enhanced the overall regional economy. However, development disparities among cities within the agglomeration still persist. The government should strengthen policy support to sustain this momentum and outline long-term strategic plans to clarify integration goals and routes. Furthermore, it is crucial to amplify the radiating and spillover effects of Beijing and Tianjin to promote adjacent cities’ development and encourage resource sharing and synergy through inter-city cooperation.
From the perspective of spatial evolution characteristics, the URI levels in the BTH urban agglomeration exhibit a distinct core–periphery structure, which aligns with the general patterns of regional economic development where core cities exert positive influences on surrounding areas through their economic and technological advantages. Therefore, there is a need to further refine the spatial optimization of the urban agglomeration by strengthening the development of the central and northern regions and enhancing the catalytic role of southern central cities such as Shijiazhuang. The government can foster complementary advantages and collaborative development among regions by formulating differentiated regional development policies that target specific economic and social needs.
4.2. Coordination of URI Subsystems in the Urban Agglomeration
The degree of coordination within the URI subsystem of the BTH urban agglomeration is generally showing an upward trend. Beijing and Tianjin, in particular, have demonstrated strong performance in terms of coordination, emerging as pivotal forces guiding the harmonious development of the urban cluster. This finding indicates that the regional coordinated development strategy has, to a certain extent, promoted balanced growth within the BTH urban agglomeration. From the perspective of the economic integration system, it is essential to drive the coordinated development of urban and rural industries by optimizing the industrial layout. This includes fostering the growth of specialized agriculture and rural tourism in rural areas and enhancing the integration of industrial chains within the urban agglomeration to realize the integration of urban and rural economies. Additionally, increasing investment in rural infrastructure and public services is essential to bridge the urban–rural gap, while encouraging social capital inflow to stimulate rural economic growth. Finally, the government should draft preferential policies to attract more enterprises and talent to invest and thrive in rural areas, thereby enhancing the employability and income levels of the rural population. From the perspective of social integration, the government should aim to integrate urban and rural transportation networks by extending public transit services to rural areas and reducing travel costs. Additionally, the government should enhance public services in rural regions, including education, healthcare, and cultural amenities, to promote equity and bridge the urban–rural divide. From the ecological integration subsystem’s perspective, enhancing collaborative governance of the internal ecological environment within urban agglomerations can improve environmental quality. Consequently, the government can foster the development of eco-industries by encouraging rural areas to pursue eco-agriculture and eco-tourism. This approach not only strengthens the integration of eco-industries with the urban–rural economy but also drives the scaling-up and industrialization of eco-industries.
4.3. Key Barrier Factors and Countermeasures
From the perspective of barrier factors, economic and social integration pose significant obstacles to enhancing ecological integration within urban agglomerations. Key constraints on URI development include factors such as the integration of urban–rural transportation systems, investment levels, and disparities in economic development. To overcome barriers to the integration of urban–rural transportation, increasing investment in transportation infrastructure and enhancing traffic planning and management can promote the integrated development of urban–rural transportation systems. To overcome the barriers in urban–rural investment levels, it is essential to optimize the investment environment to attract more social capital into rural areas. Furthermore, by strengthening cooperation between the government and social capital, the diversification of urban–rural investment can be promoted. To address barriers to urban–rural economic development, preferential policies should be formulated to encourage enterprises and talent to invest and flourish in rural areas. This involves strengthening the cultivation and upgrading of industries in rural regions, thereby enhancing the competitiveness and sustainable development capabilities of the rural economy.
The current study has several limitations. Firstly, despite constructing an indicator system that covers economic, social, and ecological dimensions, it may have overlooked crucial indicators, like quality of life and well-being. Future researchers could expand this indicator system and extend the data timeframe for more precise insights into development trends and impacts. Secondly, due to space limitations, the study did not thoroughly explore differences and underlying causes among cities within the BTH urban agglomeration. Future scholars could conduct comparative studies with other urban agglomerations to investigate the different characteristics and experiences of URI development across regions.
5. Conclusions
The urban agglomeration plays a pivotal role in promoting regional economic integration, optimizing resource allocation, and enhancing the overall development level of urban and rural areas. To uncover the actual state and development obstacles of the BTH urban agglomeration and to advance the level of URI within it, this study develops a framework for assessing URI development across economic, social, and ecological dimensions using data from 14 cities in the BTH region (2010–2022). It examines the integration level and coupling coordination among economic, social, and ecological subsystems, and it identifies spatial–temporal patterns and key obstacle factors. The main conclusions are as follows:
First, the URI in the BTH agglomeration has shown steady growth, rising from 0.377 in 2010 to 0.543 in 2022. The economic, social, and ecological subsystems all exhibit a positive trend toward integration, providing a scientific basis and directional guidance for subsequent policy formulation. The economic integration subsystem in the urban agglomeration showed minimal change, increasing slightly from 0.143 in 2010 to 0.150 in 2022. The social integration subsystem in the urban agglomeration experienced rapid growth, escalating from 0.067 in 2010 to 0.115 in 2022. The ecological integration subsystem within the urban agglomeration significantly advanced, with the integration level jumping from 0.160 in 2010 to 0.242 by 2022.
Second, the spatial evolution of URI development in the BTH urban agglomeration exhibits a distinct core–periphery structure. Beijing and Tianjin, as the core areas, continuously drive the collaborative development of surrounding cities through radiative and spillover effects. The core of URI in the BTH region has shifted gradually from the central–east to the central–north, indicating an upward movement of the core area, as revealed by trend surface analysis. Although Shijiazhuang, as the central city in the south, has experienced a rapid increase in the level of URI, its driving force is weaker compared to that of Beijing and Tianjin.
Third, the coordination within the URI subsystems across the 14 cities in the BTH urban agglomeration is exhibiting an upward trajectory. Beijing and Tianjin have significantly improved their coordination levels, emerging as pivotal forces in steering the integrated growth of the urban agglomeration. Most areas of the urban agglomeration are characterized by mild discoordination and mild coordination, with the central and northern regions exhibiting higher coordination than other areas.
Lastly, the findings from the obstacle analysis indicate that the systems of economic integration and social integration are the predominant obstacles to enhancing ecological integration within the urban agglomeration. Significant obstacles to the integrated development of urban and rural areas in the BTH urban agglomeration include factors such as urban–rural transportation integration (B2), investment disparities between urban and rural areas (A5), and economic development gaps between urban and rural areas (A1).
This study, through in-depth analysis of the level of URI in the BTH urban agglomeration, as well as its spatial and temporal evolution patterns and key obstacle factors, not only uncovers the actual conditions and challenges faced by regional development, but also offers a scientific foundation and directional insights for formulating subsequent policies. This holds significant theoretical and practical relevance for advancing URI in the BTH urban agglomeration and across the nation.


