1. Introduction
With the acceleration of global urbanization, urban street networks, as critical spatial frameworks supporting traffic flow, public space functions, and social activities, are increasingly recognized as key factors influencing the spatial distribution of commercial activities [
1,
2,
3]. In modern cities, the traditional monocentric structure is replaced by polycentric and functionally diverse urban morphologies. This structural shift not only reshapes the organization of urban space but also significantly increases the complexity of commercial activity distribution. Particularly under the backdrop of accelerated globalization, the coexistence of globally standardized chain restaurants and locally diverse dining establishments adds complexity to commercial dynamics. Understanding the relationship between urban street patterns and commercial distribution can aid in optimizing urban spatial structures, enhancing urban vibrancy and functional efficiency, and providing valuable references for planning and development in other rapidly urbanizing regions [
4].
As an important part of urban commerce, the spatial distribution of the catering industry reflects the important influence of street morphology on commercial resource allocation and urban functional organization. The distribution of the catering industry not only reflects regional commercial vibrancy but also highlights the adaptability of urban blocks to passenger flow, consumer demand, and service radius. From the perspective of urban morphology, the distribution characteristics of the catering industry under different street forms are directly related to spatial accessibility and service efficiency, and indirectly drive social interaction and economic vibrancy [
5,
6,
7,
8,
9]. Therefore, in-depth research on the spatial distribution of the catering industry can provide a strong basis for optimizing urban commercial layout, enhancing regional attractiveness, and improving the quality of life of residents. Urban streets, as the foundation of these dynamics, are widely recognized as dynamic spaces that foster urban vibrancy by supporting pedestrian movement, facilitating economic transactions, and encouraging social interactions. Previous studies have shown that well-structured and pedestrian-friendly street networks not only improve accessibility but also support the formation of vibrant commercial and social clusters, where economic and social activities thrive [
10,
11,
12,
13,
14].
Urban morphology is a discipline dedicated to studying the form of cities and their patterns of evolution. At its core, it focuses on analyzing physical elements such as streets, plots, and buildings to uncover the inherent logic behind urban structural changes and how urban morphology influences socio-economic and cultural dynamics [
15,
16,
17,
18]. In recent years, urban morphology has played an important role in coping with the spatial pressure of rapid urbanization. It has provided theoretical support for solving problems such as land scarcity and traffic congestion. For example, studies have shown its economic influence on housing markets and its role in improving public transport accessibility through compact urban forms [
19,
20]. These findings underscore the importance of urban morphology in shaping efficient and sustainable urban environments. Examining the distribution of commercial activities through this lens not only deepens the understanding of urban spatial organization but also offers a scientific basis for optimizing sustainable urban structures.
Space syntax is an important analytical tool in urban morphology. It quantifies the properties of spatial structure through mathematical modeling, reveals the complex relationship between spatial form and function, and is widely used to study the impact of street form on commercial vibrancy [
21]. Space syntax shows the differences in accessibility, visibility, and commercial adaptability between street patterns (such as grid and organic forms) [
22,
23]. For example, the grid pattern is characterized by a regular linear street layout, which improves traffic accessibility and walkability, thereby promoting commercial distribution; the organic pattern has an irregular configuration that can promote more significant social interaction and cultural continuity [
22,
24,
25,
26]. However, traditional space syntax research mainly focuses on spatial analysis at the macro scale, lacking fine-grained research on micro-scale commercial distribution, especially for specific industries such as the catering industry.
With the rise in big data, crowdsourced datasets such as Dianping (a review platform similar to Yelp), based on individual behavior data like location and online activity, have become innovative tools for studying urban morphology. These datasets provide unprecedented support for uncovering large-scale socio-economic activities from the perspective of individual behaviors [
27,
28]. For example, Yang used Points of Interest (POI) data to investigate the statistical correlations between urban spatial structures and functional clustering patterns, proposing the concept of “Syntactic Efficiency” to measure the functionality of spatial locations [
4]. Sheng et al. further developed the “Normalized Scale” method, enhancing the precision of POI data in fine-grained analyses [
2]. These studies have laid a foundation for revealing the impact of urban spatial morphology on commercial activities from a more detailed perspective.
Despite recent advancements in high-precision spatial analysis, most studies continue to focus on comparing commercial districts within functional zoning frameworks or conducting detailed, high-precision investigations within specific zones. For example, Hu et al. analyzed the spatial distribution of restaurants in three neighborhoods in Beijing, demonstrating how spatial configuration metrics influence clustering patterns within specific areas [
29]. Sheng et al. examined online catering in Beijing, highlighting significant differences in the spatial logic of dine-in and takeaway restaurants between urban centers and suburban areas [
6]. Similarly, other studies have focused on high-precision analyses within single zones, exploring the temporal evolution of commercial activities [
30] and identifying street spatial characteristics that influence commercial vibrancy [
31]. While these studies provide valuable insights into functional zoning and spatial dynamics, they are largely confined to comparisons within functional zones or detailed analyses of individual areas. They fail to systematically address how commercial vibrancy is distributed at the street level across different urban morphologies. This limitation is particularly evident in the catering industry, where spatial distribution patterns are closely tied to variations in urban morphology. To bridge this gap, this study integrates space syntax theory and Dianping data to investigate how different urban morphologies (grid and organic forms) influence the spatial distribution of the catering industry, offering new perspectives on the relationship between urban morphology and commercial activity.
The Macau Peninsula, with its unique geographical and cultural background, exhibits a “patchwork” characteristic, consisting of organically shaped historical districts and grid-patterned modern reclaimed areas [
32,
33,
34]. This distinct spatial feature provides ideal conditions for systematically comparing the distribution of commercial sectors across different urban morphologies within a unified space syntax framework. Furthermore, Macau’s diverse and densely distributed catering industry, highly dependent on urban morphology and traffic flow, makes it an ideal field for studying the spatial distribution of the catering industry. Moreover, the hybridity of Macau’s culinary culture, characterized by the integration of Portuguese/European and Chinese/Asian cuisines, offers a unique lens to explore the catering industry from a multicultural perspective. In addition, the accelerated growth of online food delivery platforms during the pandemic has driven more local restaurants to establish a presence on digital platforms, further supporting this research.
By integrating big data from the catering industry with space syntax theory and analytical methods, this study explores the relationship between street patterns and the spatial distribution of the catering industry from the perspective of urban morphology. As a key quantitative method in urban morphology analysis, space syntax provides a practical approach to understanding the relationship between urban spatial structure and functionality. Through the analysis and comparison of the impact of different urban morphologies on the spatial distribution of the catering industry in the Macau Peninsula, this study aims to reveal clustering patterns and spatial rules within different morphologies, offering empirical support for optimizing urban commercial street layouts and promoting ecological design.
This study not only validates the effectiveness of space syntax in analyzing commercial distribution but also, through empirical analysis of the catering industry in Macau, further investigates the impact of street patterns within different urban morphologies (grid and organic forms) on the spatial distribution of the catering industry. Hopefully, this study can provide insights into urban morphology research worldwide, contributing to urban structure’s refined management and sustainable development.
2. Methodology
This study aims to examine the spatial distribution characteristics of the catering industry in Macau under different urban morphologies, revealing the impact of street patterns on the spatial layout of commercial activities. To achieve this, this study adopts the four-step framework of “spatial form-spatial function” (hereafter referred to as “form-function”) proposed by [
4,
35] (
Figure 1). Rooted in the principles of Space Syntax, this framework offers a systematic methodology to analyze the relationship between spatial configuration and urban functions, enabling a quantitative understanding of how different urban morphologies influence commercial clustering and accessibility.
The rationale for using the “form-function” framework lies in its ability to bridge spatial structure and functional outcomes through a replicable and evidence-based process. Space Syntax theory posits that urban spaces are configurational entities, where the relational properties of streets and spaces significantly shape human movement, land use, and social interactions [
35,
36]. By leveraging configurational metrics such as integration (global accessibility) and choice (local route significance), this framework quantitatively evaluates how Macau’s grid-patterned and organically shaped street layouts facilitate or constrain the distribution of catering activities. These metrics provide a theoretical and methodological foundation for examining pedestrian behavior, commercial activity patterns, and their spatial correlations.
Explanation: Spatial visualization uses graphical and analytical techniques to represent urban spaces’ geometric and functional attributes. It translates abstract spatial data into interpretable visual formats, helping identify accessibility patterns, spatial hierarchies, and clustering tendencies.
Application in this study: ArcMap10.8 and Depthmap+ Beta 1.0 (2012 version) software are used to visualize catering review data and accessibility parameters, highlighting the catering industry’s spatial distribution across Macau’s grid-patterned and organically shaped areas. This step clarifies how different street patterns influence catering distribution, providing the basis for configuration analysis.
- 2.
Spatial Configuration Analysis:
Explanation: This step quantifies the relationships between spatial elements and their functional interactions using metrics like integration and choice. It evaluates how urban layouts influence movement patterns and economic activity.
Application in this study: Correlations between the number of catering establishments, reviews, and accessibility metrics reveal how street network structures affect the catering industry’s vibrancy and clustering. This step identifies configurational factors that influence catering clustering and contributes to understanding how urban morphology shapes economic performance.
- 3.
Spatial Modeling:
Explanation: Spatial modeling develops descriptive and predictive models to explain spatial phenomena. It integrates quantitative and qualitative methods to simulate relationships between spatial structures and socioeconomic factors.
Application in this study: Boxplots analyze accessibility parameters of catering establishments, capturing distributional characteristics across grid-patterned and organically shaped areas. This step generalizes patterns in the interaction between street configurations and catering distribution, enhancing the research’s predictive capacity and supporting urban planning strategies.
- 4.
Spatial Theory:
Explanation: Spatial theory synthesizes findings into a conceptual framework explaining the relationship between spatial morphology and social or economic functions. It highlights how spatial configurations shape human behavior, movement, and activity patterns.
Application in this study: The findings contribute to the “spatial form-spatial function” theory by providing empirical evidence of diverse commercial layouts under different urban morphologies. These insights validate theoretical understandings and bridge empirical observations with practical urban planning, highlighting the functional implications of Macau’s unique urban forms.
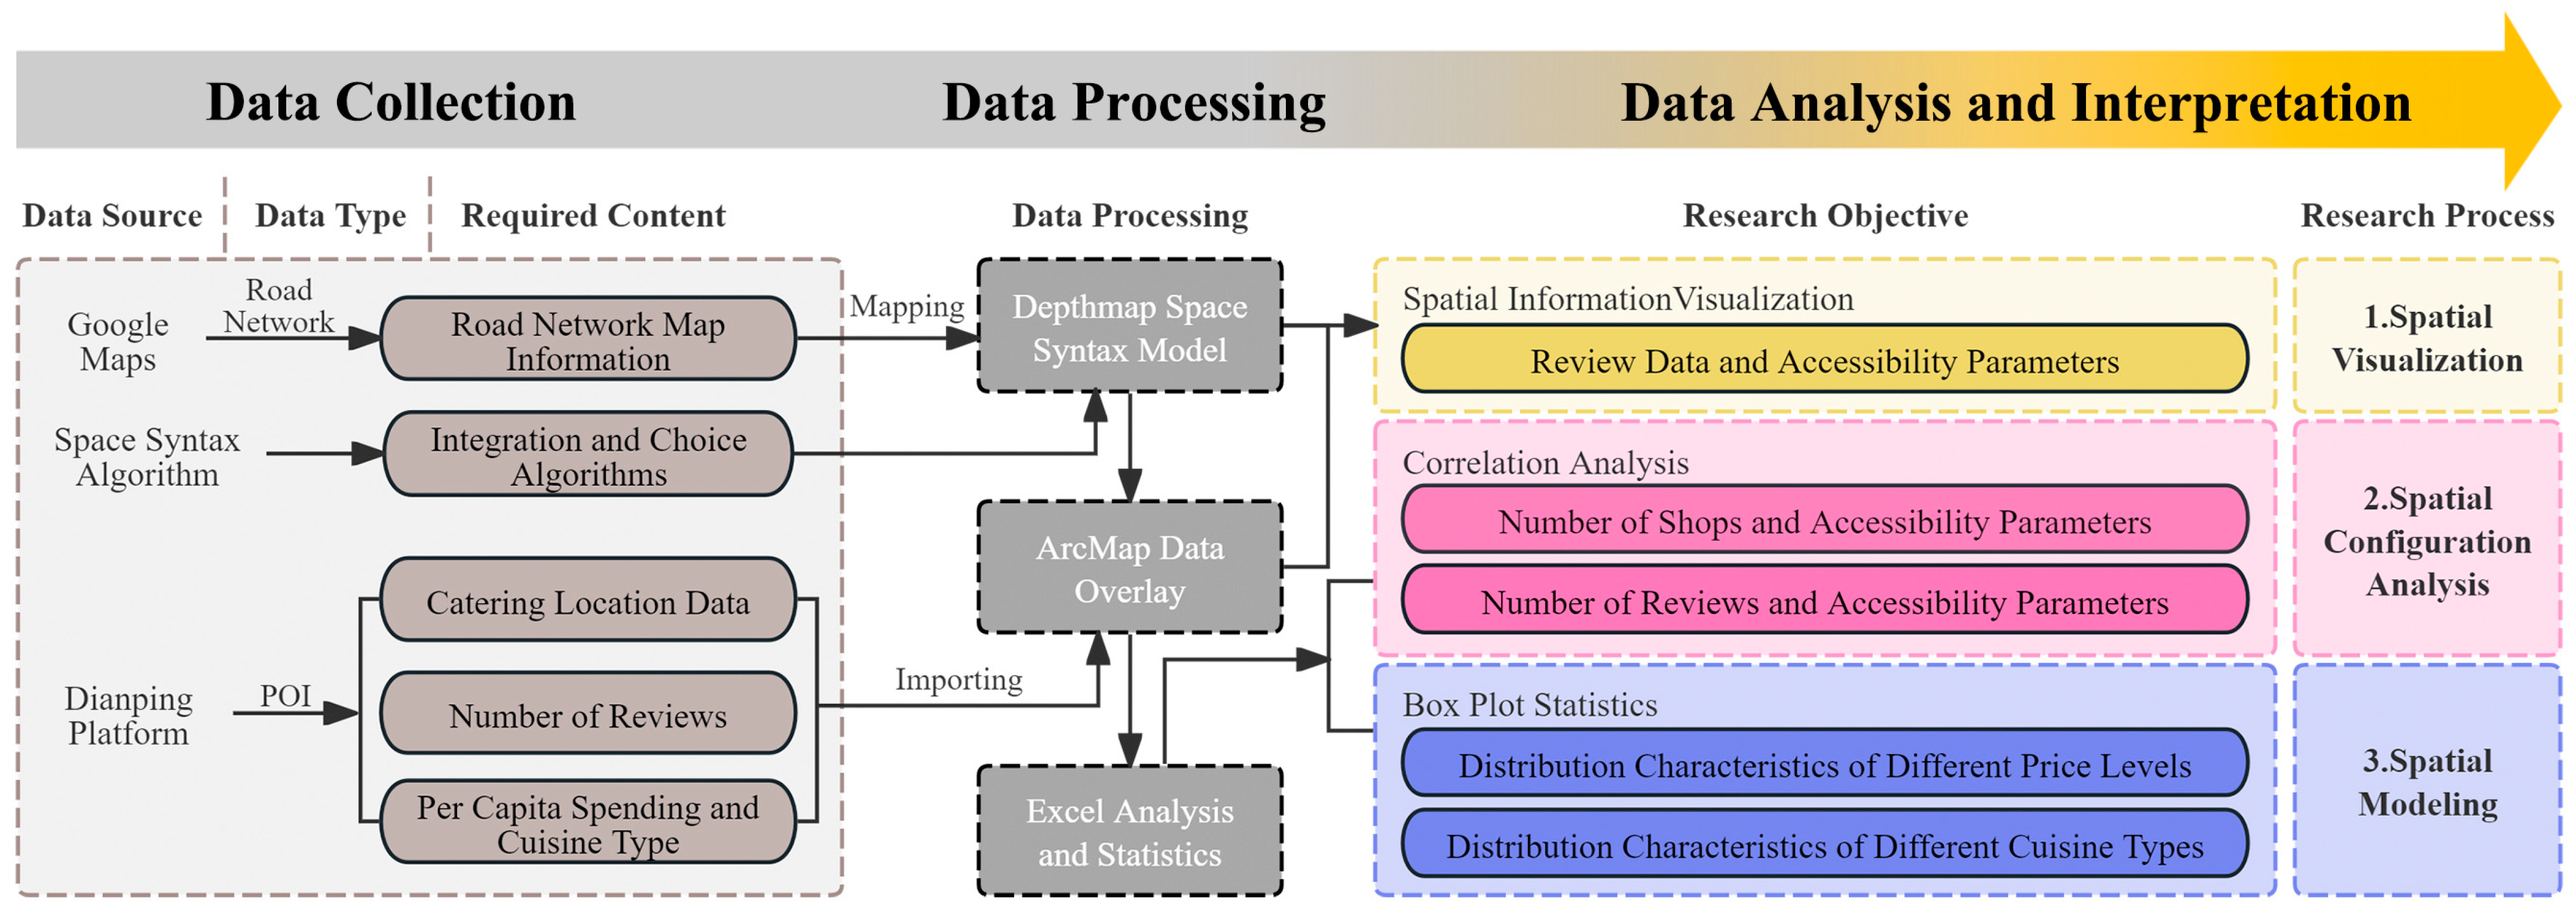
To implement the specific operations in the four-step framework, a technical workflow (
Figure 2) was established, consisting of three parts: data collection, processing, and analysis and interpretation.
Specific Procedures:
Data Collection: Using a screenshot of Google Maps Road networks as the base map, spatial syntax axial maps were drawn in AutoCAD 2022 (Autodesk, San Rafael, CA, USA) software to prepare for constructing the space syntax model. Catering industry Points of Interest (POI) data, including location information, review counts, average spending per person, and cuisine types, were scraped from the Dianping website. Based on a review of the relevant literature, suitable algorithms for integration, choice, and accessibility were selected to support the computations in the space syntax model.
Data Processing: First, the axial map was converted into a segment model using the space syntax computation software Depthmap+ Beta 1.0 (2012 version). The accessibility parameters for each street segment were calculated through algorithmic computations. Next, the segment model was overlaid and registered with the POI data on the GIS platform ArcMap, followed by data cleaning based on field surveys. Finally, the overlaid data were analyzed and statistically processed in Excel.
Data Analysis and Interpretation: Depthmap and ArcMap visualized the spatial information of the segment model’s accessibility parameters, POI data, and combined dataset. Correlation analysis of the overlaid data was conducted in Excel, and boxplots were used for descriptive statistics, supporting the development of spatial models and the validation of spatial theories.
In the final data analysis and interpretation stage, this study employs the four-step “form-function” framework to reveal the relationship between street morphology and catering distribution in the Macau Peninsula. This provides empirical evidence to understand the influence of urban structures on business distribution patterns.
2.1. Data Collection
2.1.1. Data Sources
Comprehensive and precise foundational data are critical for analyzing “form-function” relationship studies. This research utilizes Google Maps and Dianping as data sources. As a web-based mapping platform, Google Maps provides comprehensive and high-precision street information, suitable for accurate spatial morphology modeling. Dianping, having established a presence in Macau early on, offers extensive coverage of catering data, serving as a valuable supplement to official government datasets [
37]. Field surveys have verified that the volume and accuracy of Dianping’s data are suitable for this study after data cleaning. Based on these considerations, this study used the high-precision Google Maps road network screenshots as the base map to draw the street network of the Macau Special Administrative Region into an axial map in CAD software, constructing the space syntax model. Catering POI data were scraped from Dianping, including information as of September 2023 on restaurant names, locations, review counts, cuisine types, and average spending per person.
2.1.2. Study Area
The study area was selected based on the principles of representativeness in spatial morphology and functionality, as well as data analyzability. Accordingly, the catering activity centers of the Macau Peninsula were chosen as the research area to ensure an adequate data volume for analysis [
38] while encompassing diverse urban forms to comprehensively reflect the functionality of the catering industry within the city.
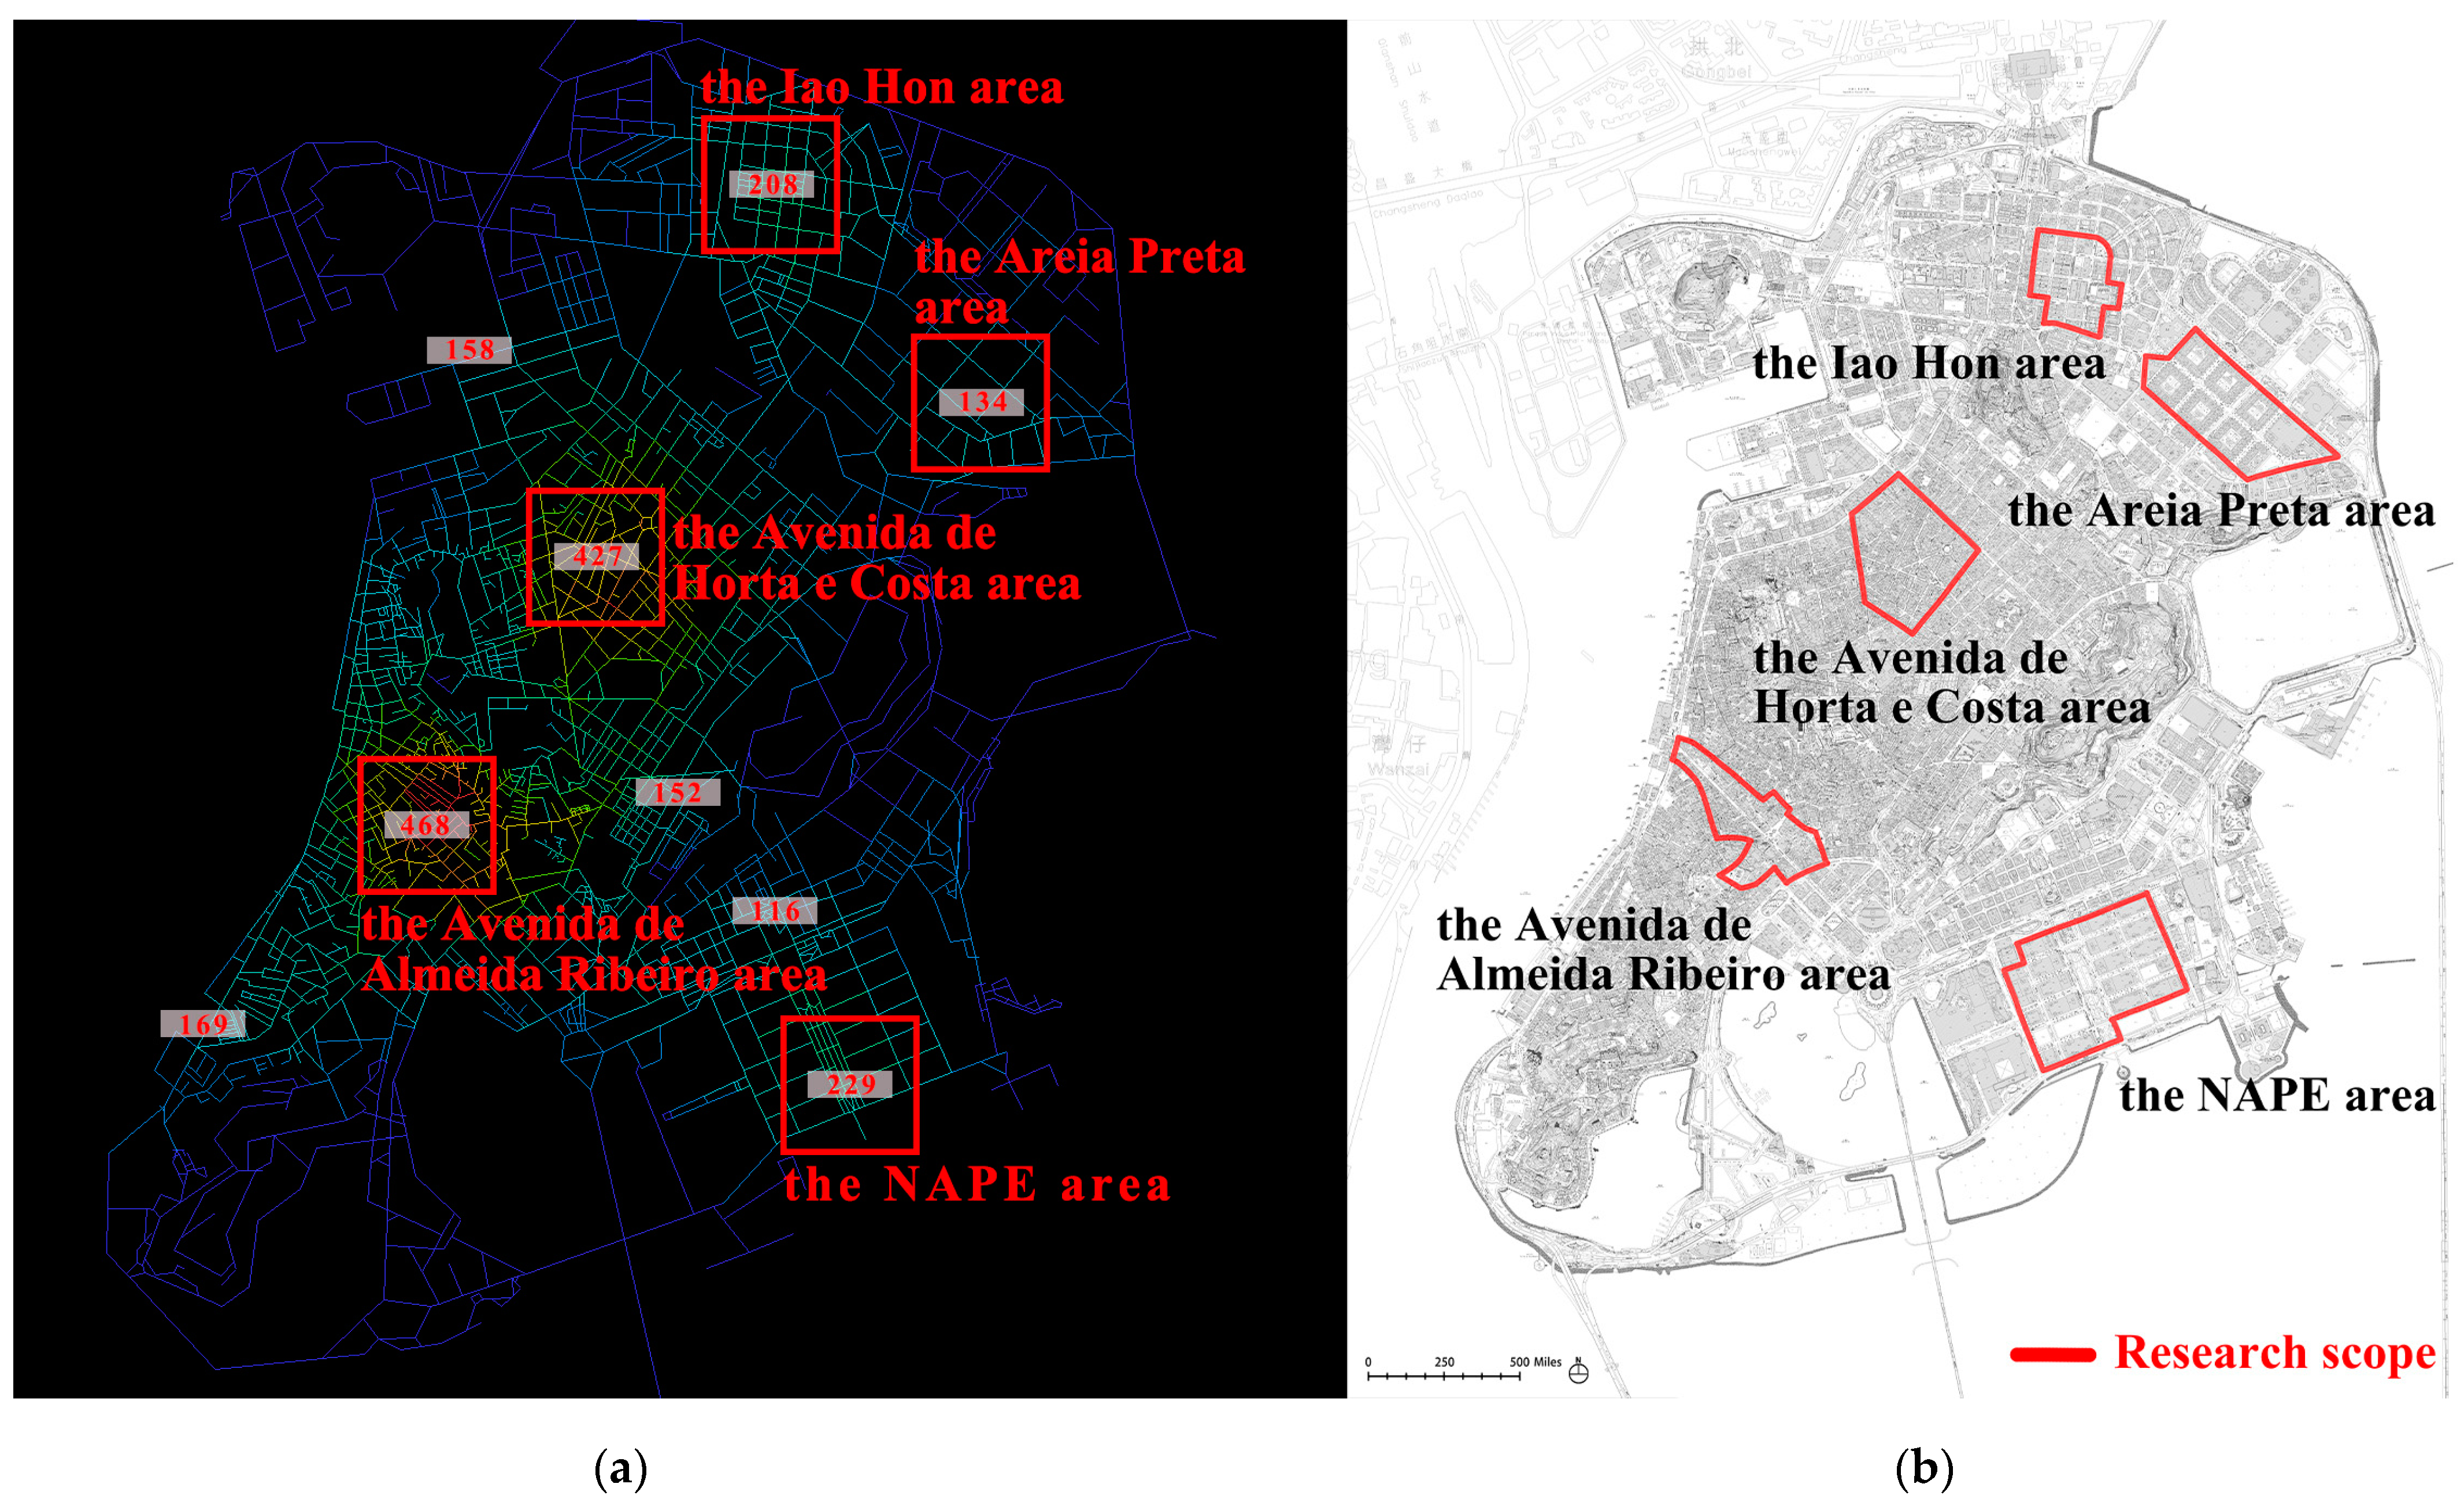
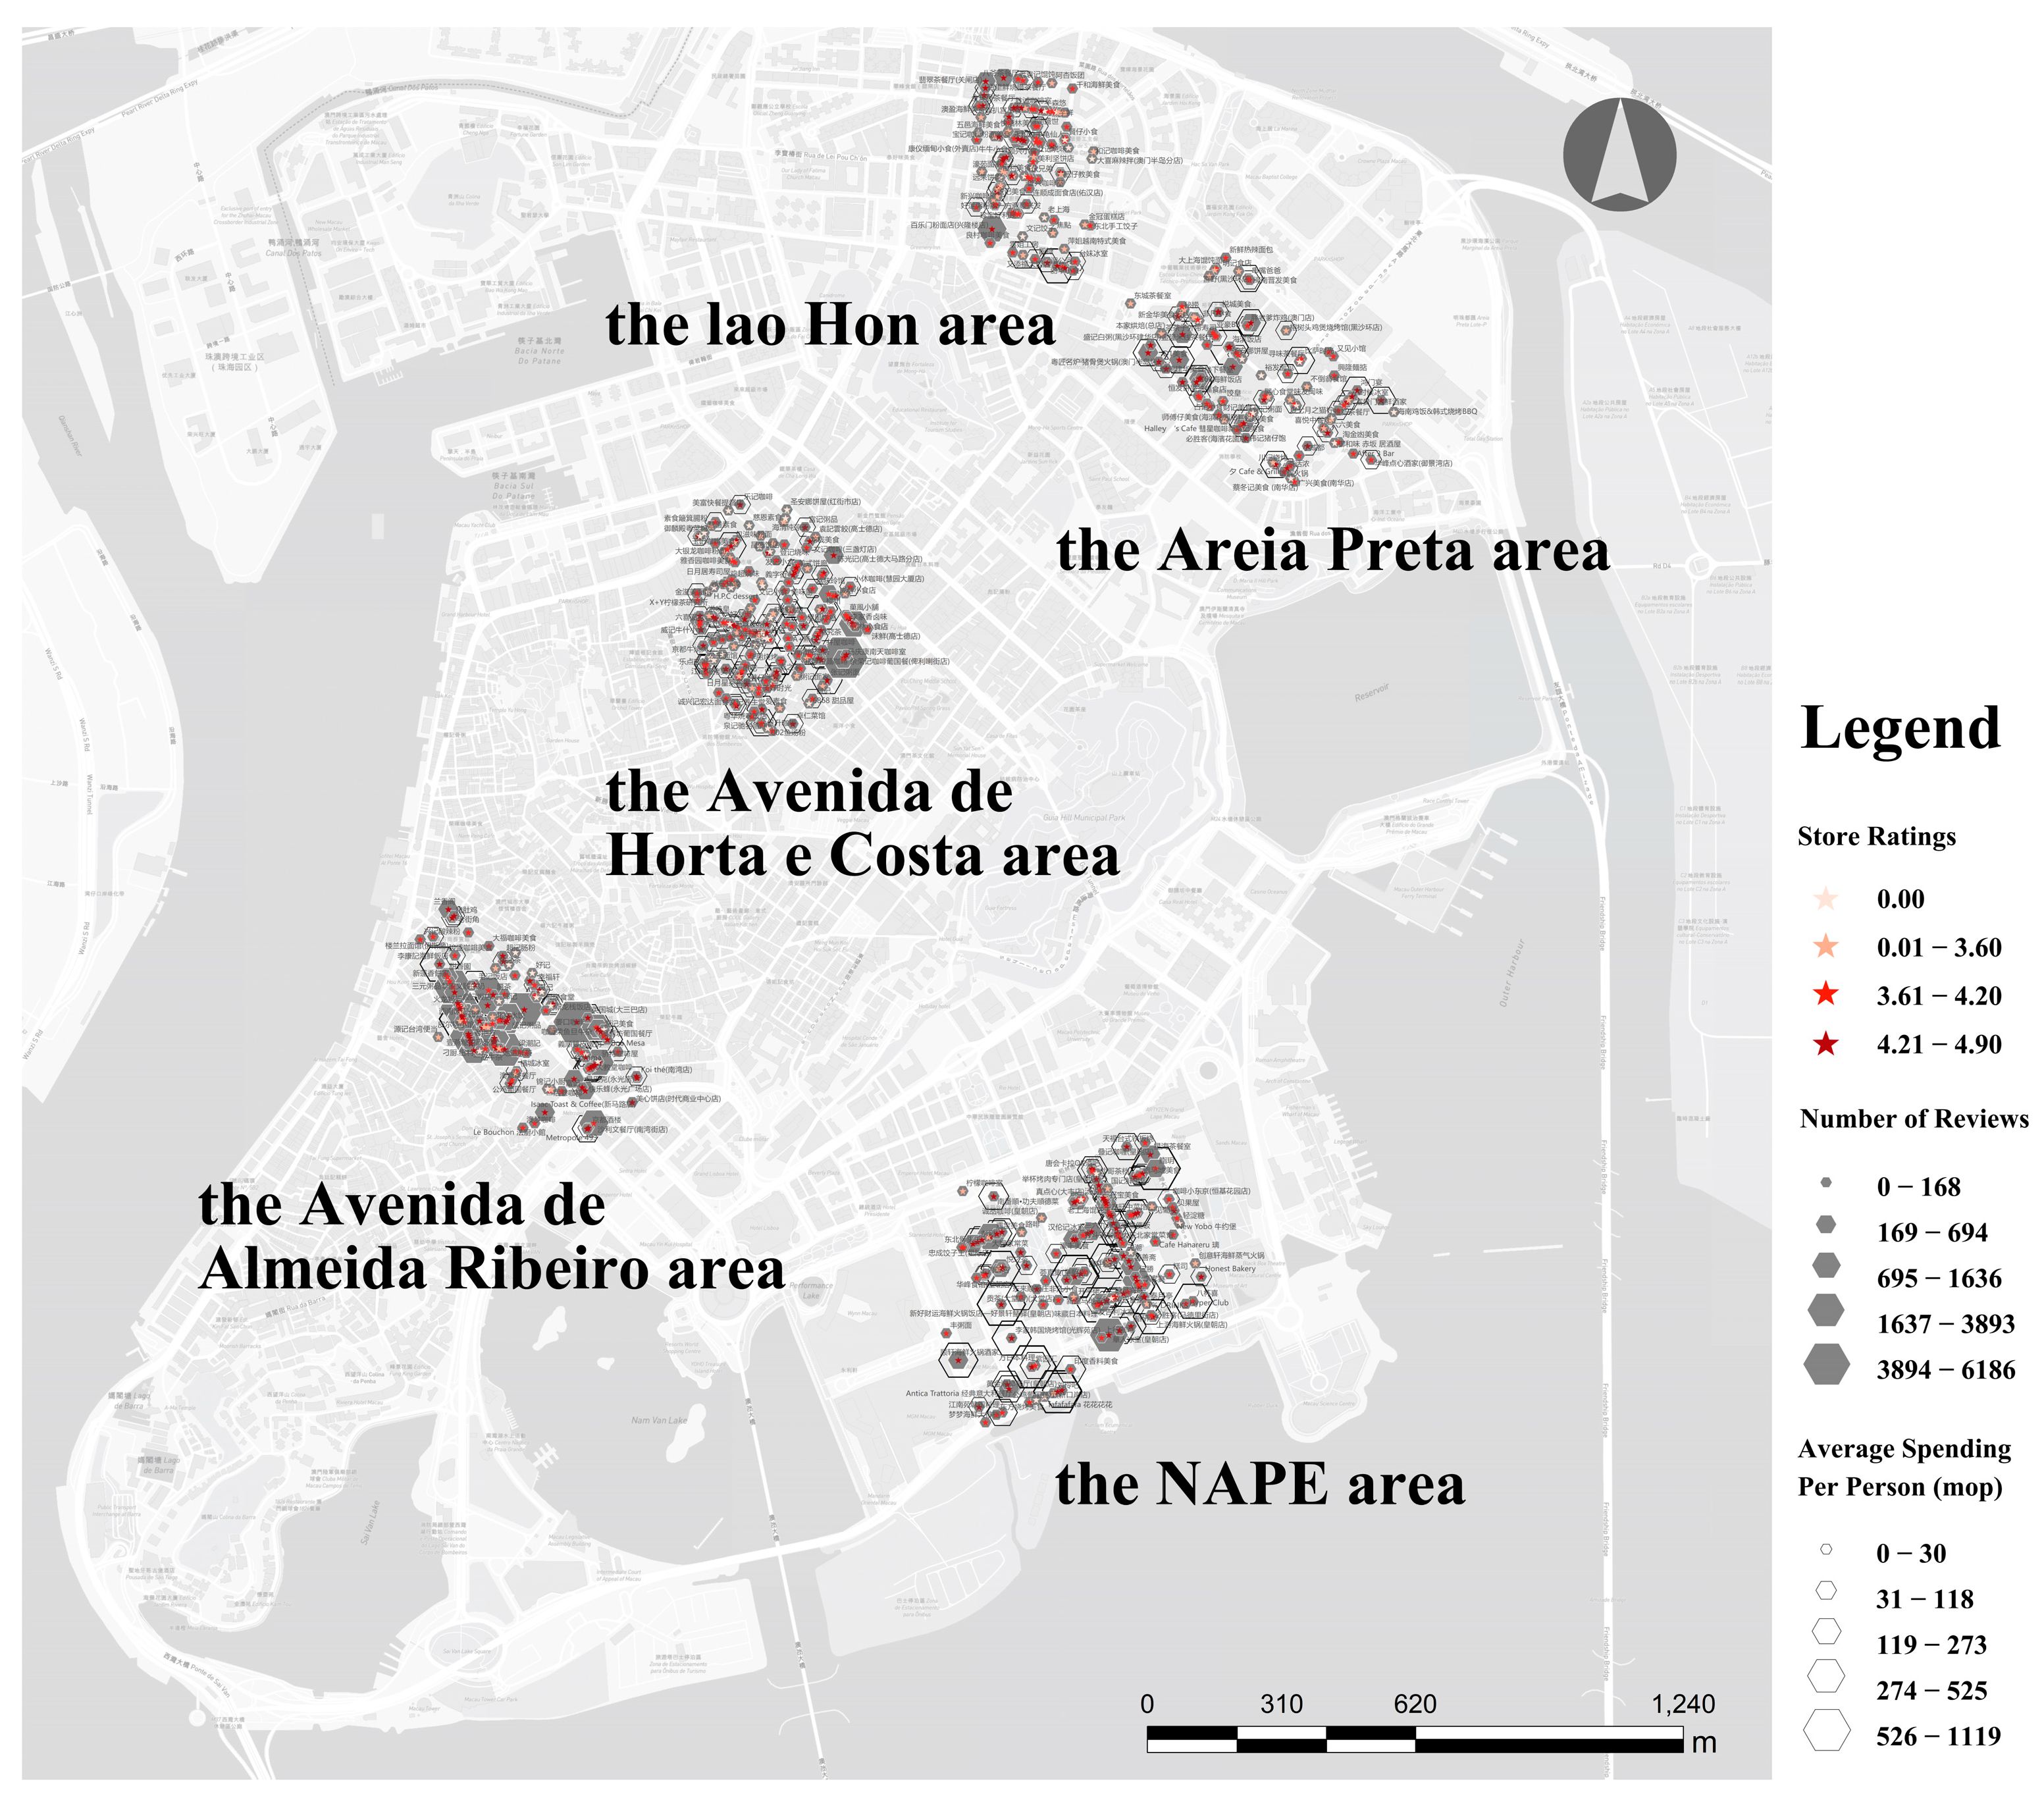
Specifically, catering activity centers were identified using proximity analysis and aggregation of catering establishment counts in ArcMap, which were then overlaid onto the space syntax segment model. Subsequently, Depthmap was utilized to calculate the number of restaurants within a 400 m radius of each street segment. Street segments with more than 100 restaurants were defined as catering activity centers (
Figure 3a).
After refining the identified centers, five areas with distinct urban morphologies were selected as the study objects (
Figure 3b). These include organically shaped areas within historic districts—the Avenida de Almeida Ribeiro area (abbreviated as Avenida de Almeida Ribeiro) and the Avenida Horta e Costa area (abbreviated as Costa)—as well as grid-patterned areas in modern reclamation zones, namely the Iao Hon area (Iao Hon), the Areia Preta area (Areia Preta), and the NAPE area (Zona Nova de Aterros do Porto Exterior) (NAPE). The division of these areas is based on the street network morphology characteristics of the Macau Peninsula [
32,
33,
34].
2.2. Data Processing
2.2.1. Space Syntax Model Construction and Parameter Selection
Space syntax is a topological geometric method for measuring urban street connectivity. It can perform calculations across multiple scales. This study selects appropriate models, parameters, and calculation scales based on the research objectives.
This study adopts the segment model for model and parameter selection, which is widely recognized for its suitability in fine-grained analysis of urban activities and commonly used parameters. The specific steps are as follows: using a screenshot of Google Maps road network as the base map, the street network of the Macau Special Administrative Region was drawn as a space syntax axial map in CAD software. The axial map was then processed into a segment model using Depthmap+ Beta 1.0 (2012 version), covering 6017 valid street segments. Accessibility parameters frequently used in recent space syntax segment model analyses were calculated, including angular integration (Integration), angular choice (Choice), normalized angular integration (NAIN), and normalized angular choice (NACH) [
39]. These parameters were used to assess the centrality and accessibility of streets, providing a quantitative description of urban spatial morphology.
For calculation scales, this study selected 300, 600, 900, and 1200 m for travel on foot and 1200, 1500, 2000, 5000, and 10,000 m or more excellent for travel by car. These scales correspond to the average measured travel times and distances based on field surveys in Macau (
Table 1).
2.2.2. Dianping Data Cleaning and Integration
To achieve high-precision business analysis at the street segment level, ensuring the accurate alignment of Points of Interest (POI) data with street segments is crucial, making data acquisition and cleaning methods particularly critical.
This study collected and cleaned catering data for Iao Hon, Areia Preta, NAPE, Avenida de Almeida Ribeiro, and Costa. The steps were as follows: Data from the Macau Peninsula’s Dianping platform as of September 2023 were obtained using Loco Spider, including information on restaurant names, locations, review counts, cuisine types, and average spending per person. The geographic locations of the restaurants were matched using ArcMap10.8, and field surveys were conducted to clean and refine the data. Restaurants located inside shopping centers, casinos, and resorts were excluded, as this study focuses on street-side restaurants. Only those with visible signage within a two-story height range on both sides of the street were retained. Finally, the points of interest (POIs) were further adjusted to ensure accurate alignment with the entrances of the restaurants on street segments, maintaining the high precision required for this study.
The final validated dataset comprised 113 establishments in Iao Hon, 101 in Areia Preta, 145 in NAPE, 126 in Avenida de Almeida Ribeiro, and 191 in Costa. These represent 80.1% (113/141) of the eligible businesses recorded during the field survey in Iao Hon, 75.9% (101/133) in Areia Preta, 92.4% (145/157) in NAPE, 79.7% (126/158) in Avenida de Almeida Ribeiro, and 74.9% (191/255) in Costa. This sample proportion ensures that a significant share of eligible businesses in each area was included, providing a solid data foundation for analysis.
2.2.3. Data Overlay and Normalized Scale Processing
Quantitative analysis of the “form-function” relationship relies on the data overlay capabilities of ArcMap and Depthmap to ensure consistency and analyzability of spatial morphology and functional data. Additionally, the Normalized Scale method proposed by Sheng et al. [
2] effectively reduces numerical differences between adjacent spatial units, eliminating the interference of incidental factors within the spatial system.
The steps are as follows: First, spatial syntax models and Dianping data were georeferenced and cleaned using ArcMap, and catering data for each street segment were aggregated. Then, in Depthmap, Normalized Scale processing was applied to the Dianping data using integrated accessibility (distance decay) and visibility (angular decay). This process involved summing the catering attributes of surrounding street segments within a specified range based on distance and angular decay patterns to each target street segment, producing normalized Dianping data. Finally, the processed data were logarithmically transformed to prepare for subsequent correlation analysis.
2.3. Data Analysis and Interpretation
This section systematically analyzes and interprets the data using the four-step “form-function” framework to reveal the relationship between street morphology and catering distribution in the Macau Peninsula. It provides empirical support for understanding the influence of urban structures on business distribution patterns.
2.3.1. Spatial Visualization: Visual Analysis of Syntax Parameters and Dianping Data
Spatial visualization allows for observing spatial accessibility characteristics under different street patterns and the operational and distribution characteristics of the catering industry from a macro-level perspective, including urban and neighborhood scales. This process identifies urban structural centers and reveals catering clustering patterns in different regions, providing strong evidence for exploring the relationship between street accessibility and catering spatial distribution. Specifically, this study employs Depthmap and ArcMap to visualize the accessibility parameters of the segment model and the Dianping data, offering a macro-level view of the spatial distribution characteristics of the catering industry across regions.
2.3.2. Spatial Configuration Analysis: Correlation Analysis of Syntax Parameters and Catering Distribution
Spatial configuration analysis is a core step in quantitatively describing the “form-function” relationship. Correlation and multiple regression analyses are commonly employed to reveal the relationships between single or multiple variables and spatial morphology. This study quantifies the relationship between street network structures and the vibrancy of the catering industry by analyzing the correlations between accessibility parameters derived from the space syntax segment model and Dianping data parameters. Line graphs statistically present the spatial configuration relationship between “morphology” and “function”.
Specific steps include exporting the normalized and logarithmically transformed Dianping data (e.g., the number of establishments and reviews) and the computed space syntax parameters (e.g., Integration, log Choice, NACH, and NAIN at various scales) from Depthmap. Correlation analysis was then performed in Excel to derive correlation coefficients. Line graphs were used to statistically present the correlation coefficients, illustrating the data distribution and highlighting the associations between catering parameters and street morphology under different calculation scales and space syntax parameters.
2.3.3. Spatial Modeling: Descriptive Statistics of Accessibility for Different Types of Catering
Spatial modeling builds upon spatial configuration analysis to further describe and reveal the “form-function” relationship. The objective is to summarize empirical results, establish general patterns, and construct models to support the development and refinement of spatial theories. In this study, boxplots describe the distribution characteristics of different types of catering establishments (e.g., fast food, restaurants, and bars) at both pedestrian and vehicular travel scales.
Specific steps include organizing the catering POI data in Excel, including the space syntax accessibility parameters of the POIs and their corresponding street segments. The catering POIs are classified based on pricing tiers and cuisine types. This analysis focuses on two relatively stable space syntax parameters: NACH at 600 m (reflecting local accessibility within walking range) and NACH at 10,000 m (reflecting urban accessibility within vehicular range). These parameters have strong explanatory power across spatial scales and effectively measure the street network’s support for different types of catering establishments. Boxplots are then used to present descriptive statistics, with interquartile ranges (IQR) visually illustrating the accessibility characteristics of various types of restaurants under pedestrian and vehicular travel scales. This provides deeper insights into the relationship between the accessibility of catering establishments and the street network structure.
Classifying different types of catering establishments is an important yet complex part of this study. Catering establishments were classified based on the characteristics of Macau’s local catering industry and drawing on previous studies [
4,
29,
38]. Pricing tiers were divided into five categories (high, upper-middle, middle, lower-middle, and low) based on average spending per person, considering the dining consumption levels in Macau and Dianping’s data, as summarized in
Table 2. Cuisine categories were primarily based on Dianping’s classifications and the Macau Statistics and Census Service’s categorization, further adjusted to reflect the main dishes served. These were defined as “cuisine categories”. Additionally, factors such as regional characteristics, restaurant quality, and service speed were integrated to subdivide these cuisine categories further, resulting in “subcategories of cuisine”, as summarized in
Table 3.
3. Results
3.1. Spatial Visualization: Visualization Results of Syntax Parameters and Dianping Data
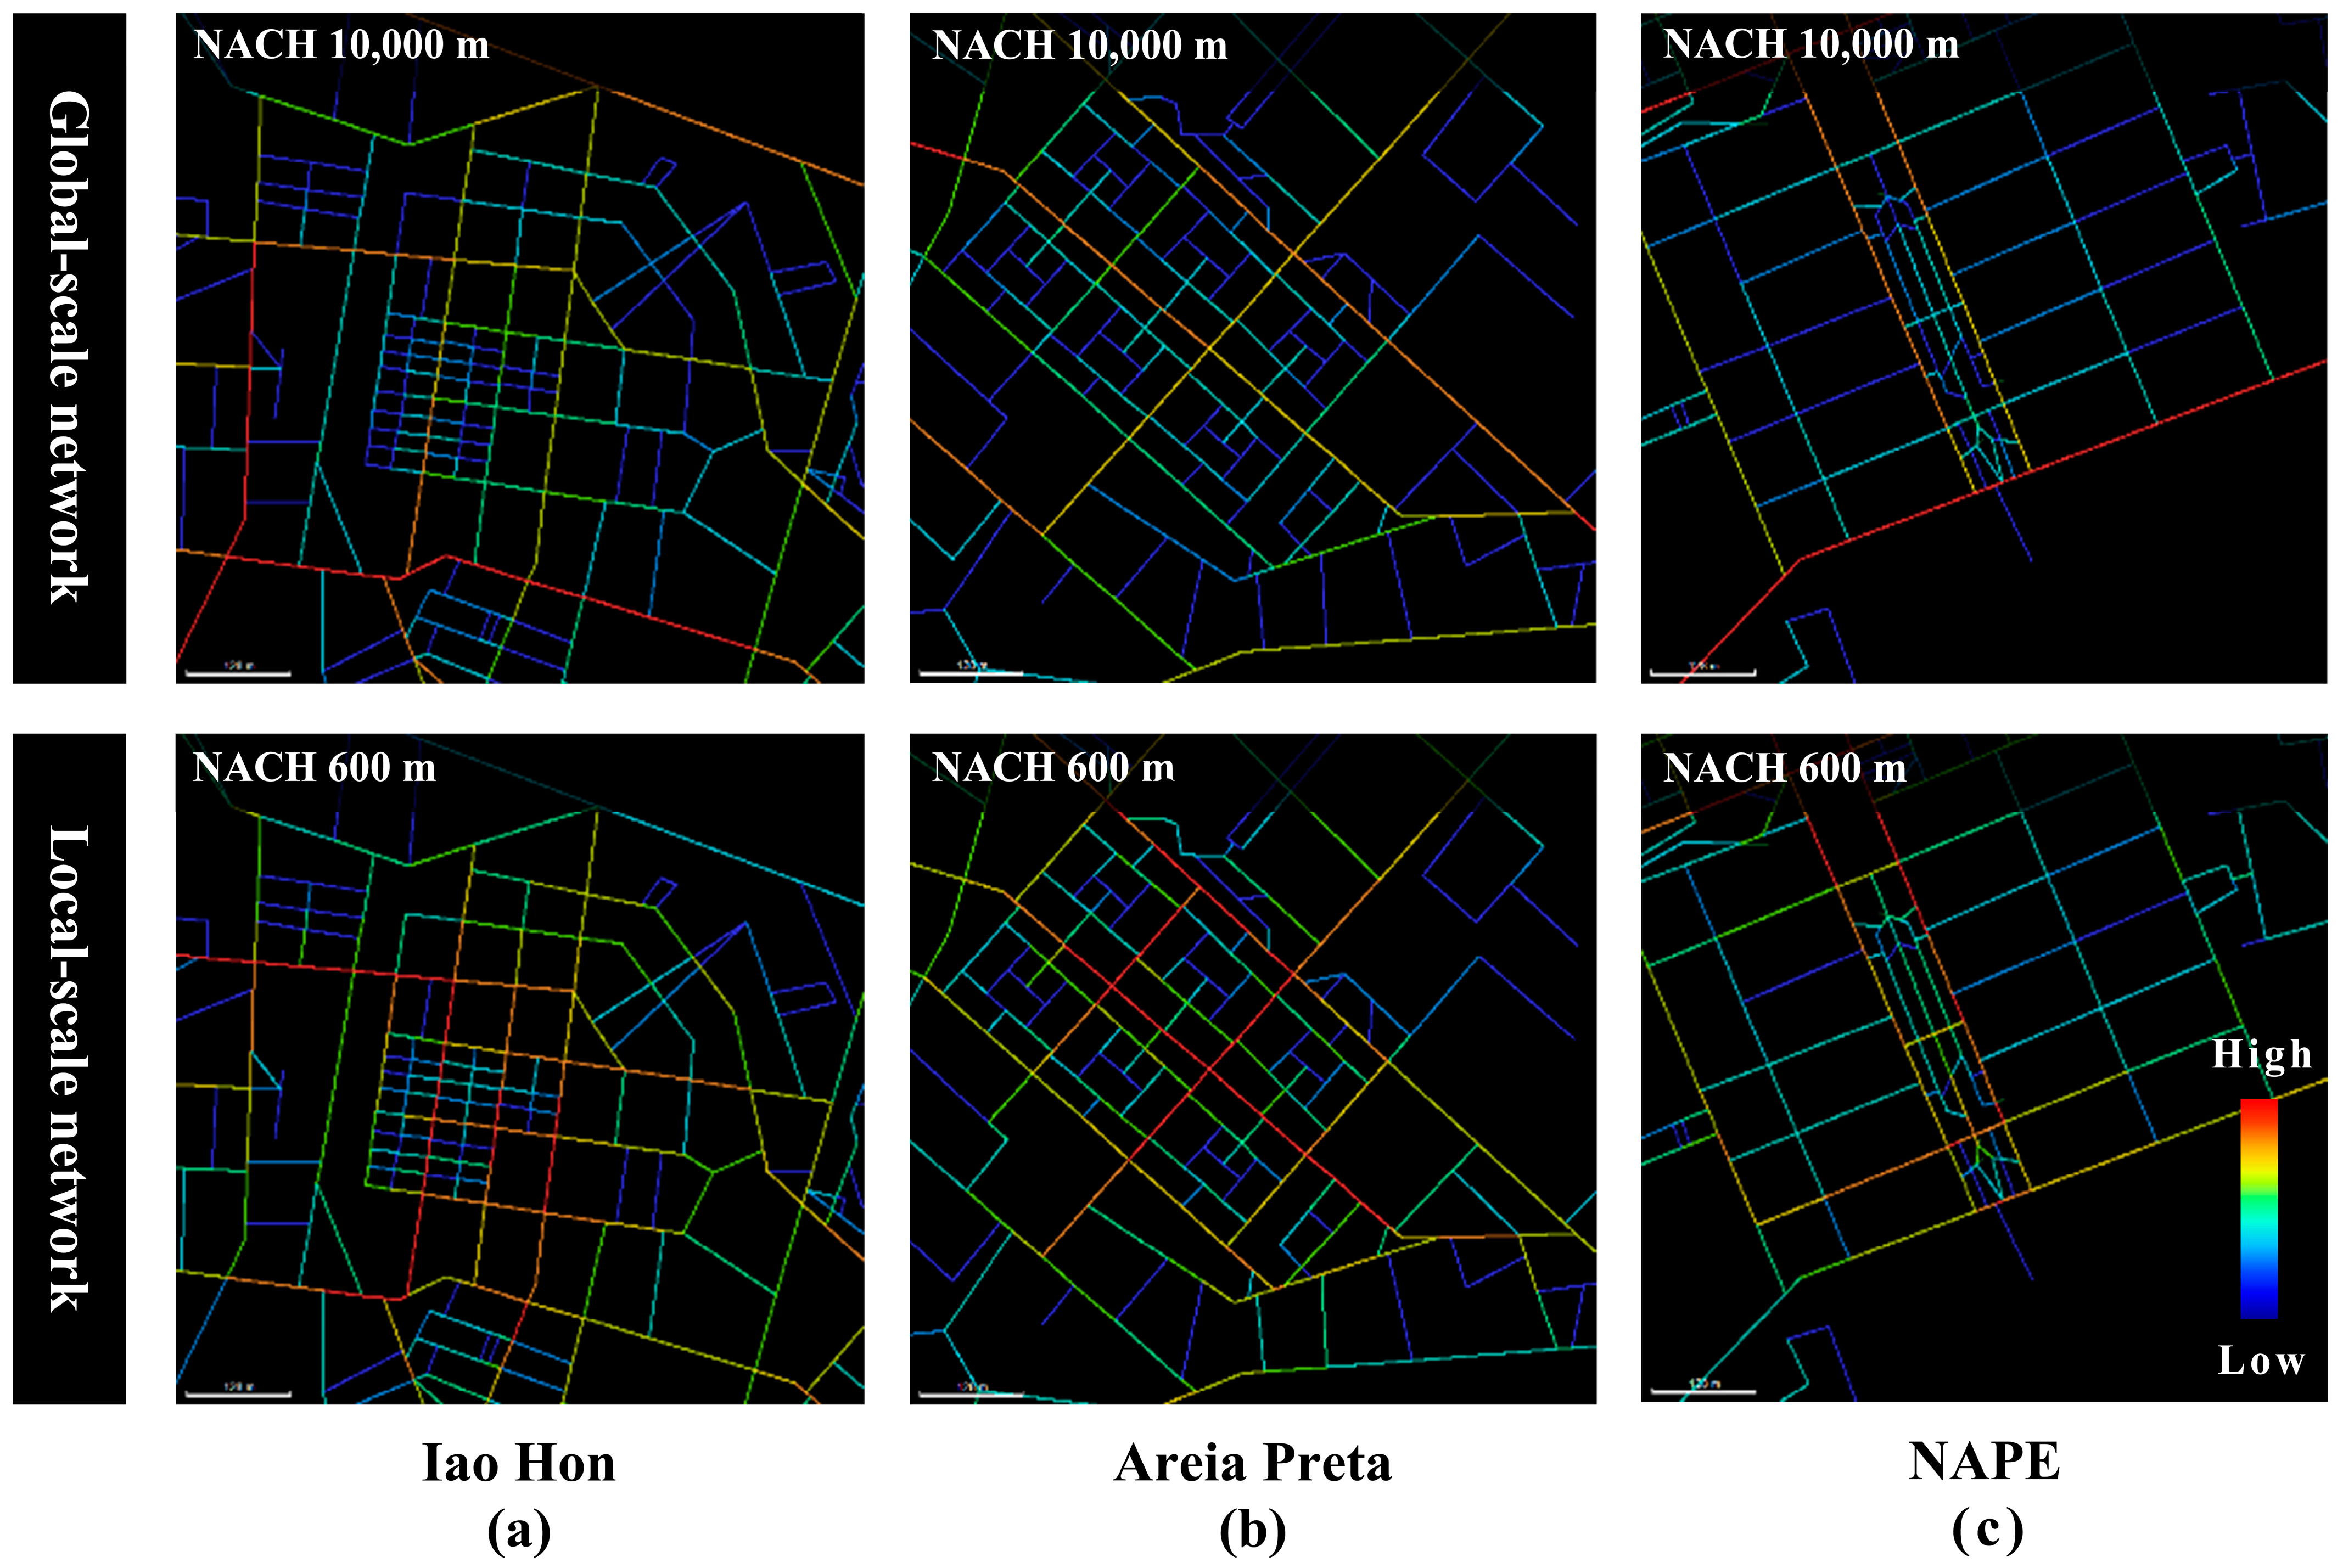
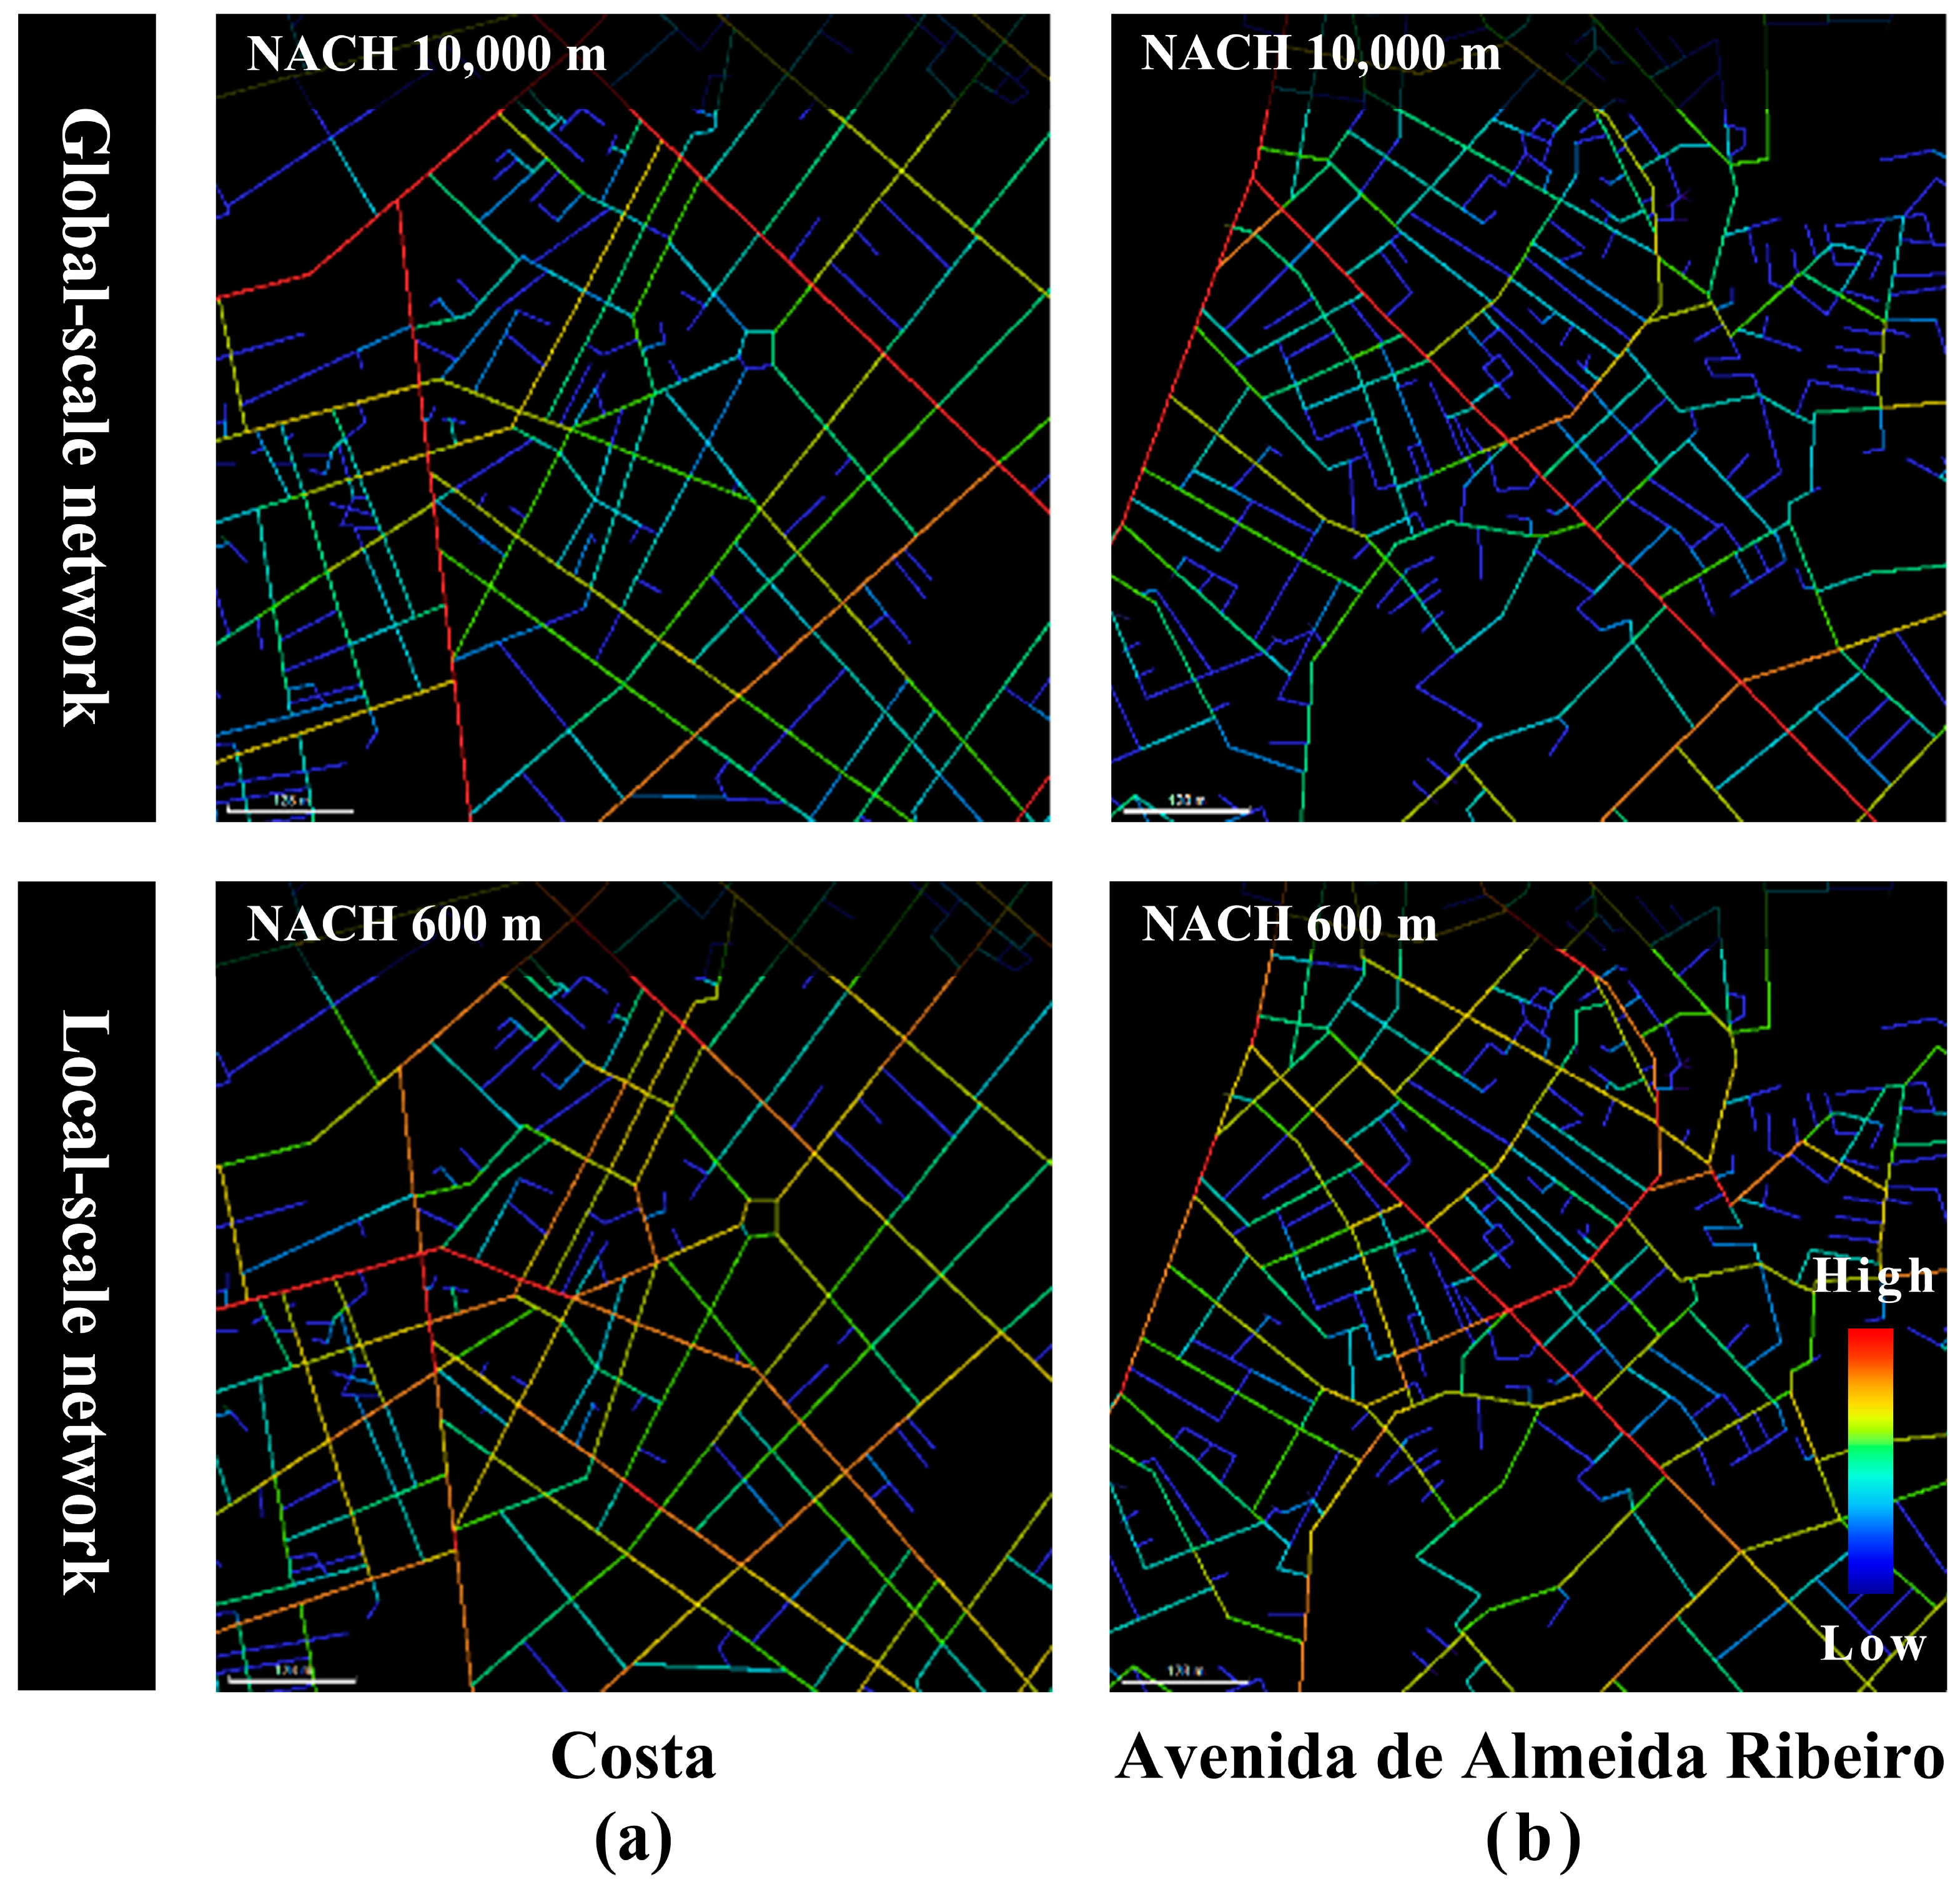
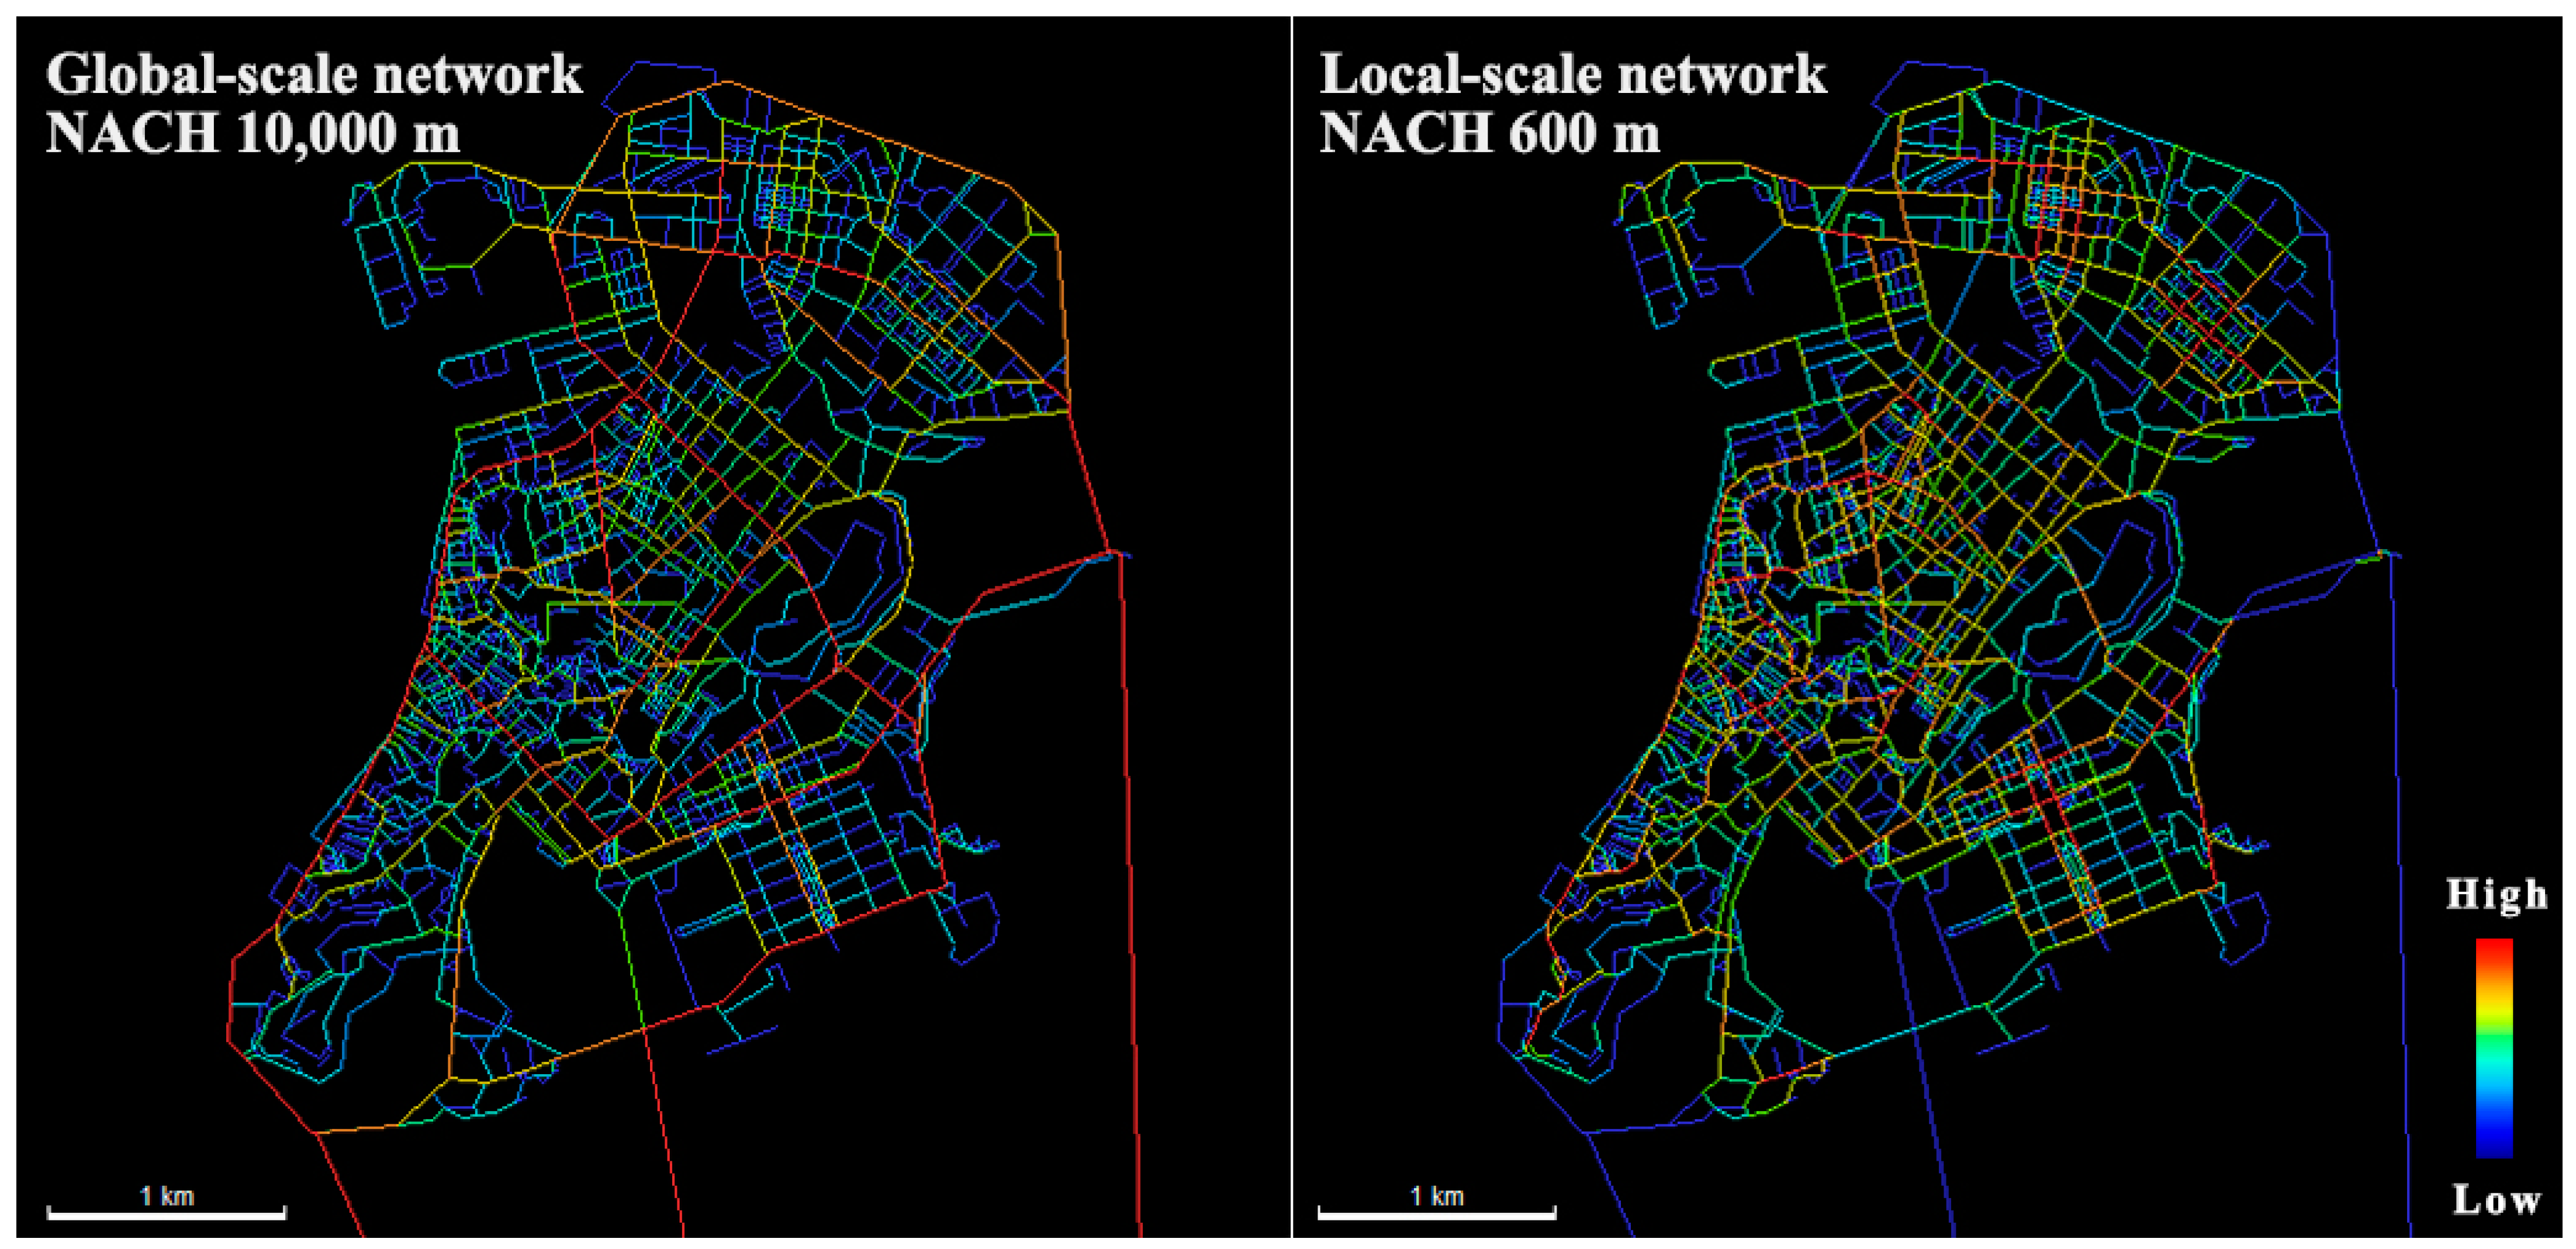
To visually illustrate the impact of different street morphologies on the spatial distribution characteristics of catering establishments, a comparative analysis was conducted between the hierarchical road networks and catering distributions in grid-patterned and organically shaped areas. The NACH10000m algorithm in space syntax was used to calculate the Macau Special Administrative Region segment model as an indicator of the urban-level network, or the global scale, reflecting vehicular accessibility at the urban scale and capturing the city’s overall spatial structure and street connectivity. The NACH600m algorithm was used for local-level network analysis, or the local scale, reflecting pedestrian accessibility at the walking scale and focusing on finer-grained street connectivity within short distances. These parameters provide a comprehensive understanding of accessibility at both global and local scales (
Figure 4,
Figure 5 and
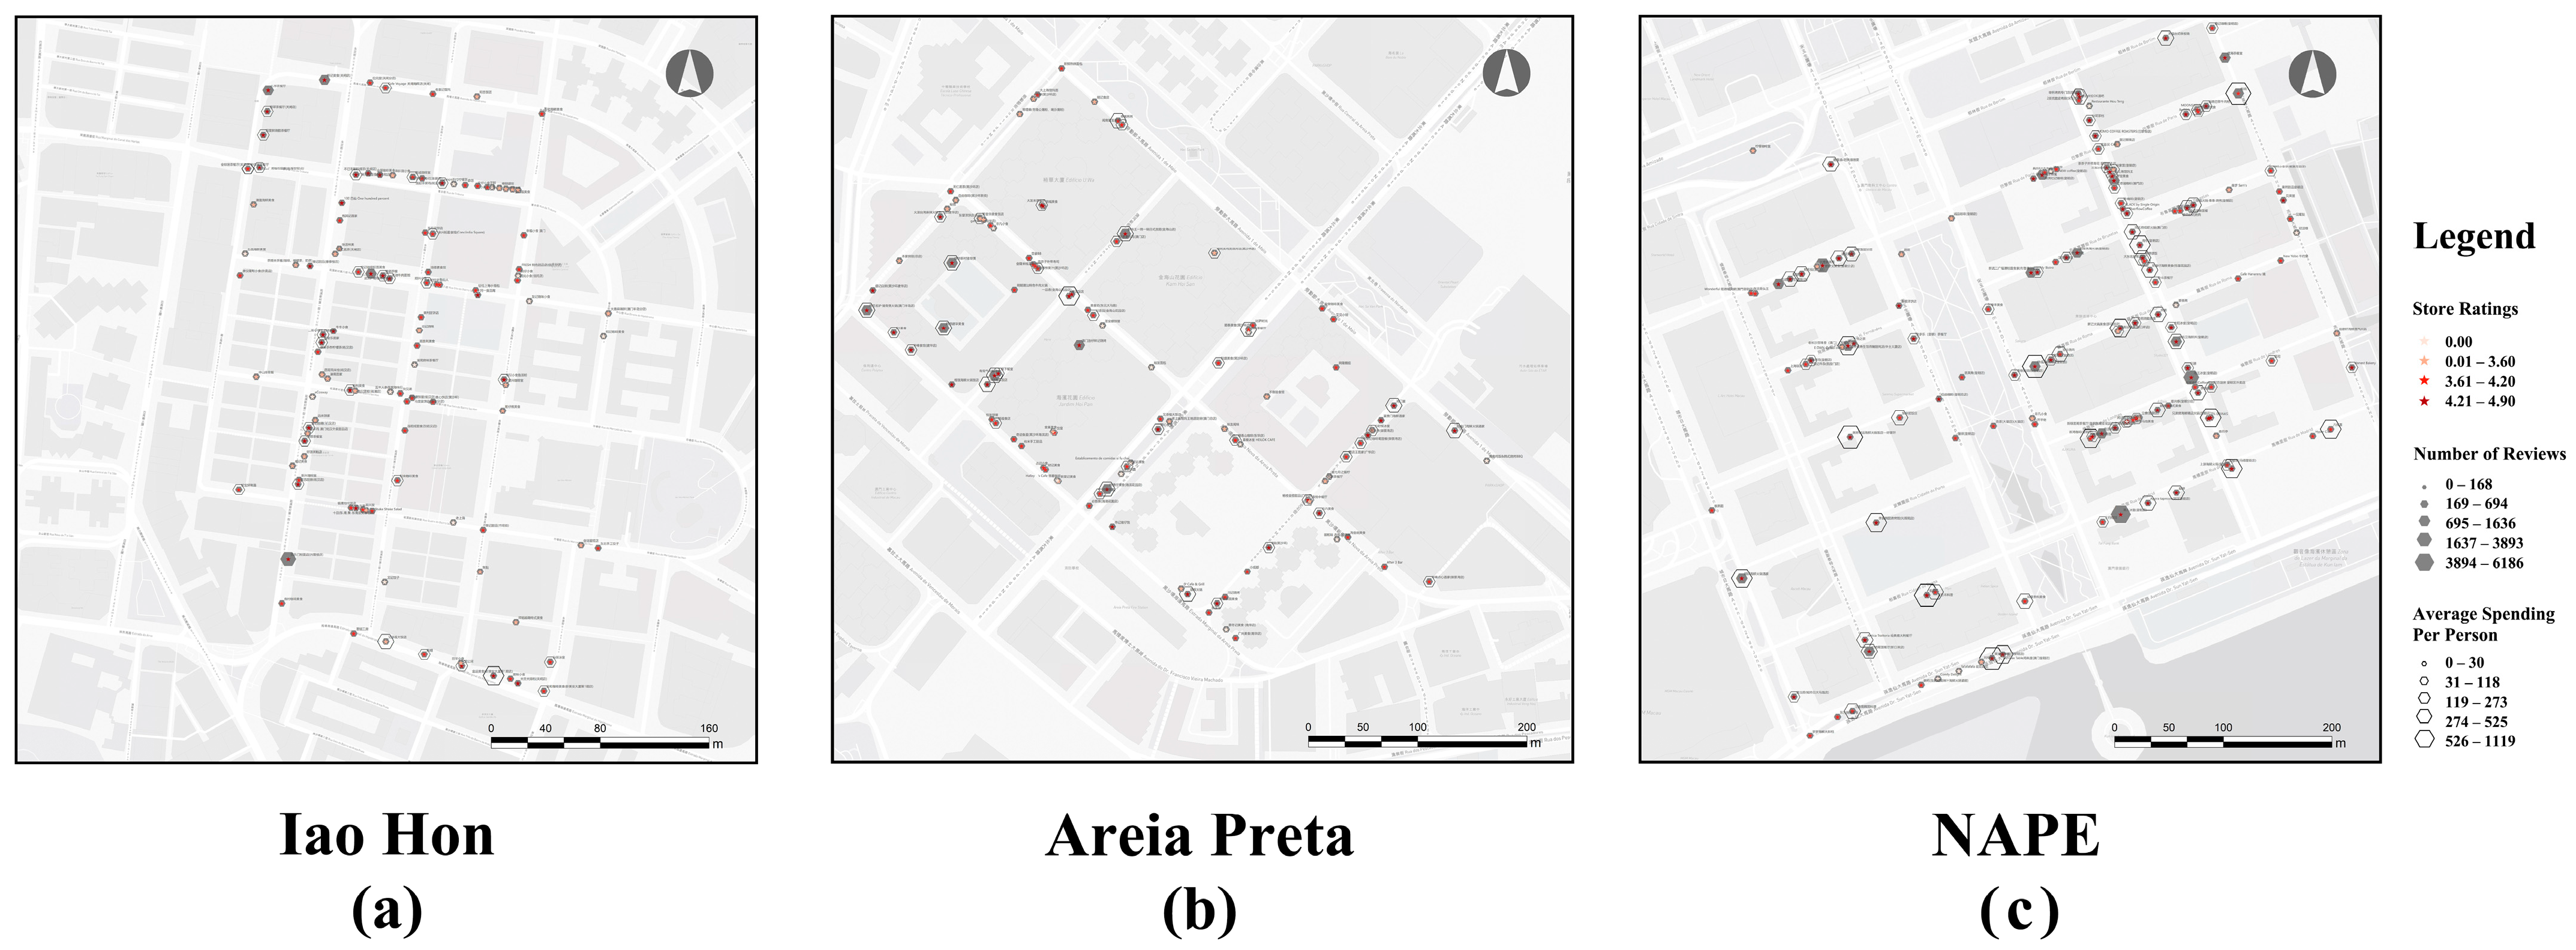
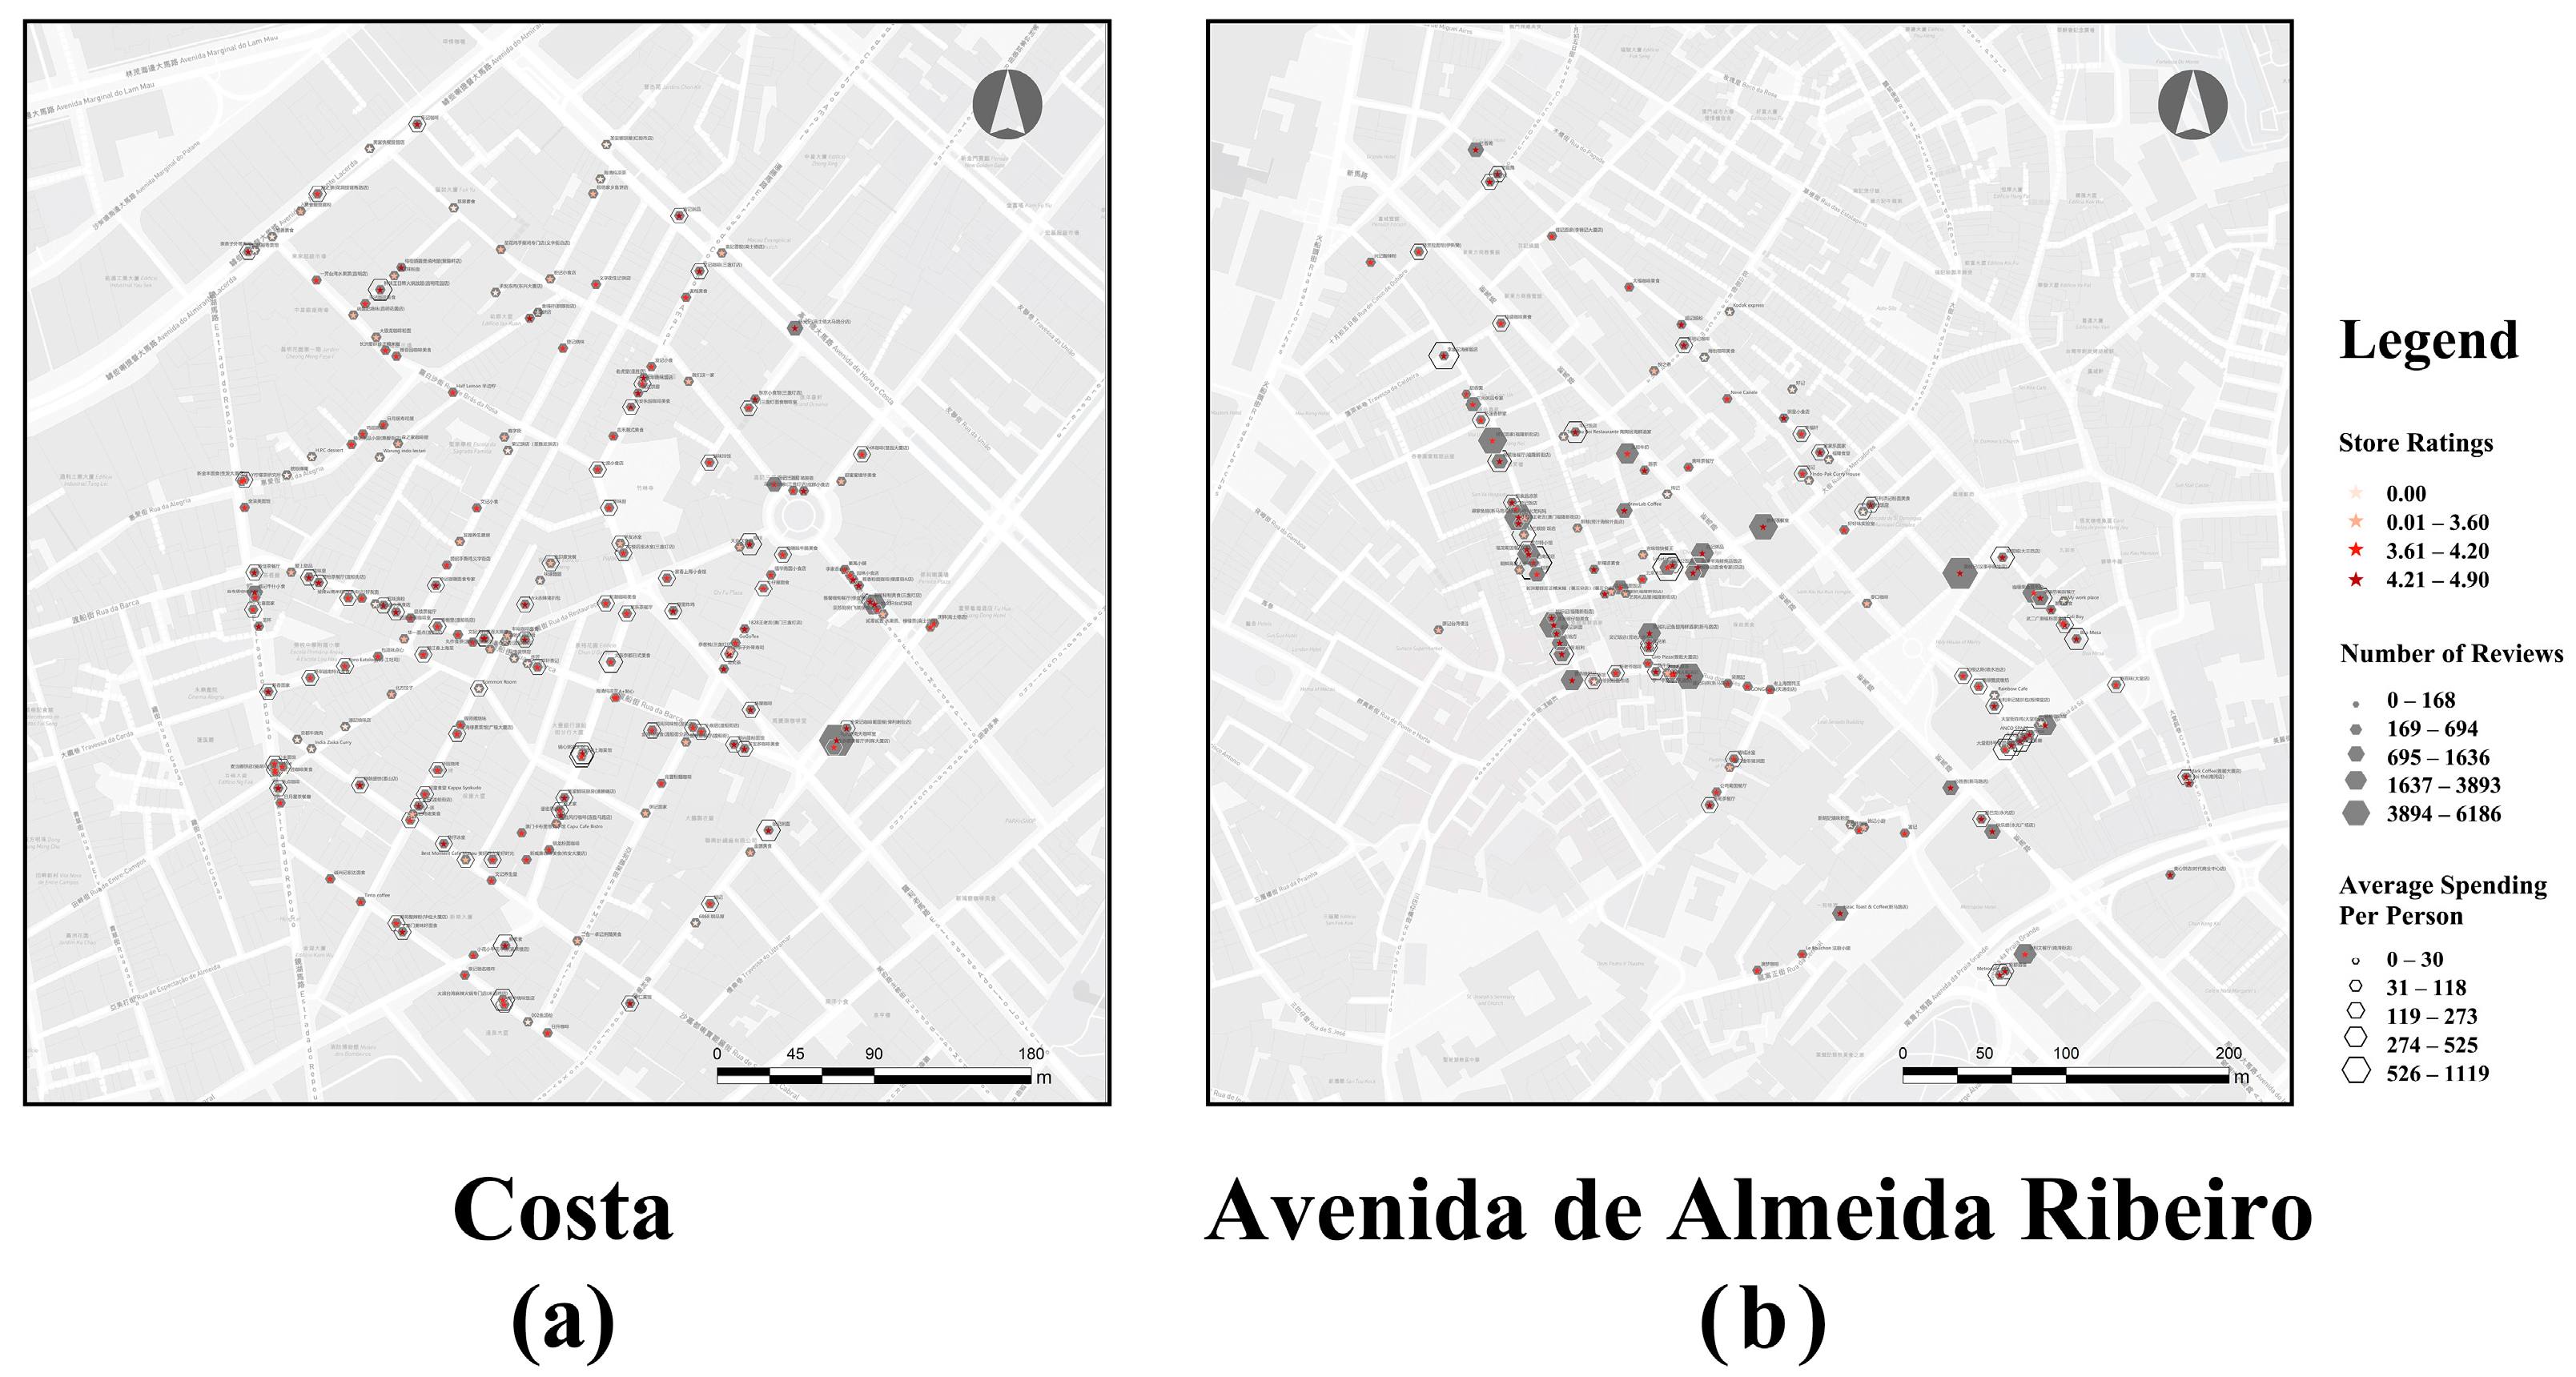
Figure 6). Meanwhile, catering data from the Dianping platform were visualized using ArcMap, with attributes such as the number of reviews, average spending per person, and rating stars displayed on the map (
Figure 7 and
Figure 8).
3.1.1. Visualization Analysis Results in Grid-Patterned Areas (Iao Hon, Areia Preta, and NAPE)
In the Iao Hon area, streets with high global-scale network accessibility include main roads connecting various parts of the city, such as Avenida do Hipódromo. Streets with high local-scale network accessibility are key streets within the area, such as Rua Um do Bairro Iao Hon (
Figure 4a). Restaurants are concentrated along Rua da Tribuna, Rua Seis do Bairro Iao Hon, and the southern section of Rua Um do Bairro Iao Hon (
Figure 7a). A comparison reveals that the distribution of restaurants highly overlaps with streets of high local-scale network accessibility, though certain deviations are present.
The distribution of restaurants in the Areia Preta area follows a similar pattern. Streets with high local-scale network accessibility include Rua Nova da Areia Preta and Avenida do Nordeste (
Figure 4b). At the same time, restaurants are concentrated along slightly offset streets such as Avenida Marginal da Areia Preta (
Figure 7b).
The distribution pattern of restaurants in the NAPE area differs significantly from the previous two areas. Streets with high global-scale network accessibility include Avenida Dr. Sun Yat-Sen and Avenida da Amizade, while streets with high local-scale network accessibility are those flanking Parque Dr. Carlos d’Assumpção and Jardim Comendador Ho Yin (
Figure 4c). However, restaurants are primarily concentrated along Avenida do Governador Jaime Silvério Marques (
Figure 7c), with no apparent correlation to streets of high global or local-scale network accessibility.
3.1.2. Spatial Visualization Analysis Results in Organically Shaped Areas (The Avenida de Horta e Costa Area and the Avenida de Almeida Ribeiro Area)
In the Avenida de Horta e Costa area, streets with high urban-scale network accessibility include Avenida do Almirante Lacerda, Avenida de Horta e Costa, and Estrada do Repous (
Figure 5a). These significant roads connect various parts of the city and surround and encapsulate the local-scale network within the area. Streets with high local-scale network accessibility include Rua da Barca, the central section of Estrada do Repous, the southern section of Rua de Martinho Montenegro, and the northern section of Avenida de Horta e Costa.
The distribution of restaurants shows two distinct patterns: one type is concentrated along interconnected streets such as the central sections of Rua da Barca and Rua de Martinho Montenegro, Rua de Marques de Oliveira, and the southern section of Estrada de Coelho do Amaral; the other type forms dispersed clusters along streets such as Travessa do Bem-Estar, the section of Estrada de Adolfo Loureiro near the Bamboo Temple, the northern section of Rua de Manuel de Arriaga, and the southern section of Rua de Fernão Mendes Pinto (
Figure 8a).
Comparative analysis reveals that the former distribution closely overlaps with streets of high local-scale network accessibility. In contrast, the latter often occurs along streets with moderate to very low accessibility at both urban and local scales.
In the Avenida de Almeida Ribeiro area, streets with high urban-scale network accessibility include Avenida de Almeida Ribeiro and Rua do Visconde Paco de Arcos (
Figure 5b). The former serves as a major thoroughfare through the historic center of Macau, while the latter functions as an important ring road in the northern peninsula. Streets with high local-scale network accessibility include the central section of Avenida de Almeida Ribeiro and Rua dos Mercadores, which are interconnected. Notably, Rua dos Mercadores is part of an early “Rua Direita” system that connects the core of Macau’s historic center.
The distribution of restaurants also shows two patterns (
Figure 8b): one type, with higher review counts and average spending per person, is concentrated along Rua da Felicidade, Rua da Alfândega, the southern section of Rua dos Mercadores, as well as Rua de S. Domingos and Rua da Sé, which are interconnected. The other type, with lower review counts and average spending per person, is distributed along the narrow, vertical streets north of Avenida de Almeida Ribeiro, such as Travessa da Porta and Beco das Caixas.
Comparative analysis indicates that both types of restaurants are located along streets with moderate to low accessibility at both urban and local scales.
3.1.3. Spatial Visualization Analysis Results of the Macau Peninsula
The visualization analysis of the space syntax model clearly illustrates the urban-level and local-level networks of the Macau Peninsula (
Figure 6). The urban-level network consists of primary roads traversing Macau, peripheral roads encircling the peninsula, and cross-sea bridges, forming the core framework for overall urban traffic flow. The local-level network comprises secondary roads within regions, with streets of high local accessibility found in grid-patterned and organically shaped areas.
The model results indicate significant spatial overlap between high-accessibility centers within the local-level network and areas where restaurants are concentrated, highlighting the decisive guiding role of the local-level network in the spatial distribution of commercial activities. Meanwhile, the urban-level network is distributed around restaurant clusters, imposing certain constraints and segmentation on the spatial organization of these areas.
The spatial visualization results of Dianping review counts, average spending per person, and restaurant distribution in the five main areas of the Macau Peninsula reveal significant disparities in the catering industry’s spatial patterns across these regions.
Figure 9 shows that restaurant distribution in the Iao Hon area is strongly influenced by building morphology and block planning, with certain buildings creating physical barriers to commercial layouts. Low average spending levels and minimal review counts characterize this area. Similarly, the Areia Preta area displays a restaurant distribution shaped by its built environment and the functional characteristics of its industrial zones, resulting in moderate average spending levels and relatively low review counts.
In the NAPE area (Zona Nova de Aterros do Porto Exterior), restaurant distribution is notably dispersed, with significant spatial segregation effects induced by major arterial roads and parks. Higher average spending levels and moderate review counts mark this area. By contrast, the Avenida de Horta e Costa area (Costa) exhibits a relatively even distribution of restaurants, with both average spending levels and review counts falling within the moderate range. In the Avenida de Almeida Ribeiro area, however, restaurant distribution is highly polarized, with substantial differences in average spending levels and review counts between sub-regions, leading to notable spatial imbalances.
Further comparative analysis highlights that review counts and average spending levels do not directly correlate with urban morphology. Instead, they are more significantly shaped by functional zoning. For instance, industrial zones in the Areia Preta area and pawnshop clusters in the NAPE area impose explicit constraints on the spatial distribution of restaurants. Conversely, the vicinity of schools in the Iao Hon area fosters concentrated clusters of catering establishments due to high pedestrian traffic.
3.2. Spatial Configuration Analysis: Correlation Results Between Syntactic Parameters and Restaurant Distribution
To quantify the relationship between street network structures and the vibrancy of the catering industry, a correlation analysis was conducted using the accessibility parameters of the space syntax segment model and the Dianping data parameters. By examining four types of space syntax parameters across different radii, the distribution patterns of restaurants in grid-patterned areas (the Iao Hon area, the Areia Preta area, and the NAPE area) and organically shaped areas (the Avenida de Almeida Ribeiro area and the Avenida de Horta e Costa area) were compared.
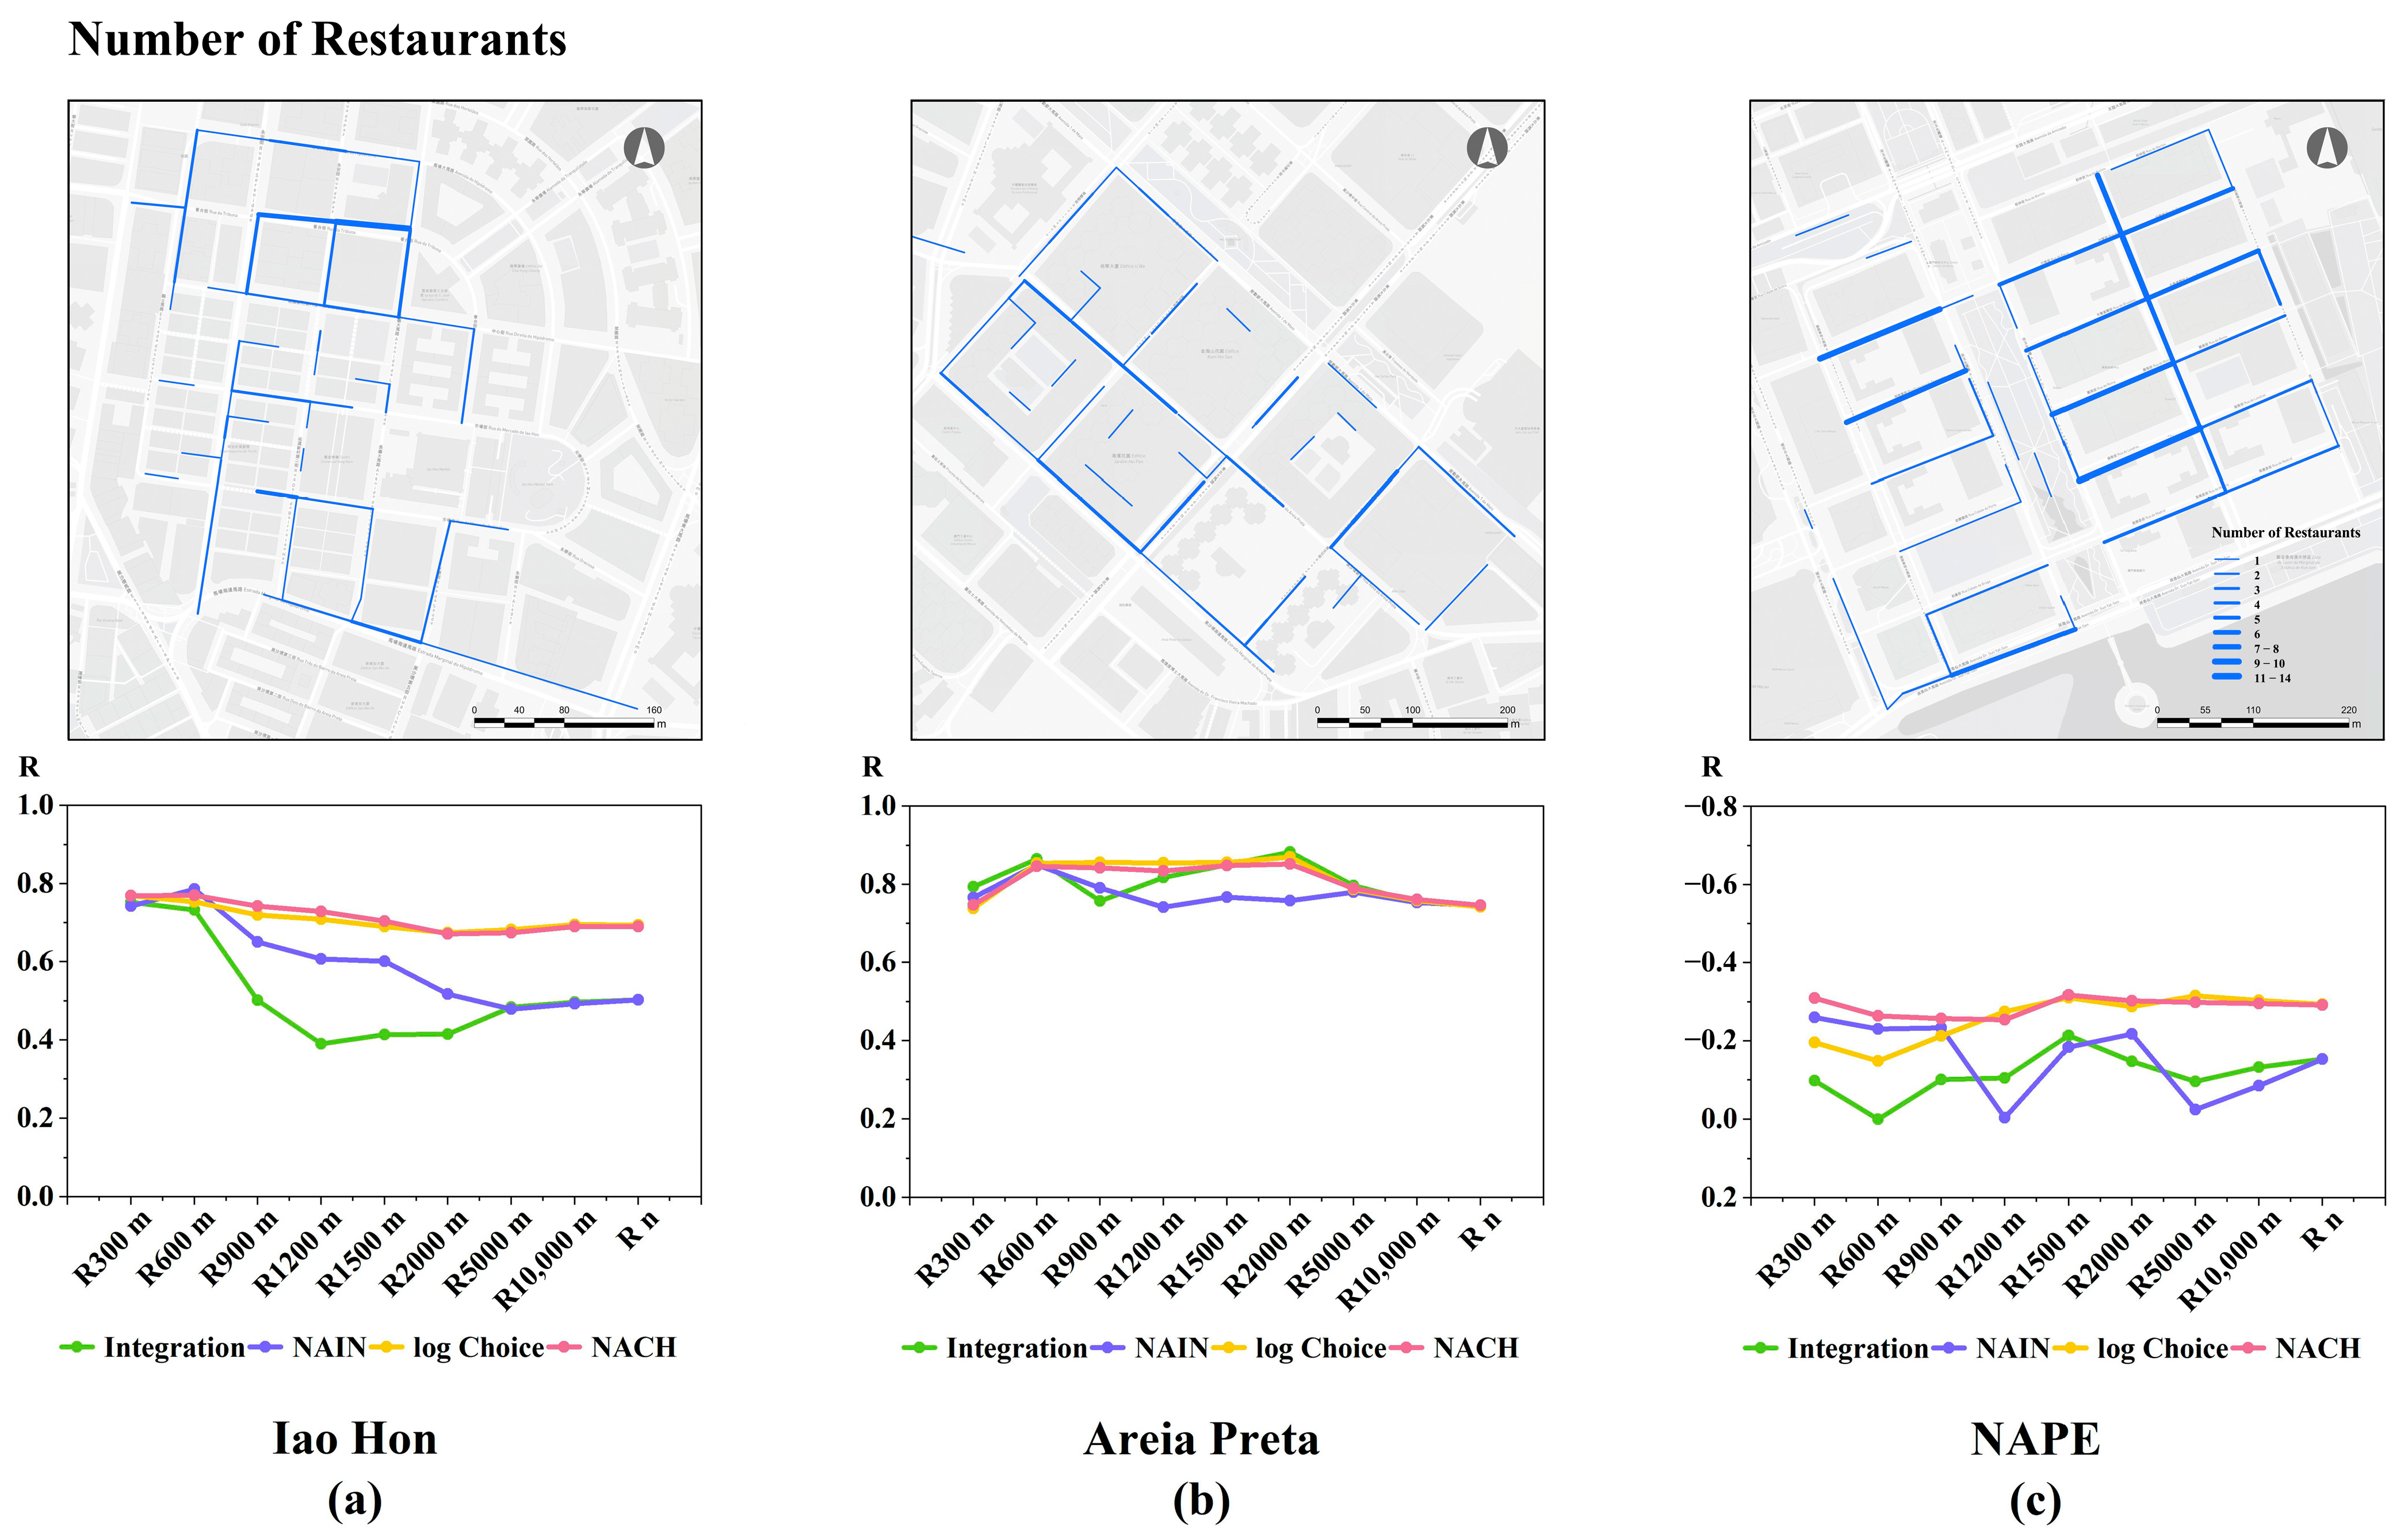
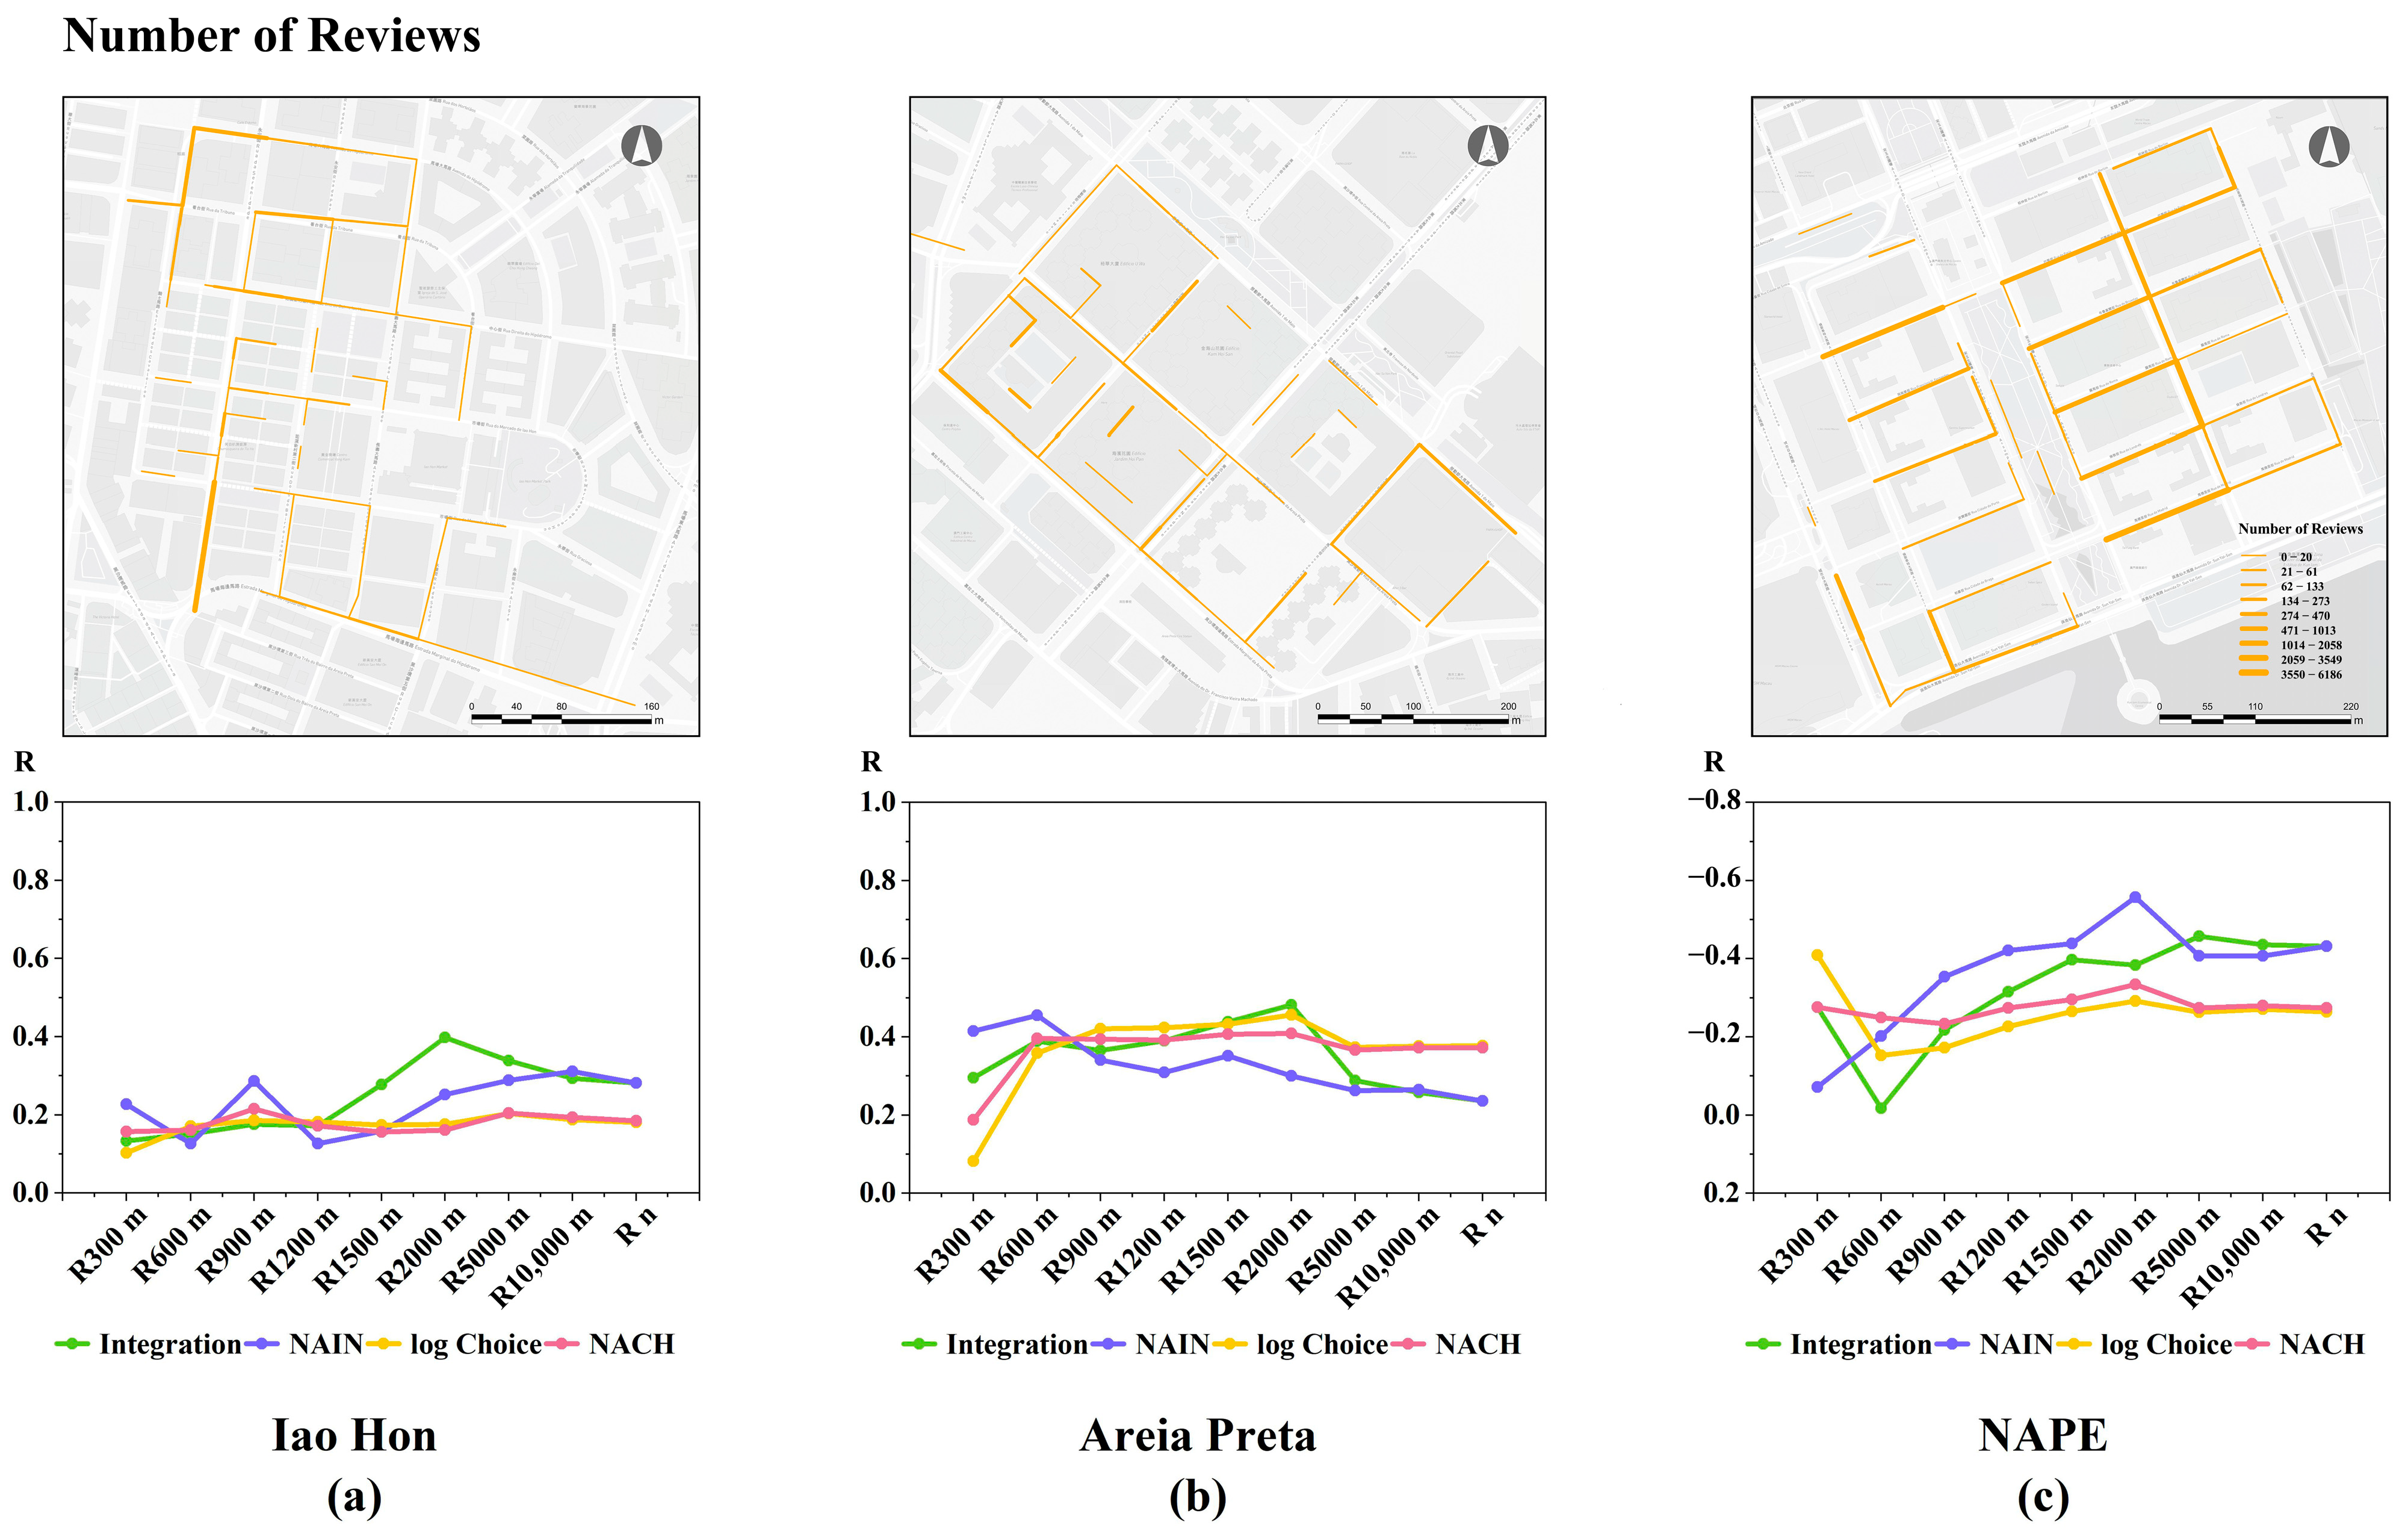
Figure 10,
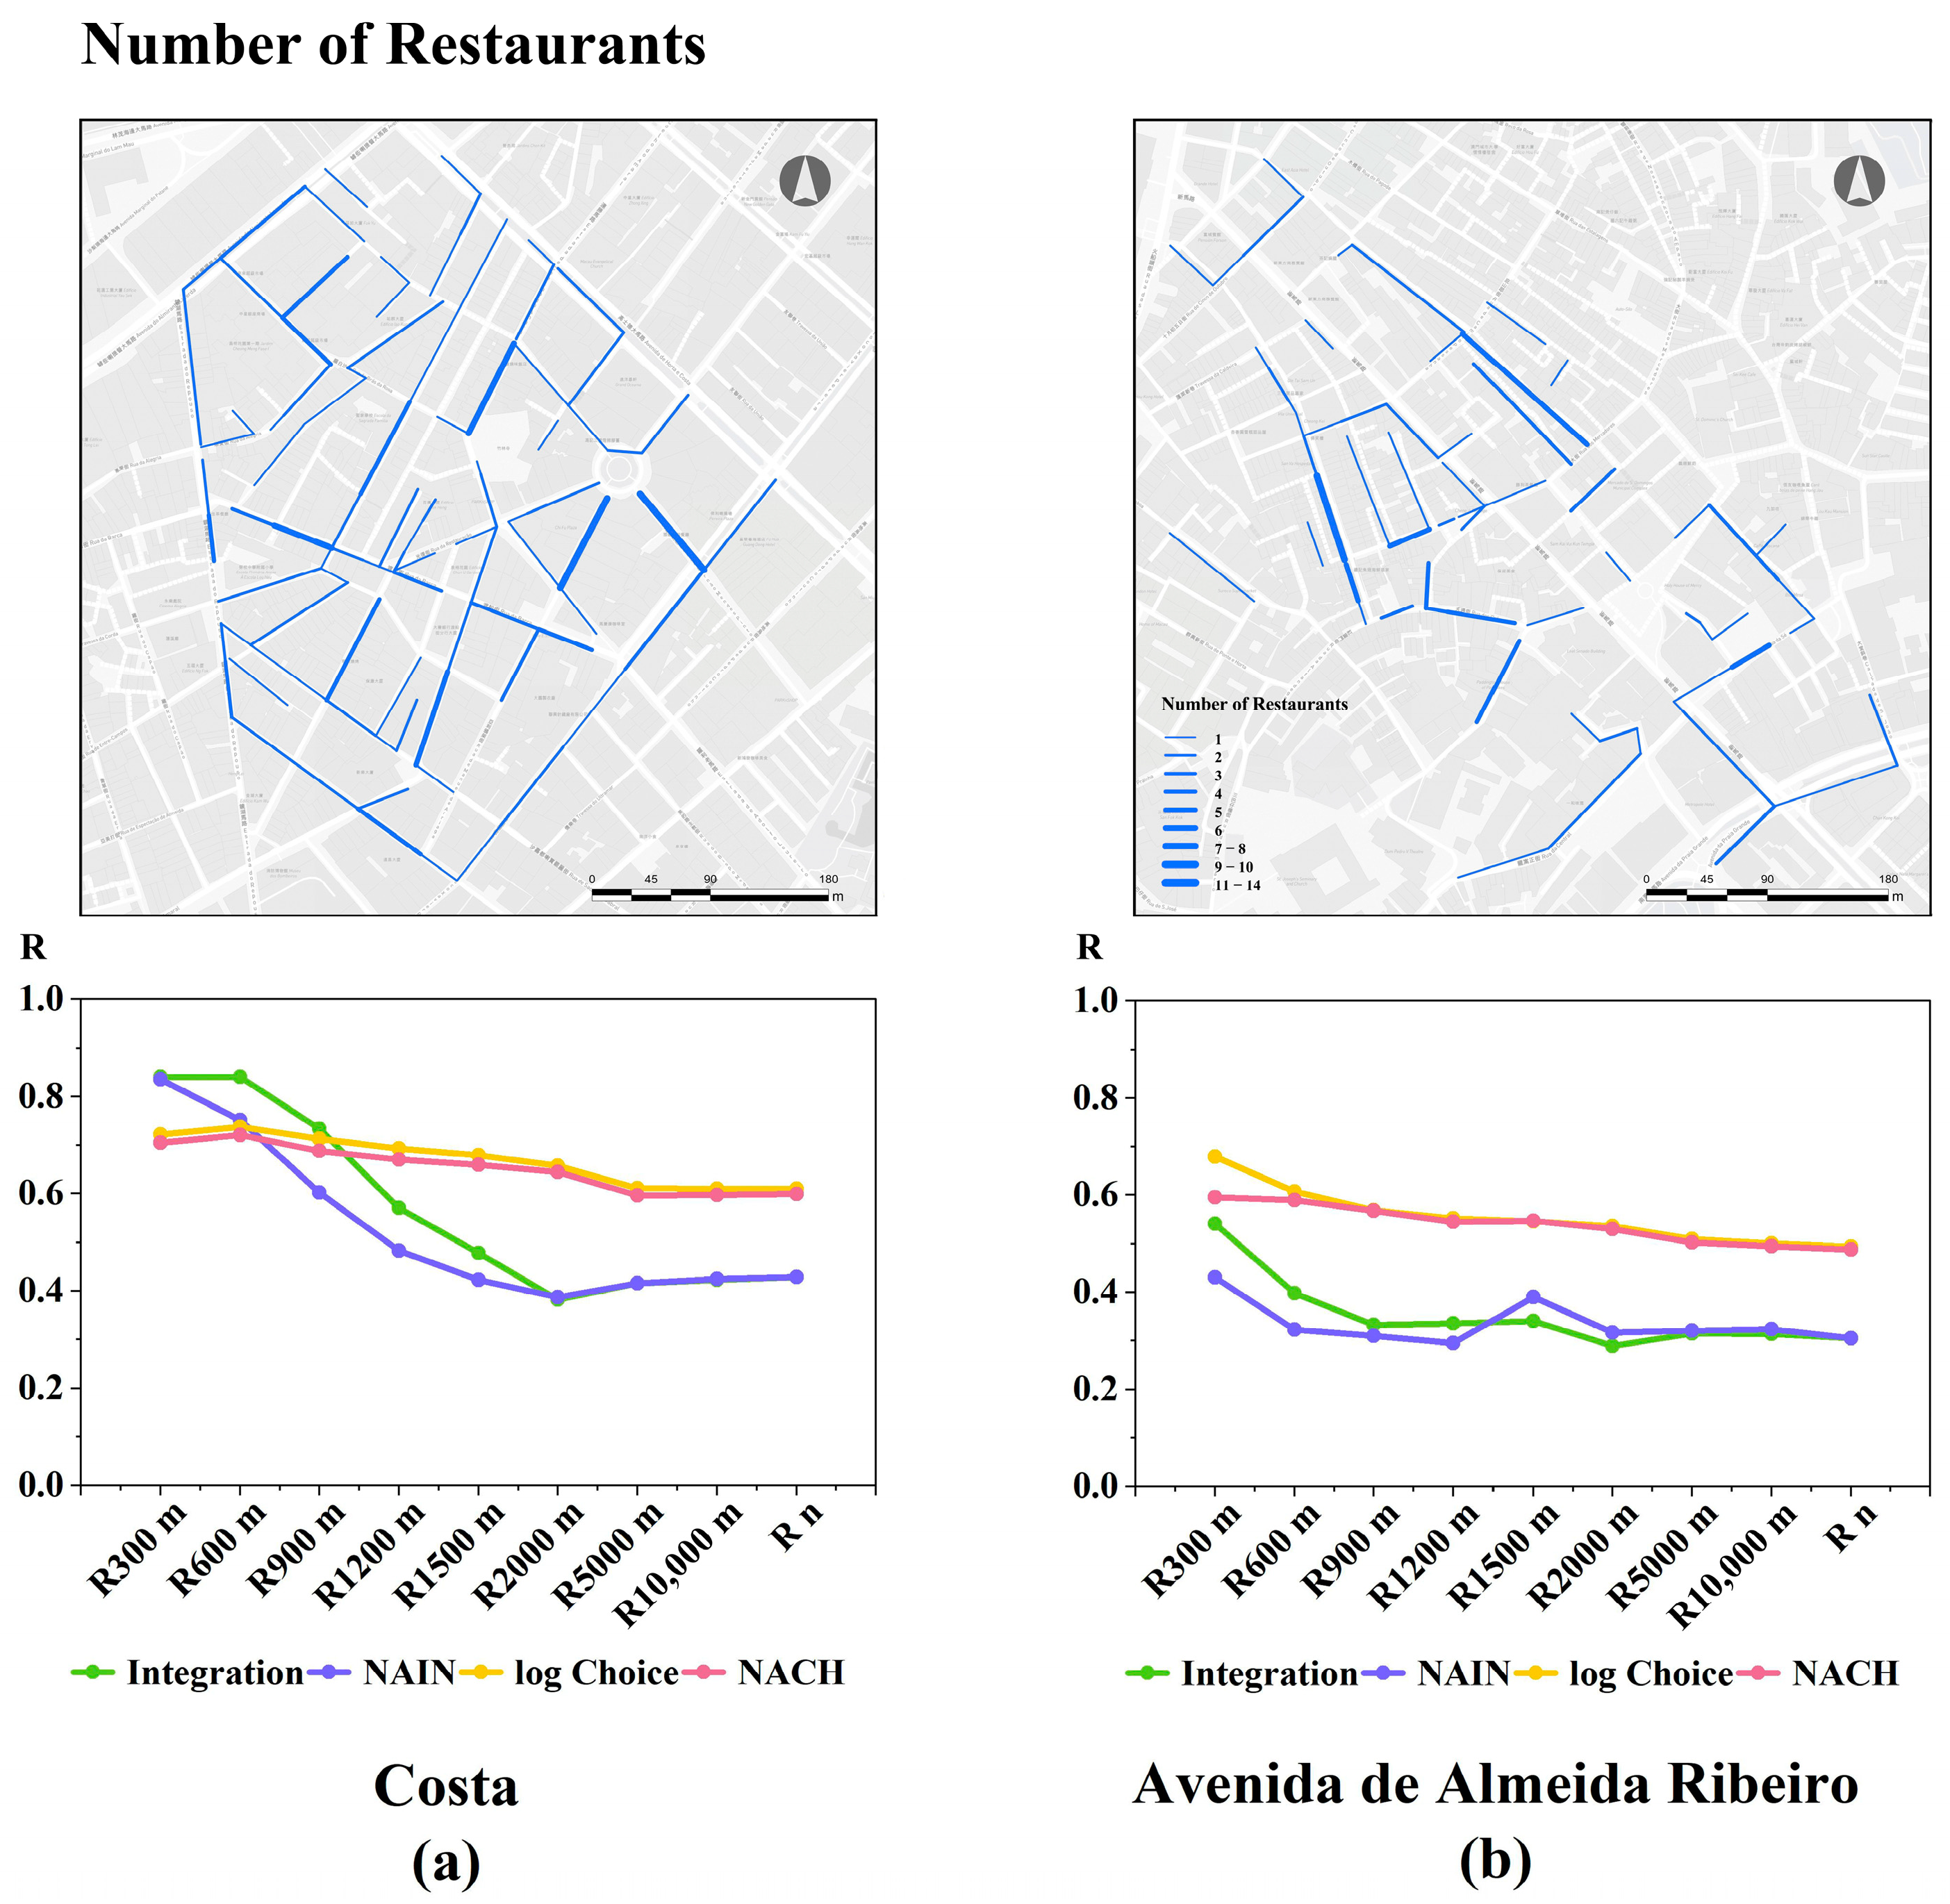
Figure 11,
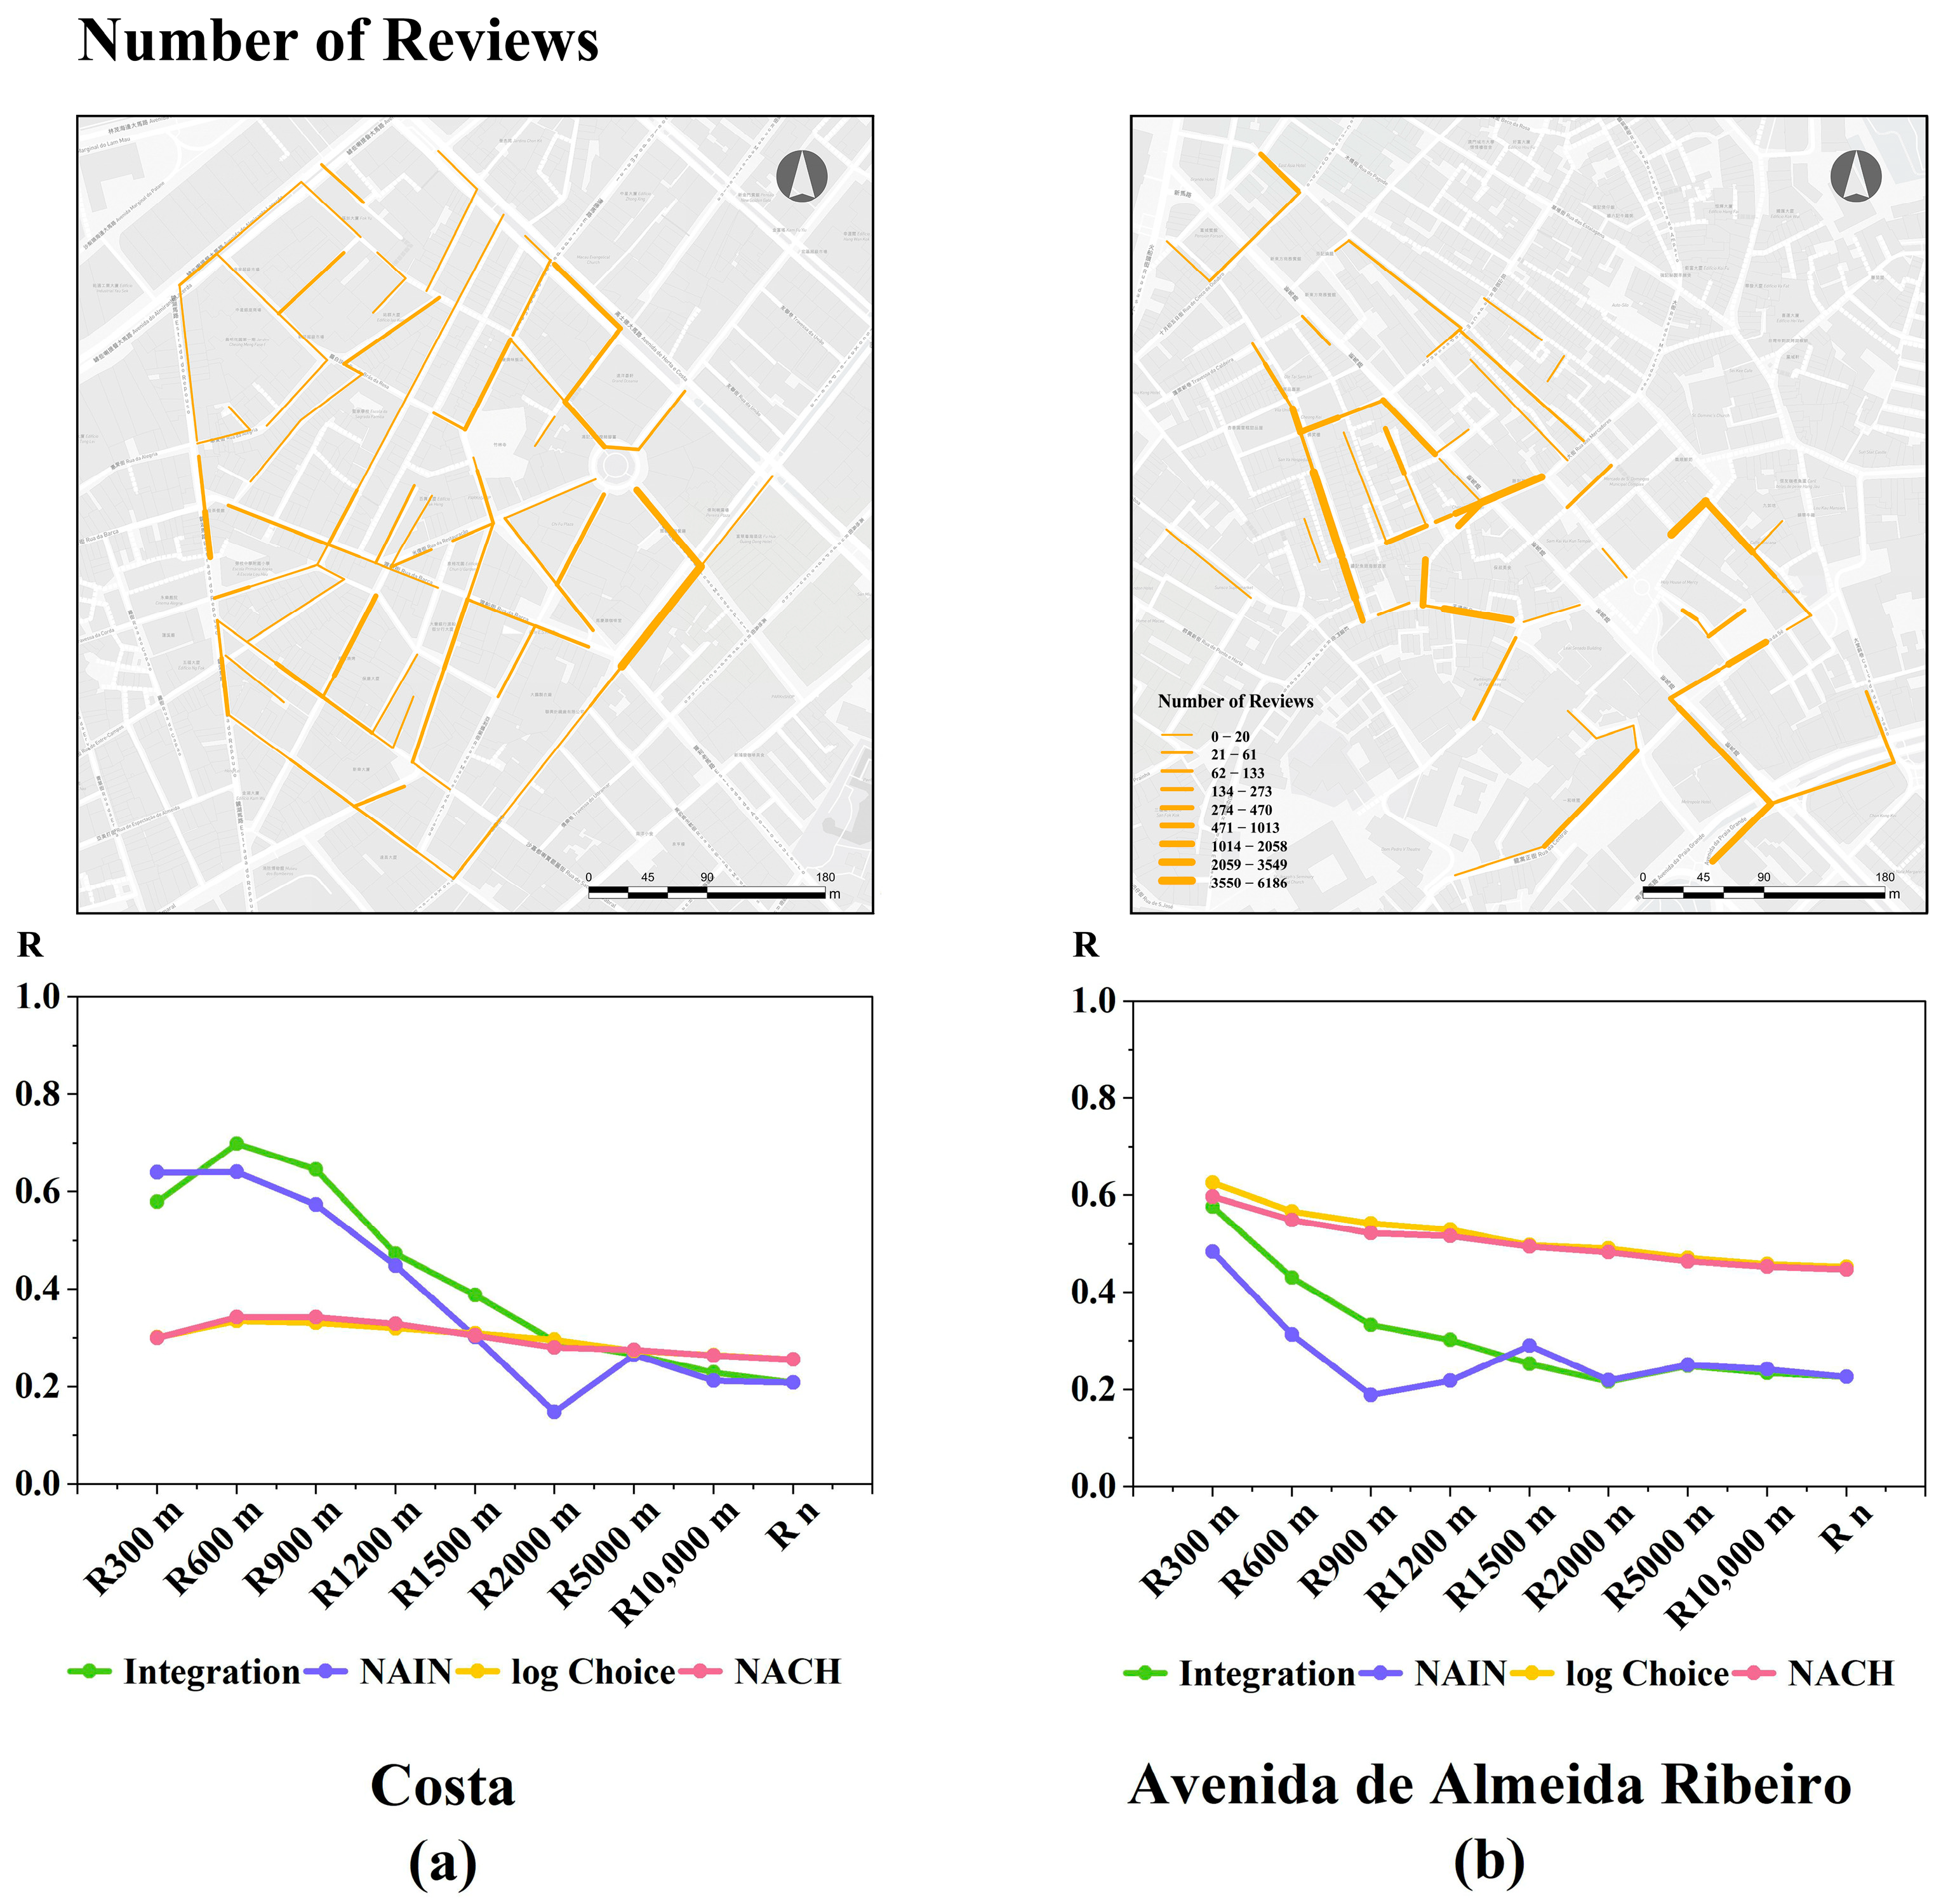
Figure 12 and
Figure 13 illustrate the variation trends in correlation coefficients (R) for restaurant distribution against different radii of space syntax parameters. The aggregated Dianping review data, visualized using ArcMap on the space syntax segment model, is displayed above the line graph for comprehensive comparison and observation.
3.2.1. Spatial Configuration Analysis Results in Grid-Patterned Areas (Iao Hon, Areia Preta, and NAPE)
In the Iao Hon area (
Figure 10a), the spatial distribution of restaurants is significantly influenced by choice parameters across all scales and integration parameters at more minor scales. The peak radius is observed at 600 m, where the R-value reaches 0.8.
In the Areia Preta area (
Figure 10b), the spatial distribution of restaurants exhibits a strong correlation with both choice and integration parameters across all scales. The primary peak radii are 600 and 2000 m, with R-values reaching 0.9.
In the NAPE area (
Figure 10c), the relationship between the spatial distribution of restaurants and choice and integration parameters is weaker, demonstrating a slight negative correlation. The peak R-value is only −0.3.
In the Iao Hon area (
Figure 11a), the spatial distribution of review counts is slightly influenced by large-scale integration parameters, with a peak radius of 2000 m and an R-value of 0.4.
In the Areia Preta area (
Figure 11b), the spatial distribution of review counts aligns with the spatial distribution patterns of restaurants. However, it shows lower correlations with choice and integration parameters across all scales. The peak radii for integration parameters are 600 m and 2000 m, with an R-value of 0.5.
In the NAPE area (
Figure 11c), the spatial distribution of review counts similarly aligns with the spatial distribution patterns of restaurants but demonstrates a stronger negative correlation with integration parameters. The peak radius is at the 2000 m integration parameter, with an R-value of −0.6.
3.2.2. Spatial Configuration Analysis Results in Organically Shaped Areas (The Avenida de Almeida Ribeiro Area and the Avenida de Horta e Costa Area)
In the Avenida de Horta e Costa area (
Figure 12a), the spatial distribution of restaurants is significantly influenced by small-scale choice and integration parameters. Peak radii are observed at 300 m and 600 m, where R-values approach 0.9. Additionally, large-scale choice parameters exert some influence, with R-values for choice consistently exceeding 0.6 at 2000 m and beyond. Spatial visualization of restaurant count data reveals that streets with higher numbers of restaurants are evenly distributed across various levels of the local-scale network.
In the Avenida de Almeida Ribeiro area (
Figure 12b), the spatial distribution of restaurants is moderately influenced by choice parameters, with the degree of influence diminishing as the calculation radius increases. The peak radius is at 300 m, where the R-value approaches 0.7. Spatial visualization of restaurant counts data shows that few restaurants are distributed along urban-scale roads, such as Avenida de Almeida Ribeiro and Rua do Visconde Paco de Arcos. Instead, streets with higher restaurant counts are primarily concentrated on the vertical streets flanking Avenida de Almeida Ribeiro. These streets belong to different levels within the local-scale network.
In the Avenida de Horta e Costa area (
Figure 13a), the spatial distribution of review counts is significantly influenced by small-scale integration parameters, with a peak radius of 600 m and an R-value close to 0.7. This distribution pattern closely resembles the spatial distribution of restaurants but shows a very low correlation with choice parameters across all scales. Spatial visualization data reveal that streets with high review counts are primarily distributed along the urban-scale network.
In the Avenida de Almeida Ribeiro area (
Figure 13b), the spatial distribution of review counts similarly aligns with the distribution pattern of restaurants, showing some influence from choice parameters. However, the degree of influence decreases as the calculation radius increases, with a peak radius of 300 m and an R-value of 0.6. Notably, as in the Avenida de Horta e Costa area, streets with high review counts in the Avenida de Almeida Ribeiro area are also prominently distributed along the urban-scale network.
3.2.3. Spatial Configuration Analysis Results of the Macau Peninsula
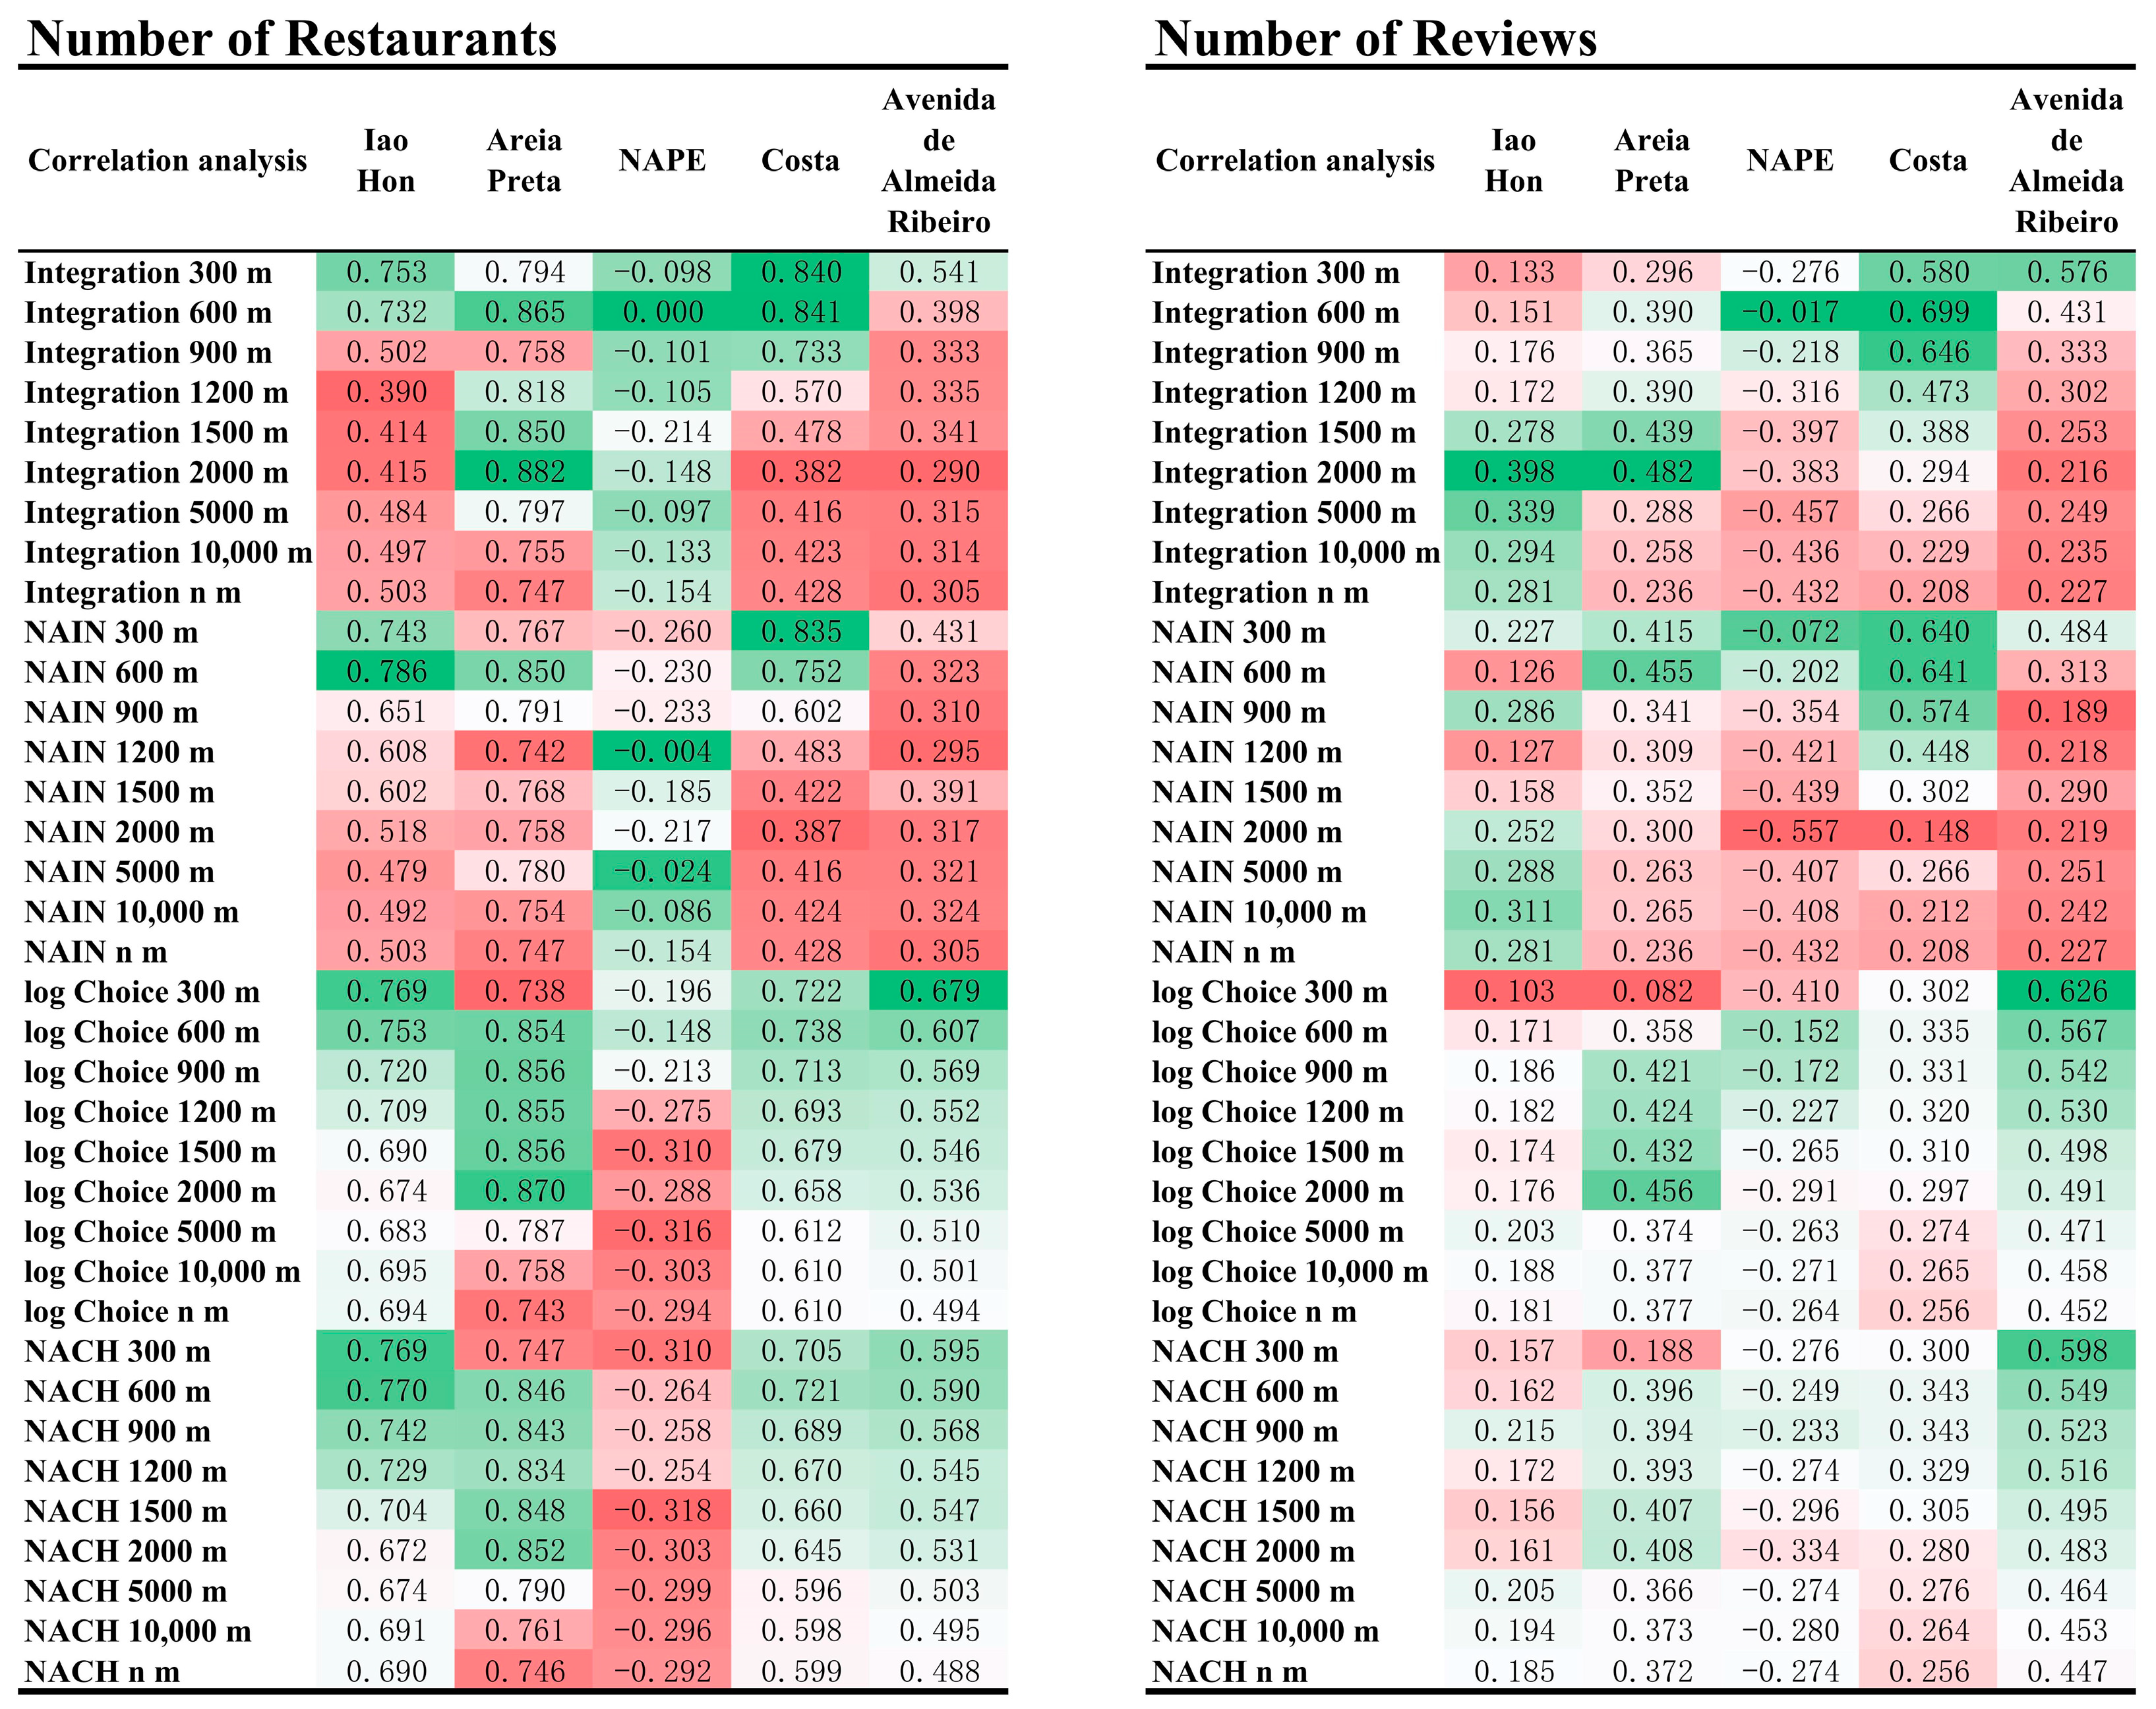
To further compare overall trends and numerical differences, this figure presents an integration matrix of R-values to highlight the key correlation characteristics between syntax parameters and Dianping data across different areas. A red-green scale is applied, and the deeper green represents higher correlation values (
Figure 14).
The matrix reveals significant variations in the distribution of red and green shades across different areas and parameters, indicating notable differences in the correlations between syntax parameters and the number of restaurants and review counts in the various regions of the Macau Peninsula.
Overall, the correlation between syntax parameters and the number of restaurants is generally higher than those with review counts (e.g., Integration300 with the number of restaurants across the five areas: 0.75, 0.79, −0.1, 0.54, and 0.84, respectively, compared to review counts: 0.13, 0.3, −0.28, 0.58, and 0.58).
This trend is particularly pronounced at pedestrian scales in grid-patterned areas (e.g., NAIN300–1200 in the Areia Preta area shows R-values of 0.76, 0.85, 0.8, and 0.74 with the number of restaurants, compared to 0.42, 0.46, 0.34, and 0.31 for review counts). However, in the NAPE area, which is also grid-patterned, all correlation coefficients are negative. This may be attributed to the area’s unique location, internal spatial structure, and commercial characteristics, which limit its integration into the urban network.
In organically shaped areas, the advantage of syntax parameters’ correlation with the number of restaurants over review counts is relatively weaker (e.g., NAIN300–1200 in the Avenida de Horta e Costa area shows R-values of 0.84, 0.75, 0.6, and 0.48 with the number of restaurants, compared to 0.64, 0.64, 0.57, and 0.45 for review counts). This suggests that spatial morphology influences review counts in organically shaped areas more than in grid-patterned areas.
3.3. Spatial Modeling: Descriptive Statistics of Accessibility for Different Types of Catering Businesses
To reveal the general characteristics of catering attributes in grid-patterned areas (the Iao Hon area, the Areia Preta area, and the NAPE area) and organically shaped areas (the Avenida de Almeida Ribeiro area and the Avenida de Horta e Costa area), this study uses boxplots to present descriptive statistics of the distribution patterns of different price tiers and cuisine types under urban-scale networks (vehicular scale) and local-scale networks (pedestrian scale).
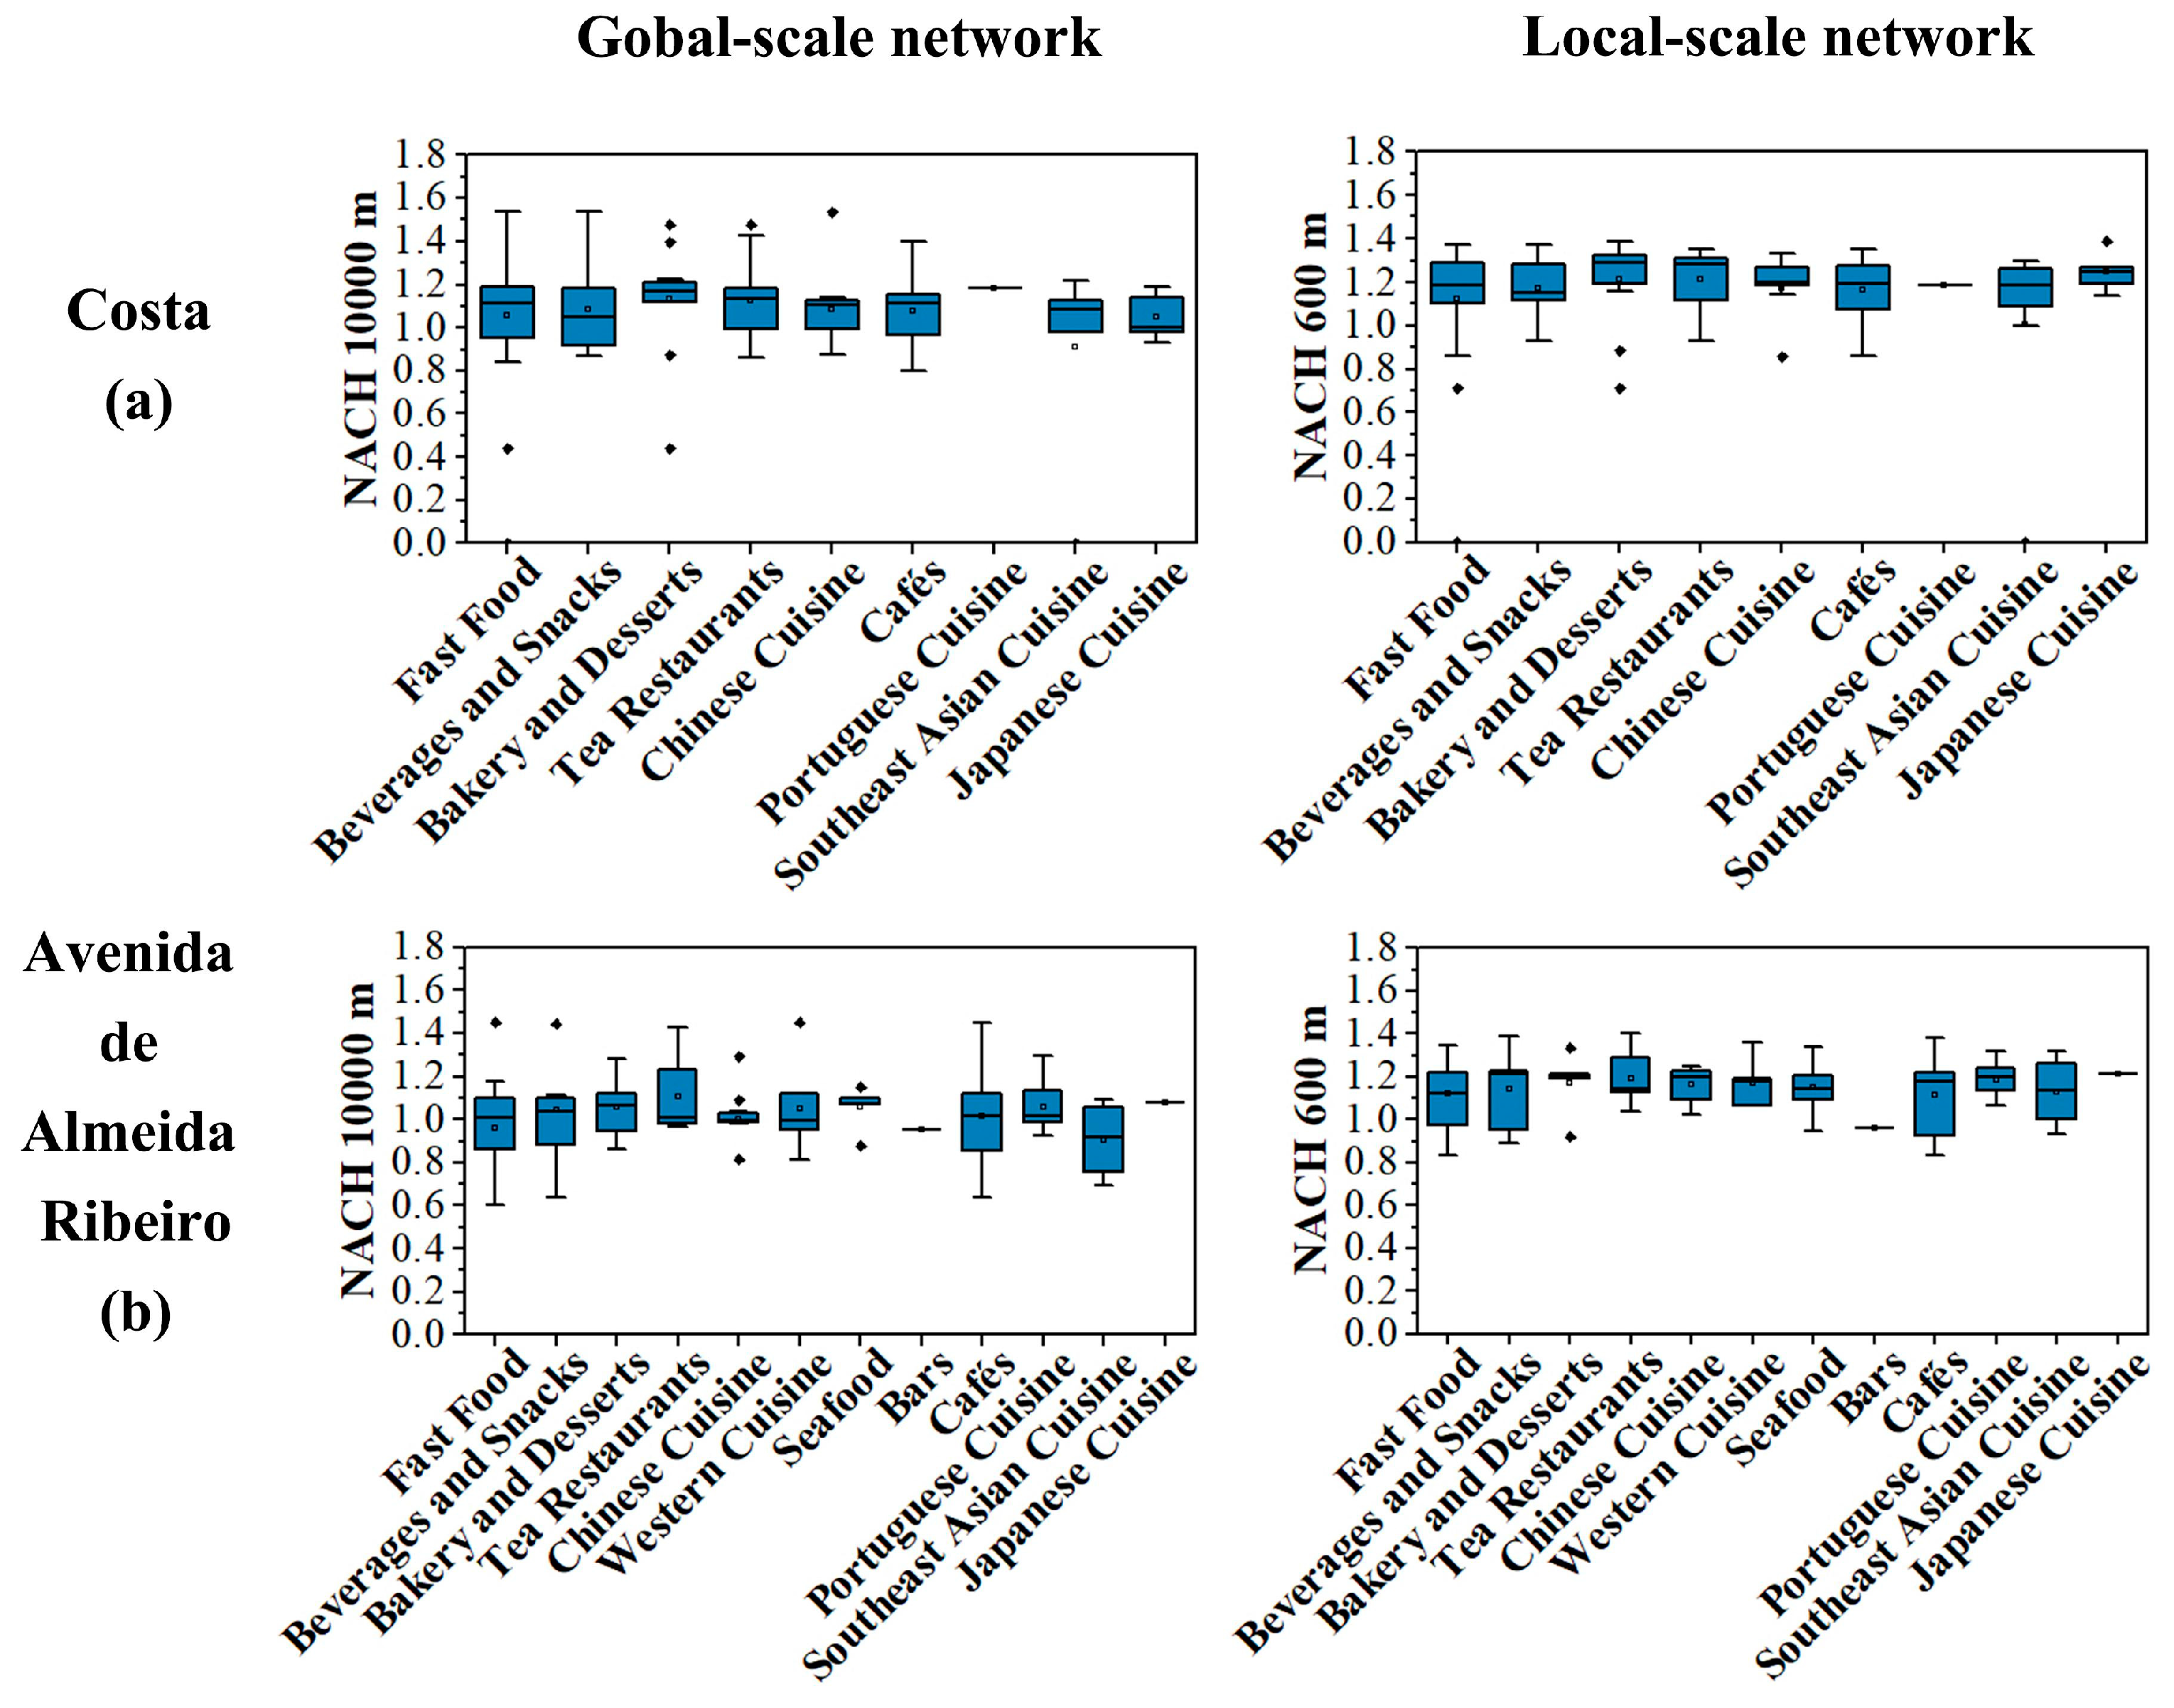
Each boxplot displays the interquartile range (IQR), with the central line representing the median. The whiskers indicate the data range, and points beyond the whiskers are outliers. The IQR reflects the mobility accessibility characteristics of a specific type of catering business at the vehicular or pedestrian scale. At the same time, the whisker length represents the accessibility range for that catering type.
3.3.1. Descriptive Statistics of Accessibility for Catering Businesses Across Different Price Tiers
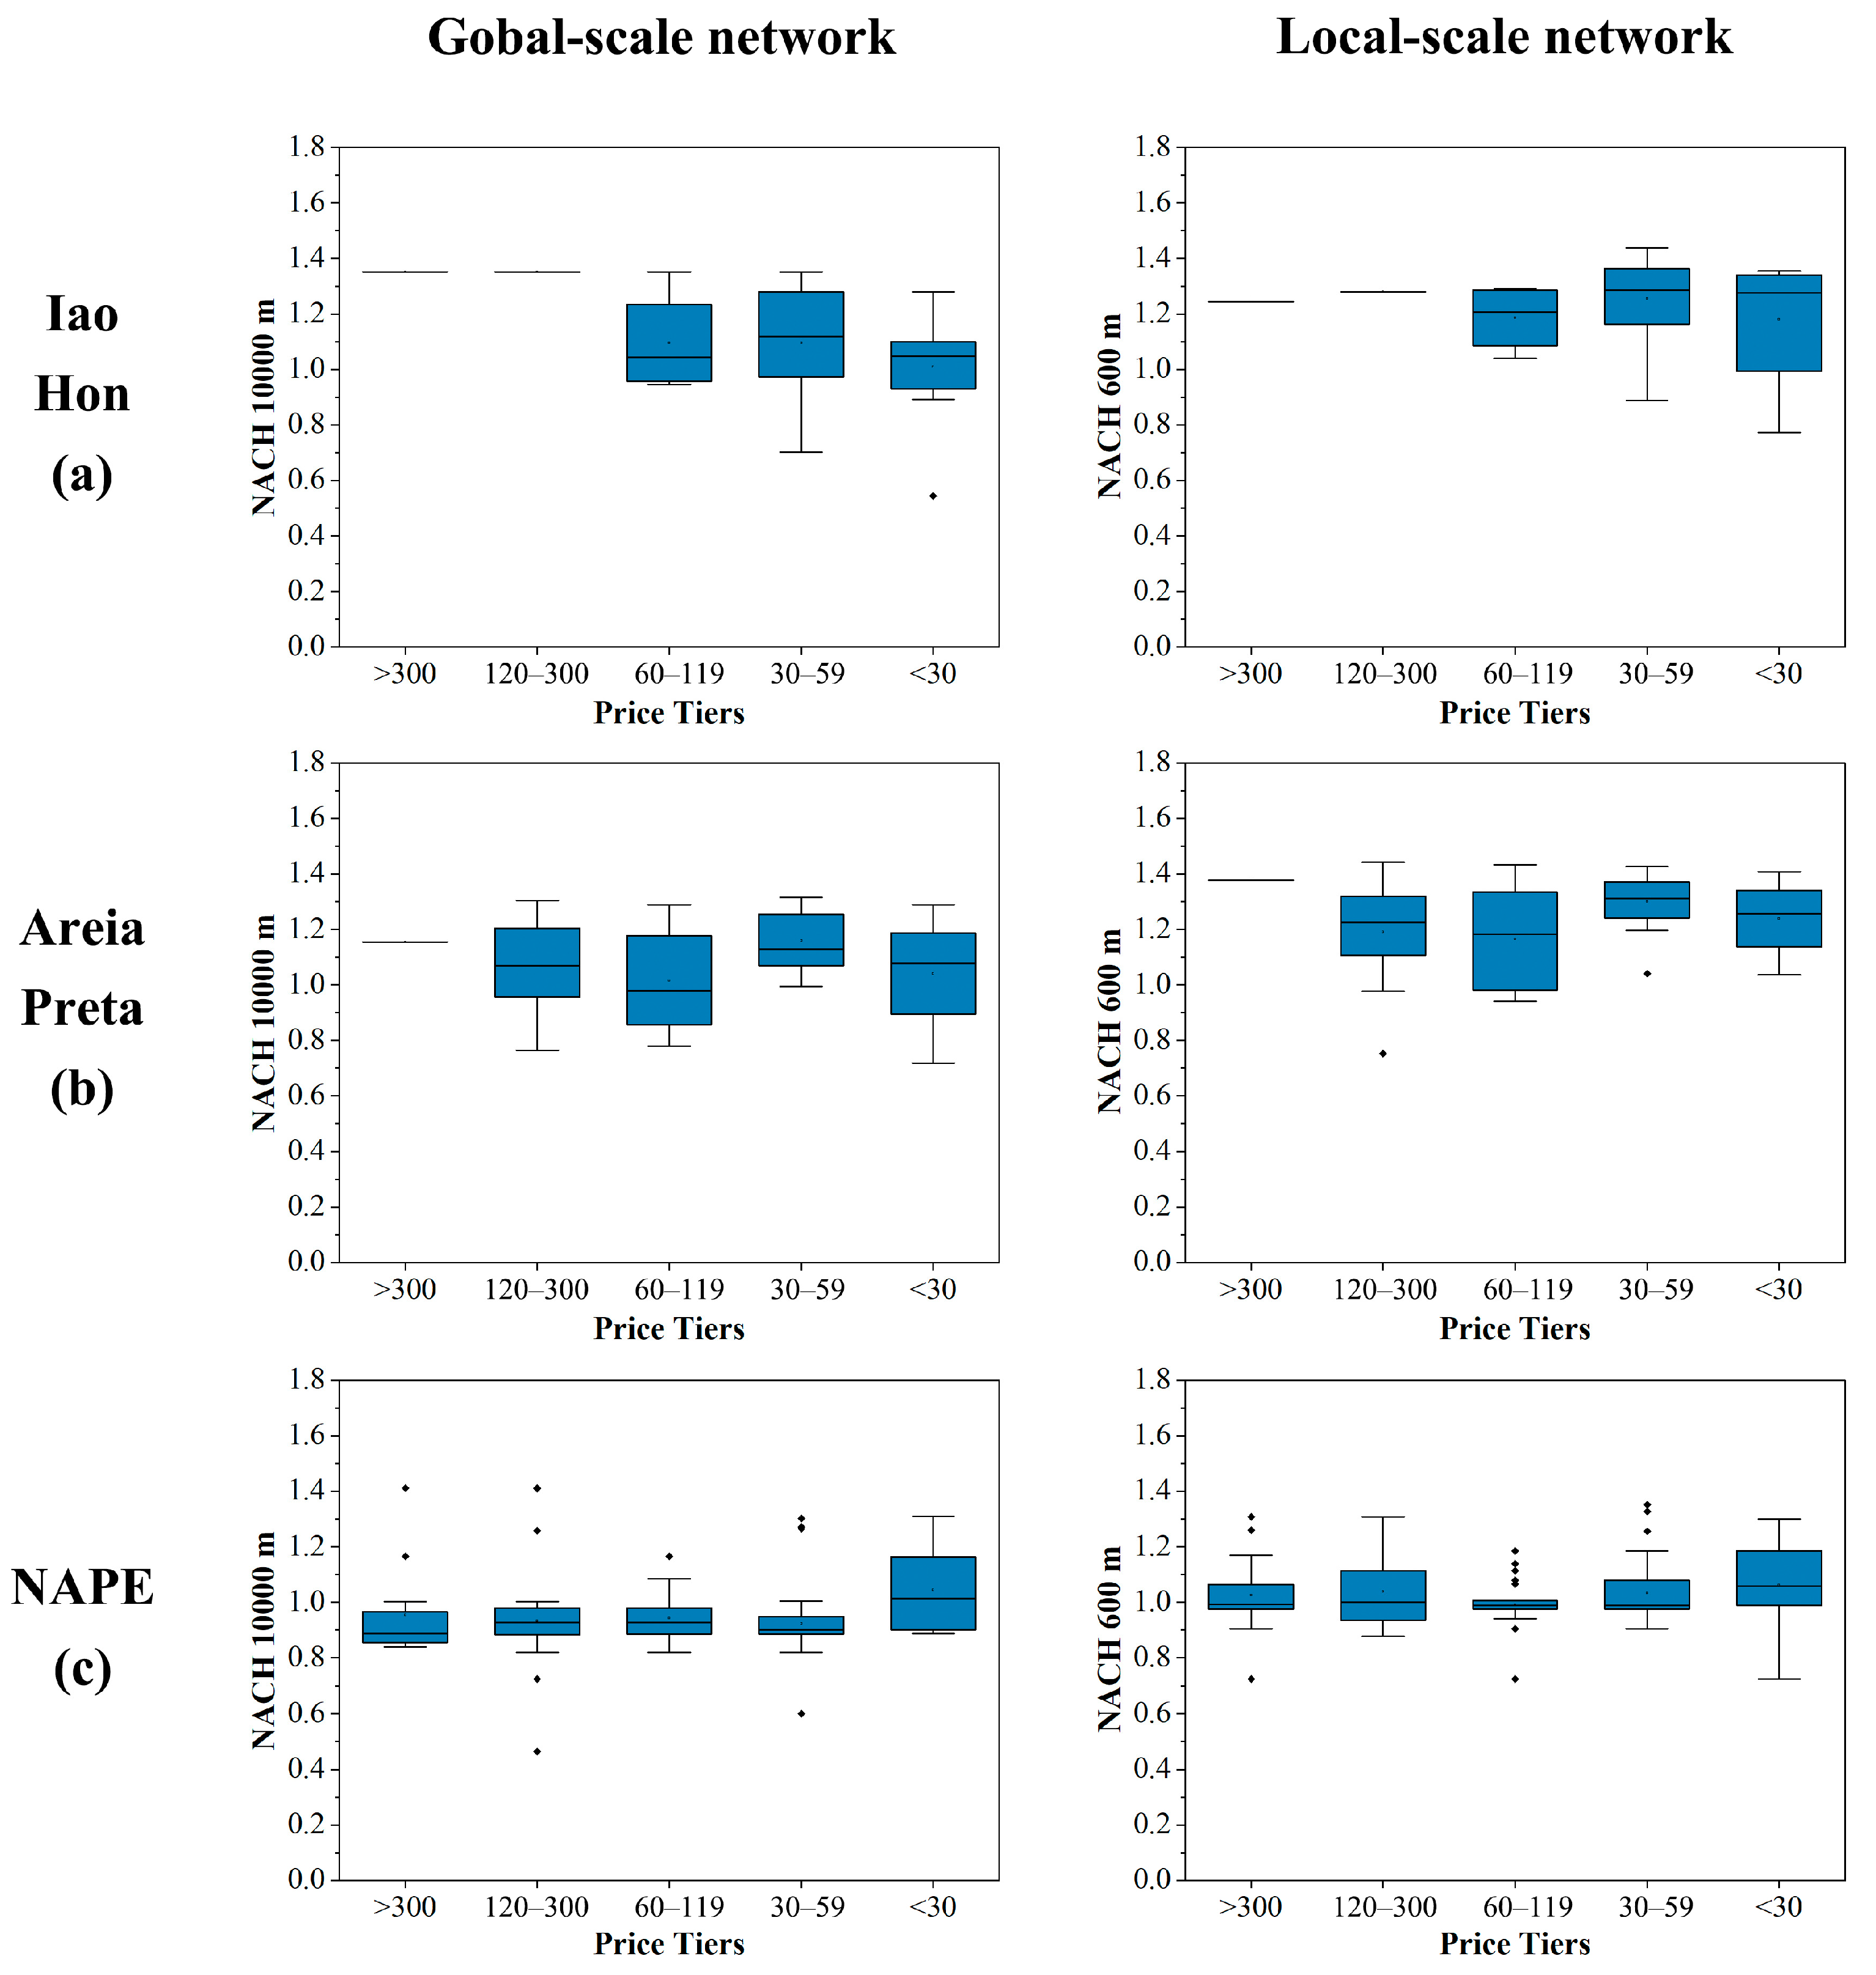
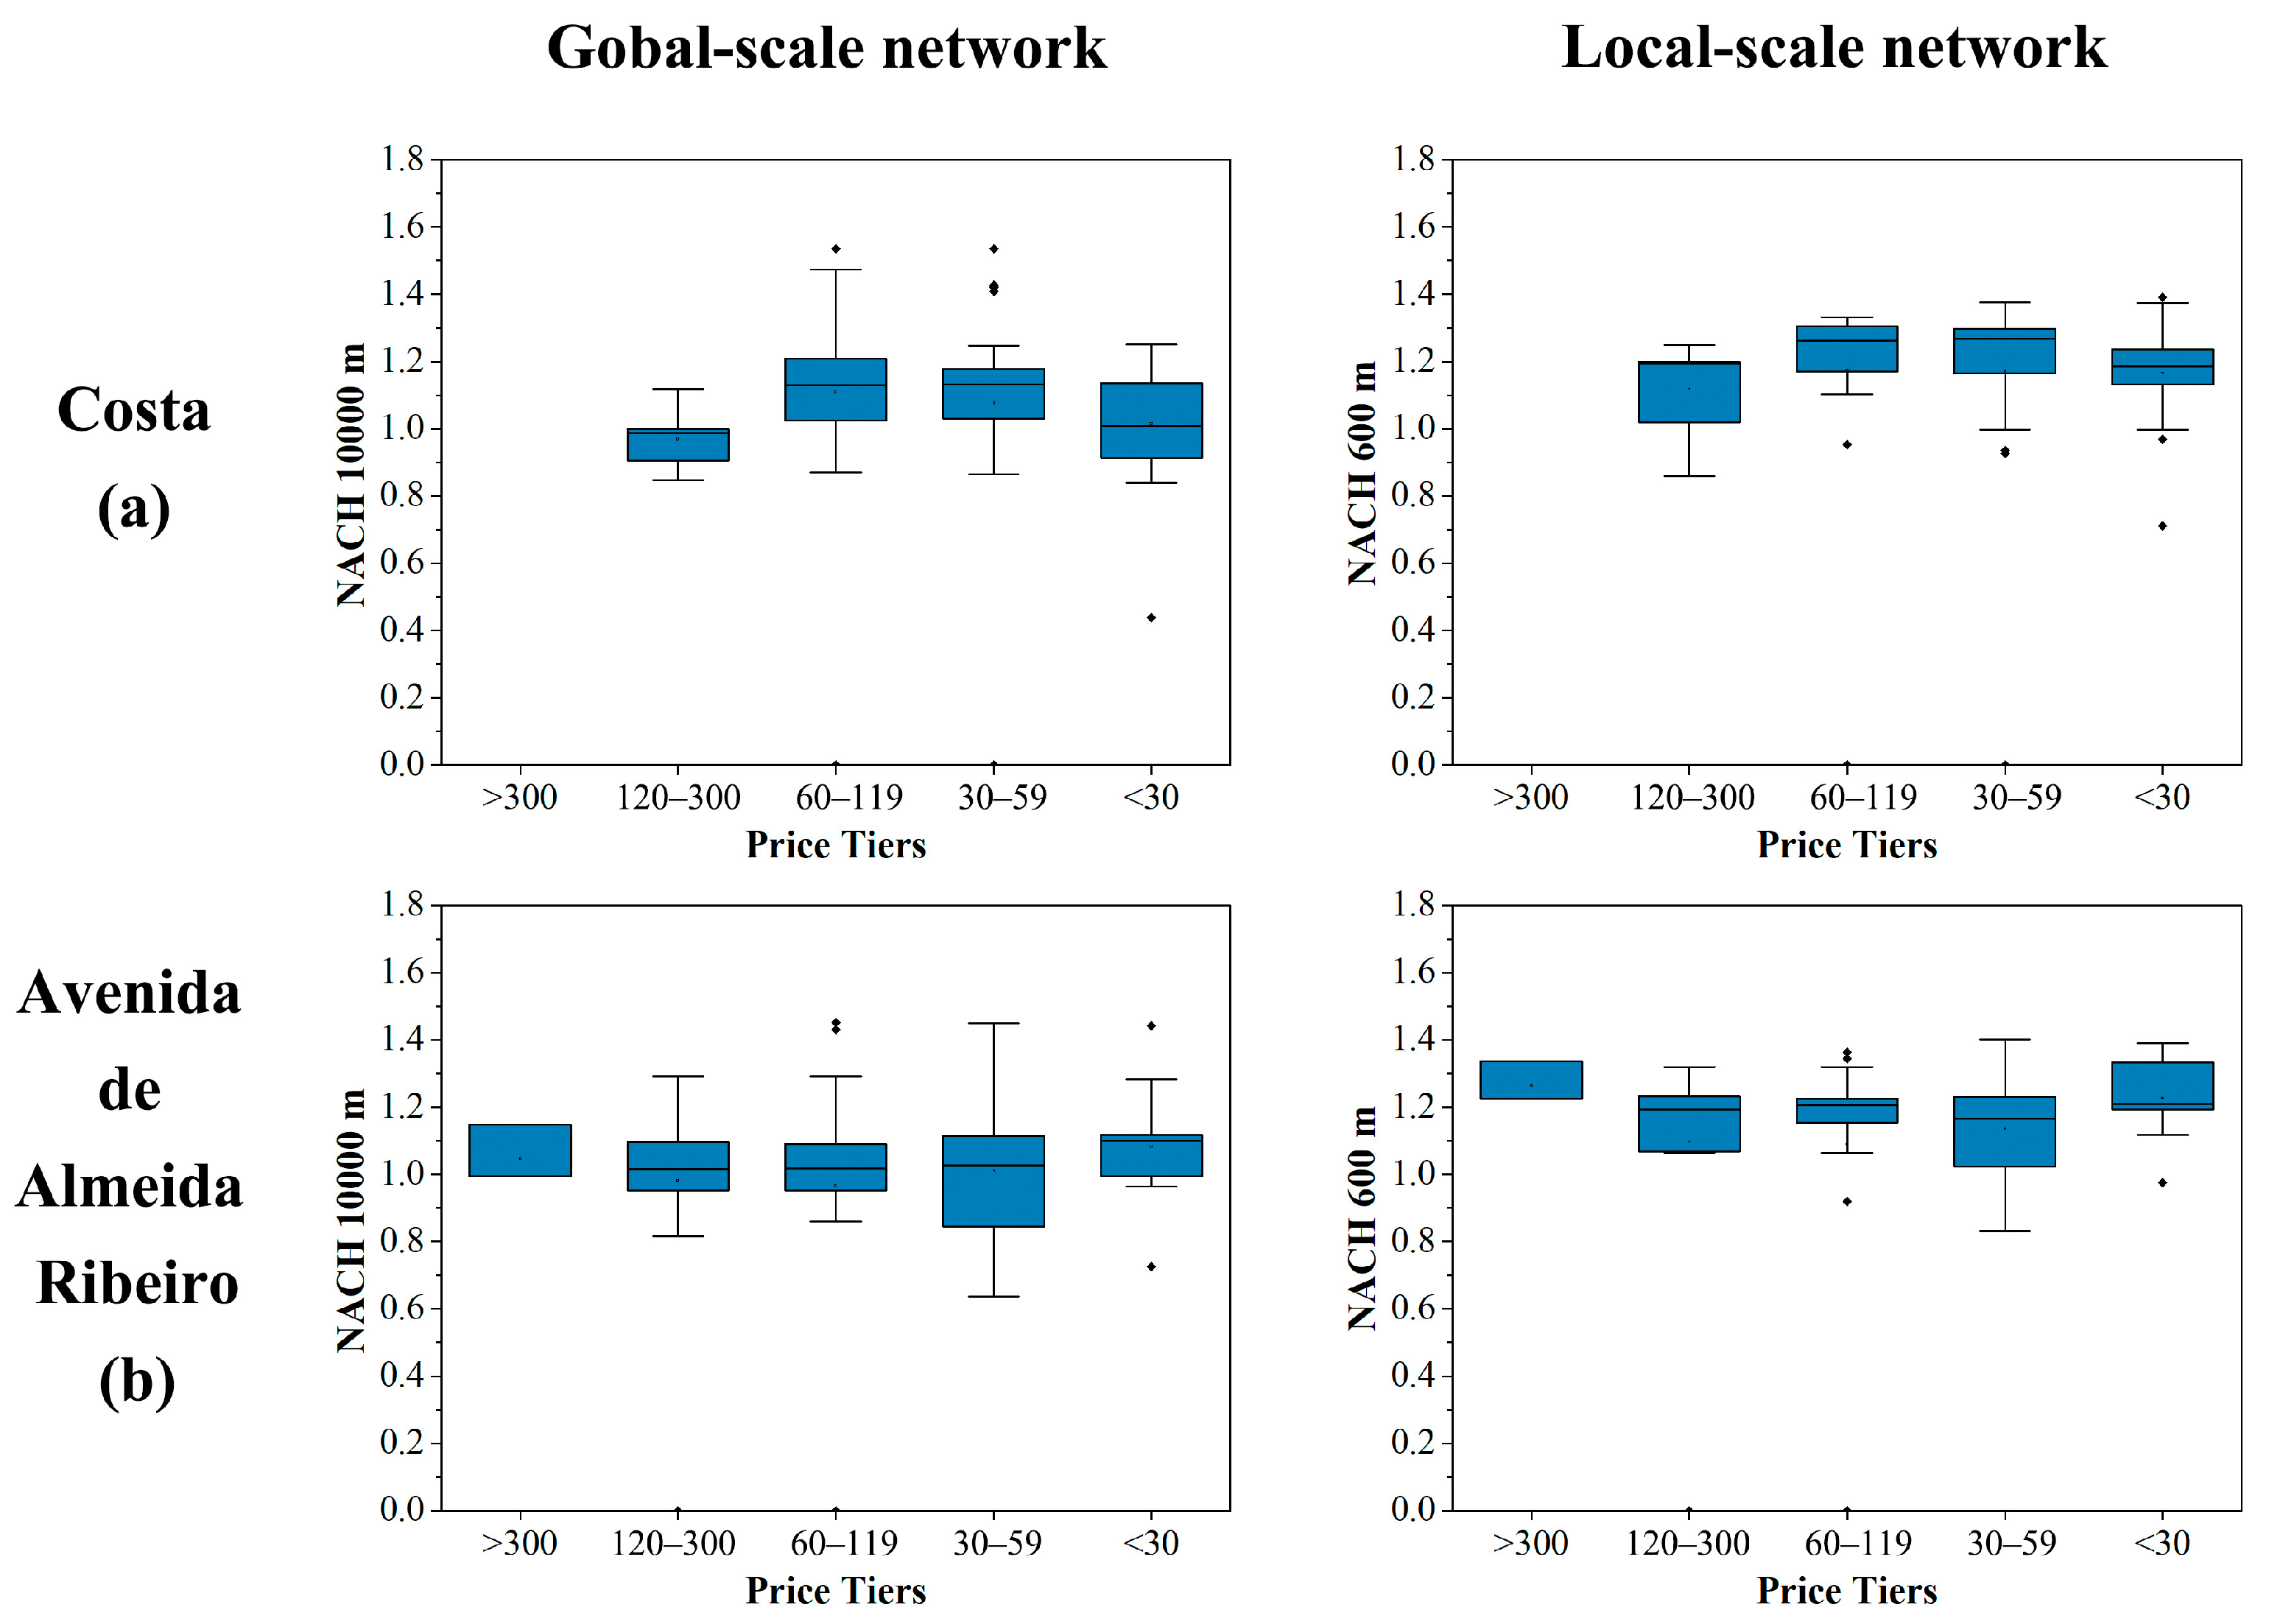
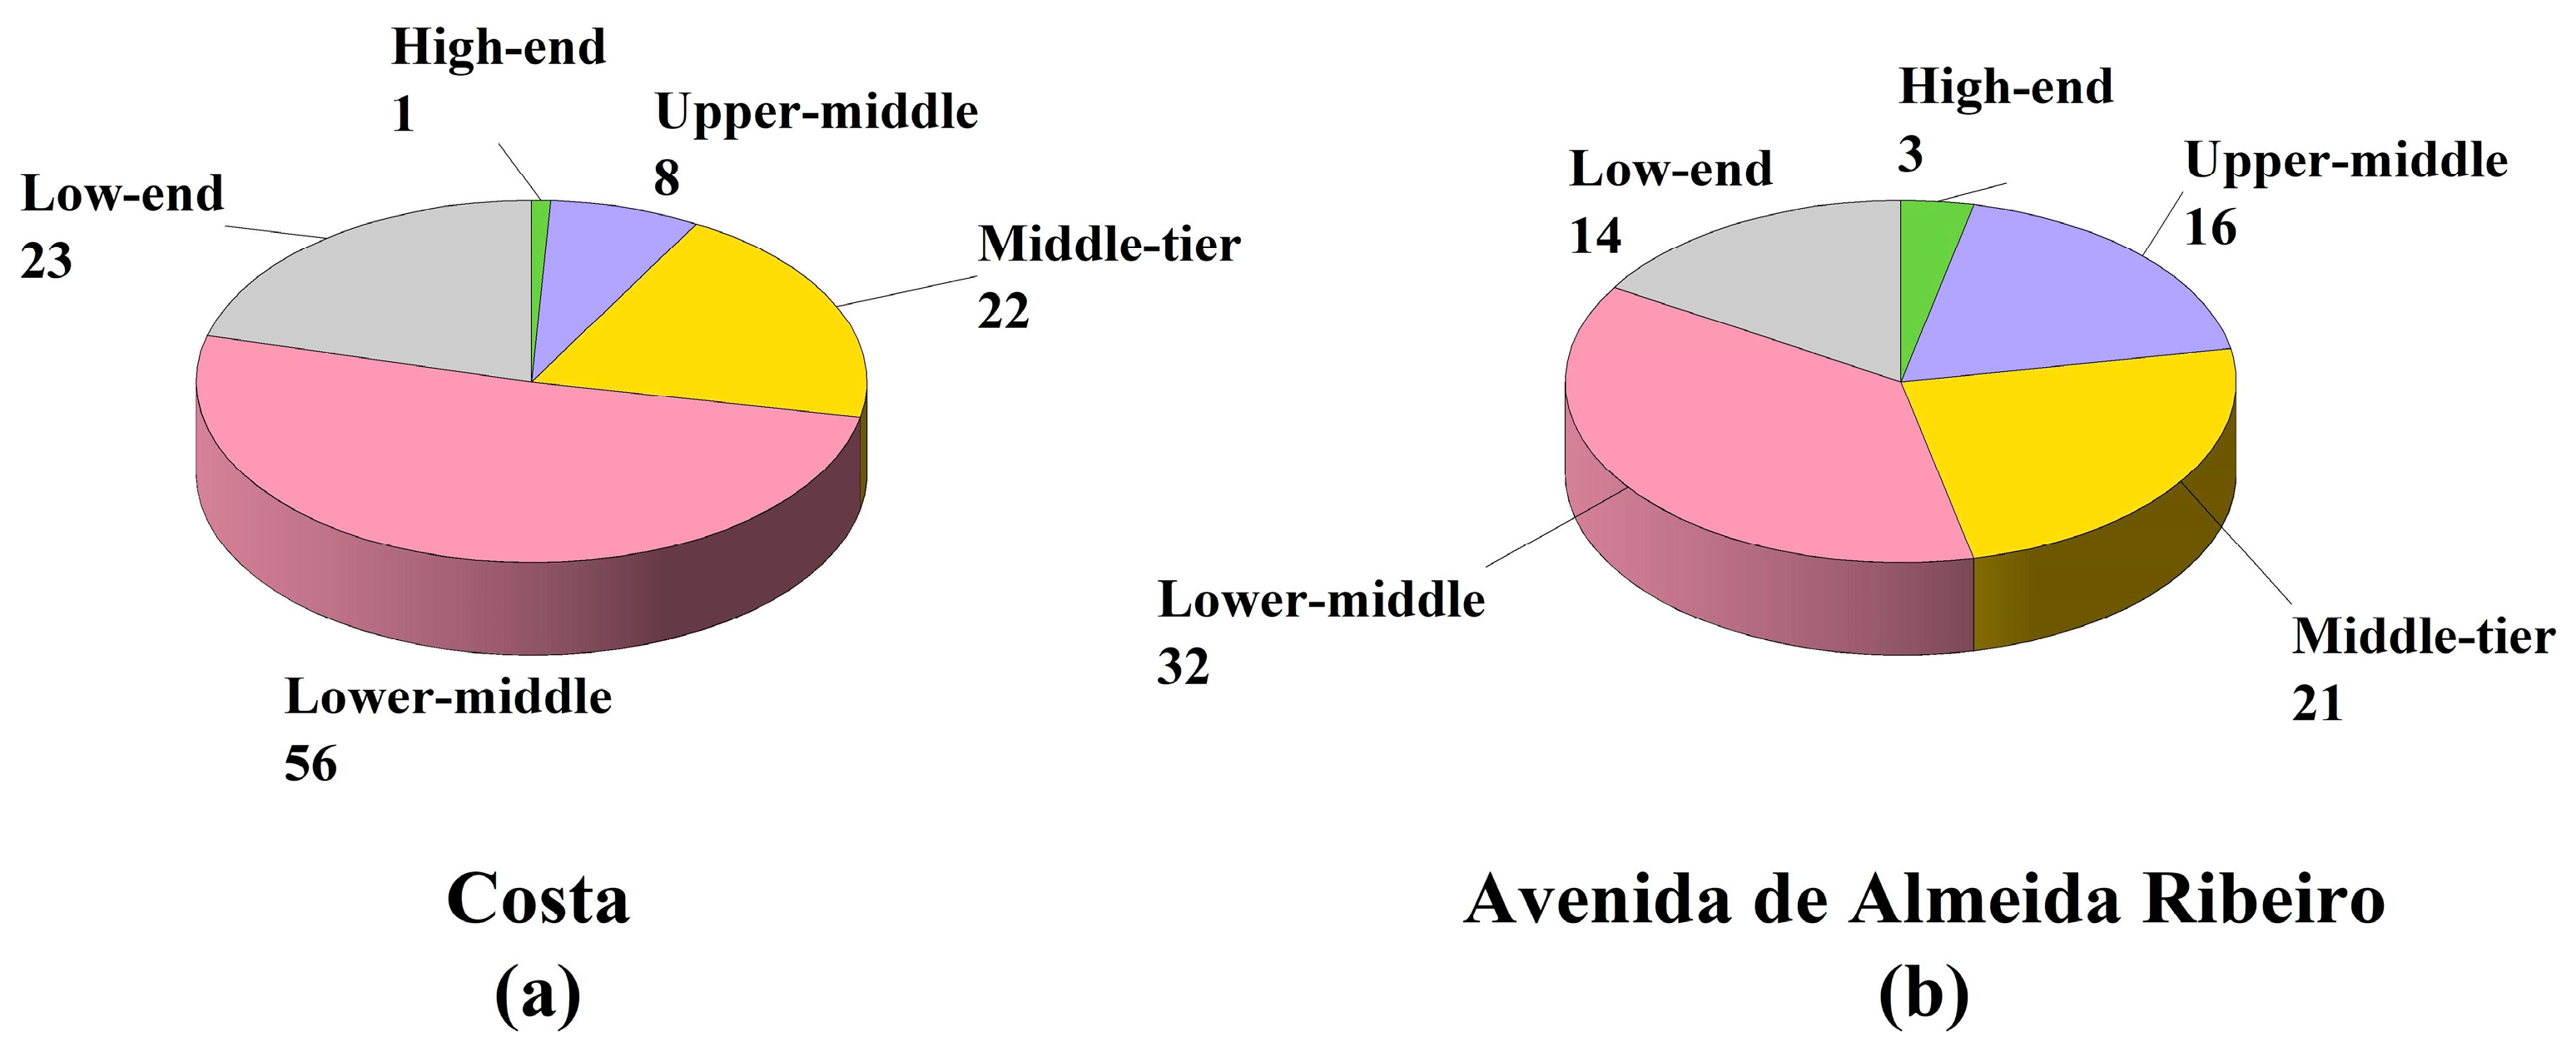
The accessibility distribution of catering businesses in different price tiers shows significant variations across urban morphologies. In grid-patterned areas (
Figure 15), the accessibility distribution for businesses within the same price tier is relatively dispersed, likely due to the more straightforward hierarchical structure. In contrast, the distribution is more concentrated in organically shaped areas (
Figure 16), possibly attributed to the diversified hierarchical structure and the complex connectivity within the internal network.
Specifically, for low-tier (<30), mid-tier (60–119), and upper-mid-tier (120–300) catering businesses, the interquartile range (IQR) in grid-patterned areas such as Iao Hon and Areia Preta (excluding NAPE due to the high presence of outliers) is broader, while the whisker length is narrower. For example, in the Areia Preta area, the IQR and whisker length for urban- and local-scale accessibility are as follows: 0.44, 0.36; 0.29, and 0.28; 0.38 and 0.28 for the IQR, and 0.57, 0.51; 0.54, 0.35; and 0.49, 0.69 for the whisker length, respectively. This indicates that catering businesses within the same price tier in grid-patterned areas are more spatially dispersed and less dependent on streets with specific accessibility. Conversely, mid-low-tier catering businesses (30–59) exhibit a more concentrated accessibility distribution. For instance, in the Areia Preta area, the IQR and whisker length for urban- and local-scale accessibility are 0.18, 0.15, and 0.33, 0.39, respectively, possibly influenced by external factors such as clusters of snack and takeaway shops near schools.
In organically shaped areas such as Avenida de Almeida Ribeiro and Costa, catering businesses in all price tiers show narrower IQRs and broader whisker lengths. This pattern is particularly evident for mid-tier (60–119) catering businesses in the urban-scale network of Costa (IQR: 0.21, whisker length: 0.6) and for mid-low-tier (30–59) businesses in Avenida de Almeida Ribeiro (IQR for urban- and local-scale networks: 0.29, 0.21; whisker length: 0.82, 0.57).
3.3.2. Descriptive Statistics of Accessibility for Different Cuisine Types
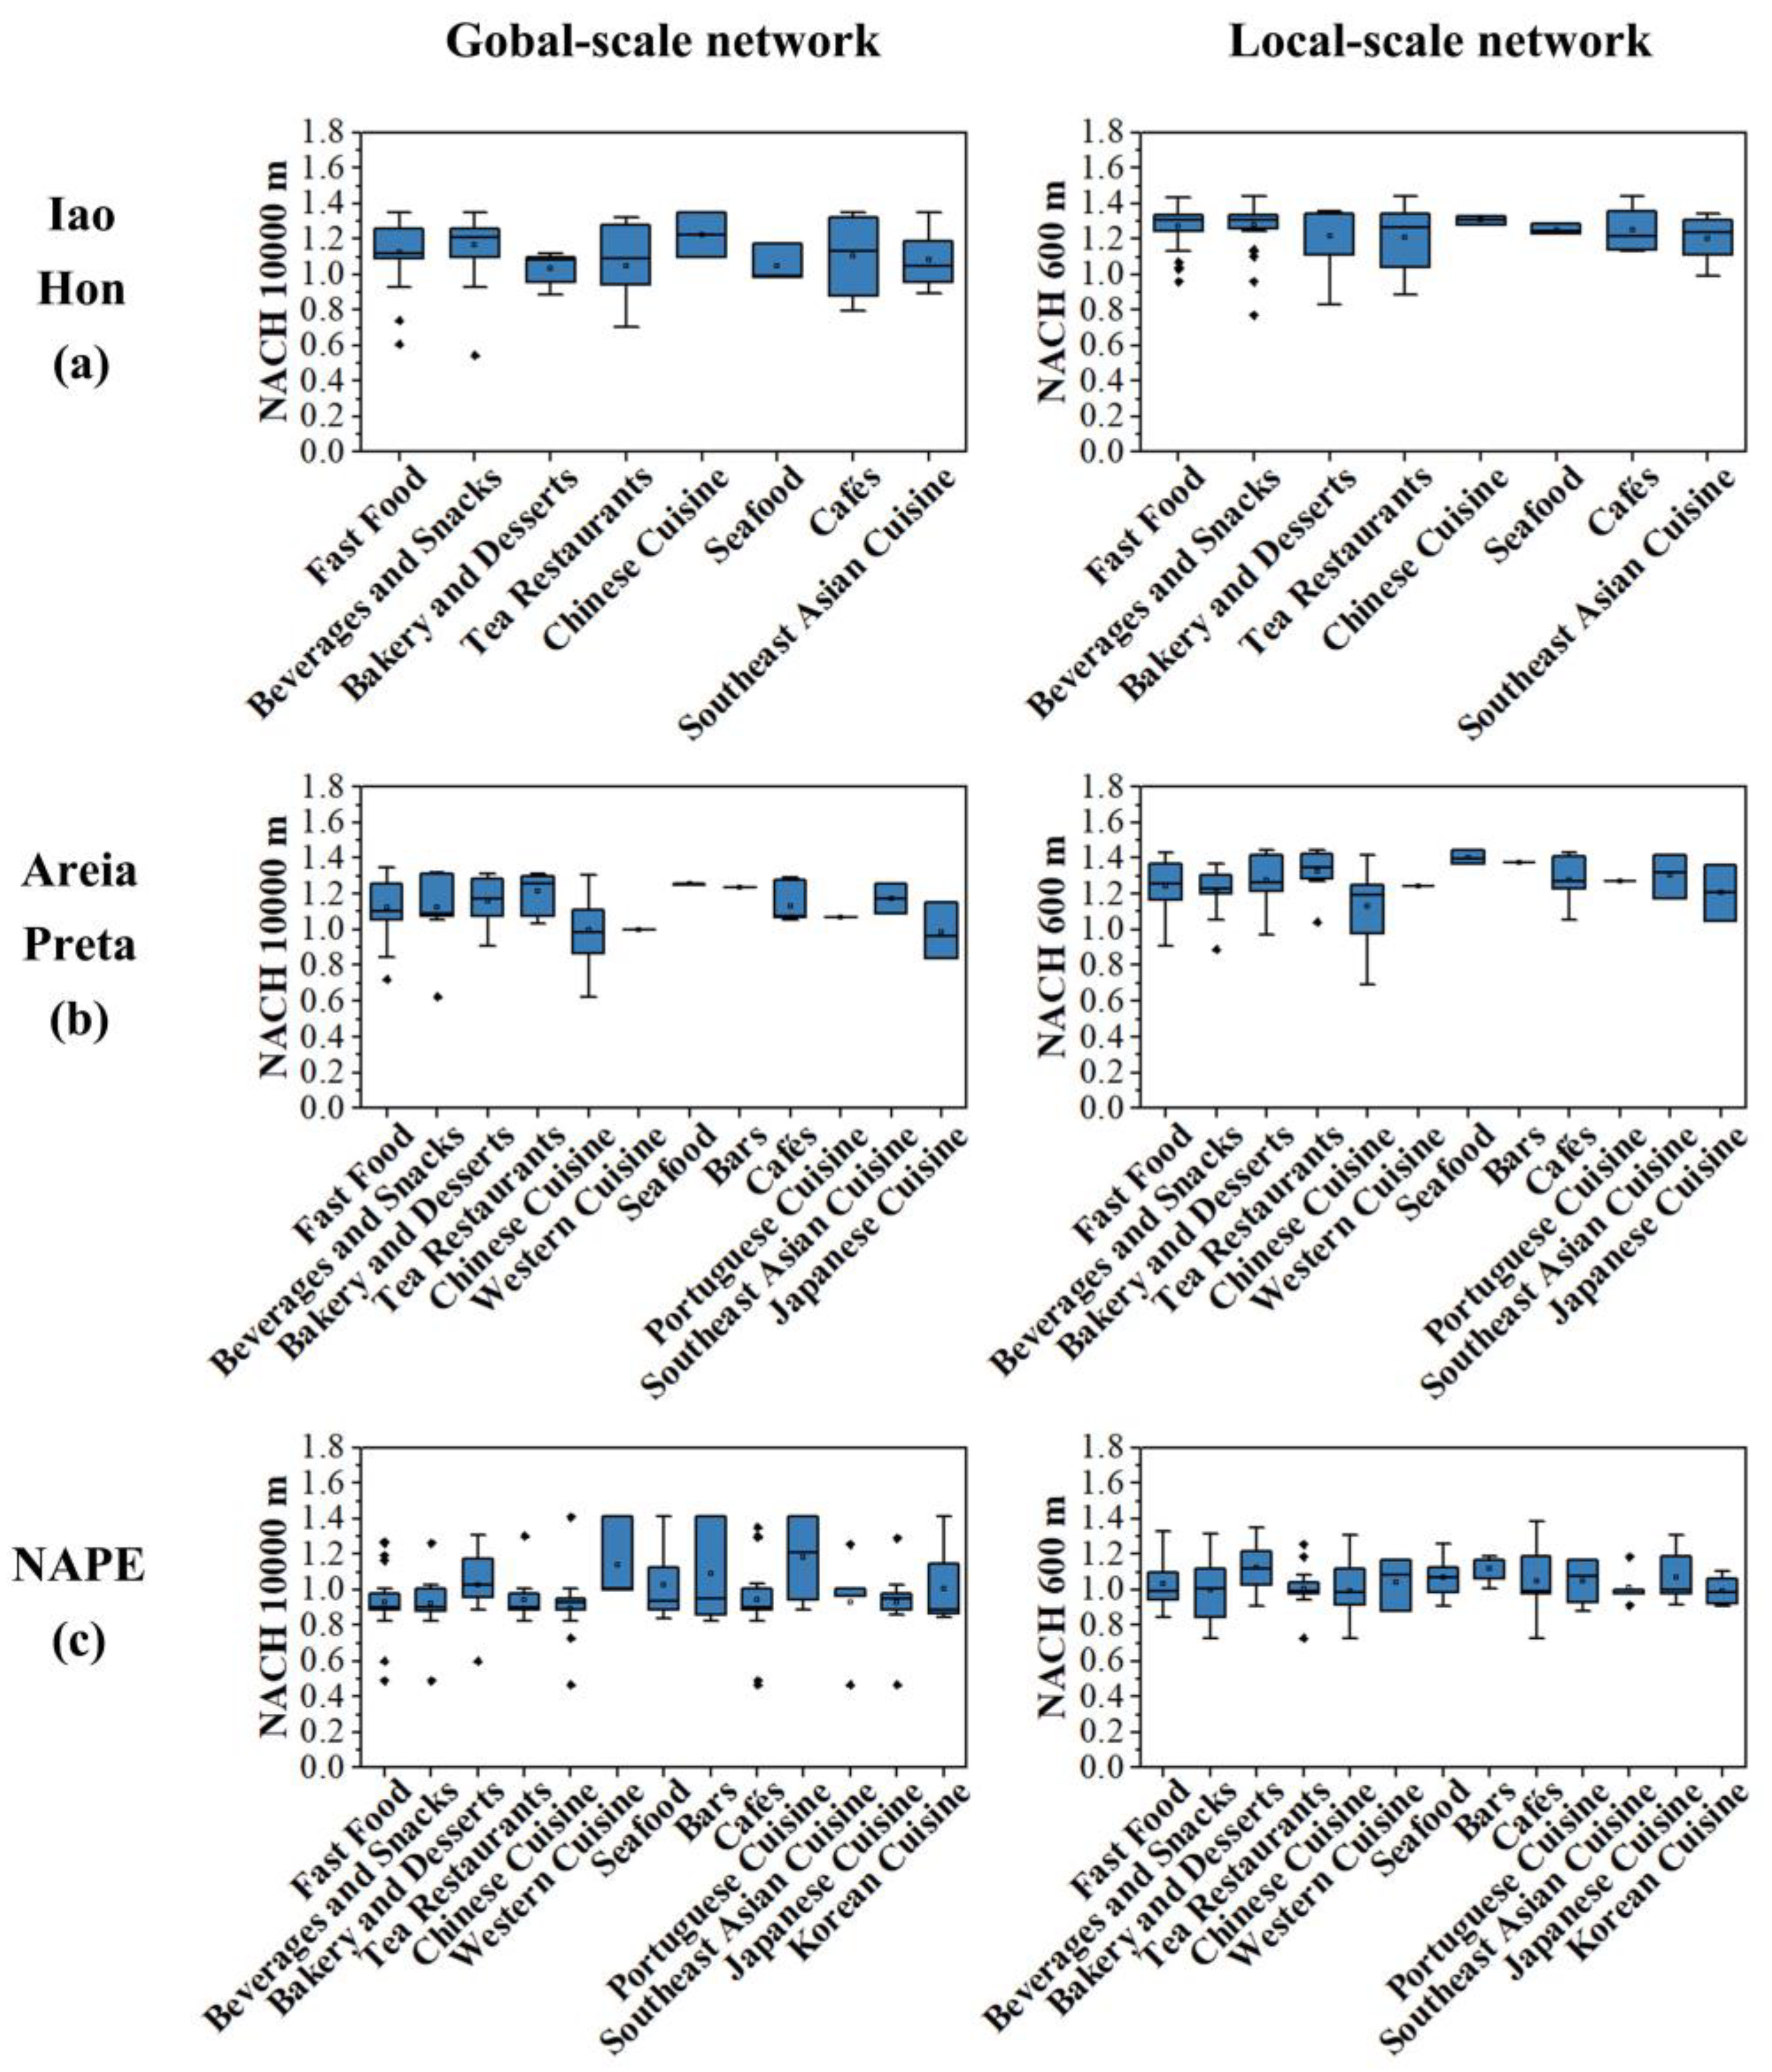
The distribution characteristics of different cuisine types further validate this pattern: grid-patterned areas, with simpler hierarchical structures, exhibit more dispersed accessibility distributions for the same type of cuisine, whereas organically shaped areas, with richer accessibility hierarchies, show more concentrated distributions for the same type of cuisine.
Specifically, fast food and lunch boxes, as standardized quick-service dining options, demonstrate distinct accessibility patterns. In grid-patterned areas (
Figure 17), their interquartile range (IQR) is relatively wide. At the same time, the whisker span is narrower (e.g., in the Areia Preta area, the IQR values for urban and local scales are 0.22 and 0.21, respectively, and the whisker spans are 0.51 and 0.53, respectively). In organically shaped areas (
Figure 18), the IQR is narrower. At the same time, the whisker span is broader (e.g., in the Costa area, the IQR values for urban and local scales are 0.24 and 0.19, respectively, and the whisker spans are 0.69 and 0.52, respectively). This indicates that fast food and lunch box establishments are more dispersed in grid-patterned areas and less dependent on specific accessible streets. In contrast, in organically shaped areas, they are more concentrated but capable of adapting to a broader range of street accessibility levels.
Chinese cuisine, as a group-oriented dining option with personalized and communal features, also has distinct patterns. In grid-patterned areas, the IQR and whisker spans are both wider (e.g., in the Areia Preta area, the IQR values for urban and local scales are 0.24 and 0.27, respectively, and the whisker spans are 0.68 and 0.73, respectively). In organically shaped areas, however, local-scale networks demonstrate significantly higher accessibility (e.g., in the Costa and Avenida de Almeida Ribeiro areas, the median values are 1.2 for both, with IQR of 1.18–1.27 and 1.08–1.22, respectively). This suggests that in grid-patterned areas, Chinese cuisine establishments are more dispersed and less dependent on specific accessible streets. In contrast, in organically shaped areas, they strongly rely on local-scale networks (pedestrian accessibility).
Cha chaan teng (local tea restaurants), as local dining options primarily catering to daily needs, also reflect these patterns. In grid-patterned areas, the IQR is more expansive. At the same time, the whisker span is narrower (e.g., in the Areia Preta area, the IQR values for urban and local scales are 0.23 and 0.15, respectively, and the whisker spans are 0.29 and 0.15, respectively). In organically shaped areas, the IQR is narrower. At the same time, the whisker span is broader (e.g., in the Costa area, the IQR values for urban and local scales are 0.2 and 0.2, respectively, and the whisker spans are 0.61 and 0.42, respectively). This suggests that in grid-patterned areas, cha chaan teng establishments are more dispersed but evenly distributed within a specific range of accessibility. In contrast, in organically shaped areas, their distribution is more concentrated and capable of adapting to a broader range of accessibility.
Southeast Asian cuisine, another local dining option catering to daily needs, exhibits divergent patterns between grid-patterned and organically shaped areas. In grid-patterned areas, the IQR and whisker spans are both wider (e.g., in the Iao Hon area, the IQR values for urban and local scales are 0.29 and 0.24, respectively, and the whisker spans are 0.46 and 0.35, respectively). In organically shaped areas, there are significant differences between sub-regions. In the Costa area, the IQR and whisker spans are narrower (e.g., the IQR values for urban and local scales are 0.15 and 0.23, respectively, and the whisker spans are 0.24 and 0.3, respectively). In the Avenida de Almeida Ribeiro area, however, the IQR and whisker spans are both wider (e.g., the IQR values for urban and local scales are 0.35 and 0.33, respectively, and the whisker spans are 0.4 and 0.36, respectively). This indicates that in grid-patterned areas, Southeast Asian cuisine establishments are more dispersed and less dependent on specific accessible streets. In contrast, in organically shaped areas, sub-regions display contrasting characteristics: establishments in the Costa area are more concentrated and strongly dependent on specific accessible streets, while those in the Avenida de Almeida Ribeiro area are more dispersed but capable of adapting to a broader range of accessibility levels.
In summary, the single-layered structure of grid-patterned areas results in lower dependence and weaker stability of dining distribution on accessibility. Conversely, the complex spatial textures of organically shaped areas support diversified distribution hierarchies, with different establishments exhibiting stronger accessibility dependence and distribution concentration. These findings provide direct evidence of how regional spatial morphology influences the distribution patterns of dining establishments, highlighting the role of different urban morphologies in organizing commercial spaces.
3.4. Auxiliary Analysis Results: Quantities and Proportions of Different Price Tiers and Cuisine Types Across the Five Areas
By supplementing and comparing the differences in the quantities of various restaurant types under grid-patterned and organically shaped areas, this analysis provides additional clues and evidence for understanding the distribution mechanisms of the catering industry in different street morphology models. However, solely relying on morphological classifications to divide areas makes it challenging to uncover significant patterns, as the differences in distribution quantities may also be closely related to the functional characteristics of the regions.
To address this, we introduced a classification based on spatial functional differences to complement the classification based on urban morphological differences. Together, these approaches provide more comprehensive support and evidence for exploring the distribution mechanisms of the catering industry in different street morphology models (
Table 4). Building on this foundation, this section aims to further explain the “diversified catering distribution hierarchy” observed in organically shaped areas, as discussed earlier, by incorporating the concept of “spatial functional differences”.
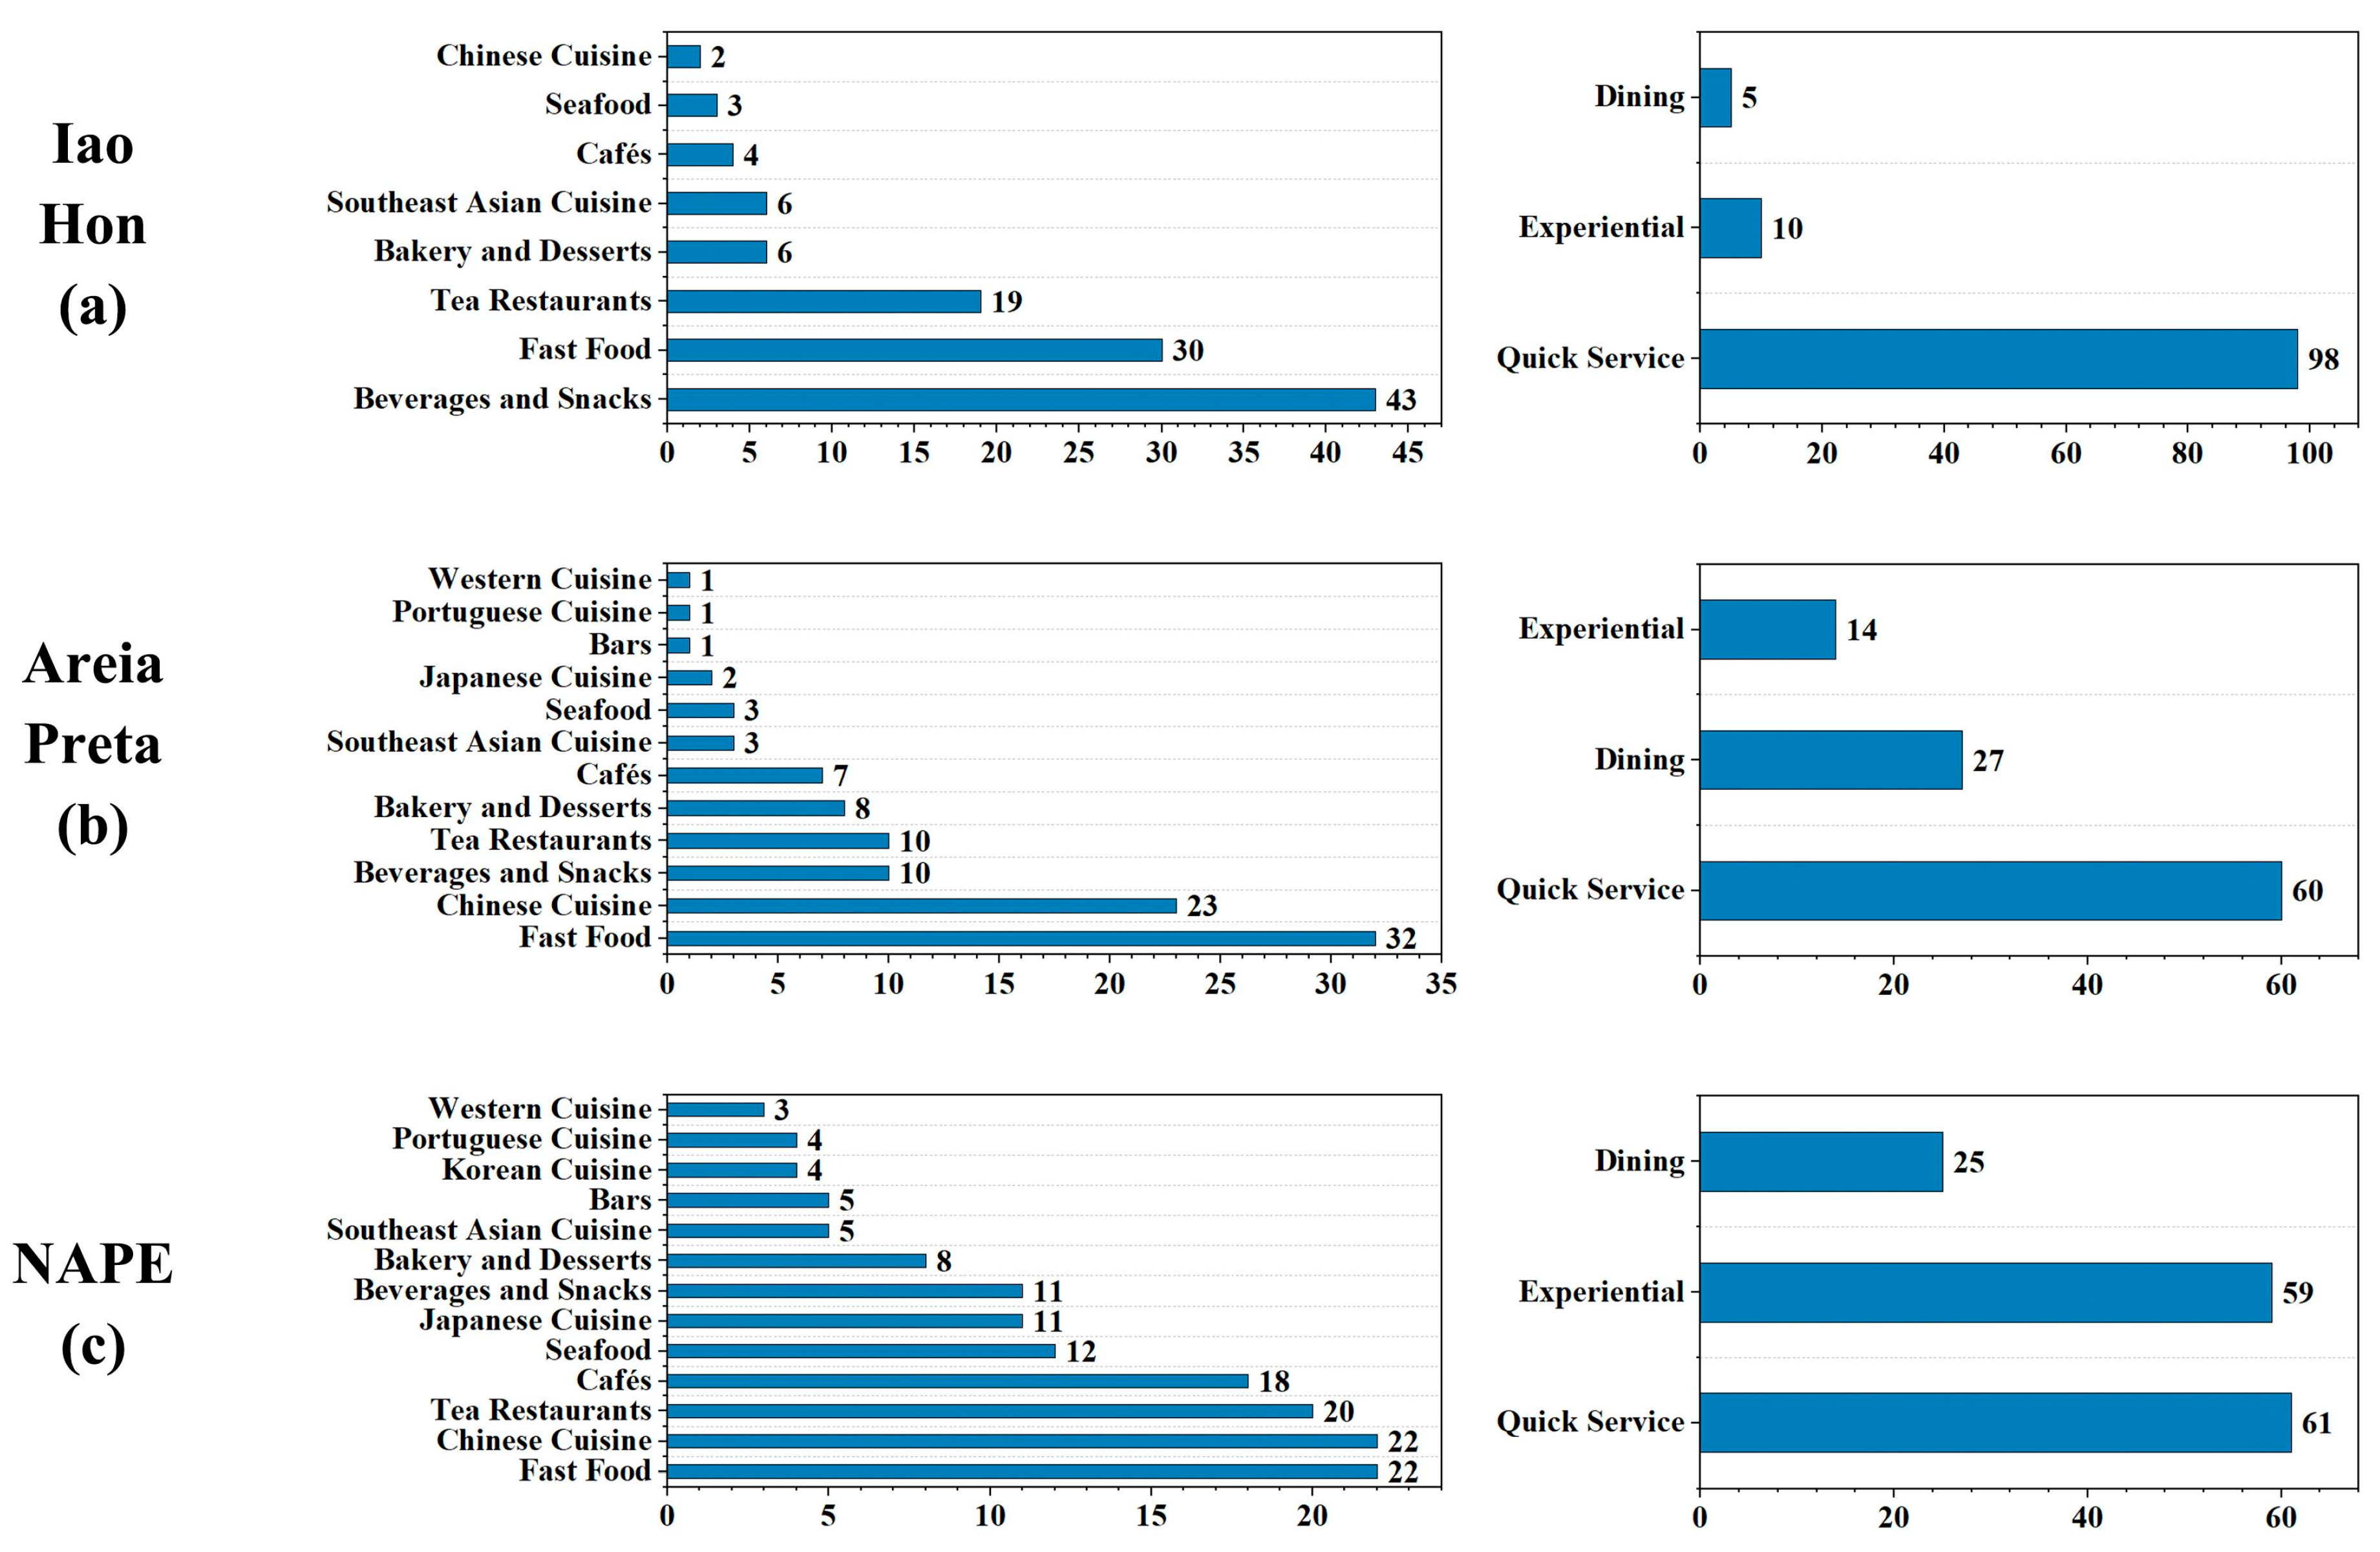
Figure 19 and
Figure 20 show that spatial functions have a greater influence over the number of different types of restaurants in grid-patterned areas. For instance, as residential districts, the catering industry in the Iao Hon area and the Areia Preta area align closely with the demands of local residents in terms of consumption levels and cuisine types. Conversely, the catering industry in the NAPE area primarily caters to tourists and office workers, exhibiting a distinct function-oriented characteristic.
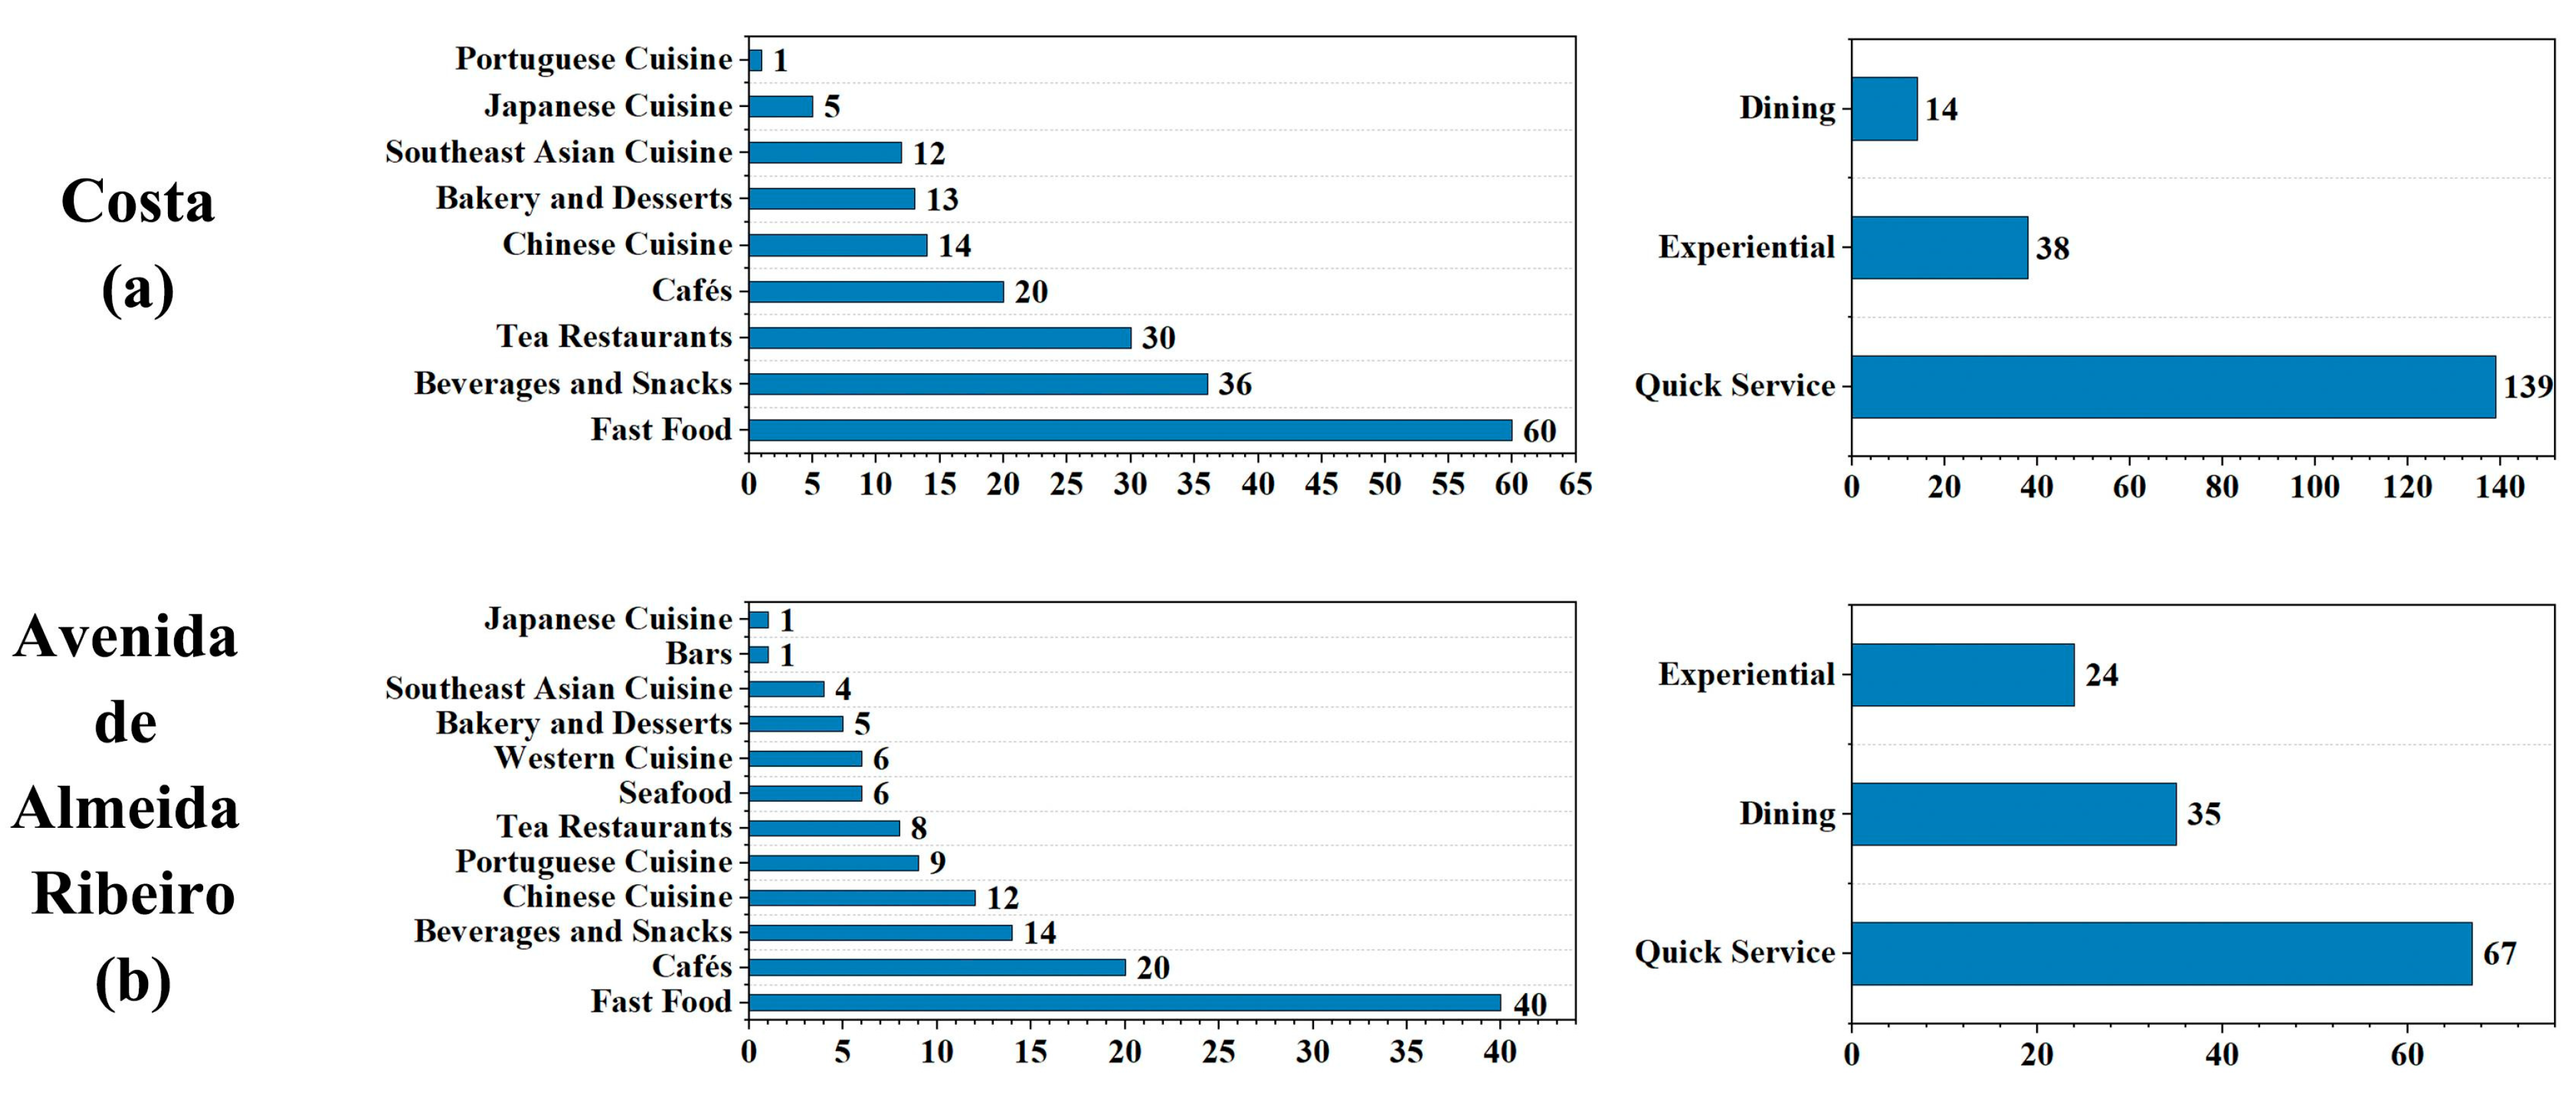
In contrast, as shown in
Figure 21 and
Figure 22, the quantity of different types of restaurants in organically shaped areas is less affected by spatial functions. Although the Avenida de Almeida Ribeiro area is classified as a tourism district, it demonstrates diversity in both cuisine types and consumption levels, with restaurants evenly distributed. Combined with the findings from the earlier spatial visualization and spatial configuration analyses, this feature can be attributed to the presence of residential streets inhabited by diverse ethnic groups, along with the influence of government-planned tourism streets. Similarly, despite being a residential district, the Avenida de Horta e Costa area exhibits commercial attributes that serve a broader regional scope. Further analysis from the previous spatial visualization and spatial configuration studies reveals that its urban-scale network supports commercial functions extending to other areas. In contrast, its local-scale road network predominantly meets the district’s residents’ needs.
3.5. Summary of Research Findings
Impact Mechanism of Grid-Patterned Street Morphology:
In grid-patterned areas, the uniform hierarchical structure results in a lower dependency of restaurant distribution on accessibility. Restaurants of the same type often exhibit unstable distributions, making it difficult for them to concentrate within specific accessibility ranges, thus leading to weaker distribution stability. Furthermore, the types of restaurants are more likely to be constrained by the functional characteristics of the space. Under this model, the simplified hierarchical structure provides a relatively equitable competitive environment and equal development opportunities for various establishments. Consequently, standardized restaurant formats exhibit a more substantial survival advantage in this environment, whereas personalized or differentiated dining formats may face more significant survival challenges.
Impact Mechanism of Organically Shaped Street Morphology:
In organically shaped areas, the complex hierarchical structure increases the dependency of restaurant distribution on accessibility. This structure supports the diversified distribution of restaurants across different levels of accessible street segments. Moreover, restaurants of the same type tend to rely on specific accessibility ranges, often clustering within these ranges, which enhances the stability of restaurant distribution. Under this model, the intricate hierarchical structure offers a broader range of accessibility levels for different types of establishments, further promoting the diversification of the local restaurant industry.
4. Discussion
The findings of this study further confirm the critical relationship between urban morphology and commercial distribution, supporting existing research that highlights the role of street patterns in enhancing commercial vibrancy. Liang et al. [
1], Sheng et al. [
2], and L. Zhou et al. [
34] have emphasized the pivotal role of street patterns in optimizing the organization of commercial spaces. Against this backdrop, studying the spatial distribution of the catering industry, an essential component of urban commercial activity can reveal how various street patterns influence the distribution of commercial establishments [
3,
5,
6,
7,
9]. By focusing on the catering industry, this study provides a foundation for understanding the relationship between street patterns and commercial vibrancy. Although studies by Rashid [
21], B. Hillier [
22], and Mohamed and van der Laag Yamu [
23] have demonstrated differences in accessibility, visibility, and commercial adaptability among various street patterns, these studies have predominantly focused on macro-scale or general functional classifications. They lack fine-grained analysis of commercial distribution, especially the spatial distribution of segmented business types in different urban forms. This study addresses this gap by systematically comparing the spatial distribution of the catering industry in different urban forms of Macau through a fine-grained analysis using space syntax and Dianping data.
Through a comparative analysis of Macau’s grid-patterned and organically shaped street patterns, this study identifies the following: Grid-patterned areas, due to their simple hierarchical structure, provide a relatively equitable competitive environment and equal development opportunities for various types of establishments. Consequently, standardized catering types demonstrate a more substantial survival advantage, while personalized or differentiated catering forms face more significant challenges. Organically shaped areas, due to their complex hierarchical structure, allow for diverse distributions of catering establishments across various levels of accessible street segments. Restaurants of the same type tend to cluster within specific accessibility ranges, enhancing distribution stability. This structure supports greater diversity in the catering industry, aligning with findings by Karimi [
26] and Sheng et al. [
2] on the role of urban complexity in promoting commercial diversity.
While this study focuses on the catering industry as a single commercial typology, it highlights the significant impact of spatial location on restaurant distribution. Catering establishments, as representative elements of small-scale commercial services, offer valuable insights into broader patterns of street-level commerce. Using analogies of “irrigation systems” and “reservoirs”, this study illustrates its findings. Grid-patterned streets resemble “irrigation systems”, where resources are evenly distributed through regulated channels, creating an efficient and expansive commercial network. However, certain functional buildings such as schools or enclosed facilities may have reduced visibility from the street and be perceived as less accessible to passers-by. This could potentially influence the flow of resources within the network, though further analysis would be needed to quantify this effect. Conversely, organically shaped streets function as “reservoirs”, accumulating and nurturing diverse commercial types. Hidden within low-accessibility alleys are unique cultural and niche commercial spaces, reflecting these areas’ diversity and sense of place.
Building on the reservoir analogy, this study introduces the concept of “cultural layer networks”, particularly evident in organically shaped areas and certain grid-patterned streets with unique spatial structures (e.g., the Areia Preta area). Cultural layer networks, supported by small streets and intricate spatial structures, foster diverse and localized commercial distributions, enhancing these regions’ cultural atmosphere and commercial vibrancy. While the concept of cultural layer networks has been alluded to in previous studies on “living spaces [
40,
41,
42]”, those studies have primarily focused on local cultural attributes of spaces rather than the influence of unified cultural networks on mobility patterns, activity ranges, and derived commercial clusters. This study advances the understanding of this phenomenon by quantitatively analyzing catering distribution using fine-grained data, overcoming the limitations of large-scale, single-dimensional studies to explore the complex dynamics between commercial distribution and urban morphology.
This study aligns with findings by Karimi [
26], Yang [
4], and Sheng and Wang [
6], which indicate that spatial structural diversity promotes commercial vibrancy. However, this study advances the field by combining space syntax segment models and Dianping data for a micro-scale analysis, revealing the role of “cultural layer networks” within local-level networks. Moving beyond the limitations of large-scale, coarse-grained analyses, this research deepens the understanding of how different urban morphologies influence the dynamics of commercial distribution, providing new perspectives and theoretical insights for detailed urban morphology research.
Theoretically, this study enriches the framework of urban morphology, validating the effectiveness of space syntax in micro-scale analyses of the relationship between urban spatial structures and commercial distribution. It uncovers the contrasting mechanisms of grid-patterned and organically shaped street patterns in resource allocation and commercial distribution. It introduces the concept of “cultural layer networks” in complex spatial structures. On a practical level, the case study of catering distribution in Macau offers an analytical framework and analogy-based approach that can guide planning in rapidly urbanizing areas, as well as the regeneration and promotion of vibrant commercial areas in organically based urban morphological regions, such as historic districts. This study further provides scientific evidence for optimizing commercial streets and achieving sustainable urban development.
This study’s innovation lies in its use of high-precision and multidimensional analytical methods and data to investigate the relationship between street patterns and the spatial distribution of the catering industry across different urban morphologies. By comparing grid-patterned and organically shaped urban forms, this study uses the analogies of “irrigation systems” (grid-patterned) and “reservoirs” (organically shaped) to elucidate the strengths and limitations of these street patterns in resource allocation and commercial support. The proposed “cultural layer network” concept explains how complex spatial structures influence local-level commercial distribution, promoting diversity in commercial types and enhancing the understanding of the dynamic relationship between street patterns and commercial distribution.
However, this study has certain limitations. Although Dianping data demonstrate potential in urban studies, their accuracy may be inferior to government statistical or precise measurement data. Nevertheless, the multidimensional nature of Dianping data provides unique advantages in studying commercial distribution and spatial vibrancy. Future research could incorporate diverse data sources and integrate review data from multiple platforms to validate and enhance the reliability of findings. Additionally, this study employs the segment model and its standard parameters within space syntax. While the axial line model offers additional potential parameters widely applied in urban morphology studies, this study prioritized the segment model for its precision. Future research could explore the axial line or the visibility graph model to delve deeper into the relationship between spatial vibrancy and urban morphology, addressing some of the limitations identified in this study.
Furthermore, although this study reveals the role of “cultural layer networks” in organically shaped streets, its impact on commercial regeneration and the enhancement of vibrancy in organically based urban areas (such as historic districts) still requires further investigation. Heritage protection policies, environmental perception factors, and broader socio-cultural dynamics, which were not explored in depth in this study, may further shape or regulate this mechanism. Future research could systematically explore these elements to better understand the mechanisms underlying commercial patterns and spatial vibrancy in organically shaped urban environments. Within the context of historic districts, further exploration could include strategies for heritage protection, adaptive renewal models, and long-term vibrancy restoration methods.
Future research could adopt a more comprehensive perspective on urban morphology. While this study primarily focuses on street patterns, plot, and building patterns’ combined effects are crucial for understanding the relationship between urban morphology and functionality. Further research could include joint analyses of plot and building patterns, exploring their interactions and effects on commercial activity. Additionally, future studies could incorporate methods and technologies related to environmental perception and cognition, such as integrating physiological data and psychological measurements, to investigate how individuals perceive space and how spatial morphology shapes urban spatial vibrancy. Qualitative methods such as interviews, field observations, and big data text analysis could also be employed to uncover the social and cultural logic behind the findings of this study.
5. Conclusions
This study explores the relationship between street patterns and the spatial distribution of the catering industry from an urban morphology perspective by integrating big data from the catering industry with space syntax theories and analytical methods. It addresses a gap in previous research within this field. The findings reveal that spatial distribution patterns of the catering industry differ under distinct street patterns. Specifically, the simple hierarchical structure of grid-patterned street patterns provides a relatively equitable competitive environment and equal development opportunities for different establishments. In contrast, the complex hierarchical structure of organically shaped street patterns offers more options for accessibility levels, fostering the diversification of the catering industry. These insights provide a new perspective on understanding how street patterns shape urban commercial environments.
Compared with existing research, this study is the first to systematically investigate differences in the spatial distribution mechanisms of street-level catering establishments under different urban morphologies within a unified space syntax framework. By employing high-precision analytical methods and multidimensional review data (including shop count and review count), this study reveals distinct resource allocation mechanisms and commercial distribution between grid-patterned and organically shaped street patterns.
Future research could build upon this foundation to further explore the connections between street patterns, building patterns, and commercial distribution. Additionally, incorporating methods and technologies from environmental perception and cognition research could help analyze the relationships between urban morphology, environmental behavior, and street-level commercial vibrancy. Qualitative approaches, such as interviews and big data text analysis, could also be utilized to uncover the mechanisms linking urban morphology and commercial activities. These studies will deepen our understanding of the relationship between urban morphology and street-level commercial activities, providing theoretical support for optimizing urban spatial structures and enhancing commercial functions.

