1. Introduction
The Land Administration System is essential in managing and planning a certain area [
1]. It provides relevant and accurate information and clarifies the land use and land ownership, and all those interested in it, such as the government, the communities, and the landowners [
2]. This system is closely linked with the cadastre, which is the premise of systematic registration of ownership of land, the boundaries of the land, and its use [
3]. Cadastre mapping is also helpful in land administration as it ensures that the current and complete details of the parcel, its use, and its owner are provided. Those cadastral data constitute essential information in land management and decision-making plans [
4]. Furthermore, accurate information on land use is vital in assessing taxes. If wrong or old information is used, local governments might suffer numerous tax losses [
5]. The combination of cadastral data sets with other spatial data sets like land use and soil maps appreciably improves the information quality, land management practices, and spatial planning [
6,
7]. Therefore, there is a need to constantly review and even validate cadastral data to capture changes in land use and to eliminate forged documents on the land title registration.
The Ministry of Agrarian Affairs and Spatial Planning/National Land Agency (or
Kementerian Agraria dan Tata Ruang/Badan Pertanahan Nasional—hereafter, ATR/BPN) is the leading ministry of Indonesia in charge of land administration [
8]. The activities conducted by the Ministry include complete systematic land registration (hereafter, PTSL) [
9], assessing land value zones (hereafter, ZNT) [
10], regional land stewardship balance (hereafter, NPTR) [
11], and detailed spatial planning (hereafter, RDTR) [
12].
Through the ministry, the government of Indonesia provides legal certainty for land rights holders through the Complete Systematic Land Registration Program with the implementation of massive and organized land certification [
13,
14]. The Complete Systematic Land Registration Program seeks to address land issues, improve land yields, and facilitate the recognition of land ownership rights to serve the various needs of the community [
15]. Despite the effectiveness of the Complete Systematic Land Registration Program, there are still some difficulties, such as inadequate human resources and infrastructure facilities [
16,
17].
The process of assessing land value or land value zones involves evaluating various factors, including distance to the city center and markets, accessibility, land use, and the presence of surrounding facilities and infrastructure [
18,
19,
20]. All these aspects are used to reflect the fair market price. Currently, Indonesia lacks a complete and structured information system to handle land data, especially at the sub-district level, which negatively impacts comprehensive land management and solutions to any disputes [
21]. In addition to that, the diverse classifiers in different agencies apply different classification systems, data sources, and scales for mapping, which results in poorly coordinated and competitive results that contain redundancies [
22,
23].
Talking about land, it is often related to spatial planning. The Detailed Spatial Planning Program in Indonesia provides detailed technical guidance on space utilization in spatial planning [
24]. This program guides the development of a country that contains strategic policies and spatial utilization programs to support the implementation of development and to improve the effectiveness of spatial utilization control [
25,
26]. Integrating spatial planning with the land administration system will optimize the efficiency and credibility of the planning data model [
27,
28]. Furthermore, it is believed that the integration of spatial planning and land administration with regional land stewardship balance is also necessary [
29]. The preparation of regional land stewardship balance is meant to guarantee that each area has sound rules to control land to meet the needs of the community and to maintain the ecological roles and strategic importance of the area [
30].
It is crucial to note that all the activities within ATR/BPN being executed concurrently, like ZNT, NPTR, PTSL, and RDTR, have different purposes and operating models based on their strategic emphasis [
31]. However, despite the differences in objectives and approaches, the processes are similar in some ways, especially in spatial data mapping. This is because several basic processes are identical, such as land data acquisition, field reconnaissance, the identification of boundaries, and geographic information checking and analysis. When these processes are conducted individually, resources are utilized in more than one way, particularly manpower, time, and operational budgets. This is why the fragmentation of activities increases operation costs even though some of the stages could be made simpler or integrated [
32]. Combining similar processes in cadastral mapping in developing countries has been proven effective because they enhance efficiency in data validation and analysis [
33]. Similarly, the ZNT, NPTR, PTSL, and RDTR activities promoting the acceleration of land mapping and spatial planning across the Indonesian region also encounter the same problems where the optimization of the resources can only be achieved if processes are carried out in combination.
In the context of cadastre mapping, it is paramount to take operational management into account. Operational management enables the establishment of goals, the creation of work plans, and the arrangement, leadership, and control of organizational activities to attain organizational objectives [
34]. Organizational goals are efficiently and effectively planned and achieved through man, method, material, machine, and money (5M), an element of operational management [
35]. Further, an operational management system can effectively acquire, sort, and interpret a large amount of big data from various disciplines and further enhance working efficiency, interdisciplinary cooperation, and immediacy while minimizing costs [
36,
37].
Operation management has been successfully proven effective in some industries, such as in the concrete industry to minimize non-value-added costs [
38] and in the oil and gas industry to improve time and financial efficiency [
39]. The operational management approach is believed to be a relevant solution to enhance operational cost-effectiveness by adopting and consolidating similar processes of the programs of the Ministry of Agrarian Affairs and Spatial Planning/National Land Agency. Among the elements of the 5M of operational management, money emerges as the most critical aspect since it has a direct impact on the project’s long-term viability, the deployment of effective data collection and processing techniques, and the procurement of necessary equipment [
40]. In addition, cost control using operations management can more effectively influence cost decisions in determining resource allocation, waste, and even organizational performance [
37,
41].
One of the tools to measure the cost efficiency is data envelopment analysis (DEA) [
42]. DEA is defined as a method based on mathematical programming which is used to assess the relative effectiveness of decision-making units (DMUs) with numerous inputs and outputs [
43]. In fact, many other analytical methods can be used to measure the efficiency level of an activity’s performance, such as stochastic frontier analysis [
44] and cost–benefit analysis [
45]. The data used in this study are non-parametric data with standardized values from the Ministry of Agrarian Affairs and Spatial Planning/National Land Agency (ATR/BPN) and a specific assumption in conducting the analysis, making the stochastic frontier analysis method less appropriate [
44]. Meanwhile, the cost–benefit analysis is also assumed to be inappropriate because the technique is more oriented towards the socio-economic and benefit value of an activity [
46]. It is also assumed to be less appropriate because this study uses annual program data from the Ministry of ATR/BPN, so the feasibility of a job is considered sufficiently viable to be carried out. Therefore, DEA is designated as the most appropriate method to be used in this study because the values to be measured in this study use simple ratio data that are not significantly influenced by assumptions from other factors outside the program and are annual programs of the Ministry of ATR/BPN that are considered feasible to be carried out in terms of socio-economic benefits [
47].
DEA has been applied in some areas such as to measure operational efficiency in education [
48], in transportation [
49,
50], and in banking [
51]; to identify managerial benchmarks and sub-optimality in the health sector [
52]; and to identify sustainable suppliers in supply chain management so that companies can make the right decisions to advance sustainable practices [
53,
54]. DEA in land administration is used in real estate cadastral offices in Spain, which verify that interagency collaboration can significantly improve the efficiency of public sector units to optimize administrative processes, reduce operational costs, and enhance overall organizational effectiveness [
55]. Meanwhile, DEA utilization in land administration in Indonesia is rarely explored.
This study aimed to determine the cost efficiency in the coordination of land administration systems and spatial planning in Indonesia. This includes complete systematic land registration (or PTSL), land value zones (or ZNT), and regional land stewardship balance (or NPTR). This study excluded detailed spatial planning (or RDTR) because its implementation involves too many data sources and procedures from various government agency offices outside the Ministry of ATR/BPN. RDTR is much more complex than ZNT, PTSL, and NPTR because it requires further data entangled and merging, legal issues, and many different parties involved in the planning and execution. While ZNT, PTSL, and NPTR are implemented in its regional-level offices, they function as backup databases that provide simple information on land use and the legal status of lands for RDTR activities. Therefore, it is not included in this study to the level of complexity in the RDTR activities, particularly as spatial data integration, multi-actor collaboration, and intricate legal analysis, which was considered incongruent with the directions of the investigations oriented towards programs in ATR/BPN regional-level offices.
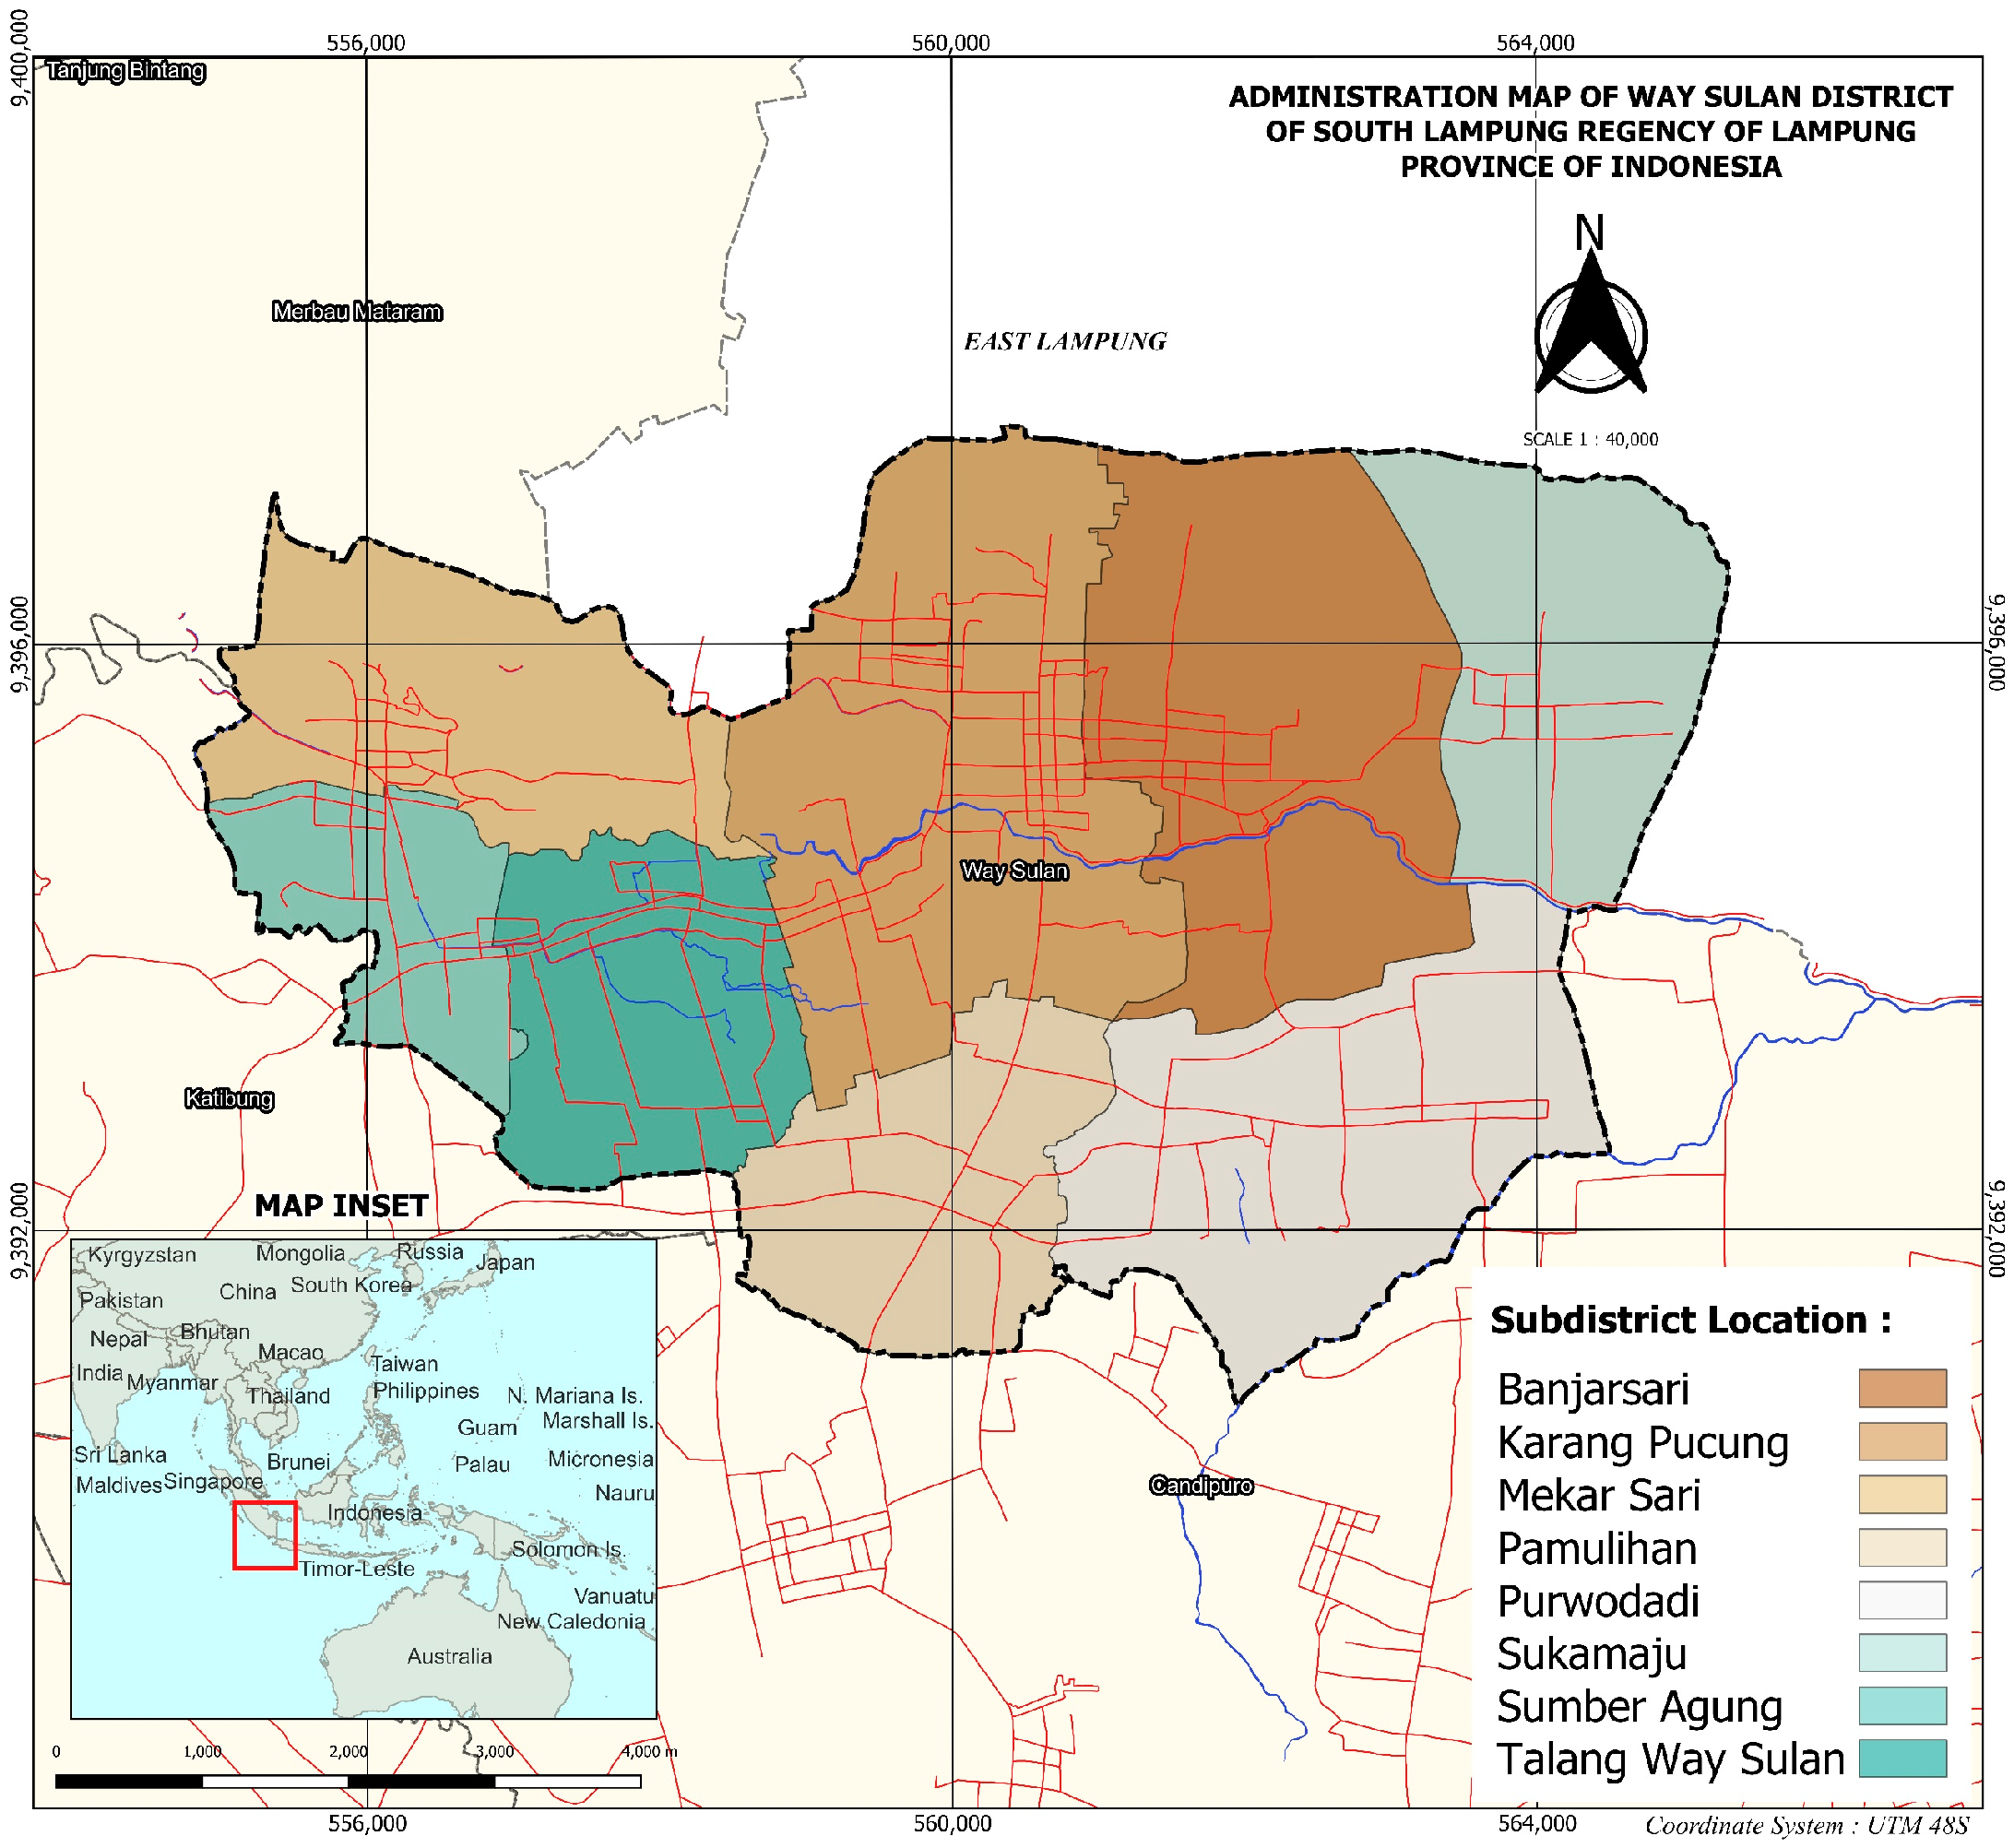
The technique employed in this study was data envelopment analysis (DEA) towards the assessment of the efficiency of the integration processes towards operational cost reduction and effectiveness of land management in Indonesia, especially in Way Sulan District of South Lampung Regency of Lampung Province. The approach used in this study offers a new perspective, namely the integration of cadastral mapping with operational management principles, to achieve cost efficiency. Unlike previous studies that focused more on technical aspects, this study emphasizes optimal resource management to improve efficiency in the mapping process. This innovation has been under-explored; therefore, it is expected to contribute significantly to more efficient land governance.
3. Results
3.1. Evaluation of the Scope and Focus of Research Activities
To evaluate the applicability and relevance of various program activities in land use analysis, assessing the suitability and level of involvement of these activities’ aspects is essential. The analysis of overlapping and non-overlapping activities of regional land stewardship balance (NPTR), complete systematic land registration (PTSL), national zoning and spatial planning (ZNT), and detailed spatial planning (RDTR) were conducted. This analysis aims to understand how each of the programs aligns with the study’s objectives and which activities are pertinent even though the efficiency and effectiveness of the land use implementation processes is not regarded yet.
After analyzing the overlapping and non-overlapping activities, it is clearly described that the RDTR program was not implemented by the Ministry of Agrarian Affairs and Spatial Planning/National Land Agency (ATR/BPN) at its regional-level offices. This is because the implementation of RDTR activities involves too many data sources and procedures from various government agency offices outside the Ministry of ATR/BPN. RDTR is much more complex than ZNT, PTSL, and NPTR because it requires further data entanglement and merging, faces legal issues, and involves many different parties in planning and execution. Meanwhile, ZNT, PTSL, and NPTR were implemented in its regional-level offices, and they function as backup databases that provide simple information on land use and the legal status of lands for RDTR activities. RDTR deals with spatial planning at the local level, which is a far more detailed analysis of zoning for residential use and especially for commercial, industrial, and green space as well as infrastructure use. RDTR entails an even more elaborate system of how resources will be utilized and deployed, for instance, the amounts allocated for capital expenditure, transport, and daily allowance within RDTR, demonstrating the need for technicality and coordination in the field. RDTR requires more focused and active management and calls on using more resources to accomplish its tasks.
Therefore, because of the analysis conducted for this study, the detailed spatial plan (RDTR) is no longer the focus of this research. This change was established based on the level of complexity in RDTR activities, particularly due to spatial data integration, multi-actor collaboration, and intricate legal analysis, which was considered incongruent with the directions of the investigations oriented towards programs in ATR/BPN regional-level offices. This approach helps the research evaluate data more effectively to support the analysis objectives.
Table 2 describes the outlines of some budgeting activities related to three programs: NPTR, PTSL, and ZNT.
Table 2 presents a comparative analysis of expenditure categories across three prominent land administration programs in Indonesia: complete systematic land registration (PTSL), land value zones (ZNT), and regional land stewardship balance (NPTR), delineating both overlapping and non-overlapping aspects. Overlapping aspects, indicative of shared resource utilization or common budgetary line items, suggest potential avenues for synergistic integration and cost optimization. For instance, the utilization of aerial mapping (X1) for basic mapping is a shared feature of both the PTSL and NPTR programs, while office supplies (X2) are required for administrative functions in PTSL and encompass both administrative and computer-related materials in ZNT. Meeting consumption expenses (X3), including provisions for snacks, meals, and participant transportation, overlap between NPTR and ZNT, but they are not documented within the PTSL program. Transportation costs (X4) exhibit partial overlap; PTSL involves personnel transport, ZNT includes transport from the province, and NPTR incorporates both transportation for meeting participants and daily allowances for personnel, demonstrating both shared and program-specific transportation needs. Daily allowances (X5), while present in all three programs, are differentiated by purpose and recipient specificity, ranging from stipends for survey personnel in PTSL to broader allowances for all personnel in ZNT and NPTR. Capital expenditure (X6) overlaps between PTSL, focusing on photocopying and supporting materials, and ZNT, encompassing map printing and report binding. Socialization activities (X7) represent a partially overlapping aspect, being documented for activity results within NPTR but absent in the ZNT and PTSL programs.
Conversely, non-overlapping aspects underscore program-specific budgetary requirements. Notably, ZNT does not utilize aerial mapping for basic mapping purposes, and NPTR does not include dedicated budget lines for office supplies. Meeting consumption is not a documented expenditure within PTSL, while both ZNT and NPTR allocate resources for meeting-related activities. Transportation costs in PTSL and ZNT are distinct from those in NPTR, which also incorporates daily allowances. While all programs include daily allowances, their specific application varies. Capital expenditures are distinct between PTSL and ZNT, while NPTR’s capital expenditures are not detailed in this context. Critically, socialization efforts are unique to NPTR, representing a non-overlapping programmatic cost. This comparative analysis serves to highlight opportunities for potential cost efficiencies through strategic resource sharing and the integration of overlapping functions, while simultaneously acknowledging the distinct budgetary requirements inherent to each program.
The following
Table 3 is the official cost budget for each aspect per hectare as activity disbursed by the Ministry of Agrarian Affairs and Spatial Planning/National Land Agency.
Table 3 describes the costs associated with each activity, where there are certain aspects that incur costs while others do not. All cost budgets are designated per hectare of land. For instance, aerial mapping (XI) is exclusive to PTSL, while socialization (X7) is only found in NPTR activities. There are also aspects that have costs in both activities, such as office supplies (X2), transportation (X4), and daily allowance (X5). Following the practices employed in this study, where NPTR, PTSL, and ZNT have common activities, the cost employed for each overlapping activity is computed from the highest expenditure. For instance, all three programs finance transportation; in this case, the greatest value is IDR 203,500 from NPTR, so it will be deemed the representative value used for the activity. This approach is applied to find areas where costs may have been wastefully incurred by supposing that flawed cost apportionment is rife in areas that share similar activities. This approach thus identifies the extent of possible synergies that can be gained from shared resources and similar coordinated programs for the same process activities, including a high-cost area such as meeting consumption (X3) and the transport of consumption (X4). Referring to the highest cost in non-integrated situations, this paper shows that through different degrees of coordination and activity integration, potential savings can be identified. From this analysis, it can be understood that, by separating concurrent activities, there is much better control over budgeting that can, in turn, lead to the more effective management of land administration and spatial planning in Indonesia.
Table 4 presents a comparative overview of the cost budget for seven distinct aspects of a project across two fiscal years, 2023 and 2024. All cost budgets are designated per hectare of land. The data reveal significant variations in budget allocation across both aspects and years. Notably, aerial mapping demonstrates a substantial increase in funding from IDR 30,000 in 2023 to IDR 50,000 in 2024. Office supplies also see an increase, rising from IDR 10,605 to IDR 18,803. A rise is evident in meeting consumption, which increases from IDR 2702.61 to IDR 122,000. Similarly, transportation costs are projected to increase considerably from IDR 39,949.96 to IDR 203,500. Conversely, daily allowances experience a significant decrease from IDR 148,331.85 in 2023 to IDR 33,200 in 2024. Capital expenditure also shows a decline, moving from IDR 24,000 to IDR 12,230. Finally, socialization costs are drastically reduced from IDR 7453.29 to IDR 745.
The highest budgets are found by explaining the above aspects of office supplies, meeting consumption, transportation, daily allowance, capital spending, and socializing. The maximum budget maximizes the mapping of transportation and the calculation of financing for the three combinations without decreasing efficiency. Then, a mathematical model [
61] is obtained to calculate the budgeted amount per hectare in one sub-district as follows:
Theorem 1. Mathematical modeling can calculate the budgeted amount in the study area, where y is total budget of Way Sulan sub-district; i is an aspect of the activity; Xi is the maximum budgeted value of the aspects of three activity (PTSL, ZNT, and NPTR); and A is the study area’s size in hectares.
The formula of Theorem 1 is used to generate the total budget for each activity (aspect) for the study area as shown in
Table 5, where each activity cost (cost budgeting of each aspect) is multiplied by the area of the location used as the study area (4421 hectares). All cost budgets are designated per hectare of land.
Looking at the data, varying degrees of cost efficiency improvements across different aspects can be observed. Aerial mapping (X1) demonstrates consistent costs, maintaining IDR 132,630,000 in both years, indicating no change in this area. Office supplies (X2) show a slight decrease from IDR 46,886,470 in 2023 to IDR 44,210,000 in 2024, resulting in savings of IDR 2,676,470. Meeting consumption (X3) also sees a minor reduction, moving from IDR 11,948,240 to IDR 11,800,000, with a difference of IDR 148,240. A more substantial decrease is evident in transportation (X4), where costs drop from IDR 176,618,800 to IDR 132,630,000, making for significant savings of IDR 43,988,800. Daily allowance (X5) represents the largest budget and shows a decrease from IDR 655,775,100 in 2023 to IDR 643,918,650 in 2024, a reduction of IDR 11,856,450. Capital expenditure (X6) remains constant at IDR 106,104,000 for both years, like aerial mapping. Finally, socialization (X7) also maintains a stable cost of IDR 32,951,000 across both years. While some aspects remained unchanged, there are demonstrable cost efficiencies achieved in several key areas, most notably in transportation and daily allowance, contributing to potential overall budget savings from 2023 to 2024.
3.2. Validity and Reliability Results
There are 27 items of questions in the questionnaire. The questionnaire was created based on seven shared aspects, namely aerial mapping, office supplies, meeting consumption, transportation, daily allowance, capital expenditure, and socialization. In this analysis, Pearson’s correlation method was employed, with an r-table value of 0.43 serving as the threshold for validity determination. If the value of each question item (Rxy) exceeded the r-table value, the item was deemed valid. Conversely, if the value was below this threshold, the item was considered invalid and required revision or removal to avoid compromising measurement accuracy [
58]. Based on the results of the validity test conducted on 27 question items, 26 items were declared valid, with only one item deemed invalid due to its Rxy value falling below 0.433.
Table 6 below provides a summary of the validity test results.
Furthermore, the Cronbach’s alpha value obtained through calculation is 0.968. This indicates that the questionnaire possesses exceptionally high reliability. Essentially, each question within the questionnaire demonstrates strong consistency with the others, suggesting that respondents are likely to provide stable and consistent answers. Given this high reliability, it can be concluded that the employed instrument is highly effective in measuring the variables under investigation, and there is no immediate need for improvement in terms of internal consistency.
3.3. Efficiency Tests Using DEA
DEA was performed on various operational aspects of the program of the Ministry of Agrarian Affairs and Spatial Planning/National Land Agency, and it revealed a difference in the efficiency level of each operation. DEA was applied to assess the effectiveness of sensitive areas such as aerial mapping, office supplies, meeting consumption, transportation costs, daily allowance, capital costs, and socialization. Such an evaluation lets one see which units are most efficient in using resources and which require attention in budgeting and other resources. Expenditure on office supplies demonstrated reasonable efficiency, and equipping several programs such as PTSL, ZNT, and NPTR eliminated some avoidable expenditures. This was particularly helpful in minimizing procurement duplication realized in several programs that had been implemented individually before. The following table illustrates the efficiency level of the integration activities using DEA.
Table 7 details the result of the DEA, evaluating the impact of integration activities via cadastral mapping on the efficiency of decision-making units (DMUs). DMU 1 and DMU 2 have the same efficiency level. The solution status indicates that both DMUs achieved an optimal solution. In addition to that, both of the DMUs illustrated an efficiency score of 1.00. This emphasizes the result that the integration process did not exhibit a negative effect toward efficiency.
4. Discussion
The result of this study generally shows that integrated cadastral mapping through the operational management approach achieved relatively significant cost efficiency. The discussion begins with the explanation of the following
Table 8 and
Table 9, which describe the decision-making unit (DMU) of each aspect in 2023 compared to 2024, where Input 1 and Output 1 mean the expenses before the integration of PTSL, ZNT, and NPTR; meanwhile, Input 2 and Output 2 reflect changes after the implementation of system integration.
Referring to
Table 8 and
Table 9 above, the amount of integrated mapping costs can be described as shown in
Figure 3 and
Figure 4 below, where all cost budgets are designated per hectare of land.
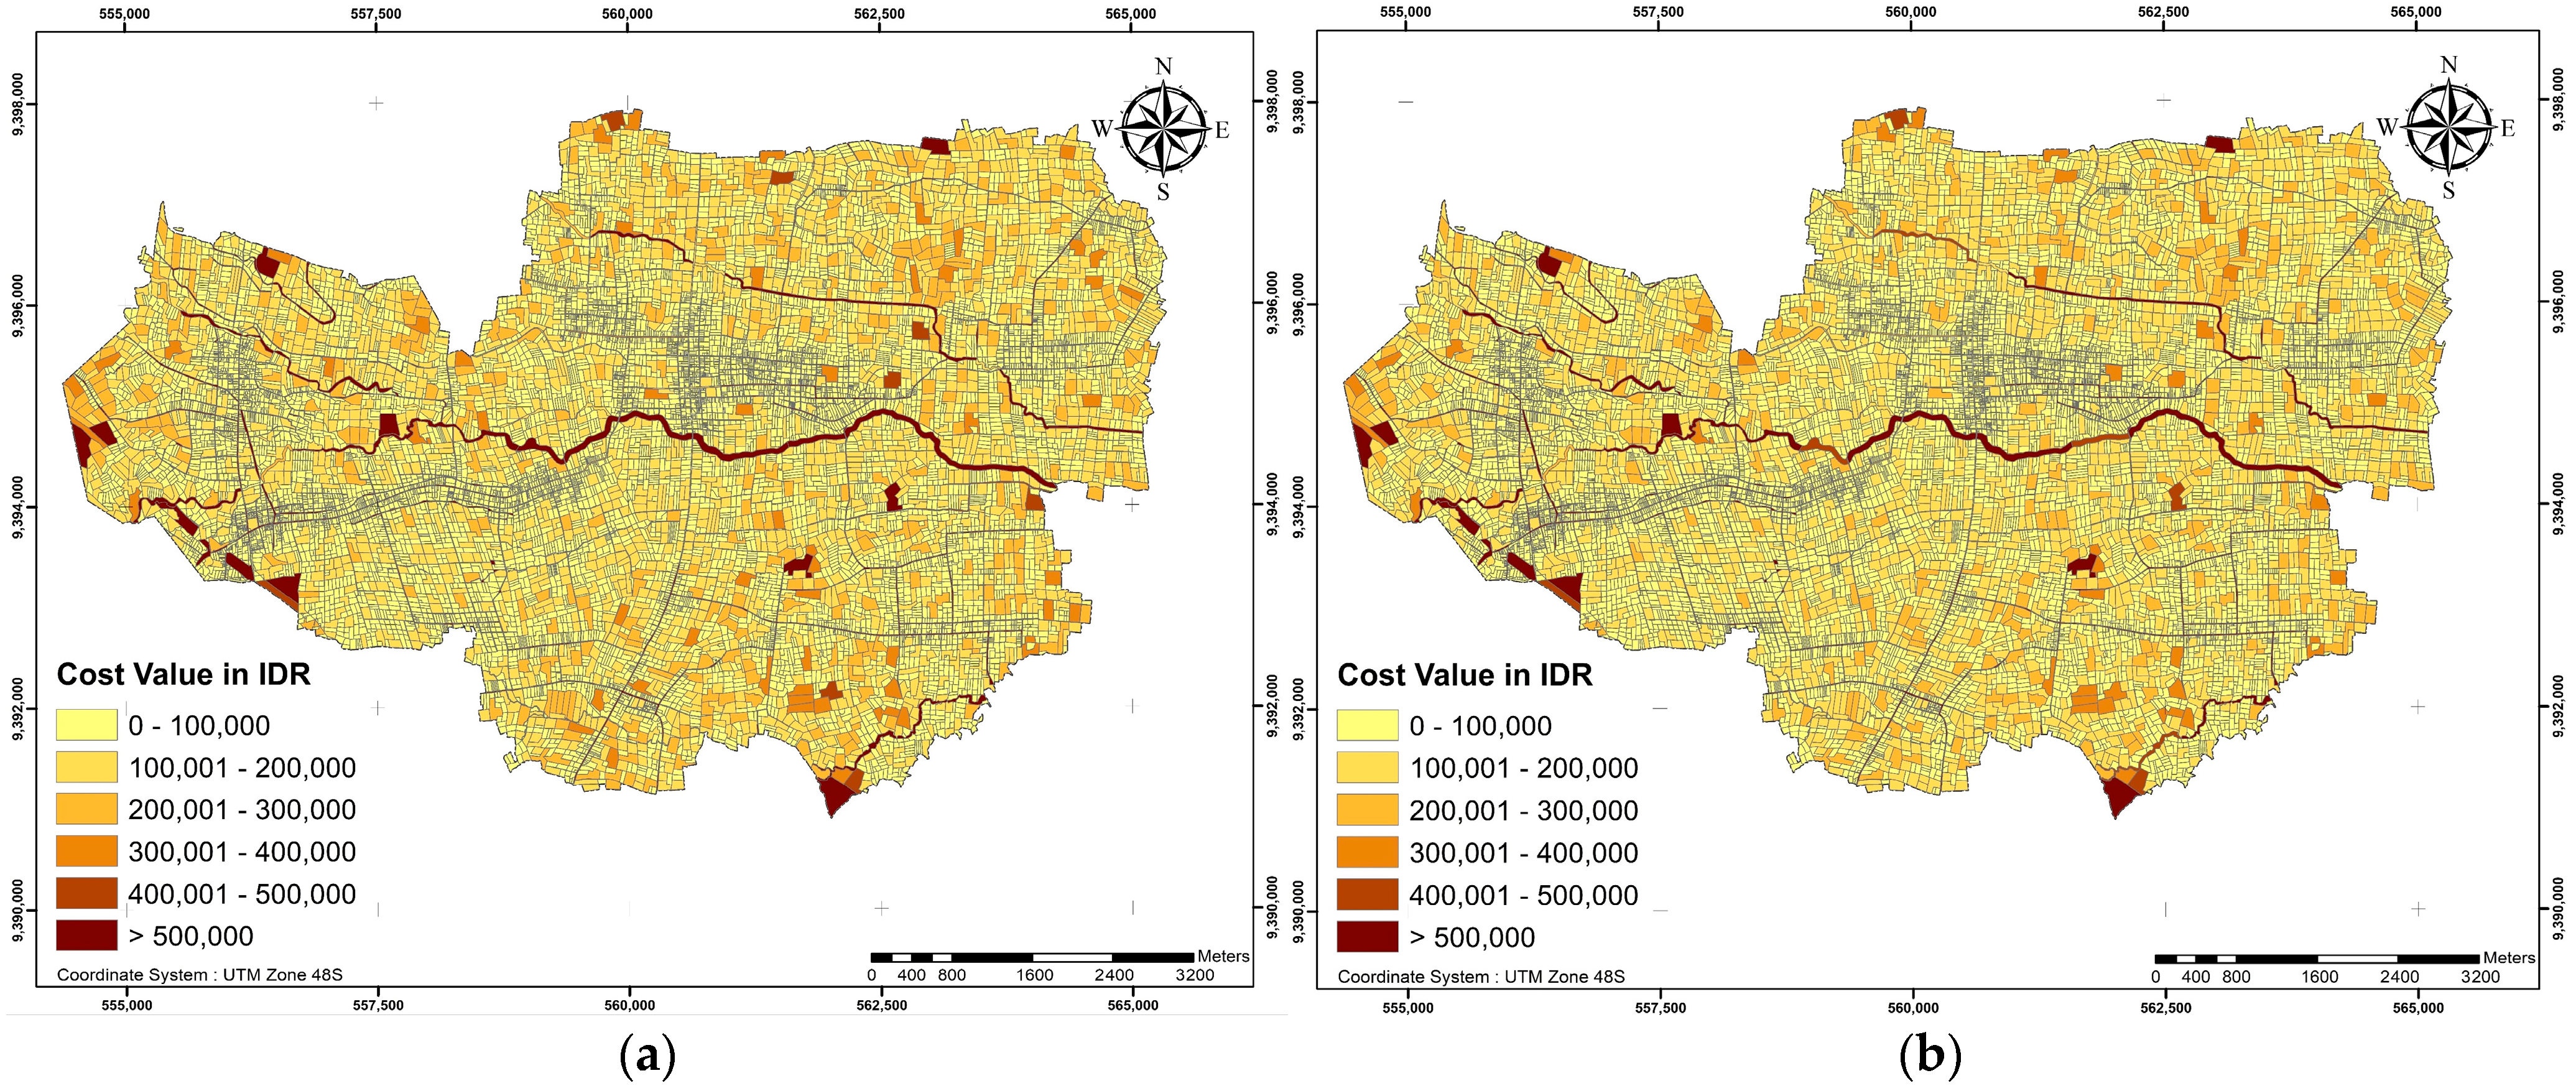
The reduced integrated cadastral mapping costs are presented using the distribution maps in
Figure 3 and
Figure 4 for 2023 and 2024, respectively, after implementing operational management. The use of operational management to enhance factors of integrated cadastral mapping is intended to optimize expenditure activities, as tested for effectiveness through DEA analysis.
The maps in
Figure 3a and
Figure 4a illustrate that dark shades are areas with high costs per hectare, suggesting that the various cost centers poorly planned their budgets. Such areas are usually situated in remote areas that may have restricted land space or hard access, hence making mapping activities expensive.
Figure 3b and
Figure 4b demonstrate a notable shift in the post-integration cost distribution: a relative increase in light hues, a decrease in the cost per hectare, and an increase in production efficiency. Test results with DEA show positive efficiency increases, chiefly in strategic forms of the utilization of agricultural land and geographical objects of interest, whereby costs were most reduced. At the same time, the level of increase in the overall efficiency was even higher for densely populated residential areas with small territories, albeit not at the level of improvement in the efficiency of areas used for agriculture. From this analysis, it can be argued that operational management enhanced the quota in a better manner by using the overall budget in Way Sulan sub-district, which has a solid ground preparation for more efficient improvement of the resource allocation plan.
Based on the efficiency test in 2023 and 2024 for the Way Sulan sub-district, covering an area of 4421 hectares in the application of the DEA method, there were differences in the budget for each aspect of the activity. In the aspect of aerial mapping, although the continued budget in 2023 was IDR 30,000 and the proposed budget in 2024 was IDR 50,000, the efficiency score was still in the same range of IDR 22,314,460 and there was still an opportunity to increase efficiency. Office supplies continued to experience a slight increase in the efficiency score, where the budget allocation was reduced by IDR 10,605.40 from the 2023 budget and increased to IDR 1,880,000 in the 2024 budget. However, the efficiency score increased from IDR 22,885,720.00 to IDR 23,019,730.00. Similarly, there was an increase in cost efficiency in consumption for meetings, where the score increased from 22,444,860 in 2023 to 23,753,120 in 2024 despite the higher budget. The transportation aspect recorded the highest level of efficiency in both years, so that the budget could be allocated optimally, which was IDR 24,995,350 in 2023 and IDR 24,974,680 in 2024. In the daily allowance aspect, the portion decreased from IDR 148,331.85 in 2023 to IDR 33,200 in 2024; however, the efficiency increased from IDR 22,499,900 to IDR 23,031,410. This showed that there was a better way to utilize the available resources. Capital expenditure remained efficient in allocating funds. However, the amount, which was IDR 24,000 in 2023, dropped to IDR 12,230 in 2024, and the efficiency score only reached IDR 22,314,460. Furthermore, there was also relatively the same consistency in terms of efficiency in the field of socialization despite the decrease in budget allocation. In 2023, the efficiency value reached IDR 5148 per hectare, indicating good performance in resource management. However, in 2024, the efficiency value decreased to IDR 4984 per hectare. So, it is confirmed that the average efficiency value is IDR 5066 per hectare. Overall, there seems to be successful management of all aspects of expenditure, although there still seems to be room for improvement in the efficiency of aerial mapping, capital expenditure, and socialization. Therefore, a more comprehensive analysis is needed to improve budgetary control of all BPN activities for a better and more optimal balance of resources.
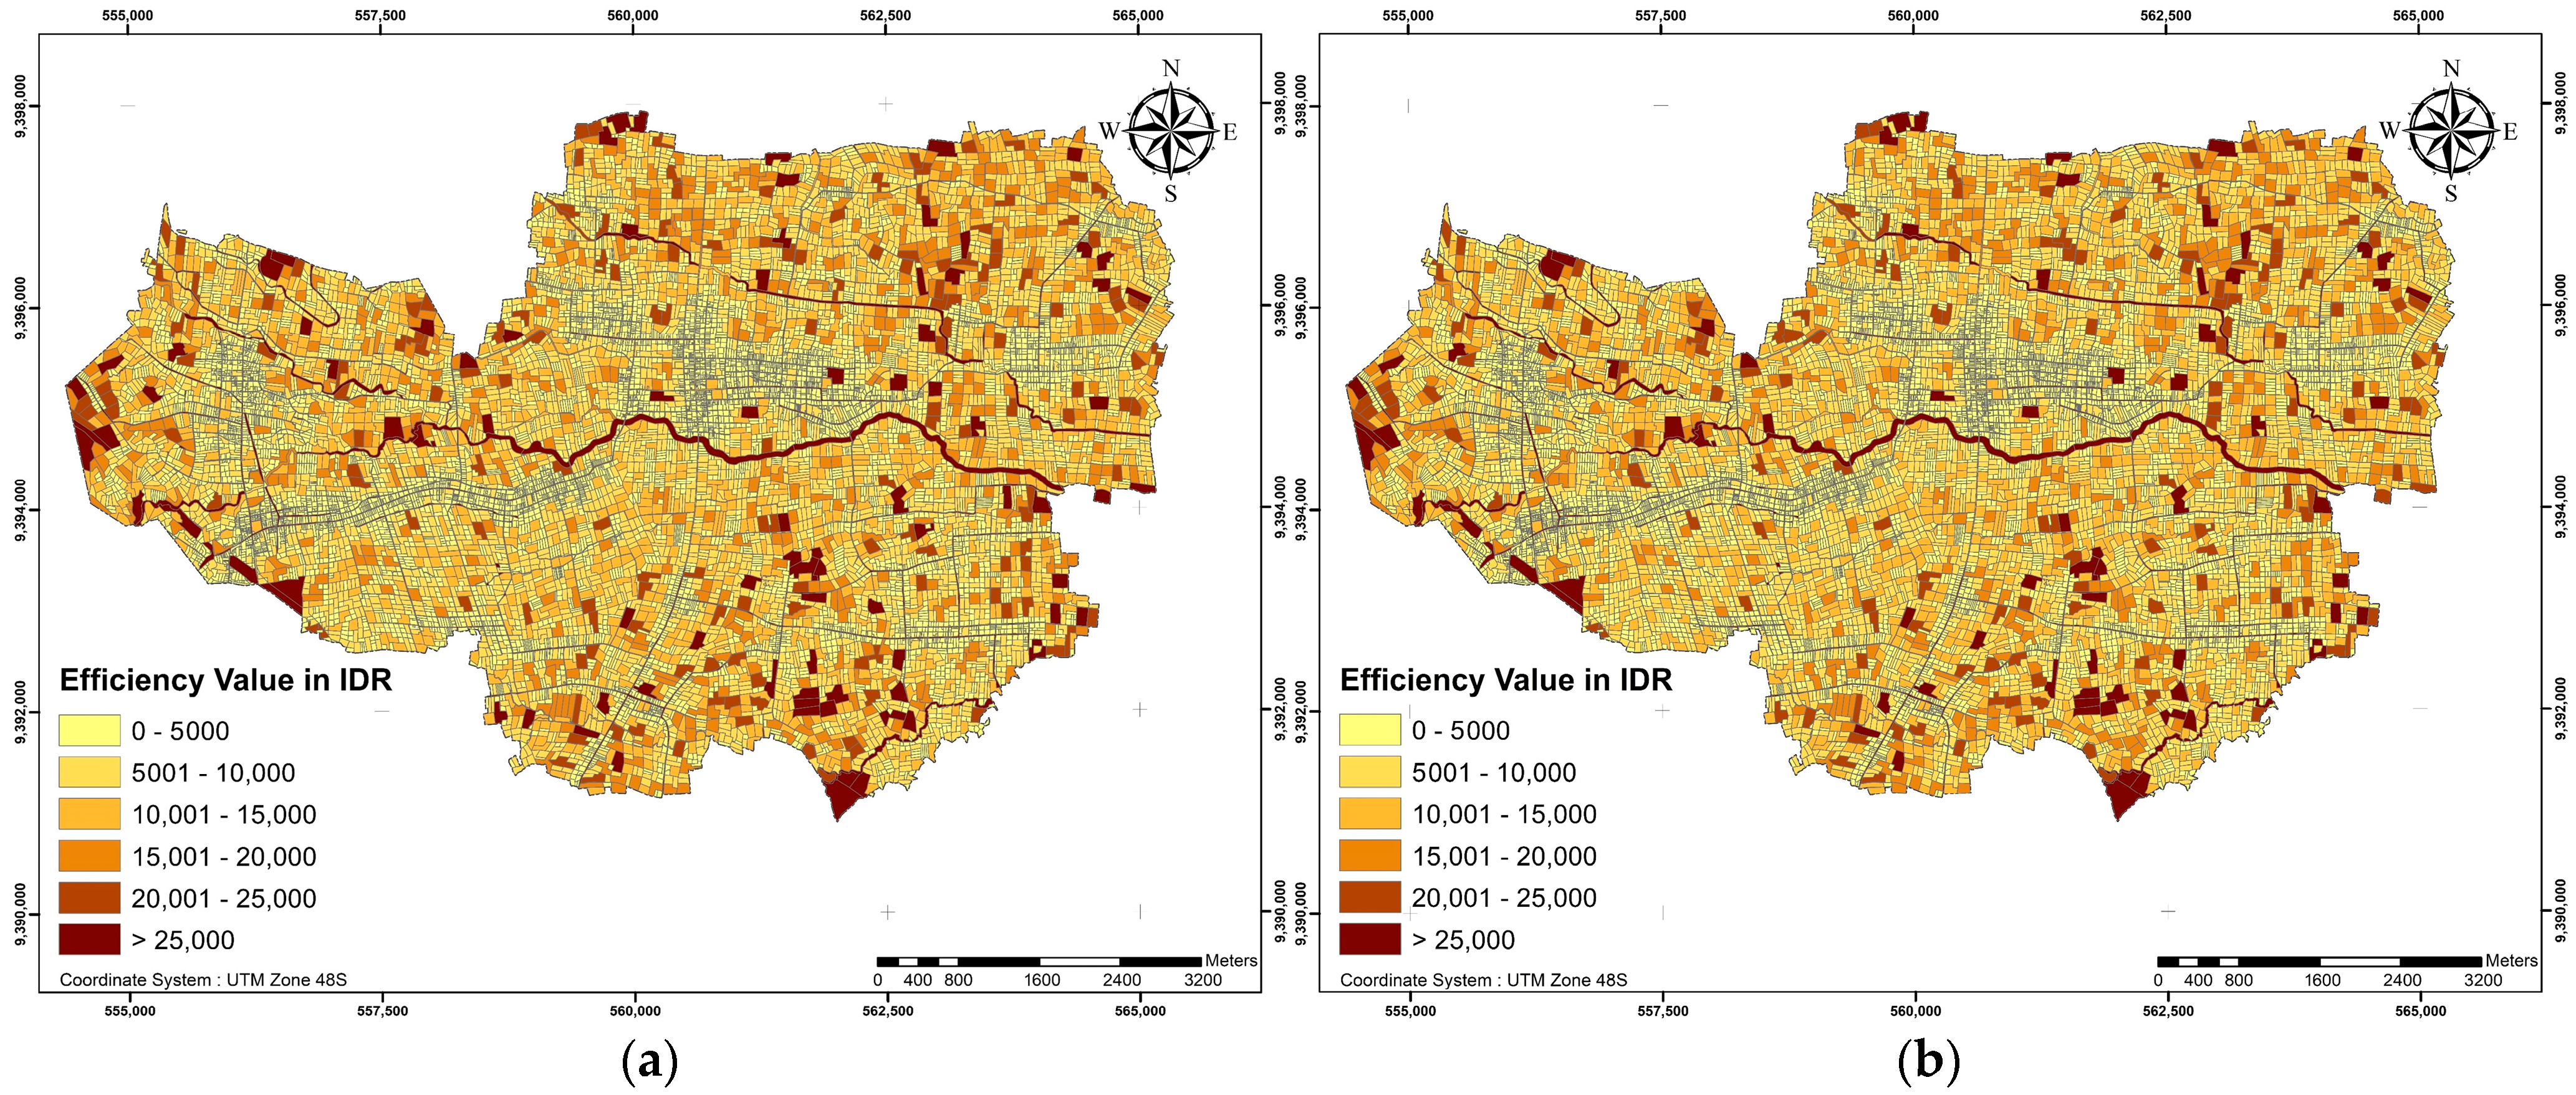
Figure 5a,b indicate the efficiency values of integrated mapping in two years during operational management implementation. The figures depict cost efficiency for each parcel and hectare in Way Sulan sub-district for 2023 (a) and 2024 (b), primarily considering the integrated cadastral mapping cost efficiency value. A darker color represents a higher cost per hectare of input, showing the best efficiency level. The darker maps are almost in the agricultural fields, and areas with geographical objects such as rivers and roads are more efficient than the white-marked maps, which represent the areas of residence. When applied to integrated cadastral mapping, the operational management was less effective within densely populated areas. This is because the land occupied by housing is much smaller than the region for agricultural production. Agriculture areas offer a bigger size of land; hence, they have higher efficiency in running the three mapping programs in one by applying operational management. On the other hand, populated residential areas tend to have smaller land size; therefore, they have lower efficiency than agricultural areas when running this program. Furthermore, agricultural areas take advantage of geographical features with less restricted access and other objects to mapping, and this has an impact on the efficiency of the entire process. Thus, it can be interpreted that the application of operational management in cadastral mapping is more effective in large areas of agricultural land. On the other hand, in a densely populated area, the efficiency is low since it costs more per parcel in each hectare of land.
Previous studies have been confined to applying the money elements of assessing the efficiency of a program. They mostly looked at how much money has been used and how many items have been created. They involve more of the number of activities achieved, the area covered by the map, or the documents produced without much emphasis on the quality of the completed work. For instance, the number of registrations or covered area of land within the stipulated period may have gone up; however, this does not mean the paper or the maps that have been produced are of good quality [
62,
63].
This research focuses on cost efficiency but has not addressed how program integration impacts the quality of cadastral mapping or stakeholder satisfaction. In implementing DEA in this study of integrated cadastral mapping, it is found that DEA has its limitations. In terms of quantity, it can indeed save the budget, but we did not further examine the quality of the mapping. In general, if the budget is reduced, the quality also tends to decrease, including the accuracy of the map. DEA is carried out in a certain period and only compares efficiency before and after budget changes. However, the long-term impact of efficiency, such as improving mapping quality or reducing operational costs in the next few years, cannot be directly measured with DEA.
The lack of quality assessment may also contribute to the overall picture of the program’s efficiency without focusing on the quality. In addition, the quality evaluation does not include some crucial factors linked to quality, including the gathered data or the service users’ satisfaction with the implemented system. Furthermore, an adverse variety of any program yield, such as geographical data, administrative blunders, and nonstandard documents, may greatly influence the entire program’s sustainability and legitimacy. This could also negatively affect the quality, leading to other issues. It is because subsequent improvements are increased, cost is also elevated, and productivity is reduced. For instance, the process of correcting whether the maps have fulfilled certain standards does consume much time and utilize many resources. It means that even though the program seems to be far more quantitative, it saves costs and time which might have been spent making revisions or corrections at some other time. This means the efficiency is zero.
Thus, to obtain a more detailed picture of efficiency, it is necessary to expand the analyzed parameter range by the quality of the work completed by the program. Such an assessment that comprises quantity and quality-based aspects will lead to a more comprehensive evaluation and thus offer a better guideline in the decisions that need to be made in terms of budget and operations. This means subjecting improvements to quality scrutiny, not only to achieve enhanced numbers as targets require but also in terms of their future viability in terms of permanently achieving results that have a positive and lasting end effect.
5. Conclusions
This study aimed to evaluate the cost efficiency of integrating Indonesia’s cadastral mapping programs (PTSL, ZNT, and NPTR) through operational management, specifically focusing on seven key aspects: aerial mapping, office supplies, meeting consumption, transportation, daily allowance, capital expenditure, and socialization. Utilizing data envelopment analysis (DEA), this research demonstrated a significant increase in capital resource efficiency within the integrated mapping system at the Way Sulan District, South Lampung study site. Notably, an average efficiency gain of IDR 5066 per hectare was achieved, with agricultural areas exhibiting higher efficiency compared to organizational areas. These findings confirm that implementing financial operational management within integrated cadastral mapping leads to substantial cost savings, reinforcing the efficacy of this approach for enhancing performance efficiency, especially in areas with complex land use with larger land area geometry.
This reinforces previous research findings, affirming the feasibility of operational management as a tool for enhancing performance efficiency. The estimated budgetary savings underscore the viability of this model as a policy implementation alternative within the Ministry of Agrarian Affairs and Spatial Planning/National Land Agency (ATR/BPN), particularly at the district/city level in Indonesia. Consequently, these efficiencies enable the ATR/BPN to execute three concurrent activities while covering a wider area, thereby expediting the achievement of the integrated mapping target for a comprehensive Indonesian map. Moreover, the integrated cadastral mapping budget efficiency demonstrated in this study aligns with the Indonesian government’s ongoing efforts to streamline budgets across various governmental sectors, including the ATR/BPN. Hence, even with the revised budget allocation, the ATR/BPN can still execute three integrated mapping programs relatively effectively.
Subsequent research should address several key areas: First, a qualitative analysis of the impact of budgetary efficiency on map quality resulting from the implementation of the integrated cadastral mapping model through an operational management approach is warranted. Furthermore, the development of alternative cost-efficiency analysis models beyond data envelopment analysis (DEA), capable of projecting future efficiency values, should be explored. Additionally, the broader application of integrated mapping models across diverse nations would enable the incorporation of additional research parameters and aspects, thereby facilitating the development of a more comprehensive model. Ultimately, it is hoped that these efforts will contribute to the establishment of a globally applicable integrated mapping model.


 ,
, 


