Abstract
Open spaces in housing estates are crucial for residents’ physical and mental well-being, especially when access to other public spaces is restricted (e.g., during a pandemic). While existing studies focus on public spaces, less is known about how residential landscapes, particularly in gated estates, influence outdoor activities. This study investigates the spatial logic behind the distribution of standing, sitting and social interaction within six pairs of gated and non-gated housing estates in Wuhan. Using space syntax analysis and zero-inflated negative binomial regression, we explore how the spatial configuration influences the incidence of outdoor activities in gated and non-gated estates. The findings suggest that spatial attributes not only significantly explain where activities occurred but also where they did not. More importantly, we found distinct differences between the two types: non-gated estates were more responsive to design, with more spatial factors significantly predicting activities simultaneously, whereas in gated compounds, only a few factors had a significant impact. Critical factors of outdoor activities include seating provision, convex area, perimeter enclosure, and spatial accessibility. These findings contribute to the theoretical understanding of spatial dynamics in residential environments and provide practical insights for urban design and residential planning.
1. Introduction
1.1. Housing Design and Outdoor Social Life: An Emerging Challenge
Housing estates are essential to urban inhabitants, offering dwelling spaces and communal open spaces for socialising, relaxing, and connecting with nature. However, the advent of the digital age has shifted people’s leisure time from outdoor activities to indoors [1,2]. While the COVID-19 pandemic further accentuated this issue by restricting public space access, its legacy continues to influence public space use through heightened risk awareness, shifting work-from-home patterns, and increased appreciation for accessible open spaces in residential settings [3,4,5]. This phenomenon reflects a broader, long-term challenge: how to design everyday communal spaces that support vibrant outdoor life.
Declining outdoor activities can negatively impact both individuals and society. For individuals, reduced outdoor activities is linked to physical health issues like obesity [6] and myopia [7], and mental health conditions [8] including anxiety and depression [9]. Underused spaces can also lower (perceived) place safety [10], weaken community cohesion, and ultimately cause social decay [11,12].
The importance of residential outdoor spaces became particularly evident when access to other public spaces was restricted (such as during COVID-19 lockdowns) [13], open spaces within housing estates—especially in gated ones—served as main venues for outdoor relaxation and exercise [14]. Nevertheless, in the absence of statutory restrictions, the effectiveness of these spaces in drawing people outdoors depends largely on their design quality [12,15].
As cities increasingly debate how to design for social resilience and everyday livability, it is crucial to (re)investigate how residential open spaces can be designed to effectively promote outdoor activities, ultimately creating sustainable and resilient residential communities that not only support vibrant daily life but also remain socially functional during potential urban crises.
1.2. Key Spatial Features Influencing Outdoor Activities
While much research has explored how open space design affects walking and other forms of physical activity [16,17,18], less attention has been given to stationary and social activities such as standing, sitting, and face-to-face interaction [19,20,21]. Yet these activities are vital for creating a lively, inclusive, and socially meaningful public space. In response, urban designers increasingly call for places that encourage people not just to pass through, but to pause, stay and engage with others [22].
Prior studies have identified several spatial factors that influence such non-movement-based activities. These can be broadly grouped into three categories: microclimatic conditions, physical features, and—less frequently acknowledged—spatial configuration, which will be elaborated on in the next section.
First, microclimatic factors such as thermal and acoustic comfort have been shown to affect users’ willingness to stay outdoors. For instance, comfortable shading, sunlight, and noise level have been associated with increased presence and duration or use (e.g., [23,24,25]).
Second, a range of physical features has been found to directly influence stationary and social behaviour. One of the most debated is open space size. While larger spaces are theoretically capable of accommodating more users, attractions, and potential activities [12], several studies have challenged the assumption that “bigger is better”. For example, Whyte [26] observed that larger urban squares did not necessarily attract more activities, and Goličnik and Thompson [27] found lawn size to be irrelevant for passive occupancies (i.e., sitting, standing), though important for large group sports. In high-density contexts, excessively large spaces can feel empty or overwhelming, thereby reducing rather than encouraging activities [28,29].
Another key factor is seating provision, particularly moveable chairs. Numerous studies have emphasised the role of seating in enabling longer stays and facilitating social interactions [26,30]. Seating is especially important for older adults and those with physical limitations [31]. Sun, Wang [25] and Peng and Maing [32] reported significantly positive correlations between seat numbers and the overall attendance of seniors in spaces. However, Chang [18] argued that seniors’ outdoor engagement was better explained by seat quality than quantity.
Ground-floor frontage permeability is also crucial for vibrant outdoor space [33,34]. Permeable and “active” frontages (e.g., shopfronts, cafes) allow physical and visual exchanges between internal (private) and external (public) spaces [35,36]. These features support natural surveillance and social encounters [37,38].
Closely related is the concept of perimeter enclosure, referring to the extent of an open space defined by buildings and walls. Enclosure conditions how people perceive safety, intimacy, and legibility of space. Studies suggest that moderately enclosed environments often support lingering and social engagement, whereas overly open or heavily enclosed settings may discourage use [39,40].
Together, these physical features create the environmental affordances that either promote or inhibit different forms of outdoor activity. However, affordances alone may not fully explain why people choose to use particular spaces and not others. Increasingly, researchers are turning to spatial configuration—that is, how spaces are arranged, connected, and perceived as a system—to better understand behavioural patterns. This dimension is addressed in the next section.
1.3. Space Syntax and the Influence of Spatial Configuration
The third group of scholars, from the space syntax discipline, highlight that alongside microclimate and physical conditions, spatial usage patterns are equally shaped by the interconnection between individual spaces, by their spatial configuration [41,42,43].
Central to this framework is the concept of spatial centrality (accessibility), often operationalised through measures such as integration and choice. These metrics capture the ease with which a space can be reached from all others. Empirical studies have shown that more integrated spaces tend to attract higher levels of spontaneous use and social interactions [44,45]. For example, Can and Heath [46] observed increased stationary and interactive activities in more integrated streets in Turkish residential areas. Recently, Sheng, Wan [47] also documented a positive correlation between face-to-face interactions and spatial accessibility in Chinese urban parks, while a study from Korea also linked integration with neighbourly interactions [48].
Alongside accessibility, visibility is another key configurational attribute influencing spatial usage. Spaces that are poorly visible—either from a distance or within their own boundaries—are less likely to attract users [26]. Previous research showed a correlation between people’s stationary positions and the extent of their visual fields or isovist field [49]. Typically, people prefer vantage points allowing observation without feeling overly exposed, known as prospect-refuge theory [50]. Previous space syntax studies have tested this [51,52,53,54], suggesting stationary activities and social interactions prefer secluded areas that offer extensive sightlines rather than overly exposed locations. Notably, such spaces often sit adjacent to highly integrated routes [53,55], providing both retreat and engagement.
A number of studies have applied space syntax to examine the distribution of stationary and interactive activities, particularly in public spaces such as urban streets, squares, and parks (see full list of reviewed studies in Supplementary Materials). While valuable, they have limitations as precedents to the current study. Firstly, they tend to overlook the social value of communal open spaces in housing estates, where social behaviour may follow different logics. Second, most relied on descriptive statistics or visual inspection, which may be insufficient to fully uncover the mechanisms linking spatial configuration and activity distribution. Finally, although Can and Heath [46] noted that the influence of configurational attributes on stationary and interactive activities differs between area types (traditional and post-war residential areas in their case), more comparative studies are needed for verification, especially between different area types and conditions, such as gated and non-gated housing estates.
To address these gaps, the current study integrates spatial configuration variables into a statistical modelling framework, alongside physical design features. This enables a more robust understanding of how different spatial qualities affect stationary and social activities in residential settings, and how these effects may differ across planning paradigms.
1.4. The Dimension of Gating in China’s Housing Transformation
Over the past few decades, China’s housing forms have undergone rapid transformation, shifting from low-rise, interconnected neighbourhoods to large-scale, highly landscaped gated housing estates [56]. This change has been driven by rapid urbanisation and beautification campaigns such as the “City Cosmetic Movement” [57], which prioritised visual order, security, and formal greenery. As a result, many older, permeable communities have been replaced by enclosed compounds with manicured but often underused open spaces (Figure 1). Despite improvements in infrastructure and aesthetics, urbanists have noted a decline in social vitality [58,59], prompting calls for housing reform and new design strategies to create more liveable, vibrant, and sustainable cities [60].
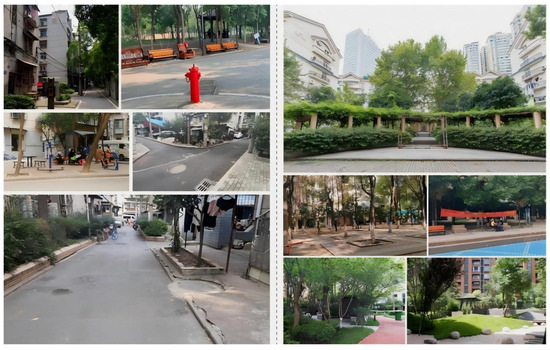
Figure 1.
Comparison between older, lightly landscaped, non-gated housing areas (left) and modern, highly landscaped, gated housing estates (right) in Wuhan, China. (Photograph by the first author).
The rise of gated residential developments further complicates the issues relating the availability, design, and use of public open spaces. While international literature has widely critiqued gating for contributing to spatial fragmentation and social divisions [15], the Chinese case presents a unique trajectory. Gating in China is not merely a matter of security or lifestyle preference, but a product of historical and institutional logics. From traditional courtyard compounds to socialist danwei work-units, enclosed living environments have long served administrative, economic, and cultural functions [61,62,63]. Unlike in many Western contexts where gating is associated with class-based secession [64,65], Chinese gating reflects a hybrid of collectivist planning legacies and contemporary market rationalities.
Some estimates have suggested that prior to 2016, 80 per cent of new housing development were gated [61]. These compounds typically feature controlled access point, boundary walls, and security guards, often restricting entry to non-residents. While intended to offer safety, order, and privacy, this spatial enclosure has been linked to the internalisation of community life and a weakening of spontaneous public engagement. Miao [63] observed that whereas historical compounds used walls to frame streets and encourage informal contact, today’s gated forms often function to separate and exclude.
In 2016, the Chinese government responded to concerns that gated residential compounds could foster social division and worsen traffic congestion by issuing a directive to end their construction and to gradually open existing ones [66]. But given how established and widespread gating is in China, the new policy was met with mixed public reactions and faced significant implementation barriers, including legal, logistical, and cultural resistance concern and uncertainty on Chinese social media about its implications [67,68,69].
So far, China is the only country attempting to turn the tide of gating. While its particular form of neo-liberalism with Chinese characteristics means this is eminently possible, albeit challenging, in other places, where the driving force has been less individualistic and more focused on protection, the challenge will be even greater [15]. Evidence concerning the impact of gating—in this case on the static and social activities apparent in outdoor residential spaces in China—is nevertheless invaluable in helping to understand the impact of gating practices, and their potential reversal.
1.5. Research Gaps and Current Study
While attention to these issues is growing, several important knowledge gaps remain. First, although space syntax has a well-established tradition in studying stationary and social activities, most studies rely on visual inspection or basic statistical techniques (see Supplementary Materials). This limits our ability to unpack the underlying mechanisms through which spatial features shape behaviour—especially for non-movement-based activities such as standing, sitting, and face-to-face interaction, which are essential for social cohesion, perceived safety, and residential vitality.
Second, although prior work has compared various residential types—such as traditional vs. modern housing [46], traditional vs. mass housing [54], and socialist vs. post-socialist estates [70]—these have not specifically addressed the spatial configurational differences between gated and non-gated housing environments. This is particularly relevant in China, where gating represents a dominant planning logic with historical and socio-political significance. How gating modifies visibility, enclosure, and accessibility—and how such differences influence activity patterns—remain underexplored.
Third, most spatial-behavioural research either assumes all spaces are equally likely to host activity or overlooks the prevalence of unused areas. Few studies employ statistical models suited to this uneven distribution. There is a clear need for fine-grained spatial analysis that systematically links design and configurational variables (e.g., accessibility, enclosure, facade permeability) to behaviour at the micro scale—particularly through models that distinguish between inactive and low-activity spaces.
To address these gaps, this study investigates how spatial configuration features—such as integration, visibility, enclosure, and facade permeability—relate to the occurrence of standing, sitting, and interacting activities in twelve gated and non-gated housing estates in Wuhan, China. By combining space syntax analysis with zero-inflated negative binomial regression, this study aims to answer:
- What residential landscape attributes effectively encourage outdoor standing, sitting and interacting activities in the sampled housing estates?
- To what extent do gated and non-gated housing estates respond to these issues consistently and differently?
- And, as a policy recommendation: which attributes (including gating) might be prioritised for facilitating outdoor spatial usage and building vibrant housing estates?
This study contributes theoretically by expanding space syntax research into gated compounds, an environment rarely analysed through configurational lenses. Methodologically, it applies zero-inflated regression to better represent underused spaces. Empirically, it offers comparative evidence on how gating shapes everyday outdoor life in rapidly urbanising contexts. These contributions are further elaborated in Section 4.5.
2. Materials and Methods
To answer the research questions, this study employed a four-stage methodological framework (Figure 2).
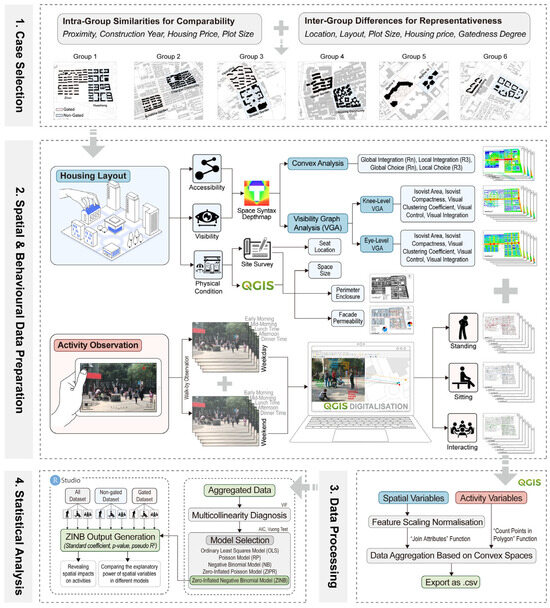
Figure 2.
The workflow of modelling the effect of spatial attributes on distribution of outdoor activities and uncovering how this differs between gated and non-gated estates.
First, twelve housing estates in Wuhan, China, with varying landscape features, were selected and divided into six gated and non-gated pairs. Site surveys documented physical conditions of the outdoor spaces (e.g., seat locations), while spatial configuration (namely, spatial accessibility and visibility) was measured using space syntax. Outdoor stationary and interactive activities were recorded via anonymous walk-by observation [30] and geocoded in QGIS (version 2.18.15). The collected spatial and behavioural data were then aggregated, normalised and evaluated for multicollinearity, followed by goodness of fit tests for model selection. Finally, zero-inflated negative binomial (ZINB) regressions [71] was performed to assess the spatial factors influencing activities, allowing direct comparisons between gated and non-gated estates.
2.1. Study Sites
This study examined 12 residential areas in Wuhan, comprising six gated and non-gated estates pairs (Figure 3). Wuhan, a major Chinese inland megacity, spans 8483 km2 with a permanent population of 13.77 million and a local GDP of 2110.62 billion yuan (statistics correct for 2024).
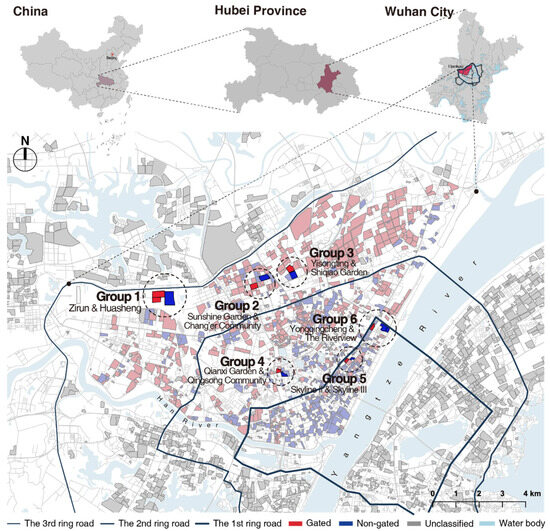
Figure 3.
Location of case studies.
To ensure representativeness and comparability, estates were selected in matched gated—non-gated pairs, following a systematic multi-stage process. First, a database was established in Geographic Information Systems (GIS), containing basic spatial and socioeconomic information (e.g., coordinates, construction year, housing price, plot area, household number) for all residential estates in the study area.
Each estate was then classified as gated or non-gated based on Baidu Street View imagery. A housing estate was defined as gated if it had clear physical boundaries (e.g., walls, fences, gates), on-site security, or signage indicating “residents only”. Using spatial query and buffer analysis, gated and non-gated estates within 500 m proximity were paired to minimise geographic and environmental variations.
Further screening criteria were applied to enhance comparability between paired samples: (i) each estate had been occupied for at least four years at the beginning of this fieldwork (i.e., completed before 2015), allowing residents to develop stable spatial usage patterns; (ii) paired estates shared similar housing prices, indicating comparable socioeconomic status among residents; (iii) paired estates had comparable size and density, reflected in total households and plot area. Overall, meeting all these criteria makes the selected housing estates comparable.
In addition to ensuring within-pair comparability, we also considered between-pair diversity to capture the heterogeneity of Wuhan’s residential environments. The six pairs vary in location (ranging from central areas to sites near suburbs), development scale (from large estates to smaller compounds), and layout morphology (e.g., linear, loop, courtyard, and cluster forms). This diversity allows the sample to represent a broad spectrum of residential typologies while maintaining internal comparability within each pair.
By fulfilling these criteria, the final 12 estates represent typical residential morphologies in Wuhan while enabling a controlled yet diverse comparison between gated and non-gated forms (see Figure 4).
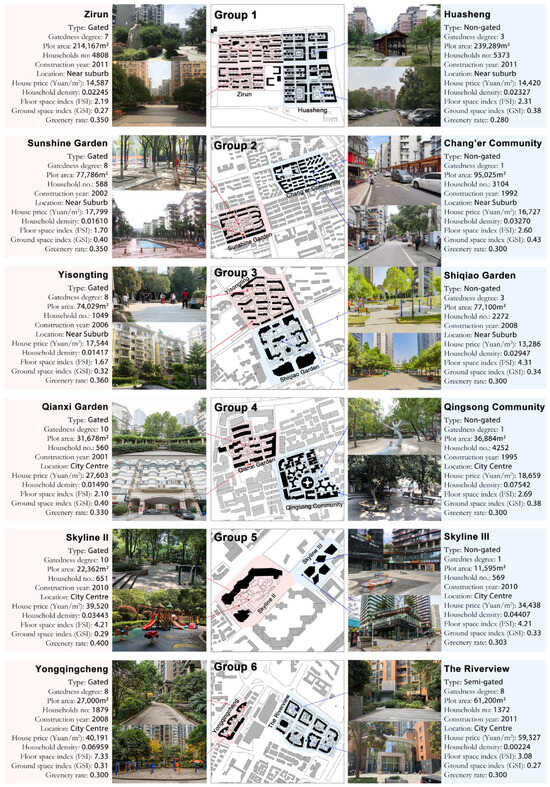
Figure 4.
General profile of twelve chosen housing estates.
2.2. Unit of Analysis: Convex Spaces
To investigate how spatial form influences outdoor behaviour, it is critical to select an analytical unit that reflects how people perceive, experience, and use space. This study adopts the convex space as the unit of analysis—a spatial element defined as an area where all points are mutually visible within a boundary. Convex spaces are particularly well-suited for analysing stationary and interactive activities, which rely heavily on mutual visibility [43].
Compared to other syntactic units such as axial lines and grid cells, convex spaces offer two key advantages. First, they more accurately reflect the discrete, legible subspaces in which people choose to stop, sit, or interact. Second, they are more tolerant of data inaccuracies (see Figure 5), making them robust for filed-based behavioural analysis. Despite these, convex spaces have been underutilised in outdoor activity research.
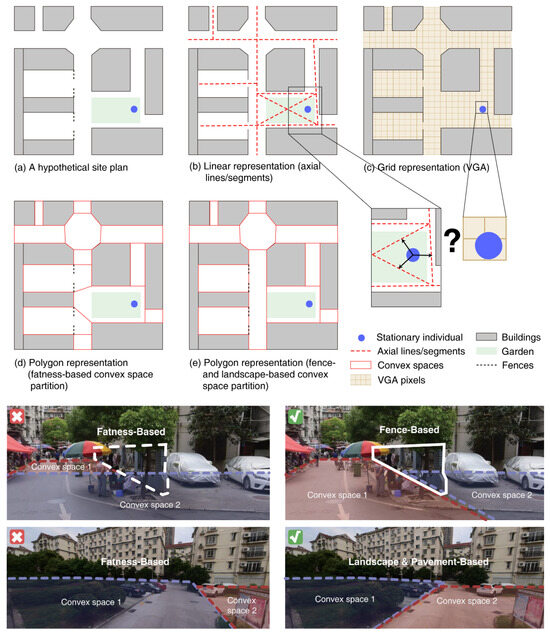
Figure 5.
Comparison between different units of analysis and spatial representation methods in space syntax methodology.
To better capture perceived spatial enclosures and their influence on activity patterns, this study refines the standard space syntax convex partitioning method by incorporating not only 2D layout geometry but also 3D landscape features, particularly fences and elevation changes (see Figure 5). This refinement reflects the understanding that physical barriers and visual enclosures significantly shape user perception, even when not reflected in plan view.
Partitioning was independently conducted by two trained researchers using a standardised base map. Each researcher followed a common interpretation protocol grounded in space syntax principles and filed-based observation of visual access, fencing, and terrain elevation. After independent partitioning, the results were compared and reconciled through a consensus-building process. Discrepancies were discussed iteratively. While no formal inter-rater reliability was computed (due to the contextual complexity of spatial segmentation), the use of a collaborative, guideline-driven, and field-informed process ensured standardisation across sites and minimised interpretive variability.
2.3. Dependent Variables: Standing, Sitting and Interacting Activities
To examine the influence of spatial features on how residents actually use outdoor spaces, this study focused on three categories of observable stationary and social behaviours: standing, sitting, and interacting. The distribution of these activities was recorded via walk-by observations from October to November 2019. The first author followed a predetermined route at a constant pace, video recording all accessible spaces within and around (i.e., the periphery) each estate. Observations were conducted on one weekday and one weekend per estate, with five rounds per day: early morning, mid-morning, lunchtime, afternoon, and dinnertime. Public holidays, special events, and poor weather were avoided; no data were collected after dark because the impact of artificial light was beyond the research scope. In total, 120 observation rounds were conducted, yielding approximately 3000 min of video recordings1.
Counts of standing, sitting and interacting individuals in each convex space were extracted as dependent variables. Activity data was geocoded in QGIS, with each person represented as a point tagged by activity type (walking, standing, or sitting) and state (individual or interactive as a group). Individuals waiting at bus stops were excluded, as their activities were unrelated to residential landscape design. Interactive activities were defined as engagements between two or more individuals—verbal (e.g., conversations) or non-verbal (e.g., group dancing, playing ball games)—whatever their activity type.
2.4. Predictive Variables: Residential Landscape Features
To understand which spatial characteristics most effectively encourage outdoor activities, a broad range of spatial predictors were included in this study. The independent variables in this study are categorised into two groups: physical variables and space syntax variables, each representing distinct spatial and design characteristics of the housing estates. The calculations and justifications for each variable are reported in Table 1.

Table 1.
Calculation of independent variables.
2.4.1. Physical Variables of Residential Landscape
Physical variables describe tangible design attributes that directly influence outdoor activity patterns. Key physical variables include:
- Convex size: the area of each convex space, indicating its capacity to accommodate activities and events.
- Seat number: the quantity of available seating in each convex space, directly affecting its usability for stationary and interactive activities.
- Facade permeability: a composite indicator quantifying physical and visual permeability of ground-floor frontages, based on eight frontage types (e.g., “active frontage”, “door and window”, “see-through fence”, “blank wall”) weighted by their permeability and potential attraction for outdoor activities (see Figure 6a and Table 1).
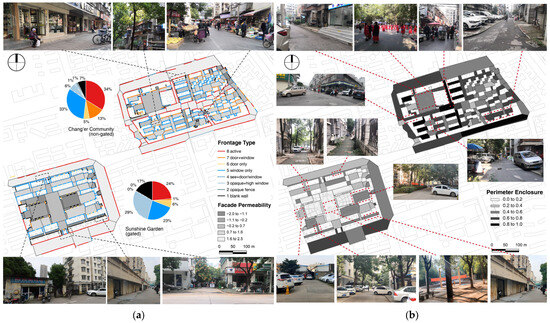 Figure 6. (a) Facade permeability of one pair of gated and non-gated estates to exemplify the analytical process across the cases studied; (b) Perimeter enclosure of one pair of gated and non-gated estates to exemplify the analytical process across the cases studied.
 - Perimeter enclosure: the ratio of facade length facing a convex space to its total perimeter (Figure 6b), with 1 indicating full enclosure and 0 complete openness.
2.4.2. Space Syntax Variables of Residential Landscape
Variables were derived from space syntax analyses using convex-map analysis and visibility graph analysis (VGA) in UCL Depthmap software (version 7.12.00) [72]. These variables quantify spatial configuration and visual properties that potentially influence how individuals perceive and use spaces.
Convex-map analysis divides layouts into discrete convex spaces and evaluates their accessibility. A key feature of this analysis is the use of topological steps, namely, the minimum number of transitions required to travel between convex spaces. The fewer the number of transitions between spaces, the more accessible the space is considered.
To minimise the “edge effect” (artificially low accessibility values near the modelling boundaries), the convex map was extended to include the streets immediately surrounding both housing estates within each comparative pair (see Figure 7a).
Two syntactical properties were used for accessibility measurements:
- Convex integration (“closeness” centrality) quantifies a space’s to-movement potential by assessing its closeness to all other spaces within a given radius (topological steps).
- Convex choice (“betweeness” centrality) measures through-movement potential by measuring how often a space falls on the shortest paths between others within a predetermined radius.
Both convex integration and choice were computed at two scales: local (radius-3) and global (radius-n, i.e., infinite). The local scale captures immediate connections within estates, while the global scale captures broader neighbourhood accessibility. This multi-scale approach offers a comprehensive understanding of both localised and extended spatial accessibility.

Figure 7.
Examples of convex-map analysis for two paired housing estates embedded in their larger neighbourhood (a), along with four major attributes (b–e) showing values from red (high) to blue (low) colours.
Figure 7.
Examples of convex-map analysis for two paired housing estates embedded in their larger neighbourhood (a), along with four major attributes (b–e) showing values from red (high) to blue (low) colours.

Visibility graph analysis (VGA) assesses the potential of visual experience in a space, built upon the concept of isovist—the set of all visible points from a given location [73]. A VGA graph overlays a grid onto a layout, calculating mutual visibility among cells to derive spatial properties [52,74].
A grid size of 1.5 m was chosen for the VGA to reflect the average width of pedestrian pathways and the typical spacing between individuals in low-density outdoor settings. This cell size is consistent with established VGA research in urban outdoor environments, offering a meaningful balance between computational efficiency and spatial sensitivity [74,75]. It allows for capturing fine-grained variations in visibility at a human scale—sensitive enough to reflect subtle changes in spatial openness and enclosure across large areas.
Five VGA properties were selected, each capturing a distinct visual dimension of spatial use:
- Isovist area measures the visible area from a vantage point, reflecting the size and openness of a space.
- Isovist compactness measures the shape of the isovist; values near 1 indicate a more circular, compact space that may be suitable for stationary use, while values closer to 0 suggest an elongated or jagged shape that support movement [76].
- Visual integration, similar to convex integration, refers to the closeness centrality. Spaces with high integration are more accessible from other spaces, typically corresponding to more active and central areas.
- Visual control compares visibility from a cell to what is seen from surrounding cells. A high value suggests that a particular space has the ability to see and access many other spaces, while from within these spaces not much is visible and accessible. This can imply a sense of privacy or seclusion within a layout.
- Visual clustering coefficient captures how well visible cells are mutually connected, with 1 indicating full cohesion and interconnection and lower values suggesting fragmentation [74,76].
To reduce edge effects, the VGA base map was extended to cover the broader neighbourhood encompassing both gated and non-gated estates within each comparative pair (Figure 8). Additionally, to capture both visual experience and physical accessibility, VGA was performed at two vertical reference levels: eye level and knee level (Figure 8). The eye-level analysis included only visibility-blocking elements (e.g., walls or buildings), representing perceived openness from a pedestrian viewpoint. In contrast, the knee-level analysis incorporated lower-level obstructions to physical access (e.g., see-through fences, low hedges, sculpture) [74], better reflecting bodily accessibility and functional use potential. This dual-level analysis is particularly important in gated estates, which often feature formalised landscaping and decorative elements that create areas that appear open but are functionally passive or inaccessible. By integrating both levels, the study distinguishes between perceived visibility and practical usability, offering a more in-depth understanding of how space is experienced and used. Full VGA results are provided in Supplementary Materials.
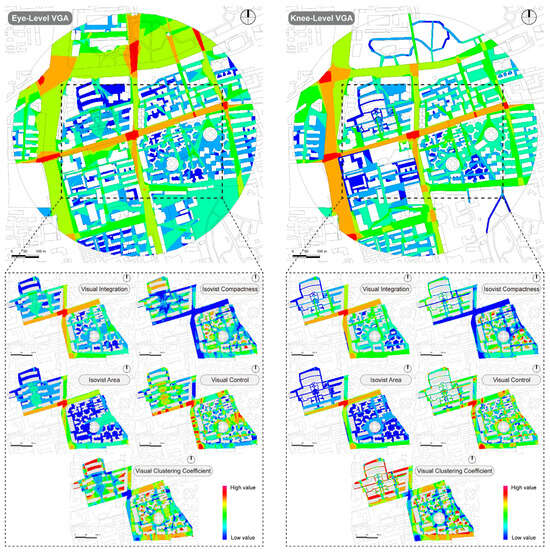
Figure 8.
Examples of VGA analysis for a pair of housing estates at both eye and knee levels.
2.5. Statistical Approach
2.5.1. Data Normalisation and Aggregation
To account for variations across housing estates and different variable scales (e.g., area, count, ratio), min-max (0–1) feature scaling was applied to each spatial variable within each estate. This normalisation ensured fair comparisons of spatial factors by scaling predictors relative to their respective ranges, avoiding disproportionate influence from extreme values.
Since the unit of analysis is the convex space, each VGA attribute was aggregated accordingly by averaging all VGA cells within the convex space, thereby providing a measure that smooths small-scale variations while capturing overall spatial dynamics.
2.5.2. Model Selection
When dependent variables are discrete counts, Poisson or negative binomial regressions are preferred [71]. However, descriptive statistics revealed excessive zeros, as approximately 50% of convex spaces had no activities. To identify the best-fitting model, we compared ordinary least squares (OLS), Poisson (RP), Zero-Inflated Poisson (ZIPR), Negative Binomial (NB), and Zero-Inflated Negative Binomial (ZINB) models.
Model selection was based on Akaike information criterion (AIC) and Vuong’s tests. As shown in Table 2, ZINB consistently produced the lowest AIC across all activity types and datasets, with Vuong’s tests further supporting its superiority. Thus, ZINB was selected for final analyses.
Table 2.
Statistical comparison between different regression models through Akaike Information Criterion (AIC) values and Vuong tests.
2.5.3. Zero-Inflated Negative Binomial Model
The ZINB model handles count data with excessive zeros by combining a negative binomial model (log link) and a zero-inflation model (logit link) [77]. To account for varying baseline activity levels across estates, we included an “offset” variable—the total observed counts of standing, sitting, and interacting individuals per estate—allowing the model to estimate the effects of the predictors on relative proportions rather than absolute counts, thereby controlling for differences in baseline activity levels.
Importantly, many of the observed zeros in our dataset, especially in gated estates, are not merely random non-events but reflect structural conditions that discourage or prevent use. These include landscape features such as ornamental lawns, fenced planting beds, or internal barriers that allow visibility but block access or invite passive rather than active engagement. In this context, the inflation component of the ZINB model is theoretically meaningful, as it distinguishes between convex spaces that are usable but unused (modelled by the count component) and those that are functionally or behaviourally excluded from everyday use (modelled by the inflation component). This enables a richer understanding of how spatial design constrains or facilitates social behaviours, aligning with space syntax theory’s emphasis on configurational influence.
Multicollinearity was assessed using Variance Inflation Factors (VIF). All VIFs values were below 10 (Table 3), indicating no severe multicollinearity, so all predictors were retained. The final ZINB models are statistically significant at 1% level (Table 3) with reasonable explanatory power for both count and zero-inflation parts.
Table 3.
Model fit and multicollinearity tests for Zero-inflated negative binomial models.
2.5.4. Methods for Comparing Explanatory Power Across Models
To address the research question regarding whether spatial configuration differently influences activity and housing types, we ran separate ZINB models for each housing type using the same set of spatial predictors. This comparative modelling approach is theory-driven and reflects long-standing concerns about how enclosure modulates behaviour across different urban residential configurations.
For each model, we extracted the coefficients and covariance matrices to assess the strength and direction of the relationships between spatial variables and activity distributions. We then calculated the differences in the coefficients, standard errors, and p-values across the two models. Importantly, our intention was not to test every individual difference for significance, but rather to identify consistent patterns of explanatory strength and effect size divergence between gated and non-gated contexts.
Although this procedure involves multiple coefficient comparisons, we did not apply formal post hoc corrections (e.g., Bonferroni), following a common practice in exploratory spatial analysis. Instead, we emphasised substantive rather than marginally significant findings and focused on theoretically interpretable patterns. We further discussed the limitation of this approach and potential risk of inflated Type I error in Section 4.4. All statistical analyses were performed in RStudio (version 2024.9.0.375).
3. Results
3.1. Characteristics of Housing Attributes and Spatial Usage
Table 4 summarises all variables across the entire sample and by housing type. Non-gated estates exhibited significantly more observed standing, sitting, and interacting people per convex space, indicating more vibrant outdoor activity (also see Supplementary Materials). Significant differences also emerged in spatial characteristics. Non-gated estates showed significantly higher perimeter enclosure, facade permeability, visual integration, and eye-level visual metrics (compactness, clustering coefficient, and control). Conversely, gated estates featured greater convex accessibility, more seating, larger convex area, and higher knee-level compactness and clustering. These differences highlight clear contrasts in spatial characteristics and activity patterns between the two estate types.
Table 4.
Descriptive statistics of variables based on convex spaces, with t-tests measuring the significant levels of differences between gated and non-gated estates.
3.2. Overall Influences of Spatial Configuration on Different Activities
Table 5 summarises ZINB results for standing, sitting, and interacting activities across all twelve housing estates. We assessed the explanatory power of each parameter by comparing the absolute value of the coefficients of the same parameter between models. Note that, while significance levels are reported, this section primarily focuses on comparing the standardised coefficients (effect sizes) across predictors and models to evaluate their relative explanatory power.
Table 5.
Summary of zero-inflation negative binomial regressions for the distribution of standing, sitting, and interacting activities across all housing estates.
For the count part, local convex choice exhibited the largest standardised effect on standing (β = 2.029) and second largest on interacting (β = 1.626), while seat number had the strongest influence on sitting (β = 2.750). Facade permeability showed moderate positive effects for standing and sitting but limited influence on interacting. Notably, isovist area at both eye and knee levels strongly promoted interactions (β = 1.439 and 1.587, respectively), while knee-level visual clustering had consistently negative associations with all three activities, with the largest suppressing effect on sitting (β = −2.349).
For the zero-inflation part, several spatial attributes were associated with reducing the likelihood of activity absence. Convex area and knee-level isovist area had strong effects across all activity types (e.g., β = −33.743 and −19.300 for standing), eye-level isovist area was only meaningful for sitting. Local convex choice, facade permeability, seat number, and visual clustering significantly reduced zero inflation for standing. For interactions, perimeter enclosure, facade permeability, and eye-level VGA attributes also showed moderate and meaningful contributions (e.g., visual integration β = −5.133).
Overall, while many spatial variables exerted similar directional effects across all activity types, the strength of associations varied: seat number was most important for sitting; convex area better explained standing inactivity than for other activities. These findings highlight the consistent yet differentiated effects of spatial attributes on outdoor behaviours.
3.3. Comparing Spatial Logic of Activity Distributions Between Housing Types
3.3.1. Standing Activity: Gated vs. Non-Gated Estates
ZINB results (Table 6) highlighted differences in spatial impacts on standing activity between estate types. In the count part, the non-gated estates demonstrated higher spatial responsiveness, with more predictors showing substantial effects (e.g., local convex choice, global convex integration, knee-level isovist compactness, and eye-level isovist area all exceeded standardised coefficients of ±3). Both models shared five predictors: perimeter enclosure, seat number, convex area, eye-/knee-level isovist area. Interestingly, isovist area showed opposite effects—positive at eye level and negative at knee level in the non-gated model, and the reverse in the gated one.
Table 6.
Estimated coefficients from ZINB in explaining the distribution and occurrence of standing activities, along with comparisons on explanatory power of spatial variables between gated and non-gated models.
In the zero-inflation part, convex area was a strong predictor in both models, particularly in reducing the likelihood of spatial inactivity in non-gated estates (β = −41.080). Gated housing estates also showed moderate sensitivity to eye-level VGA attributes, including visual clustering coefficient and integration, though their effect sizes were relatively smaller (around −8 to −10).
Overall, non-gated estates demonstrated had stronger explanatory power across both model components, with seven variables exhibiting substantial between-model coefficient differences (e.g., local convex choice, eye-level isovist area). In contrast, the gated model showed slightly better fit in explaining zero-inflated cases, though without marked differences in effect magnitude.
3.3.2. Sitting Activity: Gated vs. Non-Gated Estates
As shown in Table 7, the count model for non-gated estates again demonstrated broader spatial sensitivity, with more predictors showing sizeable effects (e.g., local convex choice, global convex integration, eye-level isovist area), while the gated model had stronger zero-inflation effects on selected metrics.
Table 7.
Estimated coefficients from ZINB in explaining the distribution and occurrence of sitting activities, along with comparisons on explanatory power of spatial variables between gated and non-gated models.
In the count component, both models identified seat number, eye-level isovist area, and eye-level visual control as key predictors. While seat number had a consistent positive effect in both models, the direction of association for eye-level isovist area diverged again: it was positively associated with sitting in non-gated estates (β = 4.151), but negatively in gated estates (β = −2.958). The non-gated model also captured broader influences, including convex centrality, perimeter enclosure, and facade permeability.
In contrast, the zero-inflation models highlighted different sets of predictors. Convex area consistently reduced the likelihood of spatial inactivity in both housing types, with a stronger effect in non-gated cases (β = −21.053 vs. −15.597). The gated model additionally found seat number (β = −27.911), and eye-level isovist areas (β = −11.573) and isovist compactness (β = 26.558) in explaining the absence of sitting.
When comparing explanatory power, local convex choice, eye-level isovist area, and compactness had greater influence in non-gated estates, while knee-level isovist measures and visual control were more predictive in gated contexts. In the zero-inflation part, the gated model had greater power for eye-level isovist compactness.
3.3.3. Interacting Activity: Gated vs. Non-Gated Estates
As shown in Table 8, non-gated estates showed substantially greater spatial sensitivity in shaping face-to-face interactions, echoing the patterns observed for standing and sitting activities.
Table 8.
Estimated coefficients from ZINB in explaining the distribution and occurrence of interacting activities, along with comparisons on explanatory power of spatial variables between gated and non-gated models.
The count model for non-gated estates identified a broader range of influential variables, many with large standardised coefficients, such as local convex choice (β = 3.111), and eye-level isovist area (β = 4.458) and isovist compactness (β = −3.949). By contrast, the gated model showed a more selective pattern, with few variables exceeding the |1.5| threshold. Both models shared seat number and convex area as positive predictors, but diverged on isovist area measures (with opposite directional effects between gated and non-gated models). Several predictors were exclusive to the non-gated model, including convex choice (both scales), global integration, perimeter enclosure, facade permeability, isovist compactness (both levels), and eye-level visual control.
For zero-inflation, unlike standing and sitting, the non-gated model identified more predictors associated with the absence of interactions. Perimeter enclosure, convex area, and eye-level isovist compactness consistently reduced the probability of observing no interaction. The non-gated model additionally identified the effects of facade permeability, seat number, knee-level isovist area, and visual integration, while the gated model linked inactivity to spatial integration and knee-level control.
Overall, the explanatory power was greater in non-gated estates across both count and zero-inflation components. The differences in zero-inflation effects were particularly pronounced in the model of interaction than in the other two activities, suggesting spatial factors play a greater role in explaining where interactions fail to occur.
4. Discussion
4.1. Key Spatial Factors That Influence Outdoor Activities
The spatial configuration of residential areas significantly influences the distribution of outdoor activities: standing, sitting, and interacting. Key positive predictors across all twelve housing estates included local convex choice, global convex integration, perimeter enclosure, seat number, and convex space size, while knee-level clustering had a significant negative impact.
These findings align with prior space syntax studies (e.g., [46,47,78,79]), which emphasised spatial accessibility as a driver of static and social activities. Pedestrians tend to naturally follow more accessible routes [16,80], increasing footfall and the likelihood of lingering and social engagement [15].
However, not all centrality attributes were consistently significant. This may be due to (1) differences in how accessibility influences activity in gated vs. non-gated estates (further elaborated in Section 4.3), and (2) the nature of activities like standing and sitting, which are less dependent on accessibility than functional walking, and more influenced by perceived comfort and the social dynamic [19,29].
Indeed, we found that other spatial features also played a crucial role. For example, convex area and knee-level isovist area significantly influenced both the presence and absence of activities. Considering both these attributes relate to usable space size, we can argue that larger spaces support more activities and are less likely to be inactive. These findings align with Sheng, Wan [47] but contradict a common assumption that larger spaces may be difficult to engage or be too vast to feel comfortable [31,81]. Arguably, well-designed expansive areas can potentially accommodate more amenities, events, and activities—particularly group or physical activities (e.g., square dancing) that require relatively large spaces [82], as illustrated in Figure 9.
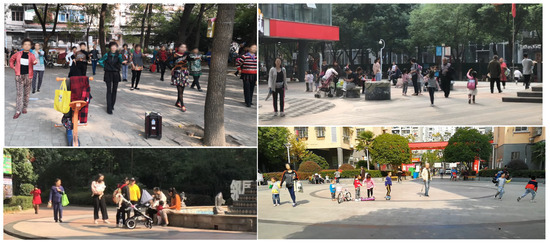
Figure 9.
Photos of observed users and activities that occupied large open spaces in the housing estates.
Seat number also had significant positive effects, supporting previous findings that seating encourages outdoor activity [30,79]. However, the zero-inflation component surprisingly showed that seating provision did not significantly reduce the absence of sitting (Table 3), reinforcing the idea that people do not sit wherever seats are available [29]. Other features of/from the seat location—such as accessibility, visibility, and openness—also influence users’ choices [83]. Meanwhile, seating quality may be more important than the quantity for outdoor engagement, particularly for older adults [18].
This is particularly evident with movable seating, which efficiently reveals users’ spatial and social preferences [26]. A recent study [1] found movable seats attract group users more than fixed ones. We observed a similar pattern in a traditional non-gated community, where seniors brought their own chairs to a central square for group activities like mahjong (Figure 10), despite insufficient seating. This location was favoured for its accessibility, visibility, and ample spaces for leisure use.
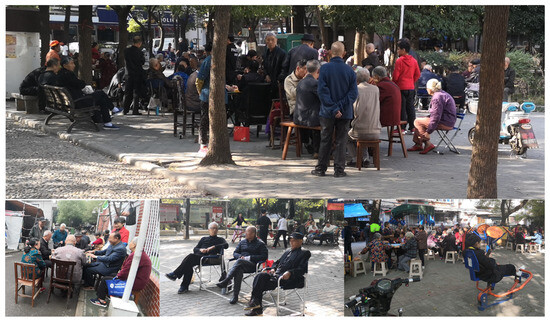
Figure 10.
The “magic” of movable seats, captured at the Chang’er Community (a traditional non-gated community).
Perimeter enclosure and facade permeability positively affect outdoor activities, with stronger effects in the count model. Our ZINB regressions indicated that people prefer well-enclosed spaces with permeable facades, as these features enhance perceptions of place safety, sociability, and liveliness [26,31,33,34,35,39]. As Bentley [84] noted, vibrant public spaces often rely on the activity and design of adjacent buildings.
A well-defined perimeter creates a room-like feel that fosters comfort [29,85]. Ground-floor facades, though a small part of the building, vitally affect what we see and experience in the spaces [86]. Impermeable frontages like blank walls and opaque fences lack visual and social stimuli, discouraging activity and reducing perceived safety [35,87,88], leading to underused spaces.
4.2. Activity Accompaniment and Spatial Variability
Our analyses revealed a shared spatial logic behind standing, sitting, and interacting activities, with similar coefficient directions and significance levels across all three (Table 5). Explanatory power comparisons were mostly non-significant, suggesting these activities respond similarly to spatial attributes.
While this supports the fact that certain spatial configurations can simultaneously encourage multiple social activities, it also reflects a phenomenon we term “activity accompaniment”, where standing, sitting, and interacting co-occur in shared spaces (Figure 10). For example, areas with seated individuals often attract others to stand or interact nearby [30,89]. Well-designed public open spaces can create a virtuous, self-reinforcing cycle of engagement, where people or activities are drawn by the presence of others [31].
Nevertheless, we also observed distinct spatial preferences across activity types. Larger convex spaces had a stronger effect on standing than on sitting and interacting, while seat numbers unsurprisingly predicted sitting more strongly. Eye-level isovist compactness was negatively correlated with sitting, indicating a preference for visually open and irregular spaces for a sense of exploration—supporting findings that lower compactness correlates with higher seat occupancy [79]. Interestingly, compactness was the only significant attribute negatively linked to interaction absence, likely because group activities tend to occur in well-defined, regular spaces like community squares.
4.3. Comparing Gated and Non-Gated Estates
This study’s comparison of gated and non-gated estates revealed important differences in how spatial factors influence outdoor activity patterns.
First, spatial predictors tended to show stronger effects in non-gated estates across all three activity types. The standardised coefficients in the count components of the models were generally larger in magnitude, especially for predictors like local convex choice, isovist area, and seat provision (Table 6, Table 7, Table 8). This suggests that spatial factors in non-gated estates play a more active role in supporting activity occurrence. In contrast, in gated estates, predictors in the zero-inflation component were relatively more prominent, implying that spatial attributes may be more useful in explaining where activities fail to occur than where they do. This contrast reflects that the open, integrated layouts of non-gated estates support diverse activities, whereas gated estates—despite higher-quality landscaping (Figure 1)—shows more predictable inactivity due to poor accessibility and visibility from their design.
Second, attributes like accessibility, facade permeability, and perimeter enclosure lost their explanatory power in gated estates, likely due to the homogeneity of open spaces, which are often segregated, impermeable, and unconstituted (i.e., open spaces are not defined or enclosed by buildings). For instance, the impact of facade permeability was relatively muted in gated estates, possibly because internal walls or fences negate the behavioural affordances that these features might otherwise provide. Thus, while non-gated estates encourage more dynamic activities, gated estates exhibit more spatially predictable inactivity, with certain spatial features having less influence due to the homogeneous nature of their design.
Third, isovist area showed contrasting effects: eye-level isovist area positively influenced three activity types in non-gated estates but negatively in gated ones; knee-level isovist area showed the reverse. This reflects different spatial preferences. Non-gated residents favour broad visibility with intimate physical settings, echoing prospect-refuge theory that humans prefer environments that offer safety while also having the ability to survey surroundings [50]. In contrast, gated estate residents prefer physically larger spaces (i.e., squares), yet the visibility is often restricted by landscape feature walls, fences, etc.
Despite differences, several predictors were consistently influential across models. For example, seat number and convex area were positively associated with standing and interacting in both estate types, though only seat number significantly influenced sitting. Convex area was the only meaningful predictor that consistently explained the absence of all three activities across both estate types. However, the strength of this influence was often larger in non-gated estates, further reinforcing the idea that spatial variation in more open, permeable and integrated environments exerts more behavioural differentiation.
4.4. Limitations
Several limitations of the study should be noted. First, although our sample includes 12 carefully paired gated and non-gated housing estates, it represents only a single city (Wuhan). This limits broader generalisability, though the matched-pair design mitigates inter-site socioeconomic variance. Future studies could expand to other cities or regions and include more diverse housing typologies.
Second, the study relies on cross-sectional, manually collected observational data, capturing only “snapshots” rather than long-term behavioral trends. Seasonal variations, temporary events, and nighttime use were not included. While systematic walk-by observations were conducted, human error and subjective classification of activities may introduce inconsistencies.
Third, this study mostly focused on configurational attributes, overlooking other influential factors. Sociodemographic (e.g., age, gender, income, lifestyle patterns, work schedules, health conditions, and social preferences) and environmental factors (e.g, micro-climatic and acoustic conditions, landscape quality, attractions) might also influence willingness to use space.
Fourth, beyond spatial and demographic considerations, the management regimes and governance structures of residential estates may also influence outdoor activity patterns. Factors such as access restrictions, surveillance intensity, cleanliness enforcement, maintenance schedules, or programming of community events can shape how residents perceive and use shared spaces. For example, a non-gated estate with poor management might feel less safe or welcoming than a well-maintained gated compound, despite spatial openness. These institutional variables were not systematically recorded in this study, thus limiting our ability to disentangle their effects from purely spatial attributes. Future research would benefit from integrating spatial analysis with qualitative or administrative data on community governance to better understand the interplay between design and institutional context.
Fifth, limitations inherent in space syntax should be acknowledged. While VGA effectively measures visibility based on layout, real-world conditions—such as vegetation, parked vehicles, and other landscape obstructions—can obstruct views and movement. Moreover, space syntax emphasises spatial configuration over perceptual and psychological dimensions of space, which may also influence how individuals interpret and engage with their surroundings.
Sixth, while the convex space partitioning in this study followed a structured and consensus-driven protocol among trained researchers, we acknowledge the inherent subjectivity involved in spatial segmentation. No formal inter-rater reliability (IRR) was computed, as we adopted a qualitative reconciliation approach better suited to the interpretive nature of environmental features such as fences, elevation changes, and transitional thresholds. Although efforts were made to minimise variation, the absence of a quantitative agreement measure limits the replicability of the segmentation process. Future studies may explore automated or semi-automated partitioning tools, or combine IRR with expert consensus, to further enhance reproducibility and transparency in spatial unit partitioning.
Finally, while the ZINB model provides a pragmatic approach to handling excess zeros, we cannot fully guarantee whether all observed zero-activity spaces are structural (intrinsically inactive) or observational (missed due to limited rounds and time). We interpret the zero-inflation component with caution and encourage future research to triangulate this with qualitative insights or longer-term sensor-based monitoring. We also acknowledge that comparing the same set of predictors across gated and non-gated models introduces multiple statistical comparisons, potentially increasing the risk of Type I error. Although our comparison was guided by theory and used fixed variables across models, this exploratory approach does not include corrections for multiple testing. We therefore emphasise larger and more consistent effect patterns over isolated p-values. Future confirmatory studies should consider applying multiple comparison corrections or bootstrapping to validate the robustness of cross-model inferences.
4.5. Contributions and Broader Implications
Despite the limitations, this study makes important theoretical, methodological, and practical contributions to better understanding how spatial conditions shape outdoor activities in residential settings.
Theoretically, this study advances space syntax theory by extending its explanatory scope beyond movement to the presence and absence of stationary and social behaviours that underpin urban vitality. It shifts the focus from public spaces to residential environments—specifically, gated and non-gated housing estates—thereby situating configurational analysis within the unique socio-spatial logic of contemporary Chinese urbanism, where gating functions as both a physical and symbolic boundary. By examining how spatial hierarchy, enclosure, permeability, and visibility operate differently within inward-facing residential layouts, the study broadens the conceptual reach of space syntax and reveals distinct space-activity mechanisms across estate types. It shows that design ideologies and spatial configuration jointly shape behavioural affordances, influencing not only where activities occur but also where they do not. Through this lens, spatial inactivity is reconceptualised as a meaningful outcome of configuration rather than random absence, demonstrating that spatial form structures not only flows of movement but also the conditions for staying, encountering, and avoiding—thereby enriching the behavioural and social interpretation of syntactic space.
Importantly, the findings bridge configurational analysis with perspectives from environmental psychology and behavioural geography, showing that visibility, enclosure, and accessibility influence not only movement but also stationary and social behaviours tided to perceived safety, comfort, and place attachment. These observed preferences align with prospect-refuge theory, which suggests that people are drawn to settings offering both visual openness (prospect) and environmental support (refuge). In non-gated estates, the positive effects of eye-level isovist area and moderate compactness suggest that users prefer spaces offering visual fields alongside edge support—facilitating both awareness and comfort. Conversely, in gated estates, the stronger effects of knee-level isovist area imply a preference for physically expansive yet visually enclosed spaces, such as internal squares bounded by hedges or fences. This contrast highlights how spatial preferences reflect both perceptual affordances and the design ideologies embedded in different residential morphologies. From a behavioural geography standpoint, the findings highlight how spatial form acts as a structuring agent of social encounters, embedding patterns of everyday use and/or avoidance within the built environment.
Methodologically, this study refines space syntax by employing a tailored convex-space partitioning, incorporating landscape features (e.g., fences, elevation changes) to better reflect how people perceive, navigate and engage with spaces. It also introduces dual-level VGA (eye and knee) to capture both visual accessibility and physical movement constraints. Furthermore, it applies zero-inflated negative binomial (ZINB) regressions to model the uneven distribution of observed activities, addressing the methodological limitation of previous syntax studies that often overlook empty or underused spaces in their traditional regression models. Together, these methodological advances allow for a more precise and behaviourally sensitive analysis of spatial performance, particularly relevant for gated settings where underused spaces are common.
Practically, the findings offer actionable insights for planners, designers, and policymakers seeking to revitalise residential environments, especially in the post-COVID context where neighbourhood spaces are under renewed scrutiny. Furthermore, the study proposes a data-driven framework integrating space syntax with ZINB models to evaluate and improve residential planning and design. Given China’s ongoing efforts in urban renewal, aging-friendly community design, and neighbourhood vitality enhancement, it offers evidence-based guidance on transforming underutilised residential spaces into more inclusive, socially vibrant, and resilient environments. It supports the policy introduced in China since 2016 that has sought to limit the construction of new gated estates and even to open-up existing ones, while also identifying specific spatial features that may mitigate the isolating effects of gating when complete removal is not feasible. In doing so, it makes an important contribution to the larger literature on gating, supporting arguments about the deadening effect of gating on the public realm and the long-term negative social and well-being consequences that this is likely to have.
Beyond these general implications, this study also contributes a translational step from spatial metrics to actionable design strategies. Key configurational attributes—such as convex choice, isovist area and compactness, visual control, and façade permeability—offer more than theoretical insight; they provide diagnostic tools to inform design interventions. For instance, spaces with high convex choice values—typically representing movement corridors or junctions—are suitable for low-interference social elements like open seating or passive recreation zones. Their strategic role in channelling flows makes them ideal for designs that aim to stimulate chance encounters.
In contrast, spaces with high visual control and moderate isovist compactness foster more private or sustained social activities, making them appropriate for small plazas, shaded gathering spots, or spaces for elderly-friendly exercise equipment. These locations offer both visual access and a sense of comfort, balancing openness with retreat. Similarly, façade permeability, when enhanced through transparent or active edges (e.g., ground-floor windows, semi-open fences, communal entrances), can dissolve hard boundaries and promote casual engagement, especially critical in gated compounds where spatial enclosure is dominant.
Notably, the study shows that design leverage points differ across community types. Non-gated estates respond more robustly to a broad set of spatial variables, implying that design interventions in these areas may benefit from fine-tuned, multi-variable optimisations. In contrast, gated compounds exhibit more selective responsiveness, suggesting that targeted improvements—such as enhancing edge activation or breaking visual isolation—may be more impactful. Designers should thus tailor interventions to the socio-spatial logic of each estate type rather than applying generic design standards.
5. Conclusions
This study examined how spatial and design features influence outdoor standing, sitting, and interacting activities in Chinese housing estates. Addressing the first research question, we found that key residential landscape attributes—such as seating provision, convex area, perimeter enclosure, façade permeability, and spatial accessibility and visibility—significantly shaped both the presence and absence of outdoor activities.
In response to the second and third research questions, the findings revealed divergent spatial behaviours across gated and non-gated estates. While non-gated estates showed greater sensitivity to design cues, gated compounds were less responsive overall, with fewer predictors reaching significance despite comparable conditions. This suggests that gating may constrain how spatial affordances translate into public life. As a policy implication, spatial features such as visibility, permeability, and seating should be prioritised—particularly in enclosed settings—to encourage usage and support vibrant, socially engaging neighbourhoods. These insights support ongoing efforts in China to re-evaluate the role of gated residential development and inform future housing renewal strategies.
By linking spatial configuration metrics with observed behavioural patterns, this study provides a practical language for planners and designers to assess and shape residential spaces with greater sensitivity to both visibility and use potential. This not only aligns with current efforts to retrofit gated communities in China but also supports a broader shift toward evidence-informed spatial design in residential urbanism.
Supplementary Materials
The following supporting information can be downloaded at: https://www.mdpi.com/article/10.3390/land14122340/s1, Table S1: Summary of previous space syntax studies on observed stationary and socail activities in open spaces; Figure S1: Static snapshots for six pairs of housing estates with data acros al ten observation rounds overlapped; Figure S2: Results of convex analyses; Figure S3: Results of VGA analyses measured at eye and knee levels.
Author Contributions
Conceptualization, Y.Y.; methodology, Y.Y.; software, Y.Y.; validation, Y.Y.; formal analysis, Y.Y.; investigation, Y.Y.; data curation, Y.Y.; writing—original draft preparation, Y.Y.; writing—review and editing, L.V. and M.C.; visualization, Y.Y.; supervision, L.V. and M.C.; funding acquisition, Y.Y. All authors have read and agreed to the published version of the manuscript.
Funding
The APC was funded by Fundamental Research Funds for the Central Universities (CCNU23XJ049).
Data Availability Statement
The raw data supporting the conclusions of this article will be made available by the authors on request.
Acknowledgments
We would like to thank the editor and reviewers for their valuable comments, helping us improve the quality of the paper. The first author also wants to thank the property managers and community officials for permitting him to enter the gated housing estates and conduct fieldwork.
Conflicts of Interest
The authors declare no conflicts of interest. The funders had no role in the design of the study; in the collection, analyses, or interpretation of data; in the writing of the manuscript; or in the decision to publish the results.
Note
| 1 | Video recordings were for research only. All collected data were anonymised, and individual residents cannot be identified from the recordings. This study protocol was reviewed and approved by UCL Research Ethics Committee [13327/001]. |
References
- Loo, B.P.; Fan, Z. Social interaction in public space: Spatial edges, moveable furniture, and visual landmarks. Environ. Plan. B Urban Anal. City Sci. 2023, 50, 2510–2526. [Google Scholar] [CrossRef]
- Carmona, M. The “public-isation” of private space–towards a charter of public space rights and responsibilities. J. Urban. Int. Res. Placemak. Urban Sustain. 2022, 15, 133–164. [Google Scholar] [CrossRef]
- Honey-Rosés, J.; Anguelovski, I.; Chireh, V.K.; Daher, C.; van den Bosch, C.K.; Litt, J.S.; Mawani, V.; McCall, M.K.; Orellana, A.; Oscilowicz, E.; et al. The impact of COVID-19 on public space: An early review of the emerging questions–design, perceptions and inequities. Cities Health 2020, 5, S263–S279. [Google Scholar] [CrossRef]
- Lu, P.; Yang, L.; Wang, C.; Xia, G.; Xiang, H.; Chen, G.; Jiang, N.; Ye, T.; Pang, Y.; Sun, H.; et al. Mental health of new undergraduate students before and after COVID-19 in China. Sci. Rep. 2021, 11, 18783. [Google Scholar] [CrossRef] [PubMed]
- Lades, L.K.; Laffan, K.; Daly, M.; Delaney, L. Daily emotional well-being during the COVID-19 pandemic. Br. J. Health Psychol. 2020, 25, 902–911. [Google Scholar] [CrossRef]
- Frank, L.D.; Andresen, M.A.; Schmid, T.L. Obesity relationships with community design, physical activity, and time spent in cars. Am. J. Prev. Med. 2004, 27, 87–96. [Google Scholar] [CrossRef]
- Huang, L.; Schmid, K.L.; Zhang, J.; Yang, G.-Y.; Wu, J.; Yin, X.-N.; He, G.; Ruan, Z.; Jiang, X.-Q.; Wu, C.-A.; et al. Association between greater residential greenness and decreased risk of preschool myopia and astigmatism. Environ. Res. 2021, 196, 110976. [Google Scholar] [CrossRef]
- Jackson, S.B.; Stevenson, K.T.; Larson, L.R.; Peterson, M.N.; Seekamp, E. Outdoor activity participation improves adolescents’ mental health and well-being during the COVID-19 pandemic. Int. J. Environ. Res. Public Health 2021, 18, 2506. [Google Scholar] [CrossRef]
- Oswald, T.K.; Rumbold, A.R.; Kedzior, S.G.; Moore, V.M. Psychological impacts of “screen time” and “green time” for children and adolescents: A systematic scoping review. PLoS ONE 2020, 15, e0237725. [Google Scholar] [CrossRef]
- Hunter, R.; Cleland, C.; Cleary, A.; Droomers, M.; Wheeler, B.; Sinnett, D.; Nieuwenhuijsen, M.; Braubach, M. Environmental, health, wellbeing, social and equity effects of urban green space interventions: A meta-narrative evidence synthesis. Environ. Int. 2019, 130, 104923. [Google Scholar] [CrossRef]
- Mouratidis, K.; Poortinga, W. Built environment, urban vitality and social cohesion: Do vibrant neighborhoods foster strong communities? Landsc. Urban Plan. 2020, 204, 103951. [Google Scholar] [CrossRef]
- Huang, S.-C.L. A study of outdoor interactional spaces in high-rise housing. Landsc. Urban Plan. 2006, 78, 193–204. [Google Scholar] [CrossRef]
- Carmona, M.; Giordano, V.; Nayyar, N.; Kurland, J.; Buddle., C. Home Comforts: How the Design of Our Homes and Neighbourhoods Affected Our Experience of Lockdown and What We Can Learn for the Future; Place Alliance: London, UK, 2020. [Google Scholar]
- Ferenčuhová, S.; Horňáková, M.S.; Kočková, J.; Špačková, P. Public, private and the pandemic: Everyday life in large housing estates during the COVID-19 lockdowns. Cities 2025, 156, 105575. [Google Scholar] [CrossRef]
- Carmona, M. Public Places Urban Spaces: The Dimensions of Urban Design; Routledge: Abingdon, UK, 2021. [Google Scholar]
- Yang, Y.; Vaughan, L. Does area type matter for pedestrian distribution? Testing movement economy theory on gated and non-gated housing estates in Wuhan, China. Comput. Environ. Urban Syst. 2022, 97, 101868. [Google Scholar] [CrossRef]
- Ma, X.; Chau, C.K.; Lai, J.H.K. Critical factors influencing the comfort evaluation for recreational walking in urban street environments. Cities 2021, 116, 103286. [Google Scholar] [CrossRef]
- Chang, P.-J. Effects of the built and social features of urban greenways on the outdoor activity of older adults. Landsc. Urban Plan. 2020, 204, 103929. [Google Scholar] [CrossRef]
- Gehl, J. Cities for People; Island Press: Washington, DC, USA, 2013. [Google Scholar]
- Askarizad, R.; Safari, H. The influence of social interactions on the behavioral patterns of the people in urban spaces (case study: The pedestrian zone of Rasht Municipality Square, Iran). Cities 2020, 101, 102687. [Google Scholar] [CrossRef]
- Han, S.; Song, D.; Xu, L.; Ye, Y.; Yan, S.; Shi, F.; Zhang, Y.; Liu, X.; Du, H. Behaviour in public open spaces: A systematic review of studies with quantitative research methods. Build. Environ. 2022, 223, 109444. [Google Scholar] [CrossRef]
- Zapata, O.; Honey-Rosés, J. The Behavioral Response to Increased Pedestrian and Staying Activity in Public Space: A Field Experiment. Environ. Behav. 2022, 54, 36–57. [Google Scholar] [CrossRef]
- Kim, S.W.; Brown, R.D. Pedestrians’ behavior based on outdoor thermal comfort and micro-scale thermal environments, Austin, TX. Sci. Total Environ. 2022, 808, 152143. [Google Scholar] [CrossRef]
- Meng, Q.; Zhao, T.; Kang, J. Influence of music on the behaviors of crowd in urban open public spaces. Front. Psychol. 2018, 9, 596. [Google Scholar] [CrossRef] [PubMed]
- Sun, X.; Wang, L.; Wang, F.; Soltani, S. Behaviors of seniors and impact of spatial form in small-scale public spaces in Chinese old city zones. Cities 2020, 107, 102894. [Google Scholar] [CrossRef]
- Whyte, W.H. The Social Life of Small Urban Spaces; The Conservation Foundation: Washington, DC, USA, 1980. [Google Scholar]
- Goličnik, B.; Thompson, C.W. Emerging relationships between design and use of urban park spaces. Landsc. Urban Plan. 2010, 94, 38–53. [Google Scholar] [CrossRef]
- Chen, Y.; Liu, T.; Liu, W. Increasing the use of large-scale public open spaces: A case study of the North Central Axis Square in Shenzhen, China. Habitat Int. 2016, 53, 66–77. [Google Scholar] [CrossRef]
- Shaftoe, H. Convivial Urban Spaces: Creating Effective Public Places; Routledge: Abingdon, UK, 2012. [Google Scholar]
- Mehta, V. Streets and social life in cities: A taxonomy of sociability. Urban Des. Int. 2019, 24, 16–37. [Google Scholar] [CrossRef]
- Gehl, J. Life Between Buildings: Using Public Space; Van Nostrand Reinhold: New York, NY, USA, 1987. [Google Scholar]
- Peng, S.; Maing, M. Influential factors of age-friendly neighborhood open space under high-density high-rise housing context in hot weather: A case study of public housing in Hong Kong. Cities 2021, 115, 103231. [Google Scholar] [CrossRef]
- Heffernan, E.; Heffernan, T.; Pan, W. The relationship between the quality of active frontages and public perceptions of public spaces. Urban Des. Int. 2014, 19, 92–102. [Google Scholar] [CrossRef]
- Jacobs, J. The Death and Life of Great American Cities; Vintage; Random House: New York, NY, USA, 1961. [Google Scholar]
- Gehl, J.; Kaefer, L.J.; Reigstad, S. Close encounters with buildings. Urban Des. Int. 2006, 11, 29–47. [Google Scholar] [CrossRef]
- Remali, A.M.; Porta, S.; Romice, O.; Abudib, H. Street quality, street life, street centrality. In Suburban Urbanities: Suburbs and the Life of the High Street; Vaughan, L., Ed.; UCL Press: London, UK, 2015; pp. 104–129. [Google Scholar]
- Van Nes, A.; Yamu, C. Introduction to Space Syntax in Urban Studies; Springer Nature: Cham, Switzerland, 2021; 265p. [Google Scholar]
- Hanson, J.; Zako, R. Housing in the twentieth-century city. In Designing Sustainable Cities; Cooper, R., Evans, G., Boyko, C., Eds.; John Wiley & Sons: Hoboken, NJ, USA, 2009. [Google Scholar]
- Hassan, D.M.; Moustafa, Y.M.; El-Fiki, S.M. Ground-floor façade design and staying activity patterns on the sidewalk: A case study in the Korba area of Heliopolis, Cairo, Egypt. Ain Shams Eng. J. 2019, 10, 453–461. [Google Scholar] [CrossRef]
- Ewing, R.; Handy, S. Measuring the unmeasurable: Urban design qualities related to walkability. J. Urban Des. 2009, 14, 65–84. [Google Scholar] [CrossRef]
- Hillier, B.; Burdett, R.; Peponis, J.; Penn, A. Creating life: Or, does architecture determine anything? Archit. Comport. Archit. Behav. 1987, 3, 233–250. [Google Scholar]
- Hillier, B.; Vaughan, L. The city as one thing. Prog. Plan. 2007, 67, 205–230. [Google Scholar]
- Karimi, K. A configurational approach to analytical urban design: ‘Space syntax’ methodology. Urban Des. Int. 2012, 17, 297–318. [Google Scholar] [CrossRef]
- Hillier, B. Against enclosure. In Rehumanizing Housing; Teymur, N., Markus, T., Wooley, T., Eds.; Butterworth: London, UK, 1988; pp. 63–88. [Google Scholar]
- Hanson, J. Urban transformations: A history of design ideas. Urban Des. Int. 2000, 5, 97–122. [Google Scholar] [CrossRef]
- Can, I.; Heath, T. In-between spaces and social interaction: A morphological analysis of Izmir using space syntax. J. Hous. Built Environ. 2015, 31, 31–49. [Google Scholar] [CrossRef]
- Sheng, Q.; Wan, D.; Yu, B. Effect of Space Configurational Attributes on Social Interactions in Urban Parks. Sustainability 2021, 13, 7805. [Google Scholar] [CrossRef]
- Kim, J.Y.; Kim, Y.O. Residents’ Spatial-Usage Behavior and Interaction According to the Spatial Configuration of a Social Housing Complex: A Comparison between High-Rise Apartments and Perimeter Block Housing. Sustainability 2022, 14, 1138. [Google Scholar] [CrossRef]
- Trova, V.; Hadjinikolaou, E.; Xenopoulos, S.; Peponis, J. The Structure of Public Space in Sparsely Urban Areas. In Proceedings of the 2nd International Space Syntax Symposium, Brasilia, Brazil, 29 March–2 April 1999; University of Brasilia: Brasilia, Brazil, 1999. [Google Scholar]
- Appleton, J. The Experience of Landscape; Wiley: Chichester, UK, 1996. [Google Scholar]
- Campos, M.B.d.A.; Golka, T. Public spaces revisted: A study of the relationship between patterns of stationary activity and visual fields. In Proceedings of the 5th International Space Syntax Symposium, Delft, The Netherlands, 13–17 June 2005; TU Delft: Delft, The Netherlands, 2005. [Google Scholar]
- Bada, Y.; Farhi, A. Experiencing urban spaces: Isovists properties and spatial use of plazas. Courr. Savoir 2009, 9, 101–112. [Google Scholar]
- Guerreiro, M.; Guarda, I.; Medeiros, V.; Loureiro, V. Seeing, Standing and Sitting: The Architecture of Co-Presence in Small Urban Spaces presence in small urban spaces. In Proceedings of the CITTA 8th Annual Conference on Planning Research, Porto, Portugal, 8–10 July 2015. [Google Scholar]
- Zerouati, W.; Bellal, T. Evaluating the impact of mass housings’ in-between spaces’ spatial configuration on users’ social interaction. Front. Archit. Res. 2020, 9, 34–53. [Google Scholar] [CrossRef]
- Raman, S. Designing a liveable compact city: Physical forms of city and social life in urban neighbourhoods. Built Environ. 2010, 36, 63–80. [Google Scholar] [CrossRef]
- Cheshmehzangi, A. The Changing Urban Landscape of Chinese Cities: Positive and Negative Impacts of Urban Design Controls on Contemporary Urban Housing. Sustainability 2018, 10, 2839. [Google Scholar] [CrossRef]
- Wang, Z. Evolving landscape-urbanization relationships in contemporary China. Landsc. Urban Plan. 2018, 171, 30–41. [Google Scholar] [CrossRef]
- Miao, P. Deserted streets in a jammed town: The gated community in Chinese cities and its solution. J. Urban Des. 2003, 8, 45–66. [Google Scholar] [CrossRef]
- Pow, C.-P. Gated Communities in China: Class, Privilege and the Moral Politics of the Good Life; Routledge: Abingdon, UK, 2009. [Google Scholar]
- Hamama, B.; Liu, J. What is beyond the edges? Gated communities and their role in China’s desire for harmonious cities. City Territ. Archit. 2020, 7, 1–12. [Google Scholar] [CrossRef]
- Zhou, L. China’s gated communities: Symbols of privilege reflect a history of exclusivity. South China Morning Post, 16 March 2016. Available online: https://www.scmp.com/news/china/policies-politics/article/1925697/chinas-gated-communities-symbols-privilege-reflect (accessed on 10 March 2025).
- Xu, M.; Yang, Z. Design history of China’s gated cities and neighbourhoods: Prototype and evolution. Urban Des. Int. 2009, 14, 99–117. [Google Scholar] [CrossRef]
- Miao, P. Seven characteristics of traditional urban form in southeast China. Tradit. Dwell. Settl. Rev. 1990, 1, 35–47. [Google Scholar]
- Bentley, I. Urban Transformations: Power, People and Urban Design; Routledge: Abingdon, UK, 1999. [Google Scholar]
- Blakely, E.J.; Snyder, M.G. Fortress America: Gated Communities in the United States; Brookings Institution Press: Washington, DC, USA, 1997. [Google Scholar]
- Renming. China to Open Up Gated Residential Communities to Public. 2016. Available online: http://en.people.cn/n3/2016/0223/c90882-9019794.html (accessed on 10 September 2018).
- Wu, X. Policy Transition from Gated Community to Block System: Situation Study and Reform Approaches. China City Plan. Rev. 2016, 25, 36. [Google Scholar]
- Chiu-Shee, C.; Ryan, B.D.; Vale, L.J. Ending gated communities: The rationales for resistance in China. Hous. Stud. 2021, 38, 1482–1511. [Google Scholar] [CrossRef]
- Wang, H.; Pojani, D. The challenge of opening up gated communities in Shanghai. J. Urban Des. 2020, 25, 505–522. [Google Scholar] [CrossRef]
- Yunitsyna, A.; Shtepani, E.; Hasa, K. Socioeconomic performance of in-between open spaces in a post-socialist city of Tirana, Albania. Front. Archit. Res. 2024, 13, 858–875. [Google Scholar] [CrossRef]
- Gardner, W.; Mulvey, E.P.; Shaw, E.C. Regression analyses of counts and rates: Poisson, overdispersed Poisson, and negative binomial models. Psychol. Bull. 1995, 118, 392. [Google Scholar] [CrossRef] [PubMed]
- Turner, A. Depthmap: A program to perform visibility graph analysis. In Proceedings of the 3rd International Space Syntax Symposium, Atlanta, GA, USA, 7–11 May 2001; Georgia Institute of Technology: Atlanta, GA, USA, 2001. [Google Scholar]
- Benedikt, M.L. To take hold of space: Isovists and isovist fields. Environ. Plan. B Plan. Des. 1979, 6, 47–65. [Google Scholar] [CrossRef]
- Turner, A.; Doxa, M.; O’Sullivan, D.; Penn, A. From isovists to visibility graphs: A methodology for the analysis of architectural space. Environ. Plan. B Plan. Des. 2001, 28, 103–121. [Google Scholar] [CrossRef]
- Conroy-Dalton, R.; Bafna, S. The syntactical image of the city: A reciprocal definition of spatial elements and spatial syntaxes. In Proceedings of the 4th International Space Syntax Symposium, London, UK, 17–20 June 2003; University College London: London, UK, 2003. [Google Scholar]
- Koutsolampros, P.; Sailer, K.; Varoudis, T.; Haslem, R. Dissecting Visibility Graph Analysis: The metrics and their role in understanding workplace human behaviour. In Proceedings of the 12th International Space Syntax Symposium, Beijing, China, 10–15 July 2019; Beijing Jiaotong University: Beijing, China, 2019. [Google Scholar]
- Cameron, A.C.; Trivedi, P.K. Regression Analysis of Count Data; Cambridge University Press: Cambridge, UK, 2013; Volume 53. [Google Scholar]
- Zhang, R.; Cao, L.; Liu, Y.; Guo, R.; Luo, J.; Shu, P. Decoding Spontaneous Informal Spaces in Old Residential Communities: A Drone and Space Syntax Perspective. ISPRS Int. J. Geo-Inf. 2023, 12, 452. [Google Scholar] [CrossRef]
- Srikanth, A.D.; Anklesaria, F.; Zhong, Y.; Zhang, X.; Schroepfer, T. Verticality in Urban Spaces: Analysing Seating Preferences and the Spatial Network. In Proceedings of the 14th International Space Syntax Symposium, Bucharest, Romania, 17–21 June 2024. [Google Scholar]
- Hillier, B.; Penn, A.; Hanson, J.; Grajewski, T.; Xu, J. Natural movement: Or, configuration and attraction in urban pedestrian movement. Environ. Plan. B Plan. Des. 1993, 20, 29–66. [Google Scholar] [CrossRef]
- Zhao, L.; Shen, Z.; Zhang, Y.; Sheng, F. Study on the impact of the objective characteristics and subjective perception of the built environment on residents’ physical activities in Fuzhou, China. Sustainability 2019, 12, 329. [Google Scholar] [CrossRef]
- Cao, J.; Kang, J. Social relationships and patterns of use in urban public spaces in China and the United Kingdom. Cities 2019, 93, 188–196. [Google Scholar] [CrossRef]
- Zacharias, J.; Stathopoulos, T.; Wu, H. Spatial behavior in San Francisco’s plazas: The effects of microclimate, other people, and environmental design. Environ. Behav. 2004, 36, 638–658. [Google Scholar] [CrossRef]
- Bentley, I. Responsive Environments: A Manual for Designers; Routledge: Abingdon, UK, 1985. [Google Scholar]
- Gordon, C. The Concise Townscape; Routledge: London, UK, 1961. [Google Scholar]
- Glaser, M. The City at Eye Level: Lessons for Street Plinths; Eburon Uitgeverij BV: Utrecht, The Netherlands, 2012. [Google Scholar]
- Simpson, J.; Freeth, M.; Simpson, K.J.; Thwaites, K. Street edge subdivision: Structuring ground floor interfaces to stimulate pedestrian visual engagement. Environ. Plan. B Urban Anal. City Sci. 2022, 49, 1775–1791. [Google Scholar] [CrossRef]
- Durmaz-Drinkwater, B.; Platt, S.; Can-Traunmüller, I. Do perceptions of neighbourhood change match objective reality? J. Urban Des. 2020, 25, 718–737. [Google Scholar] [CrossRef]
- Amin, M.B.; Bielik, M.; Schneider, S. Decision Tree Based Prediction Model of Sitting Behavior on Public Spaces. In Proceedings 13th International Space Syntax Symposium, SSS 2022, Riyadh, Saudi Arabia, 13–17 June 2022; Western Norway University of Applied Sciences (HVL): Bergen, Norway, 2022. [Google Scholar]


Disclaimer/Publisher’s Note: The statements, opinions and data contained in all publications are solely those of the individual author(s) and contributor(s) and not of MDPI and/or the editor(s). MDPI and/or the editor(s) disclaim responsibility for any injury to people or property resulting from any ideas, methods, instructions or products referred to in the content. |
© 2025 by the authors. Licensee MDPI, Basel, Switzerland. This article is an open access article distributed under the terms and conditions of the Creative Commons Attribution (CC BY) license (https://creativecommons.org/licenses/by/4.0/).