Article

Study on the Correlation Between Transportation Development and Urban Expansion in China from the Perspective of Spatio-Temporal Heterogeneity

Information Center of Ministry of Natural Resources of the People’s Republic of China, Beijing 100034, China
*
Author to whom correspondence should be addressed.
Land 2025, 14(12), 2326; https://doi.org/10.3390/land14122326
Submission received: 28 September 2025 / Revised: 22 October 2025 / Accepted: 20 November 2025 / Published: 27 November 2025

Abstract

With the acceleration of urbanization in China, the spatiotemporal effects of transportation development have profoundly influenced urban expansion, potentially posing challenges to the sustainable development of urban economic, social, and ecological systems. Existing research has primarily focused on the relationship between transportation systems and urban expansion at the city, urban agglomeration, and regional levels, but studies from a broader spatial scale and spatiotemporal heterogeneity perspective remain relatively scarce. This study examines 364 cities in China, using the proportion of urban construction land area and nighttime light data to characterize urban expansion levels. The geographically weighted regression model is employed to analyze the spatiotemporal heterogeneity of the correlation between transportation development and urban expansion, while the spatial Durbin model is used to explore spatial spillover effects. The results reveal significant spatiotemporal heterogeneity in the relationship between transportation development and urban expansion. From 2010 to 2020, the spatial heterogeneity of the correlation between transportation development and the Percentage of Construction Land Area increased, while the spatial heterogeneity of its correlation with Nighttime Lights decreased. Among the ten transportation development indicators, National Road Density and Density of Street Light showed the most significant correlations with urban expansion. Additionally, some transportation development indicators exhibited notable spatial spillover effects on urban expansion, with Provincial Road Density and Density of Road with Lights having the most prominent impacts. This study provides scientific evidence for planners and policymakers to formulate more precise urban development strategies and promote high-quality, sustainable urban development.

1. Introduction

As reported in the United Nations’ World Cities Report 2022, urban areas currently house 55% of the global population, and this proportion is projected to reach 68% by 2050. With the accelerated pace of global urbanization, the expansion of cities can contribute to socioeconomic development; however, it may also give rise to urban issues such as traffic congestion, environmental deterioration, and the urban heat island effect, consequently having adverse effects on urban environments, resource utilization, and public health [1,2,3]. Urban expansion, one of the main manifestations of urbanization [4,5,6] presents substantial challenges to the attainment of Sustainable Development Goal 11 (SDG 11) [7]. Numerous scholars have posited that there is a strong positive correlation between urbanization and transportation development, indicating a mutually reinforcing relationship between these two processes [8,9]. Hence, investigating the relationship between transportation development and urban expansion is essential for facilitating urban socioeconomic development and attaining the targets of SDG 11.
In the field of urban studies, Urban Expansion and Urban Sprawl are considered distinct terminologies that depict urban development processes in developing and developed countries, respectively [10]. Urban sprawl denotes the unplanned, unordered, and functionally ineffective outward expansion of urban areas into adjacent regions. It is characterized by low-density, spatially dispersed, and leapfrogging development patterns, which are integral to the processes of urbanization and suburbanization in the United States [11,12,13]. In contrast, urban expansion generally signifies the outward growth of towns and cities in developing countries, propelled by population growth, economic development, or spatial requirements. This process does not necessarily entail leapfrogging or low-density development [14]; however, it may result in increasing disparities among and within cities, as well as between urban and rural areas [15,16,17]. Research on Urban Sprawl has predominantly concentrated on its morphological attributes, including shape, compactness, and dispersion [18,19,20], and its detrimental impacts on urban systems, ecological environments, and human health [21,22,23,24,25,26]. Some scholars fail to differentiate between the concepts and connotations of Urban Expansion and Urban Sprawl [27,28]. This study centers on the growth of built-up urban areas and their relationship with economic development, without taking into account spatial attributes such as patch structure, density, or the continuity of expansion zones. Hence, it focuses on the phenomenon of Urban Expansion commonly witnessed in developing countries, with China serving as a representative example.
Urban expansion involves not only spatial growth but also multiple aspects including population, economy, society, and environment. The objectives and approaches of urban expansion may differ across various temporal and spatial contexts [29,30]. Regional development policies, urban planning, and transportation policies exert different influences depending on the temporal and spatial scales [31,32,33]. For instance, during periods of rapid economic growth, cities may give priority to the expansion of infrastructure. In contrast, under increasing resource and environmental pressures, they may shift their focus towards sustainable development [32,33,34]. Transportation development, including roads, railways, bridges, and public transit, can have positive impacts on urban economic growth and residents’ well-being [35,36]. The decisions of urban planners and policymakers significantly influence the trends, pace, and support mechanisms of transportation development [37,38]. Meanwhile, the relationship between urban economy, urban scale, and transportation development is mutually strengthening [39,40,41,42]. However, the expansion of traditional transportation systems often has negative impacts on urban ecosystems and sustainable development [43,44,45]. Therefore, optimizing transportation structures, promoting green mobility, and achieving smart growth according to urban development needs are of great significance [46].
The relationship between transportation infrastructure and urban expansion has become a central topic in urban geography and regional studies. There is a broad academic consensus that there is a significant positive interaction between the two. Urban spatial structure determines transportation demand and patterns. In turn, transportation systems reshape urban spatial layouts and structural evolution by improving accessibility [9,47,48]. Numerous studies have confirmed this interrelationship from spatio-temporal perspectives through methods such as causality testing [49], spatial analysis [50,51], and comparative case studies [52,53,54], which reveals both the universality and complexity of the relationship. Despite the large amount of existing research, there are still theoretical and methodological limitations in clarifying its underlying mechanisms, which provides the motivation and entry point for this study.
First, from the research methodology perspective, existing studies have inadequately captured spatial heterogeneity. Previous research has utilized a diverse array of methods, ranging from traditional econometric approaches like difference-in-differences (DID), factor analysis, and logistic regression [55,56,57], to land-use simulation and spatial analysis techniques such as cellular automata [55,56,57,58,59,60,61], and emerging machine learning methods including neural networks, gradient boosting decision trees, and explainable artificial intelligence [62,63,64]. Nevertheless, most of these approaches concentrate on identifying global average patterns or describing correlations, without adequately tackling the crucial question of where the impact of transportation development on urban expansion is most significant. In other words, the influence of driving factors on urban expansion can vary considerably across geographical locations, which is an indication of spatial heterogeneity and remains under-investigated in mainstream analyses. To address this problem, the Geographically Weighted Regression and the Spatial Durbin Model [59,65,66,67] have been introduced to account for spatial dependence and spillover effects in urban expansion, which is the main reason these two methods are employed in this study.
Second, from the research orientation perspective, previous studies have conducted limited investigations into systematic spatio-temporal heterogeneity. Most existing studies have focused on the overall relationship between transportation development and urban expansion, usually at the levels of individual cities [68,69], broader regions [70,71], or other regions [27,67,72], with few analyses explicitly dealing with spatio-temporal differentiation across areas. Nevertheless, the influence of transportation is inherently non-uniform; its intensity and pattern can differ fundamentally between core and peripheral cities or between eastern and western regions [48,73]. Overlooking such systematic spatio-temporal variations, which arise from differences in location and developmental stage, impedes a comprehensive understanding of the complex transport-urban relationship. Thus, adopting a perspective of spatio-temporal heterogeneity is crucial for enhancing insights into this complex relationship.
In light of this, the present study advocates the adoption of a novel perspective centered on decomposing spatio-temporal heterogeneity and identifying spillover effects. For a large-scale country such as China, which exhibits substantial regional disparities, simply confirming the macro-level relationship between the two is inadequate. The crux lies in clarifying how the impact of transportation development varies across different regions and whether this impact spreads to the surrounding areas. For this purpose, the present study selects 364 cities in China as research subjects and integrates the Geographically Weighted Regression model and the Spatial Durbin Model to conduct complementary local and global analyses. The GWR model is employed to precisely uncover the spatial non-stationarity of transportation impacts, addressing the question of where the differences lie. The SDM is utilized to differentiate between local effects and spatial spillover effects in adjacent areas, addressing the question of how the impact spreads. It is believed that effectively identifying the positive and negative impacts of transportation development factors on urban expansion and grasping their spatio-temporal distribution patterns can offer crucial references for optimizing urban expansion models, attaining urban sustainability, and enhancing residents’ quality of life.

2. Materials and Methods

2.1. Study Area

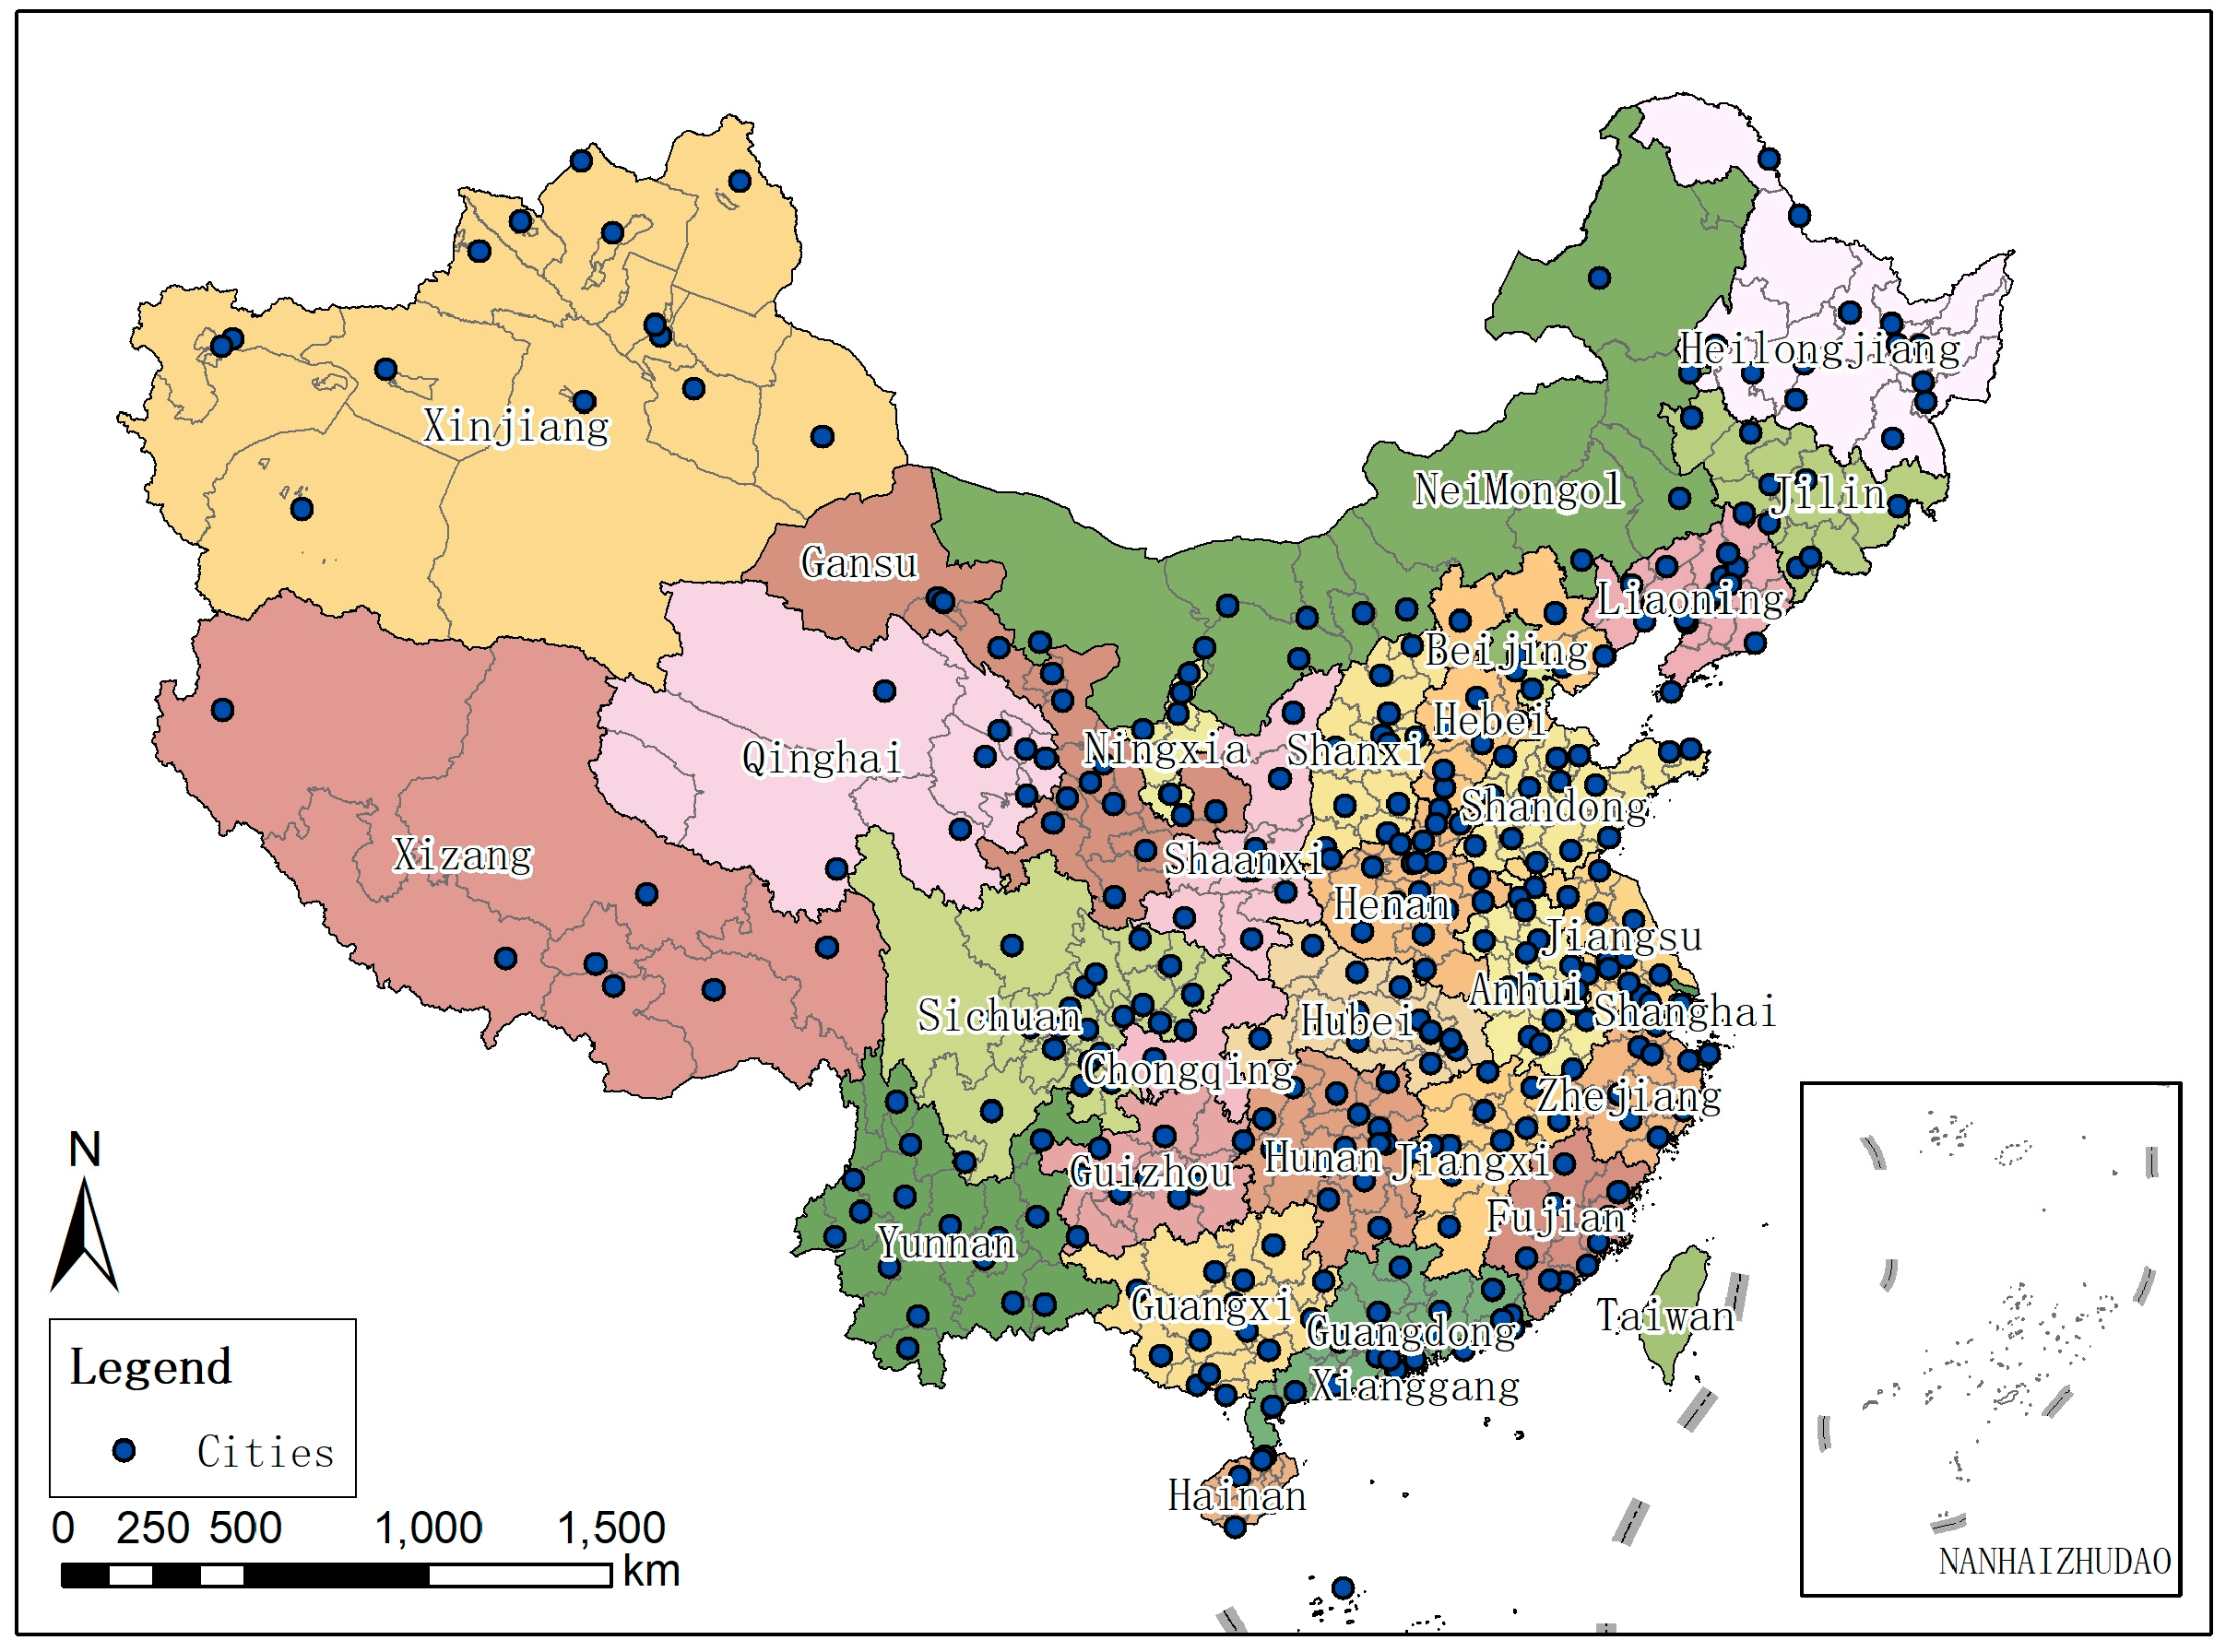
The study area includes the entire territory of China. Due to data availability, Hong Kong, Macau, Taiwan, and the South China Sea islands are not included in the calculations. The study scope encompasses 31 provincial-level administrative units, involving a total of 364 urban units. China is located in the eastern part of Asia, along the western coast of the Pacific Ocean, covering a land area of approximately 9.6 million square kilometers. China is characterized by significant regional differences and distinct urban hierarchies. Due to its vast territory, there are marked disparities in economic development levels, transportation infrastructure development, and urban expansion rates across different regions. From first-tier cities to fourth-tier cities and below, the scale, function, and expansion patterns of cities vary greatly. This unbalanced development among regions provides typical samples for studying spatial and temporal heterogeneity.
Since the reform and opening-up, China’s urbanization rate has increased from 17.9% in 1978 to 63.89% in 2020, indicating a rapid pace of urbanization. This swift urbanization process has posed new demands and challenges for urban transportation systems. With the advancement of urbanization, China has significantly intensified its transportation infrastructure construction, with substantial increases in urban road length and area, rapid development of public transportation facilities, and vigorous high-speed railway construction. The transportation capacity has been notably enhanced, providing abundant case studies for transportation research. However, the spatial distribution of transportation and urban development remains uneven, with significant disparities between urban and rural areas and among regions. Urban problems resulting from rapid expansion are still severe. As a typical representative of developing countries and an important participant in achieving the global SDG11 goals, studying its development characteristics and correlations, as well as the spatial and temporal dimensions, is crucial for understanding the performance, issues, and mechanisms of urban expansion and transportation development in rapidly urbanizing developing countries under the requirements of sustainable development (Figure 1).

2.2. Datasets

This study employs the proportion of urban construction land area and nighttime light data to characterize the extent of urban expansion. Urban construction land is a specific land category earmarked for development and construction, serving as a fundamental basis for socio-economic activities. Its quantity, scale, and proportion can directly reflect a city’s development status and the rationality of land utilization. Changes in urban construction land are closely associated with socio-economic development [74] and are frequently utilized in urban and land-related research [75,76,77,78]. The boundary data of administrative units at all levels in China used in this study come from the “Tianditu” National Geoinformation Public Service Platform (https://www.tianditu.gov.cn/, accessed on 22 October 2024). The construction land data comes from the China 30 m Land Use Dataset provided by the National Earth System Science Data Center (https://www.geodata.cn, accessed on 22 October 2024), which is based on the U.S. Landsat remote sensing imagery as the main information source and constructed through manual visual interpretation to create a national-scale multi-period land use/land cover thematic database.
Nighttime light is a significant indicator for depicting urban expansion and economic prosperity, and it has been demonstrated to be highly correlated with population density and the intensity of human activities [79,80]. Nighttime light data can not only be utilized to analyze multi-scale urban spatial structures and evolutionary patterns, such as urban elements, internal spatial structures, urban regions, and hierarchical structures of urban systems, but also to estimate diverse socio-economic development indicators at multiple scales. It has emerged as a significant indicator of urban growth characteristics [81,82,83]. The nighttime light data used in this study comes from a paper published by Wu Yizhen et al. (2021) in the journal IEEE Transactions on Geoscience and Remote Sensing, which provides an improved time-series DMSP-OLS-like data in China by integrating DMSP-OLS and SNPP-VIIRS [84]. We use the average nighttime light intensity of each city for calculations.
The level of transportation infrastructure construction is characterized by indicators such as railway, highway, and national road network densities, involving four subsystems: road density, railways and bridges, road lighting, and public transportation. The ten variables include highway density, national road density, provincial road density, county road density, railway density, bridge density, density of roads with lights, density of street lights, number of taxis per capita, and number of buses per capita. Some scholars believe that the development of urban subway systems promotes surrounding commercial growth, residential development, and population growth [85,86]; however, since most of the cities involved in this study do not have subway systems, this variable is not considered. The transportation network data comes from the National Earth System Science Data Center (https://www.geodata.cn, accessed on 22 October 2024), including main transportation lines such as railways, highways, national roads, provincial roads, and county roads. The transportation infrastructure data for prefecture-level cities comes from the “China City Statistical Yearbook (2010)”, “China City Statistical Yearbook (2020)”, “China Urban Construction Statistical Yearbook (2010)”, and “China Urban Construction Statistical Yearbook (2020)” (Table 1).

2.3. Study Methods

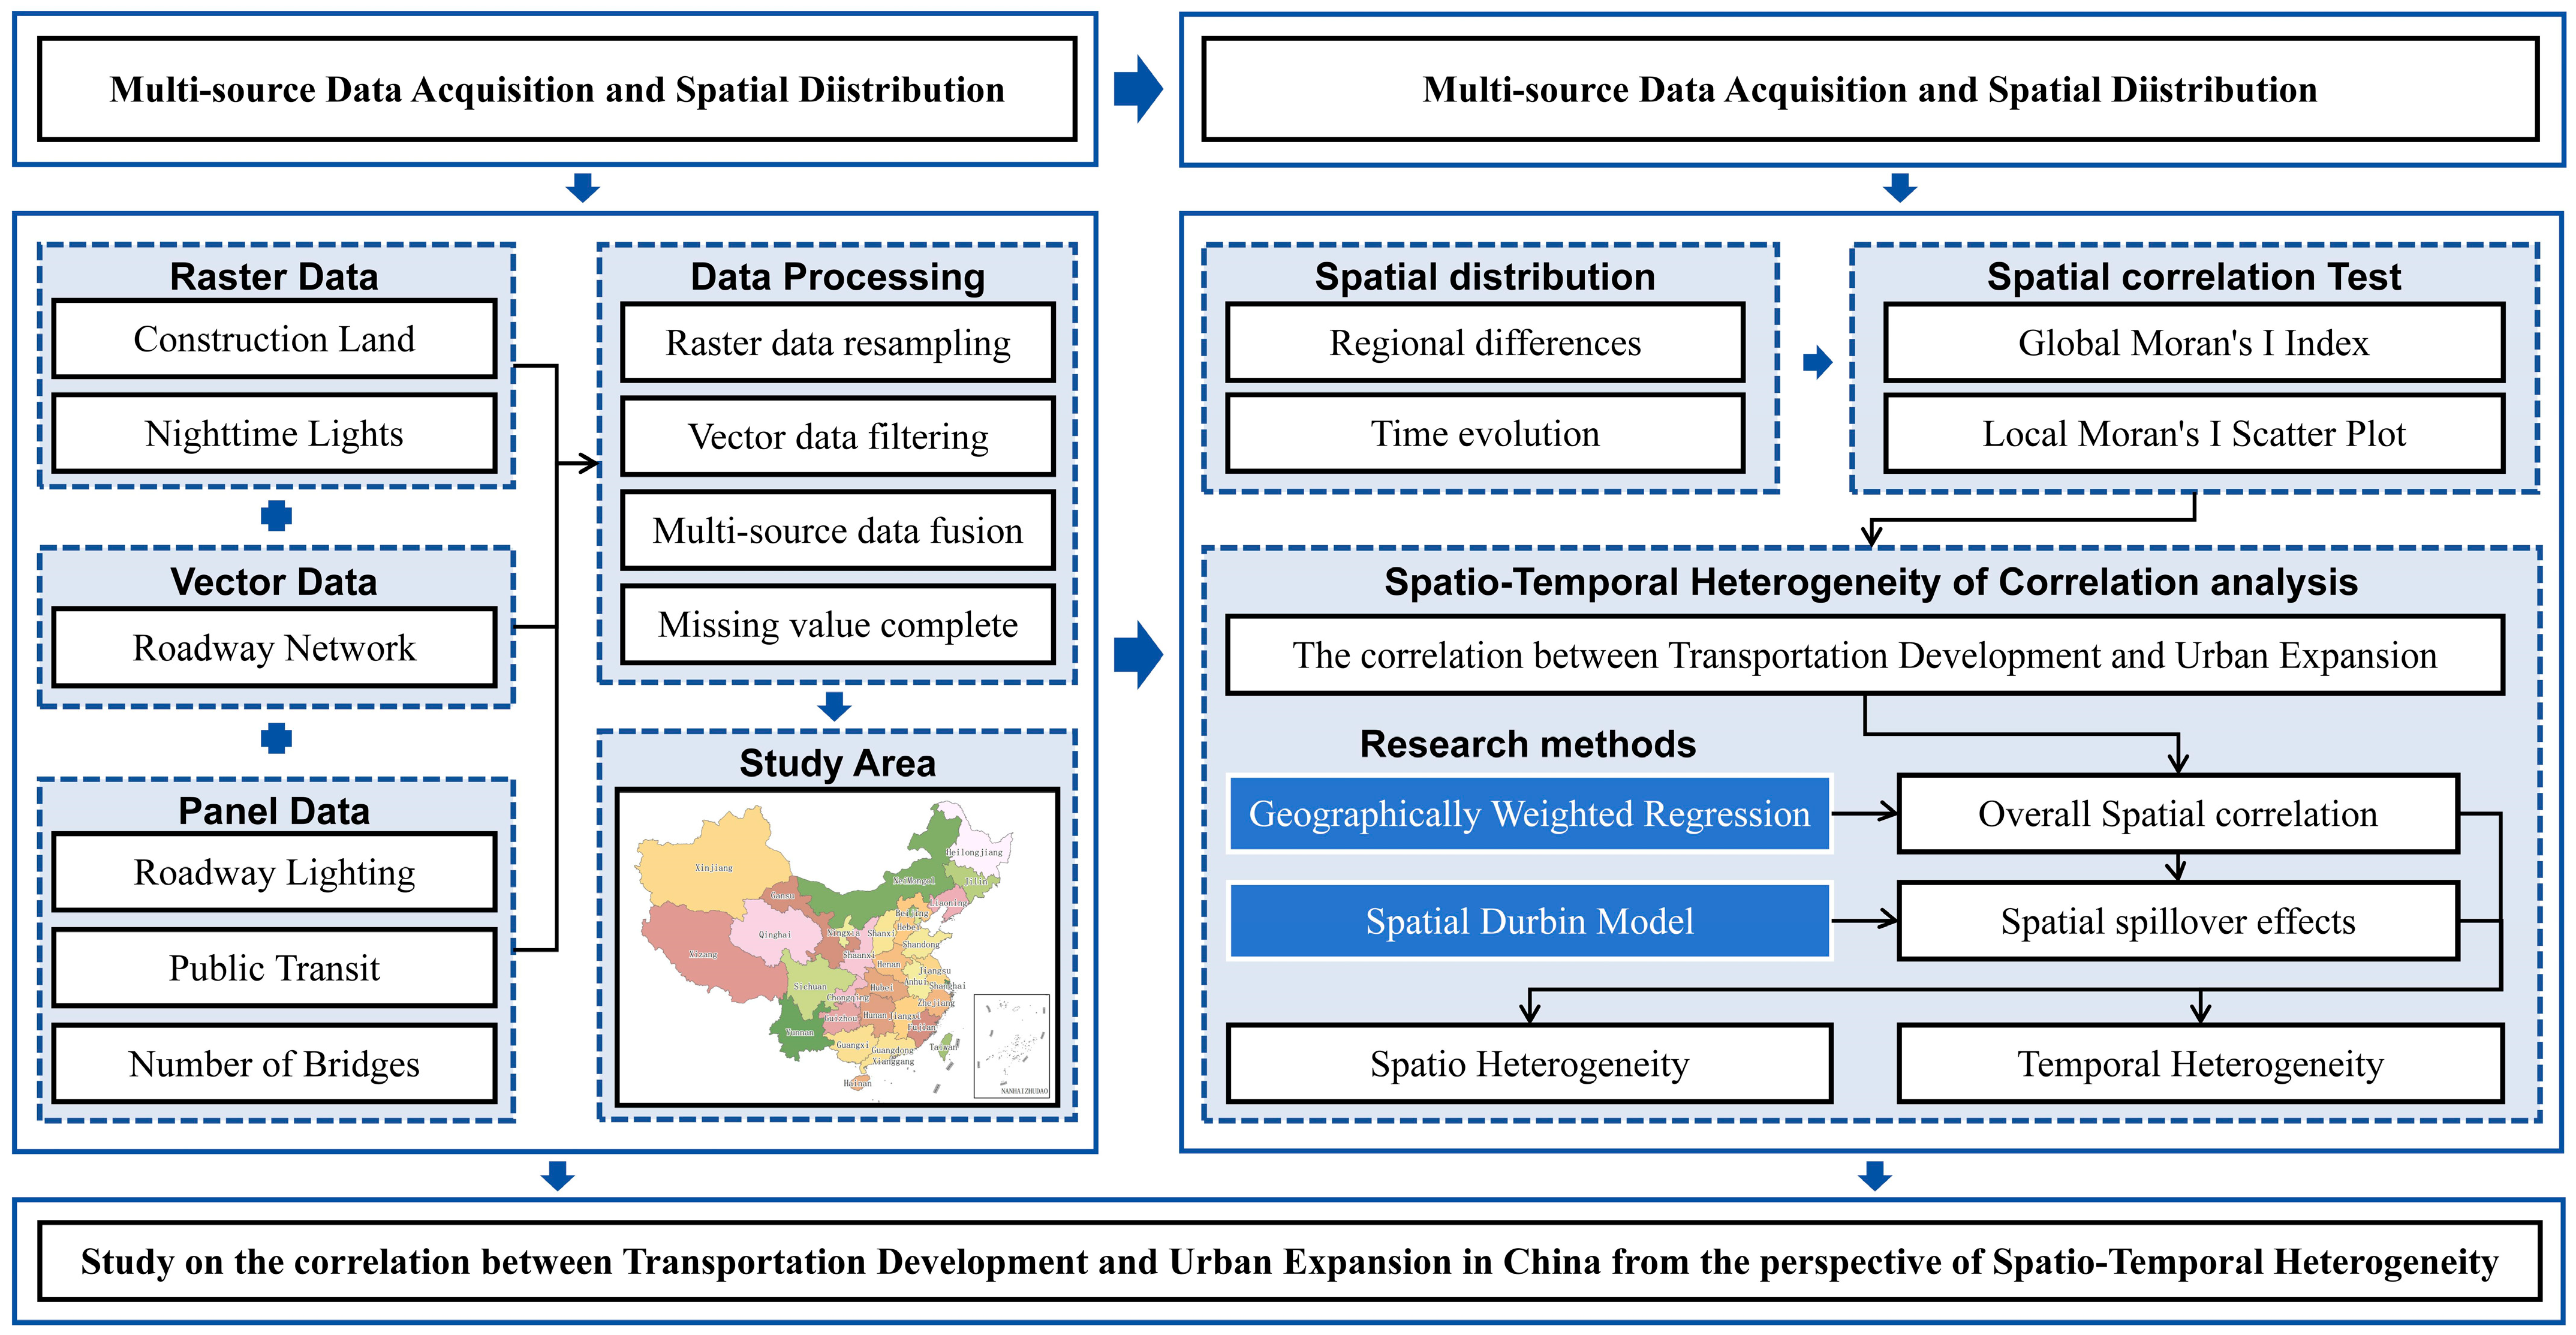
This study adopts a multi-data integration approach, processing and merging raster data, vector data, and panel data, aligning the data with the spatial context of the study area. Firstly, spatial analysis is conducted on regional differences and temporal evolution. Then, spatial correlation is tested using global Moran’s I and local Moran’s I scatter plots. In terms of data analysis, the geographically weighted regression model is first used to analyze the correlation between urban expansion and transportation development indicators in Chinese prefecture-level cities from 2010 to 2020, revealing the spatial heterogeneity between them. Subsequently, the spatial Durbin model is employed to explain the spatial spillover effects of the variables, studying the differences in impacts across different times and spaces (Figure 2).

2.3.1. Geographically Weighted Regression (GWR)

The primary advantage of Geographically Weighted Regression (GWR) lies in its capacity to relax the stringent assumption of spatially invariant parameters in traditional regression, enabling the relationship coefficients to vary flexibly according to geographic location [87,88]. This is consistent with the central argument of this study, which posits that the impact of transportation on urban expansion demonstrates spatial non-stationarity. Its underlying logic can be conceptualized as independently estimating a set of regression coefficients for each city in the study area, thus generating a continuous map of influence intensity. This allows us to intuitively tackle crucial questions, such as the spatial heterogeneity in the promotional effects of transportation development. The GWR model can be expressed in the following form:
y i = β 0 u i , v i + k = 1 m β k u i , v i X i k + ε i
where y i is the urban expansion indicator at spatial location u i , v i , X i k represents the transportation development variable at spatial location u i , v i , β 0 u i , v i is the intercept term of the regression relationship at location i, β k u i , v i is the regression coefficient of the k-th transportation development variable at location u i , v i , which is a continuous function of the spatial location u i , v i , and ε i is the independent random error term.
In the GWR model, an important basis for exploring the spatial non-stationarity of the model is the local estimates of the regression coefficient k. These estimated values of the coefficients can be displayed on a map to facilitate an intuitive observation of the spatial distribution changes in the strength with which each independent variable affects the dependent variable. The model optimizes the adaptive bandwidth using the AICc minimization criterion to determine the optimal sphere of influence for each location.

2.3.2. Spatial Durbin Model (SDM)

The implementation of the Spatial Durbin Model (SDM) is intended to transcend the “local effects” analysis of GWR and further quantify spatial spillover effects. Its underlying logic posits that the expansion of a city is influenced not only by its own transportation conditions but also by the transportation levels and expansion states of neighboring cities. The SDM accomplishes this by incorporating spatial lag terms for both the dependent and independent variables into the equation [89]. It assumes that the urban expansion of a region depends on the transportation development in its surrounding areas:
y = + WXδ + E
where WXδ represents the influence from the transportation development conditions of surrounding units, and δ is the corresponding coefficient vector. Since Equation (2) does not present endogeneity, OLS estimation can be directly applied, although there may be multicollinearity between the transportation development conditions and those of the surrounding units.
The selection criteria for the spatial lag model, spatial error model, and spatial Durbin model can refer to Elhorst, J. P.’s approach [90]. First, the spatial Lagrange Multiplier (LM) test is used to determine the presence of spatial error effects and spatial lag effects. If both are present, a spatial regression model is chosen, which is a priori testing. The post hoc testing involves three steps: the first step uses the Hausman test to determine whether the spatial regression model is suitable for fixed effects or random effects; the second step involves the Wald test, initially assuming the use of the spatial Durbin model, and pairwise comparisons are made to determine whether the spatial Durbin model degenerates into a spatial error model (SEM) or a spatial autoregressive model (SAM); the third step involves the likelihood ratio (LR) test, which also determines whether the spatial Durbin model degenerates into a spatial error model or a spatial lag model. Finally, by comparing the test results, the appropriate spatial econometric model type for the data sample in this study is determined. Combining the spatial Durbin model with the spatial autoregressive model, we get:
y = λWy + + WXδ + E
where λWy represents the influence of the urban expansion conditions of surrounding units on the current unit, and λ is the corresponding coefficient. represents the influence from the transportation development conditions of the current unit, and β is the influence coefficient. WXδ represents the influence from the transportation development conditions of surrounding units, and δ is the corresponding coefficient vector. The E represents the impact of other unconsidered variables on urban expansion. Drawing on this model, the total effect can be deconstructed into direct effects (the net influence of local independent variables on the local dependent variable) and indirect effects (the influence of local independent variables on the dependent variables of other regions, namely, spatial spillover).
In conclusion, the integration of GWR and SDM, which addresses heterogeneity diagnosis and spillover effect measurement from two complementary perspectives, jointly constitutes a comprehensive methodological solution to the central research question. This approach facilitates a more profound exploration of the intrinsic mechanisms between transportation and urban expansion while recognizing spatial complexity. To tackle potential multicollinearity problems, the global variance inflation factor (VIF) was computed (all variables had VIF < 10). Moreover, the research methodologies may have inherent limitations, such as endogeneity and the modifiable areal unit problem.

3. Results

3.1. Spatial Distribution

3.1.1. Urban Expansion

  • Percentage of Construction Land Area (PCLA)
The spatial distribution characteristics of urban construction land area proportion in China show that the eastern regions have a higher proportion, while the western regions have less. The cities with the highest proportion of construction land area mainly include Beijing, Tianjin, Hebei, Shandong, and parts of Liaoning in the Bohai Rim region. Additionally, the proportion of construction land area in North China and the southeastern coastal areas is generally higher than that in western regions such as Xinjiang, Tibet, and Qinghai. From 2010 to 2020, the overall construction land area in China showed an increasing trend, with the range increasing from 0.000 to 588.276‰ to 0.097–613.733‰. Using quintile mapping, it can be observed that there are varying degrees of increase in each segment value. However, the overall spatial distribution trend has not significantly changed (Figure 3a,b).
  • Nighttime Lights (NTL)
The spatial distribution characteristics of nighttime light are similar to the proportion of construction land, showing a high in the east and low in the west trend. The Beijing-Tianjin-Hebei region, Shandong Province, as well as the Yangtze River Delta and Pearl River Delta regions, have the highest nighttime light values. Overall, the nighttime light values in coastal areas are higher than those in inland areas. During the period from 2010 to 2020, the nighttime light values showed a significant increase, with the range increasing from 0.011 to 520.212 to 0.129–591.177. Meanwhile, the gap between different regions further widened, with higher nighttime light values more concentrated in the southeastern coastal areas (Figure 3c,d).

3.1.2. Transportation Development

Transportation development is an important foundation for promoting economic growth and improving the convenience of social life. Influenced by regional geographical location, resource conditions, and the level of socio-economic development, the level of transportation development in China’s prefecture-level cities exhibits significant regional differences.
According to the quintile map of transportation development indicators, the North China region centered around the Beijing-Tianjin-Hebei urban agglomeration and the southeastern coastal region centered around the Yangtze River Delta urban agglomeration have higher densities of railways, highways, national roads, and provincial roads. Similarly, the density of bridges and streetlights also shows a similar clustering trend. Areas with higher county road density are mainly distributed in the southwest region centered around the Chengdu-Chongqing urban agglomeration, as well as in central and southeastern regions. The per capita ownership of taxis and buses shows a spatial distribution pattern of being lower in the south and higher in the north, with high-value areas mainly concentrated in the Northeast, Inner Mongolia, Hebei, and Gansu Province.
Between 2010 and 2020, various transportation development indicators in China achieved significant growth. Indicators such as RD, PRD, BD, and DSL showed a trend of doubling, while their spatial distribution remained largely stable. Notably, in 2020, more high-value areas emerged in the previously transportation-resource-scarce northwest region, indicating significant achievements in transportation development in China’s western regions (Figure 4).

3.2. Spatial Correlation Test

According to econometric theory, the prerequisite for empirical analysis using spatial econometric models is the existence of spatial correlation between the dependent variables, so it is necessary to first perform a correlation test on urban expansion indicators. Based on the urban expansion indicator data of China’s prefecture-level administrative units for 2010 and 2020, the Moran’s I index and its significance were calculated for each year. Moran’s I is used to describe the average degree of association between all spatial units in the entire region and their surrounding areas. From the results of the Moran’s I index, the urban expansion indicators of China’s prefecture-level administrative units in 2010 and 2020 both passed the 1% significance test and were greater than 0, indicating a very significant spatial positive correlation between urban expansion indicators across regions, meaning there is a significant spatial spillover effect. The global Moran’s I index of the PCLA exhibited a downward trend from 2010 to 2020, suggesting a progressive weakening of spatial dependence. This phenomenon might be associated with the recent land-use policies that emphasize stock development and reduction development, which have caused a slowdown in the growth rate of the proportion of urban construction land. Conversely, the global Moran’s I index of NTLrose during the same period, reflecting an enhanced spatial correlation and more prominent regional clustering effects. This implies a further spatial polarization of economic activities, with more distinct regional disparities between bright and dark areas, potentially indicating the continuous accumulation and reinforcement of economic growth in advantaged regions (Table 2).
To identify the urban expansion clustering in specific regions, local Moran scatter plots for the urban expansion indicators of 2010 and 2020 were drawn. Most cities are primarily distributed in the first and third quadrants. Currently, urban expansion in China is predominantly characterized by low-low clustering and high-high clustering, indicating significant local spatial clustering features and global autocorrelation. Furthermore, low-low areas are closer to the origin, while high-high areas are farther from the origin, which may suggest strong regional development imbalances. High-low areas may imply the siphon effect of large cities or the “dark side” phenomenon around large cities (Figure 5).

3.3. Spatio-Temporal Heterogeneity Analysis

Using ArcGIS 10.8, GWR models were constructed for the urban expansion indicators and transportation development indicators of prefecture-level administrative units in 2010 and 2020, to analyze their correlations and spatial heterogeneity. The determination coefficient R2 and the adjusted R2 for the four GWR models in 2010 and 2020 were both greater than 0.840, which is generally high, indicating that the geographically weighted regression model has a very strong explanatory power. The 10 transportation development indicators can explain more than 85% of the variations in construction land area and nighttime lighting values (Table 3).
During the model-selection process, we employed the FIXED kernel type in ArcGIS and the AICc Bandwidth method to determine the most appropriate bandwidth. Notably, PCLA and NTL had the same optimal bandwidth. We fixed the optimal bandwidth for the PCLA model (1047.160 km and 1065.305 km) and then tested the NTL model within a bandwidth range with increments of ±50 km, with a total variation of ±500 km. The sensitivity analysis results indicated that although the bandwidth varied within a certain range, the AICc of the NTL model reached a stable state at changes from 0 to −300 km, and the spatial pattern of the model parameters remained stable. The parameter estimates under the optimal bandwidth selected according to the lowest AICc criterion presented theoretically inexplicable extreme values, suggesting that the model might have overfitted the noise in the data. To tackle this issue, we balanced the model’s goodness-of-fit with the interpretability of the results and ultimately chose a bandwidth with a slightly higher AICc value but robust parameter estimates that conformed to theoretical expectations. This verifies that, in this specific case study for the years 2010 and 2020, the spatial processes of the driving factors influencing PCLA and NTL indeed share a similar effective scale.
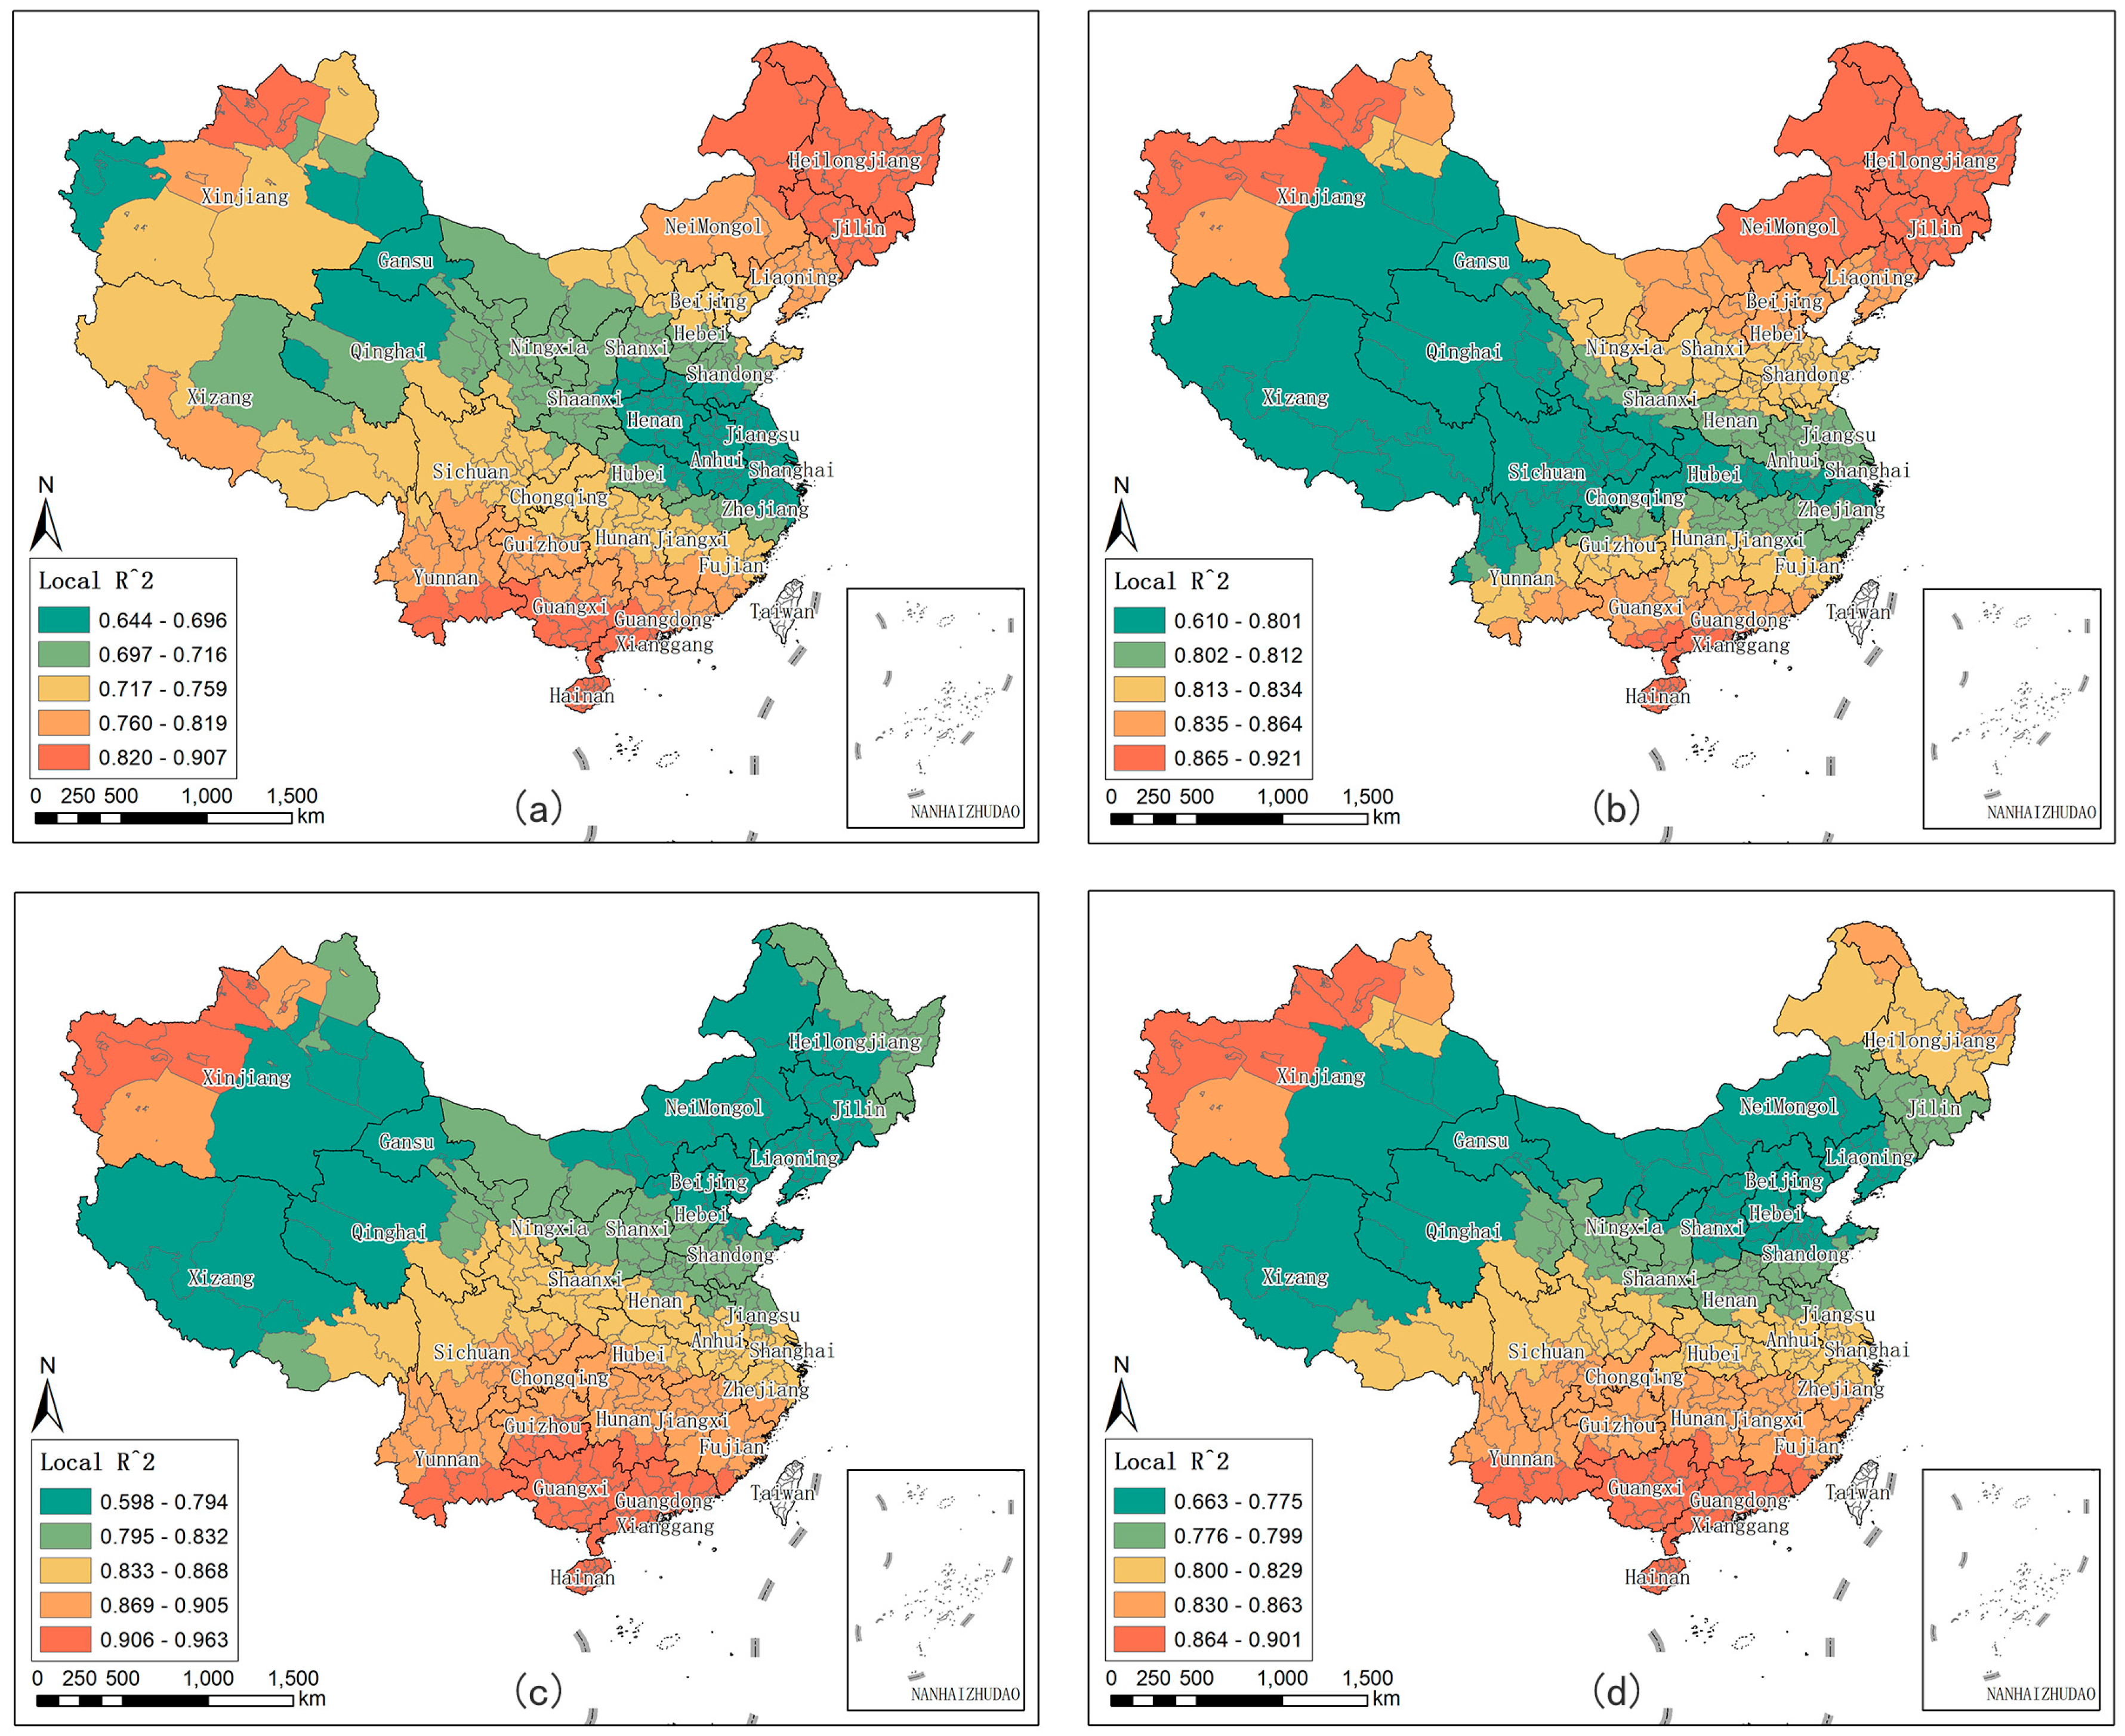
The Local R2 values of the four geographically weighted models show that the R2 values for all prefecture-level cities are relatively high, indicating a strong correlation between urban expansion and transportation development within the study area. When the proportion of construction land area is used as the dependent variable, the R2 values range from 0.610 to 0.921, with average values of 0.755 in 2010 and 0.830 in 2020. The average and maximum values for 2020 are higher than those for 2010, suggesting that the correlation between PCLA and transportation development is stronger in 2020 than in 2010. When nighttime lighting is used as the dependent variable, the R2 values range from 0.598 to 0.963, with the average and maximum values for 2010 being higher than those for 2020, indicating that the correlation between NTL and transportation development is stronger in 2010 than in 2020. From 2010 to 2020, the range of R2 values for PCLA expanded, with the difference between the maximum and minimum values increasing, while the range of R2 values for NTL narrowed, indicating that the spatial heterogeneity of the relationship between transportation development and PCLA increased, while the spatial heterogeneity of the relationship with NTL decreased (Table 4).
From a spatial distribution perspective, when PCLA is used as the dependent variable, high Local R2 values are located in the Northeast, North China, and Southern regions. By 2020, the range of Local R2 values has increased, and the spatial distribution has become more uneven, indicating an increase in the spatial heterogeneity of the correlation. When nighttime lighting is used as the dependent variable, Local R2 values generally exhibit a distribution trend of being lower in the north and higher in the south. By 2020, the spatial distribution characteristics of Local R2 values have remained largely unchanged, with high-value areas primarily located in the southern provinces of Guangdong, Guangxi, and Hainan (Figure 6).

3.3.1. With the Percentage of Construction Land Area as the Dependent Variable

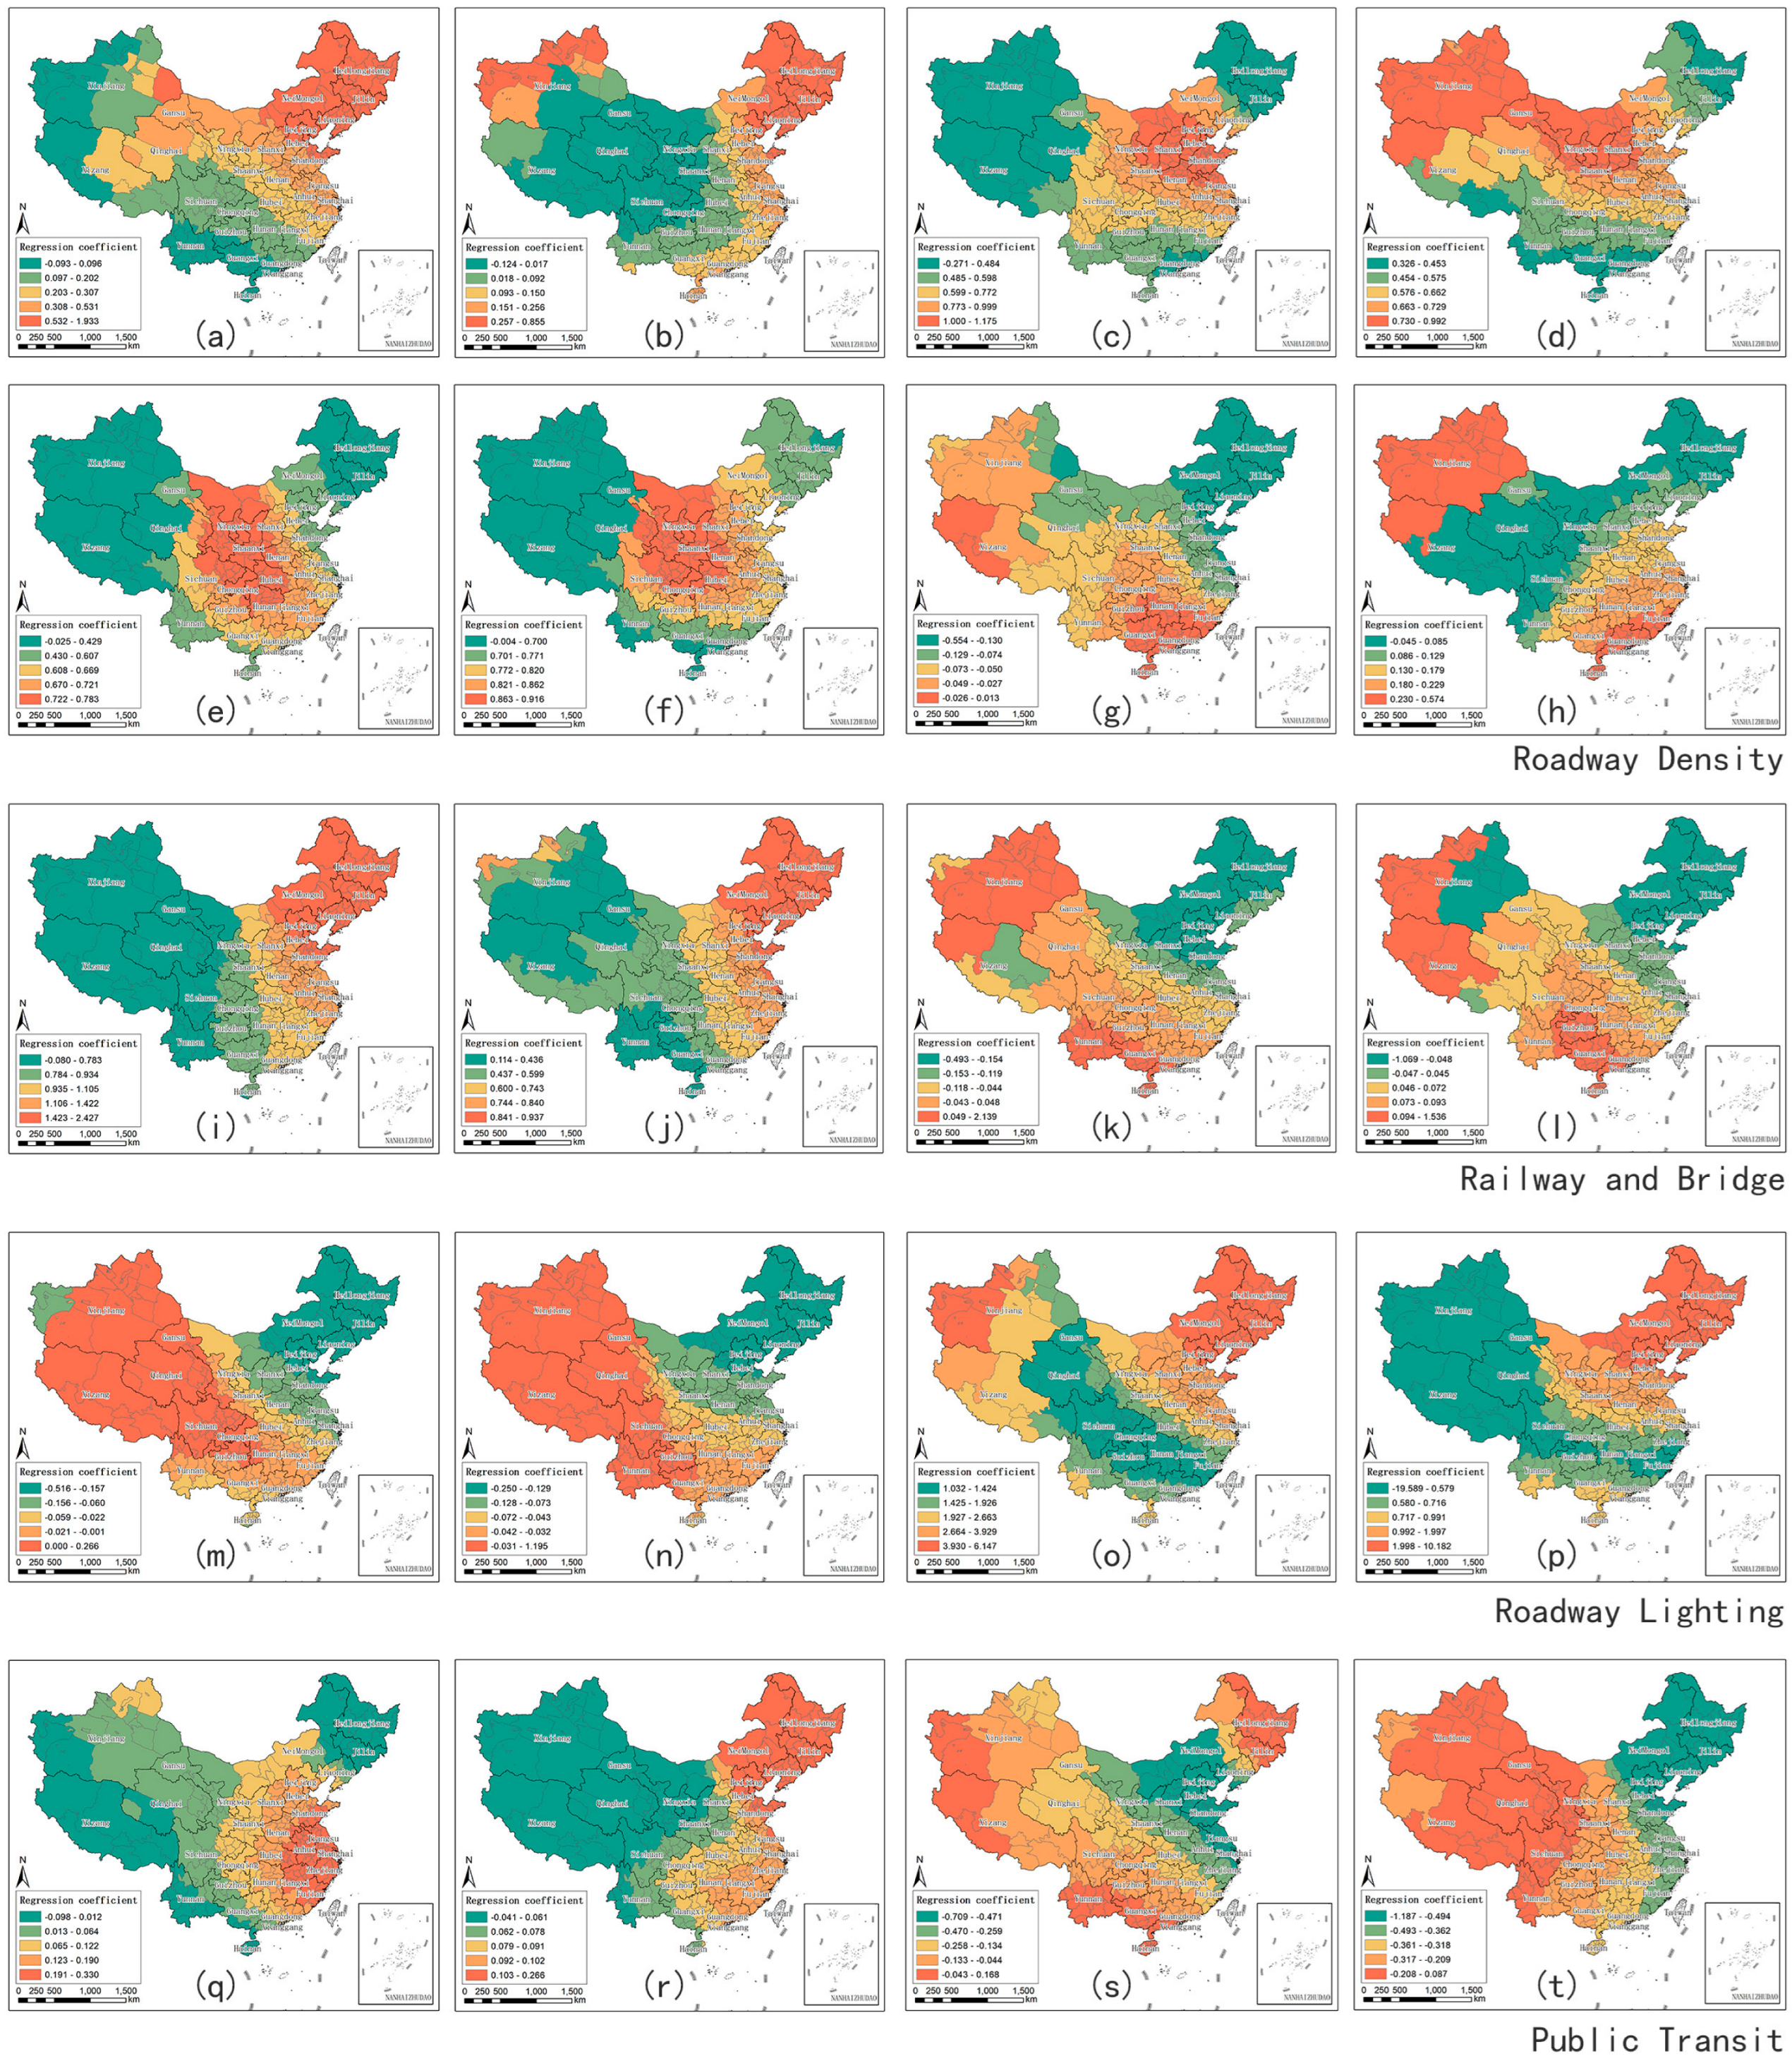
Overall, when the proportion of PCLA was used as the dependent variable, the regression coefficients of most indicators were positive. Among these indicators, the regression coefficients of NRD, PRD, and RD are relatively large, suggesting a stronger correlation between these indicators and PCLA. These are the most influential indicators that drive the expansion of physical urban space. This finding is in close agreement with theoretical expectations: as the backbone of regional transportation networks, high-grade roads and high-capacity railways significantly improve regional accessibility, directly guiding and determining the spatial direction of newly added construction land. They are key factors shaping the macro-level urban form.
The average regression coefficients for CRD, DRL, and NBPC in 2010, as well as for DRL and NBPC in 2020, are negative, indicating a negative correlation with the dependent variable. This negative correlation can be explained by the mismatch in the spatial distribution of these transportation development indicators and construction space, meaning that in some areas, the proportion of construction land is high, but the development of transportation facilities is poor. In such cases, transportation development might not be able to meet the city’s needs (Table 5).
Based on regional distribution, most transportation development indicators are positively correlated with the proportion of construction land. Indicators such as HD, NRD, and PRD have positive regression coefficients in most areas, indicating that these transportation facilities are generally positively correlated with the spatial distribution of construction land.
Some transportation development indicators show that a significant number of regions have negative regression coefficients, indicating an inverse correlation between transportation development and urban expansion in these areas. For instance, in Northeast China, the negative regression coefficient of CRD reflects a long-term mismatch between high construction density and low rural road density. This is not merely a problem of insufficient transportation infrastructure but is more likely to increase the internal connectivity costs of existing built-up areas, constraining the revival of economic vitality and industrial restructuring in the region. In contrast, Southwest China also shows a negative correlation with CRD, but the underlying reason is the opposite: a combination of low construction density and high rural road density. This reflects the socio-economic structure of the region, which is predominantly rural and has a lower level of urbanization. In this context, a well-developed rural road network mainly serves agricultural production and rural life rather than promoting large-scale urban land development. This finding serves as a reminder that the role and implications of the same transportation indicator can vary significantly across regions with different socio-economic backgrounds.
In terms of changes in regression coefficients, many transportation indicators showed a general increase in regression coefficients and a reduction in negative-value areas by 2020. For example, the CRD and BD regression coefficients were negative in most areas nationwide in 2010, but by 2020, the negative-value areas had significantly decreased. This indicates that the level of rural road and bridge construction has become more spatially coupled with the distribution of construction land (Figure 7).

3.3.2. With the Nighttime Lights as the Dependent Variable

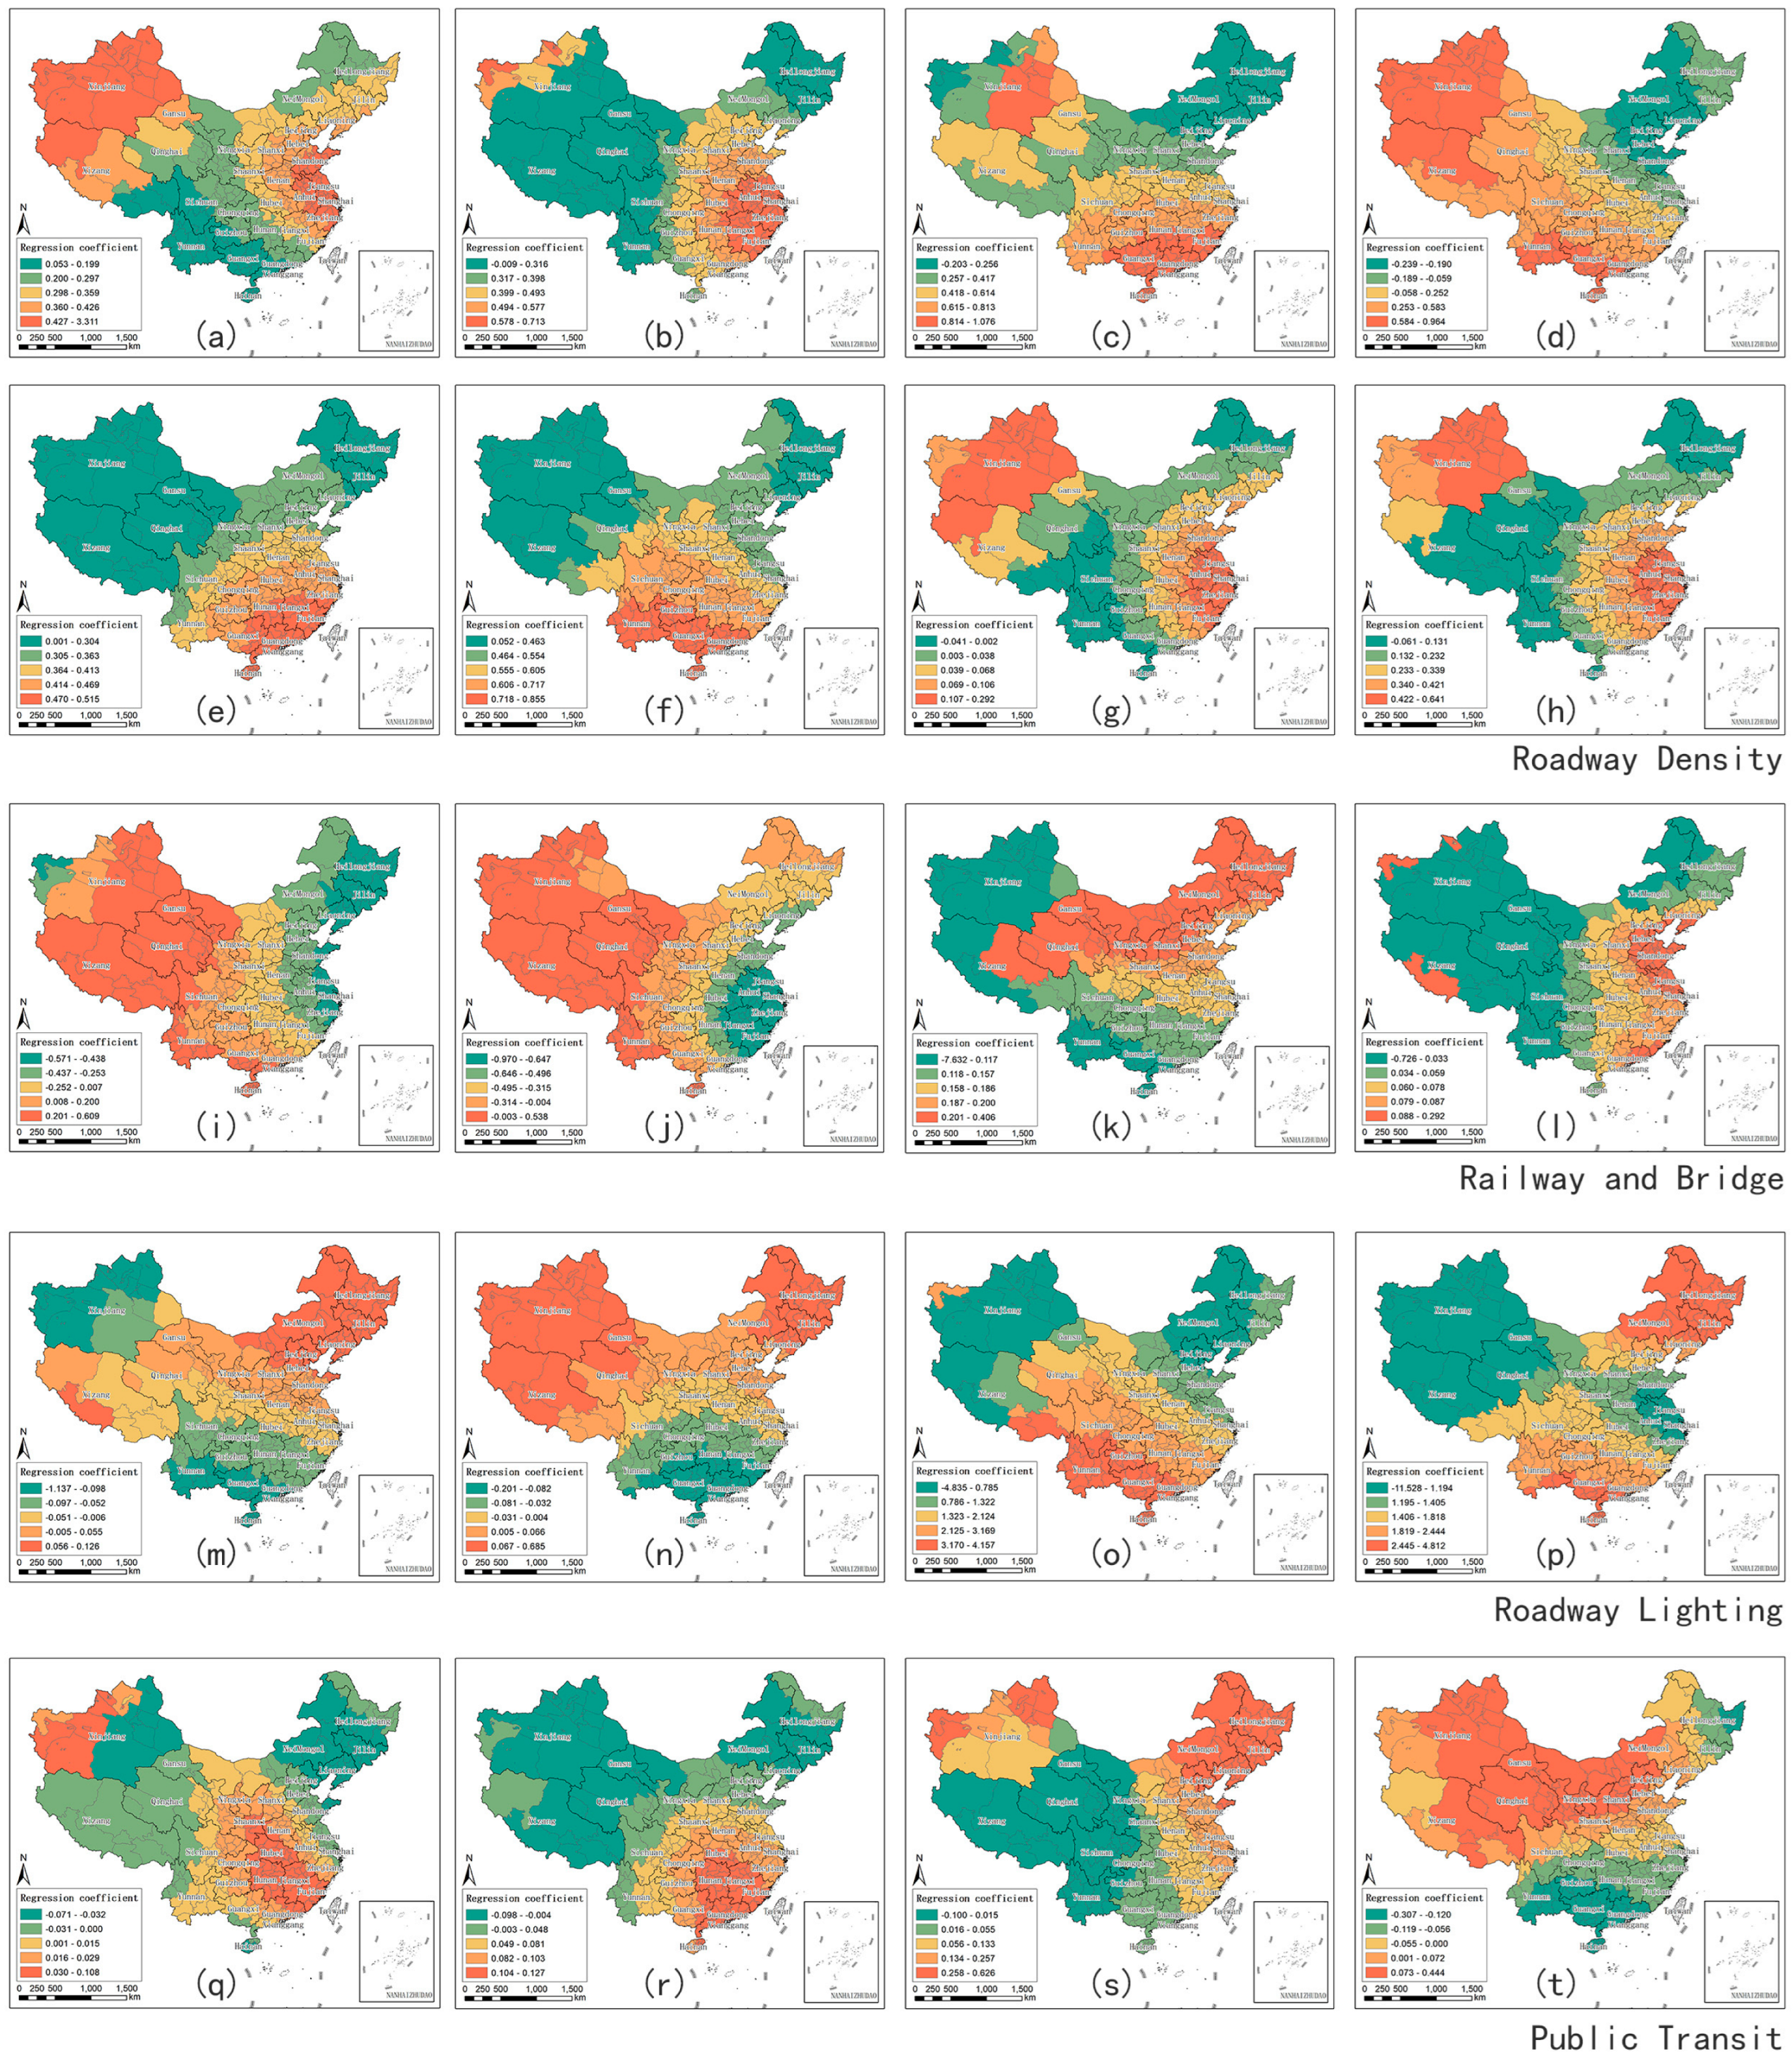
Overall, when NTL is employed as the dependent variable, most indicators, such as HD, NRD, and PRD, demonstrate a positive correlation with NTL. Among these, HD, NRD, and DSL display relatively larger regression coefficients, suggesting stronger correlations. The high coefficients of HD and NRD corroborate the core role of high-grade roads in the agglomeration of economic factors, while the significant influence of DSL reconfirms the contribution of qualitative improvements within the built environment to economic density. The average regression coefficients of PRD and CRD presented a significant increase in 2020, indicating their strengthened role in promoting regional economic development. This trend might stem from the deepening implementation of the Rural Revitalization and Regional Coordinated Development strategies: the improvement of provincial road networks has facilitated economic integration within provinces, while the enhancement of rural road infrastructure has effectively stimulated the economic potential of county and rural areas, bringing economic vitality to regions that were previously under-developed. RD and DRL showed varying degrees of negative correlation with NTL in both 2010 and 2020. This does not deny their value as infrastructure but rather reveals a spatial mismatch with economic development (Table 6).
The notable spatial heterogeneity in transportation indicator coefficients accurately reflects the diverse models of regional development in China. The high values of HD and CRD in the southeastern coastal regions and northwestern regions, respectively, signify two distinct development dynamics: the export-oriented maritime economy and rural development along with frontier construction propelled by internal policy support. Meanwhile, the clustering of high-value areas for indicators such as NRD and DSL in the northern regions probably reflects the intensified infrastructure investments by the state in these areas during specific periods, as well as the higher dependence of their economic development on trunk networks.
In terms of changes in regression coefficients, many transportation development indicators showed a general upward trend in regression coefficients by 2020, but negative-value areas remain prevalent. For example, RD, NRD, and NBPC exhibited an expanding trend of negative-value areas from 2010 to 2020. This indicates that the coupling degree between the allocation of railways, provincial roads, and buses with nighttime lighting has not improved (Figure 8).

3.4. Spatial Spillover Effects Analysis

3.4.1. Test of the Choice of Spatial Econometric Models

Urban expansion and transportation development exhibit spatial correlation and heterogeneity. Furthermore, their spatial spillover effects should also be verified, which is why a spatial econometric model is used for estimation. The results show that under both the LM test and the Robust-LM test, the p-values passed the 1% significance level, indicating the presence of spatial error effects and spatial lag effects. This leads to the rejection of using mixed panel regression and the preliminary selection of the spatial Durbin model (Table 7).
The Hausman Test was used to determine whether to adopt a fixed effects model or a random effects model. The results showed that when PCLA is used as the dependent variable, the statistic is positive and the p-value is less than 0.001, leading to the rejection of the null hypothesis and the adoption of the fixed effects model. When The Nighttime Lights is the dependent variable, statistic is negative. Referring to Qiang, C.’s perspective [91], it can be considered that a fixed effects model should be used when the Hausman Test statistic is negative. Further Wald and LR tests were conducted to determine whether the initially selected SDM could degrade into SAR or SEM, i.e., further verifying the applicability of the SDM under the premise of spatial correlation among variables. If degradation is not possible, the SDM with spatial lag and spatial error terms is used; otherwise, the degraded model is chosen. The results showed that both the LR test and Wald test supported the selection of the SDM; thus, the SDM was chosen for subsequent empirical analysis (Table 8).

3.4.2. Analysis of the SDM

Using StataMP 17 software, Spatial Durbin Models were constructed with PCLA and NTL as the dependent variables and transportation development indicators as the independent variables. The total effects were decomposed into direct effects (the net impact of the independent variables on the local dependent variable) and indirect effects (the impact of the independent variables on the dependent variable of neighboring areas, i.e., spatial spillover effects) via the partial differential method for result interpretation.
From the aspect of direct effects, NRD, CRD, and DSL demonstrate significant positive impacts on both PCLA and NTL, whereas PRD shows a significant negative direct effect on PCLA. As a vital transportation artery connecting different tiers, NRD directly steers development activities along its linear path through the corridor effect, representing the lowest-cost spatial expansion route. In contrast, DSL, as an indicator of built environment quality, stimulates land development intensity and commercial vitality through the value-enhancement effect. The significant negative direct effect of PRD on PCLA implies that, in specific regions, it may serve to divert resources to higher-grade channels (such as NRD), thus locally inhibiting development.
In terms of indirect effects, BD and NTPC generate significant positive spatial spillovers on PCLA, while HD, BD, and DRL yield significant positive spillovers on NTL. This reflects the synergistic regional economic development benefits brought about by efficient transportation networks through reducing the cost of factor mobility. More importantly from a policy perspective, widespread negative spillover effects are observed. PRD, CRD, and RD generate negative spatial spillovers on PCLA, while PRD, CRD, DSL, and NTPC result in negative spillovers on NTL. These collectively point to the core mechanism of the siphon effect—where improvements in transportation conditions in core cities ultimately draw development factors (such as population and capital) from surrounding areas, leading to depleted growth momentum in the latter. This precisely explains why regional development disparities remain severe despite the continuous improvements in high-speed rail and trunk road networks (Table 9).

4. Discussion

4.1. Spatiotemporal Differentiation of the Correlation

Urban expansion is influenced by a diverse array of natural and anthropogenic factors [92,93,94]. Through a national-scale analysis, this study confirms that transportation development is a crucial driver of urban expansion in China. However, its impact demonstrates significant heterogeneity in both temporal and spatial dimensions. In comparison with previous studies concentrating on single cities or urban agglomerations [95,96], our findings indicate that different types of transportation infrastructure play distinct roles over extended time series and wider geographical ranges. This poses complex challenges and opportunities for attaining the United Nations Sustainable Development Goal (SDG11)—to render cities and human settlements inclusive, safe, resilient, and sustainable [97].
The results of the GWR in this study disclose significant spatiotemporal heterogeneity in the influence of transportation on urban expansion. In the model with the PCLA as the dependent variable, Northeast China and North China demonstrated higher model goodness-of-fit, with the NRD, PRD, RD, and the DSL showing relatively strong positive correlations. In the model with the NTL as the dependent variable, Southern China exhibited higher model goodness-of-fit, with the HD, NRD, and the DSL presenting stronger positive correlations.
The driving mechanism of the NRD is rooted in its “connecting” function within the transportation hierarchy. Unlike the HD and RD, which predominantly serve long-distance, inter-regional traffic [98], the NRD, while also acting as an arterial road, is designed according to standards that enable better integration with local road networks. This allows it to guide development activities linearly along its corridor. This “corridor effect” renders the NRD a crucial instrument for low-cost, high-efficiency urban spatial expansion in regions such as North China, Central China, and Northwest China [99]. Simultaneously, this form of land development can further draw transportation investment [71,100,101,102,103,104,105].
The driving mechanism of the Density of Street Lights (DSL) reflects the “stock optimization” and “land premium” effects. The Density of Street Lights (DSL) is a direct indicator of the quality of the built-up environment and the level of municipal services. It not only improves the safety and convenience of nocturnal driving but also indicates mature development conditions and comprehensive infrastructure support. In relatively developed regions, under population pressure and economic incentives, continuous transportation development propels further urban expansion [106,107].

4.2. Spatial Spillover Effect of the Correlation

A significant positive correlation exists between transportation development and urban expansion. However, urban expansion is influenced not only by the transportation conditions within its own administrative unit but also by the transportation development in adjacent or more distant administrative units [8,108]. The research results indicate that BD, NTPC, HD, and DRL generate significant positive spillover effects on the urban expansion of surrounding areas, whereas PRD, CRD, RD, DSL, and NTPC produce negative spatial spillovers. As urbanization advances, urban expansion is frequently influenced by the complex interaction of multiple transportation-development factors [32].
As the backbone of regional transportation networks, HD and BD enhance the completeness of the network and cross-regional connectivity, breaking down geographical barriers and facilitating the flow of factors among cities [101]. An increase in DRL improves transportation efficiency by offering safer and more comfortable nighttime travel conditions, thus promoting urban expansion. Although trunk roads such as PRD and CRD enhance local accessibility, they may also accelerate the concentration of high-quality factors, such as talent and capital, in core cities [109]. Although enhancements in RD and DSL improve local transportation efficiency, they may put surrounding areas at a greater disadvantage in regional competition.
Notably, NTPC exhibits both positive and negative spillover effects, suggesting that its impact is highly context-specific. In regions with a high degree of equalization of public services, such as the Yangtze River Delta and Pearl River Delta urban agglomerations, it generates positive spillover effects. Conversely, in regions with generally lower development levels and significant imbalances, it may strengthen the resource monopoly of core cities [110].

4.3. Policy Enlightenment

Within the framework of the United Nations Sustainable Development Goals (SDG 11), the construction of an inclusive, safe, and sustainable urban transportation system stands as one of the core tasks for attaining “sustainable cities and communities” [111,112]. SDG 9.1 is aimed at developing resilient infrastructure with equitable access, and SDG 11.2 promotes safe, affordable, and sustainable transportation systems. Both goals delineate clear visions and requirements [113]. This study reveals that, from the perspectives of spatial distribution and impact mechanisms, there exists a certain degree of mismatch between the distribution of urban construction land and economic activity. Moreover, transportation development demonstrates spatial imbalances in relation to urban expansion, and public transportation shows the highest degree of spatial mismatch. This may compromise the safety and convenience of residents’ travel, thereby impeding the achievement of sustainable urban development goals.
With respect to spillover effects, enhancing the efficiency and network density of key transportation corridors can facilitate regionally coordinated development. Conversely, the negative spillovers act as a cautionary signal that merely augmenting transportation investment without addressing the equalization of public services may exacerbate regional disparities. Future planning ought to endeavor to balance the impacts of transportation development indicators on both local and surrounding areas, nurture positive spatial spillovers, and alleviate siphon effects through the construction of multi-level, integrated regional transportation networks. This will promote balanced and sustainable development within urban agglomerations and between urban and rural areas [114,115,116].
In the process of urban development, special attention needs to be devoted to the relationship between transportation development and urban expansion. While utilizing transportation infrastructure to promote urban construction, regional factor mobility, and demographic and economic prosperity, it is equally crucial to tackle the negative effects of transportation development. This includes preventing excessive resource concentration from disrupting the balanced distribution of urban land and facilities, and avoiding adverse impacts on regional coordinated development [117].
Specifically, the following measures are essential:
Optimize the allocation of transportation resources: Policies need to be more spatially specific. In regions where the density of high-grade roads has already significantly spurred expansion but the provision of public services is inadequate, ‘over-expansion’ needs to be prevented. The transportation structure ought to be optimized by reinforcing Transit-Oriented Development (TOD) models and enhancing quality.
Promote coordinated transportation and land-use planning: Particularly in areas currently exhibiting ‘negative’ correlations or substantial mismatches between transportation and urban expansion (e.g., some central and western cities), priority needs to be assigned to bridging infrastructure gaps and steering intensive, efficient urban development.
Emphasize regional equity and resilience: In response to the ‘higher in the east, lower in the west’ pattern and internal disparities in urban expansion and transportation development, policy design should integrate a spatial justice perspective. For facilities such as RD that are susceptible to siphon effects, regional coordination and compensation mechanisms ought to be established. This could include using fiscal transfer payments to support public services in peripheral areas, thereby alleviating development inequalities.

4.4. Research Limitations

This study is also subject to several limitations. First, since this research focuses on the entirety of China, the extensive geographical expanse renders it challenging to distinguish regression coefficients among urban areas, suburbs, and rural areas. Consequently, the relationships among population, economic development levels, and road-network density within specific regions cannot be precisely analyzed. Second, this study excludes Hong Kong, Macao, and Taiwan, which restricts the generalizability of the findings to only mainland China. Third, the excessive dependence on administrative boundaries may not comprehensively capture the actual distribution of urban functional areas. Fourth, the research indicators were not meticulously categorized to discern which factors influence the regional level and which impact the internal dynamics of cities. Fifth, this study fails to consider the temporal sequence and cyclical characteristics of transportation’s influence on urban spatial expansion.

5. Conclusions

The coupling relationship between transportation development and urban expansion in China, both spatially and temporally, is a prevalent phenomenon. This is due to the interaction between various transportation development indicators and urban expansion indicators. This study conducted a spatiotemporal heterogeneity analysis and spatial spillover effect analysis using GWR and the SDM, respectively. The findings reveal that there exists a certain reciprocal influence between transportation development and urban expansion. Enhancing the level of transportation development can promote the expansion of urban scale, while it necessitates further long-term and in-depth efforts by the government to maximize the value of transportation infrastructure construction. The study results show:
In 2010 and 2020, the proportion of urban construction land, nighttime light data, and various transportation development indicators spatially presented a distribution pattern demarcated by the Heihe-Tengchong line, characterized by more development in the southeast and less in the northwest. The ten transportation development indicators can account for over 85% of the factors contributing to urban expansion, and their correlations display significant spatiotemporal heterogeneity. As indicators of fundamental connectivity infrastructure and built-environment quality, NRD and DSL exert strong driving forces on both local land expansion and economic agglomeration. HD and DRL effectively facilitate regional urban development and synergistic economic growth via positive spatial spillover effects. In contrast, PRD and RD display negative spatial spillovers, resulting in siphon effects.
The Chinese case not only validates the universal role of transportation as a growth engine but also uncovers its unique complexities. In comparison with other developing countries like India and Brazil, China’s top-down, high-intensity investments have rapidly enhanced transportation network density and, at the same time, intensified the dynamic interaction of “polarization-trickle-down” effects among regions [118,119]. This finding enriches our understanding of how state power influences the interaction between transportation and urban development, providing valuable insights for countries with similar development contexts. When pursuing efficiency, it is crucial to manage the spatial externalities of growth through refined institutional design to attain a genuinely sustainable and inclusive urban future.
Author Contributions

Conceptualization, J.L. and Y.M.; methodology, J.L. and Y.M.; software, J.L.; validation, L.L. and Y.H.; formal analysis, J.L. and L.L.; investigation, J.L. and Y.H.; data curation, Y.H.; writing—original draft preparation, J.L.; writing—review and editing, J.L. and Y.M.; visualization, J.L.; supervision, Y.M. and L.L. All authors have read and agreed to the published version of the manuscript.

Funding

This research received no external funding.

Data Availability Statement

The original contributions presented in the study are included in the article, further inquiries can be directed to the corresponding author.

Conflicts of Interest

The authors declare no conflict of interest.

References

  1. Murayama, Y.; Estoque, R.C. Urbanization: Concept, Mechanism, and Global Implications. In Human Geoscience; Himiyama, Y., Satake, K., Oki, T., Eds.; Springer: Singapore, 2020; pp. 261–282. [Google Scholar]
  2. Vohra, K.; Marais, E.A.; Bloss, W.J.; Schwartz, J.; Mickley, L.J.; Van Damme, M.; Clarisse, L.; Coheur, P.-F. Rapid rise in premature mortality due to anthropogenic air pollution in fast-growing tropical cities from 2005 to 2018. Sci. Adv. 2022, 8, eabm4435. [Google Scholar] [CrossRef]
  3. Dodman, D.J.E. Urbanization, Blaming cities for climate change? An analysis of urban greenhouse gas emissions inventories. Environ. Urban. 2009, 21, 185–201. [Google Scholar] [CrossRef]
  4. Dupras, J.; Alam, M. Urban Sprawl and Ecosystem Services: A Half Century Perspective in the Montreal Area (Quebec, Canada). J. Environ. Policy Plan. 2015, 17, 180–200. [Google Scholar] [CrossRef]
  5. Mahtta, R.; Fragkias, M.; Güneralp, B.; Mahendra, A.; Reba, M.; Wentz, E.A.; Seto, K.C. Urban land expansion: The role of population and economic growth for 300+ cities. Npj Urban Sustain. 2022, 2, 5. [Google Scholar] [CrossRef]
  6. Li, Q. The Urban Expansion Model. In China’s Development Under a Differential Urbanization Model; Li, Q., Ed.; Springer: Singapore, 2020; pp. 219–241. [Google Scholar]
  7. Li, X.; Song, W.; Cao, S.; Mo, Y.; Du, M.; He, Z. The impact of multidimensional urbanization on sustainable development goals (SDGs): A long-term analysis of the 31 provinces in China. Ecol. Indic. 2024, 169, 112822. [Google Scholar] [CrossRef]
  8. Ge, F.J.; Chen, W.X.; Zeng, Y.Y.; Li, J.F. The Nexus between Urbanization and Traffic Accessibility in the Middle Reaches of the Yangtze River Urban Agglomerations, China. Int. J. Environ. Res. Public Health 2021, 18, 3828. [Google Scholar] [CrossRef]
  9. Aljoufie, M.; Brussel, M.; Zuidgeest, M.; van Maarseveen, M. Urban growth and transport infrastructure interaction in Jeddah between 1980 and 2007. Int. J. Appl. Earth Obs. Geoinf. 2013, 21, 493–505. [Google Scholar] [CrossRef]
  10. Behnisch, M.; Jehling, M.; Krüger, T. Editorial to the Special Issue “Limiting urban sprawl: Relations between spatial trends, drivers, and planning policies”. Land Use Policy 2024, 143, 107168. [Google Scholar] [CrossRef]
  11. Ewing, R. Is Los Angeles-Style Sprawl Desirable? J. Am. Plan. Assoc. 1997, 63, 107–126. [Google Scholar] [CrossRef]
  12. Imbrenda, V.; Coluzzi, R.; Bianchini, L.; Di Stefano, V.; Salvati, L. Chapter Two—Urban sprawl: Theory and practice. In Advances in Chemical Pollution, Environmental Management and Protection; Pereira, P., Ferreira, C.S.S., Eds.; Elsevier: Amsterdam, The Netherlands, 2022; Volume 8, pp. 23–46. [Google Scholar]
  13. Ismael, H.M. Urban form study: The sprawling city—Review of methods of studying urban sprawl. GeoJournal 2021, 86, 1785–1796. [Google Scholar] [CrossRef]
  14. Long, Y.; Zhai, W.; Shen, Y.; Ye, X. Understanding uneven urban expansion with natural cities using open data. Landsc. Urban Plan. 2018, 177, 281–293. [Google Scholar] [CrossRef]
  15. Hu, Y.; Connor, D.S.; Stuhlmacher, M.; Peng, J.; Li, B.L.T. More urbanization, more polarization: Evidence from two decades of urban expansion in China. npj Urban Sustain. 2024, 4, 33. [Google Scholar] [CrossRef]
  16. Zhong, S.; Wang, M.; Zhu, Y.; Chen, Z.; Huang, X. Urban expansion and the urban–rural income gap: Empirical evidence from China. Cities 2022, 129, 103831. [Google Scholar] [CrossRef]
  17. Imai, K.; Malaeb, B. Asia’s Rural-Urban Disparity in the Context of Growing Inequality; Research Institute for Economics & Business Administration, Kobe University: Kobe, Japan, 2016. [Google Scholar]
  18. Ewing, R.; Hamidi, S.; Grace, J.B.; Wei, Y.D. Does urban sprawl hold down upward mobility? Landsc. Urban Plan. 2016, 148, 80–88. [Google Scholar] [CrossRef]
  19. Liu, L.; Meng, L.N. Patterns of Urban Sprawl from a Global Perspective. J. Urban Plan. Dev. 2020, 146, 9. [Google Scholar] [CrossRef]
  20. Restivo, V.; Cernigliaro, A.; Casuccio, A. Urban Sprawl and Health Outcome Associations in Sicily. Int. J. Environ. Res. Public Health 2019, 16, 1350. [Google Scholar] [CrossRef]
  21. Triantakonstantis, D.; Stathakis, D. Examining urban sprawl in Europe using spatial metrics. Geocarto Int. 2015, 30, 1092–1112. [Google Scholar] [CrossRef]
  22. Pourahmad, A.; Baghvand, A.; Zangenehe Shahraki, S.; Givehchi, S. The impact of urban sprawl up on air pollution. Int. J. Environ. Res. 2007, 1, 252–257. [Google Scholar]
  23. Genovese, D.; Candiloro, S.; D’Anna, A.; Dettori, M.; Restivo, V.; Amodio, E.; Casuccio, A. Urban sprawl and health: A review of the scientific literature. Environ. Res. Lett. 2023, 18, 20. [Google Scholar] [CrossRef]
  24. Rosati, R.M. Urban Sprawl and Routing: A Comparative Study on 156 European Cities. Landsc. Urban Plan. 2025, 253, 23. [Google Scholar] [CrossRef]
  25. Litynski, P.; Holuj, A. Urban Sprawl Risk Delimitation: The Concept for Spatial Planning Policy in Poland. Sustainability 2020, 12, 2637. [Google Scholar] [CrossRef]
  26. Smith, R.M.; Blizard, Z.D. A census tract level analysis of urban sprawl’s effects on economic mobility in the United States. Cities 2021, 115, 103232. [Google Scholar] [CrossRef]
  27. Pratama, A.P.; Yudhistira, M.H.; Koomen, E. Highway expansion and urban sprawl in the Jakarta Metropolitan Area. Land Use Policy 2022, 112, 105856. [Google Scholar] [CrossRef]
  28. Li, X.; Ji, H.; Chen, X.; Liu, X.; Geng, Y.; Deng, B.; Li, F. A mechanics-based theoretical framework of urban sprawl force: A case study in Nanjing, Wuxi, and Yangzhou, China. Land Use Policy 2025, 150, 107450. [Google Scholar] [CrossRef]
  29. Pijanowski, B.C.; Tayyebi, A.; Delavar, M.R.; Yazdanpanah, M.J. Urban Expansion Simulation Using Geospatial Information System and Artificial Neural Networks. Int. J. Environ. Res. 2009, 3, 493–502. [Google Scholar]
  30. Altieri, L.; Cocchi, D.; Roli, G. Measuring heterogeneity in urban expansion via spatial entropy. Environmetrics 2019, 30, 16. [Google Scholar] [CrossRef]
  31. Liu, F.; Zhang, Z.X.; Zhao, X.L.; Liu, B.; Wang, X.; Yi, L.; Zuo, L.J.; Xu, J.Y.; Hu, S.G.; Sun, F.F.; et al. Urban Expansion of China from the 1970s to 2020 Based on Remote Sensing Technology. Chin. Geogr. Sci. 2021, 31, 765–781. [Google Scholar] [CrossRef]
  32. Wu, W.J.; Zhao, S.Q.; Henebry, G.M. Drivers of urban expansion over the past three decades: A comparative study of Beijing, Tianjin, and Shijiazhuang. Environ. Monit. Assess. 2019, 191, 15. [Google Scholar] [CrossRef] [PubMed]
  33. Wang, S.G.; Shen, J. Environmental Inequality in China’s Urban Expansion: A Case Study of Guangzhou. Chin. Geogr. Sci. 2024, 35, 187–202. [Google Scholar] [CrossRef]
  34. Al Rifat, S.A.; Liu, W.B. Quantifying Spatiotemporal Patterns and Major Explanatory Factors of Urban Expansion in Miami Metropolitan Area During 1992–2016. Remote Sens. 2019, 11, 2493. [Google Scholar] [CrossRef]
  35. Sun, Y.; Cui, Y. Evaluating the coordinated development of economic, social and environmental benefits of urban public transportation infrastructure: Case study of four Chinese autonomous municipalities. Transp. Policy 2018, 66, 116–126. [Google Scholar] [CrossRef]
  36. Yang, L.; Wu, D.; Cao, S.H.; Zhang, W.N.; Zheng, Z.B.; Liu, L. Transportation Interrelation Embedded in Regional Development: The Characteristics and Drivers of Road Transportation Interrelation in Guangdong Province, China. Sustainability 2022, 14, 5925. [Google Scholar] [CrossRef]
  37. Ahasan, R.; Hoda, M.N.; Alam, M.S.; Nirzhar, Y.R.; Kabir, A. Changing institutional landscape and transportation development in Dhaka, Bangladesh. Heliyon 2023, 9, 12. [Google Scholar] [CrossRef]
  38. Chen, Y.; Jin, F.J.; Lu, Y.Q.; Chen, Z.; Yang, Y. Development history and accessibility evolution of land transportation network in Beijing-Tianjin-Hebei region over the past century. J. Geogr. Sci. 2018, 28, 1500–1518. [Google Scholar] [CrossRef]
  39. Du, Q.; Wang, X.Q.; Li, Y.; Zou, P.X.W.; Han, X.; Meng, M. An analysis of coupling coordination relationship between regional economy and transportation: Empirical evidence from China. Environ. Sci. Pollut. Res. 2022, 29, 34360–34378. [Google Scholar] [CrossRef]
  40. Hu, Y.Q.; Chen, Y.Z. Coupling of Urban Economic Development and Transportation System: An Urban Agglomeration Case. Sustainability 2022, 14, 3808. [Google Scholar] [CrossRef]
  41. Ma, Y.L.; Zhu, J.Y.; Gu, G.F.; Chen, K. Freight Transportation and Economic Growth for Zones: Sustainability and Development Strategy in China. Sustainability 2020, 12, 10450. [Google Scholar] [CrossRef]
  42. Zhao, L.; Jia, Y.H. Interactive Correlation between Economy and Integrated Transportation Development of Metropolitan Areas in China: Quantitative Study. J. Urban Plan. Dev. 2021, 147, 10. [Google Scholar] [CrossRef]
  43. Li, Z.Y.; Hao, T.X.; Zheng, R. The Relationship between Transportation Industry Efficiency, Transportation Structure, and Regional Sustainability Development in China: Based on DEA and PVAR Models. Sustainability 2022, 14, 10267. [Google Scholar] [CrossRef]
  44. Lu, S.R.; Liu, Y. Evaluation system for the sustainable development of urban transportation and ecological environment based on SVM. J. Intell. Fuzzy Syst. 2018, 34, 831–838. [Google Scholar] [CrossRef]
  45. Wang, L.Q.; Xue, X.L.; Zhao, Z.B.; Wang, Z.Y. The Impacts of Transportation Infrastructure on Sustainable Development: Emerging Trends and Challenges. Int. J. Environ. Res. Public Health 2018, 15, 1172. [Google Scholar] [CrossRef]
  46. Wang, Y.Q.; Li, S.S.; Jiang, Y. Can Transportation Infrastructure Construction Improve the Urban Green Development Efficiency? Evidence from China. Sustainability 2022, 14, 14231. [Google Scholar] [CrossRef]
  47. Garcia-López, M.-À. Urban spatial structure, suburbanization and transportation in Barcelona. J. Urban Econ. 2012, 72, 176–190. [Google Scholar] [CrossRef]
  48. Aljoufie, M.; Zuidgeest, M.; Brussel, M.; van Maarseveen, M. Spatial–temporal analysis of urban growth and transportation in Jeddah City, Saudi Arabia. Cities 2013, 31, 57–68. [Google Scholar] [CrossRef]
  49. Liu, T.Y.; Su, C.W. Is transportation improving urbanization in China? Socio-Econ. Plan. Sci. 2021, 77, 7. [Google Scholar] [CrossRef]
  50. Zhang, M.; Meng, X.; Wang, L.; Xu, T. Transit development shaping urbanization: Evidence from the housing market in Beijing. Habitat Int. 2014, 44, 545–554. [Google Scholar] [CrossRef]
  51. Xia, X.X.; Li, H.C.; Kuang, X.J.; Strauss, J. Spatial-Temporal Features of Coordination Relationship between Regional Urbanization and Rail Transit-A Case Study of Beijing. Int. J. Environ. Res. Public Health 2022, 19, 212. [Google Scholar] [CrossRef]
  52. Long, F.J.; Zheng, L.F.; Song, Z.D. High-speed rail and urban expansion: An empirical study using a time series of nighttime light satellite data in China. J. Transp. Geogr. 2018, 72, 106–118. [Google Scholar] [CrossRef]
  53. Al-Shaar, W.; Nehme, N.; Bonin, O.; Gerard, J.A. Impacts of a New Highway on Urban Development and Land Accessibility in Developing Countries: Case of Beirut Southern Entrance in Lebanon. Arab. J. Sci. Eng. 2021, 46, 5783–5800. [Google Scholar] [CrossRef]
  54. Chu, L.X.; Zou, Y.T.; Masiliunas, D.; Blaschke, T.; Verbesselt, J. Assessing the impact of bridge construction on the land use/cover and socio-economic indicator time series: A case study of Hangzhou Bay Bridge. GISci. Remote Sens. 2021, 58, 199–216. [Google Scholar] [CrossRef]
  55. Li, M.; Zhang, G.J.; Liu, Y.; Cao, Y.W.; Zhou, C.S. Determinants of Urban Expansion and Spatial Heterogeneity in China. Int. J. Environ. Res. Public Health 2019, 16, 3706. [Google Scholar] [CrossRef]
  56. Yussif, K.; Dompreh, E.B.; Gasparatos, A. Sustainability of urban expansion in Africa: A systematic literature review using the Drivers-Pressures-State-Impact-Responses (DPSIR) framework. Sustain. Sci. 2023, 18, 1459–1479. [Google Scholar] [CrossRef]
  57. Alajizah, S.M.; Altuwaijri, H.A. Assessing the Impact of Urban Expansion on the Urban Environment in Riyadh City (2000–2022) Using Geospatial Techniques. Sustainability 2024, 16, 4799. [Google Scholar] [CrossRef]
  58. He, C.Y.; Okada, N.; Zhang, Q.F.; Shi, P.J.; Li, J.G. Modelling dynamic urban expansion processes incorporating a potential model with cellular automata. Landsc. Urban Plan. 2008, 86, 79–91. [Google Scholar] [CrossRef]
  59. Li, C.; Zhao, J.; Xu, Y. Examining spatiotemporally varying effects of urban expansion and the underlying driving factors. Sustain. Cities Soc. 2017, 28, 307–320. [Google Scholar] [CrossRef]
  60. Lei, Z.K.; Feng, Y.J.; Tong, X.H.; Liu, S.; Gao, C.; Chen, S.R. A spatial error-based cellular automata approach to reproducing and projecting dynamic urban expansion. Geocarto Int. 2022, 37, 560–580. [Google Scholar] [CrossRef]
  61. Poelmans, L.; Van Rompaey, A. Complexity and performance of urban expansion models. Comput. Environ. Urban Syst. 2010, 34, 17–27. [Google Scholar] [CrossRef]
  62. Wu, J.Q.; Li, C.S. Illustrating the nonlinear effects of urban form factors on transportation carbon emissions based on gradient boosting decision trees. Sci. Total Environ. 2024, 929, 10. [Google Scholar] [CrossRef]
  63. Gantumur, B.; Wu, F.L.; Vandansambuu, B.; Tsegmid, B.; Dalaibaatar, E.; Zhao, Y. Spatiotemporal dynamics of urban expansion and its simulation using CA-ANN model in Ulaanbaatar, Mongolia. Geocarto Int. 2022, 37, 494–509. [Google Scholar] [CrossRef]
  64. Kim, M.; Kim, G. Modeling and Predicting Urban Expansion in South Korea Using Explainable Artificial Intelligence (XAI) Model. Appl. Sci. 2022, 12, 9169. [Google Scholar] [CrossRef]
  65. Wang, C.; Liu, S.; Zhou, S.; Zhou, J.; Jiang, S.; Zhang, Y.; Feng, T.; Zhang, H.; Zhao, Y.; Lai, Z.; et al. Spatial-temporal patterns of urban expansion by land use/ land cover transfer in China. Ecol. Indic. 2023, 155, 111009. [Google Scholar] [CrossRef]
  66. Awawdeh, M.M.; Abuhadba, R.R.; Jamhawi, M.M.; Rawashdeh, A.I.; Jawarneh, R.N.; Awawdeh, M.M. Urban expansion in Greater Irbid Municipality, Jordan: The spatial patterns and the driving factors. GeoJournal 2024, 89, 43. [Google Scholar] [CrossRef]
  67. Wu, C.; Huang, X.; Chen, B. Telecoupling mechanism of urban land expansion based on transportation accessibility: A case study of transitional Yangtze River economic Belt, China. Land Use Policy 2020, 96, 104687. [Google Scholar] [CrossRef]
  68. Zhao, P. Sustainable urban expansion and transportation in a growing megacity: Consequences of urban sprawl for mobility on the urban fringe of Beijing. Habitat Int. 2010, 34, 236–243. [Google Scholar] [CrossRef]
  69. Xiao, R.; Murayama, Y.; Qin, K.; Su, J.; Gao, Z.; Liu, L.; Xu, G.; Jiao, L. Urban expansion in highly populous East Asian megacities during 1990–2020: Tokyo, Seoul, Beijing, and Shanghai. Ecol. Inform. 2024, 83, 102843. [Google Scholar] [CrossRef]
  70. Sun, X.; Xiang, P.; Ngoduy, D.; Sui, H.; Zhang, B. Can transportation networks contribute to the sustainable development of urban agglomeration spatial structures? Sustain. Cities Soc. 2024, 117, 105983. [Google Scholar] [CrossRef]
  71. Wang, D.; Wei, Y.D.; Deng, T. Transportation Development, Spatiotemporal Convergence, and Urban Land Use: Study of the Opening of High-Speed Rails in the Yangtze River Delta, China. J. Urban Plan. Dev. 2021, 147, 05021023. [Google Scholar] [CrossRef]
  72. Li, Q.; Li, L.; Zhang, J.; He, X. Spatio-Temporal Characteristics and Driving Mechanisms of Urban Expansion in the Central Yunnan Urban Agglomeration. Land 2024, 13, 1496. [Google Scholar] [CrossRef]
  73. Zeng, L.; Li, H.; Wang, X.; Yu, Z.; Hu, H.; Yuan, X.; Zhao, X.; Li, C.; Yuan, D.; Gao, Y.; et al. China’s Transport Land: Spatiotemporal Expansion Characteristics and Driving Mechanism. Land 2022, 11, 1147. [Google Scholar] [CrossRef]
  74. Chen, Y.; Xie, Q.; Liu, Y. Construction Land Area Changes and Their Influencing Factors of China. Prog. Geogr. 2012, 31, 1050–1054. [Google Scholar]
  75. Zhang, X.D.; Han, H.Y. Characteristics and factors influencing the expansion of urban construction land in China. Sci. Rep. 2024, 14, 15. [Google Scholar] [CrossRef] [PubMed]
  76. Liu, Y.; Zhang, Z.; Zhou, Y. Efficiency of construction land allocation in China: An econometric analysis of panel data. Land Use Policy 2018, 74, 261–272. [Google Scholar] [CrossRef]
  77. Shi, H.; Li, Q.; Zhang, S.; Chen, W.; Wang, Y.; Shen, Y. Does urban construction land in China achieve sustainable allocation and utilization? Land Use Policy 2024, 144, 107223. [Google Scholar] [CrossRef]
  78. Zhou, Y.; Zhong, Z.; Cheng, G. Cultivated land loss and construction land expansion in China: Evidence from national land surveys in 1996, 2009 and 2019. Land Use Policy 2023, 125, 106496. [Google Scholar] [CrossRef]
  79. Chang, Y.; Wang, S.X.; Zhou, Y.; Wang, L.T.; Wang, F.T. A Novel Method of Evaluating Highway Traffic Prosperity Based on Nighttime Light Remote Sensing. Remote Sens. 2020, 12, 102. [Google Scholar] [CrossRef]
  80. Zhao, M.; Zhou, Y.Y.; Li, X.C.; Cao, W.T.; He, C.Y.; Yu, B.L.; Li, X.; Elvidge, C.D.; Cheng, W.M.; Zhou, C.H. Applications of Satellite Remote Sensing of Nighttime Light Observations: Advances, Challenges, and Perspectives. Remote Sens. 2019, 11, 1971. [Google Scholar] [CrossRef]
  81. Zhai, G.; Zhang, M.; Hu, Y.; Chen, Y.; Wu, C.; Lu, Y.; He, T. Nighttime light metrics for analysing urban-rural economic disparities: A case study in 36 Chinese metropolitan areas. Cities 2025, 162, 105930. [Google Scholar] [CrossRef]
  82. Zheng, Q.; Seto, K.C.; Zhou, Y.; You, S.; Weng, Q. Nighttime light remote sensing for urban applications: Progress, challenges, and prospects. ISPRS J. Photogramm. Remote Sens. 2023, 202, 125–141. [Google Scholar] [CrossRef]
  83. Ren, W.; Lu, P.; Wang, Y.; Hong, X.-C. Understanding the association between urban noise and nighttime light in China. Sci. Rep. 2024, 14, 31472. [Google Scholar] [CrossRef]
  84. Wu, Y.Z.; Chen, Z.; Liu, S.; Chang, Z. An Improved Time-Series DMSP-OLS-Like Data (1992–2022) in China by Integrating DMSP-OLS and SNPP-VIIRS, 4th ed. IEEE Trans. Geosci. Remote Sens. 2021, 60, 1–14. [Google Scholar] [CrossRef]
  85. Calvo, F.; de Oña, J.; Arán, F. Impact of the Madrid subway on population settlement and land use. Land Use Policy 2013, 31, 627–639. [Google Scholar] [CrossRef]
  86. Lin, D.; Broere, W.; Cui, J. Metro systems and urban development: Impacts and implications. Tunn. Undergr. Space Technol. 2022, 125, 104509. [Google Scholar] [CrossRef]
  87. Punzo, G.; Castellano, R.; Bruno, E. Using geographically weighted regressions to explore spatial heterogeneity of land use influencing factors in Campania (Southern Italy). Land Use Policy 2022, 112, 105853. [Google Scholar] [CrossRef]
  88. Brunsdon, C.; Fotheringham, A.S.; Charlton, M. Some Notes on Parametric Significance Tests for Geographically Weighted Regression. J. Reg. Sci. 1999, 39, 497–524. [Google Scholar] [CrossRef]
  89. Xu, F.; Chi, G.; Zhang, Z.; Yang, J. How does quality regional growth affect land resources dependence in China? Evidence based on spatial Durbin panel models. Resour. Policy 2023, 81, 103402. [Google Scholar] [CrossRef]
  90. Elhorst, J.P. Spatial Econometrics: From Cross-Sectional Data to Spatial Panels; Springer: Berlin/Heidelberg, Germany, 2014. [Google Scholar]
  91. Qiang, C. Advanced Econometrics and Stata Application; Higher Education Press: Beijing, China, 2010. [Google Scholar]
  92. Kucsicsa, G.; Grigorescu, I. Urban Growth in the Bucharest Metropolitan Area: Spatial and Temporal Assessment Using Logistic Regression. J. Urban Plan. Dev. 2018, 144, 05017013. [Google Scholar] [CrossRef]
  93. Tong, Q.M.; Qiu, F. Population growth and land development: Investigating the bi-directional interactions. Ecol. Econ. 2020, 169, 106505. [Google Scholar] [CrossRef]
  94. Tosa, C.; Mitrea, A.; Sato, H.; Miwa, T.; Morikawa, T. Economic growth and urban metamorphosis: A quarter century of transformations within the metropolitan area of Bucharest. J. Transp. Land Use 2018, 11, 273–295. [Google Scholar] [CrossRef]
  95. Meng, L.; Si, W.T. The Driving Mechanism of Urban Land Expansion from 2005 to 2018: The Case of Yangzhou, China. Int. J. Environ. Res. Public Health 2022, 19, 15821. [Google Scholar] [CrossRef]
  96. Wang, H.J.; Zhang, B.; Liu, Y.L.; Liu, Y.F.; Xu, S.; Zhao, Y.T.; Chen, Y.C.; Hong, S. Urban expansion patterns and their driving forces based on the center of gravity-GTWR model: A case study of the Beijing-Tianjin-Hebei urban agglomeration. J. Geogr. Sci. 2020, 30, 297–318. [Google Scholar] [CrossRef]
  97. Liu, X.; Yuan, M. Assessing progress towards achieving the transport dimension of the SDGs in China. Sci. Total Environ. 2023, 858, 159752. [Google Scholar] [CrossRef]
  98. Cascetta, E.; Cartenì, A.; Henke, I.; Pagliara, F. Economic growth, transport accessibility and regional equity impacts of high-speed railways in Italy: Ten years ex post evaluation and future perspectives. Transp. Res. Part A Policy Pract. 2020, 139, 412–428. [Google Scholar] [CrossRef]
  99. Lu, H.; Zhao, P.; Hu, H.; Zeng, L.; Wu, K.S.; Lv, D. Transport infrastructure and urban-rural income disparity: A municipal-level analysis in China. J. Transp. Geogr. 2022, 99, 103292. [Google Scholar] [CrossRef]
  100. Tennoy, A.; Tonnesen, A.; Gundersen, F. Effects of urban road capacity expansion—Experiences from two Norwegian cases. Transport. Res. Part D-Transport. Environ. 2019, 69, 90–106. [Google Scholar] [CrossRef]
  101. Ahasan, R.; Güneralp, B. Transportation in urban land change models: A systematic review and future directions. J. Land Use Sci. 2022, 17, 351–367. [Google Scholar] [CrossRef]
  102. Zhang, R.S.; Pu, L.J.; Zhu, M. Impacts of transportation arteries on land use patterns in urban-rural fringe: A comparative gradient analysis of Qixia District, Nanjing City, China. Chin. Geogr. Sci. 2013, 23, 378–388. [Google Scholar] [CrossRef]
  103. Su, M.; Zou, W.; Zhao, B.; Fan, W. The impact of high-speed railways on urban spatial evolution: A case study of China’s coastal areas. Appl. Geogr. 2025, 175, 103504. [Google Scholar] [CrossRef]
  104. Zhang, Y.Y.; Liu, J.; Wang, B. The impact of High-Speed Rails on urban expansion: An investigation using an SDID with dynamic effects method. Socio-Econ. Plan. Sci. 2022, 82, 10. [Google Scholar] [CrossRef]
  105. Zhu, X.H.; Qian, T.N.; Wei, Y.G. Do high-speed railways accelerate urban land expansion in China? A study based on the multi-stage difference-in-differences model. Socio-Econ. Plan. Sci. 2020, 71, 11. [Google Scholar] [CrossRef]
  106. Li, Y.; Ye, J.H.; Chen, X.H.; Abdel-Aty, P.; Cen, M. Transportation Characteristics Change under Rapid Urban Expansion: A Case Study of Shanghai. Chin. Geogr. Sci. 2010, 20, 554–561. [Google Scholar] [CrossRef]
  107. Maity, B.; Mallick, S.K.; Rudra, S. Integration of urban expansion with hybrid road transport network development within Haldia Municipality, West Bengal. Egypt. J. Remote Sens. Space Sci. 2021, 24, 471–483. [Google Scholar] [CrossRef]
  108. Ding, K.; Huang, Y.D.; Wang, C.S.; Li, Q.Q.; Yang, C.; Fang, X.; Tao, M.; Xie, R.P.; Dai, M. Time Series Analysis of Land Cover Change Using Remotely Sensed and Multisource Urban Data Based on Machine Learning: A Case Study of Shenzhen, China from 1979 to 2022. Remote Sens. 2022, 14, 5706. [Google Scholar] [CrossRef]
  109. Fan, S.; Chan-Kang, C. Regional road development, rural and urban poverty: Evidence from China. Transp. Policy 2008, 15, 305–314. [Google Scholar] [CrossRef]
  110. Yu, N.; De Jong, M.; Storm, S.; Mi, J. Transport Infrastructure, Spatial Clusters and Regional Economic Growth in China. Transp. Rev. 2012, 32, 3–28. [Google Scholar] [CrossRef]
  111. Abouelela, M.; Stamos, I.; Chaniotakis, M.; Antoniou, C. Disentangling the relationships between the SDGs and transportation. Res. Transp. Bus. Manag. 2025, 62, 101447. [Google Scholar] [CrossRef]
  112. Ipingbemi, O.; Akogun, O. Transportation: The Missing Link in the Achievement of SDGs. In Industry, Innovation and Infrastructure; Leal Filho, W., Azul, A.M., Brandli, L., Lange Salvia, A., Wall, T., Eds.; Springer International Publishing: Cham, Switzerland, 2021; pp. 1229–1236. [Google Scholar]
  113. Özaydın, Ö.; Kabak, Ö.; Topcu, Y.I.; Ülengin, F.; Önsel Ekici, Ş. Analysis of direct and indirect relations among sustainable development goals and transportation targets. Transp. Policy 2025, 171, 270–281. [Google Scholar] [CrossRef]
  114. Qin, B.; Zhao, J.; Chen, G.; Wang, R.; Lin, Y. An Integrated Framework for Assessing Dynamics of Ecological Spatial Network Resilience Under Climate Change Scenarios: A Case Study of the Yunnan Central Urban Agglomeration. Land 2025, 14, 1988. [Google Scholar] [CrossRef]
  115. Wael, S.; Elshater, A.; Afifi, S. Mapping User Experiences around Transit Stops Using Computer Vision Technology: Action Priorities from Cairo. Sustainability 2022, 14, 11008. [Google Scholar] [CrossRef]
  116. Ou, D.; Wu, J.; Huang, Q.; Shu, C.; Xie, T.; Luo, C.; Zhao, M.; Zhang, J.; Fei, J. Spatiotemporal Continuity and Spatially Heterogeneous Drivers in the Historical Evolution of County-Scale Carbon Emissions from Territorial Function Utilisation in China: Evidence from Qionglai City. Land 2025, 14, 1981. [Google Scholar] [CrossRef]
  117. Qi, G.; Shi, W.; Lin, K.-C.; Yuen, K.F.; Xiao, Y. Spatial spillover effects of logistics infrastructure on regional development: Evidence from China. Transp. Res. Part A Policy Pract. 2020, 135, 96–114. [Google Scholar] [CrossRef]
  118. Maparu, T.S.; Mazumder, T.N. Transport infrastructure, economic development and urbanization in India (1990–2011): Is there any causal relationship? Transp. Res. Part A Policy Pract. 2017, 100, 319–336. [Google Scholar] [CrossRef]
  119. Holler Branco, J.E.; Bartholomeu, D.B.; Alves Junior, P.N.; Caixeta Filho, J.V. Evaluation of the economic and environmental impacts from the addition of new railways to the brazilian’s transportation network: An application of a network equilibrium model. Transp. Policy 2022, 124, 61–69. [Google Scholar] [CrossRef]
Figure 1. Study area: the distribution of cities.
Land 14 02326 g001
Figure 2. Study framework.
Land 14 02326 g002
Figure 3. Urban Expansion: PCLA in 2010 (a), PCLA in 2020 (b), NTL in 2010 (c), NTL in 2020 (d).
Land 14 02326 g003
Figure 4. Transportation Development: HD in 2010 (a), HD in 2020 (b), NRD in 2010 (c), NRD in 2020 (d), PRD in 2010 (e), PRD in 2020 (f), CRD in 2010 (g), CRD in 2020 (h), RD in 2010 (i), RD in 2020 (j), BD in 2010 (k), BD in 2020 (l), DRL in 2010 (m), DRL in 2020 (n), DSL in 2010 (o), DSL in 2020 (p), NTPC in 2010 (q), NTPC in 2020 (r), NBPC in 2010 (s), NBPC in 2020 (t).
Land 14 02326 g004
Figure 5. Local Moran’s I index scatter plot: With the PCLA as the dependent variable in 2010 (a), With the PCLA as the dependent variable in 2020 (b), With the NTL as the dependent variable in 2010 (c), With the NTtL as the dependent variable in 2020 (d).
Land 14 02326 g005
Figure 6. Local R2 of GWR Models: With the PCLA as the dependent variable in 2010 (a), With the PCLA as the dependent variable in 2020 (b), With the NTL as the dependent variable in 2010 (c), With the NTL as the dependent variable in 2020 (d).
Land 14 02326 g006
Figure 7. Regression coefficients with the PCLA as the dependent variable: HD in 2010 (a), HD in 2020 (b), NRD in 2010 (c), NRD in 2020 (d), PRD in 2010 (e), PRD in 2020 (f), CRD in 2010 (g), CRD in 2020 (h), RD in 2010 (i), RD in 2020 (j), BD in 2010 (k), BD in 2020 (l), DRL in 2010 (m), DRL in 2020 (n), DSL in 2010 (o), DSL in 2020 (p), NTPC in 2010 (q), NTPC in 2020 (r), NBPC in 2010 (s), NBPC in 2020 (t).
Land 14 02326 g007
Figure 8. Regression coefficients with the NL as the dependent variable: HD in 2010 (a), HD in 2020 (b), NRD in 2010 (c), NRD in 2020 (d), PRD in 2010 (e), PRD in 2020 (f), CRD in 2010 (g), CRD in 2020 (h), RD in 2010 (i), RD in 2020 (j), BD in 2010 (k), BD in 2020 (l), DRL in 2010 (m), DRL in 2020 (n), DSL in 2010 (o), DSL in 2020 (p), NTPC in 2010 (q), NTPC in 2020 (r), NBPC in 2010 (s), NBPC in 2020 (t).
Land 14 02326 g008
Table 1. Major Variable.
TypeVariable NameUnit
The dependent variableUrban ExpansionPercentage of Construction Land Area(PCLA)
Nighttime Lights(NTL)-
Transportation DevelopmentRoadway DensityHighway Density(HD)m/m2
National Road Density(NRD)m/m2
Provincial Road Density(PRD)m/m2
County Road Density(CRD)m/m2
Railway and BridgeRailway Density(RD)m/m2
Bridge Density(BD)A/km2
Roadway Lighting Density of Road with Lights(DRL)m/m2
Density of Street Light(DSL)A/m2
Public Transit Number of Taxis Per Capita(NTPC)Car/ten thousand people
Number of Buses Per Capita(NBPC)Car/ten thousand people
Table 2. Global Moran’s I Index table for Chinese urban expansion in 2010 and 2020.
The Dependent Variable20102020
Moran’s Ip-ValueMoran’s Ip-Value
PCLA0.0530.000 ***0.0510.000 ***
NTL0.0360.000 ***0.0590.000 ***
Notes: *** Represents the significance levels of 1% respectively.
Table 3. Coefficients of determination.
The Dependent VariableYearR2R2 AdjustedAICcResidual SquaresBandwidth (km)
PCLA20100.8580.8403977.763650,457.9241047.160
20200.8930.8803933.406580,152.8901065.305
NTL20100.9090.8973452.885162,840.8001047.160
20200.8930.8793784.933392,110.0721065.305
Table 4. Local R2.
Table 4. Local R2.
The Dependent VariableYearAverageMaximumMinimumStandard Error
PCLA20100.7550.9070.6440.064
20200.8300.9210.6100.040
NTL20100.8480.9630.5980.057
20200.8180.9010.6630.044
Table 5. Regression coefficients with the percentage of construction land area as the dependent variable.
The Independent Variable 20102020
Average MaximumMinimumAverage MaximumMinimum
Roadway DensityHD0.3971.933−0.0930.1630.855−0.124
NRD0.6761.175−0.2710.6050.9920.326
PRD0.5750.783−0.0250.7490.916−0.004
CRD−0.1020.013−0.5540.1620.574−0.045
Railway and BridgeRD0.5352.427−0.0800.6430.9370.114
BD0.0122.139−0.4930.0041.536−1.069
Roadway Lighting DRL−0.0910.266−0.516−0.0431.195−0.250
DSL2.5946.1471.0320.99810.182−19.589
Public Transit NTPC0.0980.330−0.0980.0950.266−0.041
NBPC−0.2380.1680.709−0.4030.087−1.187
Table 6. Regression coefficients with the nighttime lights as the dependent variable.
The Independent Variable20102020
Average MaximumMinimumAverage MaximumMinimum
Roadway DensityHD0.4213.3110.0530.4350.713−0.009
NRD0.5351.076−0.2030.1760.964−0.239
PRD0.3720.5150.0010.5800.8550.052
CRD0.0580.292−0.0410.2770.641−0.061
Railway and BridgeRD−0.1030.609−0.571−0.3490.538−0.970
BD0.0270.406−7.6320.0370.292−0.726
Roadway Lighting DRL−0.0410.126−1.137−0.0000.685−0.201
DSL1.6704.157−4.8351.3534.812−11.528
Public Transit NTPC0.0010.108−0.0710.0520.127−0.098
NBPC0.1230.626−0.100−0.0190.444−0.307
Table 7. LM Test Result.
The Dependent Variable TestStatisticp-Value
PCLASpatial errorLM test no spatial error146.1780.000 ***
Robust LM test no spatial error149.1320.000 ***
Spatial lagLM test no spatial lag0.3790.538
Robust LM test no spatial lag3. 3320.000 ***
NTLSpatial errorLM test no spatial error75.8030.000 ***
Robust LM test no spatial error62.4950.000 ***
Spatial lagLM test no spatial lag26.2600.000 ***
Robust LM test no spatial lag12.9520.000 ***
Notes: *** Represents the significance levels of 1% respectively.
Table 8. Hausman Test, Wald Test and LR Test Result.
The Dependent VariableTestStatisticp-Value
PCLAHausman Test382.5200.000 ***
Wald Test for SAR53.4400.000 ***
Wald Test for SEM47.2800.000 ***
LR test for SAR51.6900.000 ***
LR Test for SEM46.5700.000 ***
NTLHausman Test−1453.97-
Wald Test for SAR89.0900.000 ***
Wald Test for SEM112.5800.000 ***
LR test for SAR87.5900.000 ***
LR Test for SEM75.7300.000 ***
Notes: *** Represents the significance levels of 1% respectively.
Table 9. SDM regression coefficients.
The Dependent VariableThe Independent VariableDirect EffectIndirect EffectTotal Effect
PCLARoadway DensityHD−0.0220940.29275380.2706598
NRD0.1040942 ***0.3223290.4264232 **
PRD−0.1000613 ***−1.721455 *−1.821516 *
CRD0.0560998 ***−0.1421029 *−0.0860031
Railway and BridgeRD−0.0011102−1.428158 *−1.429268
BD0.0337412.311762 **2.345503 **
Roadway Lighting DRL−0.01790780.35644810.3385403
DSL0.0595551 **−0.5956797−0.5361246
Public Transit NTPC−0.01076071.148048 **1.137287 **
NBPC−0.0001783−0.5884617−0.5886401
NTLRoadway DensityHD0.08301751.092014 ***1.175032 ***
NRD0.0230096 *−0.1507539−0.1277443
PRD0.0709193 −0.9883213 *−0.917402 *
CRD0.1245705 ***−0.0988731 *0.0256975 *
Railway and BridgeRD0.00542360.14729040.1527139
BD−0.07033730.9425899 *0.8722526 **
Roadway Lighting DRL0.08464861.365688 ***1.450337 ***
DSL0.0967317 *−2.324783 ***−2.228051 ***
Public Transit NTPC0.0177853−0.4676614 **−0.4498761 **
NBPC0.020019 *0.01079670.0308156
Notes: ***, **, * Represents the significance levels of 1%, 5%, and 10%, respectively.
Disclaimer/Publisher’s Note: The statements, opinions and data contained in all publications are solely those of the individual author(s) and contributor(s) and not of MDPI and/or the editor(s). MDPI and/or the editor(s) disclaim responsibility for any injury to people or property resulting from any ideas, methods, instructions or products referred to in the content.