Article

Identifying Conservation Priority Areas Through the Integration of Biodiversity, Ecosystem Services and Landscape Patterns in the Wujiang River Basin

1
State Key Laboratory of Environmental Criteria and Risk Assessment, Chinese Research Academy of Environmental Sciences, Beijing 100012, China
2
State Environmental Protection Key Laboratory of Regional Eco-Process and Function Assessment, Chinese Research Academy of Environmental Sciences, Beijing 100012, China
3
School of Ecology & Environment, Renmin University of China, Beijing 100872, China
*
Authors to whom correspondence should be addressed.
These authors contributed equally to this work.
Land 2025, 14(12), 2335; https://doi.org/10.3390/land14122335
Submission received: 17 October 2025 / Revised: 21 November 2025 / Accepted: 25 November 2025 / Published: 27 November 2025
(This article belongs to the Special Issue Conservation of Bio- and Geo-Diversity and Landscape Changes II)

Abstract

Systematic biodiversity and ecosystem service (ES) conservation is vital for ecological sustainability and human well-being. This study combines MaxEnt, Zonation, InVEST, and MSPA models to identify Conservation Priority Areas (CPAs) in the Wujiang River Basin (WJRB), integrating biodiversity hotspots, ESs, and landscape connectivity. Results reveal CPAs span 1.13 × 10⁴ km2 (primarily downstream), but existing natural reserves (NRs) cover only 24.86% of these critical zones, leaving over 75% unprotected in this region. Current NRs occupy 0.62 × 10⁴ km2, with 5.82% of the basin (mainly upstream) available for targeted expansion. Spatial analysis reveals mismatches, such as some NRs protecting low-value ecological areas, resulting in imbalanced coverage. Expanding NRs across the board is less effective than adjusting protection scope or management strategies in areas of spatial mismatch, based on identified CPAs. This can involve establishing new reserves and appropriately relaxing land-use restrictions to allow compatible activities within them. New conservation planning should prioritize large, interconnected CPA regions to enhance landscape coherence. Simultaneously, integrating ecological compensation mechanisms can align protection goals with local livelihood improvements, fostering community engagement. This approach addresses critical gaps and enhances conservation efficiency by strategically directing resources toward high-value, vulnerable ecosystems. The methodology offers a replicable framework for balancing ecological preservation and human needs in river basin management.

1. Introduction

Biodiversity and ecosystem services (ESs) are fundamental to the sustainable development of human society [1]. However, escalating human activities and climate change have introduced unprecedented challenges to global biodiversity and ecosystems [2,3]. According to the Millennium Ecosystem Assessment and the global assessment reports of the Intergovernmental Platform on Biodiversity and ESs, approximately 60% of ecosystems are undergoing degradation, posing serious threats to human survival and development [4,5]. The establishment of protected areas is a fundamental strategy for conserving biodiversity and Ess [6,7]. However, given the limitations of management resources, how to optimize biodiversity conservation and the maintenance of ecosystem services while maximizing the cost-effectiveness of conservation efforts is an urgent challenge faced by the global conservation field [8].
Globally, nearly 300,000 protected areas have been established, yet meta-analyses indicate they have been insufficient to reverse the overall decline of biodiversity and ESs due to heterogeneous effectiveness [9,10]. Although targeted intervention measures (such as invasive species control and habitat restoration) have shown significant positive impacts, spatial assessment reveals serious gaps [6]. On the one hand, the current area of protected areas is insufficient to encompass regions that are critical for biodiversity conservation and ESs. 58% of threatened species lack adequate protection coverage, and 91% exhibit insufficient habitat representation within protected area [11]. Globally 16.98% of terrestrial and inland waters and 8.26% of marine and coastal waters are protected under these areas and Other Effective Area-Based Conservation Measures (OECMs) [6]. However, many scholars argue that protecting at least 30% of the global area is necessary, a target now enshrined in the Kunming-Montreal Global Biodiversity Framework (Target 3), to achieve effective ecological conservation [12,13]. Some studies propose even more ambitious targets, suggesting that protecting 50% of the area may be necessary to ensure conservation outcomes [14,15]. On the other hand, there is a mismatch between the designated boundaries of existing protected areas and the actual rich regions of biodiversity and ESs. Only 19% of key biodiversity areas (KBAs) overlap with current protected areas, while 39% of KBAs remain unprotected [16]. Therefore, accurately identifying regions with rich biodiversity and ecosystems is a fundamental priority. Furthermore, most of the existing protected areas focus mainly on biodiversity conservation, while neglecting high ES areas. These gaps in protection contribute to significant conservation deficiencies.
Currently, the objectives of protected areas have evolved from solely focusing on biodiversity to emphasizing the importance of human well-being [17]. ESs refer to the various benefits that humans derive from ecosystems, serving as a critical indicator of human well-being [18,19]. Consequently, integrating ESs with biodiversity conservation has emerged as a novel perspective for delineating Conservation Priority Areas (CPAs) and improving conservation effectiveness [20,21]. Biodiversity serves as a key driver for the sustainable provision of ESs. Through ecological mechanisms such as complementarity, selection, and insurance, it enhances fundamental ecosystem functions—such as productivity, nutrient cycling, and stability—thereby securing the supply capacity of critical services and strengthening systemic resilience [14,15]. However, increases in biodiversity do not unconditionally lead to enhancements in all services; their effects are constrained by factors such as context dependency, functional thresholds, species’ functional traits, and abiotic conditions [20,21]. Thus, identifying biodiversity hotspots and areas with high supply of key ESs holds crucial guidance for scientifically delineating CPAs and improving the efficiency and resilience of ecological conservation across the WJRB. Research indicates that incorporating ESs into conservation planning may also be a cost-effective approach. Studies in East Asia, South Africa, and North and South America have demonstrated that integrating biodiversity and ESs into conservation planning can achieve a win-win situation for both biodiversity and ecosystems functionality [22,23]. Research indicates that when biodiversity and ecological functions are comprehensively integrated, expanding protected areas to cover 1% of the terrestrial land may double the extent of conserved high-value spaces. A 5% expansion could even triple this coverage (increasing from 9% to 38%) [24]. In the fragmented landscape of Europe where the Natura 2000 network has been established, the goal of expanding protected areas by 5% could double the number of vertebrate species while strengthening the regulation of ecosystem services [8]. Scholars typically use Geographic Information Systems (GIS) and methods such as equal intervals, standard deviation, and percentiles to identify regions rich in biodiversity and ESs, subsequently defining CPAs based on these [22,24,25]. These efforts aim to delineate regions that simultaneously protect biodiversity and ESs, thereby contributing to improving the effectiveness of the protected area system. However, the delineation of conservation priority areas must also consider spatial efficiency and connectivity [6,26]. In addition, in practical research and application, certified public accountants often vary due to the characteristics and scale of their research fields [27]. Therefore, more in-depth studies are required in key regions to refine conservation strategies further.
The Wujiang River Basin (WJRB), situated in the southwestern region of China, lies within one of the 34 global biodiversity hotspots and represents a fragile karst ecological region. Despite its vulnerability, it serves as a vital ecological barrier in the upper Yangtze, fulfilling critical functions like stabilizing soil and water resources and buffering against ecological risks [28]. As such, the region possesses high conservation value and ecological significance, combining both prominent ecological importance and acute sensitivity, which makes it a critical and representative area for identifying conservation priorities and providing a scientific basis for effective conservation planning. Previous research in the WJRB has largely focused on either biodiversity or ESs separately [28]. However, in the context of clearly defining certified public accountants for the WJRB, there are still few studies that clearly integrate these two aspects. This study fills this gap by quantifying the spatial distribution of plant biodiversity and various key ecosystem services (ESs) in WJRB. Specifically, we assessed biodiversity patterns and quantified three categories of five ESs: water supply (WS), water conservation (WC), carbon sequestration (CS), soil conservation (SC), and habitat quality (HQ). We then identified and integrated the spatial hotspots for both biodiversity and these ESs. Finally, we take landscape connectivity into account to identify representative and well-connected priority protected areas. This study aims to provide a theoretical basis and reference for improving biodiversity and ecological environment management in this region.

2. Materials and Methods

2.1. Study Area

The Wujiang River is the largest tributary on the southern bank of the upper Yangtze River. It originates in Hezhan County, Guizhou Province, and flows eastward, collecting multiple tributaries, before merging into the Yangtze River at Fuling District, Chongqing. The WJRB (104°18′–109°22′ E, 26°07′–30°22′ N) is a typical Karst region, located in the transition Area between China’s second and third terraces. The elevation gradually decreases from west to east, with an average elevation of 1100 m, covering an area of 88,000 km2. The WJRB has a subtropical monsoon climate, with an annual average temperature of 13–18 °C and annual precipitation ranging from 900 to 1400 mm. The upstream area is defined as above Huawu Ridge, the midstream area extends from Huawu Ridge to Sinan, and the downstream area lies below Sinan [29]. The region is rich in biodiversity and has significant ecological functions, hosting more than 5500 plant species (Figure 1).

2.2. Data Sources

The plant species distribution data comes from sources such as the Chinese Virtual Herbarium (http://www.cvh.ac.cn, accessed on 1 March 2024), the National Specimen Information Infrastructure (http://www.nsii.org.cn/, accessed on 1 March 2024), the Global Biodiversity Information Facility (https://www.gbif.org/citation-guidelines, accessed on 1 March 2024), and our own field sampling carried out in 2020. The species names were verified against the “Flora of China” (http://www.iplant.cn/, accessed on 1 March 2024). The databases contain species distribution point data for the Wujiang River Basin from 1980 to the present. For species recorded within a 1 km radius, only one occurrence point was retained, and the latitude and longitude coordinates were calibrated. To ensure the reliability of subsequent modeling, only species with more than 10 occurrence points were retained [30].
An amount of 12,922 plant occurrence points across 561 species were retained in the WJRB. A preliminary selection of 19 bioclimatic factors, 3 topographic factors, and 3 soil factors were chosen as environmental variables affecting species distribution (Table 1). The bioclimatic factor data were sourced from WorldClim (https://worldclim.org/, accessed on 1 March 2024), with a spatial resolution of 1 km [31]. These variables include fundamental temperature and precipitation indicators (e.g., Bio1 Annual Mean Temperature, Bio12 Annual Precipitation), as well as a series of derived metrics critical to physiological and ecological processes—such as temperature seasonality (Bio4), mean temperature of the coldest quarter (Bio11), and precipitation of the driest month (Bio14). These are widely used in species distribution modeling for their ability to accurately delineate climatic thresholds and periodic rhythms that constrain species distributions. The bioclimatic variables represent long-term averages for the period 1970–2000. Terrain data were obtained from the Geospatial Data Cloud (https://www.gscloud.cn/, accessed on 1 March 2024), with a spatial resolution of 30 m. Elevation serves as a macro-scale driver, fundamentally shaping regional hydrothermal conditions through mechanisms such as the temperature lapse rate. Slope influences surface runoff, soil erosion, and material stability, while aspect contributes to microclimatic variation at local scales by modulating solar radiation exposure. These topographic variables function as indirect environmental drivers, collectively reshaping the spatial redistribution of water and heat resources and thereby promoting habitat heterogeneity. Topographic factors are considered relatively stable over time. Soil factor data came from the National Tibetan Plateau Scientific Data Center (https://data.tpdc.ac.cn/, accessed on 1 March 2024), with a spatial resolution of 1 km, Based on China’s Second National Soil Survey conducted from the 1970s to the 1980s. The selected soil variables include soil pH, soil organic matter content, and soil texture. Soil pH directly regulates nutrient bioavailability and microbial activity; organic matter content serves as a core indicator of soil fertility, influencing the supply of nutrients such as nitrogen and phosphorus as well as soil structure; soil texture determines water retention capacity, aeration, and root development conditions. Together, these three categories of variables form a comprehensive set of ecological environmental factors operating across macro-climatic, local topographic, and substrate soil habitat scales, providing a reliable ecological basis for subsequent model analysis. To reduce errors caused by high parameter autocorrelation, Spearman correlation analysis was conducted on the environmental variables for each species, and only variables with correlation coefficients less than 0.8 were used in the MaxEnt model [32]. All datasets were unified to the Krasovsky 1940 Albers coordinate system, and the spatial resolution was standardized to 30 m using the nearest neighbor sampling method.
The land use data for ES calculation is from Earth system science data (http://www.earth-system-science-data.net/, accessed on 1 March 2024), with a spatial resolution of 30 m. Net primary productivity (NPP) data from MODIS vegetation index products (https://earthdata.nasa.gov/, accessed on 1 March 2024), the spatial resolution of 250 m. Annual potential evapotranspiration, monthly precipitation, annual precipitation and net ecosystem productivity data were obtained from the national Earth System science Data center (http://loess.geodata.cn, accessed on 1 March 2024) with a spatial resolution of 1 km. https://data.tpdc.ac.cn/, accessed on 1 March 2024), with a spatial resolution of 1 km. All data are from 2020. The nearest neighbor interpolation method was adopted, and the spatial resolution was standardized to 30 m.

2.3. Methods

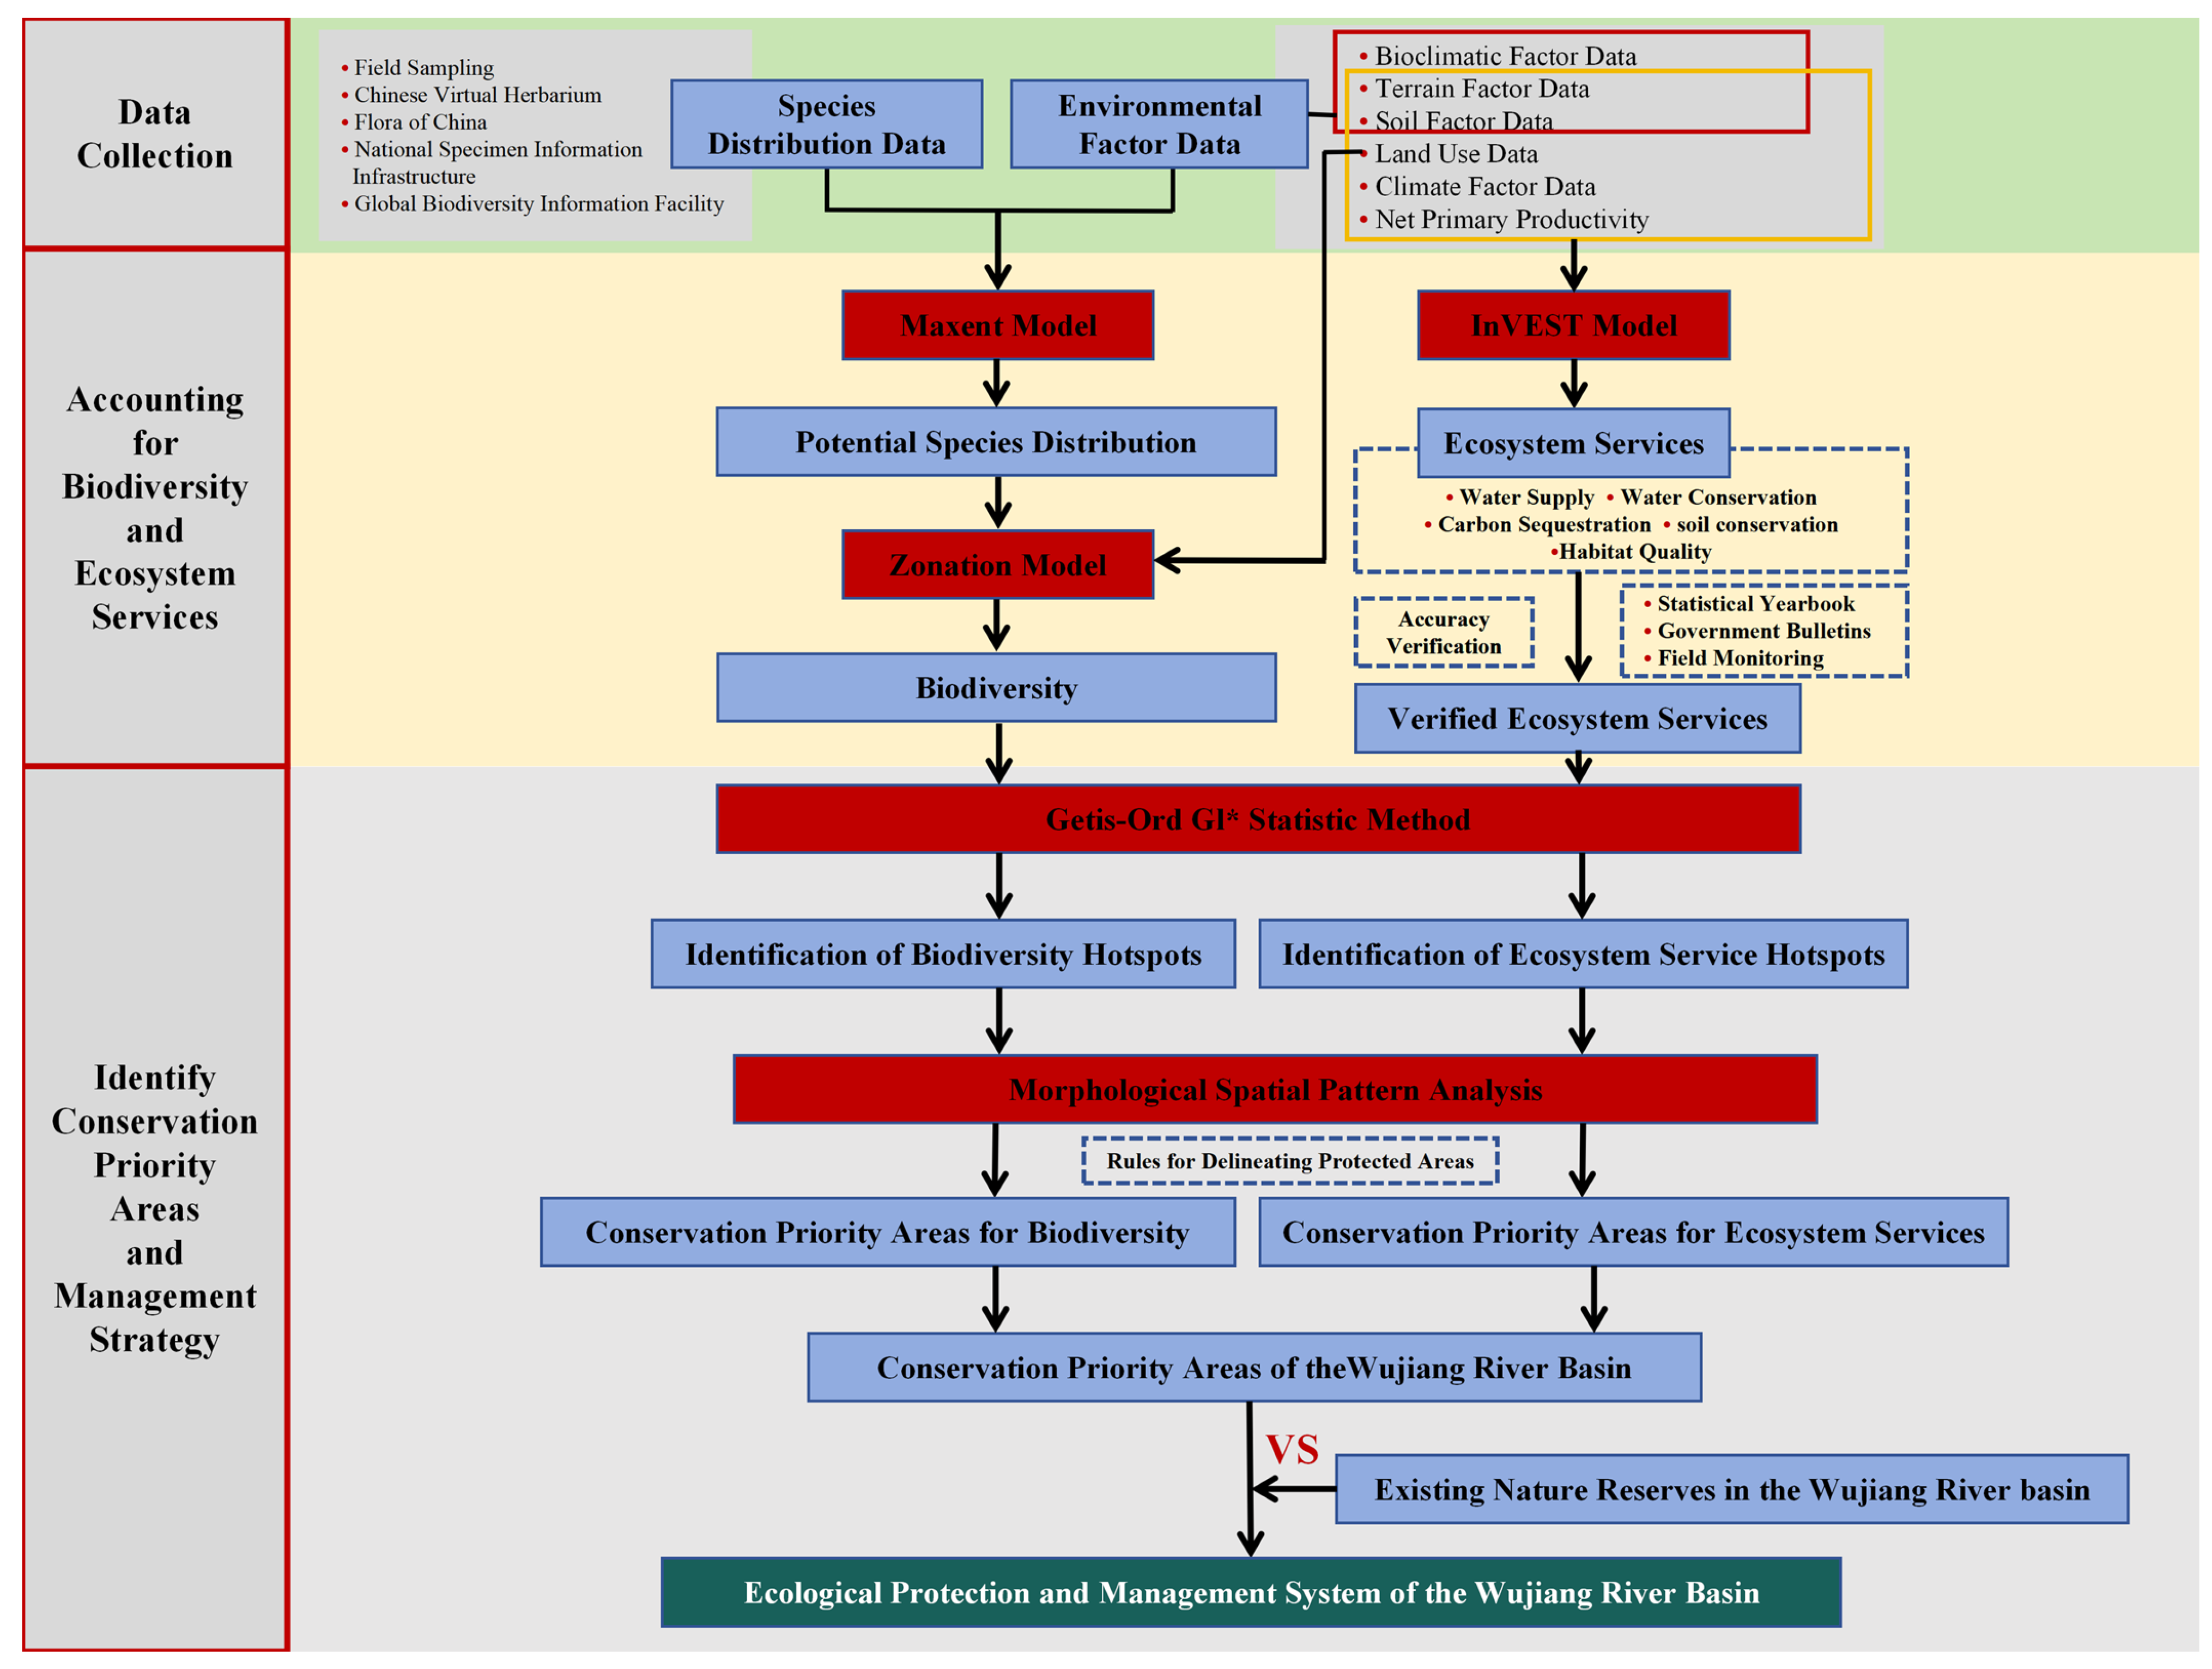
This study comprehensively utilizes multi-source data and geospatial models to systematically identify key areas for biodiversity conservation and ES supply in the WJRB, and delineates CPAs. Firstly, by integrating the MaxEnt model (version 3.4.3) and Zonation software (version 5.0), the potential distributions of multiple species are simulated and consolidated to reveal the spatial patterns of regional biodiversity. Secondly, based on the InVEST model and related ecological methods, the supply capacity of five key ESs—water supply (WS), water conservation (WC), carbon sequestration (CS), soil conservation (SC), and habitat quality (HQ)—is quantified and comprehensively assessed. Finally, through spatial correlation analysis, hotspot detection (Getis–Ord Gi*), and Morphological Spatial Pattern Analysis (MSPA), ecological hotspots and core areas under the synergy of biodiversity and ecosystem services are identified, based on which the final ecological conservation priority areas are demarcated (Figure 2).

2.3.1. Biodiversity Assessment

We first employed MaxEnt 3.4.3, developed by Steven Phillips’ team at Princeton University, USA (https://biodiversityinformatics.amnh.org/open_source/maxent/, accessed on 1 March 2024), to determine the potential distribution of each species individually [33]. Based on the principle of maximum entropy, this model predicts the potential distribution of species based on the environmental conditions of their actual distribution. In the model run, 75% of the data were used as training data, and 25% were used as validation data. To reduce model uncertainty, 1000 simulations were performed with 4 repetitions, while the other parameters were set to their default values. The accuracy of the simulations for each species was analyzed using the Area Under the Receiver Operating Characteristic (ROC) curve (AUC) [34]. Only the simulation results with an AUC value greater than 0.7 were used for subsequent analysis.
Then, from the university of Helsinki, Finland Atte Moilanen team development Zonation of 5.0 (https://zonationteam.github.io/Zonation5/, accessed on 1 March 2024). conduct systematic conservation priority ranking to determine the spatial pattern of the biodiversity value of the entire region [35]. This computational decision-support tool implements spatial conservation planning through an iterative algorithm that removes the least valuable grid cells based on biodiversity features (e.g., species distributions and habitat quality) and landscape connectivity constraints, generating a hierarchical priority ranking of areas from highest to lowest conservation value. This method ensures the high connectivity and complementarity of biodiversity elements in the output structure. This study takes the land use data of 2020 as the condition layer, uses the potential distribution of each species obtained by the MaxEnt model, and runs the Zonation software. The removal rule used was the additive benefit function, and the curvature factor was set to 1, with the remaining parameters set to default values. The output was a continuous grid data ranging from [0, 1] (its resolution is consistent with that of the resampled data source, which is 30 m), where higher values represent higher priority for conservation to maximize the retention of biodiversity representation across the landscape [33] (hereinafter referred to as biodiversity). Within the Zonation framework, the marginal loss in conservation priority was calculated using the software’s core algorithm:
δ i = j V j R j S V j R j S i
where δ i   represents the marginal loss of each grid i, V j is the increment function, and R j S represents the distribution of species jjj in the remaining grid S, while Si denotes the set of grids remaining in S after removing grid i.

2.3.2. ES Assessment

Based on the four types of ecological environments included in the Millennium Ecosystem Assessment, and considering the availability of data and the ecological functions of the WJRB, this study selected five types of ecological environments from the three for analysis: water supply (from supply services), carbon sequestration and water retention (from regulation services), and soil conservation and habitat quality (from support services). Among them, water supply (WS), water conservation (WC), carbon sequestration (CS), soil conservation (SC), and habitat quality (HQ) are regarded as the most important ESs for maintaining ecological security. This study did not take into account ESs that might have a negative impact on biodiversity (for example, crop production and wood services).
InVEST (Integrated Valuation of Ecosystem Services and Tradeoffs), developed by Stanford University (https://naturalcapitalproject.stanford.edu/software/invest, accessed on 1 March 2024), is one of the most comprehensive open-source softwares for ecosystem service quality ac-counting. WS is calculated using the water production module of the InVEST model [36]. CS is computed using the carbon module of the InVEST model, combined with spatial calibration methods [37]. WC is calculated based on WS, incorporating topographic index, soil saturation hydraulic conductivity, and runoff coefficient [38]. SC is assessed through the sedimentation module of the InVEST model [39]. HQ is evaluated using the HQ module of the InVEST model [28]. The results were compared with field data and previous research to validate the accuracy of the assessments.
The results for ESs were compared with statistical yearbooks, government bulletins, and field monitoring data to validate their accuracy. Subsequently, the values were normalized, and the total ESs in the WJRB were summed up to enable comprehensive evaluation. Considering the sensitivity of normalization techniques to minimum and maximum values, and to avoid the influence of extreme values, a pixel binary model was applied [40], as shown in the following formula:
E S m = E S i E S 5 % E S 95 % E S 5 %
where E S m is the normalized value of the mmm-th ES, E S i is the ES value for grid i, E S 5 % is the 5% value of the ES, and E S 95 % is the 95% value of the ES.
It is worth noting that in this study, the quantified ecosystem refers to the supply of the ecosystem, defined as the biophysical capacity of the ecosystem to provide services within a given period of time, regardless of social demand or actual use. Therefore, these ESs represent ecological potential rather than achieving utility. All subsequent analyses are based on the ES supply paradigm.

2.3.3. Identification of CPAs

Firstly, calculate the Spearman rank correlation coefficient between biodiversity and ESs. When this value is positive, it indicates the existence of a cooperative relationship, providing a scientific basis for cooperative protection. Subsequently, the hotspots of regional biodiversity and integrated ecosystems were identified. A hotspot is defined as a data point with a high value surrounded by similar high-value points. Compared to defining thresholds for determining high biodiversity and high ES areas [41], the Getis–Ord Gi* statistic method takes spatial heterogeneity and landscape connectivity into account, resulting in smoother hotspot boundaries and more complete spatial representation. The statistical significance of Gi* can be tested using the Z-value and p-value (p < 0.01). A positive Z-value indicates a higher degree of value clustering, while a negative Z-value indicates a higher degree of low-value clustering. Only Z-values less than −1.65 or greater than 1.65 are considered statistically significant. The calculation formulas for Getis–Ord Gi* and Z-values are as follows:
G i * = j = 1 n w i , j × x j j = 1 n x j n × j = 1 n w i , j j = 1 n x j 2 n j = 1 n x j n 2 × n j = 1 n w i , j 2 ( j = 1 n w i , j ) 2 n 1
Z = G i * E ( G i * ) V a r ( G i * )
Z = > 1.65                                                                                                   hot   spot                 1.65 ~ 1.65                             statistically   insignificant                   < 1.65                                                                                           Cold   spot                
where n is the number of grids, w i , j is the distance between grid i and grid j, i.e., spatial weight, x j is the attribute value of grid j, E ( G i * ) and   V a r ( G i * ) are the expected value and variance of G i * .
After determining the hotspots, the morphological spatial Pattern analysis (MSPA) method is adopted to analyze the spatial pattern of the hotspots. This involves image processing techniques, such as erosion, dilation, opening and closing operations, to segment, identify and classify patterns. MSPA describes the geometric arrangement and connectivity of hotspots, classifying them into seven non-overlapping categories: core area, bridge area, corridor, branch, edge, gap and island block. This study uses the Guidos software (version 3.3) to perform MSPA, setting potential sources as foreground and the rest as background. Based on previous studies, EdgeWidth is set to 3, with other parameters at default values. The core areas identified represent potential CPAs [42].
Finally, following the CPAs delineation rules, internal gaps within the core areas are streamlined. Our survey of the existing protected areas in the WJRB revealed that the three smallest protected areas have sizes of 1001.31 hm2, 1022.99 hm2, and 5656.09 hm2, respectively. Sensitivity analysis further demonstrated that when the area threshold for identifying core areas as CPAs is lowered, although the total area of CPAs and their coverage of biodiversity and ESs show a steady increasing trend, no significant inflection point is observed at any specific threshold. Therefore, based on practical feasibility and analytical results, this study ultimately adopts an area threshold of 1000 hm2 to identify valuable high biodiversity and high ecosystem service areas. Given the importance of flagship species, previously identified flagship species conservation Areas are also incorporated into the conservation priority Areas of the WJRB [43].

3. Results

3.1. Spatial Distribution Patterns of Biodiversity

This study obtained distribution data of 561 plant species and simulated their potential distribution using the Maxent model. Among them, the AUC values of 537 species were greater than 0.70, among which 82.28% of the species had AUC values greater than 0.8, and nearly half of the species had AUC values greater than 0.90 (Figure 3), indicating that the results of the model are reliable. However, the AUC values of 24 species were lower than 0.70, which might be due to the high autocorrelation of their distribution points, resulting in poor model performance for these species. Therefore, only species with an AUC value greater than 0.70 were included, and the potential distribution was further analyzed in the Zonation software in combination with the land use data of 2020 to assess the biodiversity of the WJRB. The spatial pattern of biodiversity was found to align with the distribution of species points, following a northeast-high, southwest-low pattern, with a distribution of downstream > midstream > upstream (Figure 3). Compared to species point distribution, biodiversity in geographic space was more continuous. For example, while species points in the western downstream region were densely clustered, biodiversity in the western downstream region followed a belt-like distribution along the mountains.

3.2. Spatial Distribution Patterns of ESs

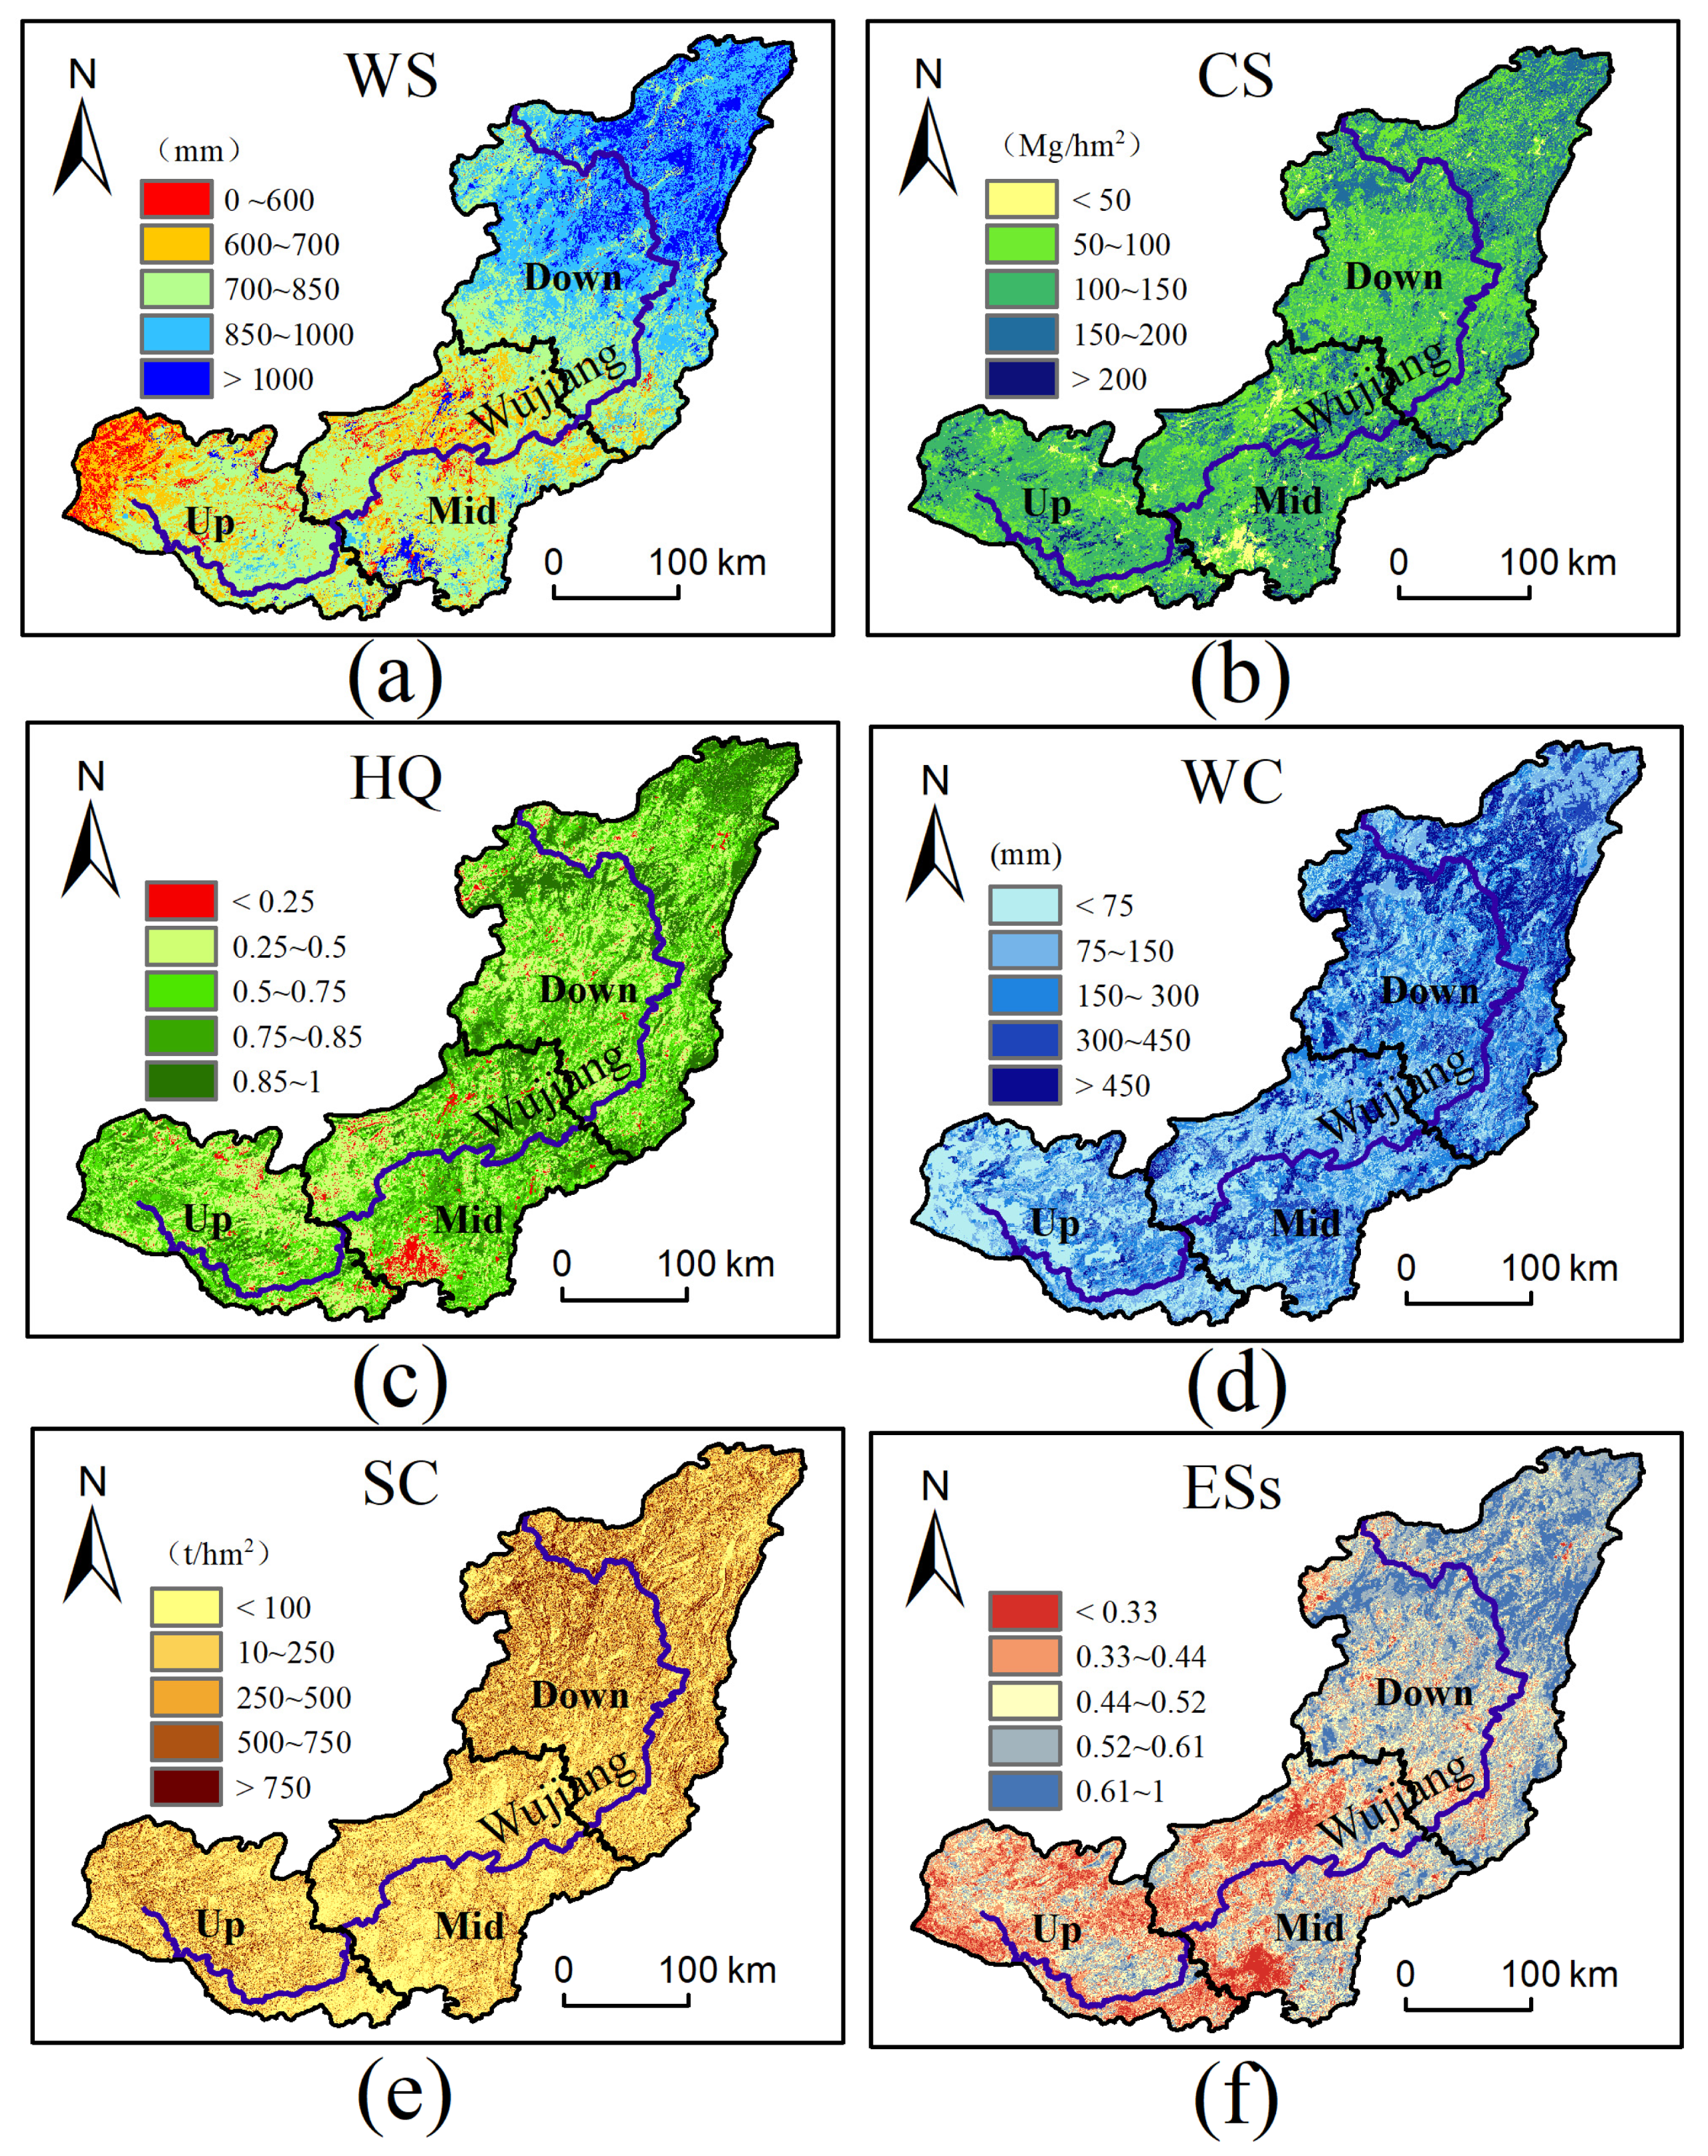
All individual ES in the WJRB exhibit a distinct northeast-high, southwest-low spatial pattern, which is consistently maintained in the composite ES assessment (Figure 4). The areas with the highest ES values across the basin are consistently located in the downstream region. For instance, the mean WS in the downstream area is 896.37 mm, which is 20.81% higher than that in the midstream and 26.28% higher than that in the upstream (Table 2). In 2020, the total WS in the WJRB was 7.12 × 10¹⁰ m3, with a unit average of 810.57 mm. The total CS amounted to 1.15 × 10³ Pg, with a unit average of 134.00 Mg/hm2. The total WC was 2.00 × 10¹⁰ m3, with a unit average of 227.98 mm. The total SC was 3.53 × 10⁹ t, with a unit average of 401.30 t/hm2. The unit average HQ was 0.68 (Table 2).

3.3. Delineation of CPAs

The biodiversity of WJRB is significantly (p < 0.05) and positively correlated with the majority of the ESs analyzed. The correlation coefficient with total ESs is the highest, at 0.58, followed by habitat quality, at 0.47. Except for soil retention, the correlation coefficients between the ecological benefits and biodiversity of the other types of work are all greater than 0.3. This indicates that the ESs and biodiversity under consideration reinforce each other. The delineation of ecological protected areas by utilizing biodiversity and integrated ecosystems can achieve the goal of collaborative protection (Figure 5).
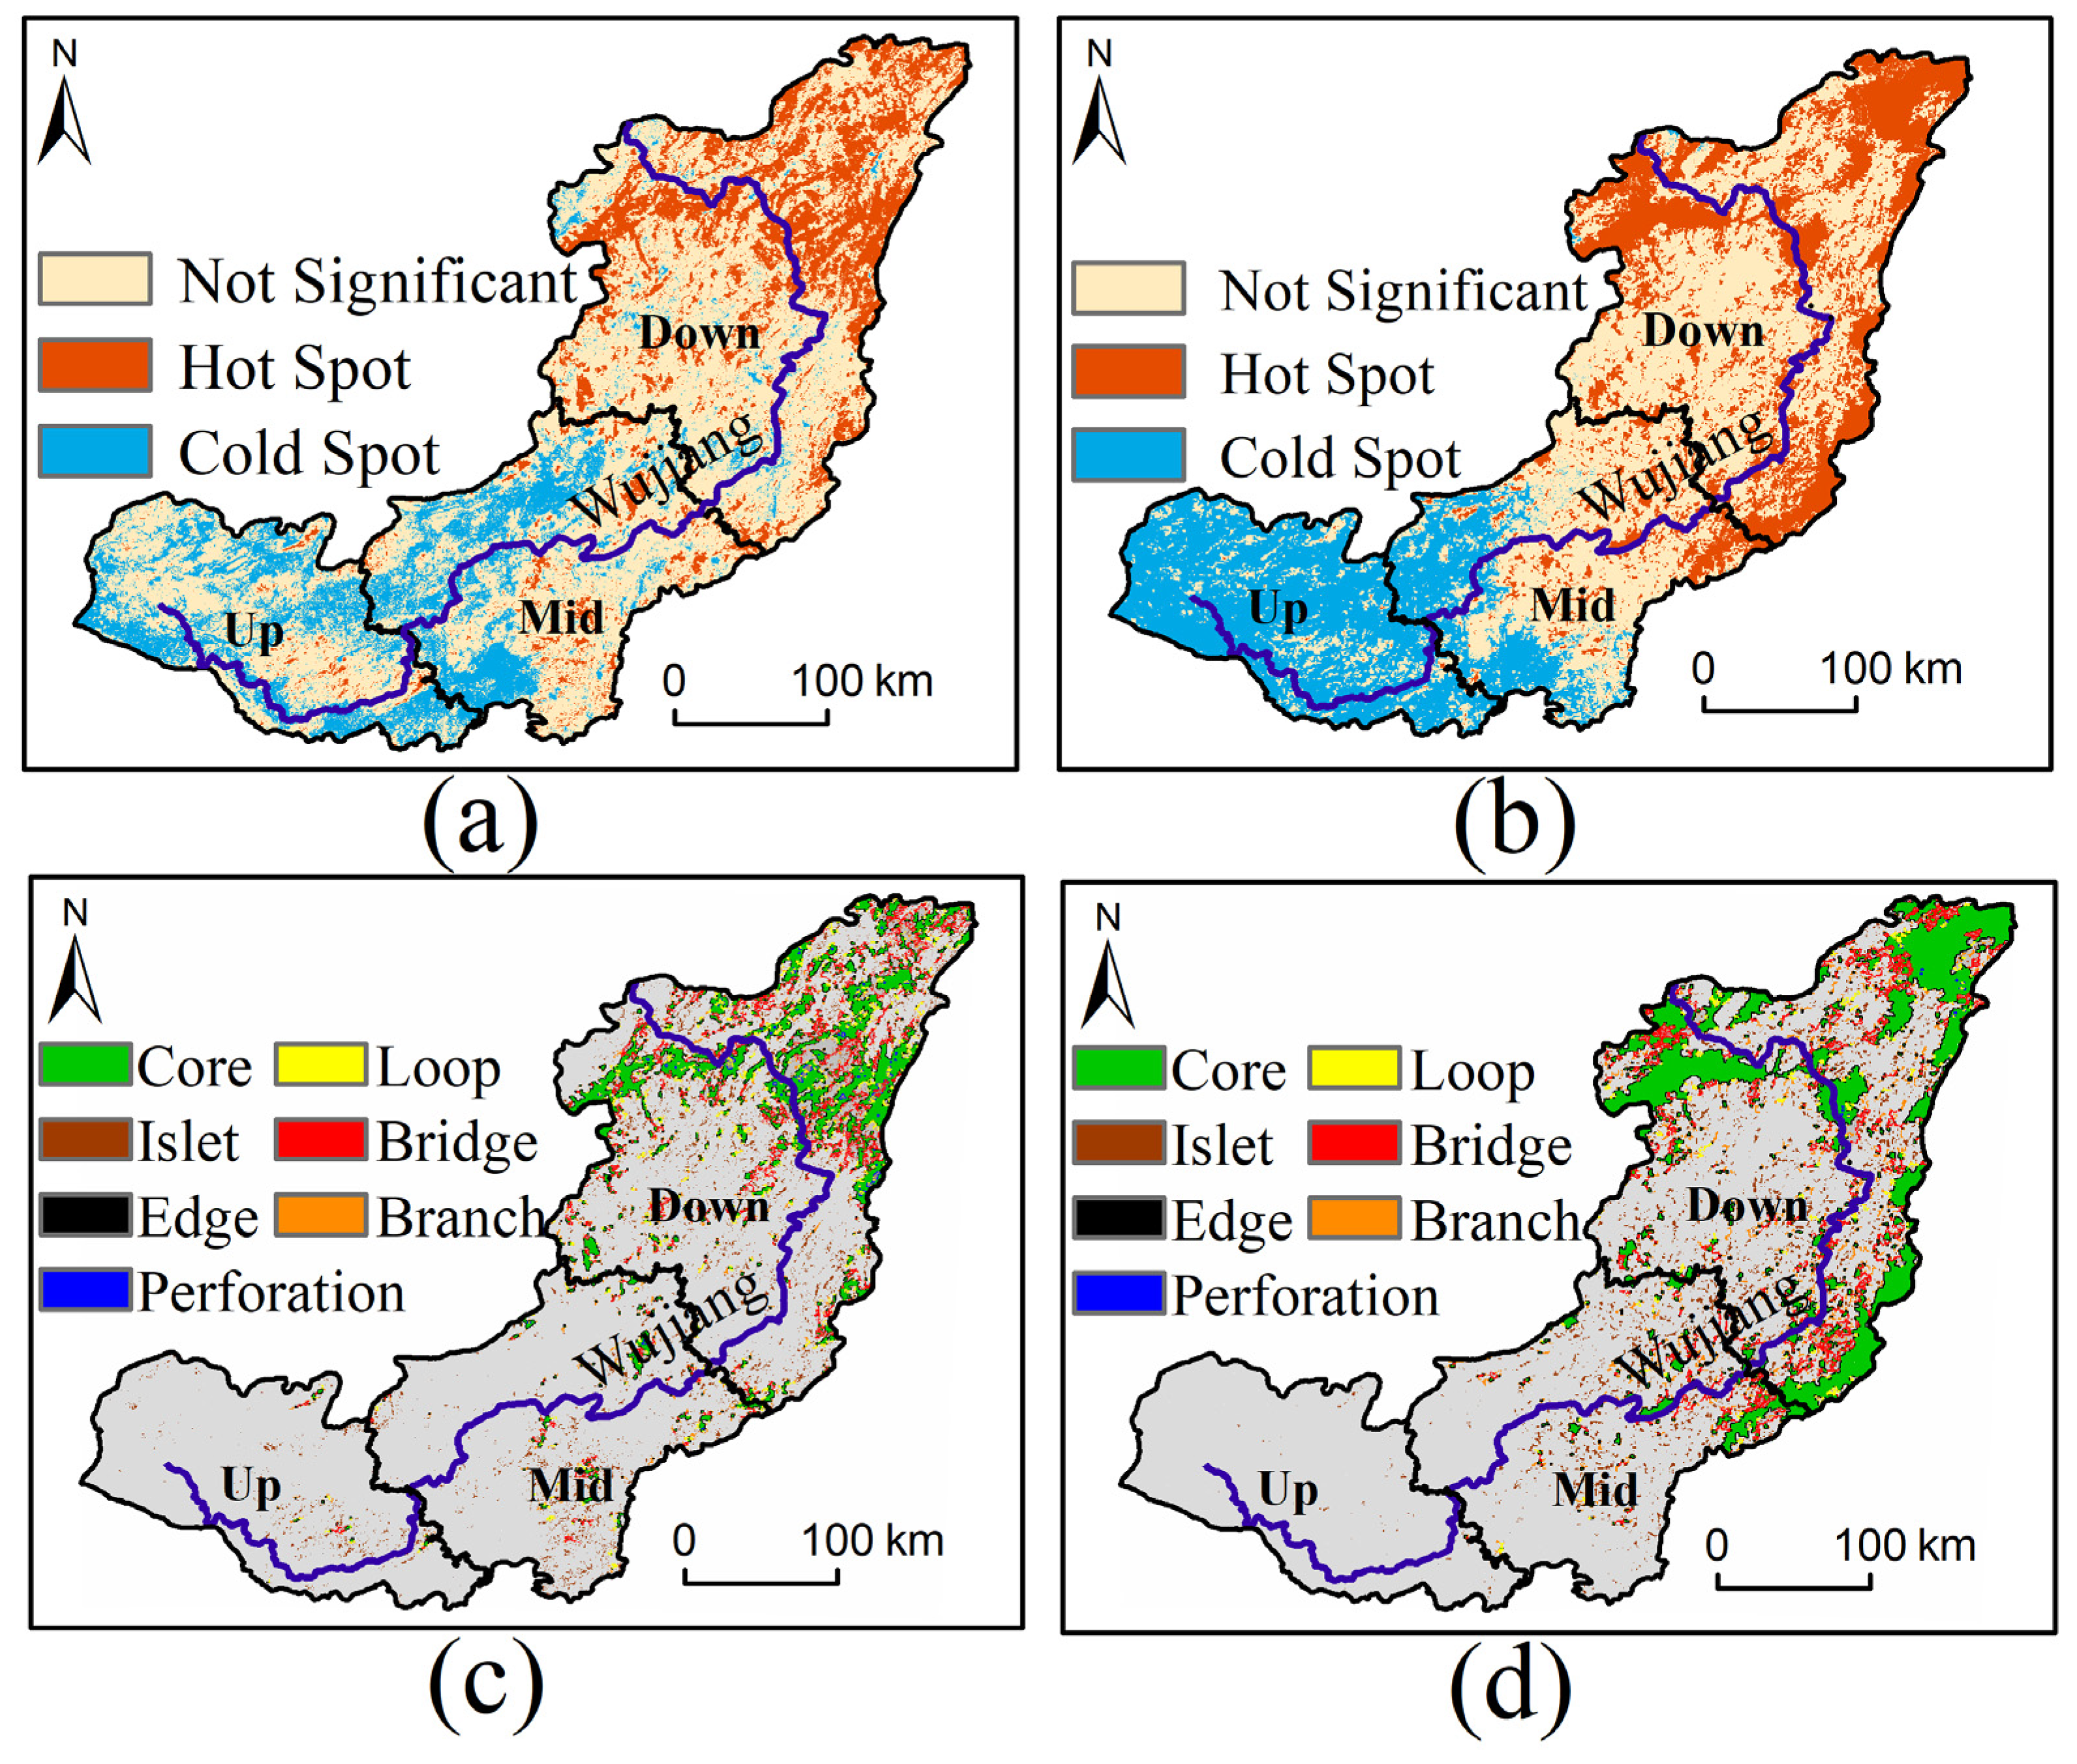
The combined results of ESs and the hotspot analysis of biodiversity show similar distribution characteristics, with a higher distribution in the southeast and a lower distribution in the northwest. However, ES hotspots are mainly concentrated in the northern downstream region (Figure 6b), while biodiversity hotspots are more densely distributed in the southern downstream region, presenting a more aggregated pattern (Figure 6a). MSPA further refines these hotspots to define core areas. These core areas align closely with the hotspot distributions but exclude scattered regions, resulting in spatially continuous and larger core areas that hold greater conservation value (Figure 6c,d).
Considering landscape connectivity and the importance of flagship species, CPAs were determined. The total CPAs in the WJRB is 1.13 × 10⁴ km2, accounting for 12.83% of the total basin area. Among these, areas with simultaneous biodiversity and ES conservation priorities cover 0.23 × 10⁴ km2 (2.67% of the basin area). Areas with biodiversity conservation priorities alone cover 0.87 × 10⁴ km2 (9.83%), while those with ES conservation priorities alone cover 0.47 × 10⁴ km2 (5.31%). Flagship species conservation areas span 325.6 km2, representing 0.37% of the basin area (Figure 7a).
Previously, there were 53 NRs in the Western Jura Basin, with a total area of 0.62 × 10⁴km2, accounting for 7.01% of the basin’s area. These NRS are mainly concentrated in the northern part of the downstream and the east bank of the downstream, while they are less distributed in the middle and upper reaches (Figure 7b). The spatial distribution results show that the existing ecological reserves are similar to those determined in this study, both mainly distributed in the downstream areas. It should be emphasized that compared with the established certified public accountants, the NRs shows a protection gap of 5.82%. However, this does not mean that national quotas should be expanded indiscriminately. Spatial mismatch is evident in areas such as the northwest of the middle-to-lower reaches boundary and the northern downstream region of the WJRB, where the identified CPAs are smaller than the existing NRs. Expansion of protected areas in such locations is inadvisable.

4. Discussion

4.1. Uncertainty Analysis of ES Quantification Results

The accurate quantification of ecosystem services (ES) forms the cornerstone of this study. When compared with data from the 2020 “Yangtze River Basin and Southwest Rivers Water Resource Bulletin” (Data obtained from local hydrological control stations), the WS estimate in this study had an accuracy rate of 99.76%. The CS estimate was 26.78% higher compared to the national average data from 2011–2015 based on field sampling by (Data obtained from field sampling) [44]. The WC service was 49.95% higher when compared with the national average data from 2000–2015 based on field sampling by [45] (Data obtained from field sampling). Compared with the measured data of soil erosion in the “China River Sediment Bulletin” in 2020 (data from local water control stations), the accuracy rate of soil retention services is 99.76%. The spatial distribution of the headquarters is basically consistent with the “Environmental Bulletin” of Guizhou Province (the data is derived from the survey of local managers). Given that the sampling periods for some research predate this study [44,45], preceded this study, multiple studies have indicated that CS in Southwest China have significantly increased in recent years. Additionally, Wu et al. reported lower precipitation levels during their study period compared to 2020, and their research also indicated that CS and WC in Southwest China were considerably higher than the national averages [45]. Therefore, the results of this study, which show higher CS and WC, are consistent and reasonable. In summary, the ES results calculated in this study are reliable and can be used for further analysis. In quantifying ESs in this study, more emphasis was placed on ES supply. While ES supply may not fully reflect societal utilization patterns, protecting high-supply areas remains ecologically imperative [46,47,48,49]. First, these zones constitute the biophysical sources of services; their degradation would irreversibly compromise future provision potential irrespective of current demand [50]. Second, conserving supply-rich ecosystems (e.g., intact forests, wetlands) enhances landscape resilience to climate disturbances and secures long-term service sustainability—aligning with the precautionary principle [51]. Third, high ES supply regions frequently overlap with biodiversity-rich habitats, enabling simultaneous achievement of ecosystem functionality and species preservation goals [52]. Thus, prioritizing such areas represents a strategic conservation investment in ecological insurance for future human well-being.

4.2. Identification Methods and Spatial Effectiveness of CPAs

Identifying CPAs forms a critical foundation for systematic conservation planning, as it enables the rational allocation of limited resources and optimizes the layout of protected areas [53]. This study implemented a comprehensive analytical framework to describe cpa rather than simply superimposing correlations. This process is initiated by the Zonation software and generates a composite biodiversity priority ranking by simultaneously handling the distribution of multiple species and landscape connectivity. The parallel quantification of five key ecosystem services was achieved through the InVEST model. Conduct spatial compliance analysis on these outputs to determine that the collaborative hotspots with high biodiversity value are in line with the concentrated ES supply. Finally, the MSPA model evaluated structural connectivity to ensure the determination of the ecological functions of the region. The resultant CPAs primarily cluster in the southwestern Hubei mountains and Wuling mountains of the downstream WJRB aligning with known biodiversity and ES hotspots. Their spatial distribution corresponds significantly with existing Natural Reserves validating the efficacy of this Biodiversity–Ecosystem Services–Landscape Patterns methodology for conservation spatial planning.
The size of CPAs is a crucial factor that influences the balance between protection and development. If the designated area is too small, it may fail to ensure ecological security; if it is too large, it could hinder socio-economic development [54]. Thus, determining optimal size for CPAs remains a complex issue, requiring a balance between land development and ecological protection. The CPAs identified in this study cover 12.83% of the WJRB, which is significantly below the 30% target set by the Kunming-Montreal framework. However, scholars have suggested that achieving the 30% protection target in human–natural–social complex systems should be a gradual process. For example, studies in Guizhou Province have proposed priority conservation areas covering 27,254.75 km2, accounting for 15.47% of the province’s total area [21]. Research in the karst regions of southwestern China suggests that priority conservation areas should occupy 15.59% to 19.17% of the total area [17], primarily distributed in regions with favorable hydrothermal conditions such as Yunnan and Guangdong provinces, while being less prevalent in areas like the WJRB. In contrast, natural landscapes characterized by minimal current or historical human disturbance, often termed wilderness areas, are frequently rich in biodiversity and ecosystem services. Playing a crucial role in maintaining ecological balance and ensuring ecosystem resilience, these areas should therefore be protected in their entirety whenever possible. A prime example is the Amazon rainforest in Brazil. As the world’s largest and most biodiverse tropical rainforest, covering approximately 49% of the country’s territory, it holds immense significance for global climate and environmental protection. Consequently, scholars advocate for the effective conservation of its entire area [15,55]. Therefore, while the 12.83% proportion identified for the WJRB falls below the 30% benchmark proposed by Zhu et al. for Asia, it effectively covers areas of significant conservation value within the basin. This underscores the necessity for differentiated protection thresholds, as emphasized by Zhu et al., particularly in regions with intensive human activities [56].

4.3. Optimization Strategies for CPAs

Existing NRs in the WJRB span 0.62 × 10⁴ km2, accounting for 7.01% of the basin area. These reserves currently cover only 24.86% of the CPAs identified in this study. Over 3/4 of the priority areas remain unprotected. However, improving protection effectiveness does not require indiscriminate expansion of protected areas. Some areas require increased protection, such as the large, unprotected areas of high-value biodiversity and ESs on the eastern downstream bank [57]. Conversely, spatial mismatch exists where existing NRs overlap minimally with CPAs. This is evident in areas like the northwest boundary of the middle-to-lower reaches and the northern downstream region of the WJRB [58], where protection efficiency may be insufficient. Studies highlight the coexistence of protection gaps and overprotection within protected area systems. Huang et al.’s research in Xishuangbanna found protected areas containing anthropogenically disturbed land uses, such as farmland, rubber plantations, and tea gardens [20], significantly impacting biodiversity habitats. Similarly, Liu et al. found nearly half of nature reserves lacked overlap with identified CPAs [57]. Therefore, filling protection gaps requires optimizing protected area spatial layout and scope. However, given that a large number of residents in the WJRB rely on natural resources for their livelihoods, filling these conservation gaps must be accompanied by ecological compensation mechanisms that balance ecological protection and livelihood improvement. Compensation should primarily target residents within the priority conservation areas, with funding responsibilities assigned to ecological beneficiary regions and enterprises that exploit natural resources. Compensation standards should be quantified based on key ESs—such as carbon sequestration, water conservation, habitat quality, and biodiversity maintenance—as well as the opportunity costs of conservation. The roles of governments at all levels in fund coordination and supervision must be clearly defined. Through approaches such as conservation agreements, community co-management, and support for green industries, local residents should be guided to become active participants and beneficiaries of ecological conservation, thereby achieving synergistic development of ecological protection and livelihood improvement. For existing NRs with low protection efficiency, adjusting land-use restrictions to allow compatible activities represents a viable approach to enhance ecosystem resilience [59].
Our analysis provides strong evidence that achieving effective protection coverage is not merely about increasing the total area of protected zones, but crucially depends on optimizing their spatial configuration. In the existing network of nature reserves, the existence of over-protected areas implies serious inefficiencies and opportunity costs. Therefore, strategically reducing the protection of low-value and over-protected areas and reallocating the vacated resources to expand the protection scope to the identified high-value cpa gaps, especially those areas with high connectivity, is a more effective and scientific approach to achieving protection goals such as the “30 × 30” for landscapes under development pressure. More importantly, our research findings oppose the sole focus on expanding the coverage of protected areas. On the contrary, they provide strong scientific support for the strategic reconfiguration of the protection network: reducing or eliminating excessive protected areas with low protection value, and prioritizing the expansion of protection to identified, highly connected protected area gaps. Such a reconfiguration strategy, guided by a spatially clear cpa mapping, is crucial for enhancing the efficiency and effectiveness of protecting investments. This applies not only to the WJRB but also to regions around the world that are striving to achieve ambitious biodiversity goals under resource constraints.
Based on the CPAs identified in this study, a diversified conservation management system should be established in the future. For large, highly connected CPA regions (such as the eastern bank of the downstream of the WJRB), priority should be given to establishing or expanding strictly protected nature reserves, and active efforts should be made to pursue high-level conservation designations such as national parks and international protected areas to enhance landscape connectivity and ecosystem integrity. In areas with existing but less effective protection or intensive human activities, inclusive management mechanisms such as “Other Effective area-based Conservation Measures” (OECM) can be introduced. By adjusting land-use restrictions, sustainable resource use activities compatible with ecological conservation goals can be permitted, achieving a balance between maintaining ecological functions and regional development. Research supports the feasibility of such measures. For instance, Petza et al. assessed the biodiversity status of marine OECMs (Other Effective Area-based Conservation Measures) over 12 years and found that since the cessation of destructive bottom trawling, benthic communities have started to recover [60]. In Canada, Jen Hoesen’s et al. study demonstrated that OECMs can effectively reduce the impact of underground resource extraction on biodiversity [61]. These examples suggest that sustainable land-use methods with ecological protection as the primary management goal can be as effective as strict protected areas. Furthermore, ecological compensation mechanisms should be established to engage local residents as participants and beneficiaries of conservation actions, thereby enhancing community support and collaboration. This integrated approach not only helps address current conservation gaps but also strikes a balance between strict protection and sustainable use, providing a replicable practical framework for synergizing ecological and human development at the watershed scale.

4.4. Research Limitations and Future Prospects

The definition of a certified public accountant is inherently uncertain. This study selected three types of ESs and biodiversity for empirical research. To extend this method to other environments, different environmental types, principles and indicators need to be taken into consideration. This will involve verifying the applicability of the method based on the unique management requirements of each service type. The ESs considered in this study do not include those that are in direct conflict with biodiversity, such as food production and timber harvesting, which often show a negative correlation with high biodiversity areas [62]. The correlation analysis in this study confirms that the chosen ESs and biodiversity are positively correlated, indicating a mutually reinforcing relationship. This allows for a balance between biodiversity protection and the inclusion of ESs in conservation planning. However, ESs like food production and timber harvesting are highly relevant to human welfare [18,28]. As global sustainable development goals evolve, the objectives of protected areas are expanding beyond species habitat and ecosystem protection to also include enhancing livelihoods, improving human welfare, and addressing climate change [17]. Meanwhile, as this study only quantified the ecological potential (supply side), it failed to capture the social utilization of biodiversity and the ecological environment. Therefore, future research should give priority to (1) incorporating a broader range of social services (including cultural services and those that exhibit potential trade-offs); (2) evaluating the applicability of this framework in different biogeographic regions; and (3) evaluating the effectiveness of implementing various protective measures (including other effective regional-based protective measures—oecm) within the identified cpz to achieve ecological integrity and human well-being—particularly by analyzing ES flows to examine their actual social utilization or needs.

5. Conclusions

This study focused on the WJRB and aimed to achieve the coordinated protection of biodiversity and ESs. Based on the “Biodiversity–ESs–Pattern” framework, an integrated modeling approach combining MaxEnt–Zonation–InVEST–MSPA was employed to determine the spatial patterns of CPAs. The primary objective was to optimize the layout of protected areas and maximize the effectiveness and benefits of ecological protection. Our analysis revealed a strong positive spatial correlation between biodiversity and key ESs (including WS, CS, WC, SC, and HQ) providing a robust scientific basis for their coordinated conservation. The identified CPAs, covering 1.13 × 10⁴ km2 and predominantly concentrated in the downstream section of the basin, represent regions of critical ecological value. However, there is a huge protection gap, as the existing protected areas currently only protect 24.86% of the registered protected areas, leaving more than three quarters of the high-priority areas in a vulnerable state. Furthermore, spatial analysis indicates that some established protected areas are located in regions with relatively low biodiversity and ES values, suggesting that there may be overprotection in non-critical locations. To address these gaps and maximize the protection effect, future planning must prioritize the large, well-connected CPA clusters identified here. It is of vital importance that the integration of ecological compensation mechanisms is crucial for combining strict ecological protection goals with the truly improved livelihoods of local communities, strengthening management, and ensuring the long-term sustainability of the protection work in this ecologically significant basin.

Author Contributions

Y.C.: Conceptualization, Methodology, Formal analysis, Visualization, Writing—original draft. J.Y.: Methodology, Formal analysis, Visualization, Writing—original draft, Software, Data curation. X.G.: Supervision, Conceptualization, Methodology, Writing—review & editing, Software, Project administration. L.P.: Writing—review & editing, Methodology, M.L.: Writing—review & editing. W.Z.: Visualization, Writing—original draft. N.X.: Supervision, Conceptualization, Methodology, Project administration. All authors have read and agreed to the published version of the manuscript.

Funding

This work was supported financially by the Basic Research Fund for Free Exploration (2025YSKY-41).

Data Availability Statement

The data supporting this study’s findings can be obtained from the corresponding authors upon reasonable request.

Conflicts of Interest

There are no conflicts of interest to declare.

References

  1. Loreau, M.; Cardinale, B.J.; Isbell, F.; Newbold, T.; O’Connor, M.I.; De Mazancourt, C. Do not downplay biodiversity loss. Nature 2022, 601, E27–E28. [Google Scholar] [CrossRef]
  2. Mahecha, M.D.; Bastos, A.; Bohn, F.J.; Eisenhauer, N.; Feilhauer, H.; Hartmann, H.; Hickler, T.; Kalesse-Los, H.; Migliavacca, M.; Otto, F.E.L.; et al. Biodiversity loss and climate extremes—Study the feedbacks. Nature 2022, 612, 30–32. [Google Scholar] [CrossRef]
  3. Hirata, A.; Ohashi, H.; Hasegawa, T.; Fujimori, S.; Takahashi, K.; Tsuchiya, K.; Matsui, T. The choice of land-based climate change mitigation measures influences future global biodiversity loss. Commun. Earth Environ. 2024, 5, 259. [Google Scholar] [CrossRef]
  4. Jaureguiberry, P.; Titeux, N.; Wiemers, M.; Bowler, D.E.; Coscieme, L.; Golden, A.S.; Guerra, C.A.; Jacob, U.; Takahashi, Y.; Settele, J.; et al. The direct drivers of recent global anthropogenic biodiversity loss. Sci. Adv. 2022, 8, eabm9982. [Google Scholar] [CrossRef]
  5. Sachs, J.D.; Baillie, J.E.M.; Sutherland, W.J.; Armsworth, P.R.; Ash, N.; Beddington, J.; Blackburn, T.M.; Collen, B.; Gardiner, B.; Gaston, K.J.; et al. Biodiversity Conservation and the Millennium Development Goals. Science 2009, 325, 1502–1503. [Google Scholar] [CrossRef] [PubMed]
  6. Langhammer, P.F.; Bull, J.W.; Bicknell, J.E.; Oakley, J.L.; Brown, M.H.; Bruford, M.W.; Butchart, S.H.M.; Carr, J.A.; Church, D.; Cooney, R.; et al. The positive impact of conservation action. Science 2024, 384, 453–458. [Google Scholar] [CrossRef] [PubMed]
  7. Obura, D.O.; Katerere, Y.; Mayet, M.; Kaelo, D.; Msweli, S.; Mather, K.; Harris, J.; Louis, M.; Kramer, R.; Teferi, T.; et al. Integrate biodiversity targets from local to global levels. Science 2021, 373, 746–748. [Google Scholar] [CrossRef]
  8. O’Connor, L.M.J.; Pollock, L.J.; Renaud, J.; Verhagen, W.; Verburg, P.H.; Lavorel, S.; Maiorano, L.; Thuiller, W. Balancing conservation priorities for nature and for people in Europe. Science 2021, 372, 856–860. [Google Scholar] [CrossRef]
  9. Li, G.; Fang, C.; Watson, J.E.M.; Sun, S.; Qi, W.; Wang, Z.; Liu, J. Mixed effectiveness of global protected areas in resisting habitat loss. Nat. Commun. 2024, 15, 8389. [Google Scholar] [CrossRef]
  10. Newbold, T.; Hudson, L.N.; Hill, S.L.L.; Contu, S.; Lysenko, I.; Senior, R.A.; Börger, L.; Bennett, D.J.; Choimes, A.; Collen, B.; et al. Global effects of land use on local terrestrial biodiversity. Nature 2015, 520, 45–50. [Google Scholar] [CrossRef]
  11. Senior, R.A.; Bagwyn, R.; Leng, D.; Killion, A.K.; Jetz, W.; Wilcove, D.S. Global shortfalls in documented actions to conserve biodiversity. Nature 2024, 630, 387–391. [Google Scholar] [CrossRef]
  12. Bell-James, J.; Foster, R.; Shumway, N.; Lovelock, C.E.; Villarreal-Rosas, J.; Brown, C.J.; Andradi-Brown, D.A.; Saunders, M.I.; Waltham, N.J.; Fitzsimons, J.A. The Global Biodiversity Framework’s ecosystem restoration target requires more clarity and careful legal interpretation. Nat. Ecol. Evol. 2024, 8, 840–841. [Google Scholar] [CrossRef]
  13. Díaz, S.; Zafra-Calvo, N.; Purvis, A.; Verburg, P.H.; Obura, D.; Leadley, P.; Chaplin-Kramer, R.; De Meester, L.; Dulloo, E.; Martín-López, B.; et al. Set ambitious goals for biodiversity and sustainability. Science 2020, 370, 411–413. [Google Scholar] [CrossRef]
  14. Bhola, N.; Klimmek, H.; Kingston, N.; Burgess, N.D.; Van Soesbergen, A.; Corrigan, C.; Harrison, J.; Kok, M.T.J. Perspectives on area-based conservation and its meaning for future biodiversity policy. Conserv. Biol. 2021, 35, 168–178. [Google Scholar] [CrossRef]
  15. Qin, Y.W.; Xiao, X.M.; Liu, F.; Silva, F.D.E.; Shimabukuro, Y.; Arai, E.; Fearnside, P.M. Forest conservation in Indigenous territories and protected areas in the Brazilian Amazon. Nat. Sustain. 2023, 6, 295–305. [Google Scholar] [CrossRef]
  16. Wolf, C.; Levi, T.; Ripple, W.J.; Zárrate-Charry, D.A.; Betts, M.G. A forest loss report card for the world’s protected areas. Nat. Ecol. Evol. 2021, 5, 520–529. [Google Scholar] [CrossRef]
  17. Yang, S.; Yang, E.; Zhao, C.; Luo, G.; Ran, C.; Zhang, S.; Xiong, L.; Liao, J.; Du, C.; Li, Z.; et al. How to identify karst priority ecological reserves. Eco. Front. 2024, 44, 1280–1290. [Google Scholar] [CrossRef]
  18. Ouyang, Z.; Zheng, H.; Xiao, Y.; Polasky, S.; Liu, J.; Xu, W.; Wang, Q.; Zhang, L.; Xiao, Y.; Rao, E.M.; et al. Improvements in ecosystem services from investments in natural capital. Science 2016, 352, 1455–1459. [Google Scholar] [CrossRef] [PubMed]
  19. Yin, L.; Dai, E.; Guan, M.; Zhang, B. A novel approach for the identification of conservation priority areas in mountainous regions based on balancing multiple ecosystem services—A case study in the Hengduan Mountain region. Glob. Ecol. Conserv. 2022, 38, e02195. [Google Scholar] [CrossRef]
  20. Huang, Z.D.; Bai, Y.; Alatalo, J.M.; Yang, Z.Q. Mapping biodiversity conservation priorities for protected areas: A case study in Xishuangbanna Tropical Area, China. Biol. Conserv. 2020, 249, 108741. [Google Scholar] [CrossRef]
  21. Yuan, Q.; Li, R. Priority conservation zoning for future karst areas based on the construction of a multi-perspective ecological security pattern. Ecol. Indic. 2025, 178, 113941. [Google Scholar] [CrossRef]
  22. Ji, J.Q.; Yu, Y.; Zhang, Z.C.; Hua, T.; Zhu, Y.P.; Zhao, H.T. Notable conservation gaps for biodiversity, ecosystem services and climate change adaptation on the Tibetan Plateau, China. Sci. Total Environ. 2023, 895, 165032. [Google Scholar] [CrossRef] [PubMed]
  23. Chan, K.M.A.; Hoshizaki, L.; Klinkenberg, B.; Merenlender, A.M. Ecosystem Services in Conservation Planning: Targeted Benefits vs. Co-Benefits or Costs? PLoS ONE 2011, 6, e24378. [Google Scholar] [CrossRef] [PubMed]
  24. Pollock, L.J.; Thuiller, W.; Jetz, W. Large conservation gains possible for global biodiversity facets. Nature 2017, 546, 141–144. [Google Scholar] [CrossRef] [PubMed]
  25. Abolmaali, S.M.-R.; Tarkesh, M.; Mousavi, S.A.; Karimzadeh, H.; Pourmanafi, S.; Fakheran, S. Identifying priority areas for conservation: Using ecosystem services hotspot mapping for land-use/land-cover planning in central of Iran. Environ. Manag. 2024, 73, 1016–1031. [Google Scholar] [CrossRef]
  26. Saura, S.; Bertzky, B.; Bastin, L.; Battistella, L.; Mandrici, A.; Dubois, G. Global trends in protected area connectivity from 2010 to 2018. Biol. Conserv. 2019, 238, 108183. [Google Scholar] [CrossRef]
  27. Zeng, S.; Jiang, C.; Bai, Y.; Wang, H.; Liu, E.; Guo, L.; Chen, S.; Zhang, J. Understanding scale effects and differentiation mechanisms of ecosystem services tradeoffs and synergies relationship: A case study of the Lishui River Basin, China. Ecol. Indic. 2024, 167, 112648. [Google Scholar] [CrossRef]
  28. Yang, J.Y.; Li, J.S.; Fu, G.; Liu, B.; Pan, L.B.; Hao, H.J.; Guan, X. Spatial and Temporal Patterns of Ecosystem Services and Trade-Offs/Synergies in Wujiang River Basin, China. Remote Sens. 2023, 15, 4099. [Google Scholar] [CrossRef]
  29. Yang, J.Y.; Guan, X.; LI, J.S.; Liu, J.J.; Hao, H.J.; Wang, H.R. Spatial patterns and interrelationships between biodiversity and ecosystem services in the Wujiang River Basin. Biodivers. Sci. 2023, 31, 132–141. [Google Scholar] [CrossRef]
  30. Ramirez-Villegas, J.; Cuesta, F.; Devenish, C.; Peralvo, M.; Jarvis, A.; Arnillas, C.A. Using species distributions models for designing conservation strategies of Tropical Andean biodiversity under climate change. J. Nat. Conserv. 2014, 22, 391–404. [Google Scholar] [CrossRef]
  31. Fick, S.E.; Hijmans, R.J. WorldClim 2: New 1-Km Spatial Resolution Climate Surfaces for Global Land Areas. Int. J. Climatol. 2017, 37, 4302–4315. [Google Scholar] [CrossRef]
  32. Li, G.; Xiao, N.W.; Luo, Z.L.; Liu, D.M.; Zhao, Z.P.; Guan, X.; Zang, C.X.; Li, J.S.; Shen, Z.H. Identifying conservation priority areas for gymnosperm species under climate changes in China. Biol. Conserv. 2021, 253, 108914. [Google Scholar] [CrossRef]
  33. Steven, J.P.; Robert, P.A.; Robert, E.S. Maximum entropy modeling of species geographic distributions. Ecol. Model 2006, 190, 231–259. [Google Scholar]
  34. Zhao, Z.Y.; Xiao, N.W.; Shen, M.; Li, J.S. Comparison between optimized MaxEnt and random forest modeling in predicting potential distribution: A case study with Quasipaa boulengeri in China. Sci. Total Environ. 2022, 842, 156867. [Google Scholar] [CrossRef] [PubMed]
  35. Lehtomäki, J.; Moilanen, A. Methods and workflow for spatial conservation prioritization using Zonation. Environ. Modell. Softw. 2013, 47, 128–137. [Google Scholar] [CrossRef]
  36. Huang, Q.; Peng, L.; Huang, K.X.; Deng, W.; Liu, Y. Generalized Additive Model Reveals Nonlinear Trade-Offs/Synergies between Relationships of Ecosystem Services for Mountainous Areas of Southwest China. Remote Sens. 2022, 14, 2733. [Google Scholar] [CrossRef]
  37. Yang, J.Y.; Li, J.S.; Guan, X.; Chen, Y.J.; Zhang, Z.M.; Li, W.J. Anthropogenic activities have accelerated the restoration of carbon sequestration services in the upper Yellow River. Ecol. Eng. 2024, 207, 107355. [Google Scholar] [CrossRef]
  38. Wang, Y.; Ye, A.; Peng, D.; Miao, C.; Di, Z.; Gong, W. Spatiotemporal variations in water conservation function of the Tibetan Plateau under climate change based on InVEST model. J. Hydrol. Reg. Stud. 2022, 41, 101064. [Google Scholar] [CrossRef]
  39. Jian, Z.; Sun, Y.; Wang, F.; Zhou, C.; Pan, F.; Meng, W.; Sui, M. Soil conservation ecosystem service supply-demand and multi scenario simulation in the Loess Plateau, China. Glob. Ecol. Conserv. 2024, 49, e02796. [Google Scholar] [CrossRef]
  40. Shen, J.S.; Li, S.C.; Liang, Z.; Liu, L.B.; Li, D.L.; Wu, S.Y. Exploring the heterogeneity and nonlinearity of trade-offs and synergies among ecosystem services bundles in the Beijing-Tianjin-Hebei urban agglomeration. Ecosyst. Serv. 2020, 43, 101103. [Google Scholar] [CrossRef]
  41. Li, Y.J.; Zhang, L.W.; Yan, J.P.; Wang, P.T.; Hu, N.K.; Cheng, W.; Fu, B.J. Mapping the hotspots and coldspots of ecosystem services in conservation priority setting. J. Geogr. Sci. 2017, 27, 681–696. [Google Scholar] [CrossRef]
  42. Yue, X.P.; Liu, W.; Wang, X.W.; Yang, J.T.; Lan, Y.X.; Zhu, Z.P.; Yao, X. Constructing an urban heat network to mitigate the urban heat island effect from a connectivity perspective. Sustain. Cities Soc. 2024, 114, 105774. [Google Scholar] [CrossRef]
  43. Sun, W.; Zhang, E.; Zhao, Y.; Wu, Z.S.; Chen, W.H.; Wang, Y.; Bai, Y.F. Conservation priority corridors enhance the effectiveness of protected area networks in China. Commun. Earth Environ. 2025, 6, 275. [Google Scholar] [CrossRef]
  44. Tang, X.L.; Zhao, X.; Bai, Y.F.; Tang, Z.Y.; Wang, W.T.; Zhao, Y.C.; Wan, H.W.; Xie, Z.Q.; Shi, X.Z.; Wu, B.F.; et al. Carbon pools in China’s terrestrial ecosystems: New estimates based on an intensive field survey. Proc. Natl. Acad. Sci. USA 2018, 115, 4021–4026. [Google Scholar] [CrossRef] [PubMed]
  45. Wu, X.; Shi, W.J.; Tao, F.L. Estimations of forest water retention across China from an observation site-scale to a national-scale. Ecol. Indic. 2021, 132, 108274. [Google Scholar] [CrossRef]
  46. Hu, L.; Li, Q.; Yan, J.H.; Liu, C.; Zhong, J.X. Vegetation restoration facilitates belowground microbial network complexity and recalcitrant soil organic carbon storage in southwest China karst region. Sci. Total Environ. 2022, 820, 153137. [Google Scholar] [CrossRef]
  47. Paul, C.; Hanley, N.; Meyer, S.T.; Fürst, C.; Weisser, W.W.; Knoke, T. On the functional relationship between biodiversity and economic value. Sci. Adv. 2020, 6, eaax7712. [Google Scholar] [CrossRef]
  48. Adler, P.B.; Seabloom, E.W.; Borer, E.T.; Hillebrand, H.; Hautier, Y.; Hector, A.; Harpole, W.S.; O’Halloran, L.R.; Grace, J.B.; Anderson, T.M.; et al. Productivity Is a Poor Predictor of Plant Species Richness. Science 2011, 333, 1750–1753. [Google Scholar] [CrossRef]
  49. Chen, S.F.; Xie, L.; Zhou, W.L.; Chen, H.; Xu, X.J.; Jiang, S.; Zang, M.Y.; Peng, Y.; Chen, X.; Duan, Y.F.; et al. Species Diversity Has a Positive Interrelationship with Aboveground Biomass and a Mismatch with Productivity in a Subtropical Broadleaf Forest on the Wuyi Mountains, China. Diversity 2022, 14, 952. [Google Scholar] [CrossRef]
  50. Wallis, C.I.B.; Crofts, A.L.; Inamdar, D.; Arroyo-Mora, J.P.; Kalacska, M.; Laliberte, E.; Vellend, M. Remotely sensed carbon content: The role of tree composition and tree diversity. Remote Sens. Environ. 2023, 284, 113333. [Google Scholar] [CrossRef]
  51. Tilman, D.; Isbell, F.; Cowles, J.M. Biodiversity and ecosystem functioning. Annu. Rev. Ecol. Evol. Syst. 2014, 45, 471–493. [Google Scholar] [CrossRef]
  52. Loreau, M.; Naeem, S.; Inchausti, P.; Bengtsson, J.; Grime, J.P.; Hector, A.; Hooper, D.U.; Huston, M.A.; Raffaelli, D.; Schmid, B.; et al. Ecology-Biodiversity and ecosystem functioning: Current knowledge and future challenges. Science 2001, 294, 804–808. [Google Scholar] [CrossRef] [PubMed]
  53. Tang, B.T.; Lü, Y.H.; Wang, H. Identifying conservation priority areas of ecosystem services by simulating preference scenarios. Ecol. Front. 2025, 45, 1613–1624. [Google Scholar] [CrossRef]
  54. Chen, Y.M.; Xu, E.Q. New indicators for delineating priority regions for ecosystem conservation based on the criterion of cost-effectiveness. Ecol. Indic. 2022, 145, 109732. [Google Scholar] [CrossRef]
  55. Marco, M.D.; Ferrier, S.; Harwood, T.D.; Hoskins, A.J.; Watson, J.E.M. Wilderness areas halve the extinction risk of terrestrial biodiversity. Nature 2019, 573, 582–585. [Google Scholar] [CrossRef]
  56. Zhu, L.; Hughes, A.C.; Zhao, X.Q.; Zhou, L.J.; Ma, K.P.; Shen, X.L.; Li, S.; Liu, M.Z.; Xu, W.B.; Watson, J.E.M. Regional scalable priorities for national biodiversity and carbon conservation planning in Asia. Sci. Adv. 2021, 7, eabe4261. [Google Scholar] [CrossRef]
  57. Liu, Y.Z.; Wang, J.C.; Wu, Z.N.; Li, S.Q.; Dai, W.Y. Identification of biodiversity priority conservation areas in China by integrating genetic, species and ecosystem diversity. Biol. Conserv. 2024, 300, 110854. [Google Scholar] [CrossRef]
  58. Sun, W.; Zhao, Y.; Chen, W.; Bai, Y.F. Current national nature reserves are insufficient to safeguard the long-term survival of birds and mammals in China. Commun. Earth Environ. 2024, 5, 304. [Google Scholar] [CrossRef]
  59. Xu, X.B.; Jiang, B.; Chen, M.K.; Bai, Y.; Yang, G.S. Strengthening the effectiveness of nature reserves in representing ecosystem services: The Yangtze River Economic Belt in China. Land Use Policy 2020, 96, 8. [Google Scholar] [CrossRef]
  60. Petza, D.; Anastopoulos, P.; Katsanevakis, S. Contribution of area-based fisheries management measures to fisheries sustainability and marine conservation: A global scoping review. Rev. Fish Biol. Fish. 2023, 33, 1049–1073. [Google Scholar] [CrossRef]
  61. Hoesen, J.; Bagshaw, D.; Elliott, J.; Haas, C.A.; Kelly, J.; Lazaruk, H.; MacKinnon, D.; Lemieux, C.J. Assessing the effectiveness of potential protected areas and OECMs in conserving biodiversity against subsurface resource extraction impacts. Biol. Conserv. 2023, 283, 110134. [Google Scholar] [CrossRef]
  62. Ben, P.; Malvika, O.; Andrew, B.; Rhys, E. Reconciling Food Production and Biodiversity Conservation: Land Sharing and Land Sparing Compared. Science 2011, 333, 1289–1291. [Google Scholar] [CrossRef]
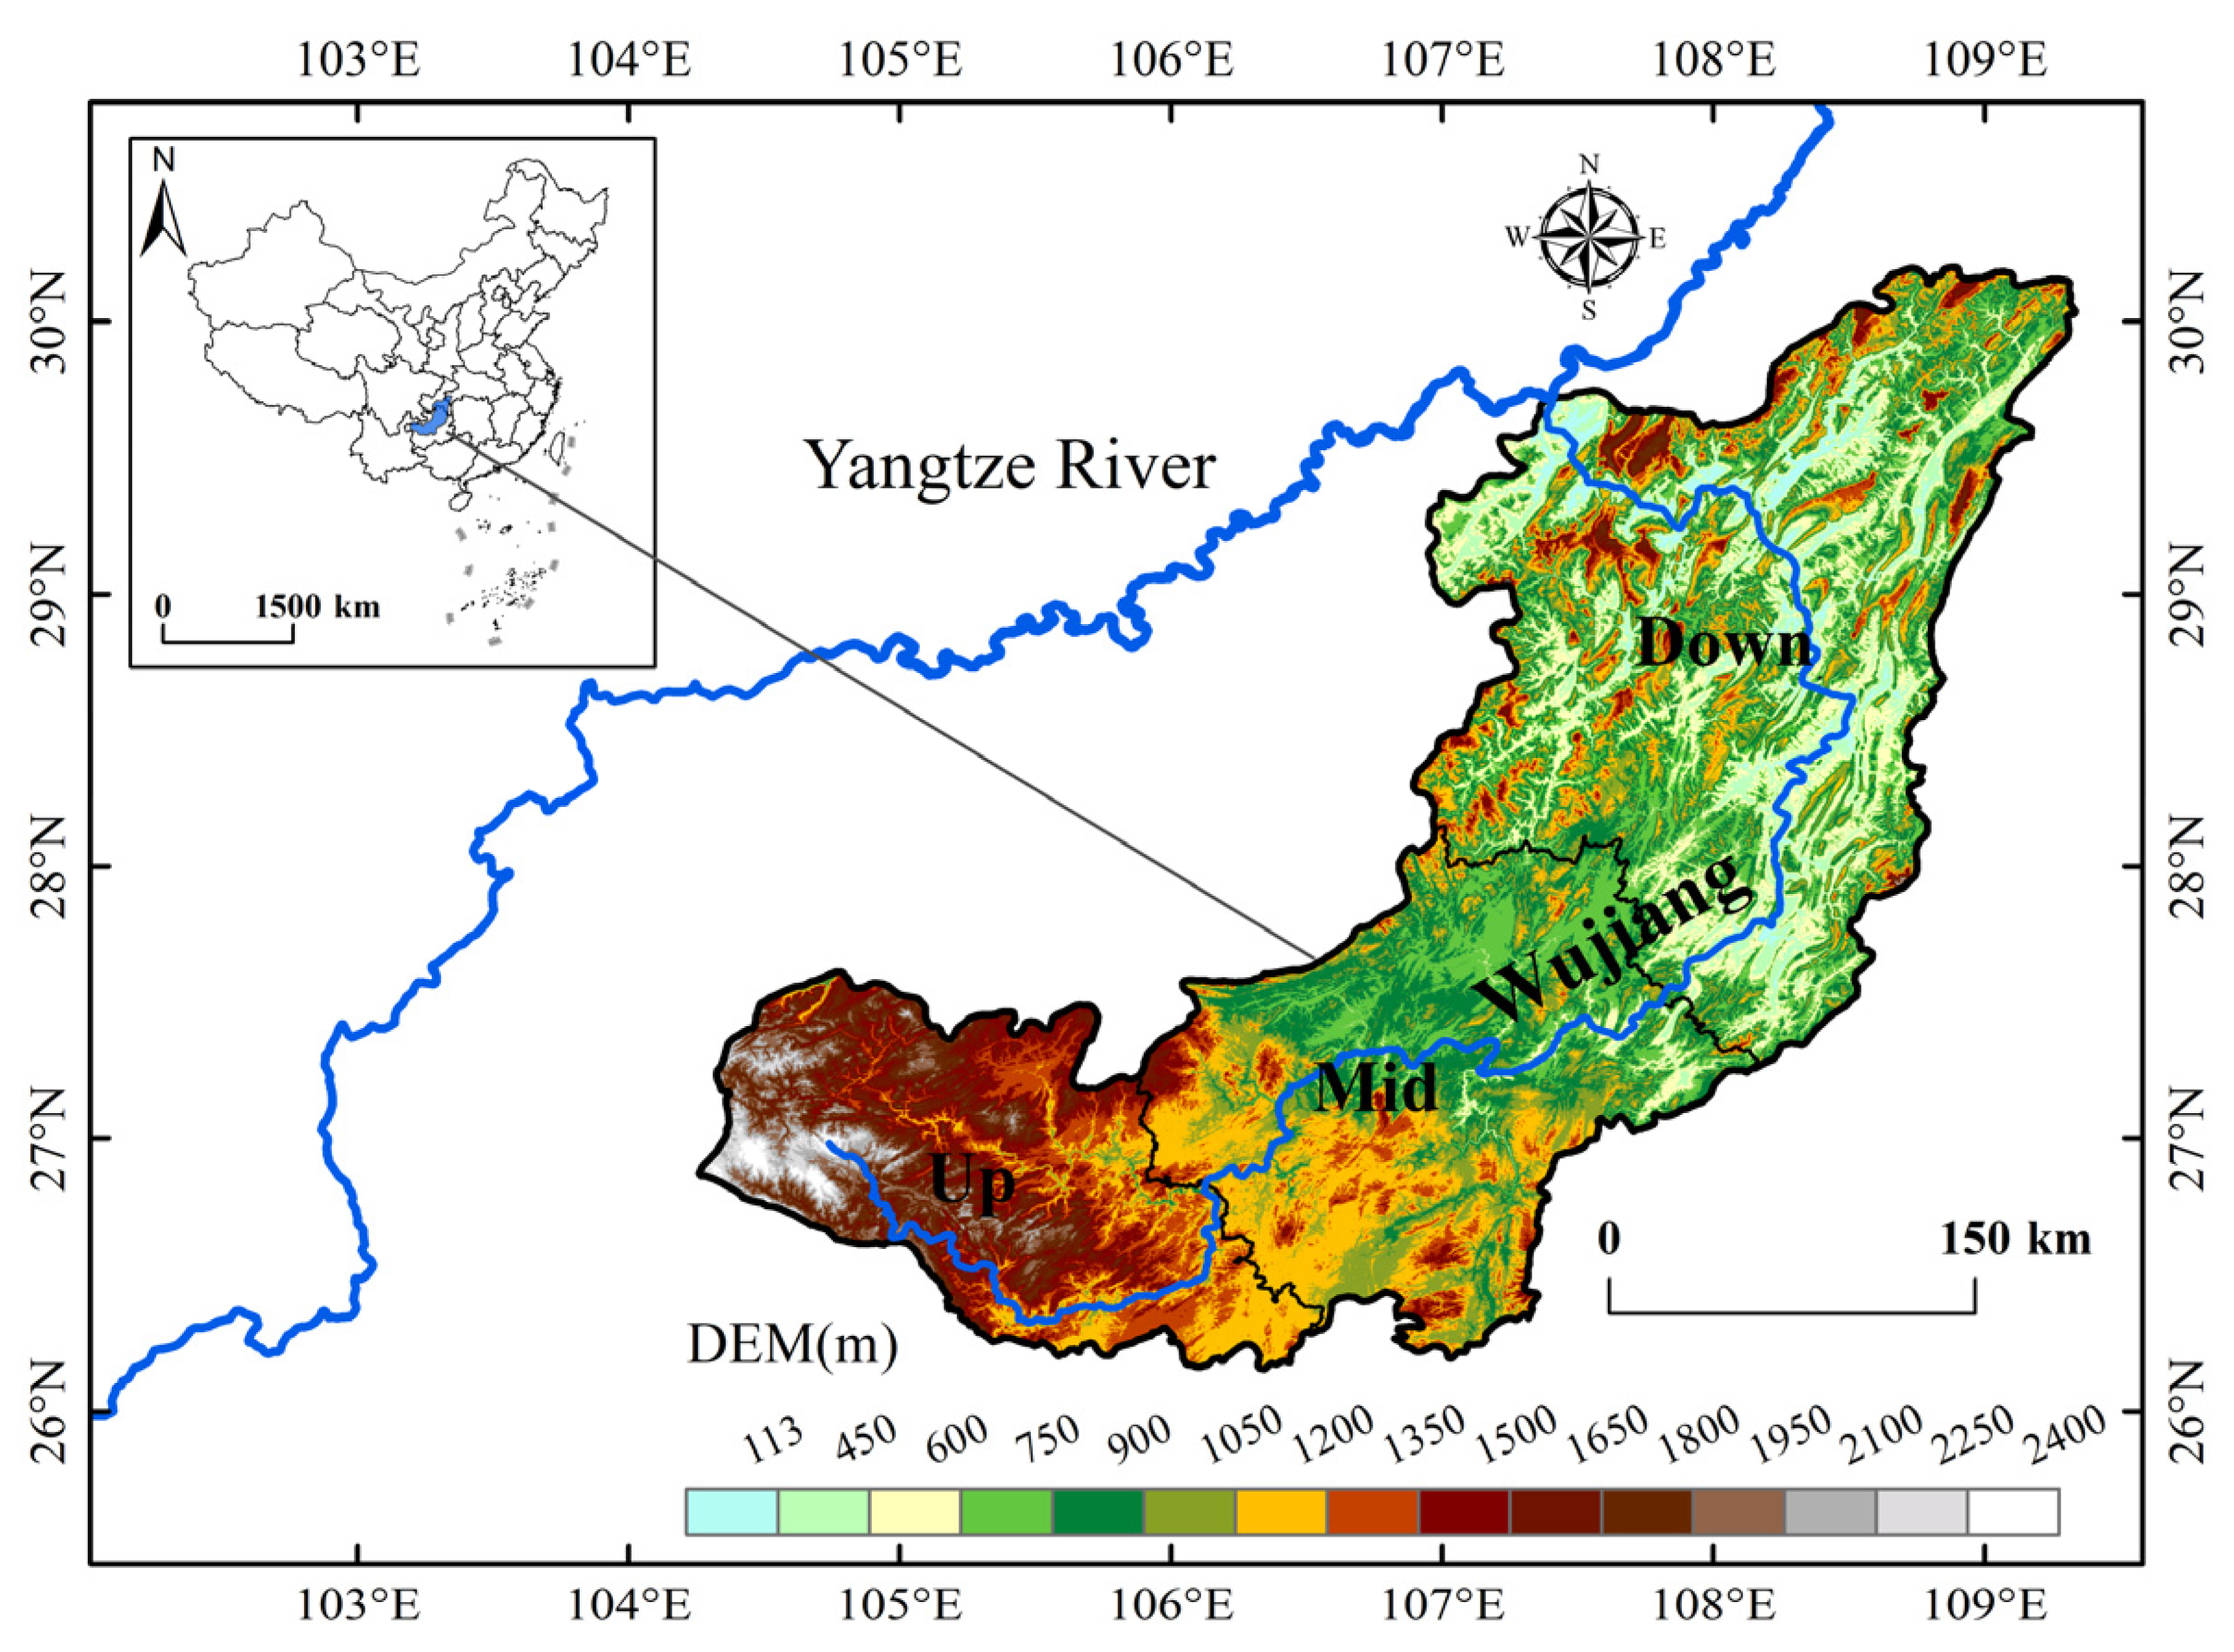
Figure 1. Location of the study area. The different colors in the picture represent different Digital Elevation Model (DEM). Map projection: CGCS2000/3-degree Gauss-Kruger CM 111° E (EPSG:4547). (Map created with ArcGIS Pro version 3.1.0, https://www.esri.com/en-us/arcgis/products/arcgis-pro/overview, accessed on 1 April 2024).
Land 14 02335 g001
Figure 2. Technical Roadmap.
Land 14 02335 g002
Figure 3. Spatial patterns of biodiversity in the Wujiang River Basin. (a) Species AUC values; (b) Biodiversity (Bio) spatial pattern (color gradient indicates biodiversity level, with blue representing high and red representing low); (c) Observed species distribution patterns. (Map created with ArcGIS Pro version 3.1.0, https://www.esri.com/en-us/arcgis/products/arcgis-pro/overview).
Land 14 02335 g003
Figure 4. Results of ecosystem services assessment. (a) water supply (WS); (b) water conservation (WC); (c) carbon sequestration (CS); (d) soil conservation (SC); (e) habitat quality (HQ); (f) the sum of the individual ecosystem services treated with Equation (1). (Map created with ArcGIS Pro version 3.1.0, https://www.esri.com/en-us/arcgis/products/arcgis-pro/overview).
Land 14 02335 g004
Figure 5. Spearman Correlation coefficient between biodiversity (BIO) and Ecosystem Services (ESs). water supply (WS); water conservation (WC); carbon sequestration (CS); soil conservation (SC); habitat quality (HQ). (Created with R version 4.3.1, https://www.r-project.org/, using the ggplot2 package version 3.4.4, https://ggplot2.tidyverse.org).
Land 14 02335 g005
Figure 6. Core areas of biodiversity and ESs in the Wujiang River Basin (WJRB). (a) Spatial distribution of biodiversity cold spots (blue), hot spots (red) and not significant (gray); (b) Spatial distribution of Ecosystem Service (ES) cold spots (blue) hot spots (red) and not significant (gray); (c) Results of MSPA of biodiversity; (d) Results of MSPA of ESs. (Map created with ArcGIS Pro version 3.1.0, https://www.esri.com/en-us/arcgis/products/arcgis-pro/overview).
Land 14 02335 g006
Figure 7. Conservation priority areas (CPAs) and protection gaps in the Wujiang River Basin (WJRB). (a) Composition of different CPA types. ES&Bio: areas with both ecosystem service and biodiversity conservation priorities; Bio: areas with biodiversity conservation priorities only; ES: areas with ecosystem service conservation priorities only; Specie: flagship species conservation areas. (b) Spatial distribution of CPAs and existing nature reserves (NRs). (Map created with ArcGIS Pro version 3.1.0, https://www.esri.com/en-us/arcgis/products/arcgis-pro/overview).
Land 14 02335 g007
Table 1. Biodiversity assessment utilization data.
Data TypeSpecific Data FactorsData Source
Bioclimatic dataAnnual mean temperature (Bio1)Derived from the WorldClim global climate database [31] (https://worldclim.org/, accessed on 1 March 2024)
Mean diurnal temperature range (Bio2)
Isothermality (Bio3)
Temperature seasonality (Bio4)
Maximum temperature of warmest month (Bio5)
Minimum temperature of coldest month (Bio6)
Temperature annual range (Bio7)
Mean temperature of wettest quarter (Bio8)
Mean temperature of driest quarter (Bio9)
Mean temperature of warmest quarter (Bio10)
Mean temperature of coldest quarter (Bio11)
Annual precipitation (Bio12)
Precipitation of wettest month (Bio13)
Precipitation of driest month (Bio14)
Precipitation seasonality (Bio15)
Precipitation of wettest quarter (Bio16)
Precipitation of driest quarter (Bio17)
Precipitation of warmest quarter (Bio18)
Precipitation of coldest quarter (Bio19)
topographic dataelevationDerived from geospatial data cloud (www.gscloud.cn/, accessed on 1 March 2024)
gradient
slope direction
soil datasoil organic matterDerived from the National Tibetan Plateau Science Data Center (https://data.tpdc.ac.cn/, accessed on 1 March 2024)
soil pH
soil texture
Table 2. Statistical values of Ecosystem Services (ESs) in the Upstream, Midstream, and downstream of the Wujiang River Basin (WJRB).
Provisioning ServicesRegulating ServicesSupporting Services
water supplycarbon sequestrationwater conservation soil conservationhabitat quality
mean (mm)total (108 m3)mean (Mg/hm2)total (Tg)mean (mm)total (108 m3)mean (t/hm2)total (108 t)mean
Up709.85137.94127.30247.41146.1328.37329.246.400.63
Mid741.94187.51129.74328.00203.0651.28272.426.880.66
Down896.37386.86134.00578.40279.42120.52509.2121.980.72
Total810.57712.31131.301153.81227.98200.18401.3035.260.68
Disclaimer/Publisher’s Note: The statements, opinions and data contained in all publications are solely those of the individual author(s) and contributor(s) and not of MDPI and/or the editor(s). MDPI and/or the editor(s) disclaim responsibility for any injury to people or property resulting from any ideas, methods, instructions or products referred to in the content.