Article

Thermal Environment Characteristics of Local Climate Zones Based on Summer Stage Subdivision: An Observational Study in Shenyang, China

1
Jangho Architecture College, Northeastern University, Shenyang 110169, China
2
The Architectural Design and Research Institute of HIT Co., Ltd., Harbin 150090, China
*
Author to whom correspondence should be addressed.
Land 2025, 14(12), 2332; https://doi.org/10.3390/land14122332
Submission received: 28 October 2025 / Revised: 23 November 2025 / Accepted: 25 November 2025 / Published: 27 November 2025

Abstract

Global warming and urbanization have exacerbated the urban heat island (UHI) effect, threatening human settlements and public health. Existing studies have primarily focused on analyzing urban thermal environment characteristics throughout the year or in specific seasons; however, research examining the urban thermal environment at different stages within a season is scarce. This study employed Local Climate Zone (LCZ) classification and focused on Shenyang, a representative city in China’s severe cold regions. Based on field measurements and multi-source meteorological data, we investigated the differences in thermal environment across seven LCZs throughout summer and at different summer stages. The result show that the UHI effect in Shenyang significantly intensified at nighttime and weakened during the daytime. Built-type LCZs 2 and 4 exhibited the highest nighttime urban heat island intensities (UHIIs), with maximum values of 7.6 °C and 5.4 °C, respectively. The duration of the daytime urban cold island effect in built-type LCZs increased significantly in mid-summer and late-summer. Land cover-type LCZ A exhibited the urban cold island effect only during the daytime throughout the summer. The UHII remained relatively stable across all LCZs during mid-summer. This study provides empirical support for developing targeted heat risk mitigation strategies for cities in severe cold regions.

1. Introduction

Urbanization and human activities are affecting the urban climate system [1,2,3,4]. As a typical climate phenomenon in the urbanization process, the urban heat island (UHI) effect has become a core issue in urban climatology research due to its formation mechanism and spatial differentiation law [5]. The UHI effect is primarily influenced by factors such as the high heat capacity and low albedo of urban surface materials (e.g., asphalt and concrete), anthropogenic heat emissions (e.g., transportation and air conditioning systems), and reduced vegetation cover [6,7]. This phenomenon not only increases energy consumption and carbon emissions but also threatens public health through heat stress, particularly in the context of global warming; its impact is becoming increasingly significant [8,9,10].
Traditionally, a binary urban–rural classification method has been used to quantify UHI by comparing the average temperature difference between urban and suburban areas. However, this classification method ignores the heterogeneity within cities. To address this problem, Stewart and Oke [11] proposed a Local Climate Zone (LCZ) system, which divides cities into 17 standardized types by integrating urban characteristic parameters such as land cover, urban structure, and urban materials. The temperature difference between each category and the LCZ D defines the heat island intensity, thus providing a general framework for urban climate research. The LCZ system effectively solves the ambiguity of traditional methods in site characteristic descriptions and promotes the comparability of global UHI research [12].
The key to studying the urban heat island effect is to obtain temperature data, which is mainly obtained through three methods: “mobile measurement”, “model simulation”, and “field measurement”. “Mobile measurement” usually refers to a method that uses a vehicle-mounted temperature measuring instrument to collect temperature data along the driving route. This method can obtain temperature data by flexibly adding measurement routes or locations [13,14]. It has the advantage of low cost, but can only obtain temperature data at specific moments and cannot capture temperature changes at a particular location over a continuous period. The “model simulation” method does not require field surveys. It only requires inputting various surface parameters to use climate model simulations to obtain long-term and large-scale temperature data [15,16,17,18,19]. However, precisely because of the large number of input parameters, the data processing of this method is relatively complicated, and its results are difficult to simulate under the actual situation of temperature changes [19]. Since the appropriate spatial scale of LCZ is usually between the microscale and mesoscale in meteorology [2], the climate models currently used include both small-scale models such as ENVI-met [20,21], TEB [22], MUKLIMO_3 [23,24], and UrbClim [25], as well as mesoscale models such as WRF [26,27,28]. The “field measurement” method involves collecting temperature data from fixed meteorological stations. The data obtained by this observation method have the advantages of authenticity, comprehensiveness, and visualization. It can accurately and long-term obtain temperature data at a specific location, which enables a more accurate understanding of the formation mechanism of the urban UHI effect [29]. Therefore, this study uses the “field measurement” method to obtain temperature data.
In recent years, a series of urban thermal environment studies on LCZs have been conducted in cities in various climate zones worldwide. The most commonly involved Köppen climate classes [30] include Csa (Madrid [31], Beirut [32], Adana [33]), Cfa (Londrina [34], Guangzhou [35,36,37], Nanjing [38,39], Tokyo [40]), Cfb (Dublin [41], Nancy [42], Berlin [43]), Cwa (Hong Kong [44]), and Bwh (Phoenix, Las Vegas [45]). However, relatively few studies have been conducted on the thermal environment of LCZs in the Dwa (Shenyang [46]) climate zone. The above climate zones all exhibit the following common phenomenon: stable meteorological conditions (e.g., calm wind and clear skies) at night are conducive to the formation of the UHI effect [32]. Each LCZ type exhibits significantly different heat island effects due to its unique underlying surface properties and spatial morphological characteristics [47,48], and the greater the difference in surface characteristics between the LCZs, the greater the difference in heat island intensity between them [42,49,50]. For example, the nighttime heat island intensity of compact built types (LCZ 1–3) is significantly higher than that of open built types (LCZ 4–6) or land cover types (such as LCZ A, B, and D) [38,43,51,52]. Despite the above general rules, the driving factors of the thermal environment in urban studies in different climate zones still show significant spatial heterogeneity [38,51,53]. For example, Unal Cilek and Cilek [33] noted that the dominant factor of UHI in the Csa climate is building materials, among which LCZ 10 is the zone with the highest temperature. Wang et al. [45] emphasized that the study of the Bwh climate also confirmed that LCZ 10 has the highest temperature, and emphasized that the impervious surface ratio is the key influencing factor. O’Malley and Kikumoto [40] emphasized that in Tokyo, which is located in the Cfa climate, building height significantly influences the development of UHI, with LCZ 2 being the hottest zone. Chen et al. [37] found that building density is an important driver of the UHI effect in Guangzhou, China, and that LCZ 2 is also the hottest zone. The above results indicate that the formation mechanism of the urban thermal environment exhibits regional specificity and surface morphological complexity.
Existing studies have mainly focused on analyzing the thermal environment characteristics of different LCZs throughout the year or in a single season [54,55]. Existing studies show a general pattern: regardless of the interannual, seasonal, monthly, and hourly scales, the temperature of built-type LCZs is generally higher than that of land cover-type LCZs, and the temperature difference in summer or winter is greater than in other seasons [56,57,58]. Specifically, the UHI at nighttime is generally stronger than that during the daytime [59], and the UHI of LCZs in summer and autumn is stronger than that in spring and winter [60]. It proves the applicability of the LCZ system in urban thermal environment research in arid, tropical, temperate, and other climate zones [61].
In summary, while significant progress has been made in urban thermal environment research across various climate zones, relatively little research has focused on the Dwa climate. Furthermore, existing studies have primarily focused on exploring the thermal environmental characteristics of different LCZs throughout the year or in specific seasons. However, research examining the thermal environmental patterns observed at different stages within a season remains lacking. Meanwhile, summers in severe cold regions are characterized by their short duration and rapid temperature increase, where sudden heatwaves can impose significant physiological stress on residents [62]. Thus, it is imperative to investigate the urban thermal environment in severe cold regions.
This study focused on Shenyang, a city in Northeast China with a severe cold-region climate. Field measurements were used to obtain summer temperature data for each LCZ in Shenyang. Based on this data, the city’s summer was divided into four summer stages (early-summer, mid-summer, peak-summer, and late-summer) to explore the characteristics of the city’s thermal environment during each period. This research can provide a scientific basis for developing refined, time-based summer thermal mitigation strategies for severe cold-region cities.

2. Materials and Methods

2.1. Study Area

As shown in Figure 1, Shenyang (123° E, 41° N), located in Liaoning Province, China, is a central city in Northeast China. The city has a total area of approximately 12,859.89 square kilometers, with a width of 115 km from east to west and a length of 205 km from north to south. Shenyang is located in the eastern part of the Liaohe Plain. The terrain is high in the east and low in the west, with an average altitude of 30 m to 50 m. The Hunhe River runs through the city, shaping terraced plains on both sides and forming an urban layout that is distributed along the north and south banks of the Hunhe River. In 2024, the permanent population of Shenyang was 9.204 million, and the urbanization rate was 85.12%, which is higher than the national average [63].
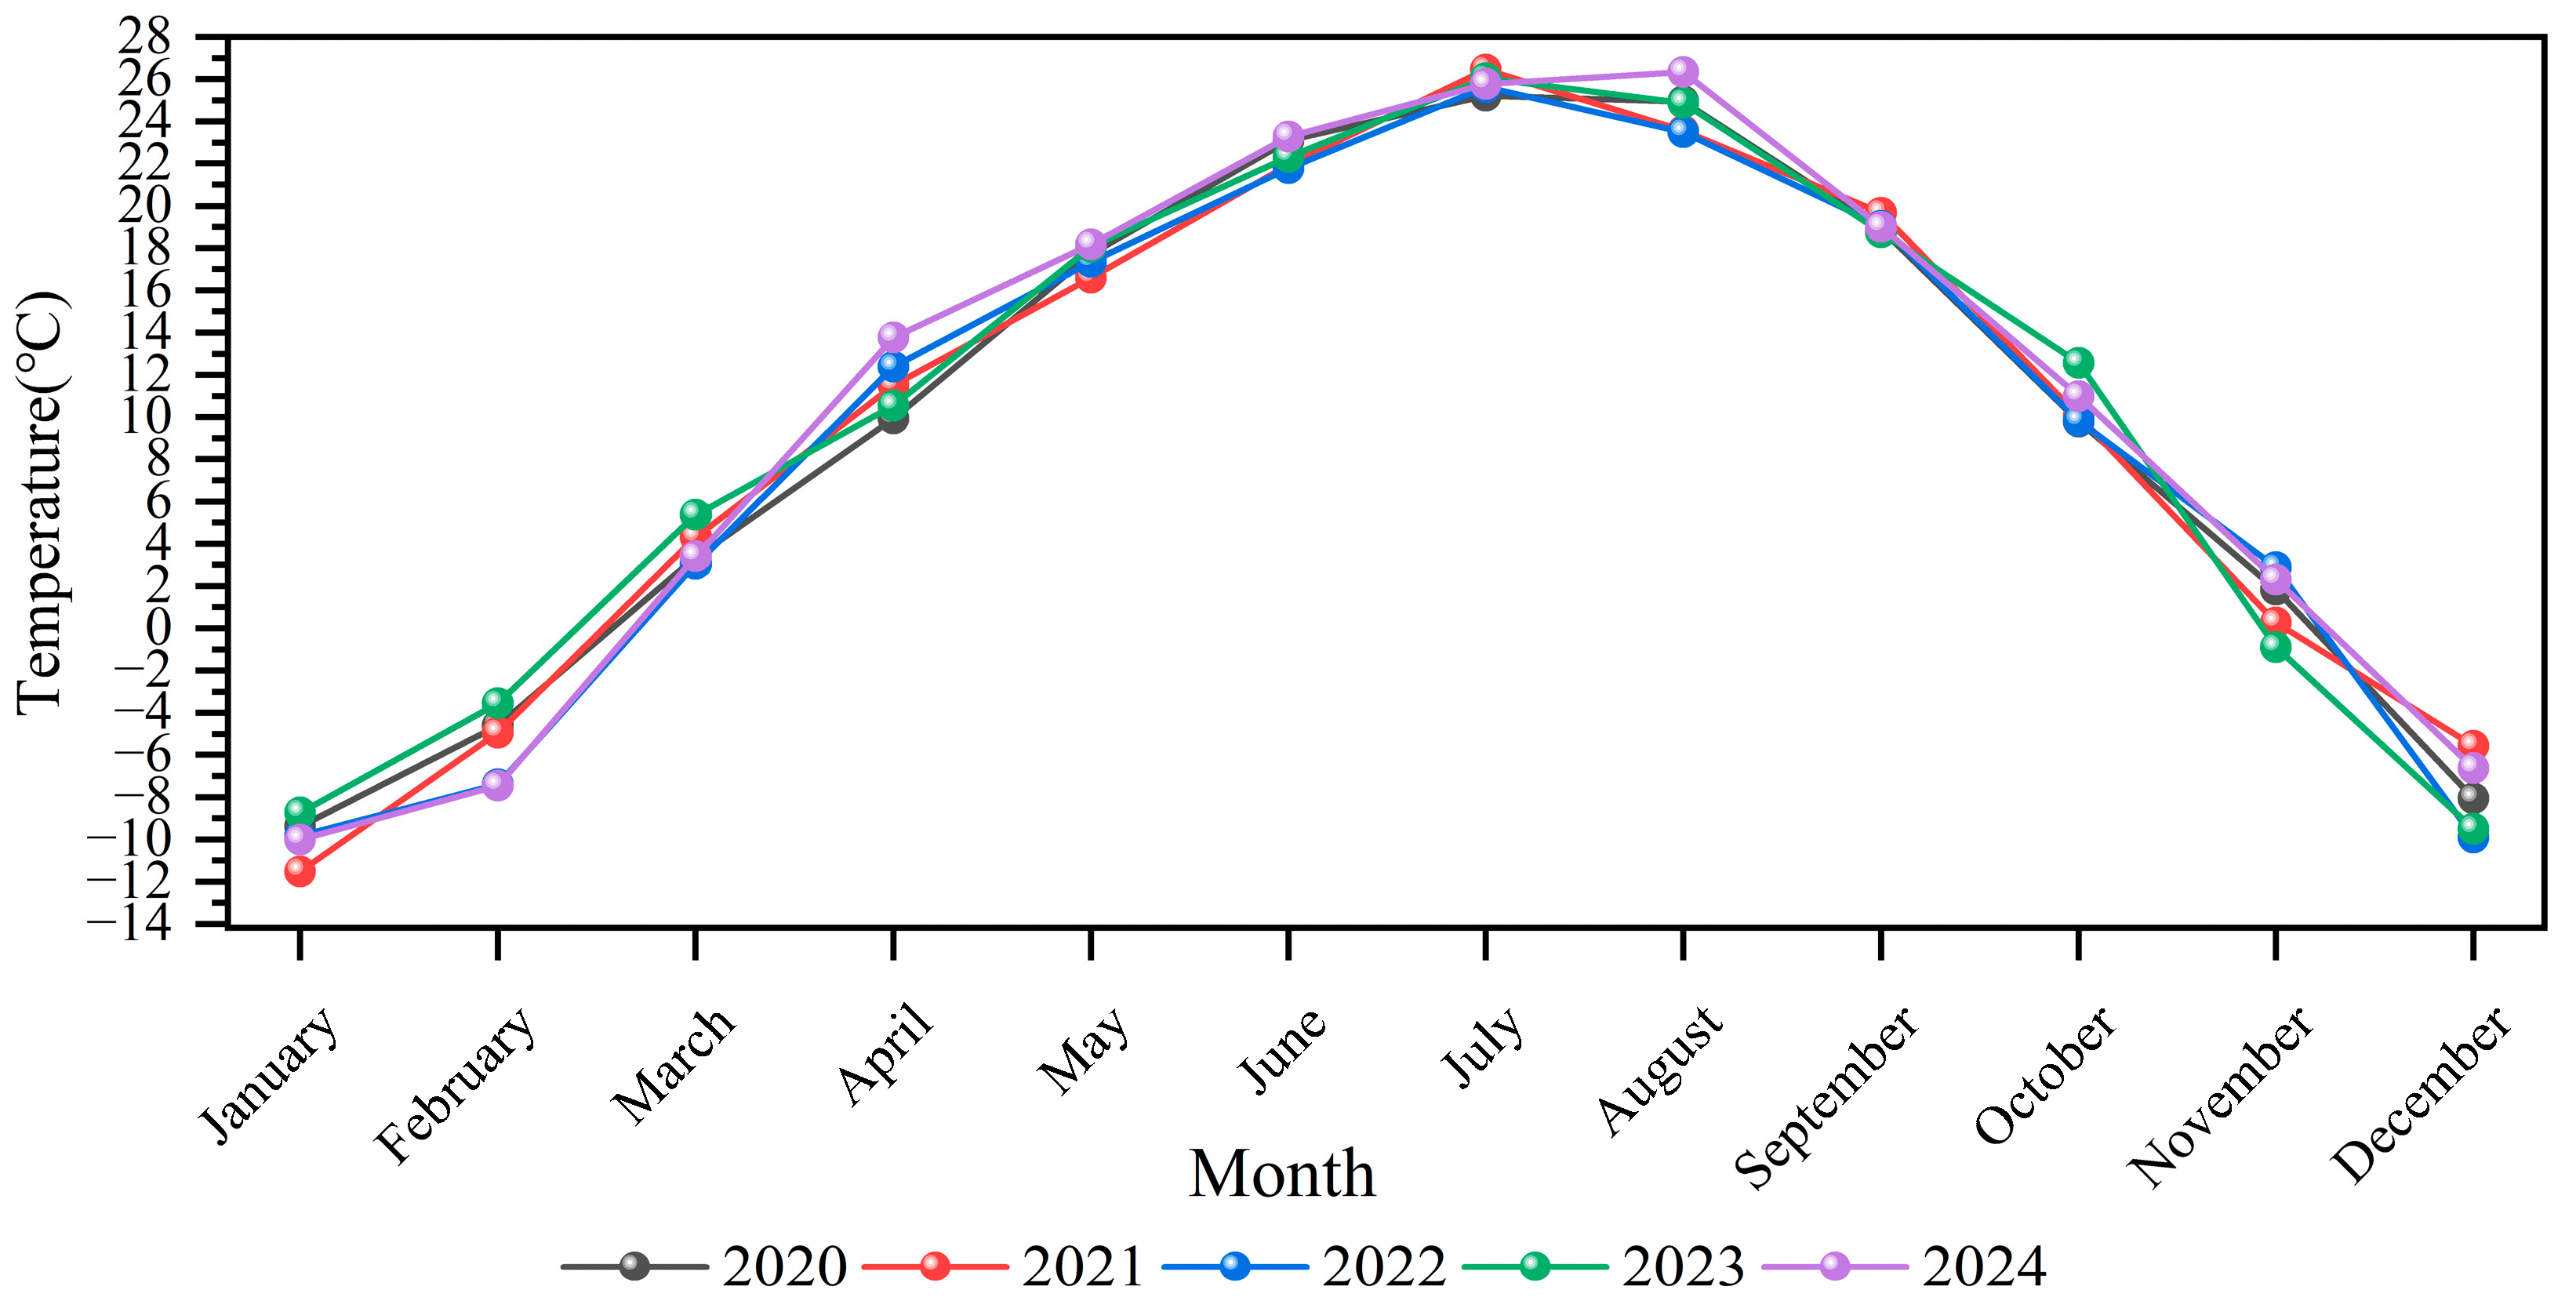
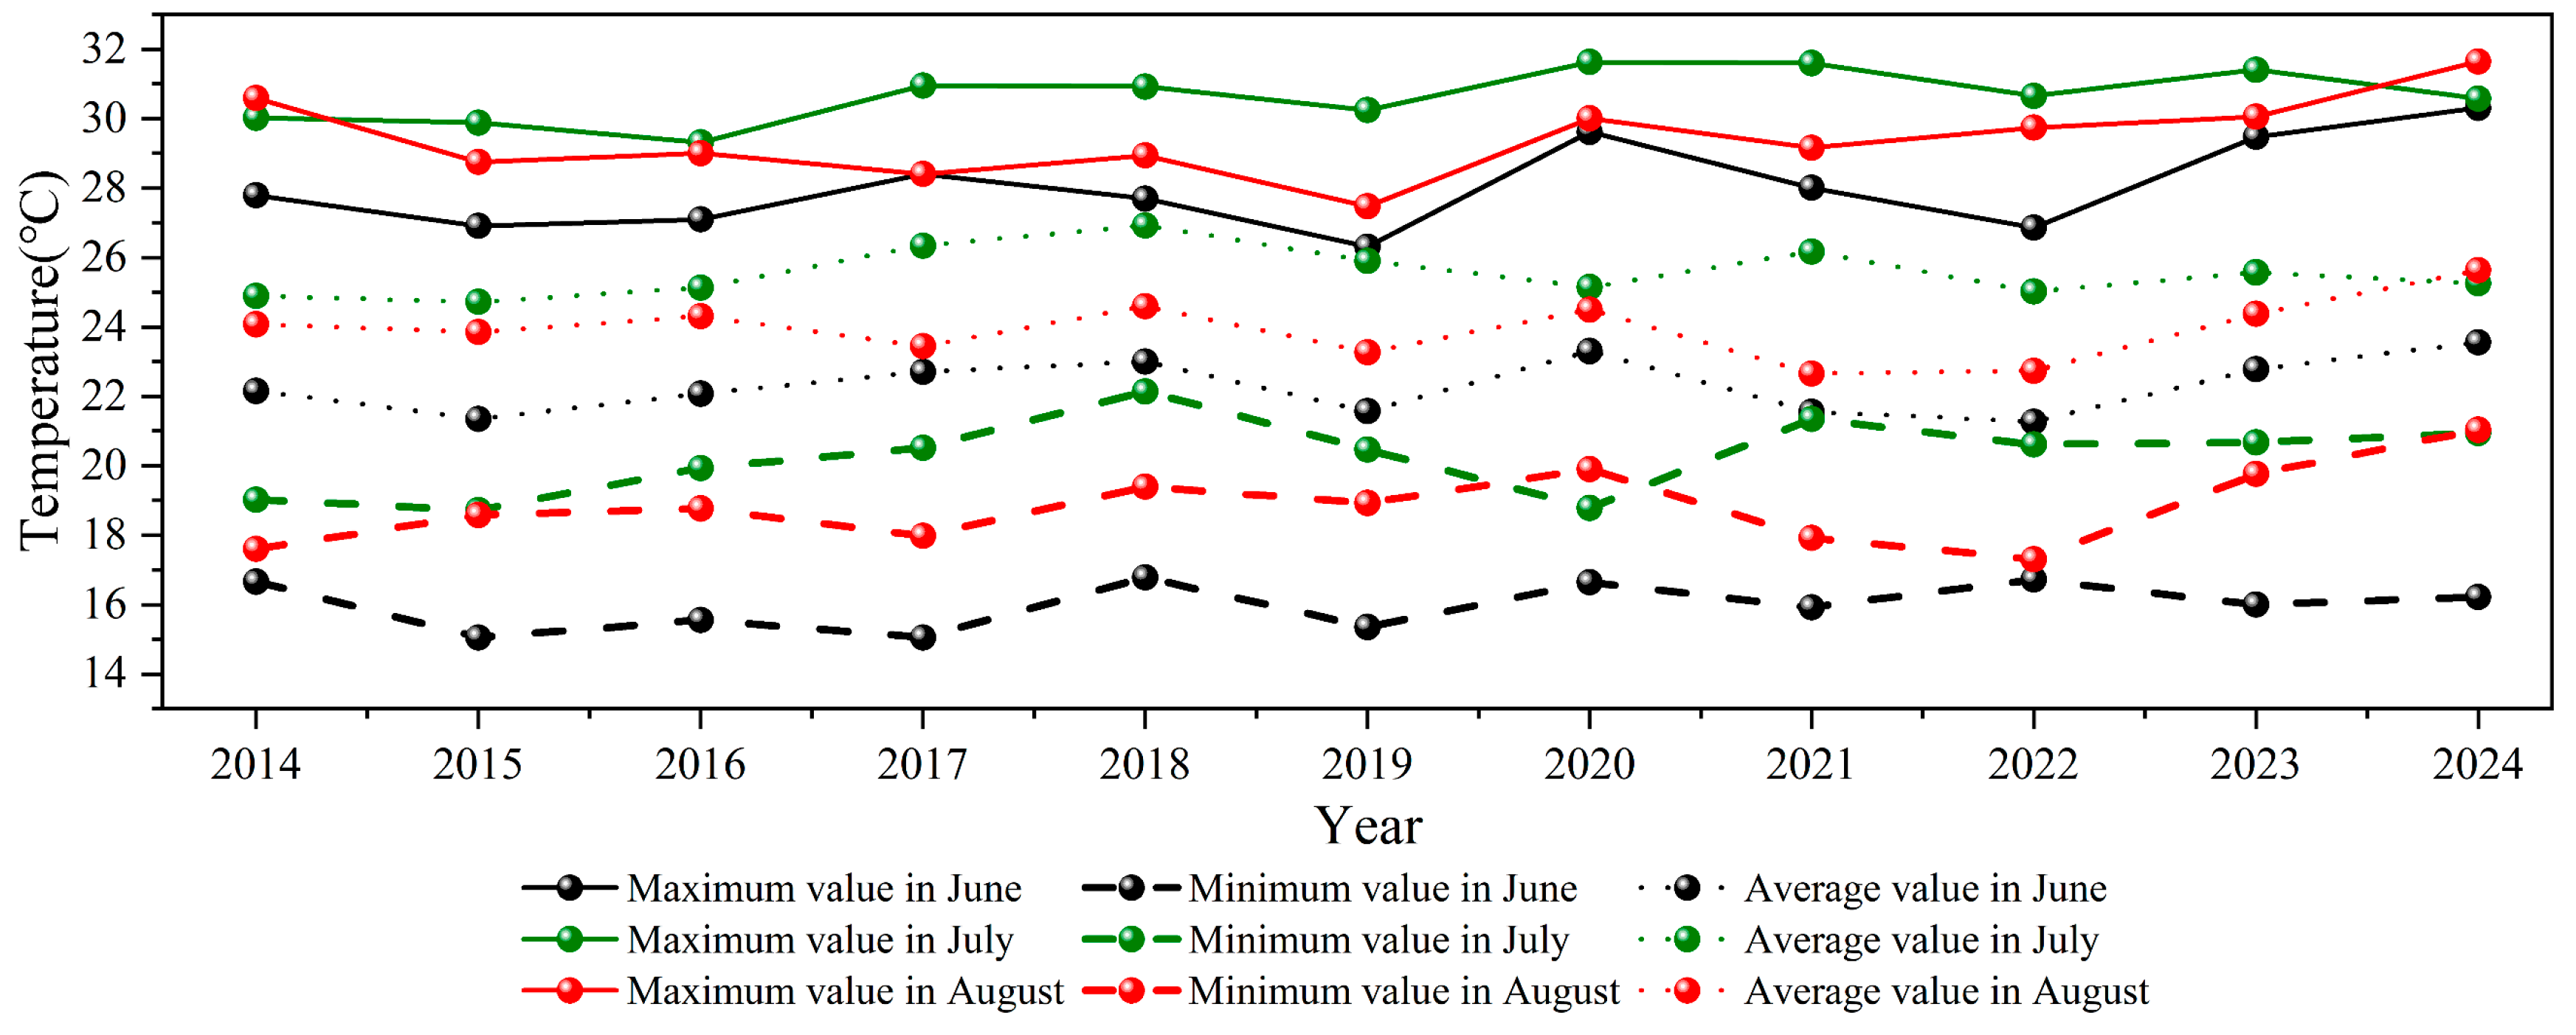
According to the Köppen climate classes, Shenyang’s climate belongs to the Dwa climate: D: cold temperate; w: dry winter; a: hot summer [30]. Its winters are long and cold, and its summers are short and warm. Annual precipitation is low, with most of it occurring in the summer, and winter is relatively dry. Figure 2 shows the monthly average temperature changes in Shenyang for the most recent 5 years [64]. Temperature changes in Shenyang show a gradual upward trend starting in January. After reaching a peak in July, temperatures remained stable throughout August. From September to December, temperatures decline at an accelerated rate. Figure 3 shows the temperature changes in Shenyang from June to August in the past ten years [64]. In Shenyang, the summer temperature typically reaches its lowest point in June, peaks in July, and then falls slightly in August. Summer temperatures in 2024 fell within the normal range for historical data, representing a typical summer in Shenyang. The average temperature in that year is 9.6 °C, 1.1 °C higher than the same period in previous years, and the second highest in the same period since 1951 [65].

2.2. LCZ Mapping

LCZs are divided into 17 categories based on the regional urban morphology and land cover-type characteristics, including 10 “built types” (LCZ 1–10) and 7 “land cover types” (LCZ A-G). This study adopts the World Urban Database and Access Portal Tools (WUDAPT) method [66], using Landsat-8 satellite images, LCZ Generator, Google Earth, Street View, and field surveys as data sources. 20–100 “training area samples” are selected for each LCZ type to construct a Local Climate Zoning map of the central urban area of Shenyang, as shown in Figure 4.
In Shenyang, built-type LCZs are concentrated in the central part, while land cover-type LCZs are distributed around the periphery of the built areas. Compact built types (LCZ 1 and 2) and the open high-rise built type (LCZ 4) are mainly located in the central area. Open, low-rise, and sparsely built types (LCZ 6 and 9) are mainly found in the peripheral areas and are scattered among land cover types (mainly LCZ D). An open mid-rise built type (LCZ 5) and large low-rise built type (LCZ 8) exist in both the central and peripheral areas. The open low-rise built type (LCZ 6) accounts for the most significant proportion of built type LCZs, at 12.68%. Among land cover-type LCZs, low-plant LCZ D accounts for the most significant proportion, at 52.89%, followed by dense-tree-type LCZ A, which is mainly distributed in the east [46]. Therefore, this paper selected seven LCZs with widespread distribution and significant characteristics in Shenyang, namely LCZ 2, LCZ 4, LCZ 6, LCZ 8, LCZ 10, LCZ A, and LCZ D, as the research areas.
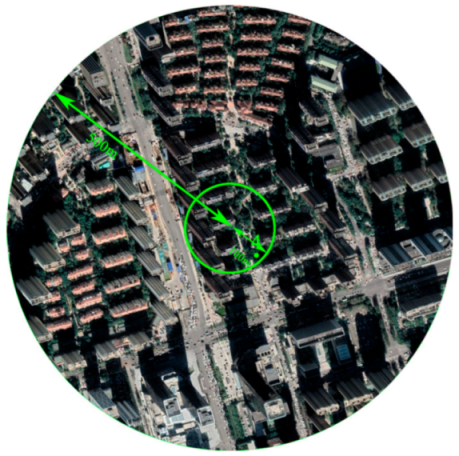
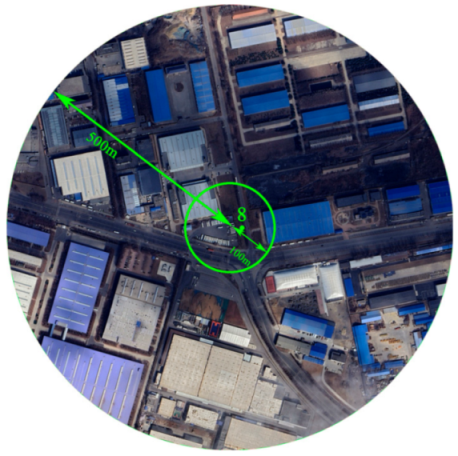
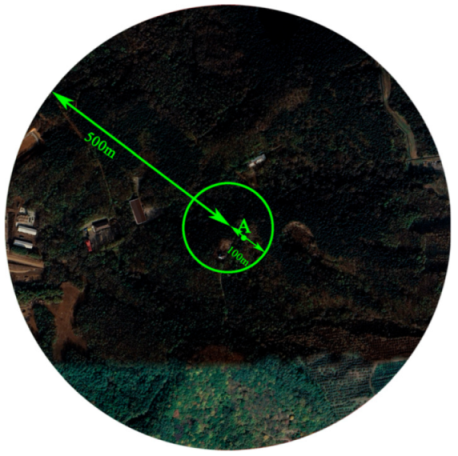
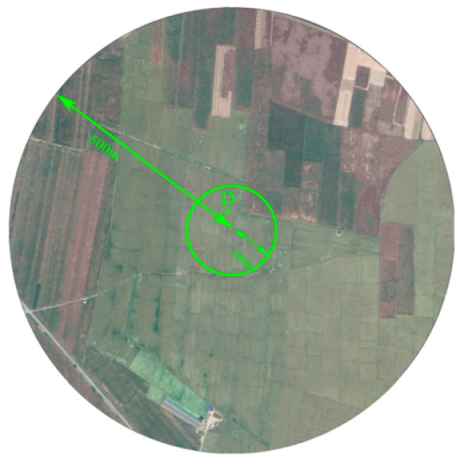
For the seven different LCZs, this study selected an area with a radius of 500 m as the research site (Table 1). By combining satellite maps with field surveys, we ensured that the building forms and land cover in the area were evenly distributed. Then, fixed measurement points were set within a 100 m radius of the center of the selected site. Based on previous research [32], it was pointed out that the five indicators of the sky view factor (SVF), aspect ratio (AR), building surface fraction (BSF), impervious surface fraction (ISF), and height of roughness elements (HREs) are closely related to the thermal environment. Therefore, this study adopted these five morphological parameters. Given that the LCZ classification system provides an ideal range of morphological parameters, yet real cities exhibit heterogeneity and complexity, individual plots may yield values that deviate from the parameter ranges corresponding to their respective LCZ types. This study denotes such deviations with *. This study ensures that each measurement point is located within a representative, homogeneous area within the respective LCZ. This guarantees that the observational data reliably reflect the climatic characteristics of each LCZ in Shenyang. The morphological parameters and measurement point locations of each LCZ measurement point are shown in Table 1.

2.3. Data Acquisition

2.3.1. Air Temperature Measurement

In this study, air temperature data were obtained at each LCZ point through field measurements. According to the 2024 China Climate Bulletin, summer in Shenyang is from June to August [67], so the data monitoring period was selected from 1 June to 31 August 2024.
This study utilized a HOBO MX2301A temperature and humidity recorder produced by ONSET, Cape Cod, MA, USA, equipped with an RS1 protective cover to collect temperature data. Referring to Oke’s Urban Meteorological Observation Guide [68], the instrument was installed at a height of 1.5–2 m above the ground, adhering to the principles of natural ventilation. It was positioned away from heat sources. To minimize obstructions, they were positioned more than 3 m away from walls [38]. Monitoring data was automatically recorded and stored at intervals of 0.5 h and downloaded on-site every three months. The specific parameters of the instrument, including model, range, and accuracy, are shown in Table 2.

2.3.2. Meteorological Observation Data

The meteorological observation dataset used in this study encompasses core meteorological elements, including temperature, air pressure, humidity, wind speed and direction, precipitation, cloud cover, snow depth, visibility, and weather phenomena. The data was obtained from the Shenyang National Reference Meteorological Station (54,342) provided by the China Meteorological Data Service Center [69]. The observation station is situated at an altitude of 49 m in Dongling District, Shenyang City, with geographical coordinates of 41.73° N and 123.51° E.
Ideal days refer to those with meteorological conditions conducive to the development of the UHI effect [38]. In this study, following the weather classification methodology established by Yang et al. [38] and Chen et al. [35], days meeting the following criteria were designated as “ideal days”: an hourly wind speed variation of less than 2 m/s, a total daily precipitation of ≤0.1 mm, and no precipitation in the preceding 24 h.

2.4. Temperature-Based Indices

2.4.1. Calculation of UHII

Urban Heat Island Intensity (UHII) is a key indicator measuring the magnitude of the urban heat island effect. UHII is quantified by calculating the air temperature difference between urban areas and adjacent rural zones with similar geographic characteristics [70]. This study defines Urban Heat Island Intensity (UHII) as the air temperature difference between other LCZ types and LCZ D, expressed by Formula (1):
U H I I = T L C Z   X T L C Z   D
where T L C Z   X denotes the temperature (°C) obtained at monitoring points within each LCZ type, and T   L C Z   D represents the temperature (°C) acquired at LCZ D monitoring points. When U H I I > 0 , it indicates that the LCZ is experiencing an urban heat island (UHI) effect; when U H I I < 0 , it indicates that the LCZ is experiencing an urban cold island (UCI) effect.
When UHII is greater than 0 °C, it indicates that the LCZ is experiencing a heat island effect; when UHII is less than 0 °C, it indicates that the LCZ is experiencing a cold island effect.

2.4.2. Heat and Cool Island Degree-Hours

Temperature differences between distinct Local Climate Zone (LCZ) classes vary temporally. As noted by Yang et al. [71], using a single Heat Island (HI)/Cold Island (CI) intensity value at a specific time point or averages over several hours may inadequately characterize the heat/cold island phenomenon. A comprehensive index is required to quantify both the magnitude and duration of temperature variations between LCZ classes. Based on the index proposed by Yang et al. [71], we adopt the cumulative sum of hourly HI/CI intensities over the entire study period, termed Heat Island Degree-Hours (HIdh) and Cold Island Degree-Hours (CIdh). HIdh and CIdh are defined as follows:
  H I d h = i = 1 n ( T L C Z   X , i T L C Z   D , i ) > 0.5
C I d h = i = 1 n ( T L C Z   D , i T L C Z   X , i ) > 0.5
where T L C Z   X ,   i denotes the air temperature (°C) of LCZ X at houri, and n represents the total number of hours in the entire study period. This study defines a heat island event when T L C Z   X , i T L C Z   D ,   i > 0.5 °C, a cold island event when T L C Z   X , i T L C Z   D , i < −0.5 °C, and a neutral heat island when T L C Z   X , i T L C Z   D , i < 0.5 °C. Consequently, HIdh and CIdh comprehensively characterize the intensity and persistence of heat/cold island effects by summing the products of duration (hours) and temperature differential intensity (°C) for specific LCZs relative to the reference LCZ D. This approach holistically reflects the spatiotemporal cumulative effects of urban heat islands.

2.4.3. Cooling/Warming Rates (0.5 h)

The formation of urban heat islands (UHIs) primarily stems from differences in warming and cooling rates between urban areas and surrounding rural regions [11]. During field measurements, varying heating/cooling rates across LCZ types induce distinct temperature variations. Based on the 0.5 h temporal resolution of acquired temperature data, we define the warming/cooling rate (°C/0.5 h) at time n as R 1 , expressed in Equation (4):
R 1 =   T n   T n 0.5
where T n denotes the temperature at time n (°C),   T n 0.5 denotes the temperature at time n − 0.5 (°C). When R 1 > 0 , the measurement point is undergoing a heating process; when R 1 < 0 , the measurement point is undergoing a cooling process.

2.4.4. Rates of Change in UHII (0.5 h)

During field measurements, distinct UHII variation rates across LCZ types result in differential changes in heat island intensity. We define the UHII variation rate (°C/0.5 h) at time n as R2, expressed in Equation (5):
R 2 =   U H I I n   U H I I n 0.5
where U H I I n denotes the Urban Heat Island Intensity at time n (°C), and   U H I I n 0.5 denotes the Urban Heat Island Intensity at time n − 0.5 (°C). When R 2 > 0 , the monitoring point is undergoing an increasing UHI process; when R 2 < 0 , the measurement point is undergoing a cooling process.

3. Result

3.1. Thermal Environment Characteristics of Each LCZ During the Entire Summer

3.1.1. Hourly UHII

Figure 5 shows the hourly UHII of each LCZ in Shenyang during summer. The UHII in Shenyang exhibits an apparent diurnal variation. During the daytime (sunrise + 2 h to sunset), each LCZ is typically experiencing the UCI effect, while at nighttime (sunset to sunrise + 2 h), the UHI effect increases significantly.
At daytime, all LCZs exhibit either a UCI effect or a weak UHI effect. Furthermore, as summer progresses, the UCI effect gradually intensifies. LCZ 6 exhibits weak UHI and UCI effects. LCZ 10 and LCZ A exhibit strong daytime UCI effects.
At nighttime, all LCZs experienced a strong UHI effect during most periods. Among built LCZs, LCZ 2 and LCZ 4 had the strongest UHII, followed by LCZ 8 and LCZ 6. LCZ 10 exhibited the UCI effect at nighttime. Land cover-type LCZ A exhibited a weaker UHI effect at nighttime, with the UCI effect occurring during some periods.

3.1.2. Frequencies of Heat and Cool Island Events

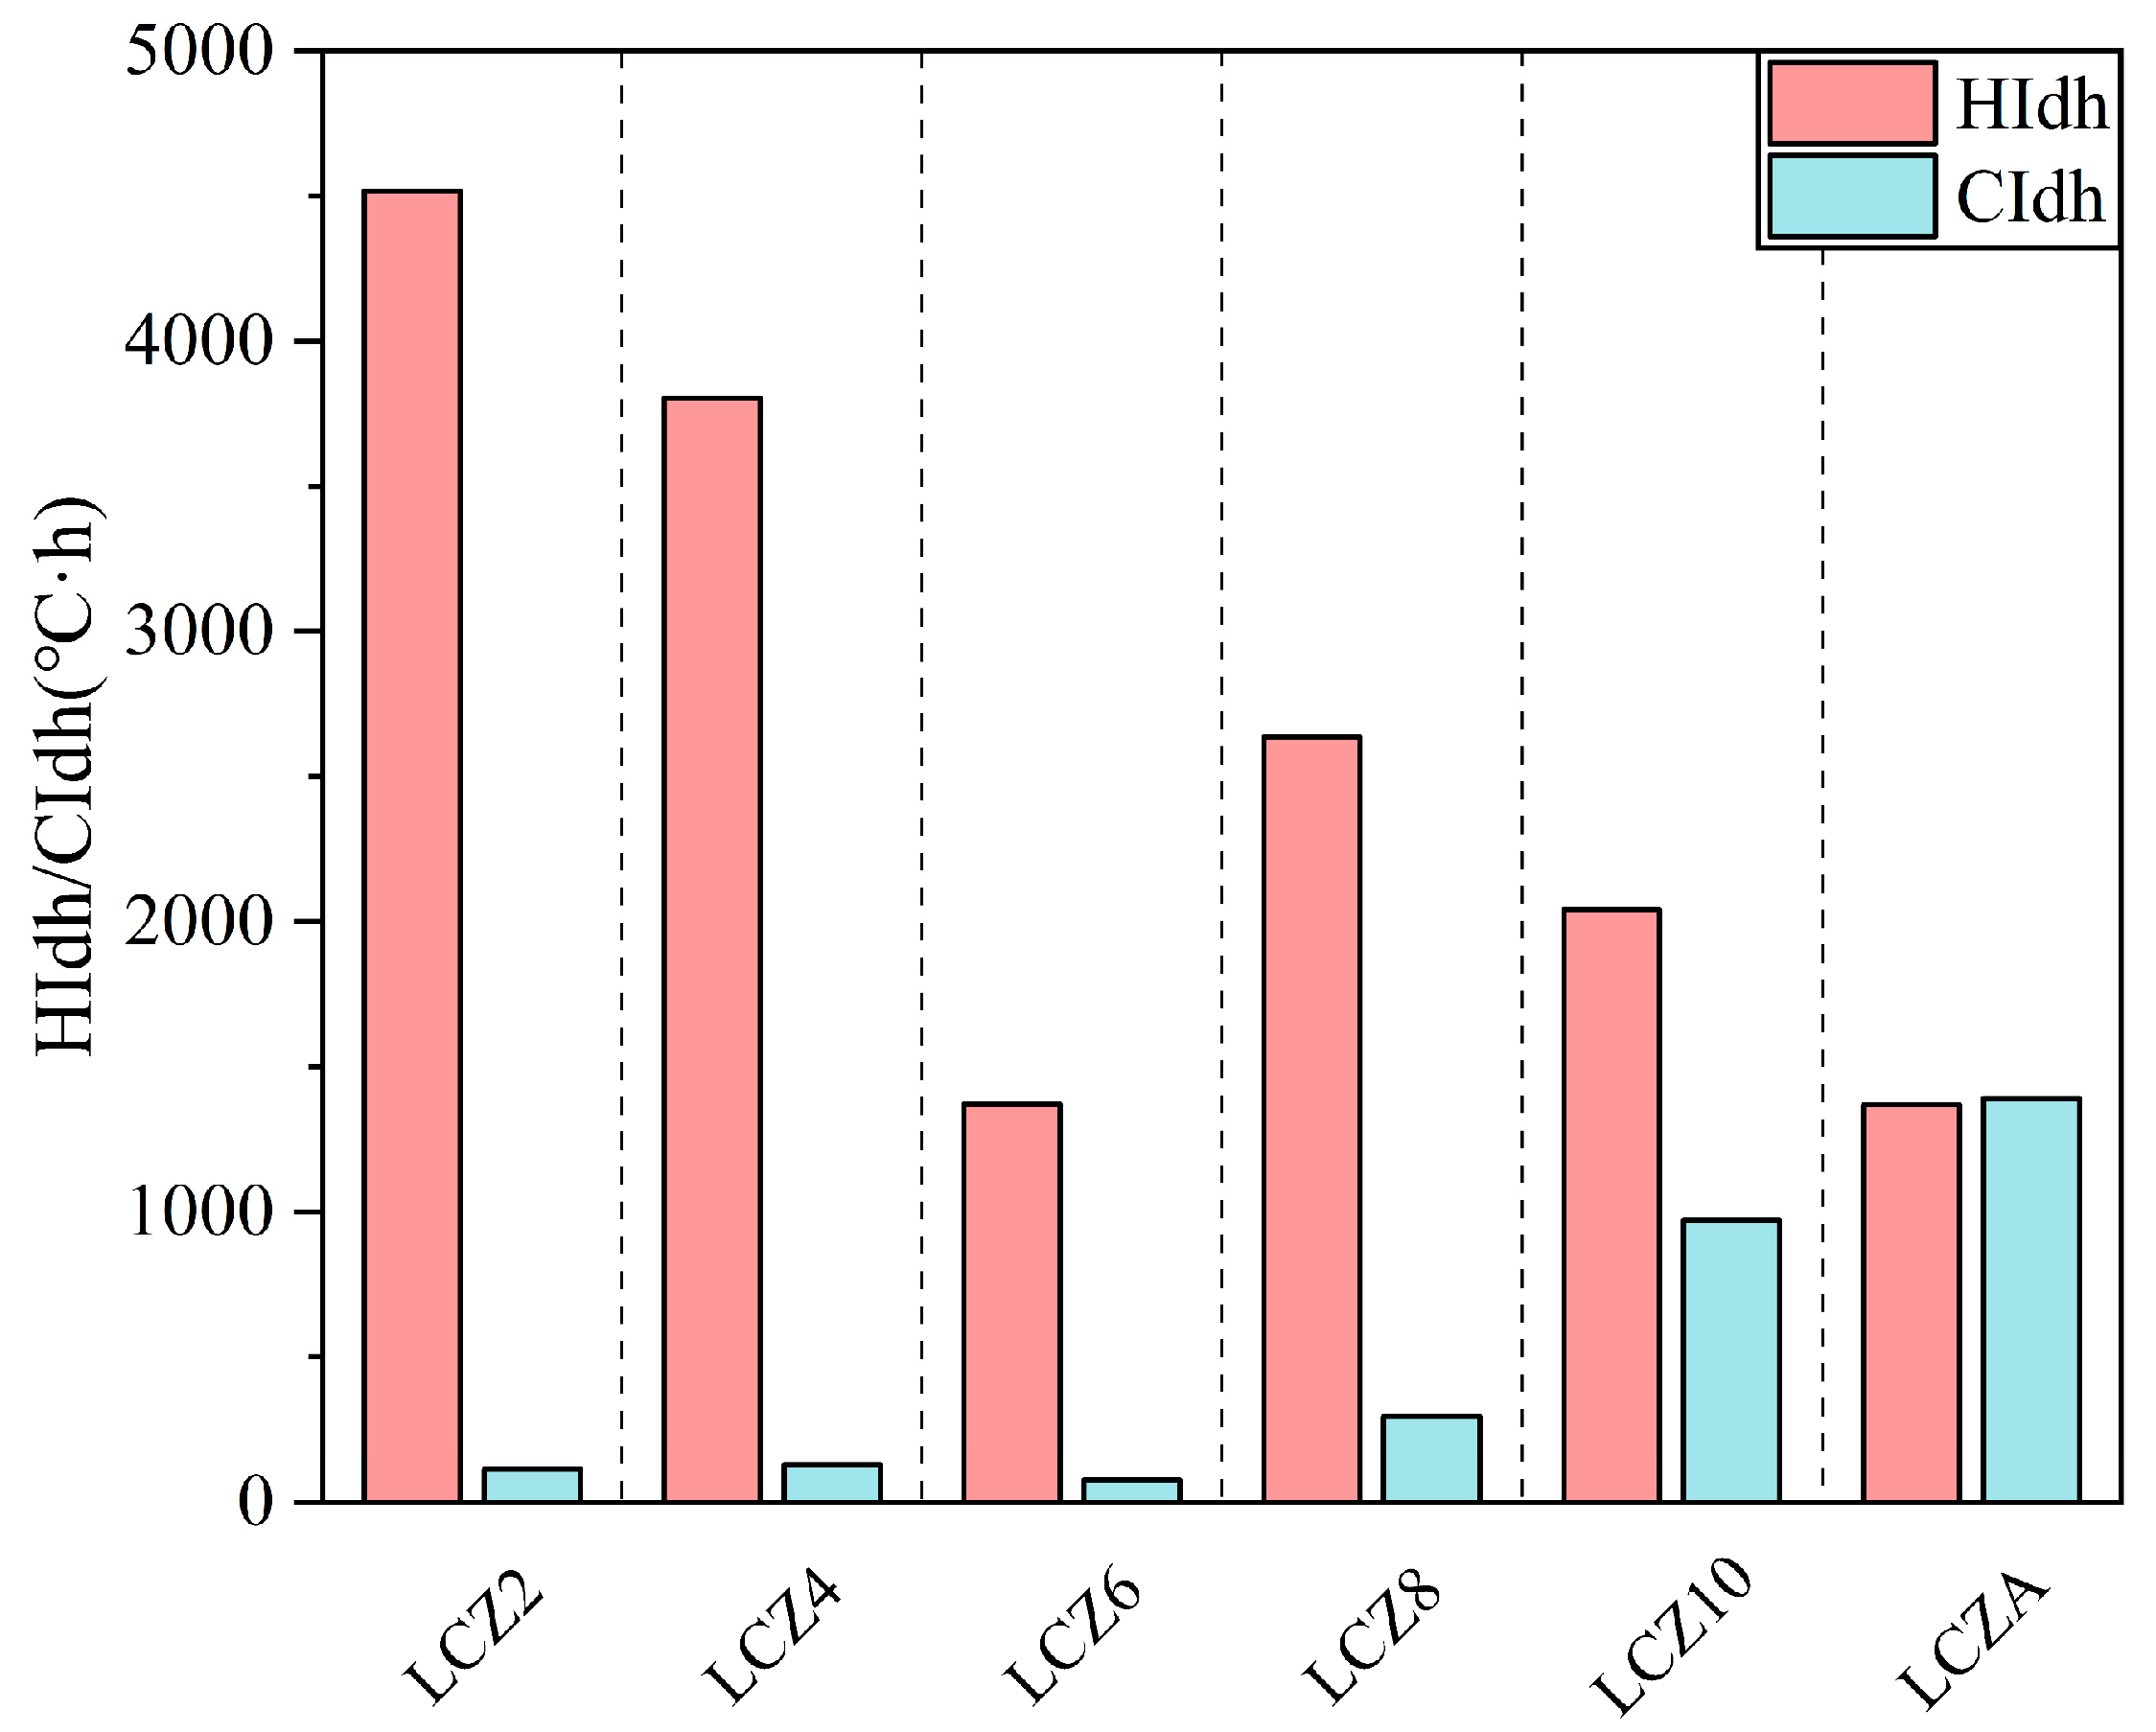
Figure 6 shows the HIdh and CIdh values for each LCZ in Shenyang during summer. LCZ 2, 4, 8, 10, and 6 exhibit a decreasing HIdh trend. LCZ 2 has the highest HIdh value, reaching 4518 °C·h. The difference between the HIdh and CIdh values for LCZ 10 is relatively small, with the HIdh being approximately twice that of the CIdh. The HIdh and CIdh values for LCZ A are almost equal.
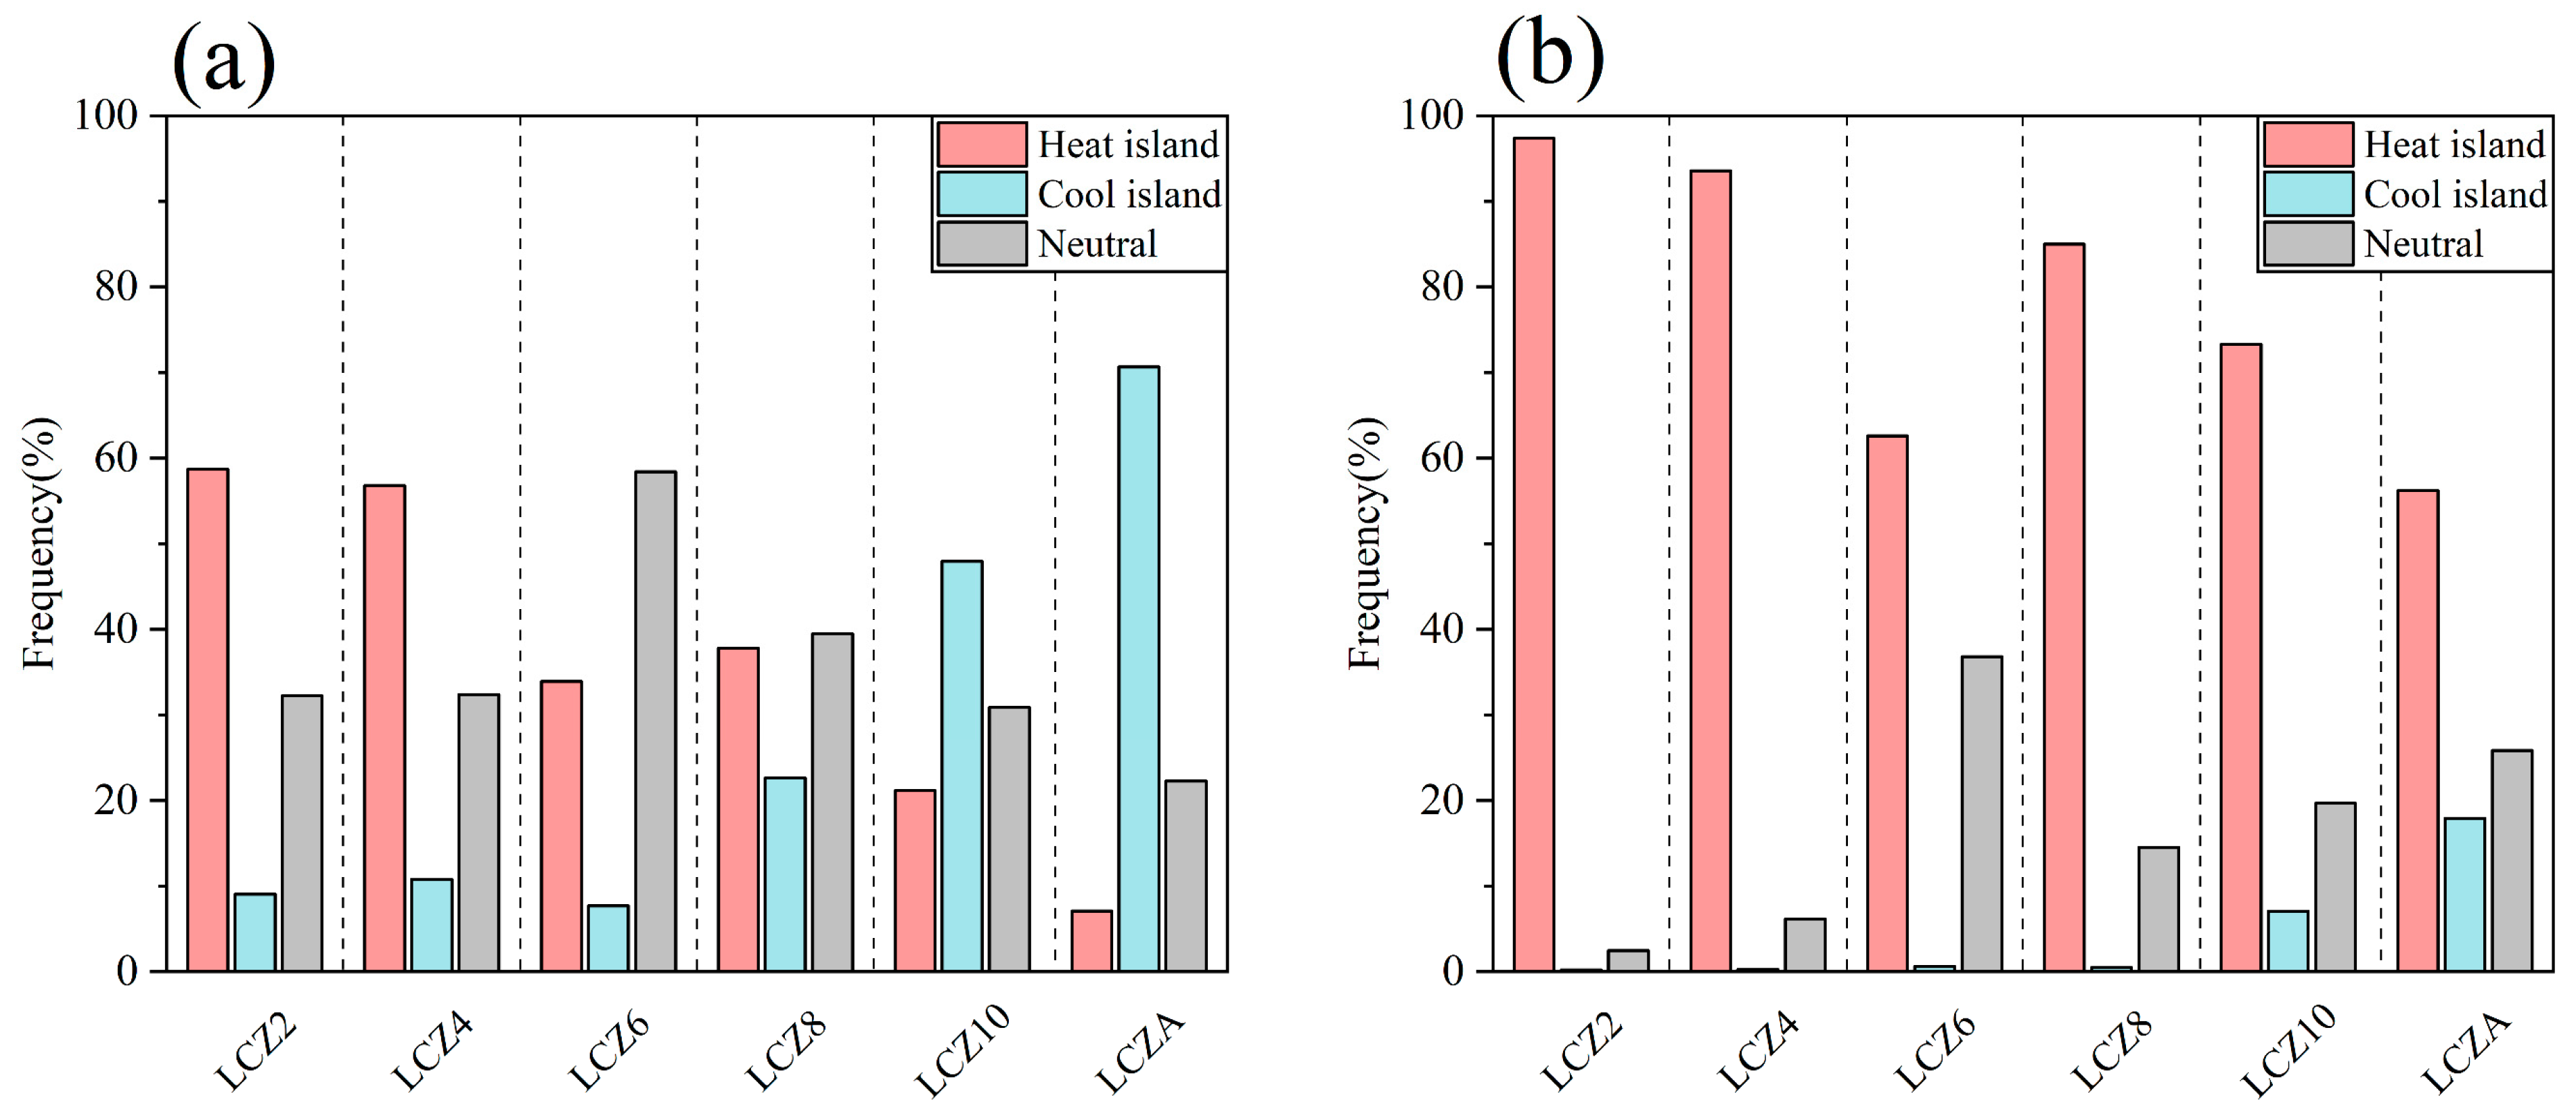
Figure 7 shows the frequency of heat island, cold island, and neutral events in Shenyang during the daytime and nighttime. During the daytime (Figure 7a), the frequency of various events in LCZ 2 and 4 is similar, among which the frequency of heat island events is higher than that of other LCZs. The frequency of heat island events in LCZ 6, 8, and 10 is second, at 34%, 38%, and 34%, respectively. The frequency of heat island events in LCZ A is the lowest, at only 7%. For neutral events, LCZ 6 has the highest frequency, at 58%, and the frequency of neutral events in other LCZs is in the range of 22–40%. For cold island events, the frequency of LCZ 2, 4, and 6 is similar, ranging from 8% to 11%. The frequency of cold island events in LCZ 8, 10, and A increases in turn.
At nighttime (Figure 7b), the frequency of heat island events was high in all LCZs. The frequency of heat island events decreased in LCZ 2, 4, 8, 10, 6, and A in turn. The frequency of neutral events increased in LCZ 2, 4, 8, 10, and A in turn. LCZ 6 had the highest frequency of neutral events, at 37%. LCZ 10 and A had the highest frequency of cold island events, at 34% and 38%, respectively. The frequency of cold island events in the other LCZs was less than 1%.

3.2. Thermal Environment Characteristics of Each LCZ at Different Summer Stages

3.2.1. Basis for Stage Subdivision of Summer

Figure 8 shows the temperature changes in each LCZ in Shenyang during the summer of 2024. The temperature curve in Shenyang during the summer shows stage differences. Summer can be divided into four stages: early-summer (Stage 1), mid-summer (Stage 2), peak-summer (Stage 3), and late-summer (Stage 4). In early-summer (June 1–June 3), the temperature gradually rises, and the overall fluctuation range is 10–26 °C. In mid-summer (June 4–July 21), the temperature rises again, and the daytime temperature fluctuation range is extensive. In peak-summer (July 22–August 23), the air temperature of each LCZ ranges from 18 to 31 °C and reaches the stage peak in mid-August. Among them, LCZ 4 has the highest temperature during this period, reaching 35.25 °C. From July 25 to July 28, under the combined action of Typhoon No. 3 “Gemi” and the northwest cold air, Shenyang experienced regional heavy rain [72,73], and the temperature dropped significantly. During the late-summer (August 24–31), the air temperature in each LCZ dropped, with the minimum temperature reaching 16 °C, marking the end of summer.
Based on the “ideal days” screening criteria established in Section 2.3.2, Table 3 shows the number of ideal days included in each summer stage. Because the number of ideal days varies from stage to stage, this study normalized the data for each stage to a day for analysis. Based on the daytime and nighttime divisions in Section 3.1.2, this study defined a day as 06:30 to 06:00 (the next day). Daytime refers to 6:30–19:00, and nighttime refers to 19:00–6:00 (the next day).

3.2.2. Characteristics of Temperature and Heat Island Intensity Changes in Four Summer Phases

Based on stage division, this study explored the differences in the thermal environment of each LCZ in S1 to S4. Figure 9 shows the thermal environment changes in Shenyang’s LCZs during different summer stages. Air temperature gradually increased in each LCZ from S1 to S3, but dropped significantly in S4, falling between S1 and S2. At daytime, temperatures in each stage showed an initial rise followed by a fall, reaching a peak around 15:30. LCZ 4 had the highest temperature, reaching 32.7 °C. At nighttime, temperatures in each LCZ continued to fall throughout the four summer stages, but the temperature drop was slow.
In terms of UHII, each LCZ exhibited diurnal variations across different phases. During daytime, the UHII of each LCZ decreased between 6:30 and 8:30, remained relatively stable from 8:30 to 16:30, and rapidly increased from 16:30 to 19:00. The UHII of LCZ 2, 4, and 10 was higher in S1 than in S2, while the opposite was true for LCZ 6, 8, and A. The duration of the UCI effect in S3 and S4 for each built-type LCZ was more prolonged than in S1 and S2. LCZ A exhibited a significant UCI effect throughout all four phases, reaching its peak at 9:00 in S4, with a value of −2.8 °C. During nighttime, the UHII of each LCZ increased between 19:00 and 21:30, then remained relatively stable from 21:30 to 4:30 (the next day), and rapidly decreased from 4:30 to 6:30. The nighttime UHII of each LCZ in S4 was higher than that in the other three phases, with LCZ 2 and 4 being the most pronounced. At 22:00 in S4, UHII of LCZ 2 reached a peak of 7.2 °C.
The UHII box plot shows that UHII values of each LCZ fluctuate the most during S4, but there are variations in UHII across different LCZs during S1–S3. The median values of LCZ 2 and 4 show a stage-by-stage upward trend during S1–S3, with LCZ 2 reaching a peak UHII of 7.2 °C. The median value of LCZ 10 decreases during S1–S3. The median UHIIs of LCZ 6 and 8 exhibit an initial upward trend, followed by a downward trend; however, the fluctuation range of UHII in LCZ 6 is smaller than that of LCZ 8, ranging from 0 °C to 2 °C. While the median UHII of LCZ A also shows an initial upward trend followed by a downward trend, it remains close to 0 °C throughout each stage.
Figure 10 shows the cooling/warming rates and UHII change rates of each LCZ during the four summer phases in Shenyang. During daytime, cooling/warming rates in each LCZ exhibited significant fluctuations across all four phases. The warming phase occurred from 6:30 to 15:30, with the warming rate gradually slowing. The cooling phase shifted from 15:30 to 19:00, with the cooling rate continuously increasing, reaching its maximum at 19:00. The temperature fluctuations for each LCZ were minimal in S2, demonstrating the most stability. Among the other three stages, LCZ 2 and 4 exhibited a greater range of temperature fluctuations from 6:30 to 11:30 than those of the other built-type LCZs. LCZ D exhibited the most considerable fluctuations among all LCZs, with particularly significant fluctuations in S4, within a range of approximately ±1.5 °C/0.5 h.
During nighttime, the cooling phase occurred from 19:00 to 4:30 (the next day), with the cooling rate gradually decreasing to zero. The warming phase shifted from 4:30 to 6:30 (the next day), with the warming rate continuously increasing, reaching a maximum around 6:30. Similarly to the daytime, the fluctuations in the nighttime cooling/warming rates of each LCZ during S2 were minimal, with the overall temperature remaining relatively stable. LCZ 2 and 4 exhibited more moderate cooling/warming rates during S1, S3, and S4 compared to other LCZs. LCZ A exhibited greater nighttime temperature fluctuations during S3 and S4 than other LCZs.
During daytime, all LCZs experienced significant fluctuations in UHII in the four phases. However, the fluctuations in UHII change rates for LCZ 6 were relatively more pronounced than those for the other LCZs. During nighttime, all LCZs experienced significant fluctuations in S1 and S4, but S2 and S3 showed some differences from the daytime. Compared to the daytime, the nighttime UHII change rates for built-type LCZs 2, 4, 6, 8, and 10 were relatively gentle in S2 and S3. However, LCZ A still experienced significant fluctuations during nighttime in S2 and S3.

4. Discussion

4.1. Differences in UHI Across LCZs

The nighttime UHII of built-type LCZs is higher than that of land cover-type LCZs, and a more substantial UHI effect occurs in LCZ 2 and 4, which is consistent with previous studies [35,37,38,43,50,51]. In previous studies [74,75], LCZ 10 always showed high UHII. However, this study found that LCZ 10 in Shenyang had the most daytime UCI effect among built types. Based on the research of Unal Cilek and Cilek [33], this may be because LCZ 10 in Shenyang are characterized by a relatively higher SVF and a lower BSF. It facilitates more efficient heat dissipation via wind. And the prevalent use of concrete for roofs and ground pavement in these areas results in significant heat absorption during daytime hours due to the material’s high thermal capacity, resulting in a significant UCI effect occurring at daytime.
This study also explored the thermal environment characteristics of each LCZ in Shenyang during different summer stages. LCZ A showed a strong UCI effect in all four summer stages, which is consistent with previous studies [76,77]. During daytime, the UCI effect of the built-type LCZs lasted longer in S3 and S4 than in S1 and S2. It may be because, as the summer stage progressed, the transpiration of LCZ D was significantly weakened, increasing temperature and a decrease in UHII, which led to a longer UCI effect. During nighttime, the UHII of each LCZ in S4 was higher than that in the other three stages, with LCZ 2 and 4 being the most obvious. This may be because the nighttime wind speed, cloud cover, and other climatic factors in S4 created conditions conducive to the development of the UHI effect, which increased the UHII of each LCZ. LCZ 2 and 4, because their underlying surfaces have strong heat retention characteristics and have more anthropogenic heat [6], have the largest nighttime UHII under the ideal conditions for the development of UHII in S4. In S1 and S4, the temperature change rate and UHII change rate of each LCZ fluctuated most dramatically. In S2, the fluctuation amplitude of each LCZ was relatively small, and the curve was flatter. It may be because S1 and S4 are in the seasonal transition period, when the underlying surface of each LCZ (vegetation, concrete, etc.) is in an unstable state. At the same time, the airflow and shading effect generated by buildings or vegetation at different summer stages can reduce or aggravate the UHI effect [78,79], resulting in a sharp fluctuation in the change rate.

4.2. Regional Differences in UHII in the Summer

Although Shenyang is located in a severe cold region, it exhibits the same diurnal variation pattern as Guangzhou (a hot summer and warm winter region) [35] and Nanjing (a hot summer and cold winter region) [38] during the summer, showing a strong UHI effect at nighttime. However, there are differences during daytime. As the summer progresses, the daytime UCI effect of each LCZ in Shenyang gradually strengthens. Guangzhou and Nanjing have a significant UCI effect throughout the summer. Since the UHII is calculated with reference to LCZ D, the underlying surface parameters of LCZ D in different climate zones may vary, affecting the vegetation heat storage capacity, resulting in the UCI effect in Shenyang during the summer daytime.
Figure 11 compares the diurnal variation in UHII in each LCZ in Shenyang, Nanjing, and Guangzhou during the summer. During daytime (Figure 11a), the fluctuations in UHII in Guangzhou’s LCZs are milder than those in Shenyang and Nanjing. This may be because the intensity and range of the summer UHII decrease as the climate becomes more humid [80]. The weakening effect of humidity on UHI can also be explained by the fact that when atmospheric water vapor pressure is high, evaporative cooling in rural areas is suppressed, resulting in a smaller temperature difference between urban and rural areas [81]. Therefore, the intensity and range of UHI in humid climate zones are smaller than those in arid climate zones.
During nighttime (Figure 11b), except for LCZ 6 and 10, the average nighttime UHII of the other LCZs gradually expands from Guangzhou, Nanjing, and Shenyang. There are slight differences between LCZ 6 and LCZ 10. The UHII range of LCZ 6 in Shenyang is smaller than that of Nanjing. Based on the Shenyang LCZ map in Section 2.2, LCZ 6 is adjacent to LCZ D and therefore shares similar urban underlying surface parameters, resulting in a smaller range of UHII. The average UHII of LCZ 10 in Shenyang is lower than that of Nanjing. This is due to the lower BSF and AR, as well as the higher SVF, which mitigates the urban heat island effect.

4.3. Seasonal Differences in UHII

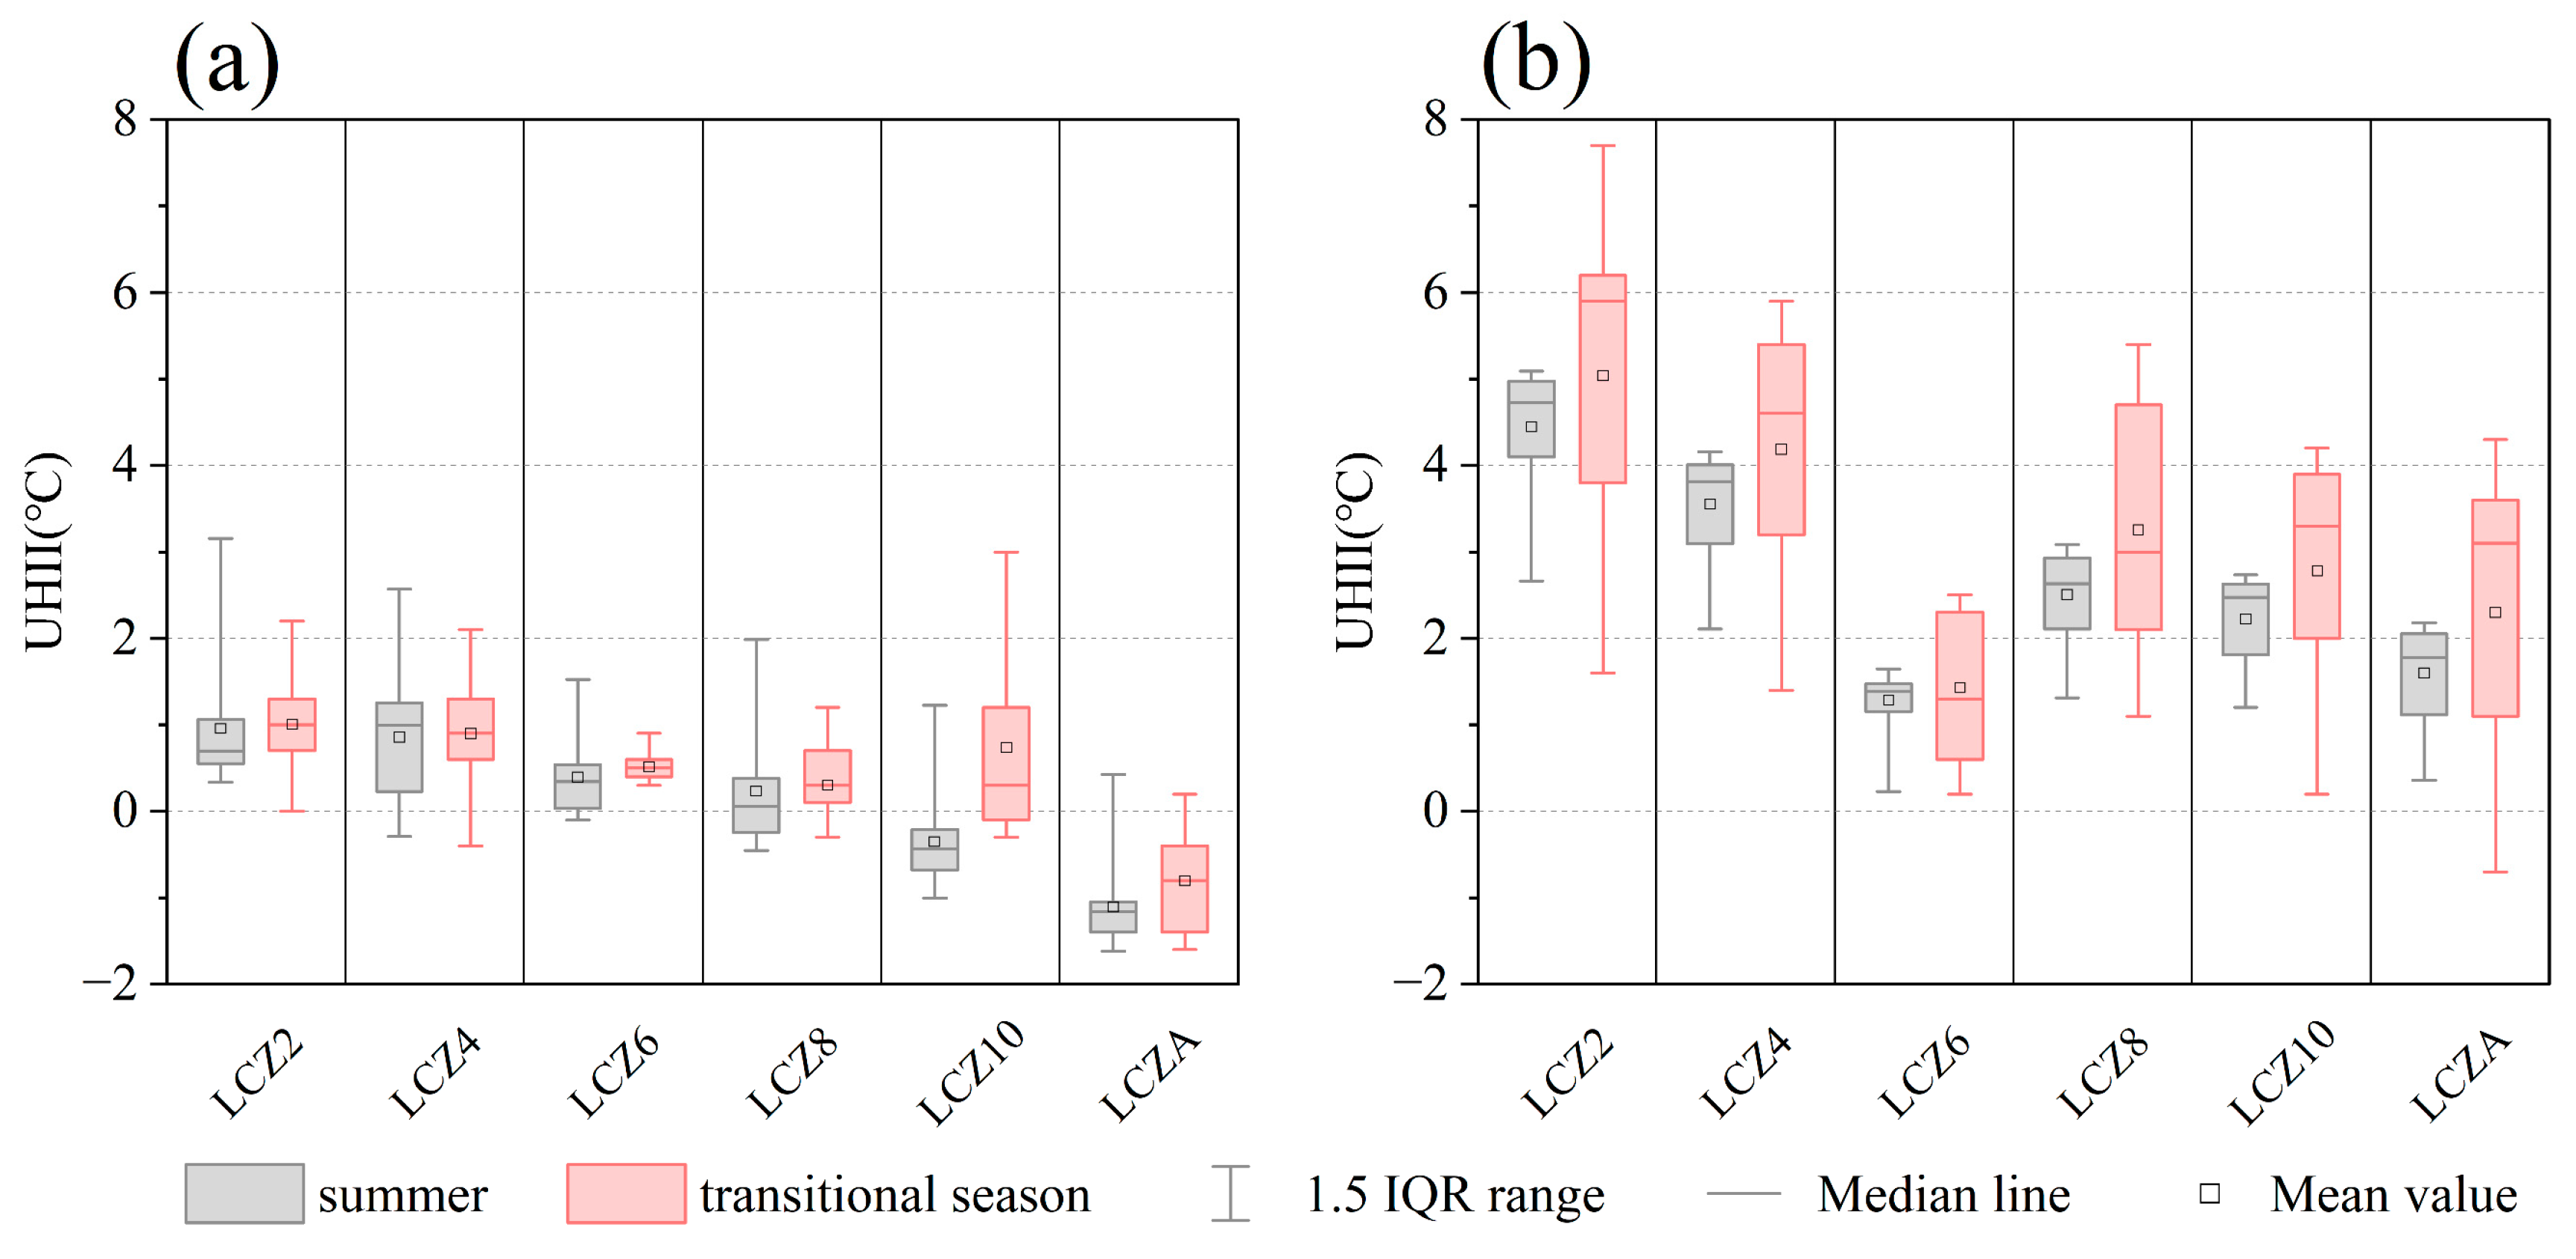
Figure 12 compares the average UHII in Shenyang during the summer and transition seasons [46]. During daytime (Figure 12a), the UHII of built-type LCZs 2, 4, 6, and 8 are similar in summer and transition season. However, LCZ 10 exhibits seasonal specificity, with higher UHII in the transition season, possibly due to seasonal differences in anthropogenic heat generated by factories.
Previous studies have shown [82] that the amplitude of the UHII in summer is larger than that in the transition season. However, during nighttime in Shenyang (Figure 12b), the summer UHII of each LCZ is lower than that in the transition season, with LCZ 2 and 4 being the most obvious. The UHII of LCZ 2 in the transition season can reach 7.8 °C. This finding is inconsistent with previous studies and may be attributed to differences in the heat storage capacity of the underlying surface materials resulting from climate change, which in turn leads to changes in the amplitude of the UHII. The fluctuation range of UHII in LCZ A in the transition season is larger than that in summer, and the cold island phenomenon occurs at night, which may be closely related to changes in vegetation phenology.

4.4. Limitations and Prospects

This study has certain limitations. First, although this study conducted long-term, uninterrupted field measurements and selected characteristically representative LCZs as research objects, only one measurement point was set up for each LCZ, resulting in a relatively small number of measurement points. Second, summer is the season when urban thermal environmental problems are most prominent. This study conducted a time-segmented study to demonstrate its necessity, but whether there are stage-divided thermal environmental differences in other seasons remains to be explored. In addition, this study used Shenyang as a case study, as its high population density and rapid urbanization process are typical of the complex thermal environmental problems brought about by this process. However, the applicability of the conclusions to other cities in the same climate zone remains to be explored. Meanwhile, this study primarily analyzes urban heat island characteristics based on air temperature data, failing to incorporate surface temperature and mean radiant temperature for multidimensional characterization of the thermal environment. It also does not introduce thermal comfort indices to assess human thermal stress conditions.
To address these limitations, future work should follow the following directions: First, increase the number of measurement points and coverage within each LCZ to improve the representativeness of the data and the universality of the conclusions. Second, conduct field measurements in different seasons to verify the necessity of stage subdivision studies. Furthermore, conduct LCZ applicability research in cities across China’s severe cold regions to further reveal the differences in the thermal environment of LCZs in these cities. Future research may integrate remote sensing surface temperature observations with numerical simulation techniques, incorporating thermal comfort evaluation systems to deepen the study of urban heat island effects from two dimensions: the mechanisms of thermal environmental impacts and human perceptual responses.

5. Conclusions

This study, based on four summer stages, revealed the differences in thermal environments across seven LCZs through field measurements. The main conclusions are as follows:
  • In terms of UHII, the summer UHI effect in Shenyang is characterized by higher intensity during nighttime and weakens significantly during the daytime. During nighttime, the UHII of built-type LCZs is higher than that of land cover-type LCZs. LCZ 2 and 4 show the highest UHII, at 7.6 °C and 5.4 °C. During the daytime, as summer progresses, the UCI effect in all LCZs gradually strengthens. LCZ 10 exhibits the most frequent daytime UCI effects among built-type LCZs. Further stage subdivision shows that, during daytime, the UCI effect in built-type LCZs persists longer in peak-summer and late-summer. LCZ A demonstrates a significant UCI effect across all four stages, with the strongest UHII reaching −2.8 °C at 09:00 in late summer. During nighttime, the UHII of each LCZ in late-summer was higher than in the other three summer stages.
  • In terms of UHII based on the stage subdivision of summer, each LCZ gradually increased from early-summer to peak-summer, but dropped significantly in late-summer. During daytime, temperatures in each stage showed a trend of first rising and then falling, reaching a peak around 15:30, with LCZ 4 reaching the highest temperature of 32.7 °C. During nighttime, temperatures in each LCZ continued to decline throughout the four summer stages, but at a slow rate.
  • In terms of cooling/cooling rates based on the stage subdivision of summer, the fluctuations for each LCZ were minimal in mid-summer, resulting in generally stable fluctuations. During daytime, LCZ D experienced the most significant fluctuations among all LCZs, with the most dramatic fluctuations occurring in late-summer, within a range of approximately ±1.5 °C/0.5 h. During nighttime, LCZ 2 and 4 exhibited more gradual cooling/warming rates in early-summer, peak-summer, and late-summer compared to the other LCZs. LCZ A exhibited the most dramatic fluctuations in cooling/warming rates during peak-summer and late-summer.
  • In terms of UHII change rates based on the stage subdivision of summer, the fluctuations for each LCZ were most dramatic in early-summer and late-summer. In contrast, the UHII of built-type LCZs varied more gradually in mid-summer. During daytime, all LCZs experienced significant fluctuations in the four summer stages. The fluctuations in UHII for LCZ 6 were more pronounced than those for other LCZs across the four summer stages. During nighttime, the UHII of built-type LCZs varied more gradually in mid-summer and peak-summer.
The results show that the thermal environmental characteristics of each LCZ in Shenyang vary significantly across the four summer stages, demonstrating the need for detailed intraseasonal stage subdivision in LCZ research. This study helps verify the applicability of the LCZ system in severely cold regions and provides a theoretical basis for improving urban climate environments.

Author Contributions

Conceptualization, Z.L. and T.X.; data curation, X.L., N.Y. and J.C.; formal analysis, Z.L., X.L. and T.X.; funding acquisition, Z.L.; investigation, X.L., N.Y., J.C. and H.S.; methodology, Z.L., X.L. and T.X.; project administration, Z.L.; resources, Z.L. and T.X.; software, X.L., N.Y., J.C. and H.S.; supervision, Z.L. and T.X.; validation, Z.L., X.L. and T.X.; visualization, X.L., N.Y. and J.C.; writing—original draft, Z.L., X.L. and T.X.; writing—review and editing, Z.L., X.L. and T.X. All authors have read and agreed to the published version of the manuscript.

Funding

This work was supported by the Ministry of Education of Humanities and Social Science Project (Grant Number: 24YJCZH192), the China Postdoctoral Science Foundation (Grant Number: 2024T171159), the Heilongjiang Postdoctoral Financial Assistance (Grant Number: LBH-Z23196), the Liaoning Provincial Natural Science Foundation Joint Fund Project (Grant Number: 2023-MSBA-094), the Liaoning Social Science Planning Fund Project (Grant Number: L22CGL012), and the Heilongjiang Province Key Research and Development Plan Project (Grant Number: 2022ZX01A33).

Data Availability Statement

The original contributions presented in this study are included in the article. Further inquiries can be directed to the corresponding author.

Conflicts of Interest

Author Zheming Liu was employed by the Architectural Design and Research Institute of HIT Co., Ltd. The remaining authors declare that the research was conducted in the absence of any commercial or financial relationships that could be construed as a potential conflict of interest.

References

  1. Grimm, N.B.; Faeth, S.H.; Golubiewski, N.E.; Redman, C.L.; Wu, J.; Bai, X.; Briggs, J.M. Globl change and the ecology of cities. Science 2008, 319, 756–760. [Google Scholar] [CrossRef] [PubMed]
  2. Oke, T.R.; Mills, G.; Christen, A.; Voogt, J.A. Urban Climates; Cambridge University Press: Cambridge, UK, 2017. [Google Scholar]
  3. Kabano, P.; Lindley, S.; Harris, A. Evidence of urban heat island impacts on the vegetation growing season length in a tropical city. Landsc. Urban Plan. 2021, 206, 103989. [Google Scholar] [CrossRef]
  4. Zhao, C.; Weng, Q.; Wang, Y.; Hu, Z.; Wu, C. Use of local climate zones to assess the spatiotemporal variations of urban vegetation phenology in Austin, Texas, USA. GISci. Remote Sens. 2022, 59, 393–409. [Google Scholar] [CrossRef]
  5. He, B.-J.; Wang, J.; Zhu, J.; Qi, J. Beating the urban heat: Situation, background, impacts and the way forward in China. Renew. Sustain. Energy Rev. 2022, 161, 112350. [Google Scholar] [CrossRef]
  6. Oke, T.R. The energetic basis of the urban heat island. Q. J. R. Meteorol. Soc. 1982, 108, 1–24. [Google Scholar] [CrossRef]
  7. Arnfield, A.J. Two decades of urban climate research: A review of turbulence, exchanges of energy and water, and the urban heat island. Int. J. Climatol. 2003, 23, 1–26. [Google Scholar] [CrossRef]
  8. Watts, N.; Amann, M.; Ayeb-Karlsson, S.; Belesova, K.; Bouley, T.; Boykoff, M.; Costello, A. The Lancet Countdown on health and climate change: From 25 years of inaction to a global transformation for public health. Lancet 2018, 391, 581–630. [Google Scholar] [CrossRef]
  9. Xu, R.; Yu, P.; Abramson, M.J.; Johnston, F.H.; Samet, J.M.; Bell, M.L.; Guo, Y. Wildfires, global climate change, and human health. N. Engl. J. Med. 2020, 383, 2173–2181. [Google Scholar] [CrossRef]
  10. Lyu, K.; Licina, D.; Wienold, J.; Tehrani, H.K.; Khovalyg, D. A multidomain approach to neighbourhood typology for urban environmental studies. Sustain. Cities Soc. 2025, 128, 106378. [Google Scholar] [CrossRef]
  11. Stewart, I.D.; Oke, T.R. Local climate zones for urban temperature studies. Bull. Am. Meteorol. Soc. 2012, 93, 1879–1900. [Google Scholar] [CrossRef]
  12. Stewart, I.D.; Oke, T.R.; Krayenhoff, E.S. Evaluation of the ‘local climate zone’ scheme using temperature observations and model simulations. Int. J. Climatol. 2014, 34, 1062–1080. [Google Scholar] [CrossRef]
  13. Leconte, F.; Bouyer, J.; Claverie, R.; Pétrissans, M. Estimation of spatial air temperature distribution at sub-mesoclimatic scale using the LCZ scheme and mobile measurements. In Proceedings of the 9th International Conference on Urban Climate (ICUC), Toulouse, France, 20–24 July 2015. [Google Scholar]
  14. Chen, F.; Huang, Y. A new comparative analysis of local urban morphology based on local climate zones: A study using mobile surveys in Chengdu tested. In Proceedings of the 25th International Seminar on Urban Form (ISUF), Krasnoyarsk, Russia, 5–9 July 2018. [Google Scholar]
  15. Bokwa, A.; Dobrovolny, P.; Gal, T.; Geletič, J.; Gál, C.; Hajto, M.; Hollósi, B.; Kielar, R.; Lehnert, M.; Škarbit, N.; et al. Modelling the impact of climate change on heat load increase in Central European cities. In Proceedings of the 9th International Conference on Urban Climate (ICUC), Toulouse, France, 20–24 July 2015. [Google Scholar]
  16. Skarbit, N.; Gál, T. Projection of intra-urban modification of nighttime climate indices during the 21st century. Hung. Geogr. Bull. 2016, 65, 181–193. [Google Scholar] [CrossRef]
  17. Sharma, R.; Hooyberghs, H.; Lauwaet, D.; De Ridder, K. Urban heat island and future climate change—Implications for Delhi’s heat. J. Urban Health 2019, 96, 235–251. [Google Scholar] [CrossRef] [PubMed]
  18. Grunwald, L.; Kossmann, M.; Weber, S. Mapping urban cold- air paths in a Central European city using numerical modelling and geospatial analysis. Urban Clim. 2019, 29, 100503. [Google Scholar] [CrossRef]
  19. Yang, X.; Yao, L.; Peng, L.L.; Jiang, Z.; Jin, T.; Zhao, L. Evaluation of a diagnostic equation for the daily maximum urban heat island intensity and its application to building energy simulations. Energy Build. 2019, 193, 160–173. [Google Scholar] [CrossRef]
  20. Middel, A.; Häb, K.; Brazel, A.J.; Martin, C.A.; Guhathakurta, S. Impact of urban form and design on mid-afternoon microclimate in Phoenix Local Climate Zones. Landsc. Urban Plan. 2014, 122, 16–28. [Google Scholar] [CrossRef]
  21. Chatterjee, S.; Khan, A.; Dinda, A.; Mithun, S.M.; Khatun, R.; Akbari, H.; Kusaka, H.; Mitra, C.; Bhatti, S.S.; Doan, Q.V.; et al. Simulating micro-scale thermal interactions in different building environments for mitigating urban heat islands. Sci. Total Environ. 2019, 663, 610–631. [Google Scholar] [CrossRef]
  22. Long, N.; Gardes, T.; Hidalgo, J.; Masson, V.; Schoetter, R. Influence of urban morphology on urban heat island intensity: An approach based on Local Climate Zone classification. PeerJ Prepr. 2018, 6, e27208v1. [Google Scholar] [CrossRef]
  23. Geletič, J.; Lehnert, M.; Dobrovolný, P. Modelled spatio-temporal variability of air temperature in an urban climate and its validation: A case study of Brno, Czech Republic. Hung. Geogr. Bull. 2016, 65, 169–180. [Google Scholar] [CrossRef]
  24. Gál, T.; Skarbit, N.; Molnár, G.; Unger, J. Weather and climate modeling possibilities using local climate zone concept and observation network in Szeged, Hungary. In Proceedings of the 10th International Conference on Urban Climate (ICUC), New York, NY, USA, 6–10 August 2018. [Google Scholar]
  25. Verdonck, M.-L.; Demuzere, M.; Hooyberghs, H.; Beck, C.; Cyrys, J.; Schneider, A.; Dewulf, R.; Van Coillie, F. The potential of local climate zones maps as a heat stress assessment tool, supported by simulated air temperature data. Landsc. Urban Plan. 2018, 178, 183–197. [Google Scholar] [CrossRef]
  26. Brousse, O.; Martilli, A.; Foley, M.; Mills, G.; Bechtel, B. WUDAPT, an efficient land use producing data tool for mesoscale models? Integration of urban LCZ in WRF over Madrid. Urban Clim. 2016, 17, 116–134. [Google Scholar] [CrossRef]
  27. Ren, C.; Fung, J.C.H.; Tse, J.W.P.; Ng, E. Implementing WUDAPT product into urban development impact analysis by using WRF simulation result: A case study of the Pearl River Delta Region (1980–2010). In Proceedings of the 13th Symposium of the Urban Environment, Seattle, WA, USA, 21–25 January 2018. [Google Scholar]
  28. Hammerberg, K.; Brousse, O.; Martilli, A.; Mahdavi, A. Implications of employing detailed urban canopy parameters for mesoscale climate modelling: A comparison between WUDAPT and GIS databases over Vienna, Austria. Int. J. Climatol. 2018, 38, e1241–e1257. [Google Scholar] [CrossRef]
  29. Ren, J.; Shi, K.; Kong, X.; Zhou, H. On-site measurement and numerical simulation study on characteristic of urban heat island in a multi-block region in Beijing, China. Sustain. Cities Soc. 2023, 95, 104615. [Google Scholar] [CrossRef]
  30. Köppen, W. Das geographische System der Klimate. In Handbuch der Klimatologie; Köppen, I.W., Geiger, G., Eds.; Gebrüder Borntraeger: Stuttgart, Germany, 1936; pp. 1–44. [Google Scholar]
  31. Núnez-Peiro, M.; Sanchez-Guevara, C.; Neila, G.F.J. Hourly evolution of intra-urban temperature variability across the local climate zones. The case of Madrid. Urban Clim. 2021, 39, 100921. [Google Scholar] [CrossRef]
  32. Badaro-Saliba, N.; Adjizian-Gerard, J.; Zaarour, R.; Najjar, G. LCZ scheme for assessing Urban Heat Island intensity in a complex urban area (Beirut, Lebanon). Urban Clim. 2021, 37, 100846. [Google Scholar] [CrossRef]
  33. Cilek, M.U.; Cilek, A. Analyses of land surface temperature (LST) variability among local climate zones (LCZs) comparing Landsat-8 and ENVI-met model data. Sustain. Cities Soc. 2021, 69, 102877. [Google Scholar] [CrossRef]
  34. Anjos, M.; Targino, A.C.; Krecl, P.; Oukawa, G.Y.; Braga, R.F. Analysis of the urban heat island under different synoptic patterns using local climate zones. Build. Environ. 2020, 185, 107268. [Google Scholar] [CrossRef]
  35. Chen, G.; Chen, Y.; Tan, X.; Zhao, L.; Cai, Y.; Li, L. Assessing the urban heat island effect of different local climate zones in Guangzhou, China. Build. Environ. 2023, 244, 110770. [Google Scholar] [CrossRef]
  36. Chen, G.; Li, N.; Cai, Y.; He, M. Analysis of the Characteristics of Heat Island Intensity Based on LCZ in the Summer of Guangzhou. Build. Sci. 2021, 37, 96–104. [Google Scholar] [CrossRef]
  37. Chen, G.; He, H.; Chen, Y.; Zhao, L.; Cai, Y.; Ma, Y. Applying a diagnostic equation for maximum urban heat island intensity based on local climate zones for Guangzhou, China. Build. Environ. 2023, 228, 109817. [Google Scholar] [CrossRef]
  38. Yang, X.; Yao, L.; Jin, T.; Peng, L.L.; Jiang, Z.; Hu, Z.; Ye, Y. Assessing the thermal behavior of different local climate zones in the Nanjing metropolis, China. Build. Environ. 2018, 137, 171–184. [Google Scholar] [CrossRef]
  39. Yang, X.; Yao, L.; Jin, T.; Jiang, Z.; Peng, L.; Ye, Y. Temporal and spatial variations of local temperatures in the summer of Nanjing. J. Civ. Environ. Eng. 2019, 41, 160–167. [Google Scholar] [CrossRef]
  40. O’Malley, C.; Kikumoto, H. An investigation into heat storage by adopting local climate zones and nocturnal-diurnal urban heat island differences in the Tokyo Prefecture. Sustain. Cities Soc. 2022, 83, 103959. [Google Scholar] [CrossRef]
  41. Alexander, P.; Mills, G. Local climate classification and Dublin’s urban heat island. Atmosphere 2014, 5, 755–774. [Google Scholar] [CrossRef]
  42. Leconte, F.; Bouyer, J.; Claverie, R.; Pétrissans, M. Using local climate zone scheme for UHI assessment: Evaluation of the method using mobile measurements. Build. Environ. 2015, 83, 39–49. [Google Scholar] [CrossRef]
  43. Beck, C.; Straub, A.; Breitner, S.; Cyrys, J.; Philipp, A.; Rathmann, J.; Schneider, A.; Wolf, K.; Jacobeit, J. Air temperature characteristics of local climate zones in the Augsburg urban area (Bavaria, southern Germany) under varying synoptic conditions. Urban Clim. 2018, 25, 152–166. [Google Scholar] [CrossRef]
  44. Zheng, Y.; Ren, C.; Shi, Y.; Yim, S.H.L.; Lai, D.Y.F.; Xu, Y.; Fang, C.; Li, W. Mapping the spatial distribution of nocturnal urban heat island based on Local Climate Zone framework. Build. Environ. 2023, 234, 110197. [Google Scholar] [CrossRef]
  45. Wang, C.; Middel, A.; Myint, S.W.; Kaplan, S.; Brazel, A.J.; Lukasczyk, J. Assessing local climate zones in arid cities: The case of Phoenix, Arizona and Las Vegas, Nevada. ISPRS J. Photogramm. Remote Sens. 2018, 141, 59–71. [Google Scholar] [CrossRef]
  46. Xi, T.; Li, J.; Yang, N.; Liu, X.; Guo, F. Analysis of the Characteristics of Heat Island Intensity Based on Local Climate Zones in the Transitional Season of Shenyang. Energies 2025, 18, 1053. [Google Scholar] [CrossRef]
  47. Grapas, C.; Pisello, A.L.; Pigliautile, I.; Guattari, C.; De Cristo, E. Multisensory Urban Climate Zones (MUCZ): A Framework for Mapping Dynamic Multidomain Human Comfort in Complex Urban Fabrics beyond Urban Morphology. Sustain. Cities Soc. 2025, 131, 106673. [Google Scholar] [CrossRef]
  48. Lam, C.K.C.; Shooshtarian, S.; Kenawy, I. Assessment of urban physical features on summer thermal perceptions using the local climate zone classification. Build. Environ. 2023, 236, 110265. [Google Scholar] [CrossRef]
  49. Fenner, D.; Meier, F.; Bechtel, B.; Otto, M.; Scherer, D. Intra and inter ‘local climate zone’ variability of air temperature as observed by crowdsourced citizen weather stations in Berlin, Germany. Meteorol. Z. 2017, 26, 525–547. [Google Scholar] [CrossRef]
  50. Skarbit, N.; Stewart, I.D.; Unger, J.; Gál, T. Employing an urban meteorological network to monitor air temperature conditions in the ‘local climate zones’ of Szeged, Hungary. Int. J. Climatol. 2017, 37, 582–596. [Google Scholar] [CrossRef]
  51. Rahmani, N.; Sharifi, A. Urban heat dynamics in Local Climate Zones (LCZs): A systematic review. Build. Environ. 2025, 267, 112225. [Google Scholar] [CrossRef]
  52. Feng, J.; Cai, X.; Chapman, L. Impact of atmospheric conditions and levels of urbanization on the relationship between nocturnal surface and urban canopy heat islands. Q. J. R. Meteorol. Soc. 2019, 145, 3284–3299. [Google Scholar] [CrossRef]
  53. Lelovics, E.; Unger, J.; Savić, S.; Gál, T.; Milošević, D.; Gál, C.V.; Kántor, N. Intra-urban temperature observations in two Central European cities: A summer study. Időjárás 2016, 120, 283–300. [Google Scholar]
  54. Xia, H.; Chen, Y.; Song, C.; Li, J.; Quan, J.; Zhou, G. Analysis of surface urban heat islands based on local climate zones via spatiotemporally enhanced land surface temperature. Remote Sens. Environ. 2022, 273, 112972. [Google Scholar] [CrossRef]
  55. Han, L.; Lu, L.; Fu, P.; Ren, C.; Cai, M.; Li, Q. Exploring the seasonality of surface urban heat islands using enhanced land surface temperature in a semi-arid city. Urban Clim. 2023, 49, 101455. [Google Scholar] [CrossRef]
  56. Dian, C.; Pongrácz, R.; Dezső, Z.; Bartholy, J. Annual and monthly analysis of surface urban heat island intensity with respect to the local climate zones in Budapest. Urban Clim. 2020, 31, 100573. [Google Scholar] [CrossRef]
  57. Dong, P.; Jiang, S.; Zhan, W.; Wang, C.; Miao, S.; Du, H.; Li, J.; Wang, S.; Jiang, L. Diurnally continuous dynamics of surface urban heat island intensities of local climate zones with spatiotemporally enhanced satellite-derived land surface temperatures. Build. Environ. 2022, 218, 109105. [Google Scholar] [CrossRef]
  58. Reis, C.; Lopes, A.; Nouri, A.S. Assessing urban heat island effects through local weather types in Lisbon’s Metropolitan Area using big data from the Copernicus service. Urban Clim. 2022, 43, 101168. [Google Scholar] [CrossRef]
  59. Eldesoky, A.H.M.; Gil, J.; Pont, M.B. The suitability of the urban local climate zone classification scheme for surface temperature studies in distinct macroclimate regions. Urban Clim. 2021, 37, 100823. [Google Scholar] [CrossRef]
  60. Lemoine-Rodríguez, R.; Inostroza, L.; Zepp, H. Does urban climate follow urban form? Analysing intraurban LST trajectories versus urban form trends in 3 cities with different background climates. Sci. Total Environ. 2022, 830, 154570. [Google Scholar] [CrossRef]
  61. Yang, X.; Xu, S.; Peng, L.L.; Chen, Y.; Yao, L. General air temperature and humidity features of local climate zones: A multi-city observational study in eastern China. Urban Clim. 2023, 51, 101652. [Google Scholar] [CrossRef]
  62. Zhang, R.; Yang, J.; Ma, X.; Xiao, X.; Xia, J.C. Optimal allocation of local climate zones based on heat vulnerability perspective. Sustain. Cities Soc. 2023, 99, 104981. [Google Scholar] [CrossRef]
  63. Shenyang Bureau of Statistics. 2024 Shenyang Statistical Yearbook; Shenyang Bureau of Statistics: Shenyang, China, 2024. Available online: https://tjj.shenyang.gov.cn/sjfb/tjgb/ (accessed on 20 October 2025).
  64. National Oceanic and Atmospheric Administration. Available online: https://www.noaa.gov (accessed on 17 November 2025).
  65. Atlas, W. Weather Atlas. Available online: https://www.weather-atlas.com/zh/china/shenyang-climate#temperature (accessed on 1 September 2024).
  66. Ching, J.; Mills, G.; Bechtel, B.; See, L.; Feddema, J.; Wang, X.; Theeuwes, N. WUDAPT: An urban weather, climate, and environmental modeling infrastructure for the anthropocene. Bull. Amer. Meteor. Soc. 2018, 99, 1907–1924. [Google Scholar] [CrossRef]
  67. China Meteorological Administration. Available online: https://www.cma.gov.cn/zfxxgk/gknr/qxbg/202503/t20250302_6886935.html (accessed on 2 March 2025).
  68. Oke, T.R. Initial Guidance to Obtain Representative Meteorological Observations at Urban Sites. World Meteorological Organization. 2006. Available online: https://library.wmo.int/idurl/4/35333 (accessed on 20 October 2025).
  69. China Meteorological Data Service Centre. China Meteorological Data Service Centre. Available online: https://data.cma.cn/en (accessed on 1 September 2024).
  70. Memon, R.A.; Leung, D.Y.C.; Liu, C.-H. An investigation of urban heat island intensity (UHII) as an indicator of urban heating. Atmos. Res. 2009, 94, 491–500. [Google Scholar] [CrossRef]
  71. Yang, X.; Li, Y.; Luo, Z.; Chan, P.W. The urban cool island phenomenon in a high-rise high-density city and its mechanisms. Int. J. Climatol. 2017, 37, 890–904. [Google Scholar] [CrossRef]
  72. National Emergency Broadcasting. Early Warning Information. Available online: http://www.cneb.gov.cn/yjxx/ (accessed on 20 October 2025).
  73. Shenyang Daily. 2024 Shenyang Climate: Higher Temperatures, More Precipitation, and Fewer Sunshine Hours. 20 January 2025. Available online: https://www.syd.com.cn/newscenter/content/2025-01/20/content_143904.html (accessed on 20 October 2025).
  74. Středová, H.; Chuchma, F.; Rožnovský, J.; Středa, T. Local Climate Zones, Land Surface Temperature and Air Temperature Interactions: Case Study of Hradec Králové, the Czech Republic. ISPRS Int. J. Geo-Inf. 2021, 10, 704. [Google Scholar] [CrossRef]
  75. Chen, X.; Yang, J.; Ren, C.; Jeong, S.; Shi, Y. Standardizing thermal contrast among local climate zones at a continental scale: Implications for cool neighborhoods. Build. Environ. 2021, 197, 107878. [Google Scholar] [CrossRef]
  76. Wang, Z.; Xing, W.; Huang, Y.; Xie, T. Studying the Urban Heat Island Using a Local Climate Zone Scheme. Pol. J. Environ. Stud. 2016, 25, 2609–2616. [Google Scholar] [CrossRef]
  77. Chen, Y.; Li, J.; Hu, Y.; Liu, L. Spatial and temporal characteristics of nighttime UHII based on local climate zone scheme using mobile measurement—A case study of Changsha. Build. Environ. 2023, 228, 109869. [Google Scholar] [CrossRef]
  78. See, L.; Perger, C.; Duerauer, M.; Fritz, S.; Bechtel, B.; Ching, J.; Alexander, P.; Mills, G.; Foley, M.; O’Connor, M.; et al. Developing a community-based worldwide urban morphology and materials database (WUDAPT) using remote sensing and crowdsourcing for improved urban climate modelling. In Proceedings of the 2015 Joint Urban Remote Sensing Event (JURSE), Lausanne, Switzerland, 30 March–1 April 2015; pp. 1–4. [Google Scholar] [CrossRef]
  79. Feng, Y.; Du, S.; Fraedrich, K.; Zhang, X.; Du, M.; Cheng, W. Local climate regionalization of the Tibetan Plateau: A data-driven scale-dependent analysis. Theor. Appl. Climatol. 2024, 155, 4813–4825. [Google Scholar] [CrossRef]
  80. Wang, R.; Voogt, J.; Ren, C.; Ng, E. Spatial-temporal variations of surface urban heat island: An application of local climate zone into large Chinese cities. Build. Environ. 2022, 222, 109378. [Google Scholar] [CrossRef]
  81. Lai, J.; Zhan, W.; Voogt, J.; Quan, J.; Huang, F.; Zhou, J.; Bechtel, B.; Hu, L.; Wang, K.; Cao, C. Meteorological controls on daily variations of nighttime surface urban heat islands. Remote Sens. Environ. 2021, 253, 112198. [Google Scholar] [CrossRef]
  82. Zhang, L.; Nikolopoulou, M.; Guo, S.; Song, D. Impact of LCZs spatial pattern on urban heat island: A case study in Wuhan, China. Build. Environ. 2022, 226, 109785. [Google Scholar] [CrossRef]
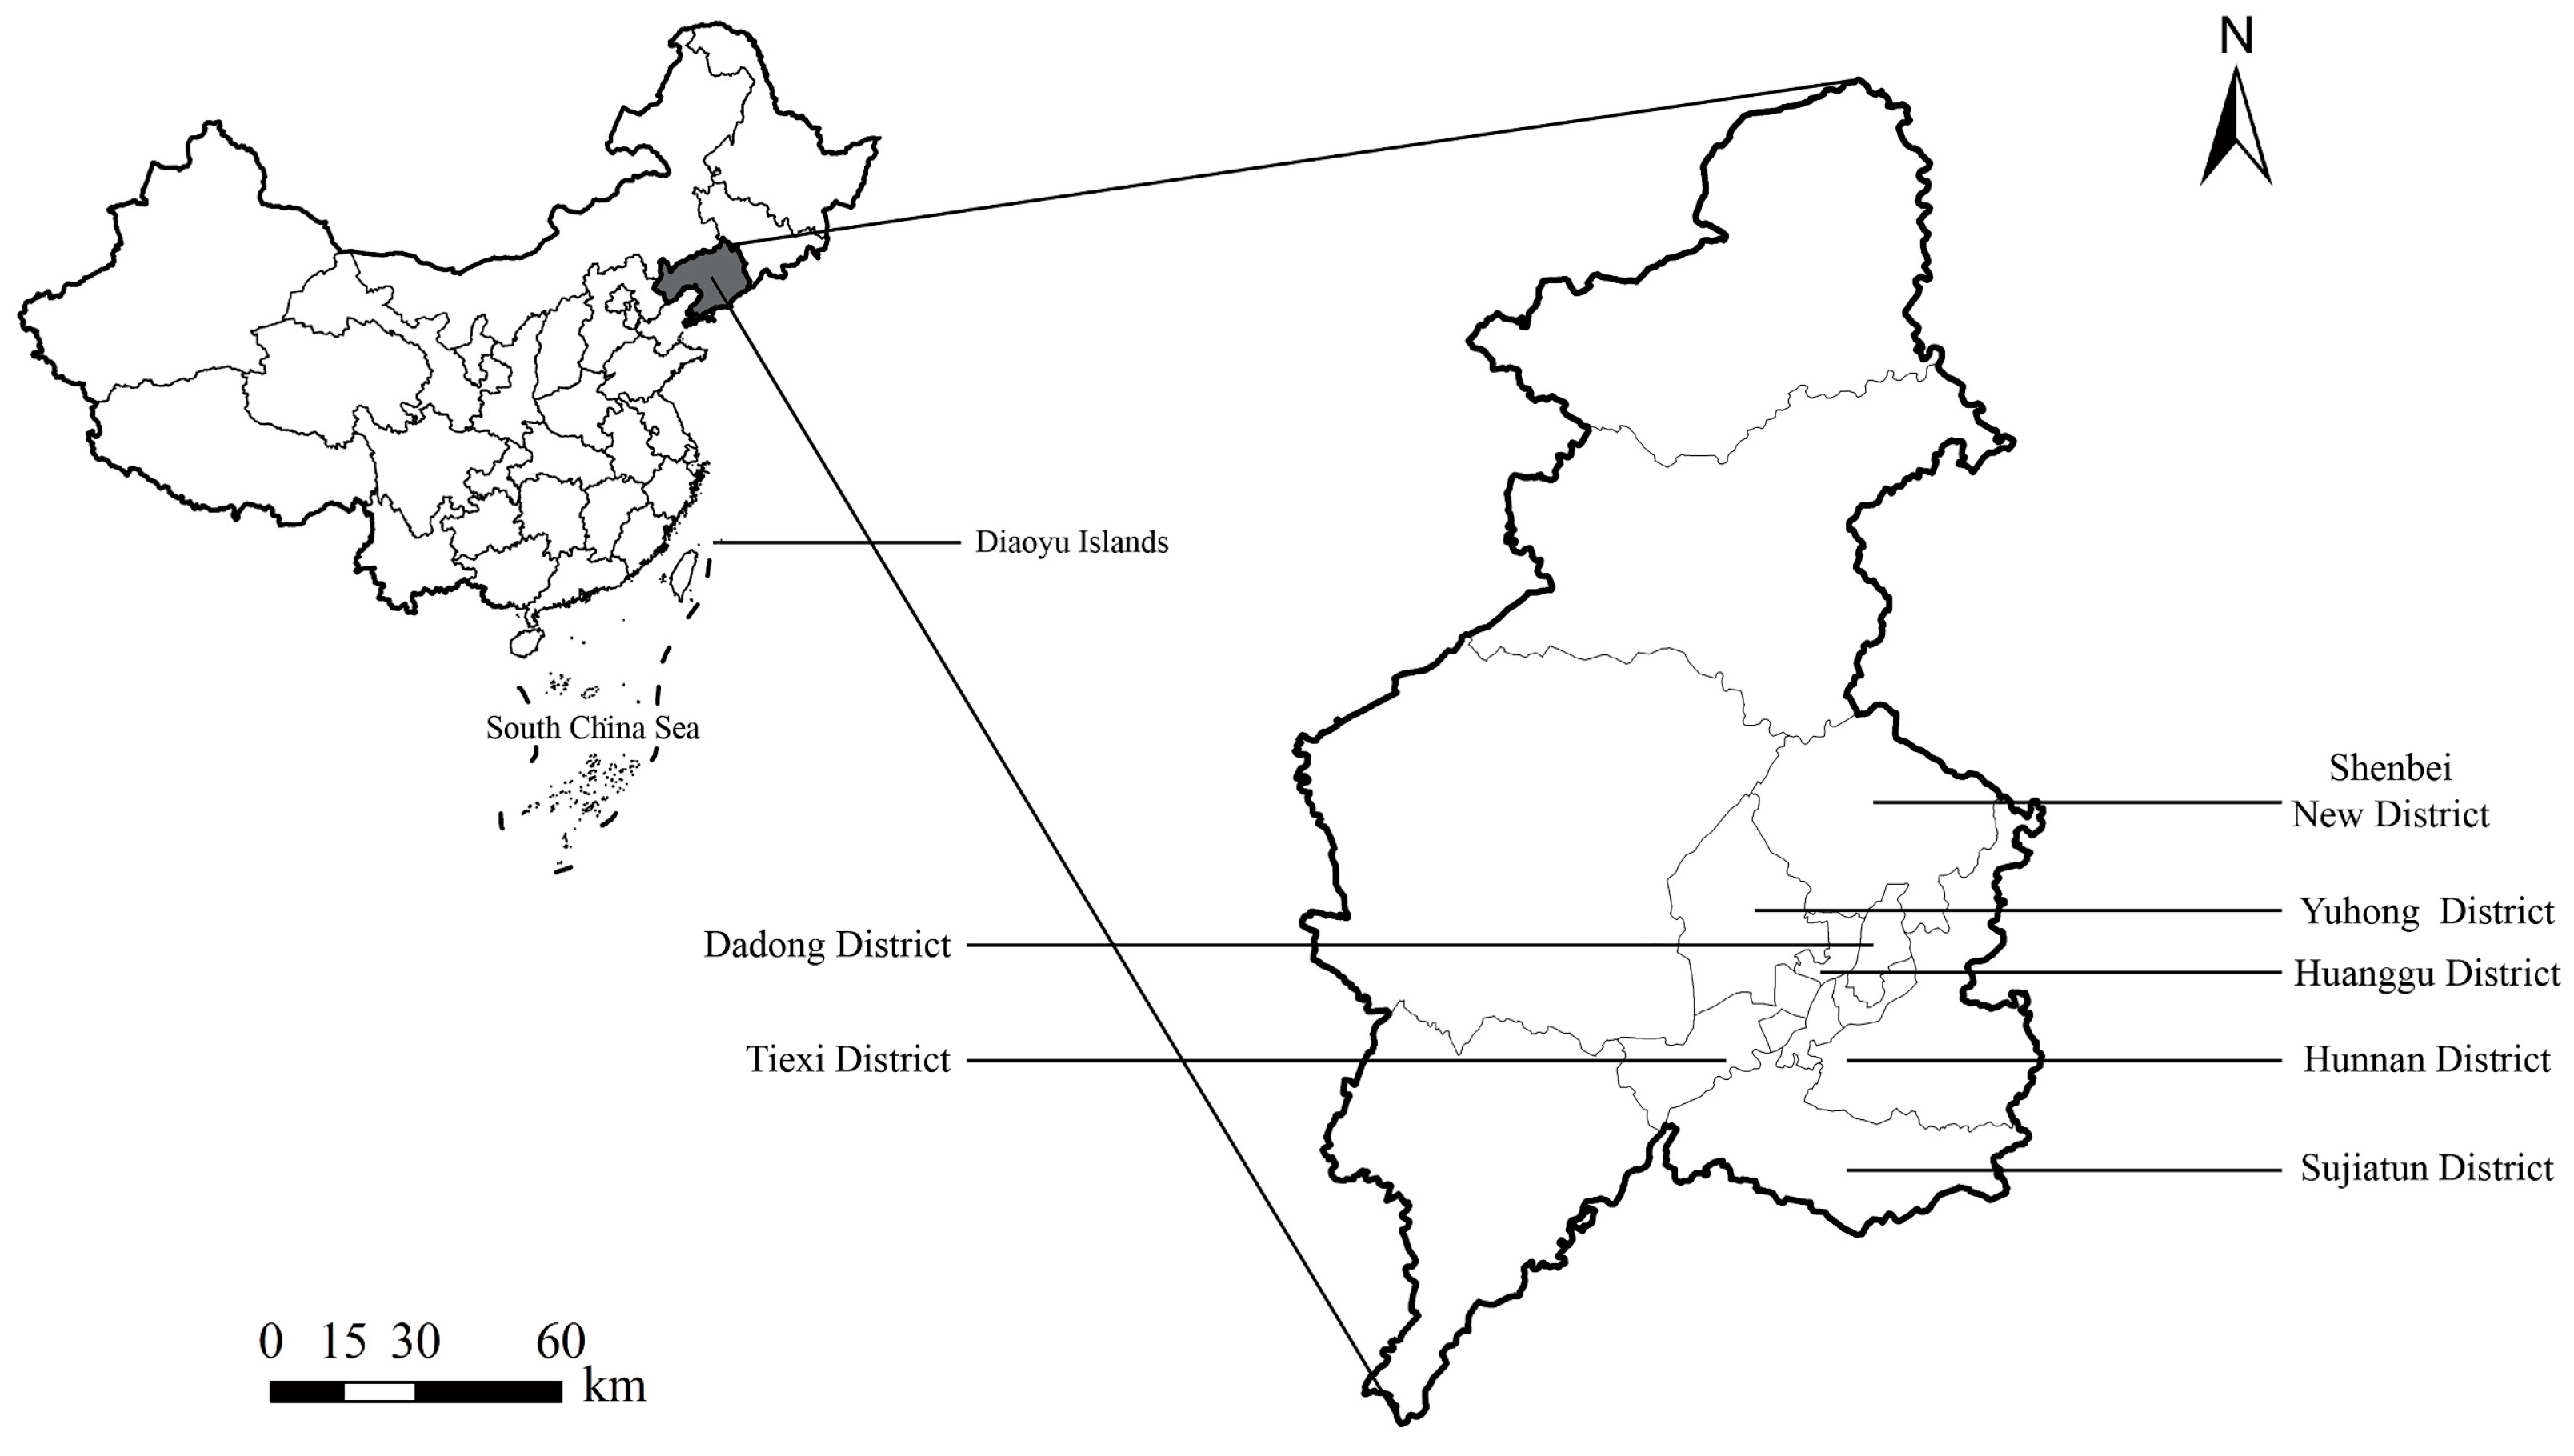
Figure 1. Location of the study area.
Land 14 02332 g001
Figure 2. Monthly average temperature changes in Shenyang for recent 5 years.
Land 14 02332 g002
Figure 3. Temperature changes in Shenyang from June to August in the past 10 years.
Land 14 02332 g003
Figure 4. LCZ map of the central urban area of Shenyang. (a) LCZ map of Shenyang. (b) Proportion of various types of LCZ in Shenyang. (c) Location of various LCZ measurement points in Shenyang [46].
Land 14 02332 g004
Figure 5. Hourly UHII in each LCZ in Shenyang during summer. (a) LCZ 2, (b) LCZ 4, (c) LCZ 6, (d) LCZ 8, (e) LCZ 10, (f) LCZ A.
Land 14 02332 g005
Figure 6. Cumulative heat/cold island degree hours (HIdh/CIdh) in each LCZ in Shenyang during summer.
Land 14 02332 g006
Figure 7. Frequency of heat island, cold island, and neutral events in each LCZ of Shenyang during summer: (a) daytime, (b) nighttime.
Land 14 02332 g007
Figure 8. Hourly air temperature chart for each stage of summer in Shenyang.
Land 14 02332 g008
Figure 9. Temperature change, UHII change in each LCZ in four summer stages. (a) LCZ 2, (b) LCZ 4, (c) LCZ 6, (d) LCZ 8, (e) LCZ 10, (f) LCZ A.
Land 14 02332 g009
Figure 10. Change rates of each LCZ for four summer stages. (a) LCZ 2, (b) LCZ 4, (c) LCZ 6, (d) LCZ 8, (e) LCZ 10, (f) LCZ A, (g) LCZ D. (Left: cooling/warming rate; Right: heat island intensity change rate).
Land 14 02332 g010aLand 14 02332 g010b
Figure 11. Comparison of UHII in each LCZ of Shenyang, Nanjing, and Guangzhou. (a) Daytime, (b) nighttime.
Land 14 02332 g011
Figure 12. Comparison of UHII in each LCZ of Shenyang during summer and transition season. (a) Daytime, (b) nighttime.
Land 14 02332 g012
Table 1. LCZ morphological parameters ans measurement point locations.
LCZActual Morphological Parameters of the PlotLCZ Morphological Parameter Range [11]Measuring Point and Surrounding Environment (Radius 500 m)
LCZ 2: Compact mid-riseLand 14 02332 i001Station 1—Hunnan DistrictLand 14 02332 i002
SVF0.470.3–0.6
AR1.070.75–2
BSF37.08% *40–70%
ISF46.75%30–50%
HRE23 m10–25 m
LCZ 4: Open high-riseLand 14 02332 i003Station 2—Hunnan DistrictLand 14 02332 i004
SVF0.550.5–0.7
AR0.960.75–1.25
BSF22.17%20–40%
ISF39.51%30–40%
HRE51 m>25 m
LCZ 6: Open low-riseLand 14 02332 i005Station 4—Sujiatun DistrictLand 14 02332 i006
SVF0.91 *0.6–0.9
AR0.19 *0.3–0.75
BSF18.84% *20–40%
ISF21.18%20–50%
HRE3 m3–10 m
LCZ 8: Large low-riseLand 14 02332 i007Station 5—Dongling DistrictLand 14 02332 i008
SVF0.91>0.7
AR0.07 *0.1–0.3
BSF32.83%30–50%
ISF40.02%40–50%
HRE7 m3–10 m
LCZ 10: Heavy industryLand 14 02332 i009Station 6—Tiexi DistrictLand 14 02332 i010
SVF0.890.6–0.9
AR0.18 *0.2–0.5
BSF15.65% *20–30%
ISF39.14%20–40%
HRE7 m5–15 m
LCZ A: Dense treesLand 14 02332 i011Station 7—Sujiatun DistrictLand 14 02332 i012
SVF-<0.4
AR>1>1
BSF0.52%<10%
ISF0.92%<10%
HRE3 m3–30 m
LCZ D: Low plantsLand 14 02332 i013Station 8—Sujiatun DistrictLand 14 02332 i014
SVF1>0.9
AR-<0.1
BSF0.00%<10%
ISF0.58%<10%
HRE0 m<1 m
* indicates values outside the morphological parameter range.
Table 2. Technical parameters of the instrument.
Meteorological ParametersInstrument ModelMeasuring RangeAccuracy
Air Temperature (Ta) °CHOBO MX2301A Temperature and humidity meter recorder−40 ~ 70 °C±0.2 °C
Table 3. Distribution of ideal days during summer.
StageEarly-Summer (S1)Mid-Summer (S2)Peak-Summer (S3)Late-Summer (S4)
Number of ideal days42858
Disclaimer/Publisher’s Note: The statements, opinions and data contained in all publications are solely those of the individual author(s) and contributor(s) and not of MDPI and/or the editor(s). MDPI and/or the editor(s) disclaim responsibility for any injury to people or property resulting from any ideas, methods, instructions or products referred to in the content.