Article

Research on Cultivated Land Use System Resilience in Major Grain-Producing Areas Under the “Resource–Utilization–Production–Ecology” Framework: A Case Study of the Songnen Plain, China

1
School of Public Administration and Law, Northeast Agricultural University, Harbin 150030, China
2
Heilongjiang Institute of Natural Resources Rights Survey and Monitoring, Harbin 150080, China
*
Author to whom correspondence should be addressed.
Land 2025, 14(11), 2292; https://doi.org/10.3390/land14112292
Submission received: 17 October 2025 / Revised: 15 November 2025 / Accepted: 19 November 2025 / Published: 20 November 2025

Abstract

Clarifying the spatiotemporal evolution pattern of cultivated land use system resilience (CLUSR) in major grain-producing areas and identifying the key obstacles constraining its enhancement is of great significance for promoting the sustainable development of cultivated land use systems and ensuring regional food security. Taking the Songnen Plain, a typical major grain-producing area in China, as the study area, we constructed a CLUSR evaluation index system based on the “Resources–Utilization–Production–Ecology” (RUPE) framework and analyzed the spatiotemporal dynamics of CLUSR. Furthermore, we identified the primary factors impeding CLUSR enhancement. The results were as follows: (1) From 2005 to 2020, CLUSR values in the Songnen Plain ranged from 0.3353 to 0.4256, indicating a moderately low level overall but showing an upward trend. Across subsystems, the mean resilience scores followed the order ESR (0.121) > RER (0.114) > GPSR (0.090) > CLUR (0.055). (2) Spatially, CLUSR exhibited a distinct “high in the east and low in the west” pattern, with significant growth in the northwestern region. High–High clusters were primarily concentrated in the southeastern part of the study area, while Low–Low clusters exhibited a divergent spatial pattern. (3) From an indicator perspective, agricultural output value per unit of cultivated area, water coverage degree, agricultural labor input, agricultural mechanization level, cultivated land area, per capita yield of grain, and agricultural capital investment were identified as the dominant obstacles to CLUSR improvement. From a subsystem perspective, grain production stability and cultivated land use subsystems were the primary factors limiting CLUSR improvement in the Songnen Plain. (4) At the county level, obstacle factors were classified into three types: single, dual, and multiple obstacles. Nearly half of the counties were facing multiple constraints simultaneously. This study provides theoretical and practical implications for the formulation of cultivated land use policies in the Songnen Plain and other major grain-producing areas worldwide, thereby contributing to the sustainable utilization of cultivated land.

1. Introduction

Cultivated land, as a typical semi-natural and semi-artificial ecosystem, is a crucial strategic resource for ensuring food security, achieving Zero Hunger (United Nations Sustainable Development Goal 2, proposed in 2015), and fostering sustainable socioeconomic development [1,2]. It also plays a significant role in shaping the ecological environment. The utilization and protection of cultivated land have consistently constituted fundamental, strategic, and societal challenges [3]. Under the circumstances of climate change, frequent extreme weather events, and intensified human disturbances, the sustainable use of cultivated land is increasingly exposed to multiple external pressures and challenges. Enhancing cultivated land resilience (CLR), particularly cultivated land use system resilience (CLUSR), to bolster its capacity to withstand external disturbances, adapt to change, recover its structure and functions, and even undergo transformation, is therefore a critical pathway toward achieving sustainability in land use [4]. As one of the most populous countries in the world and the largest developing economy, China is undergoing rapid urbanization, industrialization, and agricultural modernization. These processes have led to increasingly prominent challenges concerning the quantity, quality, and ecological status of its cultivated land, thereby significantly compromising its sustainable utilization capacity [5]. In response, the Chinese government has promulgated a series of policies to enforce the strictest cultivated land protection regime [6], promoting an integrated “quantity–quality–ecology” framework. Consequently, research on CLR and CLUSR has emerged as a pivotal frontier in the field [7,8,9], following earlier studies on soil quality, agricultural productivity, agroecosystem health, and land degradation monitoring [10,11,12]. Quantitatively evaluating and revealing the spatiotemporal heterogeneity of CLUSR is crucial for facilitating a comprehensive diagnosis of the system’s capacity and thresholds for resisting exogenous risks [11], thus providing critical decision-making references for regional zonal management and sustainable utilization of cultivated land.
Resilience, originating from the Latin term resilio (meaning “to rebound”), refers to the capacity of a system to recover its original state after being exposed to external shocks or disturbances [4,13,14,15]. In the 1970s, the ecologist Holling first introduced resilience into ecology, establishing a foundational framework to evaluate ecosystem stability, persistence, and the ability to withstand external disruptions while adapting to changing conditions [16,17]. Subsequently, as the concept of resilience has been extended and refined, its application has expanded into numerous disciplines, including economics [18], disaster science [19], urban studies [20], and agricultural science [21]. It has thus become an essential theoretical foundation for investigating the stability and sustainability of socio-ecological systems [22]. Given that cultivated land often exhibits properties analogous to the “pressure-bearing capacity” and “resilience” of solid materials during its utilization process [23], increasing scholarly attention has been directed toward CLR and CLUSR in recent years [2,12,24]. CLUSR is defined as the capacity of a cultivated land use system to withstand and respond to natural or anthropogenic disturbances by relying on its inherent resource endowments, socioeconomic support elements, grain production functions, and ecological regulation mechanisms. It encompasses resistance, adaptability, recovery, and transformation, with the ultimate goal of sustaining stable grain production and maintaining ecological balance, thereby reflecting the overall flexibility and sustainability of cultivated land [4,25,26]. Contemporary research on CLUSR primarily focuses on quantitative assessment methodologies. Existing resilience measurement models, such as shock-cycle models [14], general-cycle frameworks [27], model simulation techniques [28], the empirical method [29], bioeconomy assessment acts [10], and comprehensive index models [4,30,31], can provide theoretical and methodological foundations for measuring the CLUSR. Among these, comprehensive index models have gained widespread application, as they not only enable the simulation of the occurrence processes of CLR or CLUSR through frameworks such as the pressure–state–response (PSR) model [22], resistance–adaptation–transformation frameworks [8], apparent–potential resilience models [4], and input–feedback mechanisms, but also reveal the structural sources of resilience [11]. In terms of research scale, studies on CLR or CLUSR span provincial [32], county [7], and grid levels [2]. For example, Miao et al. [2] took Qiqihar City, a representative black soil region, as their study area and developed PSR models for the ecological and socioeconomic subsystems. Their grid-based assessment of cultivated land ecosystem resilience in 2020 showed that the ecological subsystem was more resilient than the socioeconomic subsystem, with socioeconomic inputs emerging as the main limiting factor. Liu et al. [8] reconstructed the concept of CLUSR, simulated the occurrence process of resilience, and developed a resilience–adaptability–transformability evaluation framework. This framework was then applied to analyze the spatiotemporal patterns and influencing factors of CLUSR at the county level in typical areas of the Lower Liaohe Plain from 2009 to 2018. Xu et al. [9] developed a comprehensive index model to assess CLUSR in terms of the production, ecological, and economic dimensions. At the provincial scale, they examined the spatiotemporal evolution of resilience in China’s major grain-producing regions from 2000 to 2020 and identified key drivers for its enhancement. In summary, existing studies provide a solid theoretical foundation for research on CLR/CLUSR. However, current practices in constructing evaluation index systems exhibit certain limitations. Many studies focus primarily on the process of resilience occurrence, whereas others, grounded in the structural composition of resilience systems, often design indicators specific to regional contexts. This latter approach frequently overlooks the coupled and progressive relationships among the subsystems that collectively contribute to overall resilience. Consequently, the field suffers from a lack of unified evaluation frameworks, thereby limiting interregional comparability and practical applicability. Furthermore, the predominant focus on administrative units as the primary research scale fails to fully capture the overall resilience level and spatial differentiation characteristics of CLUSR within specific natural geographical patterns and functional zones, ultimately restricting the effectiveness of policy formulation and implementation.
Cultivated land use systems are complex socio-ecological systems integrating natural and human-managed components [2], and measurements of their resilience must comprehensively reflect these two dimensions. From the natural perspective, it encompasses resource endowment and ecological sustainability [33], whereas in the human-managed dimension, key aspects comprise land utilization and grain production [34]. Furthermore, resource endowment, land utilization, grain production, and ecological sustainability together form a logical chain underlying the whole-process theory of cultivated land. Therefore, constructing an evaluation index system based on the “Resources–Utilization–Production–Ecology” (RUPE) framework can comprehensively capture the fundamental operational logic of the system and enable a scientific characterization of its resistance, adaptation, and transformation capacities when confronting external disturbances. Accordingly, it is imperative to integrate the RUPE conceptual framework with the theory of CLUSR to establish a multi-indicator assessment system.
The Songnen Plain, situated within the typical black soil region of Northeast China, possesses exceptional resource endowment conditions. It serves as one of the nation’s most crucial commodity grain bases [35] and a significant ecological functional area in North China [36], often regarded as the “anchor” and “stabilizer” of China’s food security [37]. However, decades of intensive cultivation and unsustainable land use practices have led to a severe decline in the cultivated land environment, manifesting in soil thinning, decreasing soil organic matter, soil compaction, agricultural pollution, and the multifunctional degradation of cultivated land [38]. These processes have significantly compromised CLUSR. On the other hand, in recent years, the national government has actively promoted ecological civilization reforms and implemented a series of cultivated land protection policies, such as crop rotation and fallow systems, land reclamation, soil and water conservation projects, and soil testing for formulated fertilization. Concurrently, advancements in agricultural modernization have gradually improved the efficiency and sustainability of cultivated land utilization. Within this complex context, CLUSR in the Songnen Plain has exhibited pronounced spatiotemporal heterogeneity. Understanding the spatiotemporal evolution of CLUSR in the Songnen Plain and formulating effective regulatory measures is therefore of great importance for protecting the quality of black soil, ensuring national food security, and promoting sustainable socioeconomic and ecological development. Accordingly, this study selects the Songnen Plain as its research area to investigate the spatiotemporal evolution characteristics of CLUSR from 2005 to 2020 (a period during which the country began to promote agricultural modernization and repeatedly emphasized ensuring food security), identify the primary obstacles to resilience, and propose targeted management strategies. The main objectives are as follows: (1) to construct a comprehensive evaluation index system for CLUSR based on the “RUPE” framework; (2) to analyze the spatiotemporal evolution of CLUSR and its subsystem resilience in the Songnen Plain from 2005 to 2020; (3) to identify and diagnose the key obstacles impacting CLUSR in the study area; and (4) to implement obstacle-oriented zoning strategies aimed at mitigating constraints and enhancing resilience. The “RUPE” framework and methodology used in this study are applicable to other regions globally that are exploring CLUSR. The findings of this research are expected to provide valuable evidence to support decision-making in formulating cultivated land protection policies and implementing differentiated land management strategies in Songnen Plain, China, as well as to offer insights for countries encountering similar challenges.

2. Materials and Methods

2.1. Study Area

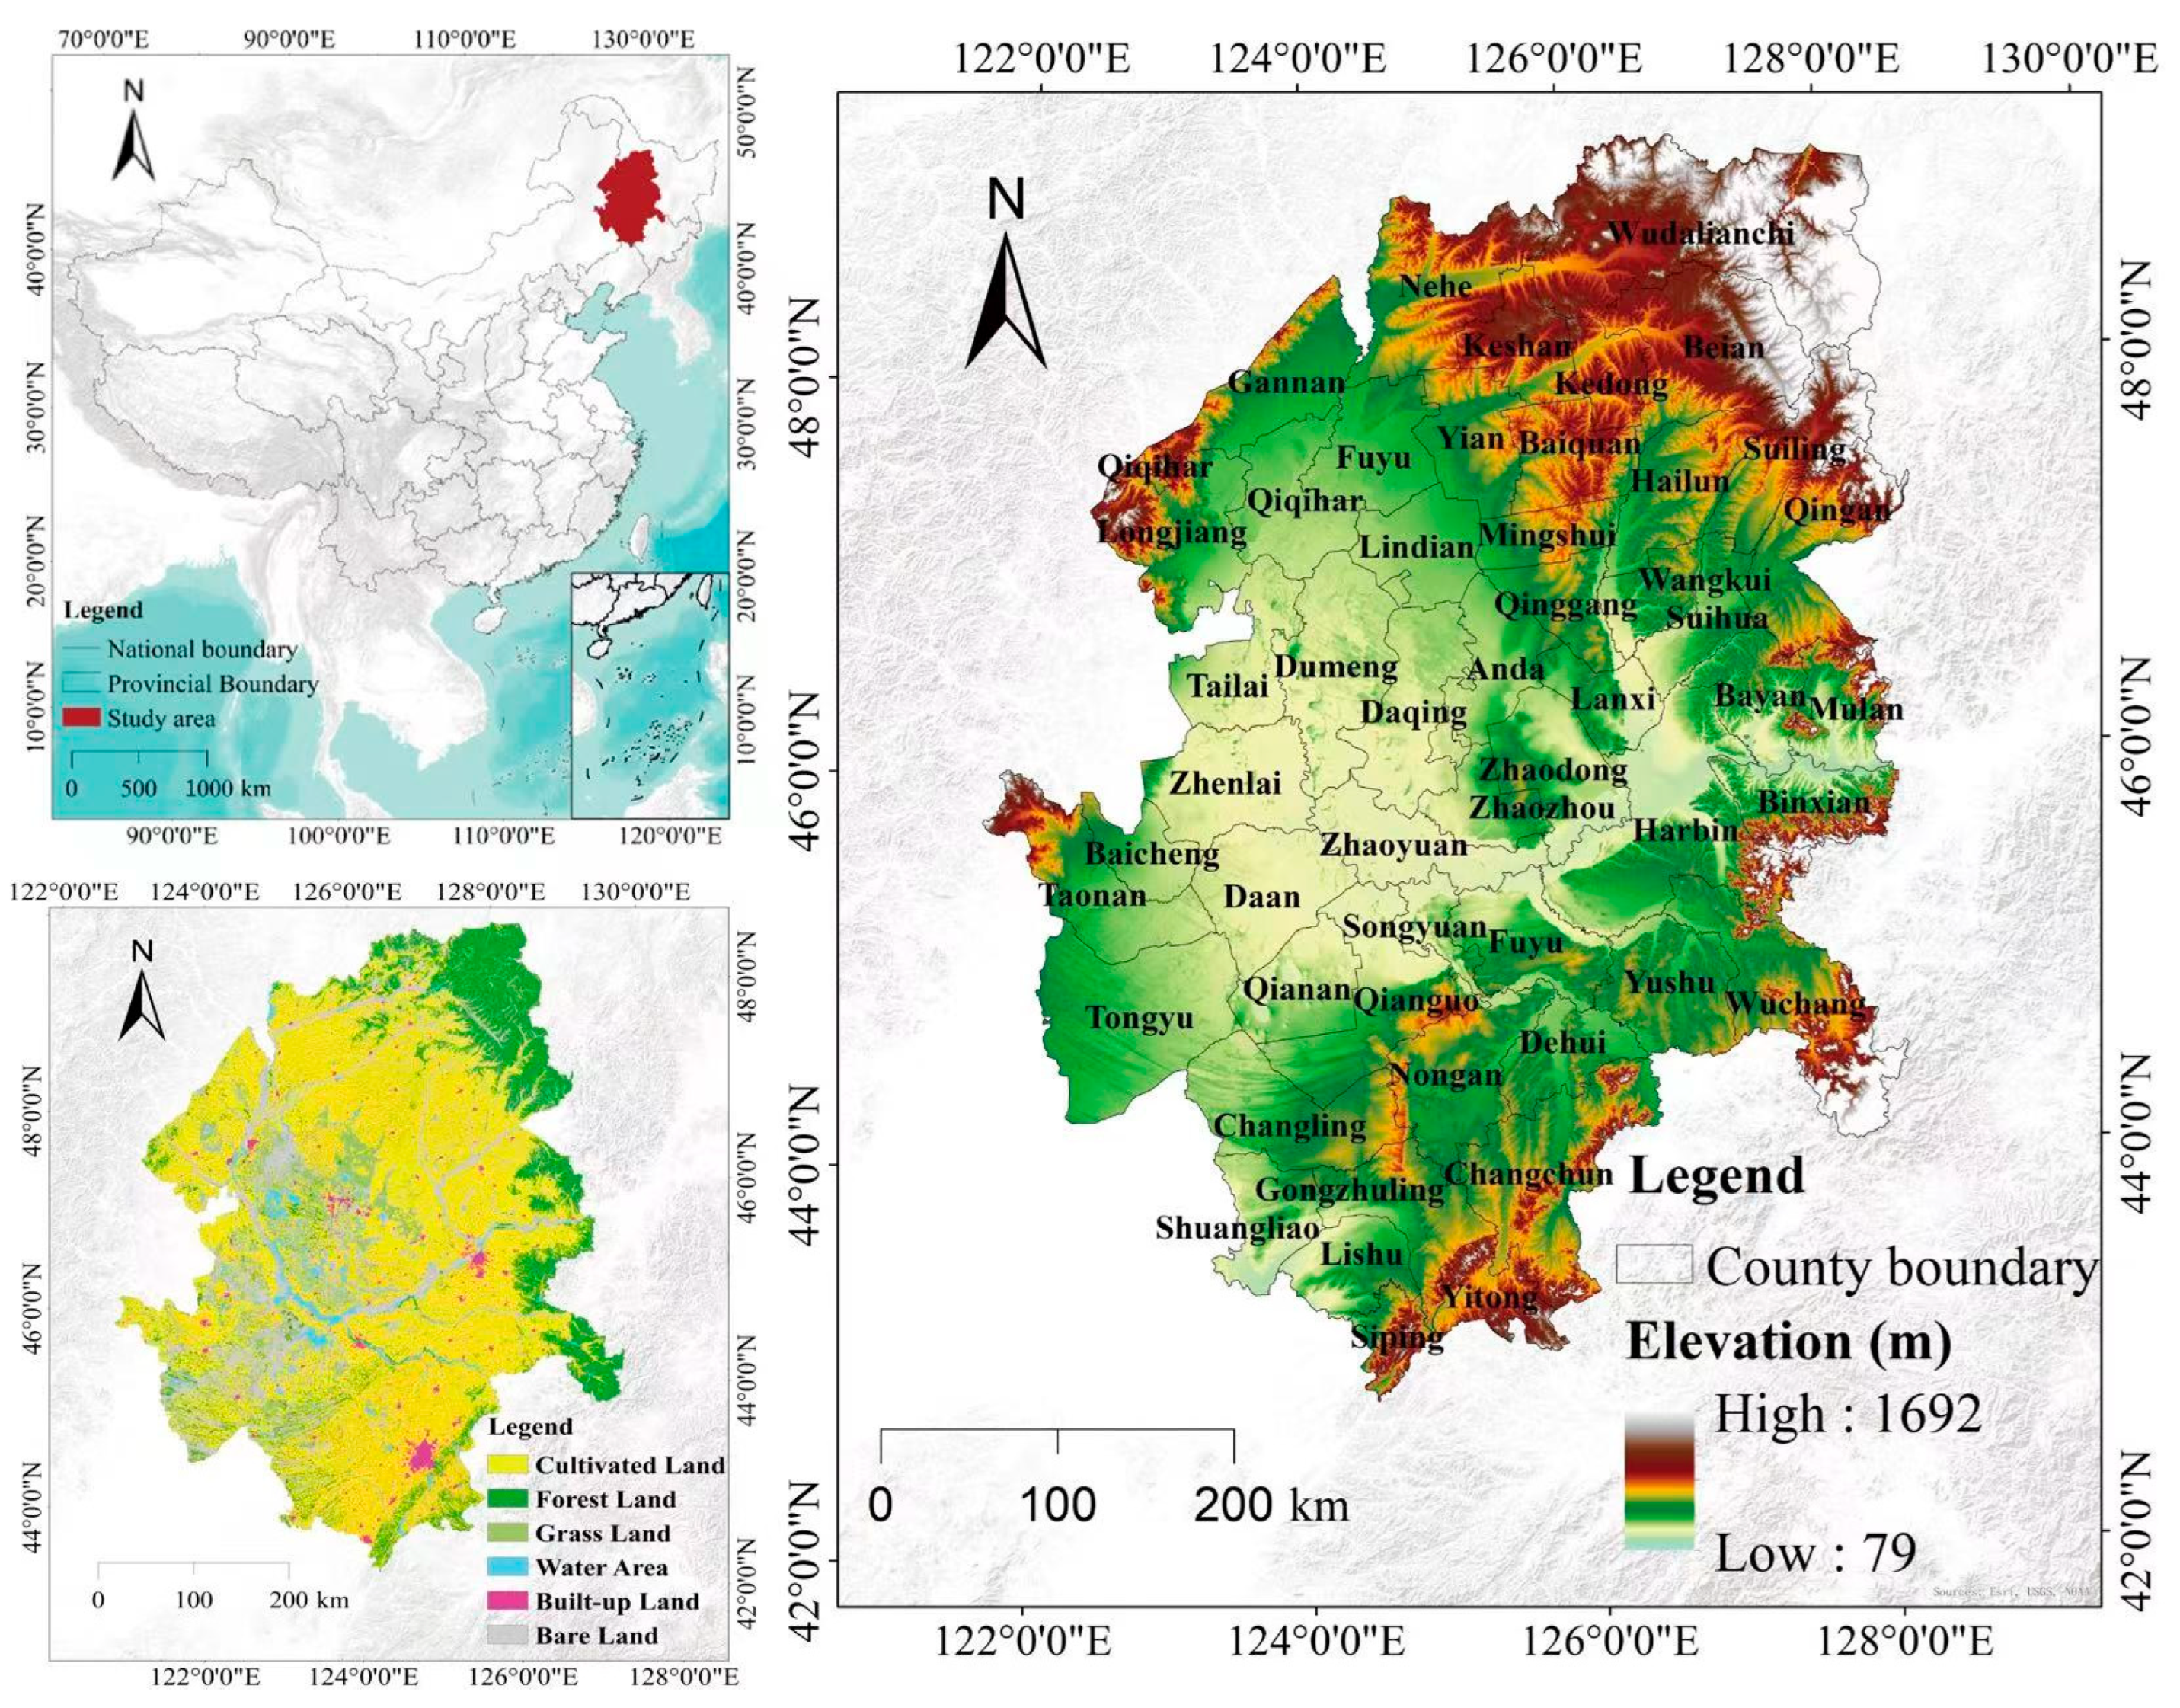
The Songnen Plain (42°30′–51°20′ N, 121°40′–128°30′ E) is located in the central part of the Northeast China Plain, as shown in Figure 1. This characteristic alluvial plain, with a total area of about 230,300 km2, was formed through long-term sedimentation processes of the Songhua and Nen River systems. It spans Heilongjiang and Jilin Provinces and encompasses nine municipal regions: Harbin, Qiqihar, Daqing, Heihe, Suihua, Changchun, Siping, Songyuan, and Baicheng [39]. Climatically, the study area lies within the transitional belt between semi-humid and semi-arid zones, featuring a typical temperate continental monsoon climate [40]. Governed by the alternation of winter and summer monsoons, the region exhibits distinct seasonal variations. Most precipitation occurs from June to September, contributing 60–70% of the annual total, with mean annual rainfall ranging from 400 to 600 mm [41] and decreasing progressively from the southeast to the northwest. The mean annual temperature varies between –2 °C and 7 °C [41]. Over the past 15 years, due to climate change, extreme weather events have become increasingly frequent on the Songnen Plain. Extreme droughts occurred 13 times, with each water shortage lasting an average of approximately 26 days [42]; the rates of change in annual average surface temperature and winter temperature in this region have been 1.8 °C/10a and 2.9 °C/10a since 2005, much higher than the corresponding national averages (with a warming rate of 0.21 ± 0.02 °C/10a) [43]; extreme precipitation events have become increasingly frequent, with precipitation levels exceeding normal levels by 50% in 2009, 2010, 2014, and 2015 [43]. Soil resources are dominated by fertile black soils, primarily Chernozems and Phaeozems [44], supplemented by widespread meadow soils, dark brown soils, and other types [45]. Cultivated land covers about 133,200 km2, representing 57.84% of the Songnen Plain’s total area (Figure 1). With its abundant cultivated land resources and favorable soil conditions, the Songnen Plain has seen its grain output increase from 2.7 million tons in 2005 to 7.3 million tons in 2020. It stands as a major grain-producing region and commercial grain base in China. However, over the past 15 years, climate change, socioeconomic development, and agricultural modernization have led to an excessive and irrational use of cultivated land resources, resulting in a decline in the adaptability and resilience of cultivated land to external pressures, imposing tremendous stress on both agricultural production and the ecological environment, and ultimately posing a severe threat to national food security and ecological security.

2.2. Data Sources and Processing

The data employed in this study comprised administrative boundary data, land use data, socioeconomic statistical data, soil data, soil erosion monitoring data, meteorological data, and NDVI (normalized difference vegetation index) data. We obtained administrative boundary data from OpenStreetMap (OSM) (https://openstreetmap.org/). DEM data were obtained from the Data Center for Resources and Environmental Sciences, Chinese Academy of Sciences (http://www.resdc.cn). Land use/land cover data (30 × 30 m) for the four periods (2005, 2010, 2015, 2020) were acquired from the RESDC (http://www.resdc.cn) under the Chinese Academy of Sciences; the classification system comprises six categories—cropland, forest, grassland, water bodies, unused land, and built-up areas (including urban, rural, industrial, and residential lands)—with an overall accuracy above 90%, as validated in [46]. Socioeconomic datasets were derived from the official Heilongjiang and Jilin Statistical Yearbooks (2006–2021), and missing data for certain years or regions were estimated using interpolation methods. The soil organic carbon content and pH value were provided by the Second National Land Survey, conducted by the Nanjing Institute of Soil Science, Chinese Academy of Sciences (https://www.issas.ac.cn/). Soil erosion data were obtained from the Science Data Bank (https://www.scidb.cn/) [47]. Meteorological data were sourced from the National Tibetan Plateau Data Center (https://data.tpdc.ac.cn/). NDVI data were derived from the National Ecosystem Science Data Center (http://nesdc.org.cn/).
In this paper, the county-level administrative units of the Songnen Plain (counties, county-level cities, and municipal districts) were adopted as the basic research units. Considering the availability of statistical data, districts under the same prefecture-level city were consolidated, ultimately producing 51 county-level units as the study objects [48]. Meanwhile, to ensure consistency in the extent of spatial data and accuracy of calculations, all data were uniformly projected to the WGS_1984_UTM_Zone_51N coordinate system. The relevant data sources and their descriptions are summarized in Table 1.

2.3. Resilience Assessment Processing and Methods

2.3.1. CLUSR Evaluation Index System

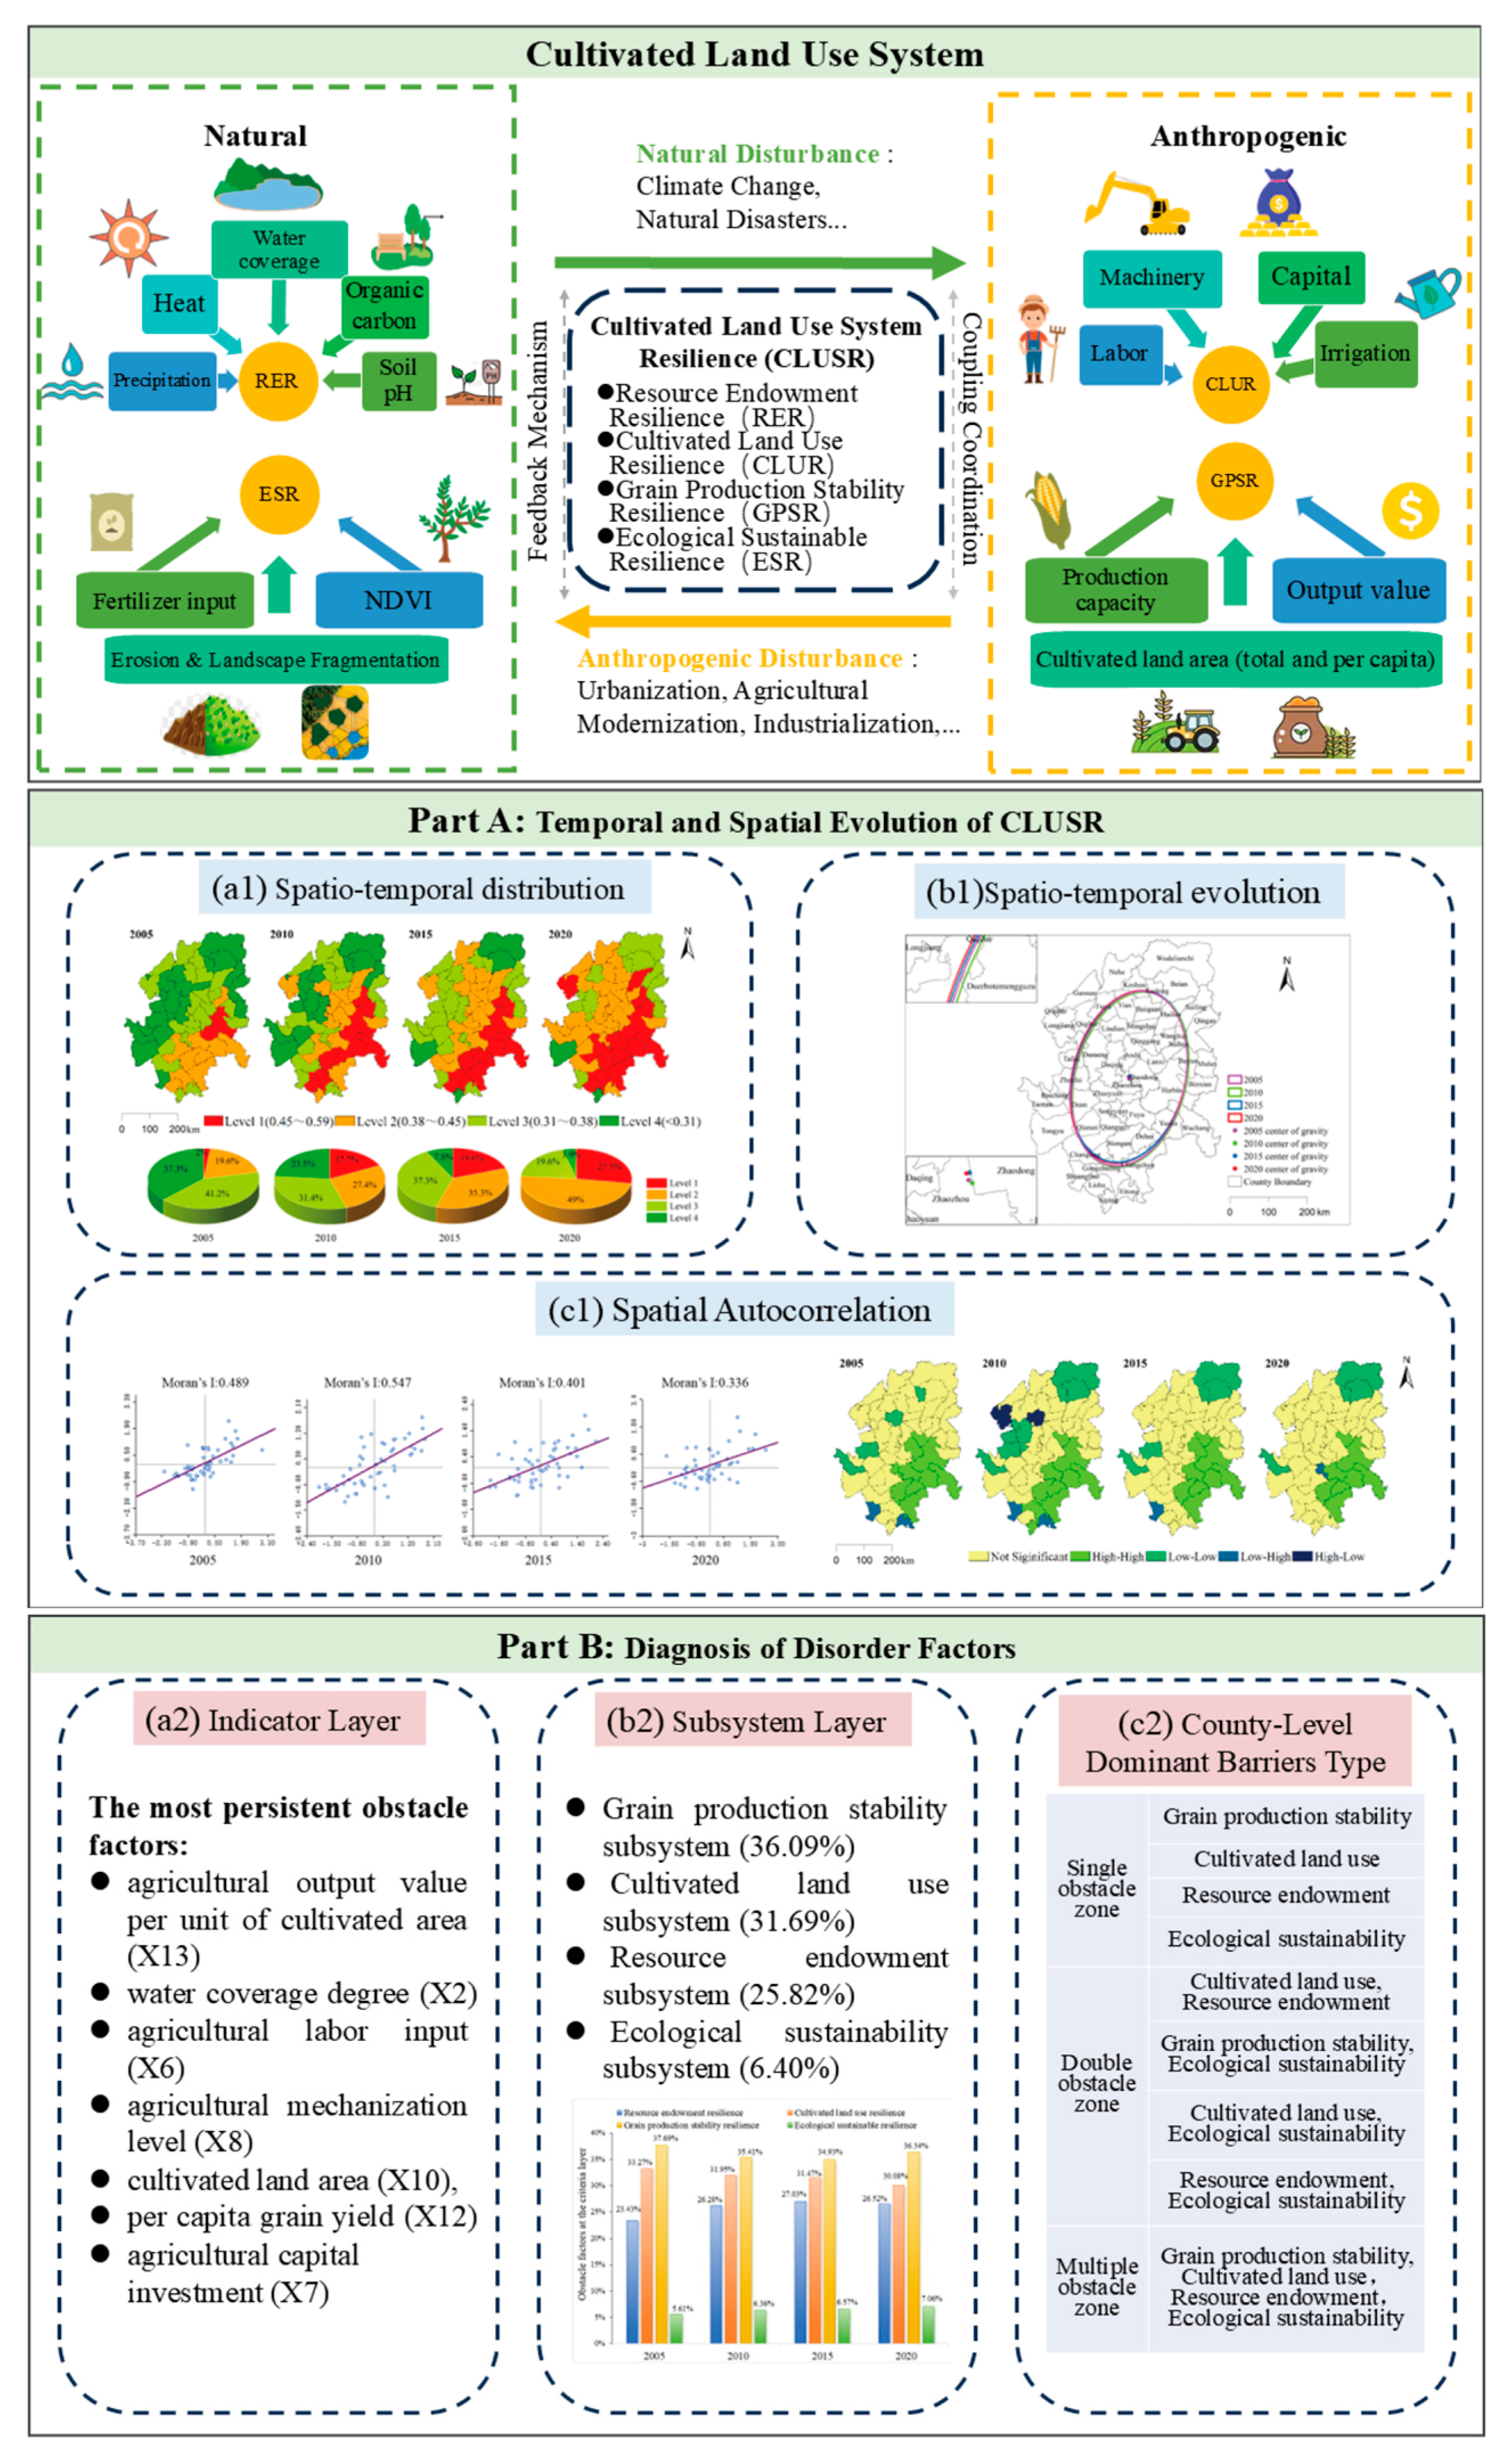
This paper constructs an evaluation index system for CLUSR based on the RUPE framework. The index system comprises four interconnected dimensions: Resource Endowment Resilience (RER), Cultivated Land Use Resilience (CLUR), Grain Production Stability Resilience (GPSR), and Ecological Sustainability Resilience (ESR). This integrated framework establishes a coherent theoretical model (Figure 2) for analyzing CLUSR (including the capacity to resist external pressures, adjust to current conditions, restore initial functionality, and pursue transformative optimization) in response to both natural shocks (e.g., climate change, natural disasters) and anthropogenic disturbances (e.g., urbanization, industrialization, agricultural modernization).

2.3.2. Construction of a Multidimensional Evaluation Index System

Based on the aforementioned research framework for CLUSR and on previous research [2], we constructed an evaluation indicator system (Table 2), considering the scientific validity, objectivity, and data availability of the selected indicators.
(1)
Resource Endowment Resilience
Resource endowment is a fundamental element of the CLUSR, representing the capacity and tolerance of the system’s components to withstand internal shocks and external disturbances [49]. Due to the influence of global climate change and black soil degradation on cultivated land in the Songnen Plain, water–heat availability and soil quality have become the primary constraints on cultivated land resources. Accordingly, five indicators were selected to characterize the RER in the study area: mean annual precipitation, water coverage degree, mean annual temperature, soil organic carbon content, and soil pH value. Among these, mean annual precipitation and water coverage degree reflect the water supply capacity of cultivated land. Sufficient water resources are essential for ensuring crop growth and maintaining stable yields, thereby improving drought tolerance and adaptive capacity. Mean annual temperature influences crop development, soil moisture, and ecosystem service functions, which in turn affect the stability, adaptive capacity, and resilience of cultivated land use systems. Soil organic carbon content serves as a critical indicator of land quality. Higher carbon content is associated with improved soil fertility and a strengthened capacity to buffer external pressures. Finally, soil pH value, which indicates acidity or alkalinity, directly affects microbial activity, nutrient availability, and soil structure. An optimal pH range enhances the adaptability of cultivated land to climate variability and other external stresses.
(2)
Cultivated Land Use Resilience
CLUR represents a critical capacity for maintaining the stable utilization of the cultivated land system (CLS) and facilitating the rapid recovery of its production levels. In this study, four indicators—agricultural labor input, agricultural capital investment, agricultural mechanization level, and the water–land coordination degree—were selected to characterize the extent of human input into cultivated land. Specifically, agricultural labor input was measured by the agricultural population, which reflects human involvement in cultivated land utilization. Agricultural capital investment was expressed as fiscal expenditure on agriculture, forestry, and water affairs, indicating the degree of fiscal support for cultivated land utilization and restoration. The agricultural mechanization level was quantified by the total power of agricultural mechanization, as higher mechanization improves both farming efficiency and agricultural output and enhances risk-coping capacity. Finally, the water–land coordination degree was calculated as the proportion of irrigable land to total cultivated land, reflecting the level of irrigation investment. A higher water–land coordination degree corresponds to greater drought resilience of a CLS.
(3)
Grain Production Stability Resilience
GPSR reflects the capacity of cultivated land to maintain stable food production and ensure food security in the face of external disturbances. Four indicators were employed for this study: cultivated land area, per capita cultivated land area, per capita yield of grain, and agricultural output value per unit of cultivated area. A larger cultivated land area corresponds to a greater total grain production capacity and a stronger ability to withstand external shocks. Higher per capita cultivated land area reduces the pressure of human activities on cultivated land resources, thereby enhancing the structural stability of the CLS and strengthening its resilience in maintaining stable yields. Per capita yield of grain, defined as the amount of grain produced per hectare of cultivated land, is used to measure grain production efficiency and constitutes a key factor influencing yield stability. Agricultural output value per unit of cultivated land characterizes the risk resistance capacity of cultivated land from the perspective of economic benefits and efficiency.
(4)
Ecological Sustainable Resilience
ESR refers to the ability of a resilient cultivated land ecosystem to maintain its structure and function under external pressures. Four indicators were used in this study: fertilizer input per unit area, landscape fragmentation, soil erosion, and ecological conservation capacity. Fertilizer input per unit area is measured by the amount of fertilizer applied per unit of cultivated land. Excessive fertilizer input results in soil nutrient imbalance, biodiversity loss, soil degradation, and reduced ecological resilience. Landscape fragmentation reflects the connectivity of landscape structure. Greater landscape fragmentation weakens the connectivity of cultivated land resources within the region, thereby weakening the adaptability and resilience of ecological functions in response to natural or human disturbances. Soil erosion characterizes the extent of water-induced soil loss. Severe soil erosion leads to nutrient loss, structural damage, and reduces ecosystem resilience, undermining ESR. Ecological conservation capacity was represented by the normalized difference vegetation index (NDVI), which reflects vegetation coverage. Higher vegetation coverage mitigates soil erosion, enhances soil carbon storage, and supports biodiversity, ultimately improving the resistance and resilience of cultivated land ecosystems.

2.3.3. Research Methods

(1)
Data Standardization
In the evaluation of CLUSR, standardization of the selected indicators is required to account for differences in their measurement units. The extreme value method was applied to unify the units of the original indicators. This method enables direct comparison and comprehensive analysis of indicators with different units, which enhances the comparability of the data [2]. The specific formula is as follows:
Positive   indicators :   Z ij   =   X ij     MIN   ( X 1 j ,   X 2 j ,   ,   X mj ) MAX X 1 j ,   X 2 j   , ,   X mj     MIN   ( X 1 j   , X 2 j ,   ,   X mj )
Negative   indicators :   Z ij = MAX   X 1 j ,   X 2 j ,   ,   X mj   X ij MAX   X 1 j ,   X 2 j ,   ,   X mj   MIN ( X 1 j ,   X 2 j ,   ,   X mj )
Moderate   indicators :   Z ij = 1 a   X ij MAX a   x j min ,   x j max b         ,   X ij   <   a 1                                                                                                 ,   a     X ij     b 1 X ij - b MAX   a   x j min ,   x j max   b       ,   X ij   >   b
In the formula, X i j is the value of the j-th indicator before standardization in the i-th county ( i   =   1 , 2, …, m; j   =   1 , 2, …, n). Among these, M A X   X 1 j , X 2 j , , X m j   a n d   M I N   ( X 1 j , X 2 j , , X m j ) denote the maximum and minimum values of the j-th indicator, respectively. Z i j is the value of the j-th indicator before standardization in the i-th county.
(2)
Entropy Weight Method
To minimize subjective bias, this study employs the entropy weight method (EWM), based on the concept of information entropy, to assign objective weights to the indicators [50]. Information entropy reflects the dispersion level and unpredictability of an indicator. A lower entropy value suggests that the indicator’s data are more clustered and contain greater amounts of effective information, thus warranting a higher weight in the assessment system.
Information entropy e was calculated as follows:
e j   =   K i   =   1 n [ P ij In P ij ]
P ij = Z ij i = 1 n Z ij
K = 1 Ln   n
Indicator weights were
W j = 1   e j j = 1 n 1 e j
(3)
CLUSR Evaluation Index
According to the result of weight calculation using the entropy value method, the level of CLUSR was evaluated by a comprehensive index model [51]. The expression is as follows:
M =   j   =   1 n W j Z ij
In the formula, M stands for the CLUSR composite evaluation index; W j is assigned the value of the weight of the j-th indicator; Z i j denotes the standardized value of an indicator; and n represents the number of evaluation indicators. The final range of m is in [0, 1], with larger values indicating a higher level of CLUSR in the area.
(4)
Standard Deviation Ellipse Method
The standard deviation ellipse (SDE) tool in ArcMap 10.4 was used to analyze the spatial distribution characteristics and dynamic trends of CLUSR in the study area with the help of attributes such as the long axis, short axis, and area of ellipse [52]. The expression is as follows:
X -   =   i   =   1 n W i X i / i   =   1 n W i Y - = i   =   1 n W i Y i / i   =   1 n W i
θ = arctan / ( i = 1 n x i 2 i = 1 n y i 2 ) + ( i = 1 n x i 2 i = 1 n y i 2 ) + 4 ( i = 1 n x i y i ) 2 2 x i = 1 n x i y i
σ x = i = 1 n ( x i cos θ   y i cos θ ) 2 / n ,   σ y = i = 1 n ( x i sin θ   y i cos θ ) 2 / n
In the formula, X - and Y - are the latitude and longitude of the attribute’s center of gravity coordinates, respectively. X i and Y i are the latitude and longitude of the center of coordinates in the i-th county. W i refers to the spatial weight of an attribute value in the i-th region. n stands for the number of counties and   θ represents the standard deviation elliptic azimuth; x and y denote the coordinate deviations from the center of the study area to the mean center, respectively; σ x designates the standard deviation along the x-axis and σ y signifies the standard deviation along the y-axis.
(5)
Spatial Autocorrelation Analysis
CLUSR is affected by natural resource endowment and by socioeconomic and ecological factors. All of these factors are spatially stochastic and structural, with certain spatial correlations. Accordingly, spatial autocorrelation analysis (global spatial autocorrelation and local spatial autocorrelation) was applied to assess the spatial clustering of resilience in the Songnen Plain [53]. Among them, global spatial autocorrelation was used to examine the overall spatial correlation of CLUSR in the study area, which is commonly expressed as Global Moran’s I. Local spatial autocorrelation was employed to determine the localized clustering patterns, measured by Local Moran’s I [54]. The expressions are as follows:
Global   Moran s   I   =   i   =   1 n j   =   1 n W ij X i     X - X j     X - S 2 i   =   1 n j   =   1 n W ij ( i     j )
Local   Moran s   I = n ( x i x - ) j = 1 n W ij x j x - j = 1 n ( x i x - ) 2
Z = 1   E I Var I
In the formula, n represents the number of counties in the study area. X i and X j indicate the attribute value of the space unit i and j, respectively. X -   =   1 n i = 1 n X i , S 2   =   1 n i = 1 n X i X - 2 . W i j is the spatial weighting matrix. Moran’s I takes values in the range of [−1, 1], with larger absolute values indicating stronger spatial autocorrelation. When I   > 0, the level of CLUSR shows a positive correlation in spatial distribution; when I < 0, the level of CLUSR shows a negative correlation in spatial distribution; and when I = 0, the spatial distribution shows a random distribution pattern. Z refers to the normal standardized statistic of Moran’s I. E I stands for the expectations of Moran’s I. Var I denotes the variance in Moran’s I. In this paper, the Z value was used to carry out the significance test. Z > 1.96 or Z < −1.96 (p < 0.05) indicates that the regional CLUSR is spatially significantly correlated.
(6)
Obstacle Degree Model
The obstacle degree model helps identify the limiting factors that hinder CLUSR. This model calculates the factor obstacle degree ( O ijt and   M j t ) based on the factor contribution degree ( F i j ) and indicator deviation degree ( V ijt ). It subsequently diagnoses the primary obstacle factors affecting CLUSR [55] and divides the different obstacle zones. The relevant expressions are as follows:
F i j = W i W i j
V ijt = 1   Z ijt
O ijt = F ij V ijt j = 1 n F ij V iit
M j t = j = 1 n O i j t
In the formula, W i is the weight of the i-th criterion layer, W i j indicates the weight of the j-th indicator in the i-th criterion layer, V ijt represents the indicator deviation, Z ijt signifies the standardized value of the indicator layer in a given year, O ijt denotes the obstacle degree of the j-th indicator in the i-th criterion layer in the t-th year, and M j t refers to the obstacle degree of the criterion layer to CLUR in a given year.

2.4. Technology Roadmap

The technical approach described in this paper is shown in Figure 3.

3. Results

3.1. CLUSR Measurement: Analysis of Results

To clarify the overall trend of CLUSR variation in the Songnen Plain, the comprehensive resilience index model (Formula 8) was employed to calculate the RER, CLUR, GPSR, ESR, and the overall CLUSR from 2005 to 2020 (Table 3). The results indicated that the overall CLUSR of the Songnen Plain exhibited an upward trend during this period, with the average score increasing from 0.3353 in 2005 to 0.4256 in 2020. This suggests that over these 15 years, the cultivated land use system in the region gradually enhanced its capacity to withstand external pressures and to maintain and restore systemic stability. However, despite this improvement, the absolute values remained relatively low, implying that there is still substantial scope for enhancing CLUSR in the Songnen Plain.
From a dimensional perspective, the subsystem resilience scores from 2005 to 2020 were ranked in descending order: ESR (0.121) > RER (0.114) > GPSR (0.090) > CLUR (0.055). Among these, CLUR and GPSR demonstrated a consistent upward trend throughout the study period. CLUR increased from 0.0313 in 2005 to 0.0786 in 2020, while GPSR rose from 0.0627 to 0.1047 during the same interval, with CLUR exhibiting a more pronounced growth rate. In contrast, RER followed a fluctuating pattern, initially decreasing from 0.1177 in 2005 to 0.1068 in 2010, and then gradually increased to 0.1218 in 2020. Meanwhile, ESR experienced a modest decline, decreasing from 0.1236 in 2005 to 0.1205 in 2020.

3.2. Temporal and Spatial Evolution of CLUSR

3.2.1. Temporal and Spatial Patterns of Change in CLUSR

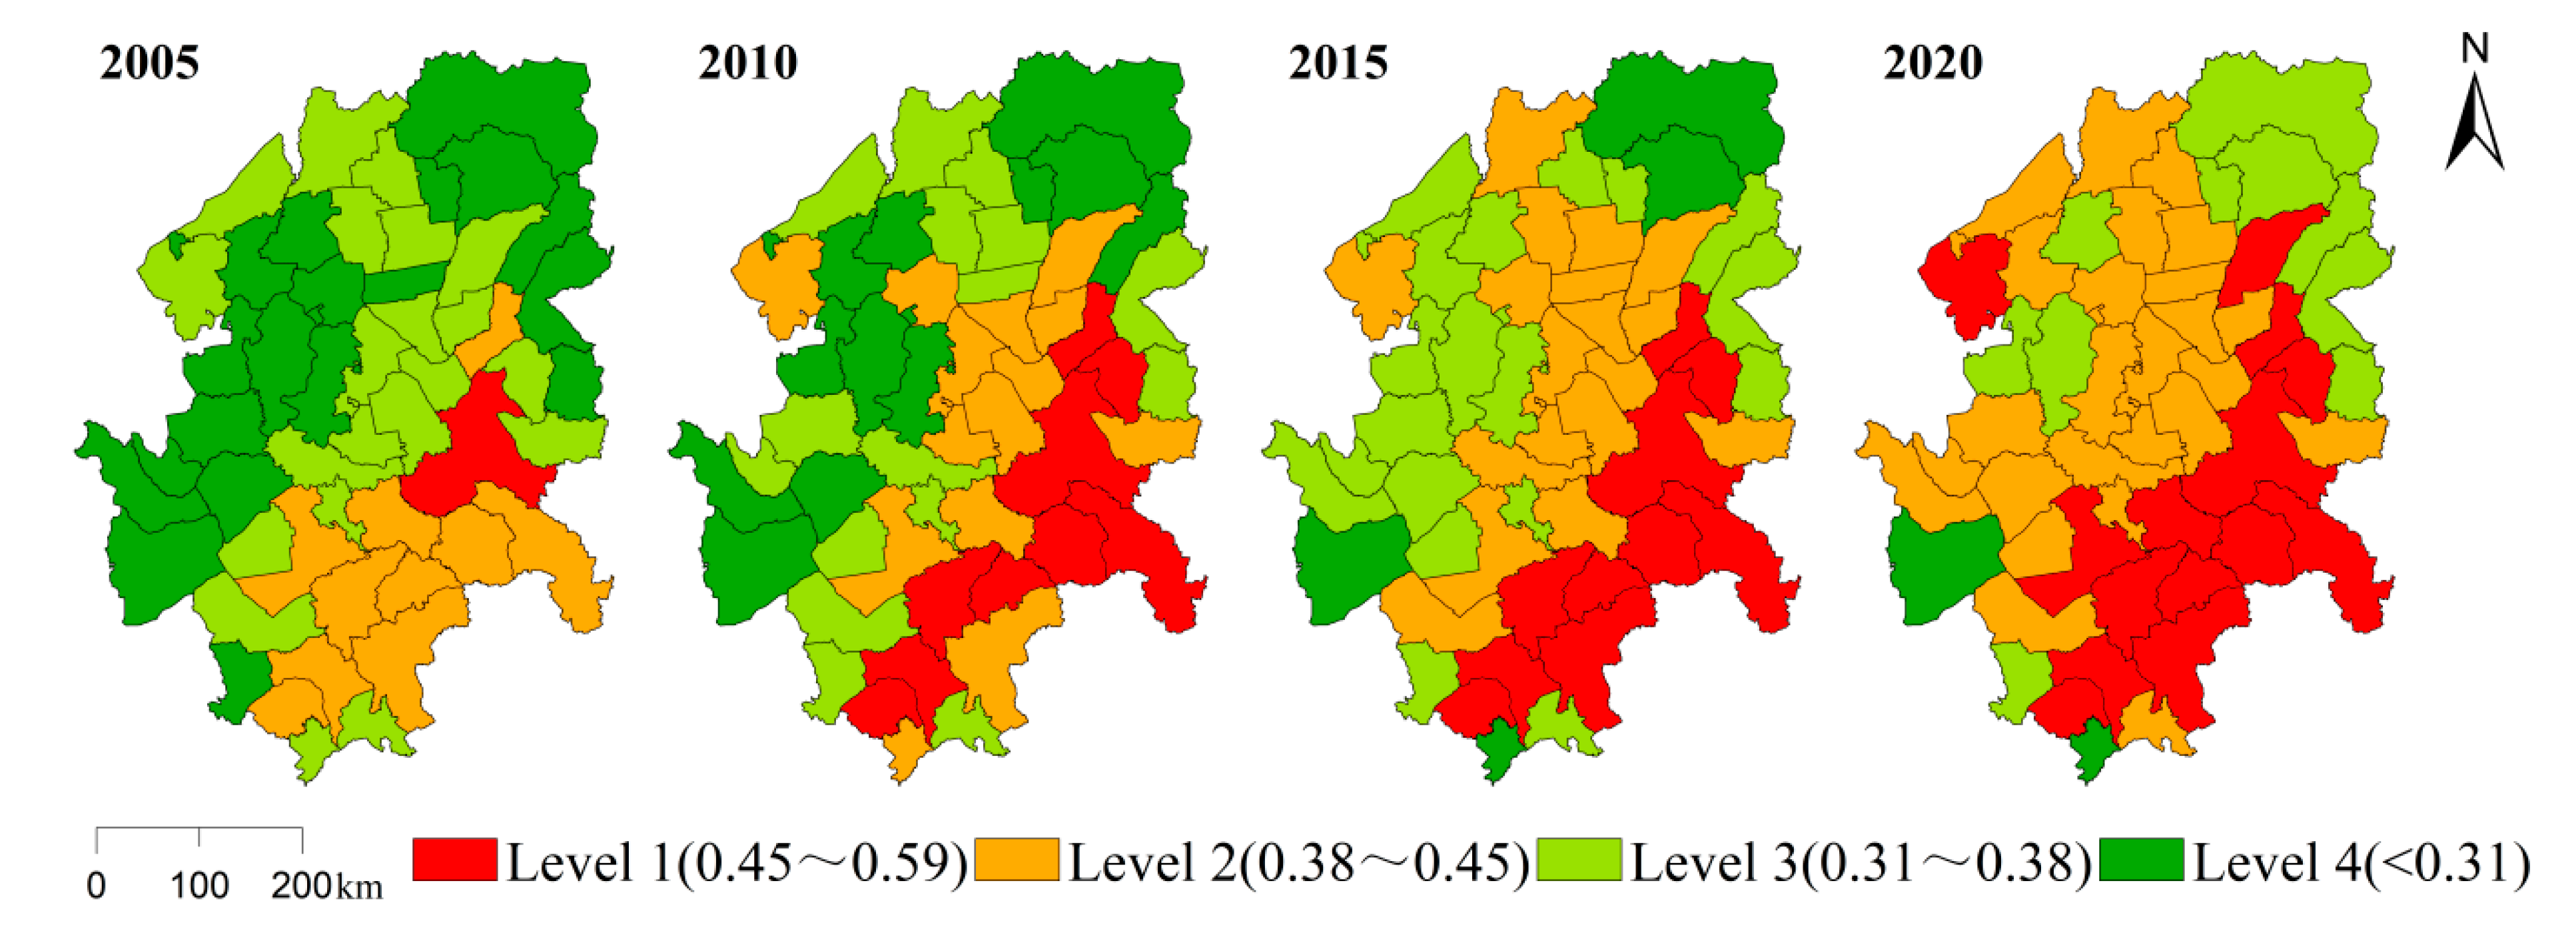
To further elucidate the spatiotemporal distribution characteristics of CLUSR in the Songnen Plain, the natural breakpoint method was employed to classify resilience levels from 2005 to 2020 into four categories: Level 1 (high resilience: 0.45–0.59), Level 2 (moderate resilience: 0.38–0.45), Level 3 (low resilience: 0.31–0.38), and Level 4 (very low resilience: <0.31). The division results are shown in Figure 4 and Figure 5.
Spatially, the overall distribution pattern of CLUSR within the study area was relatively high in the east and low in the west, with significant changes in the trends of different resilience levels over the past 15 years. In 2005, Level 1 areas, located in the municipal districts of Harbin in the eastern region, had the smallest distribution (2%). Level 2, constituting 19.6% of the total area, was concentrated in the southeastern part of Songnen Plain (municipal districts of Suihua, the entirety of Changchun, Wuchang in Harbin, the central-eastern region of Songyuan, and Lishu County in western Siping). In contrast, low-resilience areas (Levels 3 and 4) covered a relatively high proportion of the study area (78.5%), forming belt-like patterns across the central, western, and northeastern regions.
From 2005 to 2020, Level 1 areas expanded progressively both northward and southward from the municipal districts of Harbin, reaching 27.5% of the total area by 2020. Concurrently, Level 2 areas shifted gradually from the southeast to the central and western regions over the 15-year period, exhibiting a planar distribution (the proportion increased to 49% in 2020). In contrast, Level 3 and Level 4 areas declined markedly, with their coverage decreasing from 37.3% and 41.2% in 2005 to 19.6% and 3.9% in 2020, respectively. By 2020, Level 3 areas were mainly located in the northeastern part of the study area, overlapping with forest-rich regions, while Level 4 areas were limited to Tongyu County and the municipal districts of Siping.

3.2.2. Spatial Evolution Analysis of CLUSR

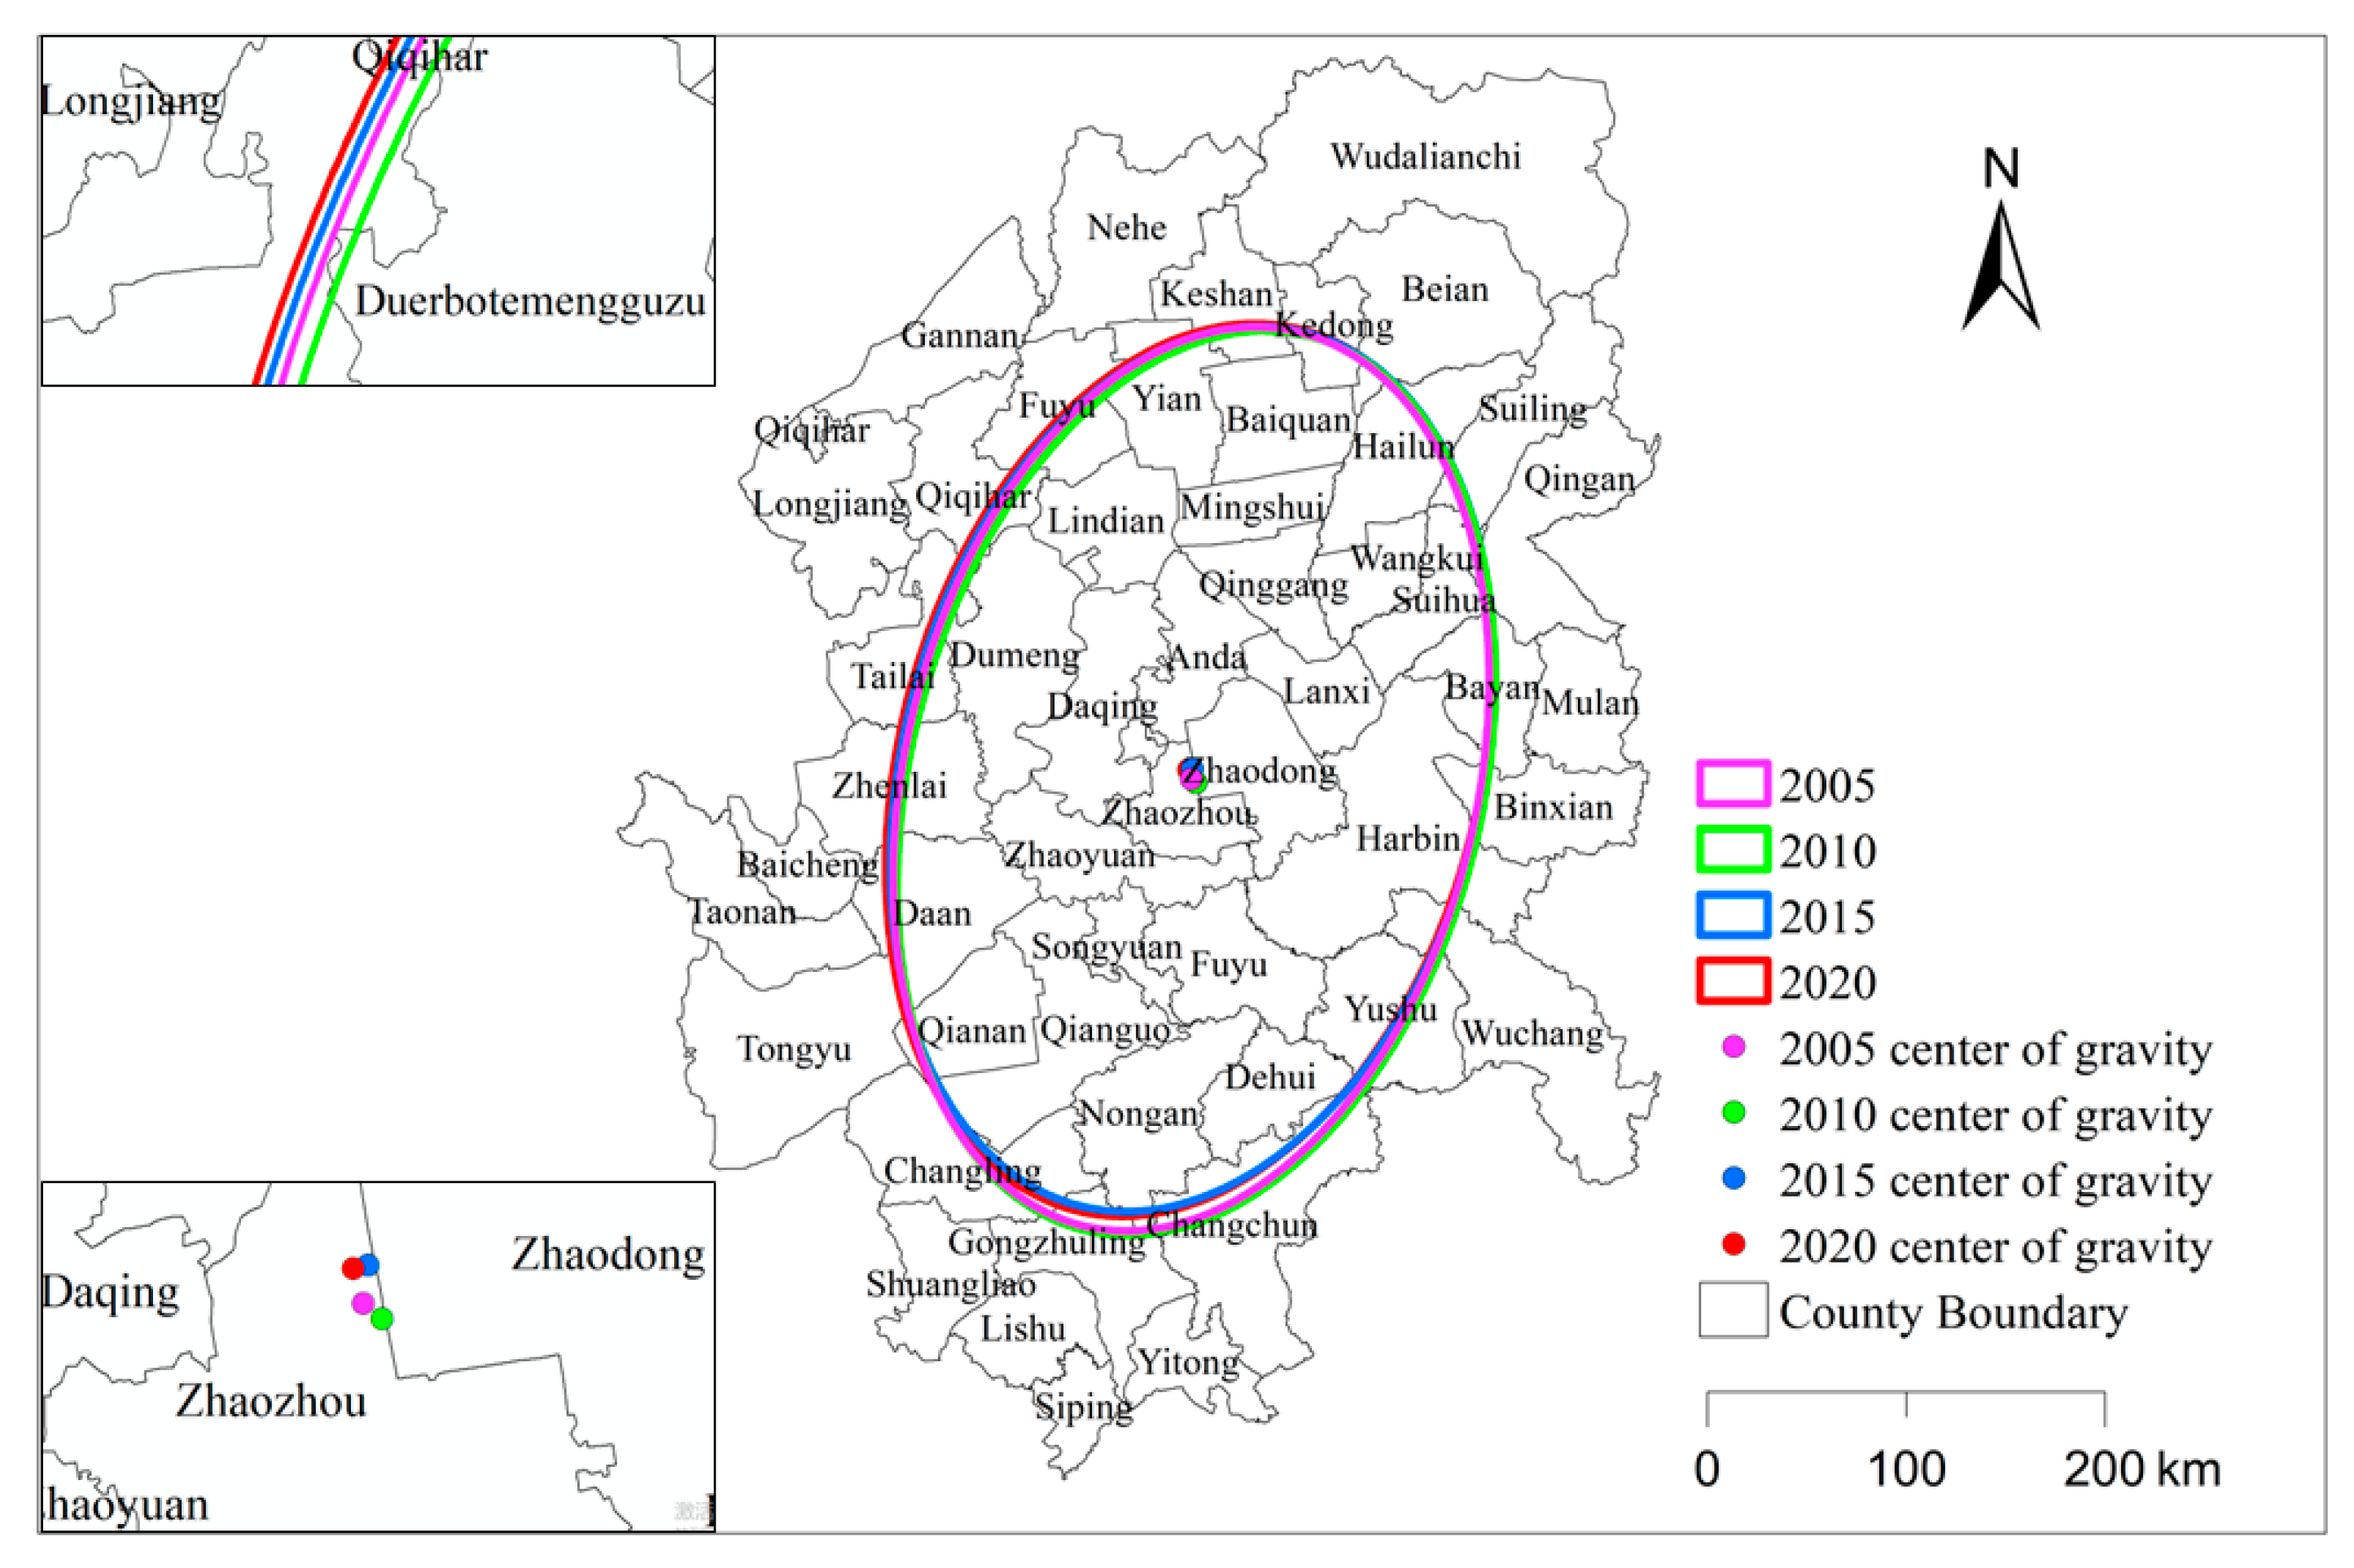
To examine the spatiotemporal evolution of CLUSR in the Songnen Plain from 2005 to 2020, the standard deviation ellipse tool in ArcGIS was applied (Table 4; Figure 6). The results showed that the ellipse area exhibited a fluctuating trend, expanding from 26.07 × 10³ km2 in 2005 to 26.11 × 10³ km2 in 2010, decreasing to 25.87 × 10³ km2 in 2015, and then increasing again to 26.13 × 10³ km2 in 2020. This indicates that the spatial heterogeneity of CLUSR first declined, then increased, and finally weakened again. The centroid of the CLUSR ellipse was consistently located in the central part of the Songnen Plain, north of Zhaozhou County. However, it shifted southeastward by 3.21 km between 2005 and 2010 and then northwestward by 7.71 km from 2010 to 2020, suggesting that resilience in the southeastern part of the plain improved first, followed by an increase in the northwestern region. With respect to the ellipse axes, the major semi-axis gradually shortened from 115.47 km in 2005 to 114.24 km in 2020, while the minor semi-axis lengthened from 71.86 km to 72.80 km during the same period, resulting in a decrease in ellipticity. This pattern reflected a weakening in the orientation of the CLUSR spatial distribution. The orientation angle remained stable at approximately 14°, suggesting that areas with higher CLUSR levels were consistently distributed along a northeast–southwest orientation.

3.2.3. Spatial Autocorrelation Analysis

Based on the CLUSR measurements obtained for the Songnen Plain in 2005, 2010, 2015, and 2020, this study computed the Global Moran’s I index using the GeoDa 1.20 spatial analysis tool to assess the spatial autocorrelation of CLUSR. The results are presented in Table 5 and Figure 7. The Global Moran’s I values for CLUSR in the Songnen Plain for the years 2005 to 2020 were 0.489, 0.547, 0.401, and 0.336, respectively. The corresponding Z-values were 6.0866, 6.8038, 4.9969, and 4.2399. All values passed the significance test at p < 0.05, indicating a statistically significant positive spatial correlation of CLUSR across the study area during this period.
In terms of local spatial autocorrelation, CLUSR in the Songnen Plain during the study period was predominantly characterized by High–High and Low–Low clustering patterns (Figure 8). Over the 15-year period, the High–High clusters remained relatively stable, showing an aggregated pattern concentrated in the southeastern part of the study area. Specifically, these clusters were primarily located in the municipal districts of Harbin, Wuchang City, most of Changchun City, the southern part of Suihua City, and the eastern part of Songyuan City, corresponding to the provincial capitals of Harbin and Changchun and their surrounding regions. In contrast, the Low–Low clusters exhibited a more dynamic spatial evolution between 2005 and 2020. In 2005, Low–Low clusters were scattered in the study area. By 2010, these clusters had become more regionally concentrated, forming patches in the western Songnen Plain (Tailai County, Zhenlai County, Dumeng Autonomous County, and Taonan County) and in the northeastern region (Heihe City and Kedong County). Notably, the western clusters coincide with saline–alkali soil regions, while the northeastern and western clusters are associated with higher elevations or forest-rich areas. By 2020, the extent of Low–Low clusters had further contracted, persisting only in the higher-altitude northeastern and western regions. Additionally, Low–High and High–Low outlier clusters were sporadically distributed around the main High–High and Low–Low cluster zones.

3.3. Obstacle Factor

Accurately identifying obstacles is essential for enhancing CLUSR. This study employed an obstacle diagnosis model (Formulas (15)–(18)) to calculate obstacle degrees at both the criterion and indicator layers within the Songnen Plain from 2005 to 2020.

3.3.1. Obstacle Factors at the Indicator Layer

Based on the obstacle degree scores at the indicator level, the top seven indicators—whose cumulative obstacle degree exceeded 60%—were identified as the primary constraints on CLUSR in the Songnen Plain (Table 6). The most persistent obstacle factors across the study period were agricultural output value per unit of cultivated area (X13), water coverage degree (X2), agricultural labor input (X6), agricultural mechanization level (X8), cultivated land area (X10), per capita yield of grain (X12), and agricultural capital investment (X7). Among these, X13 consistently ranked within the top two across all four sampled years, confirming its role as the most critical obstacle factor. Regarding temporal trends, the constraining effects of X2, X6, and X10 exhibited a clear upward trajectory, with their obstacle degrees increasing from 8.938%, 8.358%, and 8.310% in 2005 to 11.258%, 10.578%, and 9.618% in 2020, respectively. This indicates that these three indicators have become increasingly dominant constraints on CLUSR enhancement. In contrast, the influence of X7 and X8 demonstrated a consistent declining trend, and by 2020, X7 no longer represented a major obstacle, suggesting that neither factor will be a key constraint on CLUSR improvement in the foreseeable future. Notably, soil organic carbon content (X4) emerged as a major obstacle factor for the first time in 2020, signaling that soil quality is progressively becoming a critical limiting factor for CLUSR in the region.

3.3.2. Obstacle Factors of Subsystem Layer

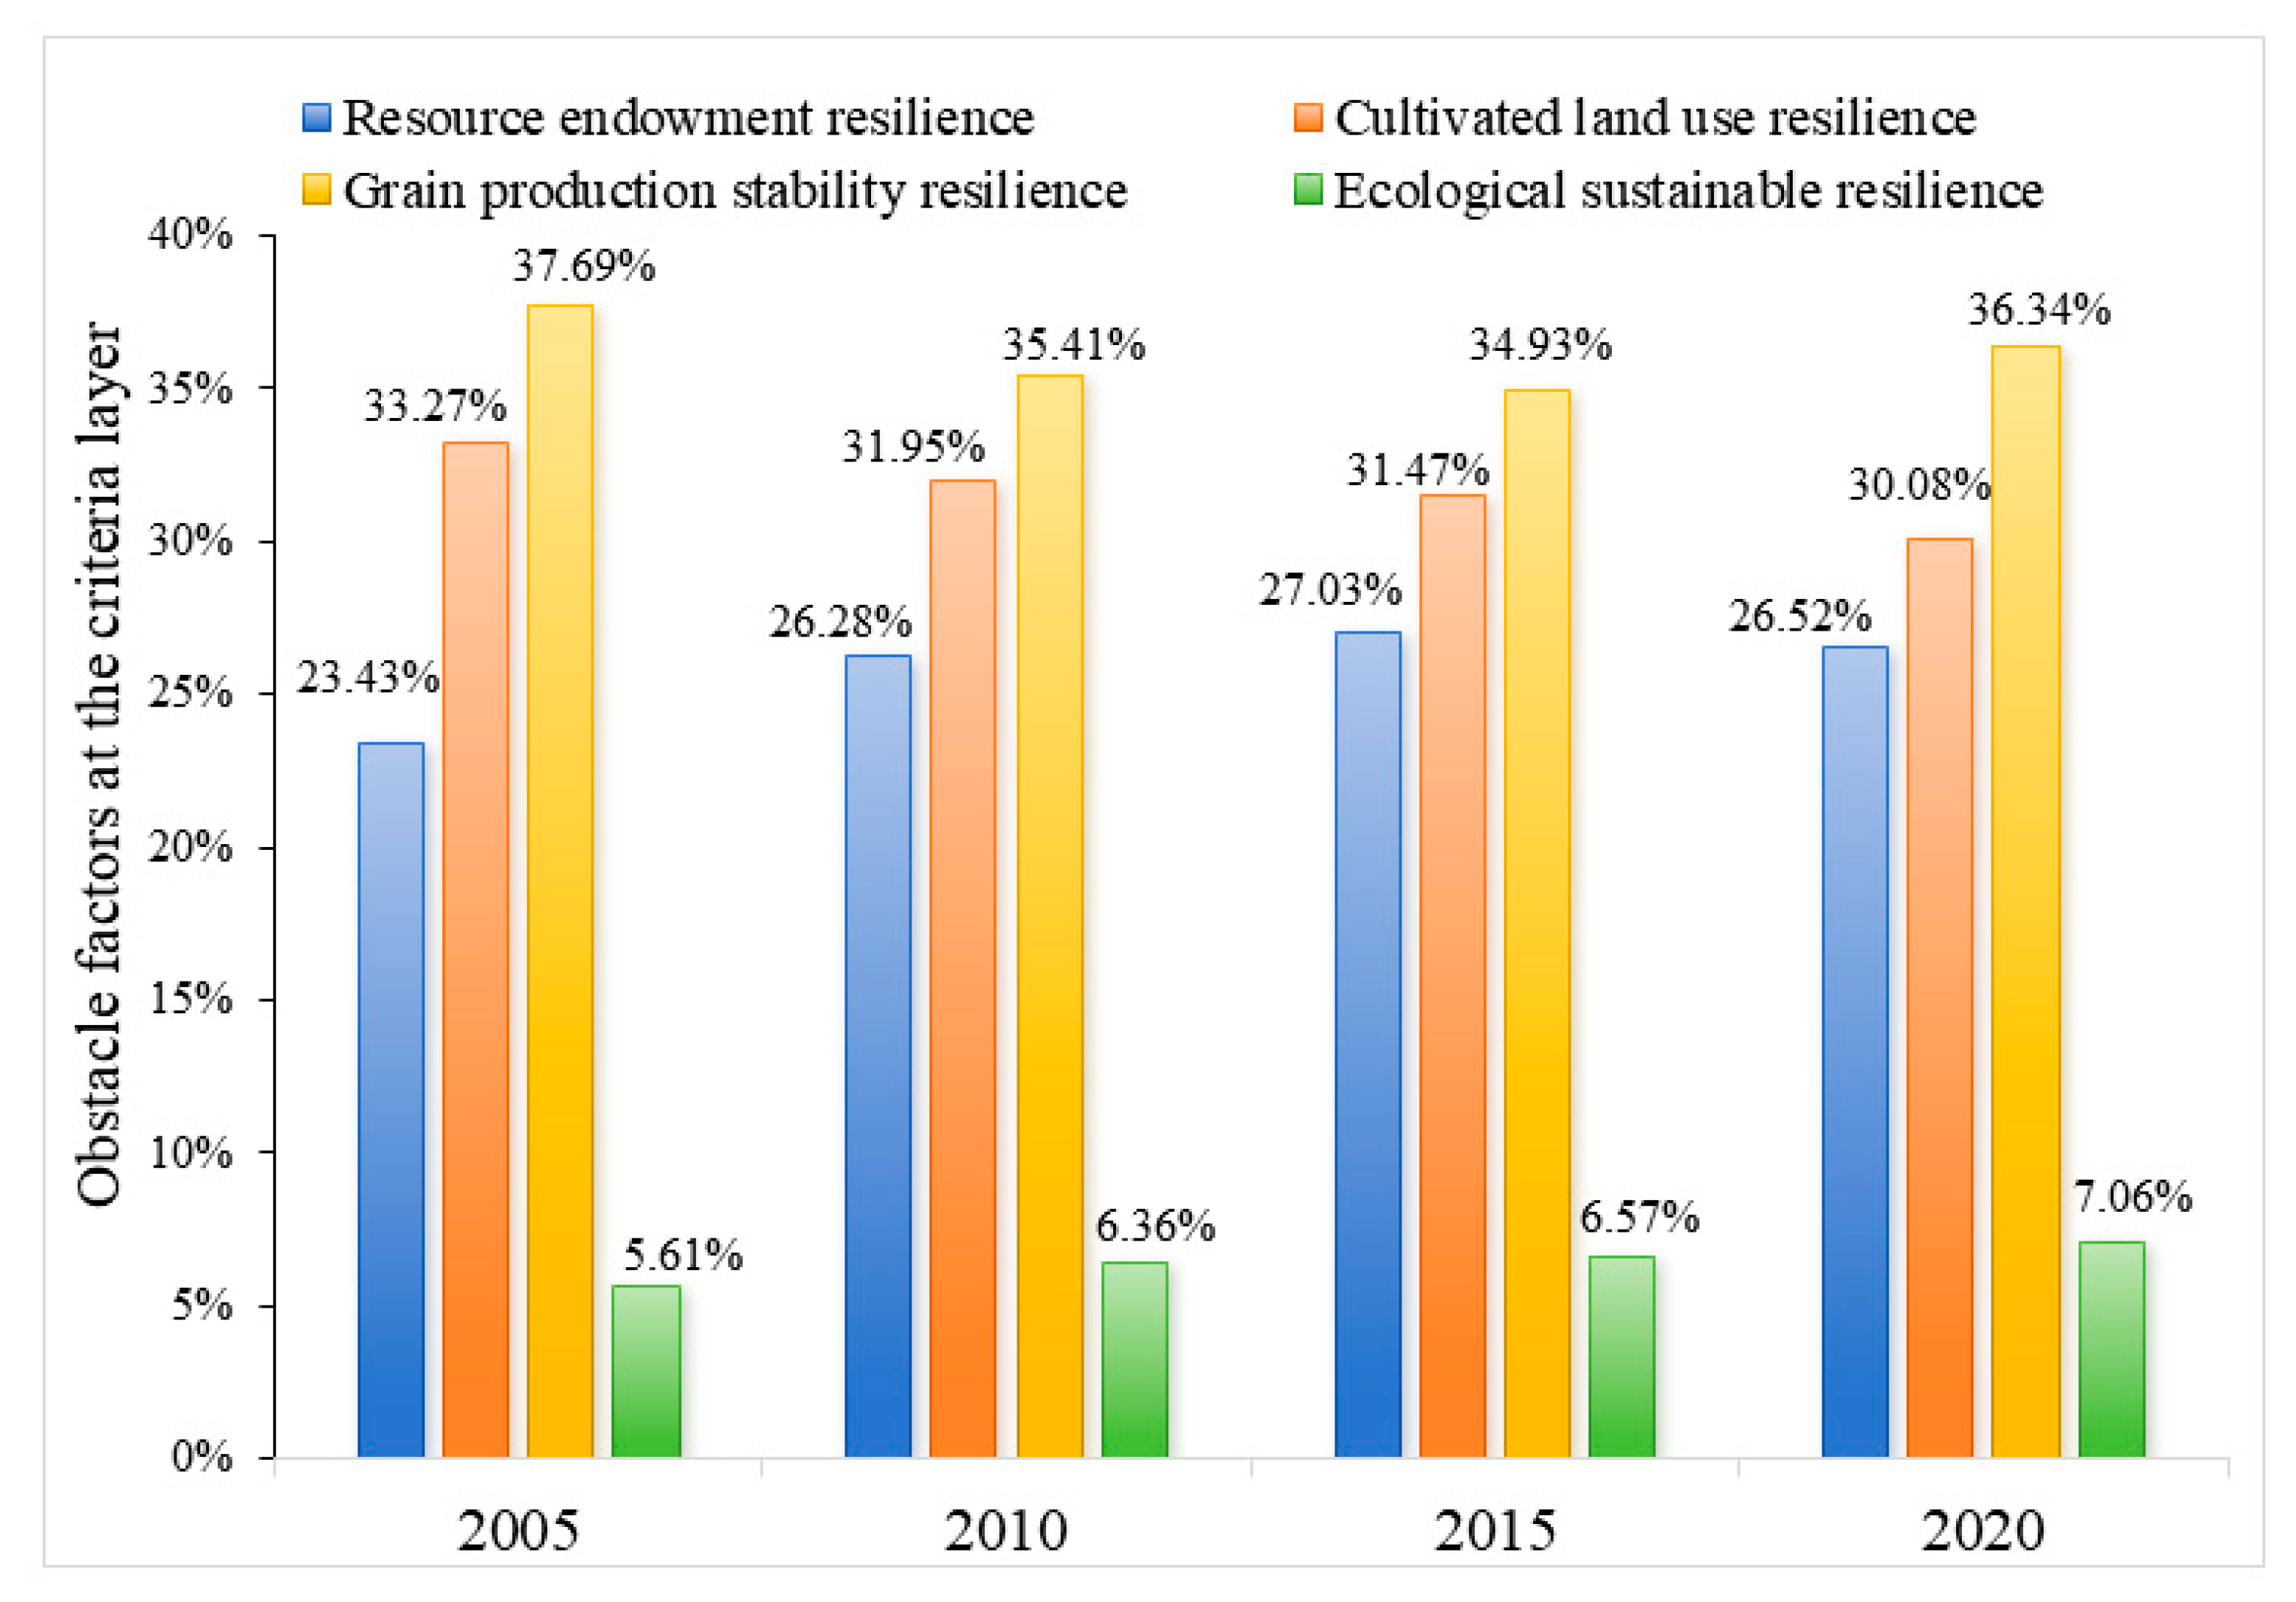
Figure 9 illustrates the extent to which the four subsystems constrained the CLUSR of the Songnen Plain from 2005 to 2020, as well as the trends in these changes. The ranking of subsystem constraints was as follows: grain production stability subsystem (36.09%) > cultivated land use subsystem (31.69%) > resource endowment subsystem (25.82%) > ecological sustainability subsystem (6.40%). This indicates that the grain production stability and cultivated land use subsystems were the primary factors limiting the improvement in CLUSR in the Songnen Plain. In terms of temporal trends, the degree of obstacle to the grain production stability subsystem first declined and then increased, falling from 37.69% in 2005 to 34.93% in 2015, before rising again to 36.34% in 2020. The obstacle degree of the cultivated land use subsystem showed a continuous decline (a decrease of 3.2%), indicating that its influence on CLUSR has gradually weakened. During the study period, the obstacle degree of the resource endowment subsystem first increased and then decreased, rising from 23.43% in 2005 to 27.03% in 2015, before slightly declining to 26.52% in 2020. Although the ecological sustainability subsystem exerted the weakest constraint on CLUSR, it exhibited a steady upward trend, rising from 5.61% in 2005 to 7.06% in 2020 (an increase of 1.45%), suggesting that the ecological pressure on CLUSR has been gradually intensifying.

3.3.3. Obstacles to CLUSR in the Songnen Plain Counties

To reflect the current status of the research, this analysis was based on 2020 data. The dominant obstacle types in each county were identified according to the criterion that the obstacle degree of a subsystem should exceed the sum of its mean and standard deviation [56]. The results are shown in Table 7. County-level obstacle factors in the study area were classified into three types: single obstacle, dual obstacle, and multiple obstacle. These can be further divided into nine subcategories. Among these, the proportion of counties affected by multiple obstacles—such as grain production stability, cultivated land use, resource endowment, and ecological sustainability—was the highest, accounting for 49.02% (25 counties) of the total and covering a total area of 116,019.1 km2. This suggests that improvements in CLUSR in nearly half of the counties in the Songnen Plain were simultaneously constrained by multiple factors. Counties affected by a single obstacle ranked second, accounting for 41.18% of the total. Among them, counties constrained by grain production stability and ecological sustainability accounted for relatively large proportions, at 15.69% and 9.80%, respectively. Counties dominated by obstacles to grain production stability included Bin County, Keshan County, and Kedong County, amounting to eight counties in total. These counties were characterized by relatively small cultivated land areas and low grain yields. Counties dominated by ecological sustainability obstacles were concentrated in regions such as the municipal districts of Daqing, Dumeng Autonomous County, and Daan County, where salinization and soil erosion are severe. In addition, counties with dual obstacles accounted for the smallest proportion (9.8%) and were primarily constrained by resource endowment or ecological sustainability factors.

4. Discussion

4.1. The Assessment System for CLUSR, Based on “Resource–Utilization–Production–Ecology” Framework, Is Essential for Scientific Evaluations of CLUSR and Enables Effective Cross-Regional Comparisons

Existing studies on CLR and CLUSR have primarily focused on the characteristics of specific research areas, constructing indicator systems by simulating the sources of resilience from the perspectives of pressure–state–response or resistance–adaptation–transformation. For instance, Li et al. [22] investigated CLR in the black soil region of Qiqihar City, China, where hilly terrain and uneven economic development prevail, and selected cultivated land slope and the farmer–village income disparity of the pressure system. Similarly, Miao et al. [2] constructed two subsystems, the black soil ecological and socioeconomic, and selected pressure indicators such as flood season rainfall, growing season drought index, soil erosion, and slope. Owing to differences in research areas and data acquisition methods, the selection of indicator systems—particularly pressure indicators—varies considerably. Notably, with climate change, shifts in the global food security landscape, and accelerating urbanization, the pressures on cultivated land use systems in many regions will continue to evolve. This implies that indicator systems based on existing pressures may no longer adequately capture the objective resilience of cultivated land use systems. Therefore, in order to objectively assess CLUSR across different regions, evaluations should focus on the resistance, support, and recovery capacities of cultivated land use systems and their subsystems. Compared with previous studies, we aim for a comprehensive characterization of CLUSR through four interrelated and mutually influential subsystems: resources, utilization, output, and ecology. Resources are crucial for supporting CLUSR. The water–heat–carbon supply capacity of cultivated land resources reflects their quality and health, forming the foundation for CLUSR to support agricultural production, withstand external pressures, and maintain normal system functioning [57,58,59]. Accordingly, we characterized the resource endowment of the cultivated land use system in terms of mean annual precipitation, water coverage ratio, mean annual temperature, soil organic carbon content, and soil pH. In addition, several studies have shown that the appropriate allocation of human resources, capital, and technology to cultivated land helps promote the efficient use of resources [60,61]. Therefore, agricultural labor input, capital investment, mechanization level, and water–land coordination degree were selected as utilization-related CLUSR indicators. Stable grain production capacity reflects the ability of the cultivated land use system to respond to external pressures and restore structural and functional integrity [62], so cultivated land area (total and per capita), grain yield, and total agricultural output value were included in the index system to evaluate the stable output capacity of cultivated land. Finally, a healthy cultivated land ecosystem is essential for providing ecosystem services such as soil fertility, water regulation, and biodiversity and represents a key limiting factor for the sustainable supply and utilization of cultivated land resources [63]. Excessive fertilizer application [64], alterations in spatial connectivity [65], and soil erosion [66] negatively affect the quality of cultivated land ecosystems. Accordingly, fertilizer consumption, landscape fragmentation, and soil erosion were adopted as negative indicators to evaluate ESR. In addition, ecological conservation capacity was included as a positive indicator of cultivated land ESR. In summary, constructing an indicator system based on four dimensions—resource endowment, cultivated land use investment, grain production, and ecological sustainability—not only enables a comprehensive characterization of the current CLUSR level but also provides an effective means to evaluate its capacity to withstand pressures and adapt to future challenges. Compared with previous studies that often focused on a single subsystem or a limited set of indicators, this study establishes a more systematic and integrative analytical framework, thereby enhancing the robustness and applicability of CLUSR assessments. Moreover, the proposed framework can be applied to large-scale evaluations and cross-regional comparisons, offering valuable data support for governmental decision-making and the sustainable management of cultivated land resources.

4.2. Spatial and Temporal Evolution of the CLUSR

Between 2005 and 2020, the ESR scored the highest resilience value (0.121) among the four subsystems of CLUSR in the Songnen Plain (Table 3), consistent with the region’s actual ecological conditions. The Songnen Plain, located within the black soil belt of Northeast China [35], possesses relatively high soil ecosystem service capacity [67] and is recognized as a nationally important ecological function zone. In recent years, the implementation of the Black Soil Protection Law, the Black Soil Protection Regulations, and the Grain-to-Green Program [68] has prompted active adoption of soil protection measures in the study area, including crop rotation, fallow management, precision fertilization, and organic agriculture. These measures have effectively enhanced the ecological sustainability and ESR of the Songnen Plain’s cultivated land use system [69,70]. Consistently, relevant studies in the Songnen Plain, as well as in Heilongjiang and Jilin Provinces, indicate that the ecological carrying capacity of cultivated land in these regions remains relatively high [2,71,72].
Over the study period, the overall CLUSR of the Songnen Plain exhibited an upward trend, primarily driven by continuous increases in CLUR and GPSR (Table 3). As China’s major grain-producing region, the Songnen Plain plays a critical role in ensuring national food security, promoting agricultural modernization, and supporting the revitalization of Northeast China [73]. In 2007, the Chinese government issued its Central Document No. 1, which called for equipping agriculture with modern material resources and enhancing irrigation and mechanization levels. By 2008, a target responsibility system for cultivated land protection had been established to safeguard the red line of 1.8 billion mu cultivated land (≈12 million hectares) [74]. In 2014, the central government further allocated subsidies for agricultural resources and ecological conservation, specifically aimed at improving cultivated land quality and promoting sustainable land use practices. Within this policy context, agricultural investment and mechanization in the study area increased substantially, with total agricultural funding rising from CNY 161,064.83 million in 2005 to CNY 6,923,556.17 million in 2020 and mechanization capacity from 11.1387 million kW to 58.351 million kW. These improvements contributed significantly to a rise in CLUSR. Concurrently, total cultivated land area, grain yield per unit area, and agricultural output value per unit of cultivated land also increased significantly (from 133,214.76 km2, 328.44 ton/km2, and 615,600 CNY/km2 in 2005 to 133,221.79 km2, 495.03 ton/km2, and 1,981,400 CNY/km2 in 2020, respectively), resulting in an upward trajectory of GPSR over the 15-year period.
Spatially, the CLUSR in the study area exhibited an overall “high in the east and low in the west” pattern (Figure 4), with the High–High CLUSR clusters concentrated in the eastern region (Figure 8). This spatial heterogeneity is associated with factors such as economic development, soil properties, and climatic conditions. The eastern region, particularly the southeastern part, is proximate to Harbin and Changchun, the provincial capitals of Heilongjiang and Jilin, respectively. These cities feature dense populations, relatively high economic development, well-established agricultural infrastructure, and substantial agricultural labor and capital investment [75,76]. In addition, the black soil layer in the eastern Songnen Plain, including areas around Harbin and Changchun, is relatively thick and rich in organic matter. In contrast, western areas such as Qiqihar, Baicheng, and Daqing face soil erosion, desertification, and salinization, resulting in thinner black soil layers and poorer soil [40,77]. Climatically, the eastern part of the study area falls within humid and semi-humid zones, with average annual precipitation of 500–650 mm. It provides favorable soil moisture that supports cultivated land use system adaptation and recovery. Conversely, western areas such as Qiqihar, Daqing, and Baicheng are located in semi-arid zones, receiving only 300–450 mm of annual precipitation [77]. Low precipitation combined with high evaporation rates exacerbates soil desertification and salinization, leading to degraded cultivated land and reduced CLUSR. Furthermore, the northeastern part of the study area, including Wudalianchi City, Beian City, and Kedong County (Figure 4 and Figure 8), consistently exhibited relatively low CLUSR, closely corresponding to the Low–Low zone. This pattern is primarily attributed to the region’s high elevation and abundant forest resources (Figure 1), which constrain the total cultivated land area and per capita arable land. Additionally, the fragmented distribution of arable land limits opportunities for large-scale mechanization, resulting in lower values of both CLUR and GPSR and, consequently, a reduced overall CLUSR.
It is worth mentioning that the center of gravity of CLUSR in the Songnen Plain has shifted northwestward (Figure 6). The change is likely driven by increases in CLUSR in the western part of the study area, particularly in Longjiang County, Keshan County, Baiquan County, and Kedong County of Qiqihar City during 2005–2020. In recent years, Longjiang County in Qiqihar has emerged as a pilot region for black soil protection, implementing measures such as protective cultivation, straw return, reduced tillage, and no-till farming to safeguard cultivated land. These practices have given rise to the “Longjiang Model” for black soil protection [78], which has substantially improved soil quality. Moreover, as a major grain-producing county in China, Longjiang ranks first in grain output within Qiqihar City [79]. Its favorable natural endowments and stable cultivated land production capacity have contributed significantly to the enhancement of CLUSR in the region. In contrast, Keshan County, Baiquan County, and Kedong County represent typical areas of soil erosion on the Songnen Plain [80]. Under the “Comprehensive Prevention and Control Plan for Soil Erosion in the Northeast Black Soil Region”, large-scale soil erosion control initiatives have recently been implemented across these counties [81,82], resulting in a marked reduction in the vulnerability of the cultivated land use system in the region and a substantial improvement in its capacity to withstand external risks.

4.3. Policy Implications

The findings indicate that CLUSR in the Songnen Plain demonstrated a gradual upward trend (Table 3) over a 15-year period. This improvement is attributable to national efforts to promote agricultural modernization and to safeguard the red line of 1.8 billion mu of cultivated land, both of which enhanced cultivated land utilization efficiency and stabilized the production capacity. However, it is important to note that, despite substantial investments in capital, labor, and agricultural mechanization, and despite the implementation of ecological conservation and black soil protection policies, the RER and ESR exhibited fluctuations during the study period. In particular, ESR displayed an overall declining trend (Table 3), despite the region’s favorable resource endowment and relatively high baseline ecological conditions. These dynamics suggest that complex feedback effects exist among the four subsystems of CLUSR. Consequently, future policies aimed at enhancing CLUSR should adopt a coordinated approach that balances the interactions among these subsystems in order to avoid excessive anthropogenic inputs from compromising cultivated land quality and ecological sustainability. Furthermore, we recommend establishing a comprehensive monitoring network for cultivated land quality and ecological conditions to enable regular risk assessments and early warnings. Additionally, the analysis of obstacle factors revealed that soil organic content emerged as a primary constraint for the first time in 2020, while the obstacle degrees for water coverage, agricultural labor input, and cultivated land area demonstrated consistent upward trends throughout the study period (Table 6). These factors are expected to become key constraints hindering the recovery of CLUSR in the future. Therefore, targeted policy measures should be formulated in line with national conditions, regional realities, and projected climate trends so as to strengthen the system’s ability to withstand external pressures from the outset. The Songnen Plain, located within Northeast China’s black soil belt, shoulders a critical responsibility to ensure national food security. In recent years, this region has faced significant challenges, including soil layer thinning, nutrient depletion, and declining soil organic carbon content [83]. To address these issues, future policy measures should actively promote sustainable land management practices such as fallow rotation, conservation tillage, straw incorporation, and organic fertilizer application to systematically enhance cultivated land quality. Concurrently, climate changes have introduced additional pressures through rising temperatures, reduced effective precipitation, and increased evaporation rates across Northeast China [84,85], thereby weakening regional water supply capacity. In response, it is essential to expand the application of precision irrigation technologies, such as drip and sprinkler irrigation, to improve water use efficiency. Furthermore, strategic optimization of crop structures, including a moderate reduction in paddy field areas, could help alleviate water resource constraints on CLUSR. To address the agricultural labor shortage resulting from population outflow and aging in Northeast China, proactive measures should be implemented to foster new agricultural business entities, advance intelligent farming technologies, and facilitate appropriately scaled operations. These strategies will help mitigate the constraints on CLUSR imposed by demographic challenges. Moreover, the government should maintain strict enforcement of national cultivated land protection policies, safeguard the red line of 1.8 billion mu cultivated land, increase the supply of high-quality cultivated land, and enhance the overall CLUSR of the region against external pressures. At the county level, differentiated management practices should be implemented according to the specific types of obstacle factors. For areas constrained by a single obstacle zone, targeted precision governance is recommended. For instance, CLUSR in the municipal districts of Daqing City, Dumeng Autonomous County, Qianguo Autonomous County, and Da’an City was primarily limited by the ecological sustainability subsystem (Table 7). Previous studies have shown that these counties are situated within the arid and semi-arid climatic zones of the central and western Songnen Plain, where high evaporation rates, low-lying topography, irrational irrigation practices, and intensive fertilizer application have collectively exacerbated soil salinization, resulting in compromised ecosystem sustainability and resilience 63. To enhance CLUSR in these areas, comprehensive ecological remediation should be pursued through integrated approaches, including engineering interventions (e.g., groundwater level regulation, subsurface drainage, and salt isolation technologies) and vegetation or land use management strategies (e.g., the introduction of salt-tolerant species and controlling the expansion of paddy fields). For regions exhibiting dual or multiple obstacle zones, coordinated or system-level governance is required to strengthen their capacity to withstand risks. Take Suiling County and Wudalianchi City in the northeastern study area as examples: although their CLUSR has improved, both have remained in low-resilience zones (Figure 4), simultaneously facing multidimensional constraints across grain production stability, cultivated land use, resource endowment, and ecological sustainability (Table 7). Situated in high-altitude areas rich in forest resources, these counties are further limited by topography, climatic conditions, and low population density, which limit cultivated land areas, hinder large-scale mechanized farming, and create fragile ecosystems with poor resource endowments. In practical management terms, implementing isolated interventions targeting single subsystems—such as forest clearance for agricultural expansion or intensifying mechanization—not only fails to enhance overall system resilience but may further exacerbate ecosystem vulnerability and degrade fundamental resource quality. Therefore, integrated and coordinated management strategies are essential. Adaptive agricultural practices, such as improved water and fertilizer management, conservation tillage, and crop variety improvement, could effectively mitigate natural constraints on grain production in high-altitude regions, thereby simultaneously enhancing both RER and GPSR. At the same time, strategic optimization of land allocation among cultivated land, forest land, and ecological conservation zones, coupled with enhanced ecological compensation mechanisms for cultivated land, can significantly strengthen both ESR and CLUR. Such measures are necessary to achieve a balance between cultivated land use and ecological conservation.

5. Conclusions

In this research, we constructed an evaluation index system for CLUSR based on the RUPE framework, which encompasses four dimensions—RER, CLUR, GPSR, and ESR—and measured the CLUSR of the Songnen Plain in 2005, 2010, 2015, and 2020. Furthermore, the SDE tool and spatial autocorrelation analysis were employed to reveal the spatiotemporal dynamics of CLUSR, while an obstacle diagnosis model was applied to identify the primary factors impeding CLUSR enhancement at the county level. The results were as follows:
(1)
From 2005 to 2020, CLUSR showed an increasing trend, with the value rising from 0.3353 in 2005 to 0.4256 in 2020. However, overall CLUSR remained at a relatively low level, indicating significant potential for improvement. Across subsystems, the mean resilience scores followed the order ESR (0.121) > RER (0.114) > GPSR (0.090) > CLUR (0.055).
(2)
Spatially, CLUSR exhibited a distinct “high in the east and low in the west” pattern, with significant changes in the distribution of resilience levels over the past 15 years. Concurrently, the spatial gravity center of CLUSR shifted northwestward from the southeast, with the level of CLUSR in the northwestern region showing a marked increase. CLUSR of the Songnen Plain presented spatial clustering, primarily characterized by High–High clusters and Low–Low clusters. High–High clusters showed a relatively stable distribution, concentrated mainly in the southeastern part of the study area around the provincial capitals of Harbin and Changchun and their surrounding regions. Low–Low clusters, however, displayed a pattern of differentiation.
(3)
From the indicator perspective, the agricultural output value per unit of cultivated area, water coverage degree, agricultural labor input, agricultural mechanization level, cultivated land area, per capita yield of grain, and agricultural capital investment were identified as the dominant obstacles to CLUSR improvement. Among these, agricultural output value per unit of cultivated area was the most critical obstacle factor. Soil organic carbon content, water coverage degree, agricultural labor input, and cultivated land area are expected to be the primary factors constraining the enhancement of CLUSR in the future. From a subsystem perspective, grain production stability and cultivated land use subsystems were the primary factors limiting the improvement in CLUSR in the Songnen Plain.
(4)
At the county level, obstacle factors were classified into three types: single, dual, and multiple obstacles. Among these, nearly half of the counties (49.02%) were affected by multiple obstacles related to grain production stability, cultivated land use, resource endowment, and ecological sustainability. Counties affected by single obstacle zones ranked second (41.18%), while those with dual obstacle zones accounted for the smallest proportion (9.8%).
(5)
In formulating future policies, it is essential for the government to coordinate the relationships among four subsystems (resource endowment, cultivated land use, grain production stability, and ecological sustainability) to avoid excessive human interventions that may impair cultivated land quality and ecological sustainability. Meanwhile, addressing the major obstacles to the recovery of CLUSR, such as soil organic carbon content, water coverage degree, agricultural labor input, and cultivated land area, measures should be formulated in line with national conditions, regional realities, and long-term climate dynamics. Practical strategies could include fallow rotation, precision irrigation, fostering new agricultural business entities, and strictly implemented policies for protecting cultivated land and other measures. Moreover, differentiated management should be implemented according to the specific types of obstacle factors. For areas constrained by a single obstacle, targeted precision governance is recommended. In contrast, areas characterized by dual or multiple obstacles would benefit more from collaborative or system-level management, which can enhance their overall resilience and capacity to withstand external risks.

Author Contributions

Conceptualization, X.G. and S.Y.; Methodology, X.G.; Software, Y.L. (Yunfeng Liu) and T.M.; Validation, Y.L. (Yunfeng Liu) and Y.L. (Yuanyuan Liu); Formal analysis, Y.L. (Yunfeng Liu); Investigation, Y.L. (Yunfeng Liu), T.M. and Y.C.; Resources, T.M.; Data curation, Y.L. (Yuanyuan Liu) and Y.C.; Writing—original draft, X.G. and Y.L. (Yunfeng Liu); Writing—review & editing, G.D. and S.Y.; Visualization, Y.C.; Supervision, X.G. and S.Y.; Funding acquisition, X.G., G.D. and S.Y. All authors have read and agreed to the published version of the manuscript.

Funding

This research was funded by National Key Research and Development Program of China (grant number 2024YFD1500901), Natural Science Foundation of Heilongjiang Province of China (grant number ZL2024D002), Program of China Scholarship Council (grant number 202306610035).

Data Availability Statement

The raw data supporting the conclusions of this article will be made available by the authors on request.

Conflicts of Interest

The authors declare no conflict of interest.

References

  1. Gigliotti, M.; Schmidt-Traub, G.; Bastianoni, S. The sustainable development goals. Encycl. Ecol. 2019, 4, 426–431. [Google Scholar] [CrossRef]
  2. Miao, X.; Li, Z.; Wang, M.; Mei, J.; Chen, J. Measurement of cultivated land ecosystem resilience in black soil region of Northeast China under the background of cultivated land protection policy in China: Case study of Qiqihar City. J. Clean. Prod. 2024, 434, 140141. [Google Scholar] [CrossRef]
  3. Zhou, W.; Shi, J.; Fan, Z. Research on Ecological Protection of Cultivated Land Based on Food Security and Ecological Security. Chin. J. Land Sci. 2023, 37, 125–134. [Google Scholar]
  4. Meng, L.; Huang, C.; Chen, X.; Jiang, L.; Zhang, G.; Hao, J.; An, P. Evaluation of the Resilience of the Farmland Utilization System in Quzhou County. Resour. Sci. 2019, 41, 1949–1958. [Google Scholar]
  5. Cui, J.; Jin, H.; Luo, Y.; Lin, Y.; Tong, X.; Zhu, Y. The Coupling and Coordination Relationship Between Non-agricultural and Non-grain Use of Farmland and Rural Population Depopulation at the County Level: A Case Study of the Yangtze River Economic Belt. Acta Ecol. Sin. 2024, 44, 1822–1836. [Google Scholar] [CrossRef]
  6. Zhou, Y.; Li, X.; Liu, Y. Cultivated land protection and rational use in China. Land Use Policy 2021, 106, 105454. [Google Scholar] [CrossRef]
  7. Li, C.; Zhang, Y.; Fu, B.; Song, X.; Zhang, Y. Evaluation of Cultivated Land Resilience and Spatial Differences in Kunming City. Sci. Technol. Eng. 2021, 21, 4848–4855. [Google Scholar]
  8. Liu, W.; Song, G.; Gao, J.; Sui, H.; Wang, Q. Spatial and Temporal Differentiation Characteristics of Resilience of the Cultivated Land System in Typical Regions of the Lower Liaohe Plain. Trans. Chin. Soc. Agric. Eng. 2023, 39, 252–260. [Google Scholar]
  9. Xu, W.; Jin, X.; Liu, J.; Li, H.; Zhang, X.; Zhou, Y. Spatiotemporal evolution and the detection of key drivers in the resilience of cultivated land system in major grain-producing regions of China. Land Degrad. Dev. 2023, 34, 4712–4727. [Google Scholar] [CrossRef]
  10. Lewandowski, I.; von Cossel, M.; Winkler, B.; Bauerle, A.; Gaudet, N.; Kiesel, A.; Lewin, E.; Magenau, E.; Marting Vidaurre, N.A.; Müller, B.; et al. An adapted indicator framework for evaluating the potential contribution of bioeconomy approaches to agricultural systems resilience. Adv. Sustain. Syst. 2024, 8, 2300518. [Google Scholar] [CrossRef]
  11. Wang, Y.; Jiang, Y.; Zhu, G. Spatio-temporal evaluation of multi-scale cultivated land system resilience in black soil region from 2000 to 2019: A case study of Liaoning Province, Northeast China. Chin. Geogr. Sci. 2024, 34, 168–180. [Google Scholar] [CrossRef]
  12. Wang, D.; Yu, H.; Qiu, Z.; Dong, Y.; Dong, Z.; Huangfu, Y. Analysis of land system resilience: Static and dynamic perspectives. J. Clean. Prod. 2024, 447, 141258. [Google Scholar] [CrossRef]
  13. Rose, A. Economic resilience to natural and man-made disasters: Multidisciplinary origins and contextual dimensions. Environ. Hazards 2007, 7, 383–398. [Google Scholar] [CrossRef]
  14. Martin, R. Regional economic resilience, hysteresis and recessionary shocks. J. Econ. Geogr. 2012, 12, 1–32. [Google Scholar] [CrossRef]
  15. Reggiani, A. Network resilience for transport security: Some methodological considerations. Transp. Policy 2013, 28, 63–68. [Google Scholar] [CrossRef]
  16. Hotelling, C.S. Resilience and stability of ecological system. Annu. Rev. Ecol. Syst. 1973, 4, 1–23. [Google Scholar] [CrossRef]
  17. Shao, Y.; Xu, J. Urban Resilience: A Conceptual Analysis Based on an International Literature Review. Int. Urban Plan. 2015, 30, 48–54. [Google Scholar]
  18. Ye, Z.; Li, J.; Chen, J. The promotion mechanism of financial agglomeration and human capital on urban economic resilience: Based on the moderating effect of industrial structure. Int. Rev. Econ. Financ. 2025, 97, 103764. [Google Scholar] [CrossRef]
  19. Weiss, R.; Zobel, C.W. Resist and recover: Introducing a spring theory for modeling disaster resilience. Risk Anal. 2025, 45, 409–420. [Google Scholar] [CrossRef] [PubMed]
  20. Humphries, C. An urban resilience fix: Resolving waterfront development and flood risks in Boston’s Seaport District. Urban Geogr. 2025, 46, 1497–1518. [Google Scholar] [CrossRef]
  21. Li, Y.; Gao, G.; Wen, J.; Zhao, N.; Du, G.; Stanny, M. The measurement of agricultural disaster vulnerability in China and implications for land-supported agricultural resilience building. Land Use Policy 2025, 148, 107400. [Google Scholar] [CrossRef]
  22. Li, Y.; Huang, H.; Guo, T.; Du, G. Research on the resilience of cultivated land in the Northeast Black Soil Region under multiple stressors and its implications: A case study of BaiQuan County, Heilongjiang Province. Chin. J. Land Sci. 2022, 36, 71–79. [Google Scholar]
  23. Zhao, H.; Qu, X.; Feng, X.; Wu, K.; Huang, Q. Theoretical and Empirical Research on the Elastic Deformation of Cultivated Land. Reg. Res. Dev. 2012, 31, 73–77. [Google Scholar]
  24. Chen, Y.; Bakker, M.M.; Ligtenberg, A.; Bregt, A.K. External shocks, agent interactions, and endogenous feedbacks—Investigating system resilience with a stylized land use model. Ecol. Complex. 2019, 40, 100765. [Google Scholar] [CrossRef]
  25. Wang, X.; Wang, Y.N. Farmer differentiation and cultivated use system resilience from a perceptive behavioral perspective: Influencing mechanisms and governance strategies. Front. Sustain. Food Syst. 2024, 8, 1307781. [Google Scholar] [CrossRef]
  26. Li, L.; Pan, P.; Wang, Y.; Wang, X.; Wang, X.; Xiao, D.; Song, S. Research on the cultivated land use system resilience under a safe and just space framework. J. Environ. Manag. 2025, 380, 125006. [Google Scholar] [CrossRef] [PubMed]
  27. Rose, A. Defining and measuring economic resilience to disasters. Disaster Prev. Manag. Int. J. 2004, 13, 307–314. [Google Scholar] [CrossRef]
  28. Ansah, I.G.K.; Kotu, B.H.; Manda, J.; Muthoni, F.; Azzarri, C. Mediation and moderation roles of resilience capacity in the shock–food-security nexus in northern Ghana. Ecol. Econ. 2023, 211, 107894. [Google Scholar] [CrossRef]
  29. Kahiluoto, H.; Kaseva, J.; Hakala, K.; Himanen, S.J.; Jauhiainen, L.; Rötter, R.P.; Salo, T.; Trnka, M. Cultivating resilience by empirically revealing response diversity. Glob. Environ. Change 2014, 25, 186–193. [Google Scholar] [CrossRef]
  30. Joerin, J.; Shaw, R.; Takeuchi, Y.; Krishnamurthy, R. Action-oriented resilience assessment of communities in Chennai, India. Environ. Hazards 2012, 11, 226–241. [Google Scholar] [CrossRef]
  31. Dong, X.; Shi, T.; Zhang, W.; Zhou, Q. Temporal and spatial differences in the resilience of smart cities and their influencing factors: Evidence from non-provincial cities in China. Sustainability 2020, 12, 1321. [Google Scholar] [CrossRef]
  32. Yan, M.; Yang, B.; Sheng, S.; Fan, X.; Li, X.; Lu, X. Evaluation of cropland system resilience to climate change at municipal scale through robustness, adaptability, and transformability: A case study of Hubei province, China. Front. Ecol. Evol. 2022, 10, 943265. [Google Scholar] [CrossRef]
  33. Yang, H.; Zou, R.; Hu, Y.; Wang, L.; Xie, Y.; Tan, Z.; Zhu, Z.; Zhu, A.-X.; Gong, J.; Mao, X. Sustainable utilization of cultivated land resources based on “element coupling-function synergy” analytical framework: A case study of Guangdong, China. Land Use Policy 2024, 146, 107316. [Google Scholar] [CrossRef]
  34. Chen, Y.; Li, X.; Wang, J. Changes and effecting factors of grain production in China. Chin. Geogr. Sci. 2011, 21, 676–684. [Google Scholar] [CrossRef]
  35. Wang, H.; Zhang, C.; Yao, X.; Yun, W.; Ma, J.; Gao, L.; Li, P. Scenario simulation of the tradeoff between ecological land and farmland in black soil region of Northeast China. Land Use Policy 2022, 114, 105991. [Google Scholar] [CrossRef]
  36. Tian, Z.; Lu, H.; Ma, R.; Zhao, Y.; Liang, Y. Spatial differentiation characteristics of soil erosion and degradation in the Northeast Black Soil Region’s cultivated land. Acta Pedol. Sin. 2024, 1–16. Available online: https://link.cnki.net/urlid/32.1119.P.20241022.1655.002 (accessed on 16 November 2024).
  37. Wei, S.; Wei, G. The Impact and Mechanism of Agricultural Machinery Operation Services on Farmers’ Black Soil Protection Behavior: Evidence from Farmers in a Typical Black Soil Region in Jilin Province. Resour. Sci. 2024, 46, 1382–1393. [Google Scholar]
  38. Sui, H.; Song, G.; Gao, J. Spatiotemporal Differentiation of Ecological Degradation of Cultivated Land in a Typical Region of the Northeast Black Soil Area: A Case Study of Fuji City. J. Nat. Resour. 2022, 37, 2277–2291. [Google Scholar]
  39. Xiang, H.; Zhang, J.; Wang, Z.; Mao, D. Research on the supply and demand of ecosystem services in the Songnen Plain. J. Ecol. Environ. 2021, 30, 1769–1776. [Google Scholar] [CrossRef]
  40. Huang, J.; Wu, Z.; Xue, K.; Xiong, J. An evaluation framework for identifying saline croplands for improvement: A case study of Songnen Plain. Geoderma Reg. 2025, 41, e00963. [Google Scholar] [CrossRef]
  41. Yin, Z. Spatio-temporal changes in land use patterns on the Songnen Plain and their relationship with climatic factors. Environ. Impact Assess. 2023, 45, 63–71. [Google Scholar] [CrossRef]
  42. Sun, J.; Wu, Y.; Zhang, Q.; Jiang, L.; Ma, Q.; Chen, M.; Dai, C.; Zhang, G. Spatiotemporal variation in water deficit-and heatwave-driven flash droughts in Songnen Plain and its ecological impact. Remote Sens. 2024, 16, 1408. [Google Scholar] [CrossRef]
  43. Zhang, L.; Li, Y.; Zhang, F.; Chen, L.; Pan, T.; Wang, B.; Ren, C. Changes of winter extreme precipitation in Heilongjiang province and the diagnostic analysis of its circulation features. Atmos. Res. 2020, 245, 105094. [Google Scholar] [CrossRef]
  44. Lu, Z.; Li, K.; Zhang, J.; Lei, G.; Yu, Z.; Li, C. Mechanisms influencing changes in water cycle processes in the changing environment of the Songnen Plain, China. Sci. Total Environ. 2023, 905, 166916. [Google Scholar] [CrossRef] [PubMed]
  45. Wu, Y.; Wang, W.; Wang, Q.; Zhong, Z.; Wang, H.; Yang, Y. Farmland shelterbelt changes in soil properties: Soil depth-location dependency and general pattern in Songnen Plain, Northeastern China. Forests 2023, 14, 584. [Google Scholar] [CrossRef]
  46. Li, L.; Tang, H.; Lei, J.; Song, X. Spatial autocorrelation in land use type and ecosystem service value in Hainan Tropical Rain Forest National Park. Ecol. Indic. 2022, 137, 108727. [Google Scholar] [CrossRef]
  47. Wu, H.; Xiong, J.; Hou, X.; Lin, C.; Xu, J.; Ma, R. Soil Water Erosion Dataset of Northeast China from 2001 to 2020. V2. Science Data Bank. 2023. Available online: https://cstr.cn/31253.11.sciencedb.08027 (accessed on 22 November 2024).
  48. Guo, X.; Sun, J.; Sun, Z.; Cai, Y.; Ma, T.; Du, G. A Study on the Degradation Risk of Cultivated Land Ecosystems in Major Grain-Producing Regions Based on a Measurement-Differentiation-Mechanism-Control Framework. J. Agric. Mach. 2025, 56, 1–15. Available online: https://link.cnki.net/urlid/11.1964.S.20250724.1928.004 (accessed on 16 August 2025).
  49. Geng, Y.; Li, X.; Chen, W.; Liu, X.; Chen, J.; Ji, H. Research on the identification of rural regional system resilience types and driving mechanisms: A case study of Suiyang District, Shangqiu City, in the eastern plains of Henan Province. Adv. Geogr. 2023, 42, 1755–1768. [Google Scholar]
  50. Li, H.; Wang, Y.; Zhang, H.; Yin, R.; Liu, C.; Wang, Z.; Fu, F.; Zhao, J. The spatial-temporal evolution and driving mechanism of Urban resilience in the Yellow River Basin cities. J. Clean. Prod. 2024, 447, 141614. [Google Scholar] [CrossRef]
  51. Li, W.; Guo, J. Coupling coordination and obstacle factors of cultivated land system resilience and new urbanization. Front. Sustain. Food Syst. 2025, 9, 1554797. [Google Scholar] [CrossRef]
  52. Yang, Y.; Qin, T.; Yan, D.; Liu, S.; Feng, J.; Wang, Q.; Liu, H.; Gao, H. Analysis of the evolution of ecosystem service value and its driving factors in the Yellow River Source Area, China. Ecol. Indic. 2024, 158, 111344. [Google Scholar] [CrossRef]
  53. Xiong, C.; Ren, H.; Xu, D.; Gao, Y. Spatial scale effects on the value of ecosystem services in China’s terrestrial area. J. Environ. Manag. 2024, 366, 121745. [Google Scholar] [CrossRef]
  54. Ren, X.; Xiong, R.; Ni, T. Spatial network characteristics of carbon balance in urban agglomerations—A case study in Beijing-Tianjin-Hebei city agglomeration. Appl. Geogr. 2024, 169, 103343. [Google Scholar] [CrossRef]
  55. Zhao, R.; Fang, C.; Liu, J.; Zhang, L. The evaluation and obstacle analysis of urban resilience from the multidimensional perspective in Chinese cities. Sustain. Cities Soc. 2022, 86, 104160. [Google Scholar] [CrossRef]
  56. Long, H.; Liu, Y.; Zou, J. Types of Rural Development in Eastern Coastal China and Evaluation of Rural Characteristics. Acta Geogr. Sin. 2009, 64, 426–434. [Google Scholar]
  57. Hughes, H.M.; Koolen, S.; Kuhnert, M.; Baggs, E.M.; Maund, S.; Mullier, G.W.; Hillier, J. Towards a farmer-feasible soil health assessment that is globally applicable. J. Environ. Manag. 2023, 345, 118582. [Google Scholar] [CrossRef]
  58. Bayissa, Y.; Srinivasan, R.; Hunink, J.; Nyolei, D.; Moges, S.; Costa, D.D.A.; Tadesse, D.; Melesse, A.; Tilahun, S. Evaluating the potential of Nature-based solutions to mitigate land use and climate change impacts on the hydrology of the Gefersa and Legedadi watersheds in Ethiopia. J. Hydrol. Reg. Stud. 2025, 57, 102130. [Google Scholar] [CrossRef]
  59. Moisa, M.B.; Negash, D.; Reta Roba, Z.; Debesa Wedajo, G.; Tsegay Deribew, K.; Benti, F.; Obsi Gemeda, D. Spatial analysis of urban expansion and its effects on land surface temperature using geospatial techniques in Addis Ababa and Shaggar Cities, Ethiopia. All Earth 2025, 37, 1–23. [Google Scholar] [CrossRef]
  60. Lyu, X.; Wang, Y.; Niu, S.; Peng, W. Spatio-Temporal Pattern and Influence Mechanism of Cultivated Land System Resilience: Case from China. Land 2022, 11, 11. [Google Scholar] [CrossRef]
  61. Czubak, W.; Pawłowski, K.P. The Impact of Agricultural Investments on the Economic Efficiency of Production Factors: An Empirical Study of the Wielkopolska Voivodeship. Agriculture 2024, 14, 2217. [Google Scholar] [CrossRef]
  62. Hao, S.; Wang, G.; Yang, Y.; Zhao, S.; Huang, S.; Liu, L.; Zhang, H. Promoting grain production through high-standard farmland construction: Evidence in China. J. Integr. Agric. 2024, 23, 324–335. [Google Scholar] [CrossRef]
  63. Tang, Z.; Song, W.; Zou, J. Farmland protection and fertilization intensity: Empirical evidence from preservation policy of Heilongjiang’s black soil. J. Environ. Manag. 2024, 356, 120629. [Google Scholar] [CrossRef]
  64. Hu, Y.; Liu, Y. Impact of fertilizer and pesticide reductions on land use in China based on crop-land integrated model. Land Use Policy 2024, 141, 107155. [Google Scholar] [CrossRef]
  65. Meier, E.S.; Lüscher, G.; Herzog, F.; Knop, E. Collaborative approaches at the landscape scale increase the benefits of agri-environmental measures for farmland biodiversity. Agric. Ecosyst. Environ. 2024, 367, 108948. [Google Scholar] [CrossRef]
  66. Fang, H.; Zhai, Y.; Li, C. Evaluating the impact of soil erosion on soil quality in an agricultural land, northeastern China. Sci. Rep. 2024, 14, 15629. [Google Scholar] [CrossRef]
  67. Guo, X.; Yang, Y.; Zhang, Y.; Kalantari, M.; Sun, J.; Sun, W.; Guan, G.; Du, G. The Spatiotemporal Correlation between Human Activity Intensity and the Evolution of Ecosystem Service Value in the Songnen Plain, China. Land 2024, 13, 1158. [Google Scholar] [CrossRef]
  68. Wang, J.; Xing, Q.; Tong, Y.; Wang, Z.; Li, B. Establish governance systems for securing black soils in China based on a new law. Soil Secur. 2023, 13, 100112. [Google Scholar] [CrossRef]
  69. Vaziritabar, Y.; Macholdt, J.; Frei, M.; Honermeier, B. Proficiency of green fallow compared to bare fallow, grain legume and cereal pre-crops in a long-term crop rotation. Eur. J. Agron. 2025, 170, 127765. [Google Scholar] [CrossRef]
  70. Brambilla, M.; Romano, E.; Toscano, P.; Cutini, M.; Biocca, M.; Ferre, C.; Comolli, R.; Bisaglia, C. From conventional to precision fertilization: A case study on the transition for a small-medium farm. AgriEngineering 2021, 3, 438–446. [Google Scholar] [CrossRef]
  71. Chen, L.; Zhao, H.; Song, G.; Liu, Y. Optimization of cultivated land pattern for achieving cultivated land system security: A case study in Heilongjiang Province, China. Land Use Policy 2021, 108, 105589. [Google Scholar] [CrossRef]
  72. Wang, F.; Han, Y.; Xu, Y.; Zhu, R.; Qu, C.; Zhang, P.; Martin, S.; Zhuang, L.; Liu, Z.; Zhang, J.; et al. Spatial-temporal variation and influencing factors of ecological environment quality in Jilin Province (China). Front. Environ. Sci. 2024, 12, 1446313. [Google Scholar] [CrossRef]
  73. Sun, X.; Li, Y.; Hu, Y.; Li, Y. Human and natural factors affect habitat quality in ecologically fragile areas: Evidence from Songnen Plain, China. Front. Plant Sci. 2024, 15, 1444163. [Google Scholar] [CrossRef]
  74. Wu, Y.; Shan, L.; Guo, Z.; Peng, Y. Cultivated land protection policies in China facing 2030: Dynamic balance system versus basic farmland zoning. Habitat Int. 2017, 69, 126–138. [Google Scholar] [CrossRef]
  75. Tang, Y.; Yuan, Y.; Zhong, Q. Evaluation of Land Comprehensive Carrying Capacity and Spatio-Temporal Analysis of the Harbin-Changchun Urban Agglomeration. Int. J. Environ. Res. Public Health 2021, 18, 521. [Google Scholar] [CrossRef]
  76. Pan, Z.; Tian, P.; Ma, P.; Ma, L.; Zhu, Y. Spatiotemporal evolution and driving factors in coupling coordination of cultivated land use transformation and county-level urban-rural integration in Harbin-Changchun urban agglomeration. Trans. Chin. Soc. Agric. Eng. 2025, 41, 228–239. [Google Scholar]
  77. Yu, H.; Wang, Z.; Mao, D.; Jia, M.; Chang, S.; Li, X. Spatiotemporal variations of soil salinization in China’s West Songnen Plain. Land Degrad. Dev. 2023, 34, 2366–2378. [Google Scholar] [CrossRef]
  78. Dai, Y.; Liu, Y.; Wang, Y.; Fang, W.; Chen, Y.; Sui, Y. A Practice of Conservation Tillage in the Mollisol Region in Heilongjiang Province of China: A Mini Review. Pol. J. Environ. Stud. 2023, 32, 1479–1489. [Google Scholar] [CrossRef]
  79. Wang, L.; Pang, M.; Wang, N.; Wei, D.; An, Z.; Xie, J.; Jin, L. Constructing and Spatially Differentiating Soil Quality Indices in Qiqihar’s Typical Black Soil Zone: A Case Study of Tailai, Longjiang, and Gannan Counties, China. Agronomy 2025, 15, 773. [Google Scholar] [CrossRef]
  80. Xie, Y.; Tang, J.; Gao, Y.; Gu, Z.; Liu, G.; Ren, X. Spatial distribution of soil erosion and its impacts on soil productivity in Songnen typical black soil region. Int. Soil Water Conserv. Res. 2023, 11, 649–659. [Google Scholar] [CrossRef]
  81. Liu, X.; Li, H.; Zhang, S.; Cruse, R.M.; Zhang, X. Gully Erosion Control Practices in Northeast China: A Review. Sustainability 2019, 11, 5065. [Google Scholar] [CrossRef]
  82. Li, M.; Li, T.; Zhu, L.; Meadows, M.E.; Zhu, W.; Zhang, S. Effect of land use change on gully erosion density in the black soil region of Northeast China from 1965 to 2015: A case study of the Kedong County. Front. Environ. Sci. 2021, 9, 652933. [Google Scholar] [CrossRef]
  83. Xu, X.; Pei, J.; Xu, Y.; Wang, J. Soil organic carbon depletion in global Mollisols regions and restoration by management practices: A review. J. Soils Sediments 2020, 20, 1173–1181. [Google Scholar] [CrossRef]
  84. Li, M.; Ye, W.; Li, Y.; Cui, C. Evaluation of the synergistic change in cultivated land and wetland in northeast China from 1990 to 2035. Sci. Rep. 2025, 15, 14973. [Google Scholar] [CrossRef] [PubMed]
  85. Dai, H.; Fang, Y.; Chen, C.; Liu, K.; Li, X.; Yang, Z.; Fang, N.; Zhang, Y. Geochemical Evaluation and Driving Factor Analysis of Soil Salinization in Northeast China Plain. Front. Environ. Sci. 2025, 13, 1614178. [Google Scholar] [CrossRef]
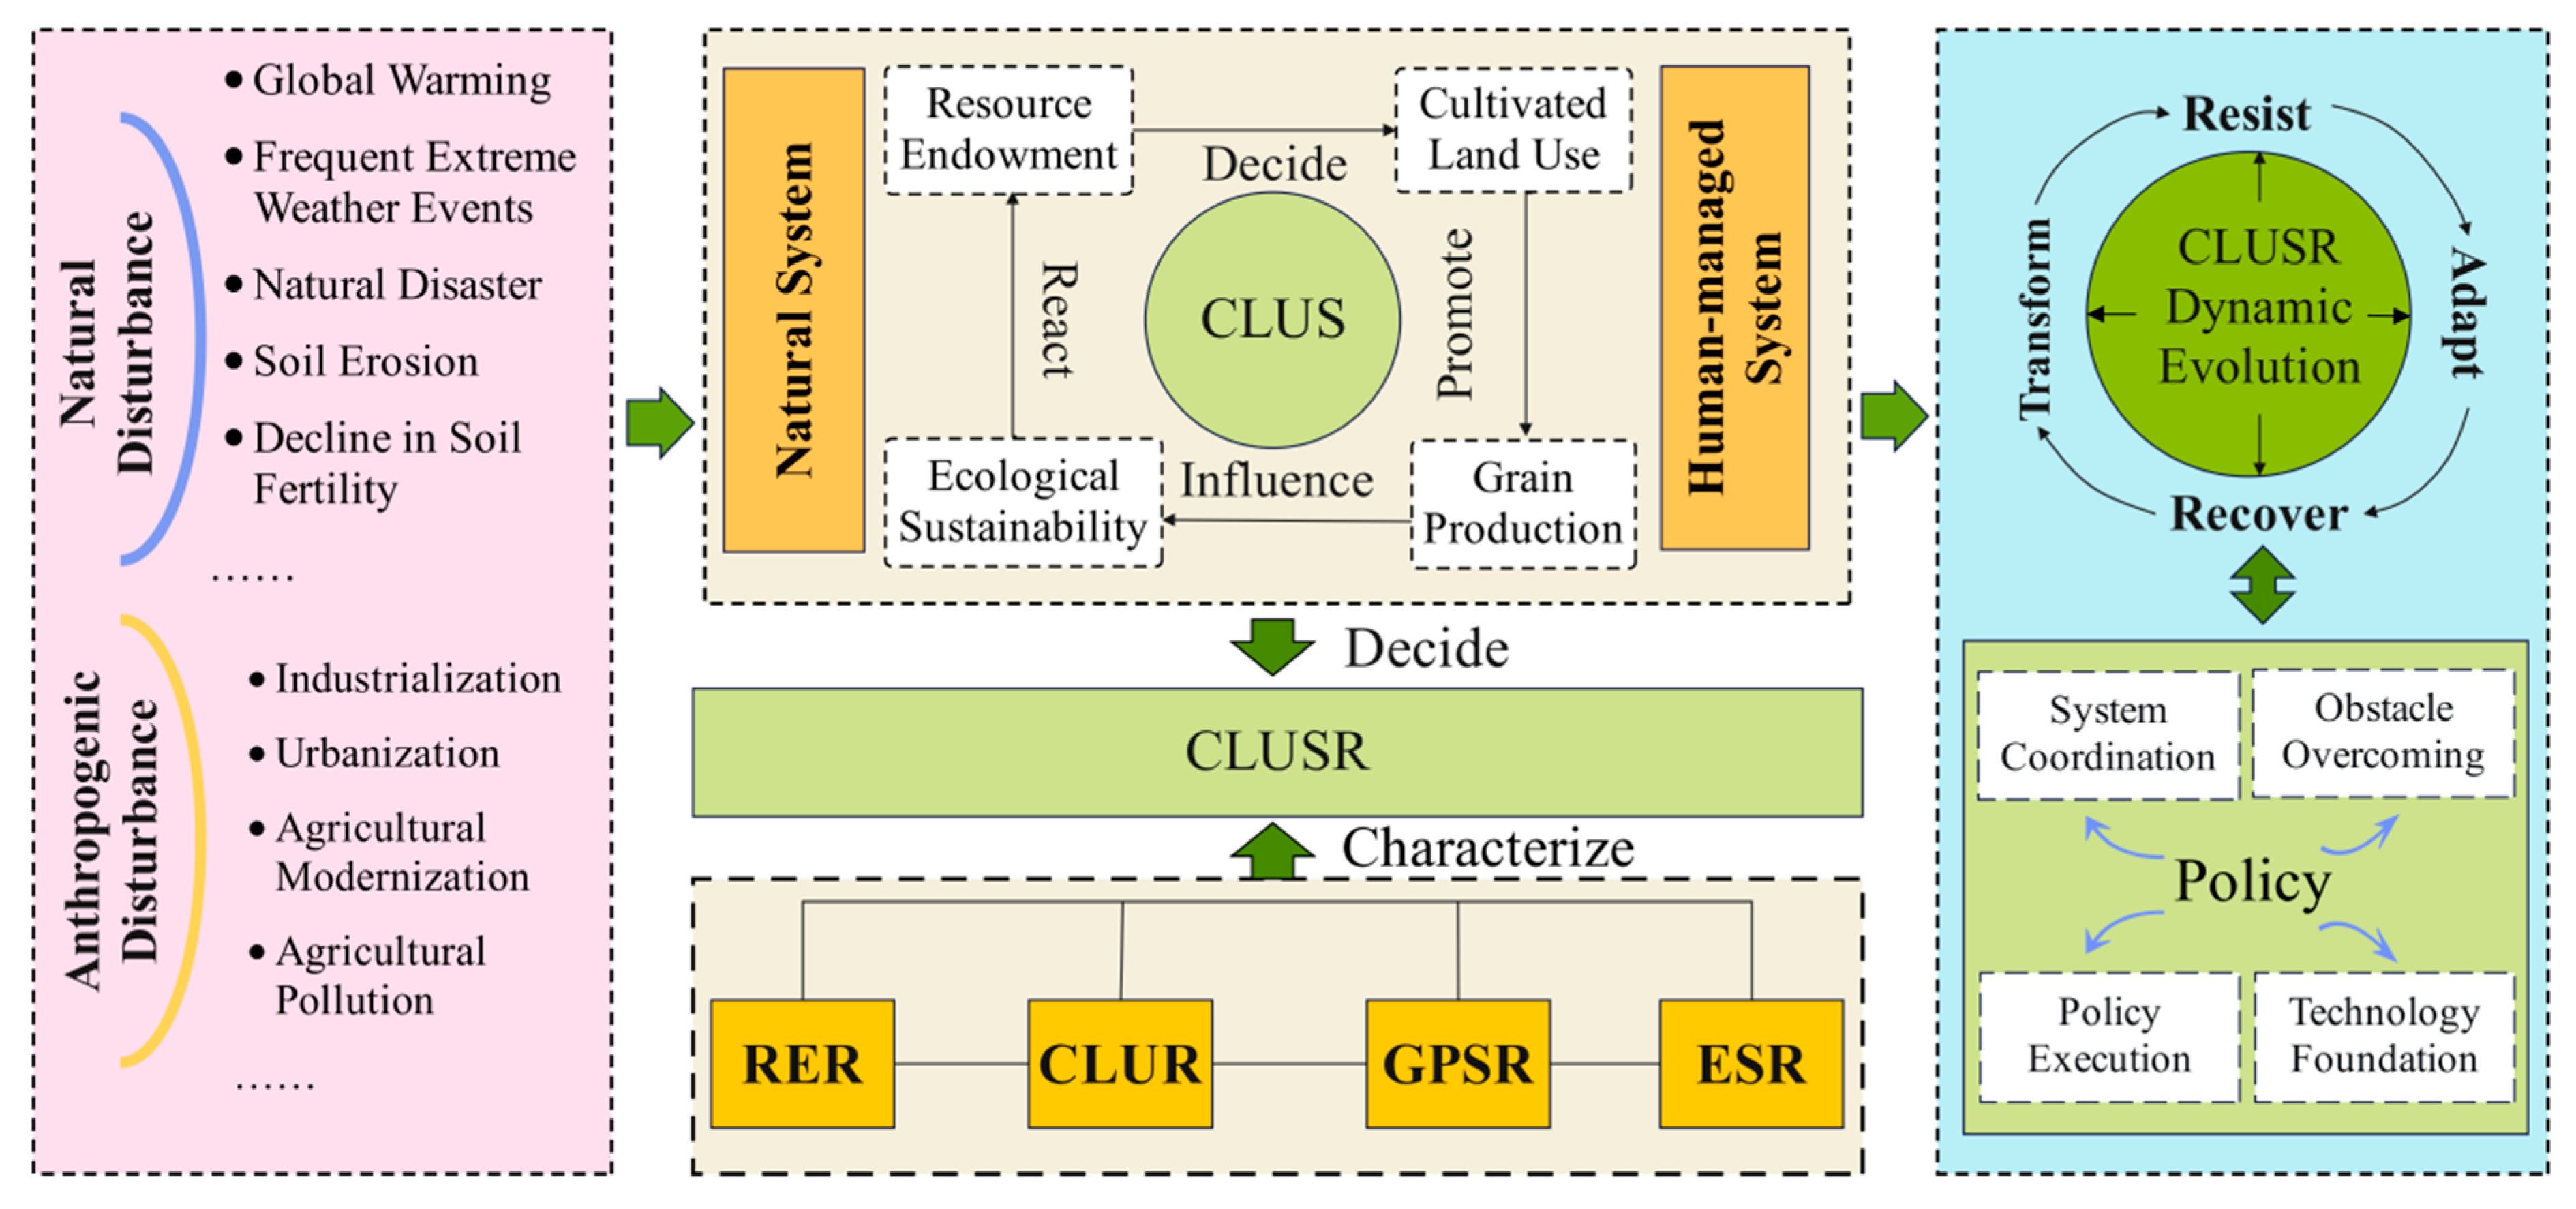
Figure 1. Location of and land use types in Songnen Plain, China [39,46].
Land 14 02292 g001
Figure 2. Evaluation framework for cultivated land use system resilience (CLUSR) in Songnen Plain, China. (In the figure, CLUS refers to the Cultivated Land Use System).
Land 14 02292 g002
Figure 3. Technology roadmap.
Land 14 02292 g003
Figure 4. Spatial pattern of change in CLUSR in Songnen Plain, China (2005–2020).
Land 14 02292 g004
Figure 5. Grade distribution pie chart of CLUSR in Songnen Plain, China (2005–2020).
Land 14 02292 g005
Figure 6. Standard deviation ellipse of CLUSR and its center of gravity change in Songnen plain, China (2005–2020).
Land 14 02292 g006
Figure 7. Global Moran′s I scatter diagram for CLUSR in Songnen Plain, China (2005–2020).
Land 14 02292 g007
Figure 8. Local spatial autocorrelation LISA results of CLUSR in Songnen Plain, China, from 2005 to 2020.
Land 14 02292 g008
Figure 9. Obstacle degrees for CLUSR in Songnen Plain, China (2005–2020), by subsystem.
Land 14 02292 g009
Table 1. Data sources.
Basic DataTypeCharacterizationResolutionData Source
Administrative BoundaryVectorThe 2024 administrative boundary of the Songnen Plain in China-Open Street Map
(https://openstreetmap.org/)
DEMRasterElevation250 m × 250 mResource and Environment Science and Data Center (http://www.resdc.cn)
Land Use
Data
RasterLand use remote sensing monitoring data for 2005, 2010, 2015, and 2020 (CNLUCC)30 m × 30 mResource and Environment Science and Data Center (http://www.resdc.cn)
Socioeconomic
Data
StatisticalTotal population, total agricultural machinery power, fiscal expenditure on agriculture, forestry and water affairs, agricultural population, fertilizer consumption (in physical units), effective irrigated area, total grain production, and total value of agricultural production for 2005, 2010, 2015, and 2020-Heilongjiang Statistical Yearbook and Jilin Statistical Yearbook
(http://data.cnki.net/)
Soil DataRasterSoil organic carbon content
and pH data
1 km × 1 kmNanjing Soil Research Institute
(https://www.issas.ac.cn/)
Soil Erosion
Data
RasterSoil erosion data for 2005, 2010, 2015, and 2020250 m × 250 mScience Data Bank
(https://www.scidb.cn/)
Meteorological RasterMean annual precipitation and mean annual temperature for 2005, 2010, 2015, and 20201 km × 1 kmNational Tibetan Plateau Data Center
(https://data.tpdc.ac.cn/)
NDVIRasterNormalized difference vegetation index data for 2005, 2010, 2015, and 202030 m × 30 mEarthdata Search APIs
(https://search.earthdata.nasa.gov/search)
Table 2. Evaluation indicator system of CLUSR in the Songnen Plain, China.
Target LayerCriterion Layer (Weight)Index LayerIndex ExplanationUnitAttributesWeight
Cultivated land use
resilience
Resource endowment resilience
(0.2735)
Mean annual precipitation (X1)Average annual precipitation
by municipality
mmneutral0.0584
Water coverage degree (X2)Water area/
total land area
%+0.0718
Mean annual temperature (X3)Average annual temperature
by municipality
°C+0.0385
Soil organic
carbon content (X4)
Quantifying soil fertilityg+0.0801
Soil pH value (X5)Quantifying soil
acidity–alkalinity status
/neutral0.0248
Cultivated land use resilience
(0.2521)
Agricultural
labor input (X6)
Agricultural populationperson+0.0701
Agricultural
capital investment (X7)
Fiscal expenditure on agriculture, forestry and water affairs CNY+0.0579
Agricultural mechanization level (X8)Total agricultural machinery powerkw+0.0771
Water–land
coordination degree (X9)
Effective irrigated area
/cultivated land area
%+0.0469
Grain production stability resilience
(0.3134)
Cultivated land area (X10)Quantity of cultivated
land resources
km2+0.0763
Per capita
cultivated land area (X11)
Cultivated land area/
total population
km2/person+0.0564
Per capita yield of grain (X12)Total grain yield/
cultivated land area
ton/km2+0.0977
Agricultural output value per unit of cultivated area (X13)Total value of agricultural production/cultivated land areaCNY/km2+0.0830
Ecological sustainable resilience
(0.1610)
Fertilizer input
per unit area (X14)
Fertilizer application quantities/cultivated land areat/km20.0335
Landscape fragmentation (X15)Quantifying landscape
structural connectivity
%0.0566
Soil erosion degree (X16)Soil erosion area
/cultivated land area
t0.0277
Ecological conservation
capacity (X17)
Normalized difference
vegetation index (NDVI)
%+0.0432
Table 3. Evaluation results of CLUSR for Songnen Plain, China, from 2005 to 2020.
Evaluation DimensionYearMeanRange of ChangeMean in 2005–2020
RER20050.1177/0.114
20100.1068−0.0109
20150.11040.0036
20200.12180.0114
CLUR20050.0313/0.055
20100.05020.0189
20150.06180.0115
20200.07860.0168
GPSR20050.0627/0.090
20100.08870.0260
20150.10200.0132
20200.10470.0028
ESR20050.1236/0.121
20100.1204−0.0032
20150.12110.0008
20200.1205−0.0006
CLUSR20050.3353 /0.381
20100.3661 0.0308
20150.3953 0.0292
20200.4256 0.0304
Table 4. Standard deviation ellipse parameters of CLUSR in Songnen Plain, China.
YearCenter of Gravity LongitudeCenter of Gravity
Latitude
Long Semi-Axis
(km)
Short Semi-Axis
(km)
Rotation (°)Area
(×103 km2)
2005125.37 45.97 115.47 71.86 13.50 26.07
2010125.40 45.95 115.75 71.82 14.15 26.11
2015125.38 46.01 113.36 72.64 14.66 25.87
2020125.35 46.01 114.24 72.80 14.51 26.13
Table 5. Global Moran′s I and significance for Songnen Plain, China.
YearGlobal Moran′s Ip-ValueZ-Value
20050.4890.0016.0866
20100.5470.0016.8038
20150.4010.0014.9969
20200.3360.0014.2399
Table 6. Obstacle degrees of the main obstacle factors for CLUSR in Songnen Plain, China (2005–2020).
Year2005201020152020
FactorObstacleFactorObstacleFactorObstacleFactorObstacle
obstacle
factors
X1311.721%X1311.055%X1310.368%X211.258%
X1210.456%X29.811%X210.260%X1310.689%
X810.403%X89.735%X69.662%X610.578%
X28.938%X68.815%X109.134%X109.618%
X78.697%X108.753%X88.841%X128.816%
X68.358%X78.119%X117.868%X87.951%
X108.310%X128.002%X77.590%X47.227%
Table 7. Spatial pattern of dominant obstacles to CLUSR in Songnen Plain, China.
Resistance ModesResistance TypeNumber of CountiesRatioCounty Name
single obstacle zoneGrain production stability815.69%Bin County, Keshan County, Kedong County, Lindian County, Mingshui County, Dehui City, the municipal districts of Siping, the municipal districts of Songyuan
Cultivated land use 47.84%Gannan County, Zhaozhou County,
Anda City, Lanxi County
Resource endowment47.84%Lishu County, Shuangliao City,
Fuyu City, Changling County
Ecological sustainability59.80%the municipal districts of Daqing, Dumeng Autonomous County, Qingan County, Qianguo Autonomous County, Daan City
dual obstacle zoneCultivated land use, resource endowment11.96%Longjiang County
Grain production stability, ecological sustainability11.96%The municipal districts of Changchun
Cultivated land use, ecological sustainability11.96%Zhaoyuan County
Resource endowment, ecological sustainability23.92%The municipal districts of Harbin, Tongyu County
multiple obstacle zoneGrain production stability,
cultivated land use, resource endowment, ecological sustainability
2549.02%Bayan County, Wuchang City, Mulan County, the municipal districts of Qiqihar, Baiquan County, Nehe City, Yian County, Fuyu County, Tailai County, Beian City, Wudalianchi City, the municipal districts of Suihua, Hailun City, Qinggang County, Wangkui County, Zhaodong City, Suiling County, Gongzhuling City, Nongan County, Yushu City, Yitong Autonomous County, Qianan County, the municipal districts of Baicheng, Taonan County, Zhenlai County
Disclaimer/Publisher’s Note: The statements, opinions and data contained in all publications are solely those of the individual author(s) and contributor(s) and not of MDPI and/or the editor(s). MDPI and/or the editor(s) disclaim responsibility for any injury to people or property resulting from any ideas, methods, instructions or products referred to in the content.