Article

Understanding Flash Droughts in Greece: Implications for Sustainable Water and Agricultural Management

by
Evangelos Leivadiotis
1,*,
Evangelia Farsirotou
1,
Ourania Tzoraki
2,
Silvia Kohnová
3 and
Aris Psilovikos
1,*
1
Laboratory of Ecohydraulics and Inland Water Management, Department of Ichthyology and Aquatic Environment, University of Thessaly, Fytokou Street, 38446 New Ionia, Greece
2
Coastal Morphodynamics, Coastal Management and Marine Geology Laboratory, Department of Marine Sciences (DMR), Aegean University, 81100 Mitilini, Greece
3
Department of Land and Water Resources Management, Faculty of Civil Engineering, Slovak University of Technology in Bratislava, Radlinskeho 11, 81005 Bratislava, Slovakia
*
Authors to whom correspondence should be addressed.
Land 2025, 14(11), 2290; https://doi.org/10.3390/land14112290
Submission received: 10 September 2025 / Revised: 13 November 2025 / Accepted: 17 November 2025 / Published: 20 November 2025

Abstract

Flash droughts—characterized by their sudden development, severity, and short duration—impose considerable challenges on the soil–water complex of agricultural systems, especially under the Mediterranean climate. Though gaining increasing global significance, Mediterranean flash droughts are still understudied. This study examines the spatiotemporal variability of flash droughts in Greece for the period 1990–2024 using 5-day (pentad) ERA5-Land root-zone soil moisture (0–100 cm) at 0.25° resolution. A percentile-threshold approach detected flash drought events, and their main features—including frequency, duration, magnitude, intensity, decline rate, recovery rate, and recovery duration—were evaluated at the annual and seasonal levels. Findings indicate that Central Greece and Thessaly face the highest frequency and longevity of flash droughts, while Western Greece and Peloponnese and Western Macedonia are characterized by rapid development but intense recovery. An innovative empirical classification framework founded on decline and recovery rates indicated that Mild Fast Recovery events prevail in northern and central Greece, while Intense but Recovering events dominate in western and southern Greece. These results offer new perspectives on how flash droughts impact soil–water availability and agricultural resilience, providing a data-driven platform to aid sustainable water management, early warning systems, and adaptation strategies for Mediterranean agriculture in conditions of climate variability.

1. Introduction

In a world that experiences a climate crisis, among natural hazards, drought is often characterized as the phenomenon with the most significant threat [1,2,3]. Drought implies a sustained deficiency in water supply that persists for months or years. Its naturally occurring aspect impacts nearly every part of the globe, resulting in substantial damage to agriculture, ecology, and the social economy [4].
Traditional drought is commonly referred to as “creeping drought” because of its prolonged duration and slow onset development. However, the recent literature showed that under extreme atmospheric anomalies, droughts can develop rapidly. Svoboda et al. [5] used the term “flash drought” (FD) to refer to this type of drought by making an analogy with “flash flooding”. Unlike conventional drought, flash drought is a severe type of drought occurrence characterized by short duration, high intensity and rapid intensification [6,7,8,9,10,11,12,13,14]. Flash droughts are subsequently caused by intense evapotranspiration and rapid decline in soil moisture (SM), which can be driven by high temperatures and lack of rainfall over a short amount of time [12,14,15,16,17,18].
Although definitions diverge, two principal characteristics are commonly accepted: (1) a rapid decrease in soil moisture (SM) or increase in evaporative demand, usually occurring over a period of weeks [16,19] and (2) short-term severity, which is frequently measured by evaporative stress indices [13] or SM percentile drops (e.g., 40th to 20th percentile within 20–30 days) [8]. The word “flash” underscores the impacts on agriculture, water resources, and ecosystems by reflecting the rapid development and the short time for adaptive responses [5,20]. In order to enhance early warning systems and impact assessments, additional standardization is required, as there are still gaps in the establishment of thresholds for duration, recovery, and compound drivers [21,22].
Initial studies of flash drought concentrated on the meteorological and hydrological factors that contribute to its emergence. Flash droughts have been analyzed with a variety of indices quantifying sudden changes in moisture stress, evapotranspiration (ET), and soil moisture (SM). The initial attempts by Hunt et al. [23] constructed an SM-based index for tracking water stress in the topsoil, whereas Mo and Lettenmair [24,25] classified flash droughts into two types: those associated with heat waves and those associated with precipitation deficits, employing metrics of precipitation (P), temperature (T), ET, and SM. Satellite-derived indices, such as the Evaporative Stress Index (ESI) and Rapid Change Index (RCI) [20], enhanced the detection of rapid drought onset, later refined by the Standardized Evaporative Stress Ratio (SERS) [16]. Operation tools like QuickDRI (U.S Geological Survey/NDMC) integrate P, SM, ET, and vegetation health to provide near-real-time flash drought alerts. They typically depend on thresholds of rapid intensification-generally declines in SM percentiles (e.g., 40th to 20th percentile over weeks) [8] or maxima in evaporative demand [13], even though none define intensity in clear terms [16,21]. Meteorological drivers (e.g., high T, low P and high ET) are well reported [11], but their sub-seasonal interactions are less understood, which makes water management in transition to agricultural droughts difficult. Although U.S.-based frameworks, water balance models and ET-SM hybrids [22] have grown, standardization of intensification rates, duration and effects remains an obstacle, as highlighted in seminal reviews [11]. Additionally, the recovery phase is an essential component of flash drought, as it is a crucial indicator to measure ecosystem resilience and evaluate flash drought impacts [26,27,28]. The precise identification of recovery stages allows water management authorities to assess potential risks and strategically adjust water allocation prior to complete recovery. Although the recovery process is important in explaining flash drought impacts, it remains underexplored in current studies. Early concepts of flash droughts heavily focused on rapid development or multi-variable thresholds, often at the expense of the recovery component. Some recent research, such as that by Yuan et al. [19] and Zhang et al. [29], has begun incorporating the recovery process, primarily through an emphasis on soil moisture dynamics. Definitions differ, particularly concerning the initiation of recovery, which may be coincident with the lowest point of soil moisture or a deceleration of decline. The majority of the flash drought studies concur that recovery ends when the flash drought ends [16,24,27]. Recovery from a flash drought is more sudden than from other droughts and is typically defined on the basis of soil moisture metrics rather than ecological or hydrological metrics. Considering these gaps, emphasizing soil moisture trends gives a practical and uniform basis for defining and examining flash drought recovery.
Flash droughts are an emerging global hydroclimatic hazard, characterized by the rapid loss of soil moisture and significant impacts for agriculture and ecosystem functions. Recent studies point to the increasing occurrence and severity of flash droughts worldwide due to rising temperatures and shifted precipitation patterns [30]. The majority of recent studies focused on the continental United States, where the criteria of FD originated. In the United States, for instance, flash droughts account for almost 40% of all observed drought occurrences, with significant seasonal maxima—May to June for the western United States, July to August for the east—and up to 47% occurring under apparently favorable initial conditions, highlighting the rapid onset and unexpected occurrence [11,16]. Similarly, the occurrence is higher for China at the beginning phase (15–19%) and end phase (18%) for the seasonal drought occurrence, indicating the highly dynamic transition between wetting and drying phases [31]. Regional analysis for major riverine basins, for example, the Pearl River Basin, reveals that the duration (D) and severity (I) of the occurrence of flash droughts greatly vary with space, with the occurrence being briefer, however, more severe for the eastern and southern sub-basins [32]. Australian case studies demonstrate that precipitation variability dominates flash-drought variability, though indicators of evaporative demand (e.g., EDDI) can provide useful early warnings when combined with other indices [33]. In India, basin-scale analysis reports wide variability in onset and recovery durations (mean onset/retrieval ≈ 20–30 days), with severe events concentrated in some basins during monsoon or non-rainy seasons [34]. In northeastern South America, multi-sensor analysis (2004–2022) linked flash droughts to pronounced vegetation losses and proposed objective thresholds combining soil moisture and vegetation response [35]. Pan-European work using clustering of antecedent and onset conditions highlights multiple initiation pathways and an increasing trend of rapid-onset events in recent decades [10]. In Central Europe, flash droughts display strong seasonality, with a notable rise in frequency during the April–June period, primarily linked to anticyclonic circulation and high-temperature anomalies that accelerate soil moisture depletion [36]. In Germany, coupled analyses of heatwaves and soil moisture confirm that flash droughts influenced by heat extremes are shorter in duration but develop more rapidly, highlighting the compounding effect of thermal stress on drought onset [37]. Over the United Kingdom, flash droughts exhibit pronounced spatial and seasonal variability, with significant springtime increases driven mainly by rainfall variability, while atmospheric circulation patterns such as the North Atlantic Oscillation (NAO) exert a dominant control on event occurrence [38]. Across the Iberian Peninsula, flash droughts are most common in northern and northwestern Spain, showing a rising trend—particularly in summer—driven by persistent anticyclonic conditions and ridge-blocking circulation patterns that suppress precipitation [39,40].
Greece is a country with a plethora of vital agroecosystems, and there is a necessity for flash drought studies in order to assess the vulnerable areas. A significant portion of Greece is used for agriculture, which is the backbone of the national economy [41]. Greece exhibited marked drought variability over the past decades, mostly due to deficits in precipitation and increasing temperatures [42,43]. The SPI analysis indicates regular extreme droughts for southern Greece, particularly summer under anticyclonic weather patterns [44,45,46,47]. The high-resolution scenarios (RCP4.5, RCP8.5) suggest drier and more frequent and longer-lasting droughts, with particular prominence for the region of Thessaly, highlighting temperature-initiated aridity and the critical necessity for adaptive water planning [48,49,50,51].
This study investigates flash drought characteristics over Greece according to the high-resolution Land hourly ERA5 soil moisture record (0.25° resolution) for the period 1990–2024. We employ a soil moisture-based approach to identify flash drought events with a focus on the rapid development and near-surface soil moisture deficiency. The research discusses key spatiotemporal characteristics like frequency, duration, magnitude, declining rate, recovery rate, recovery duration and intensity. Also, seasonal fluctuation is examined in order to determine prevailing patterns and temporal trends. Being the first extensive investigation of flash drought events in Greece, this research seeks to improve knowledge of their spatial distribution and temporal variations, and make significant contributions to flash drought studies in Mediterranean basins.

2. Materials and Methods

Study Area

Greece (131,957 km2), a classic Mediterranean country of 10.5 million inhabitants and a 13,676 km coastline, is a fascinating case study for climatic and environmental research. Its diverse topography—ranging from mountainous mainland to peninsulas and over 6000 islands—creates a diverse mosaic of microclimates from alpine to semi-arid. The Hellenic territory has marked seasonal differences, with dry, hot summers and rainy, cold winters that are regionally variable: Northern/Western provinces have higher precipitation continental conditions, whereas Southern areas show classic Mediterranean dryness. Climate conditions in the country could broadly be classified into three main categories: Mediterranean, temperate, and alpine. Mediterranean climate, which dominates the coastal areas, islands, and the southern part of the country, has hot, dry summers—wherein the temperature often goes above 30 °C—and mild, rainy winters with an average temperature between 10 °C and 15 °C. Normally, the wet season comes between November and February. However, northern Greece experiences a temperate climate, which encompasses warm summers that are fresher compared to the southern region, and cold winters with temperatures between −5 °C and 10 °C. Precipitation in this region comes in a more even distribution over the year (~1200 mm), with increased rainfall and frequent snowfall in winter. In high areas, particularly at higher elevations, an alpine climate dominates, characterized by cool, rainy summers and very cold winters with high snowfall.
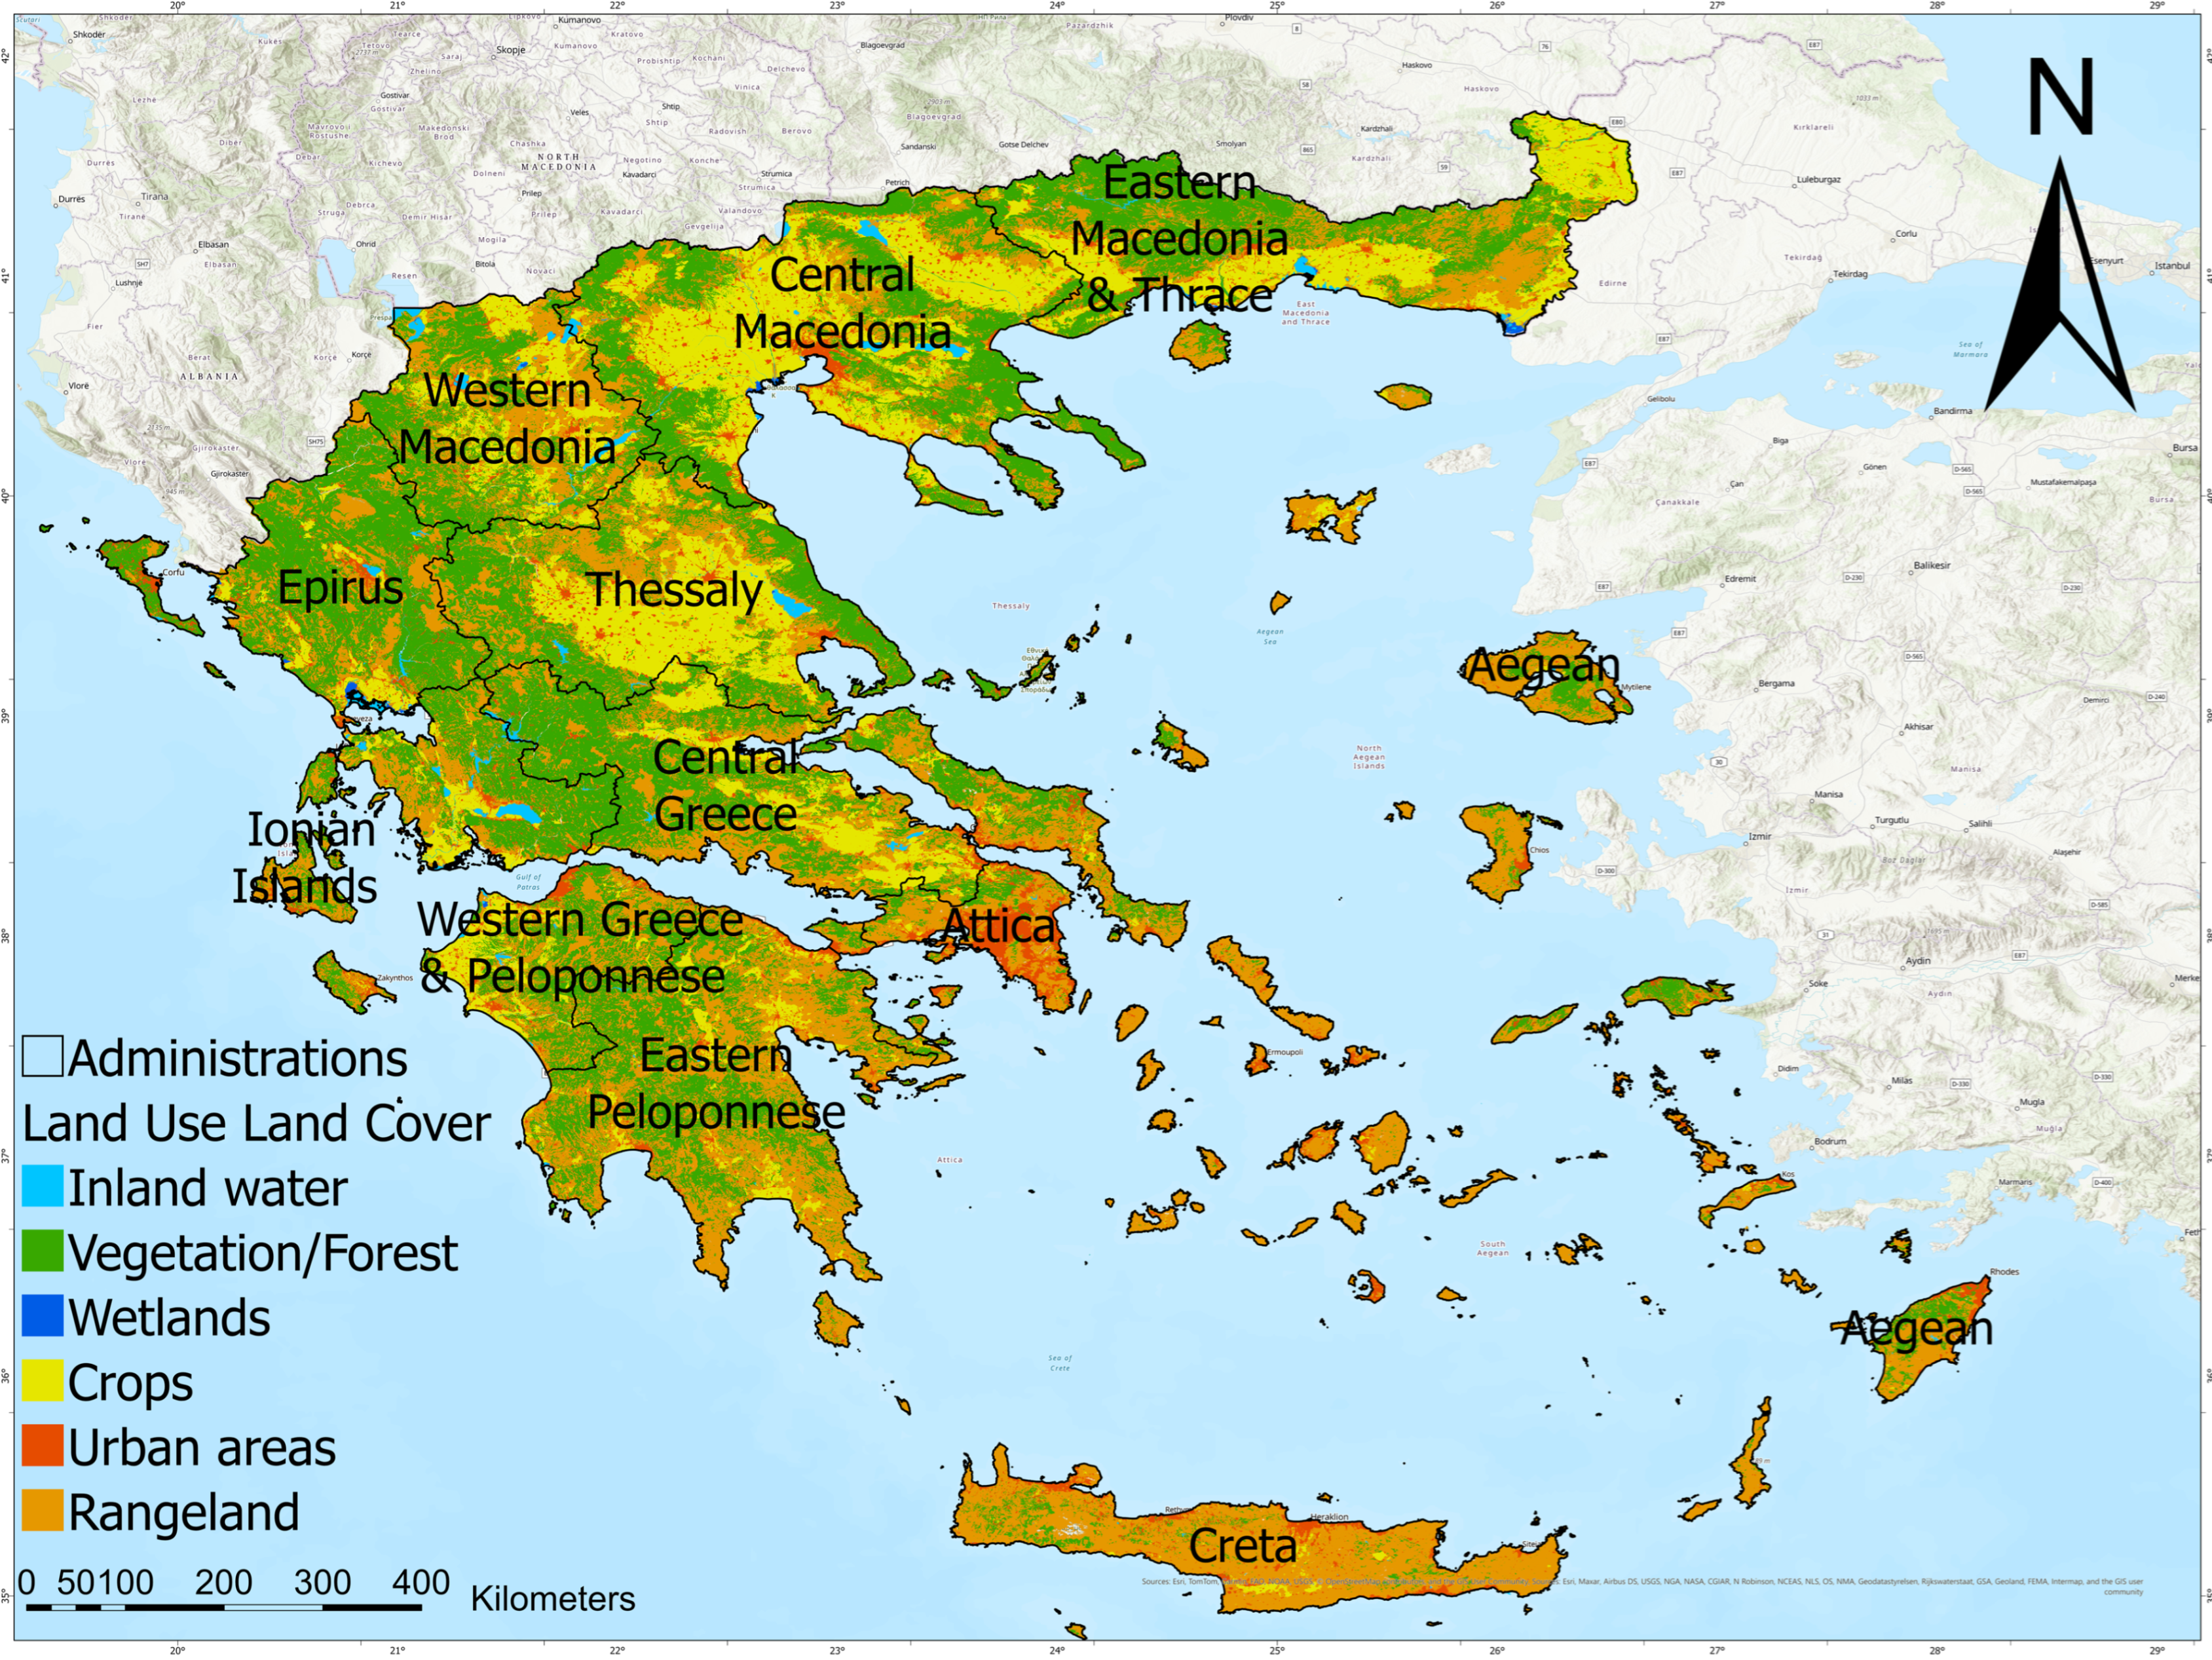
The area’s environmental value is equal to its socioeconomic susceptibility. While tourism drives the economy, agriculture (occupying 20.4% of land cover) remains strongly dependent on effective water management (Figure 1). Although Greece boasts enormous yearly water resources (58 × 109 m3), it merely exploits 12% of its potential due to infrastructural limitations, leading to conflicting groundwater overexploitation and contamination [41]. This imbalance renders precipitation variability acutely sensitive, and drought incidents particularly critical. Additionally, Figure 1 shows the division into administration levels that were used in the regional level analysis.
Throughout the last decades, this weakness has been confirmed by repeated water shortages menacing agricultural production (38,540 km2 of arable land), environmental balance, and economic stability. Our study examines the dynamics of flash droughts across Greece and their impact on agricultural land use, using ERA5 reanalysis data that capture this regional diversity. This synthesis approach accounts for both the physical drivers of rapid-onset droughts and their impacts on a nation where modernized water supplies and climate adaptation strategies are becoming ever more critical to sustainable development.
ERA5 data soil moisture 0–100 cm grid-level 9 km (34 years 1990–2024)
This study utilizes the ERA5-Land reanalysis dataset from the Copernicus Climate Change Service (C3S), a state-of-the-art land surface product providing hourly data at 0.1° (~9 km) spatial resolution available at: https://cds.climate.copernicus.eu [52]. We focus on soil moisture dynamics within the top 100 cm (combining the average of Layer 1: 0–7 cm and Layer 2: 7–28 cm, Layer 3: 28–100 cm) as this near-surface zone is most sensitive to rapid moisture depletion and directly impacts vegetation health during flash drought events [8,11]. The dataset’s high temporal resolution and physically consistent land surface modeling make it particularly suitable for detecting rapid-onset drought conditions across Greece’s diverse microclimates. For the period 1990–2024, volumetric soil moisture (m3·m−3) was converted to daily values and analyzed to characterize flash drought frequency, intensity, and temporal evolution. This approach aligns with established methodologies that prioritize shallow soil layers for flash drought identification, as they respond most rapidly to precipitation deficits and evapotranspiration stresses. The use of ERA5-Land data is further justified by its demonstrated reliability in Mediterranean environments and its widespread application in drought monitoring studies.
Flash drought detection
This study identifies flash drought events through rapid soil moisture depletion using percentile-based thresholds and intensification rates. Following established approaches [8,12], we define flash drought onset when pentad-mean (5-day) root-zone soil moisture (0–100 cm) declines from above the 40th percentile to below the 20th percentile, with an average decline rate ≥5th percentile per pentad. The event must maintain drought conditions (soil moisture <20th percentile) for at least 3 pentads (15 days) to distinguish persistent droughts from transient fluctuations (Figure 2). As shown in the schema in the figure, termination occurs when soil moisture recovers above the 20th percentile. To enhance reliability in Greece’s Mediterranean climate, we incorporate an absolute soil moisture change criterion (>0.01 m3·m−3) alongside percentile thresholds, preventing misclassification in naturally arid conditions [53]. This dual-threshold approach captures both the rapid intensification (characterizing the “flash” aspect) and sustained moisture deficit (fulfilling “drought” criteria) essential for operational definitions [11]. The 40th–20th percentile range (equivalent to ~5th percentile/week decline) aligns with vegetation stress thresholds while accommodating regional hydroclimatic variability. Research also focuses on recovery duration as the time to return to normal condition, and recovery rate as the metric that measures how quickly the soil moisture rebounds after reaching the minimum level.
Consequently, our study focuses on the metrics given below to characterize the flash drought events:
  • Frequency (F): The occurrence rate of flash droughts per grid cell, calculated as the total number of events detected during the study period (1990–2024).
  • Magnitude (M): The cumulative soil moisture deficit for each event, computed as the sum of negative soil moisture anomalies (relative to the 1990–2024 climatology) from onset to termination.
  • Duration (D): The temporal span (in days) between drought initiation (soil moisture dropping below the 40th percentile) and termination (recovery above the 20th percentile).
  • Intensity (I): The mean severity per unit time, derived as the ratio of magnitude to duration (I = M/D) for each grid cell.
  • Decline Rate (DR): The maximum rate of soil moisture depletion during the intensification phase, quantified as the 5-day moving average of percentile decrease (≥5th percentile/pentad).
  • Recovery Duration (RD): The number of pentads from the point of minimum soil moisture to the point when the soil moisture exceeded the 20th percentile threshold for at least five (5) consecutive pentads.
  • Recovery Rate (RR): The rate of increase in soil moisture from the minimum value at the confirmed recovery point, divided by the recovery duration.
These spatially explicit metrics collectively capture the occurrence patterns, hydrological severity, and temporal dynamics of flash drought events across Greece’s diverse climatic regions. Additionally, even if frequency, magnitude, duration and intensity are used in traditional drought studies, this is the first time where decline rate, recovery duration and recovery rate metrics are applied to Mediterranean climates.

3. Results

3.1. Spatial Characteristics of Flash Droughts

3.1.1. Frequency

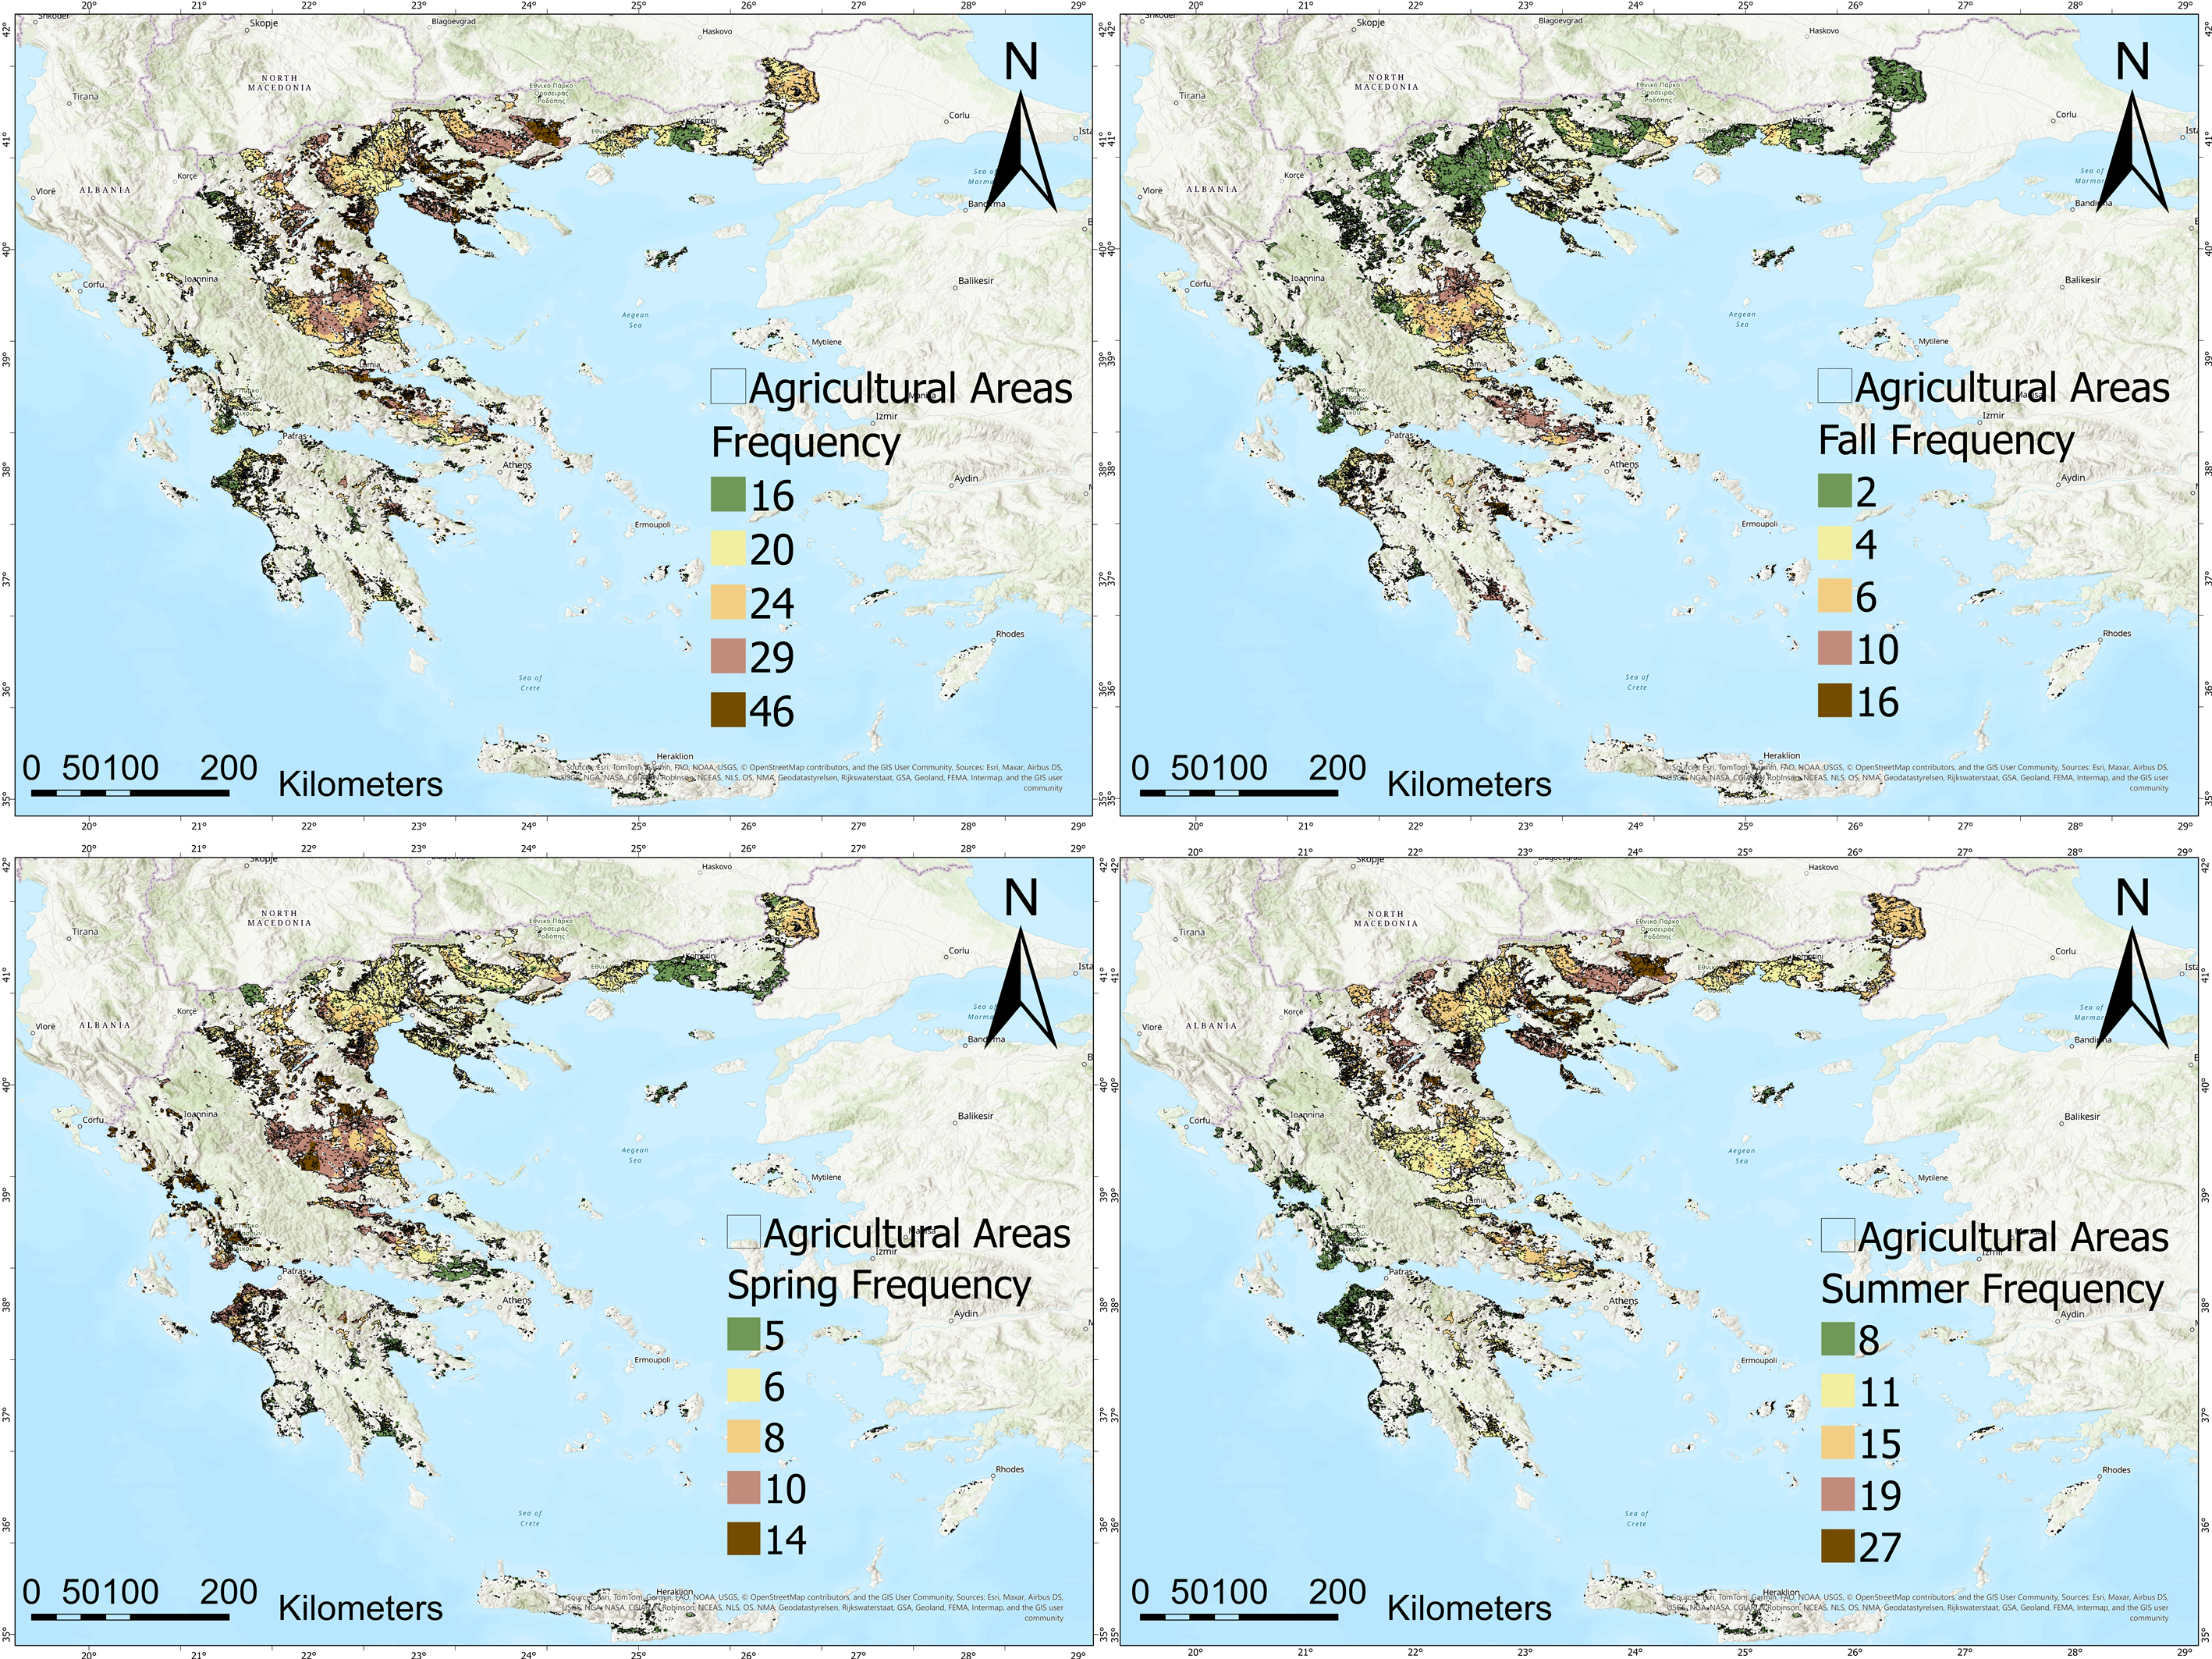
The spatial distribution of flash drought frequency over the 34-year period (Figure 3) highlights a clear concentration of high-frequency events in northern and central Greece, particularly across agricultural zones in Central Macedonia, Thessaly, and Central Greece, reaching an occurrence of events between 20 and 46. These regions consistently exhibit the highest vulnerability to flash droughts. Seasonally, the summer map reveals widespread flash drought occurrence, especially in Thessaly, Central and Western Macedonia, Thrace, and parts of Central Greece, ranging from 11 to 27, reflecting heightened evapotranspiration and reduced precipitation during this period. In general, the lowest values in the summer season are noticed in the western parts of the country (8). In spring, flash drought frequency is notably higher and more localized, with elevated values mainly in Thessaly (10 to 14), Western Greece and Peloponnese and Epirus (10 to 14), likely due to transitional climate dynamics and delayed rainfall. Fall presents a distinct spatial pattern, with increased frequency in Thessaly and Central Western Greece (10 to 16), indicating potential impacts from post-summer soil moisture deficits and erratic fall rainfall.

3.1.2. Duration

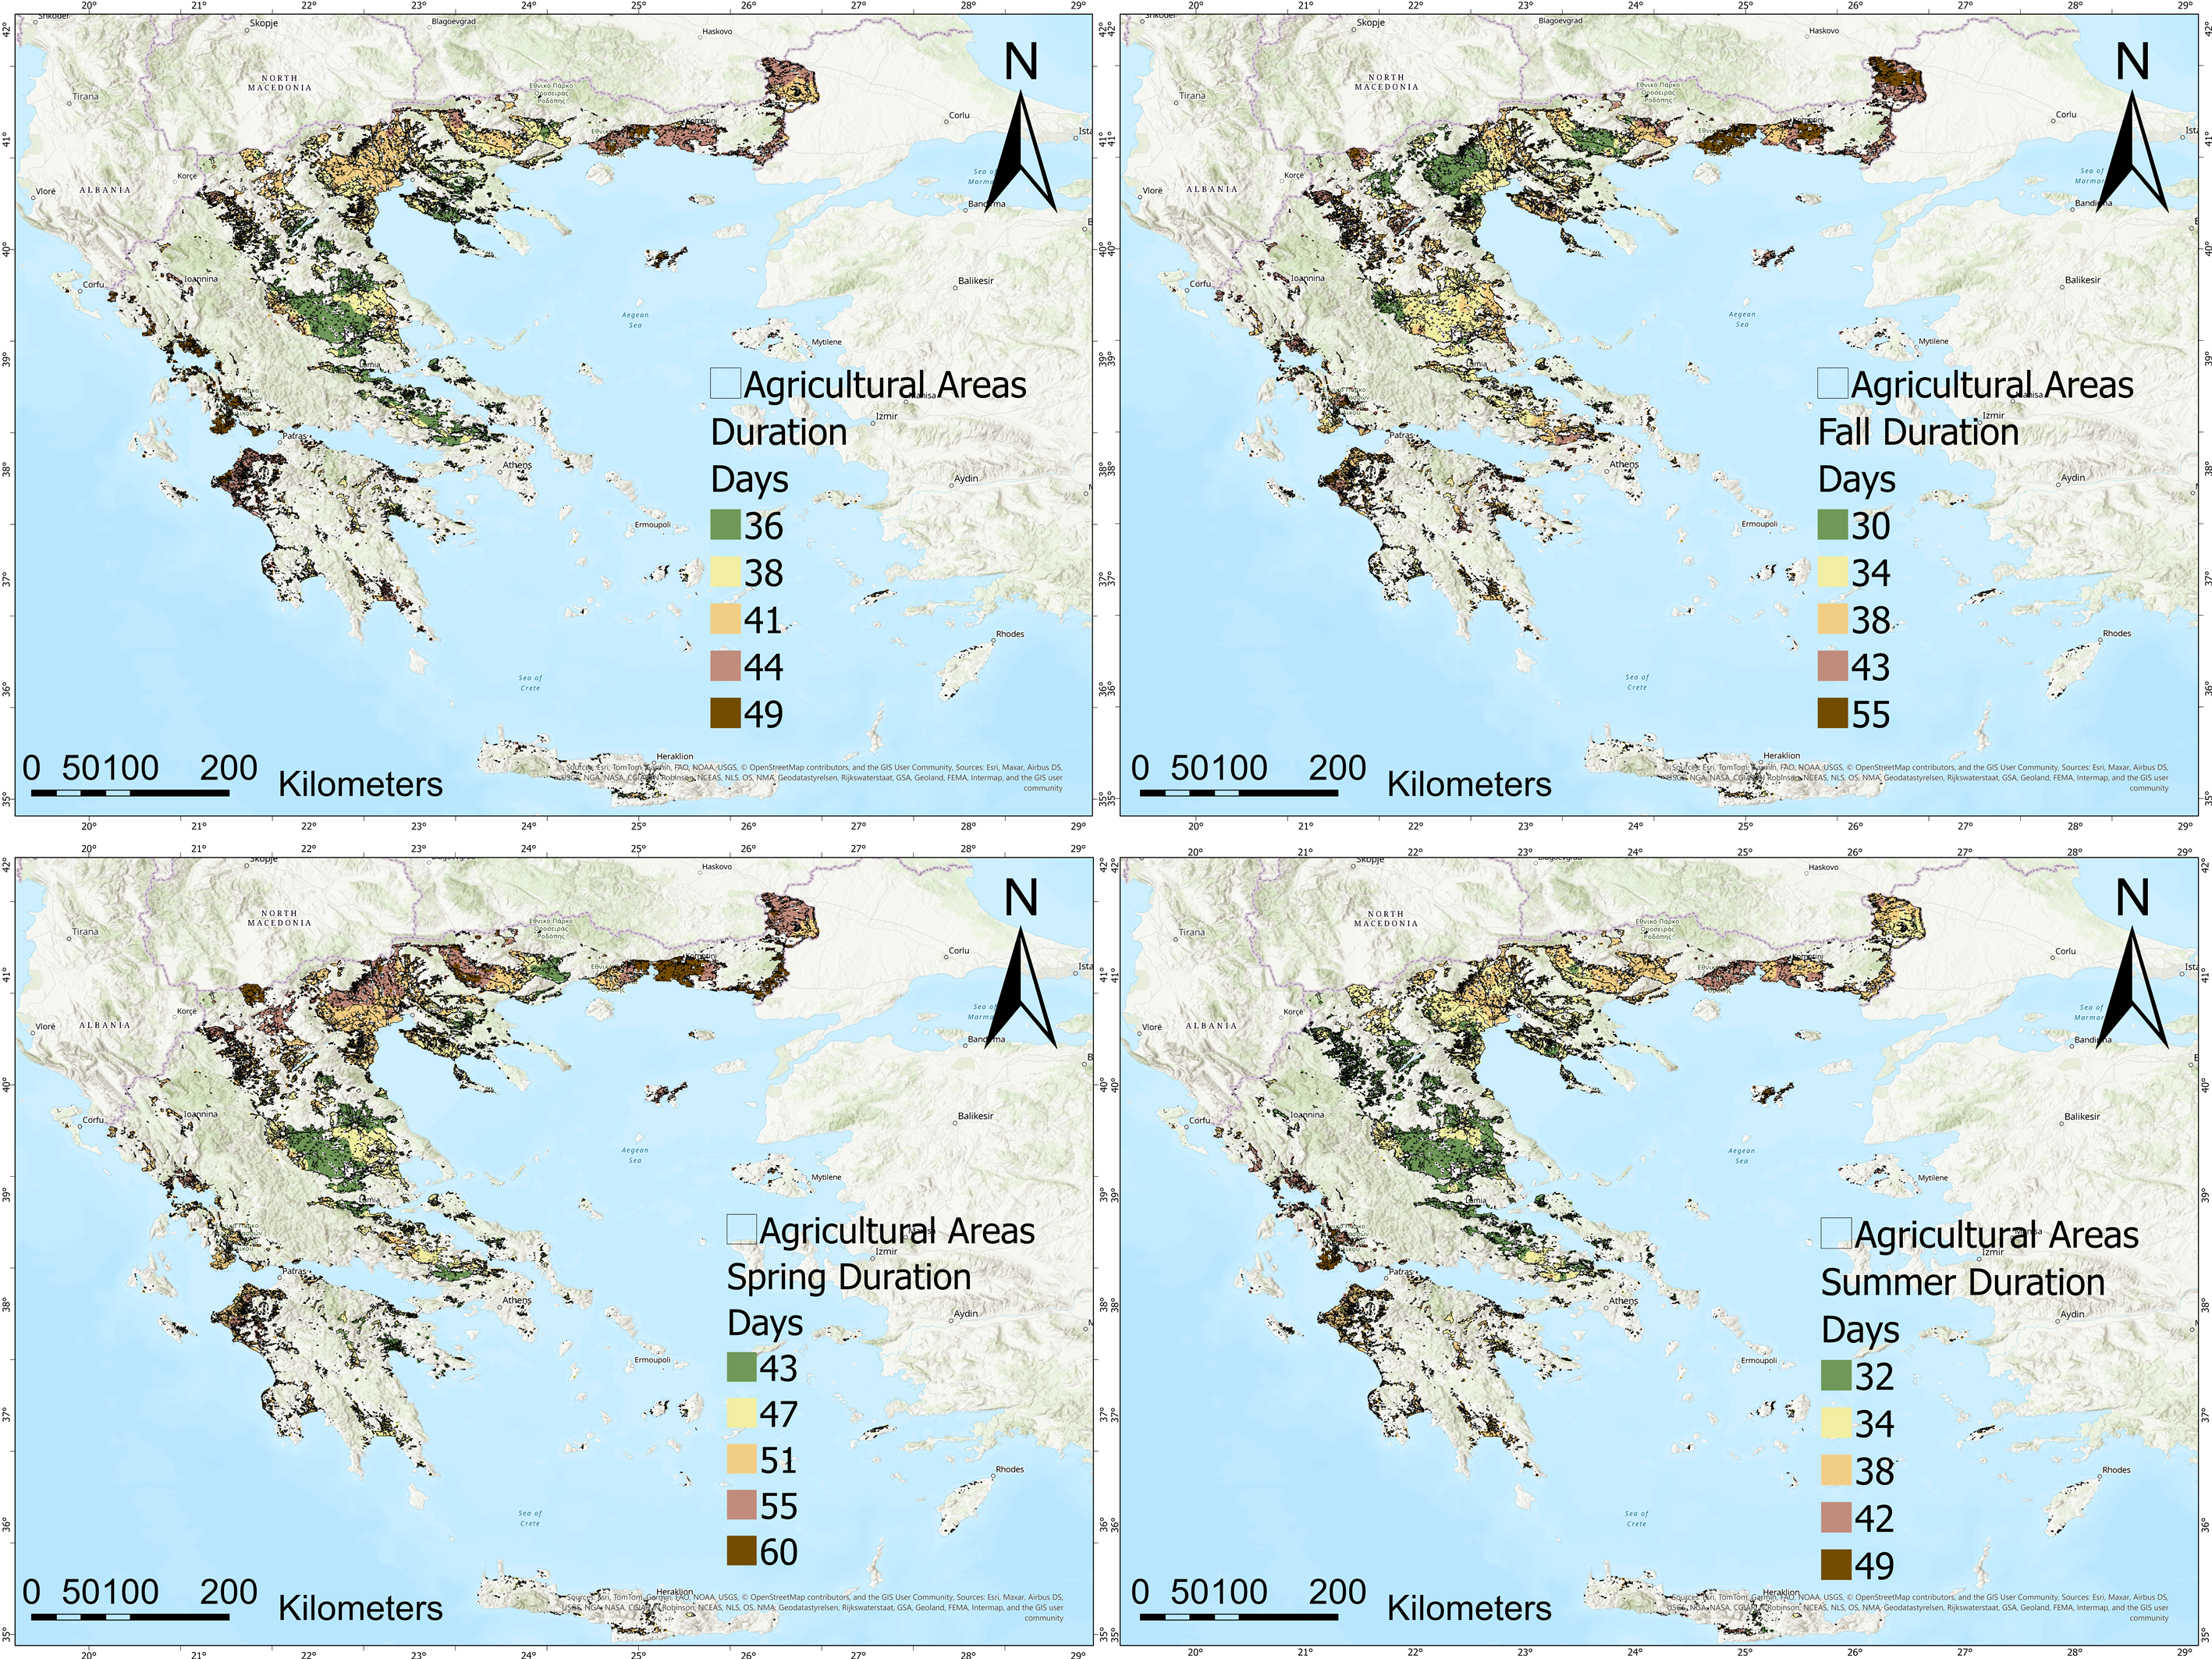
The spatial analysis of flash drought duration over the 34-year period indicates that long flash drought events are mainly concentrated in northern and central Greece, with very high values being recorded in the regions of Central Macedonia, Eastern Macedonia and Thrace and parts of Western Greece and Peloponnese (Figure 4). These areas tend to experience values exceeding 41 days, reflecting the persistence of dry conditions for a very long duration. Seasonally, the summer map shows the least widespread and short flash drought durations; however, many agricultural areas—particularly in Western Greece and Peloponnese and parts of Eastern Macedonia and Thrace—have durations as long as 49 days, reflecting severe and persistent moisture deficits at the time of maximum evapotranspiration demands. Spring presents the highest durations (55 to 60 days) in northern and western areas, particularly in Western Greece and Peloponnese and Central Macedonia, as well as Eastern Macedonia and Thrace, implying early-season moisture stress that can affect crop establishment. Conversely, fall presents scarce distribution of areas with high durations like Western Greece and Peloponnese, Eastern Macedonia and Thrace, and even some parts of Central Macedonia with values fluctuating from 43 to 55 days. In contrast, shorter durations are found in most regions, which can be associated with irrigation practices. Figure 4 shows that the shortest durations occur in the fall in parts of Central Macedonia (32 days). The spatial patterns recorded indicate that the agricultural areas under continental and northern climates are more susceptible to suffering not just repeated but also extended flash drought events and therefore present significant water availability, crop reliability, and farm management challenges in these susceptible regions.

3.1.3. Magnitude

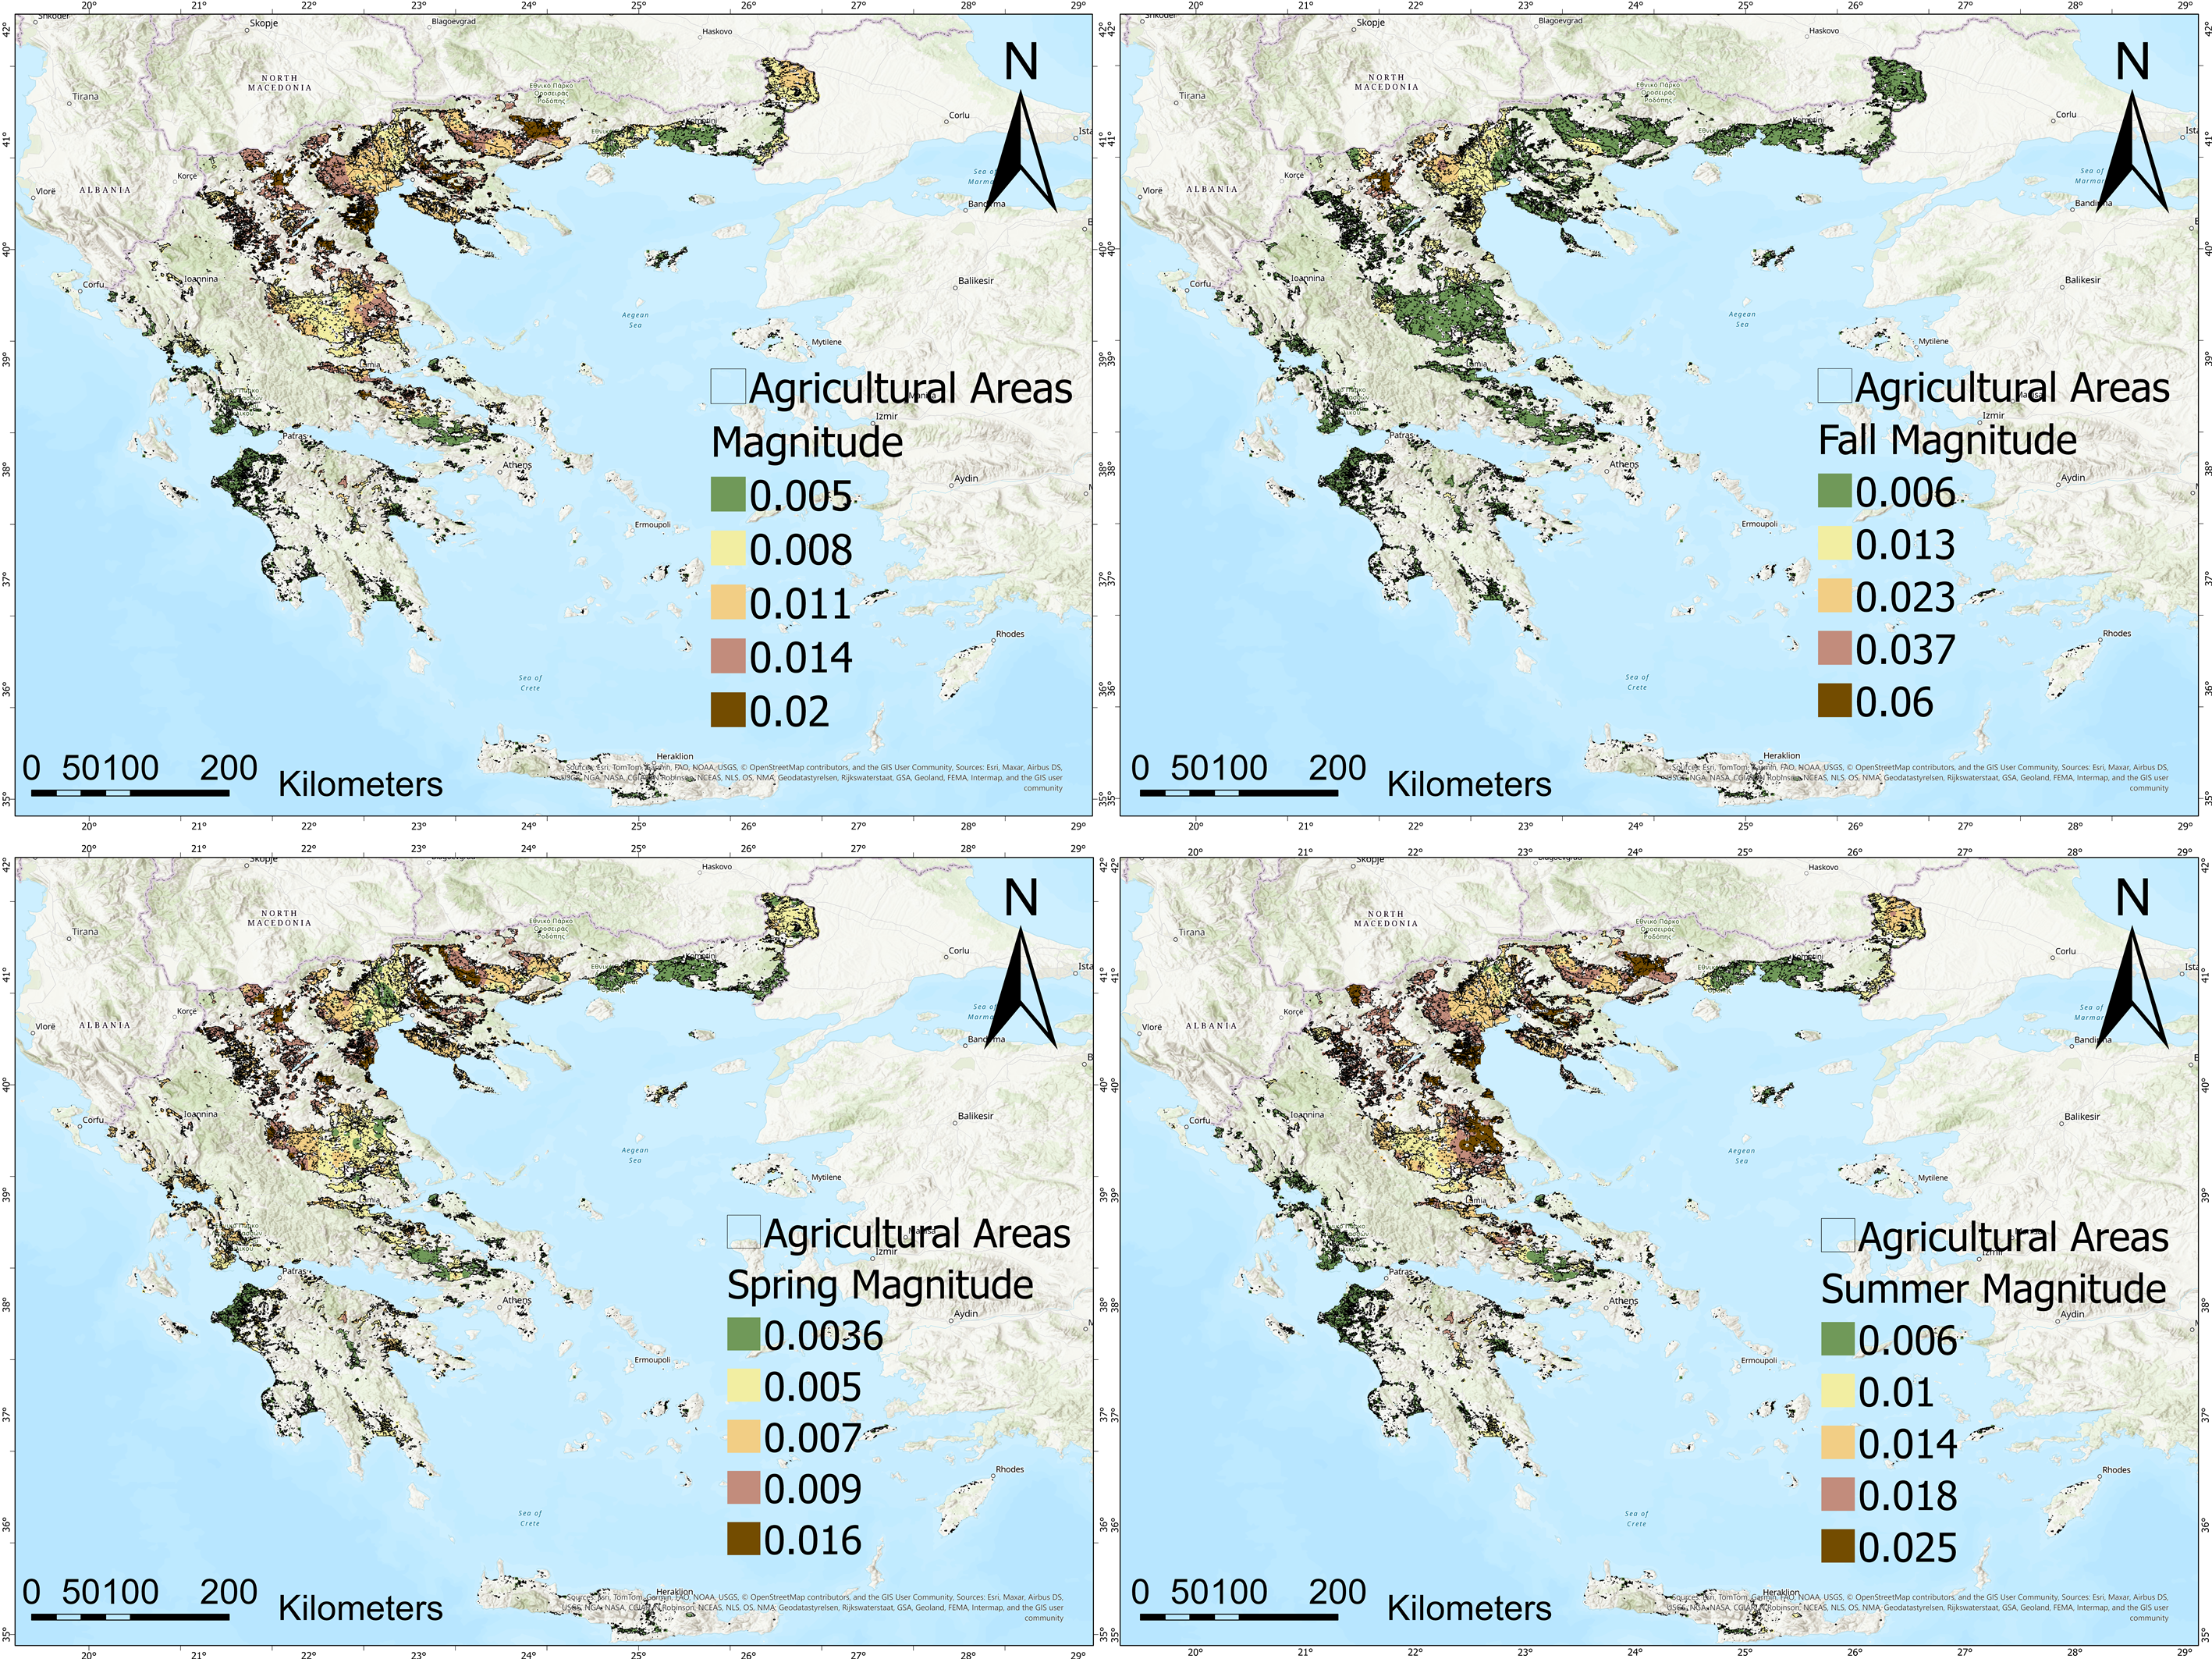
As reported above, magnitude is a metric that presents the severity of a drought event. Figure 5 presents the spatial distributions of magnitude for the whole study period and at the seasonal level. In general, higher values (0.02) tend to concentrate in northern Greece, while Thessaly recorded moderate values (0.014). Moving towards the southern parts of Greece, as well as the islands magnitude values are the lowest (0.005). A similar pattern is prevailing in the summer season, where the highest values are recorded in agricultural areas of Central and Western Macedonia, as well as Thessaly, reaching up to 0.025. Moderate and low values are also noticed in western and northern parts of Greece, with the magnitude being the lowest (0.006) than the year average. The spring season presents smoother values the highest ones concentrated around Central Macedonia (0.016). Thessaly, Eastern Macedonia and Thrace and Central and Western Greece and Peloponnese present low to moderate values between 0.0036 and 0.07. Fall is the season with the lowest magnitude values in most parts of Greece (0.006), while the ones with the highest ones like some parts of Central Macedonia do not exhibit values of 0.006. This can be interpreted by the fact of seasonal transition from summer to fall, with rainfall patterns prevailing in most parts of the country.

3.1.4. Intensity

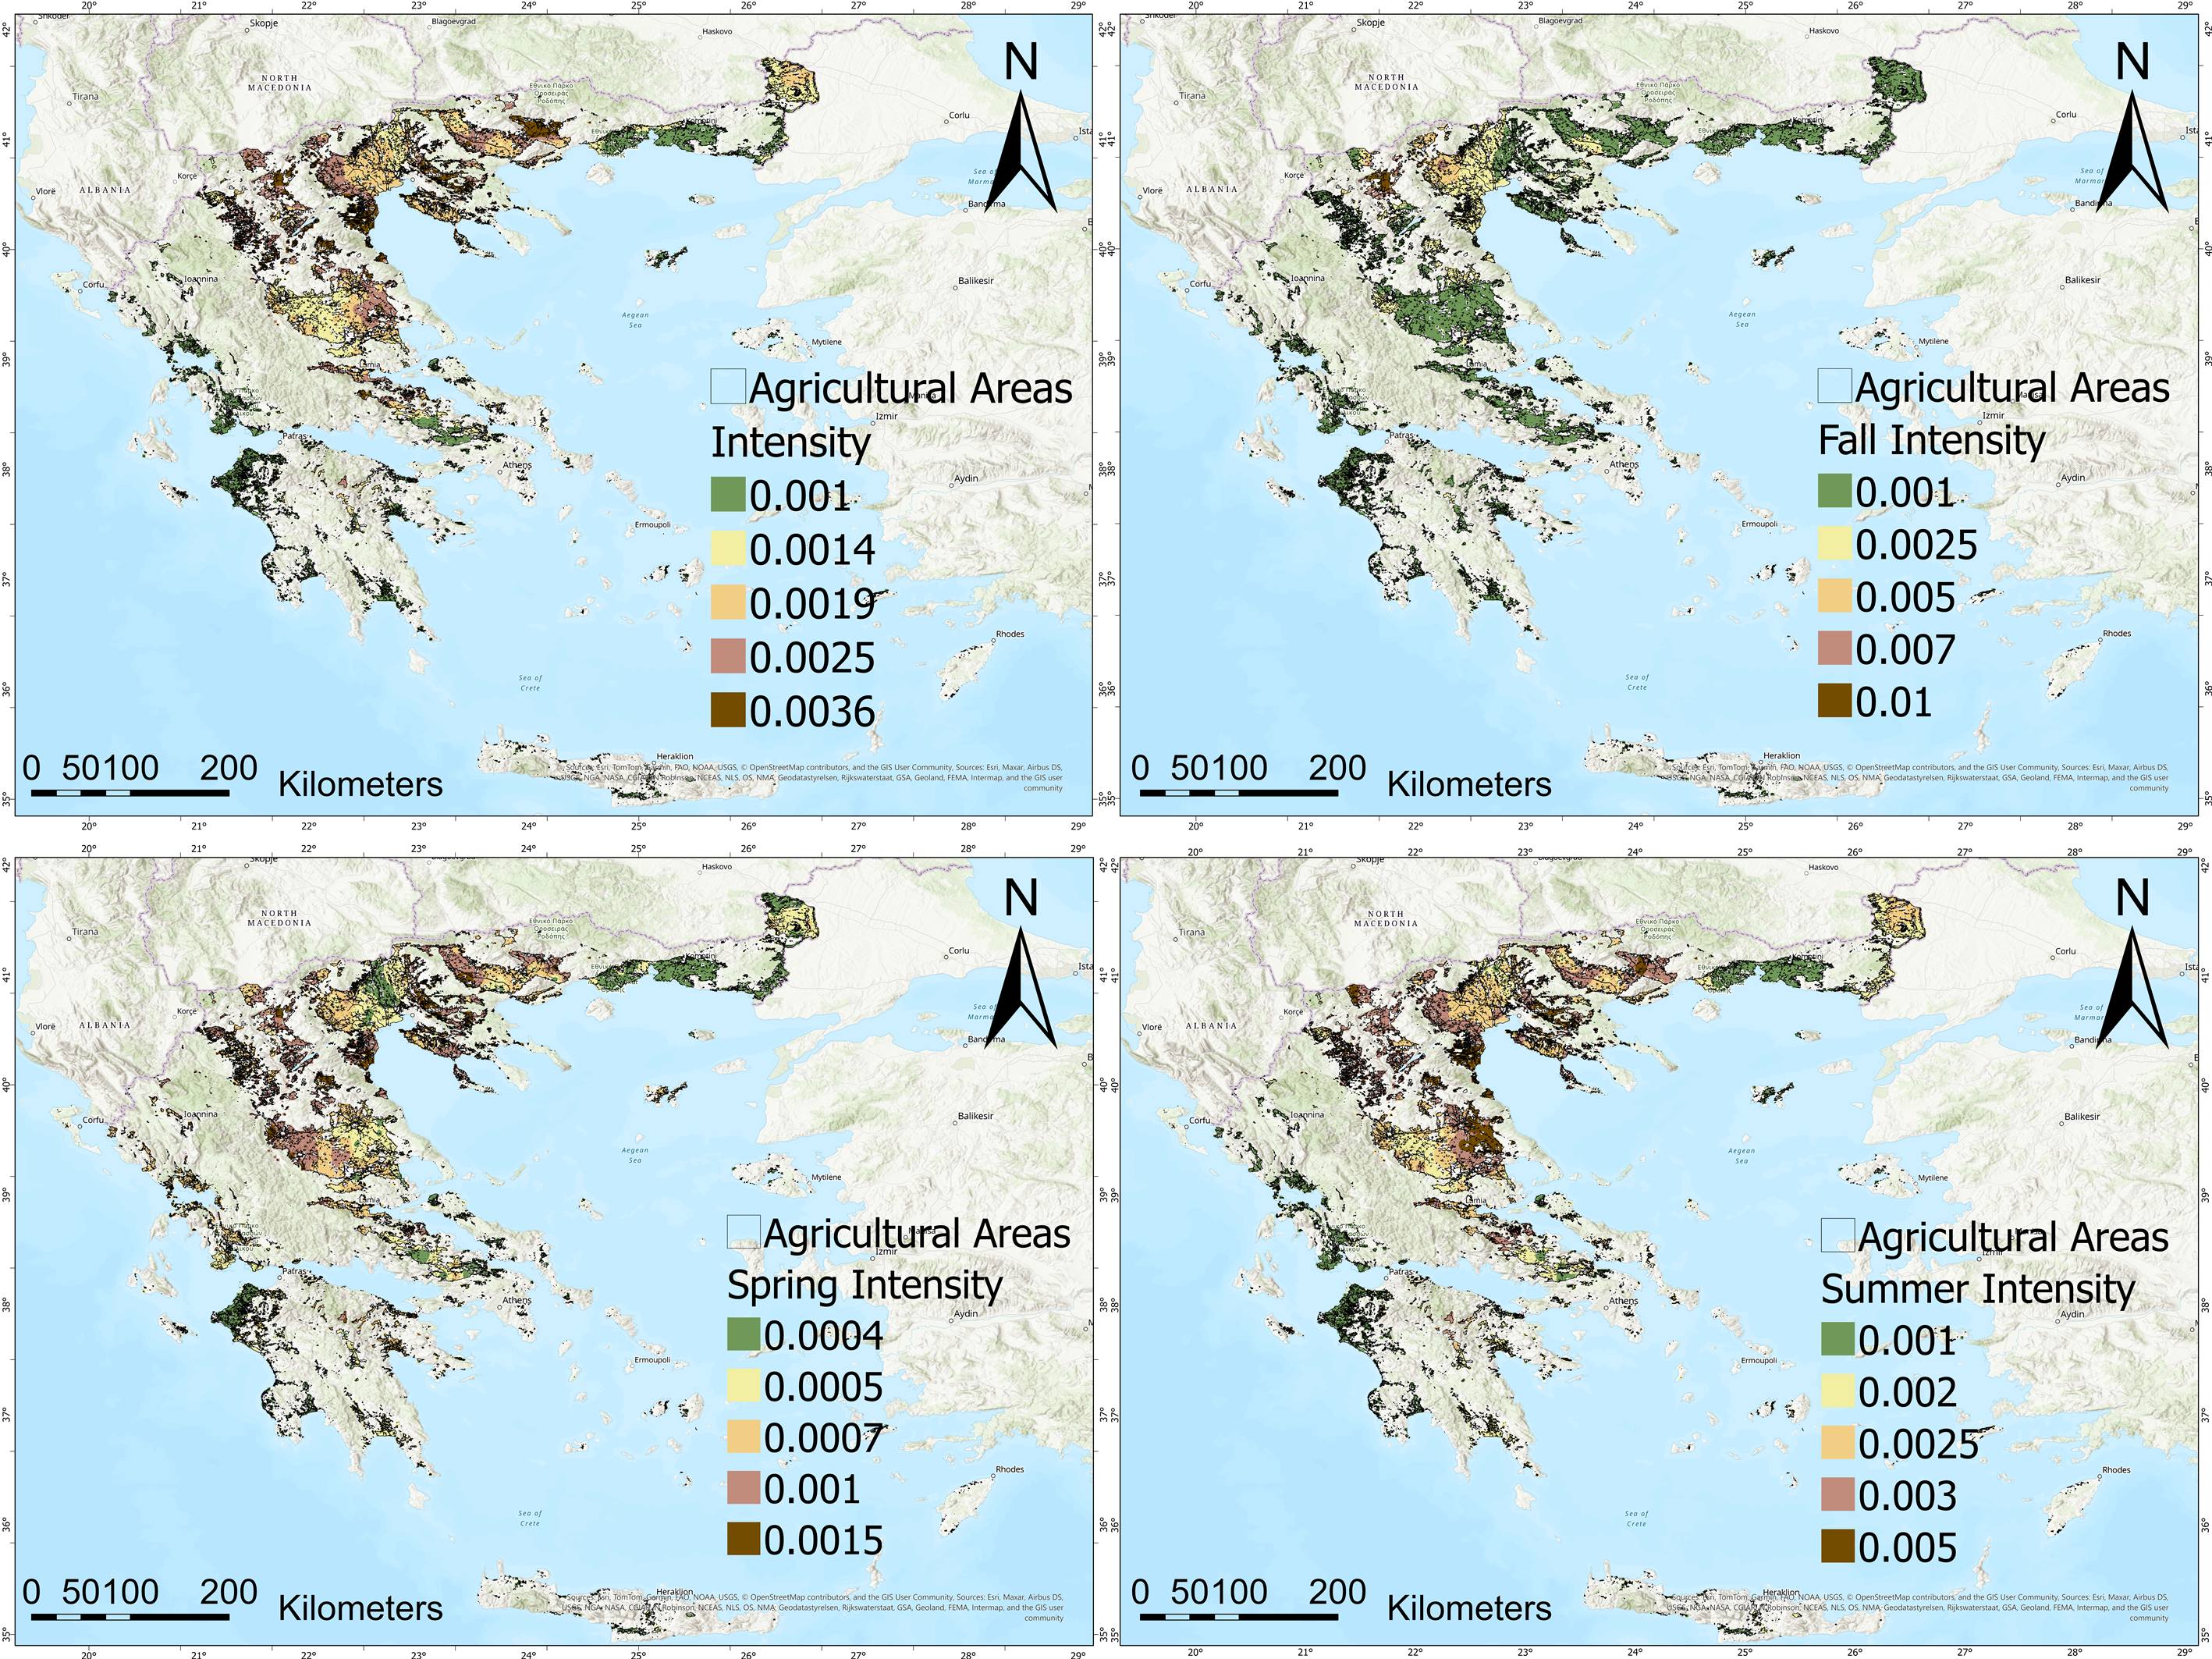
As already defined, intensity is a metric that quantifies the rate of initialization and duration of a drought and measures how severe a flash drought is over its path. Figure 6 presents the geographical distribution of intensity over the whole study period and on a seasonal timescale. In general, higher intensity values (up to 0.0036) are typical primarily in Thessaly, Western and Central Macedonia, characterizing the swift onset and strong development of droughts in these areas. Thessaly and Central Macedonia exhibit moderate intensity values of around 0.0025, consistent with their intermediate nature of drought. The southern parts of Greece and most of the islands, as well as some parts of Thrace, on the other hand, exhibit the lowest intensity values of around 0.001, indicating weaker or more slowly developing flash drought events. This spatial pattern is very well maintained during the summer months, in which again peak intensity values are registered in the agricultural regions of Western and Central Macedonia, as well as the majority of Thessaly, reaching a maximum of 0.005, which is higher than the yearly average. The spring season presents lower values, which are scarcely distributed (Figure 6). For instance, the lowest values (0.0004) are distributed in Western Greece and Peloponnese, parts of Central Greece and Eastern Macedonia and Thrace, while the highest ones (0.0015) are in parts of Thessaly and Central Macedonia. In fall, the trend is different compared to other seasons and the yearly average. The majority of the country presents an even distribution of intensity values of 0.001, still higher than the spring and season maximum values. Additionally, its highest records (0.01) are found in some parts of Central Macedonia. These point to a persistent vulnerability of the whole country’s agricultural areas to not only persistent but also intensively evolving flash droughts in the fall season.

3.1.5. Decline Rate

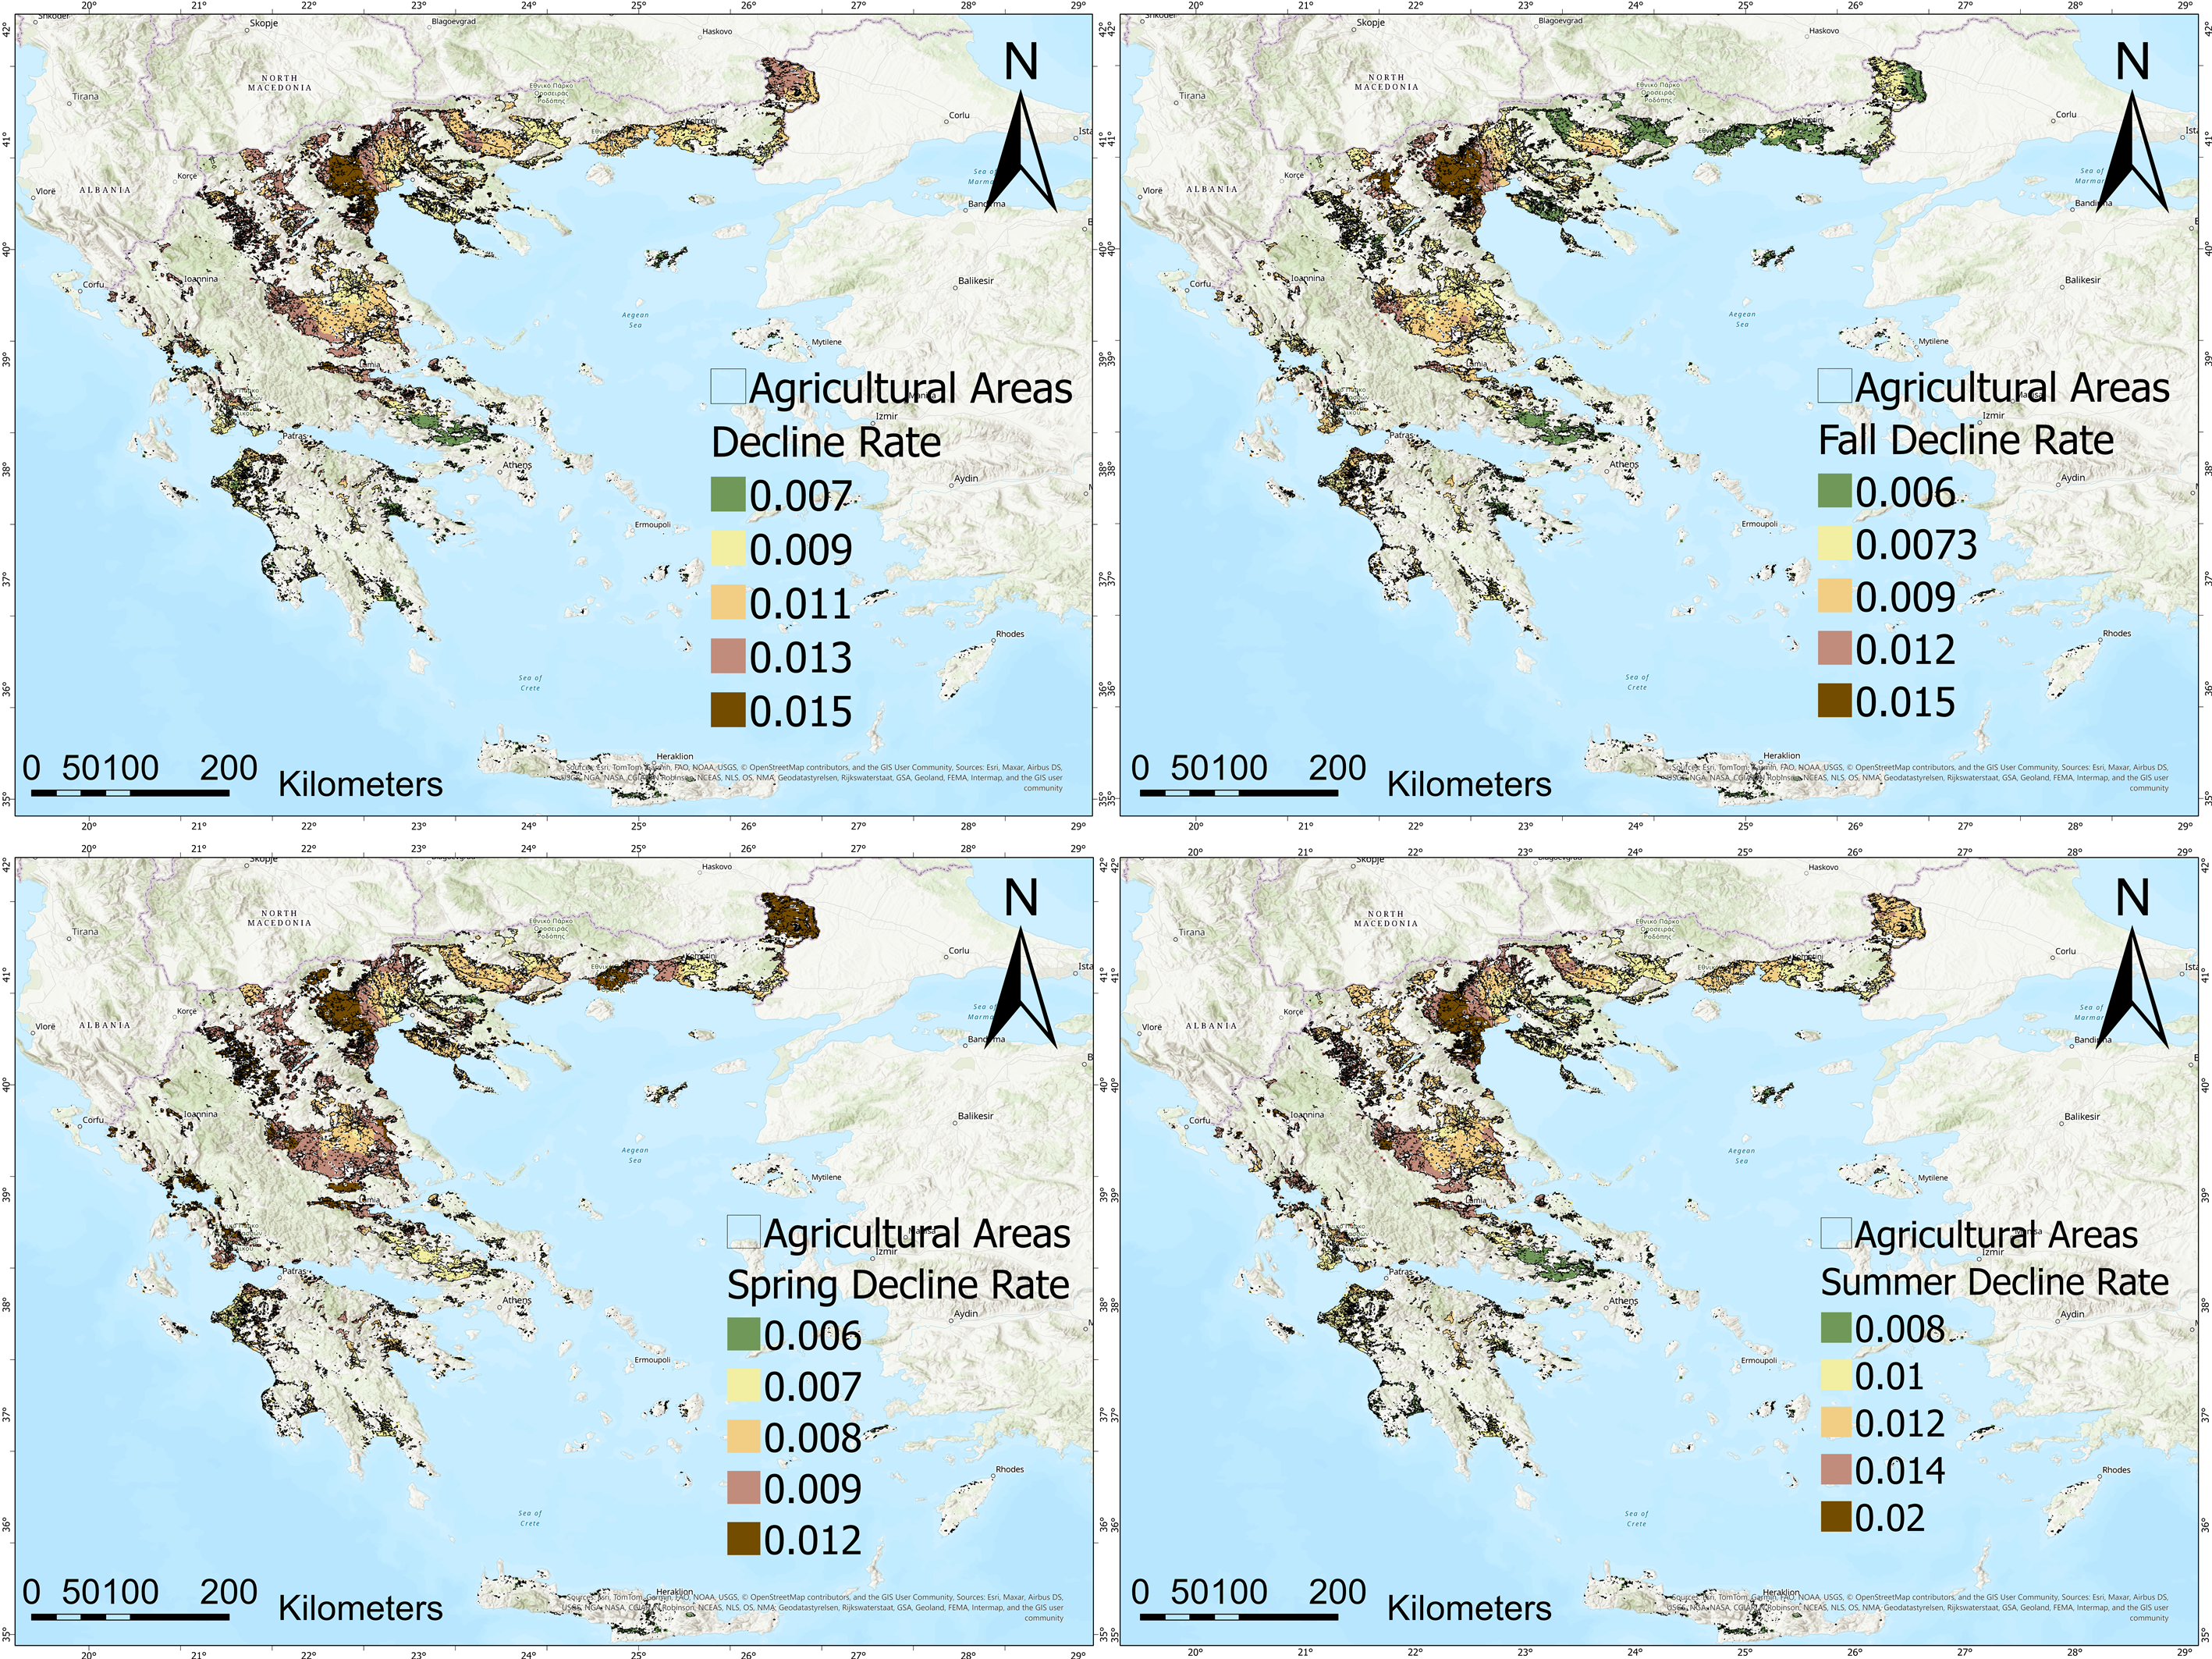
The spatiotemporal distribution of the decline rate is presented in Figure 7. Results reveal that across a 34-year study period, the highest values (0.015) are recorded in Western and Central Macedonia and the majority of the Thessaly region (0.011–0.015). Eastern Macedonia and Thrace present moderate values, while Central Greece has the lowest ones (0.007). In the summer period, the spatial patterns remain the same with more enhanced decline rate values in Central Macedonia reaching up to 0.02. Furthermore, spring shows a similar geographical distribution with the highest decline rates (0.012) being recorded in Western and Central Macedonia, Thessaly region, and some parts of Epirus and Eastern Macedonia and Thrace, while the rest of the country records moderate values (0.008). Decline rate distribution during fall shows a different pattern, with the highest values being concentrated in Central Macedonia (0.015), while the other parts present a smoother distribution.

3.1.6. Recovery Rate

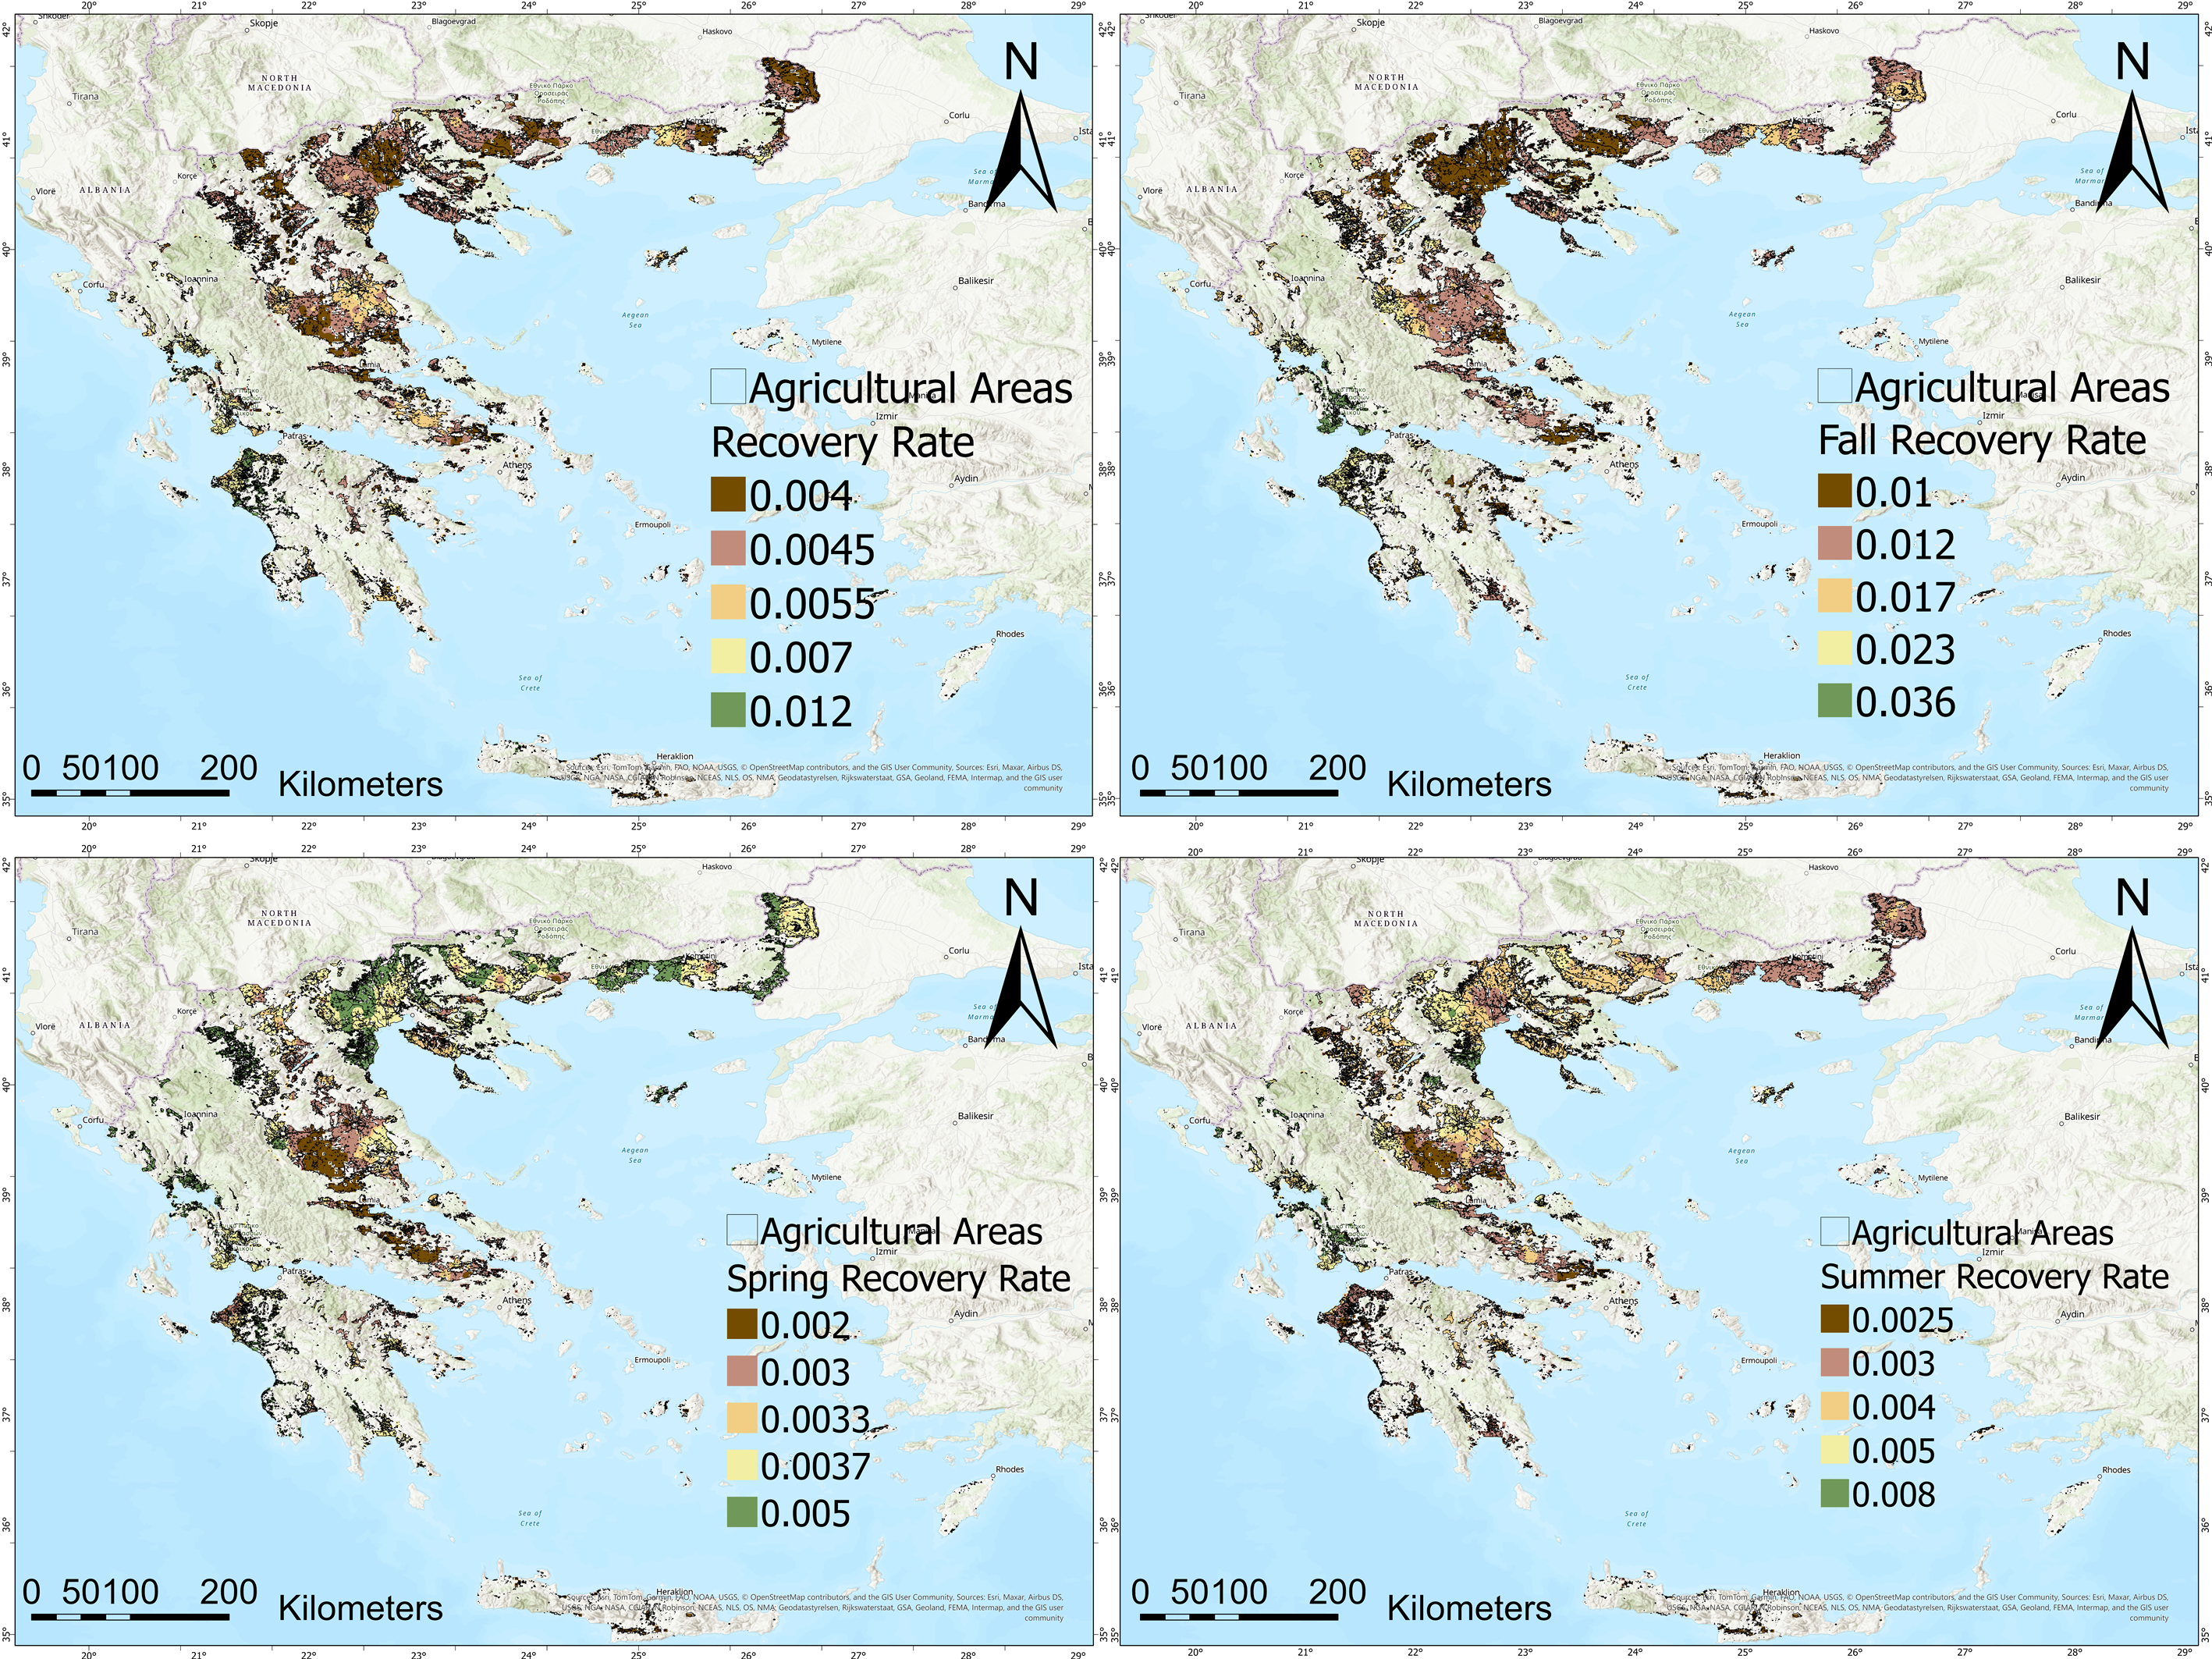
The recovery rate, which quantifies the speed at which agricultural areas bounce back from flash drought occurrences, exhibits considerable spatial and seasonal variability across Greece (Figure 8). Overall, the yearly average recovery rate is relatively low across most agricultural areas, with the highest rates (up to 0.012) being observed in some parts of Western Greece and Peloponnese, and particular locations in Epirus, implying a faster recovery from drought impacts in these areas. On the other hand, several regions in northern and eastern Greece, such as Central Macedonia and Thessaly, exhibit lower recovery values (0.0055–0.004), indicating lingering impacts of drought. During the fall season, the recovery is particularly significant, with values as high as 0.036 in western Greece, such as Western Greece and Peloponnese, Epirus and Western Macedonia, indicating the contribution of positive post-drought rainfall or beneficial climatic conditions. On the other hand, spring brings the highest recovery, particularly in northern Greece and the western Peloponnese, where rates of 0.005 are observed, while Thessaly and Central Greece present the lowest values (0.002), implying residual impacts during the critical early growing season. Summer follows a similar trend, with low rates of recovery (0.0025–0.004) in much of the country, particularly in western parts of Thessaly, which are of agricultural importance. These findings point to a seasonal dependence of recovery potential, with autumn showing the strongest post-drought recovery, but spring and summer showing pronounced vulnerabilities to agricultural drought resilience.

3.1.7. Recovery Duration

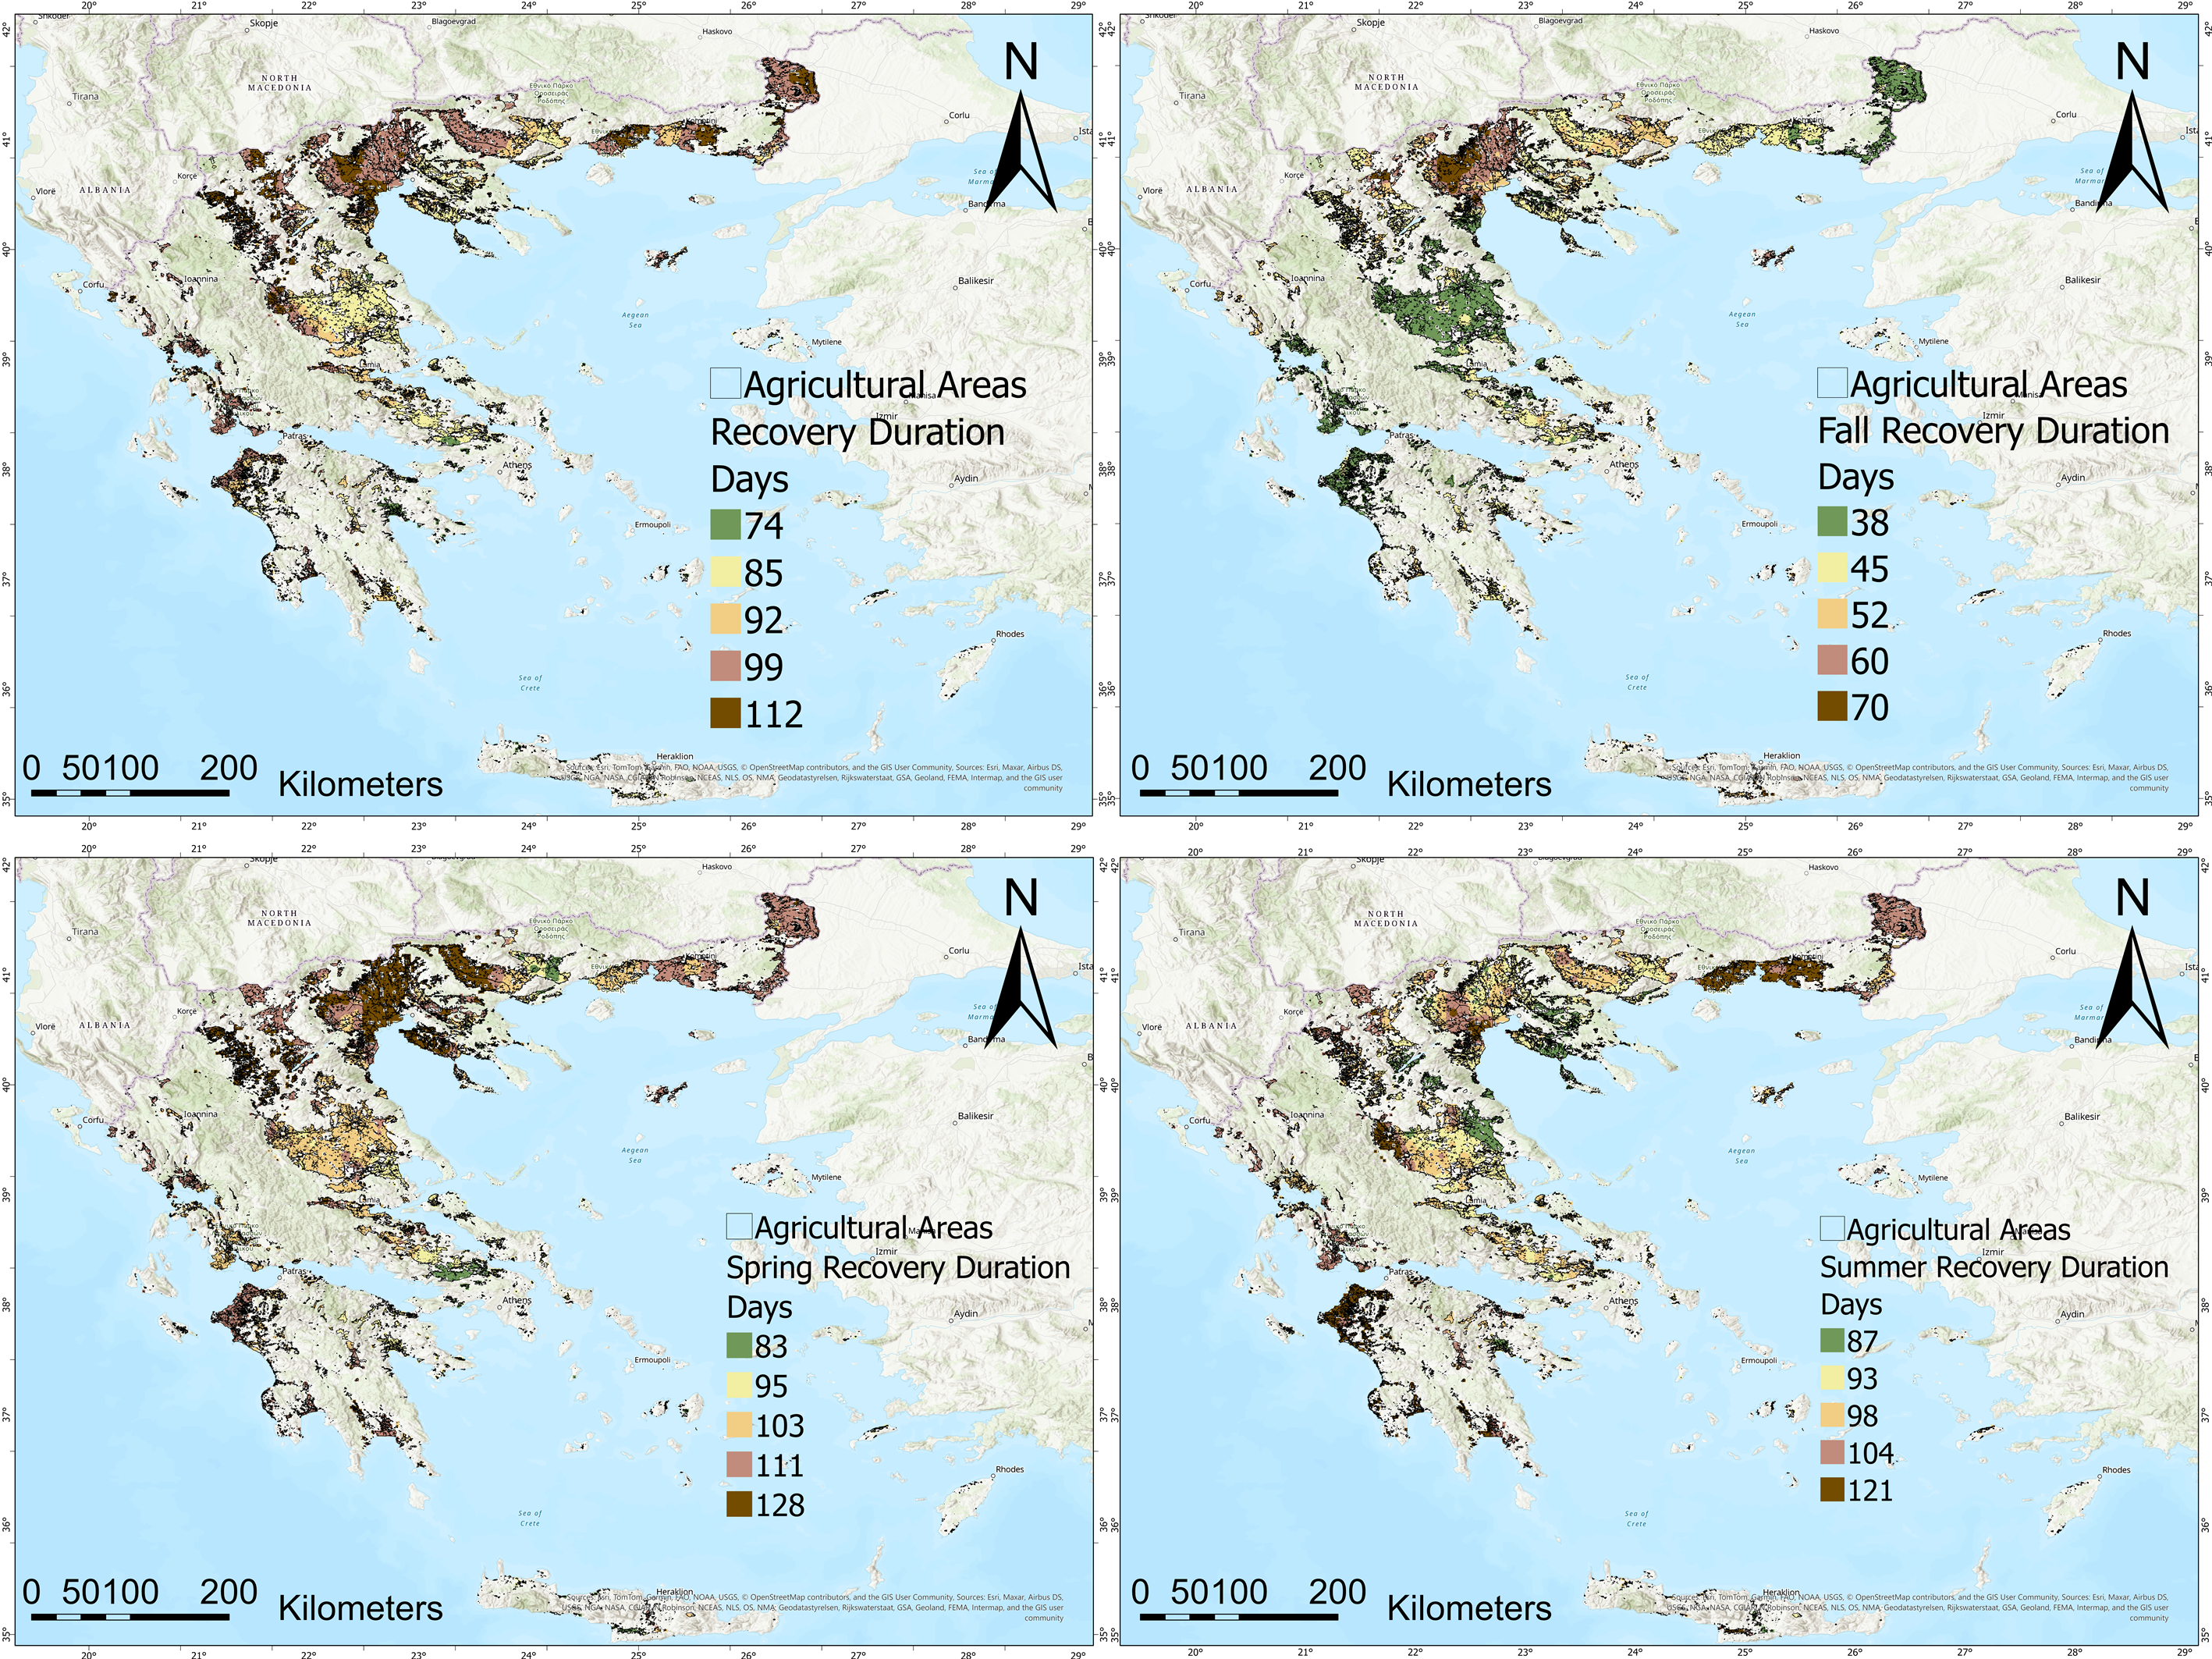
Spatial maps of recovery duration of flash drought in Greece for a 34-year span reveal distinct seasonal and regional patterns (Figure 9). Overall, the top-left annual-scale map shows that the northern and northeastern parts of Greece have the longest recovery times, specifically in regions like Central Macedonia and Eastern Macedonia and Thrace. These locations are darker, signifying recovery times of up to 112 days. Seasonally, the bottom-left and bottom-right maps for spring and summer, respectively, present greater and longer recovery times, particularly in the northern and western parts of summer (98 to 121 days). In spring, the majority of the country, especially the northern parts of Greece (Central Macedonia), record values whose recovery times last more than 128 days, indicating high agricultural vulnerability during the period. Similarly, the summer trends present longer recovery times in the north (Eastern Macedonia and Thrace) as well as Western Greece and Peloponnese, reaching a maximum of 121 days. On the contrary, fall (top-right) shows the shortest recovery times for most of the country, particularly western, southern Greece and Thessaly, at less than 38 days in most areas. This would suggest that autumn would be more favorable for drought recovery. The highest recovery time is being recorded in Central Macedonia. Collectively, the maps present a distinct spatial gradient indicating that northeastern and northern Greece are more vulnerable to the effects of prolonged flash drought, particularly during the warmer half of the year, with serious implications for agricultural sustainability in these regions.
Flash drought classes based on decline and recovery criteria
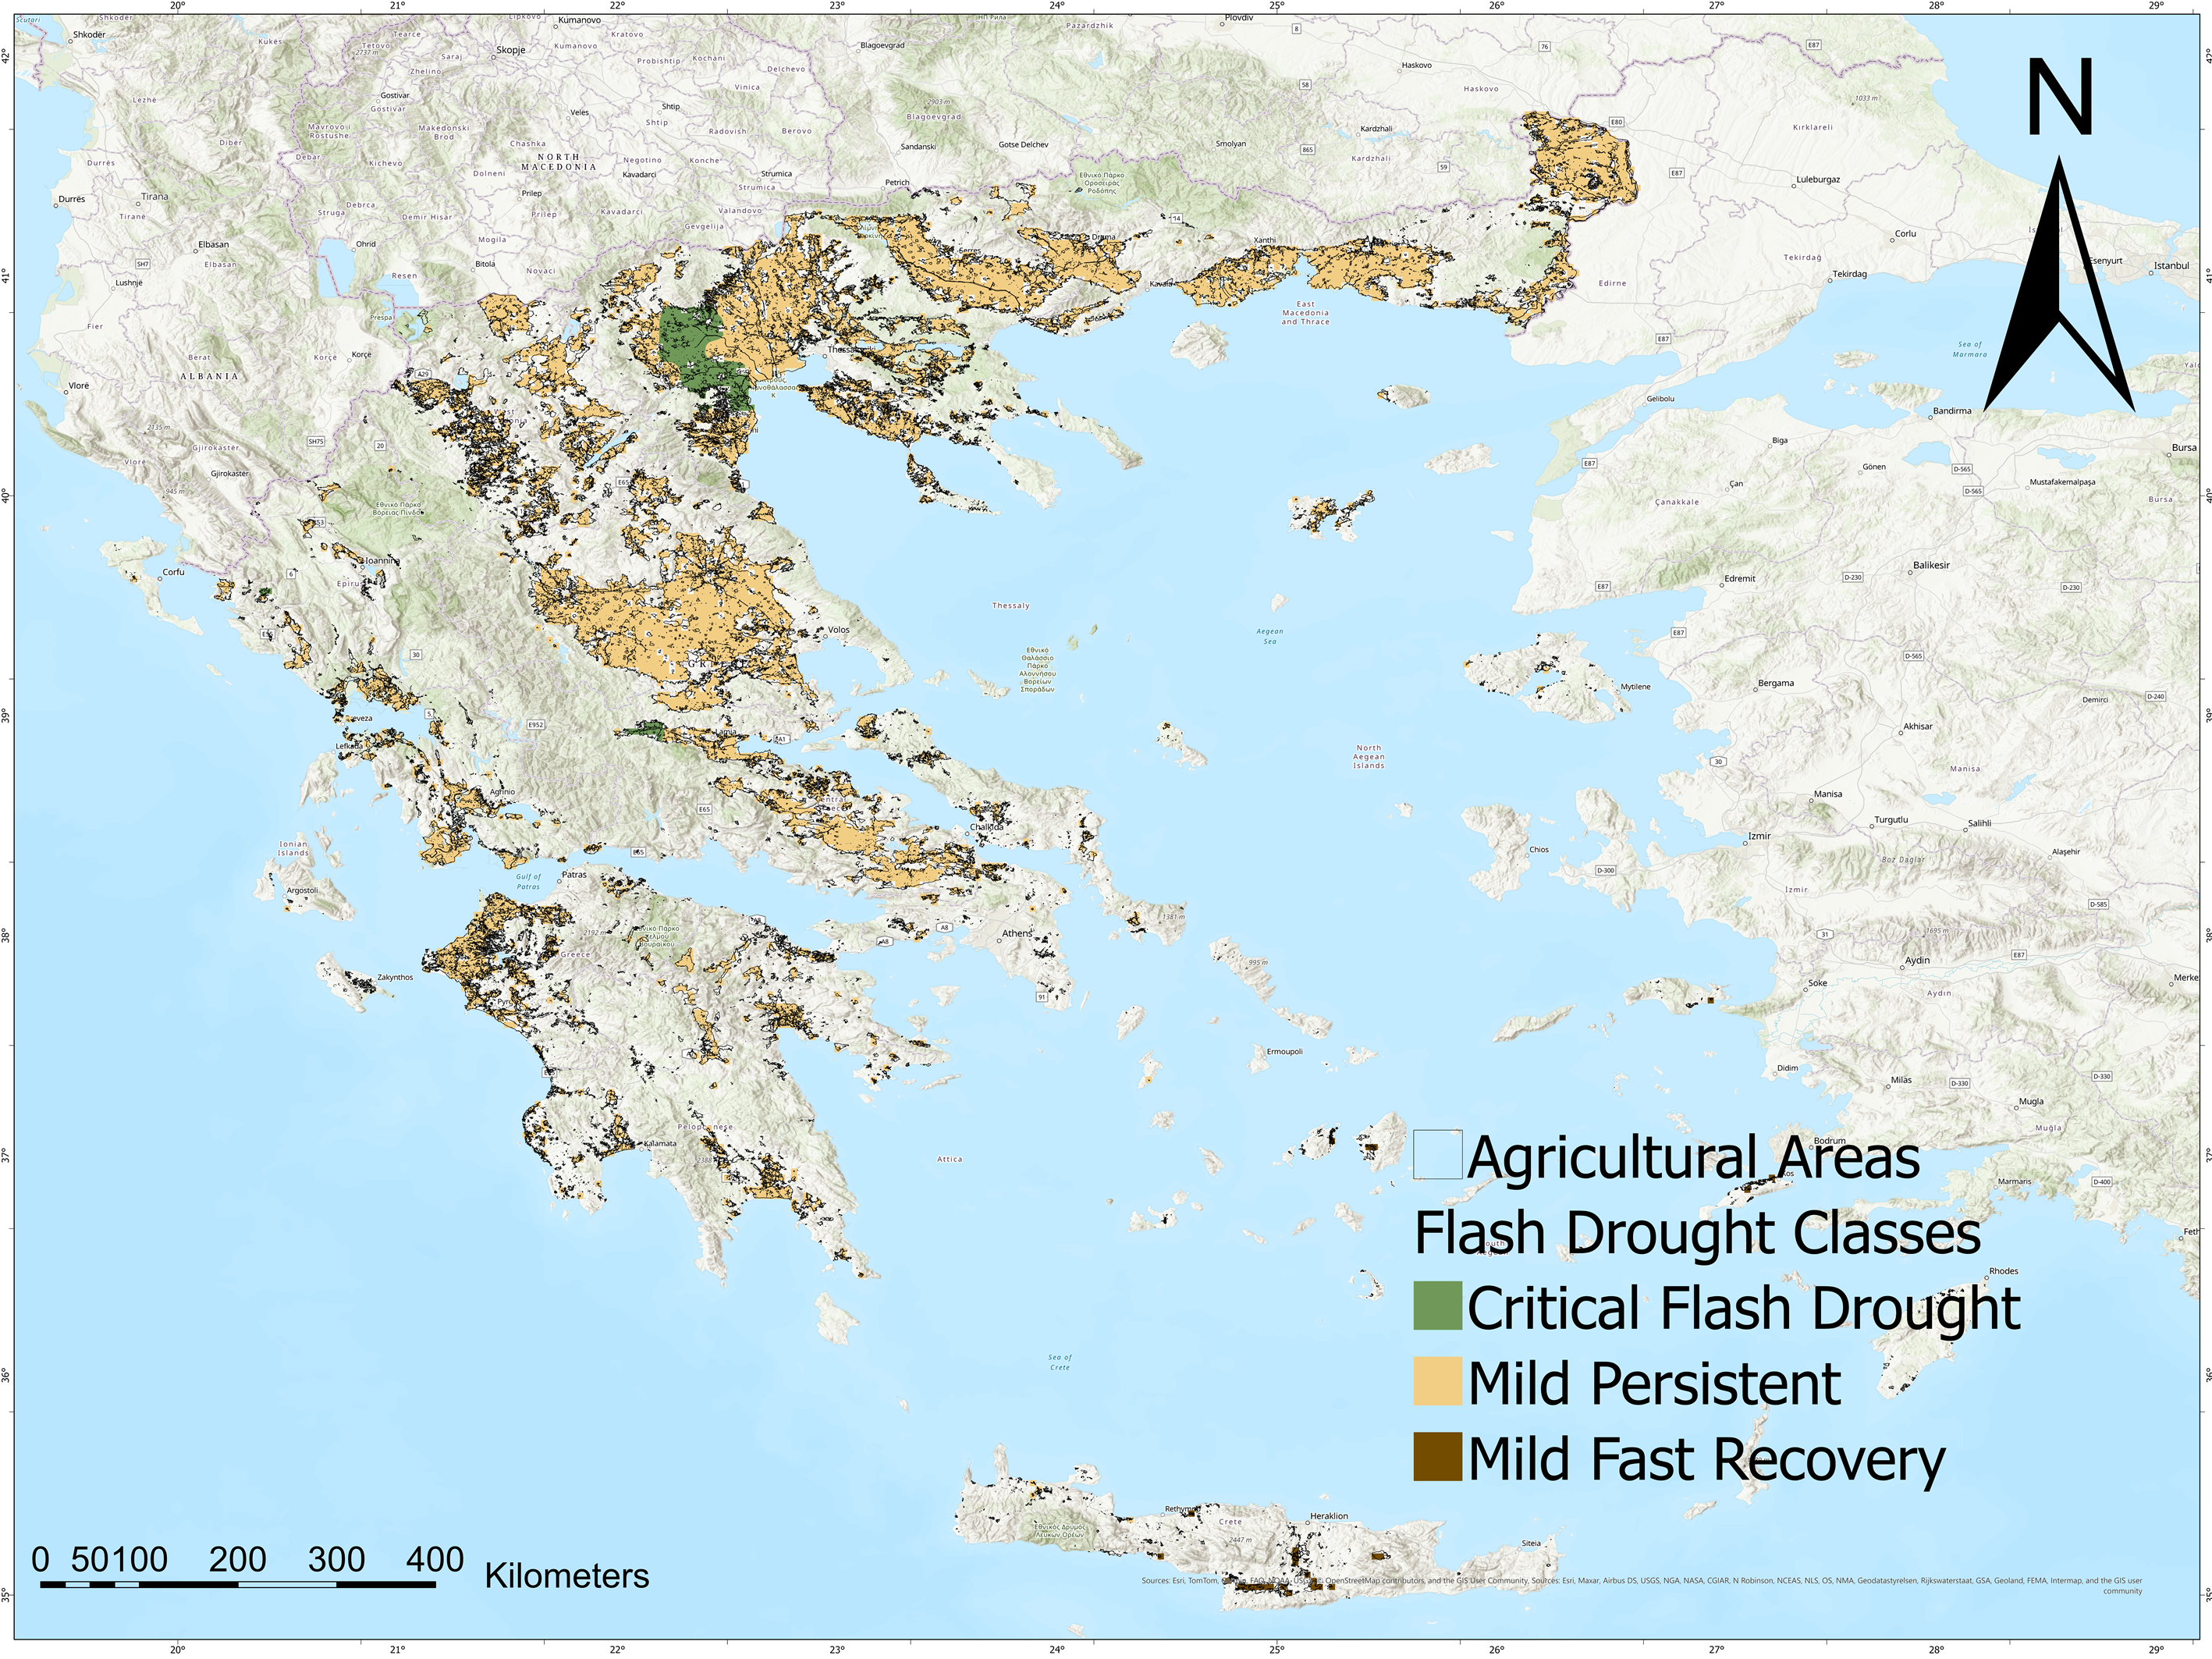
Up to this date, there is no study covering the significance of a general map indicating areas susceptible to flash drought events in the context of decline and recovery rates regarding the soil moisture. There are a handful of studies about the threshold recovery using different approaches and methods. To better visualize the heterogeneity of flash drought response across Greece, we developed a categorical classification system from two basic dynamic metrics: decline rate (rate of soil moisture depletion) and recovery rate (replenishment efficiency). Using gridded averages of these metrics, each location was categorized into one of four flash drought categories: (1) Critical Flash Drought (high rate of decline, low rate of recovery), (2) Intense but Recovering (high rate of decline, high rate of recovery), (3) Mild Persistent Drought (low rate of decline, low rate of recovery), and (4) Mild Fast Recovery (low rate of decline, high rate of recovery). The typology was identified based on threshold values of 0.012 day−1 for rapid decline and 0.009 day−1 for slow recovery derived from the distribution of the representative dataset. The rule-based method is an effective means to differentiate and bound flash drought typologies in various regions, thus facilitating local-level adaptation and planning. (Table 1).
Figure 10 displays the spatial pattern of flash drought classes in Greece, revealing pronounced regional flash drought characteristics controlled by the interplay between recovery and severity. There is a clear picture of the flash drought status in Greece, where the frequent occurrence of mild persistent flash droughts in vital agricultural areas, Central Greece, Thessaly, and Central Macedonia, suggests the prevalence of frequent but short dry periods with rapid recovery, implying relatively strong hydrological systems. In contrast, critical flash droughts are seen in parts of Central Macedonia, with a high decline and slow recovery, indicating long periods of stress with potential agricultural impact. It is worth mentioning areas characterized by mild and fast recovery rates, which are the islands of the Aegean and Crete. The lack of prominent flash droughts in the map, although included as part of the grounds for classification, indicates that such events are possibly not common or not well captured. This classification, in general, yields useful information regarding spatial heterogeneity in flash drought dynamics and therefore informs focused drought preparedness and water resource management.

3.2. Frequency on Regional Level

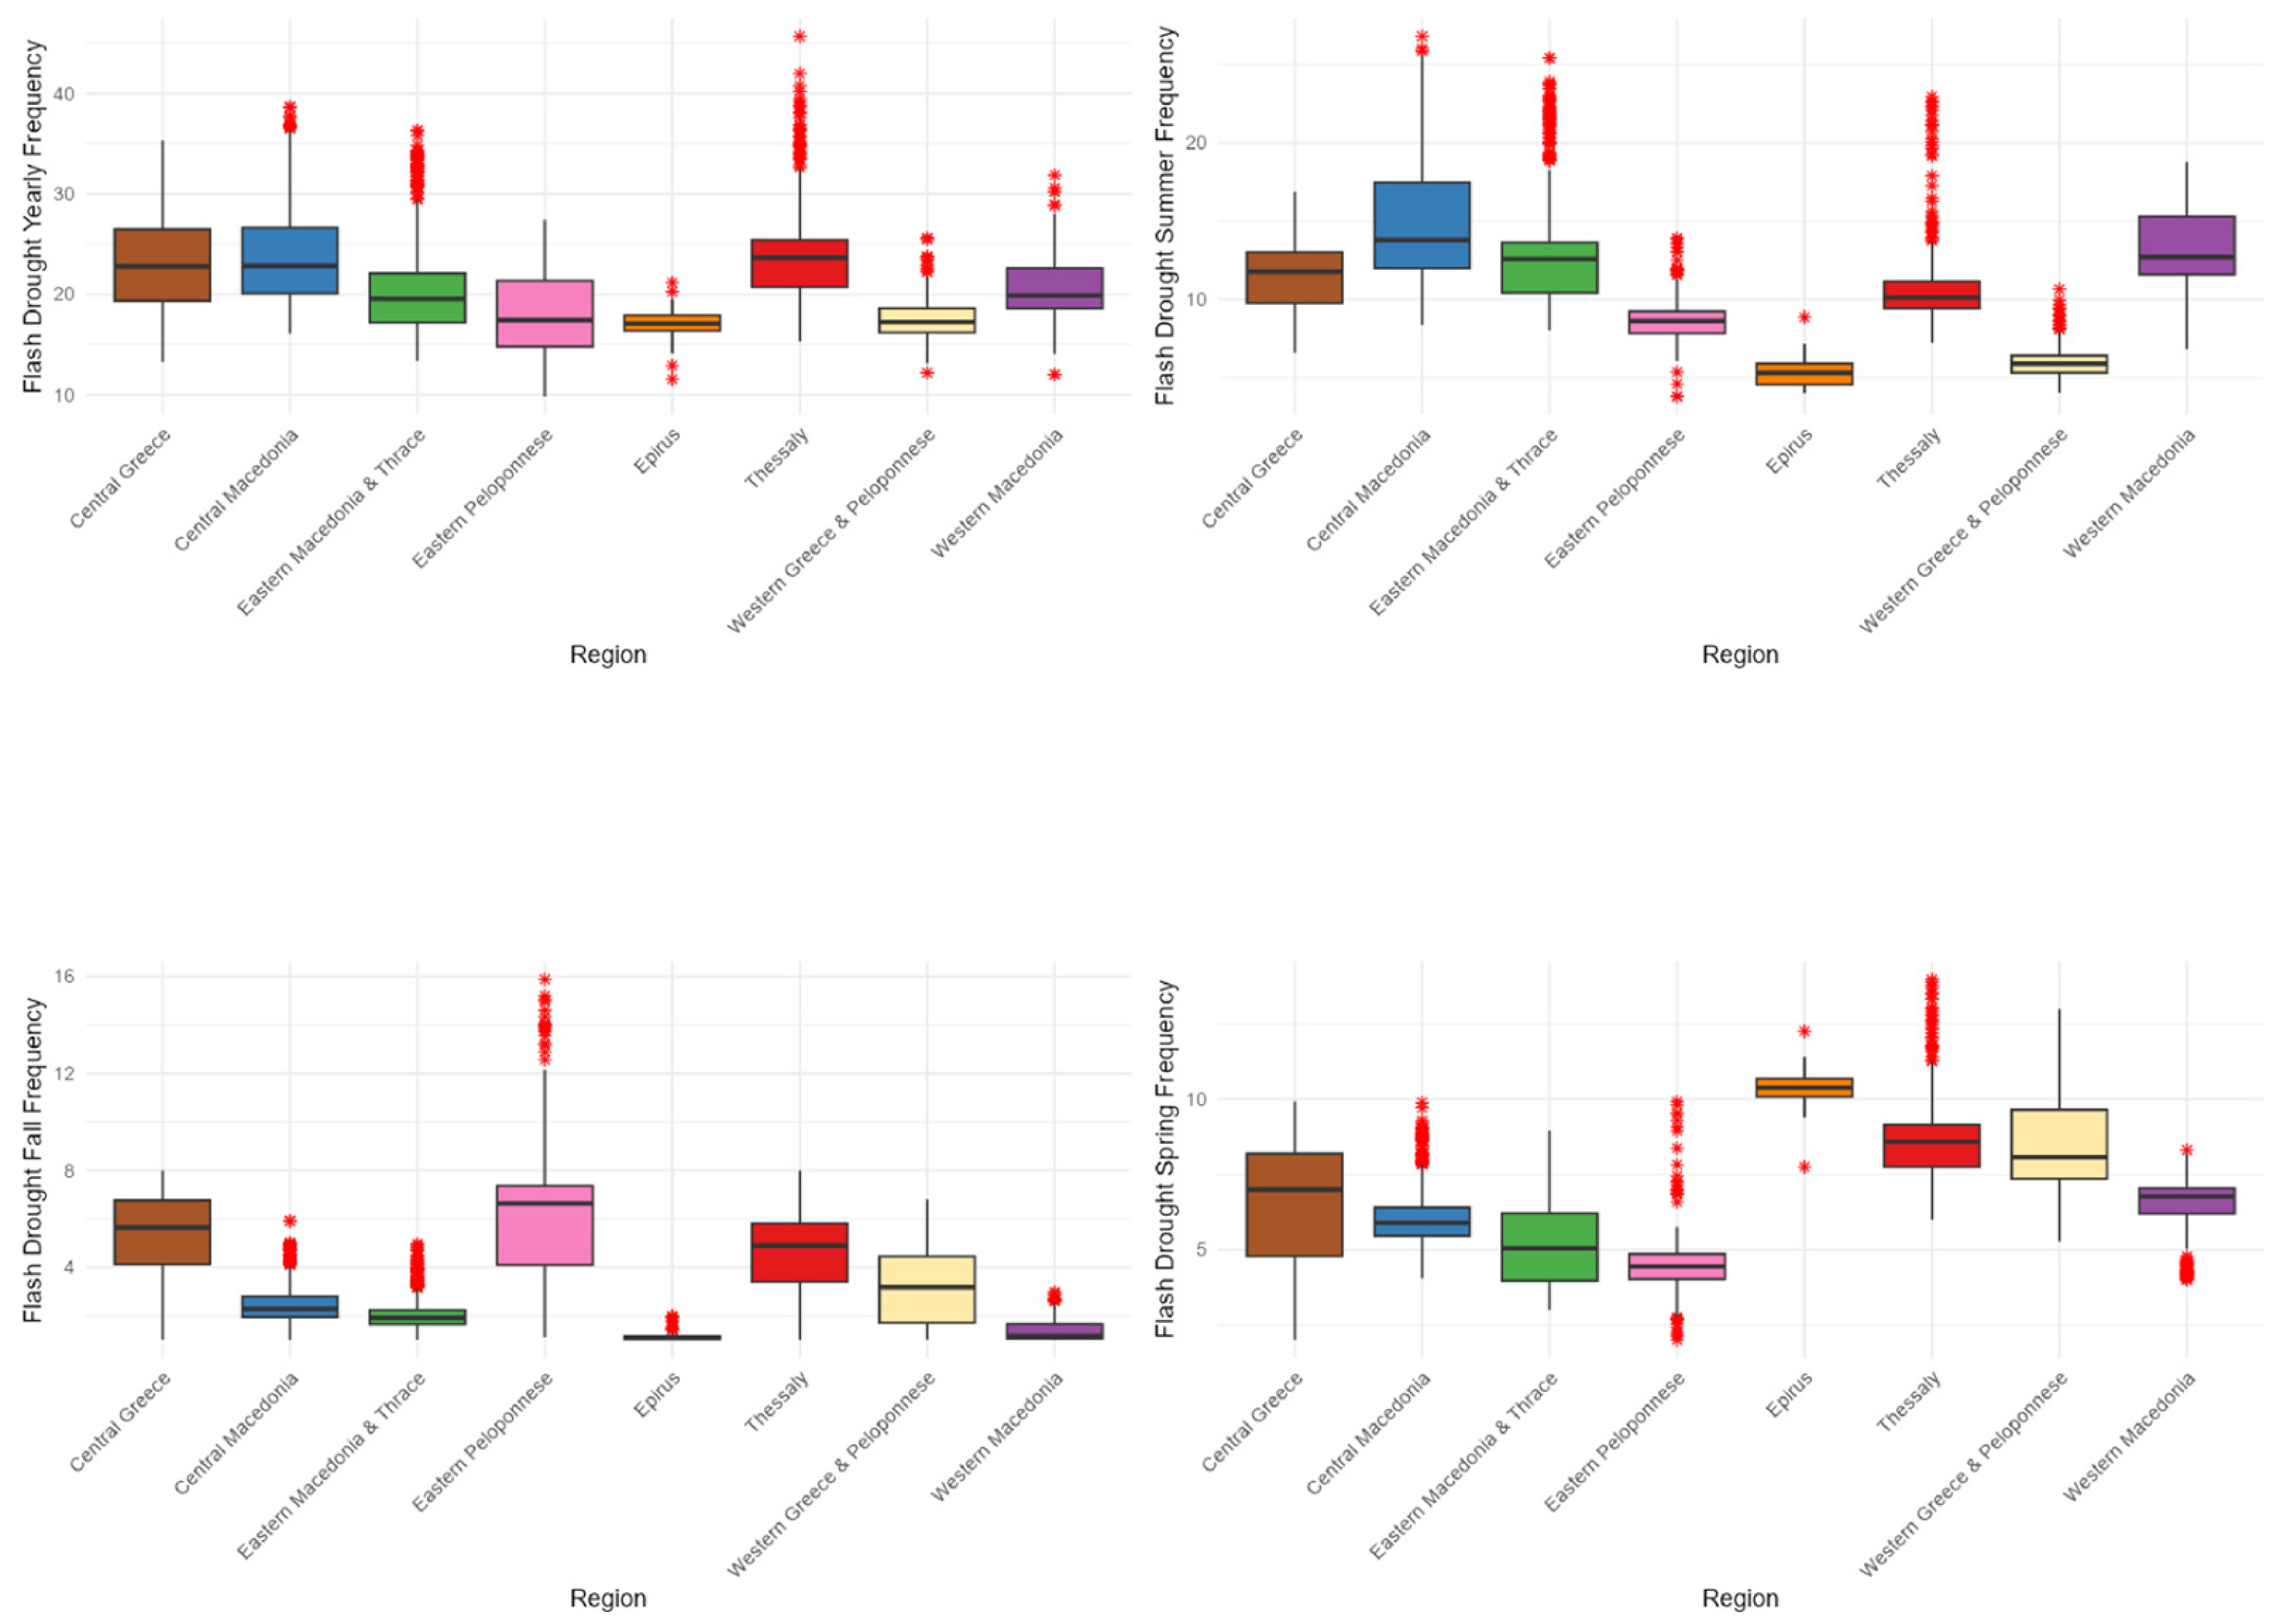
The box plot summary in the lower right indicates strong regional differences in flash drought frequency throughout Greece for the 34 years analyzed (Figure 11). Central Greece, Central Macedonia and Thessaly experience the highest median flash drought frequency of approximately 22 events, with a range of approximately 20 to more than 25, and several extreme outliers above 35 events, especially Thessaly, indicating both high exposure and high variability. Thrace and Western Macedonia follow, with around 20 median frequencies and wide interquartile ranges, reflecting chronic drought stress at these agricultural hubs. Eastern Macedonia and Thrace also present many outliers where they exhibit about 30 events, showing the variability in the northern areas of Greece. Eastern and Western Greece and Peloponnese and Epirus have the lowest median frequencies, around 15 to 20 events, with narrower spreads and fewer outliers, reflecting comparatively lower and more stable drought exposure. In the summer period, Central Macedonia presents the highest median (~13), while Thessaly and Eastern Macedonia and Thrace have the most outliers with more than 20 events in some cases. Spring seasons show a different picture, where Epirus and Thessaly have a median of 10 and 8, respectively. Additionally, in fall, Eastern Peloponnese, Central Greece and Thessaly present median values between 5 and 7, with Eastern Peloponnese recording the most extreme outliers (>12). One can notice that there is a significant spatial variability from season to season, with the events getting more frequent as the summer season approaches.

3.3. Duration on Regional Level

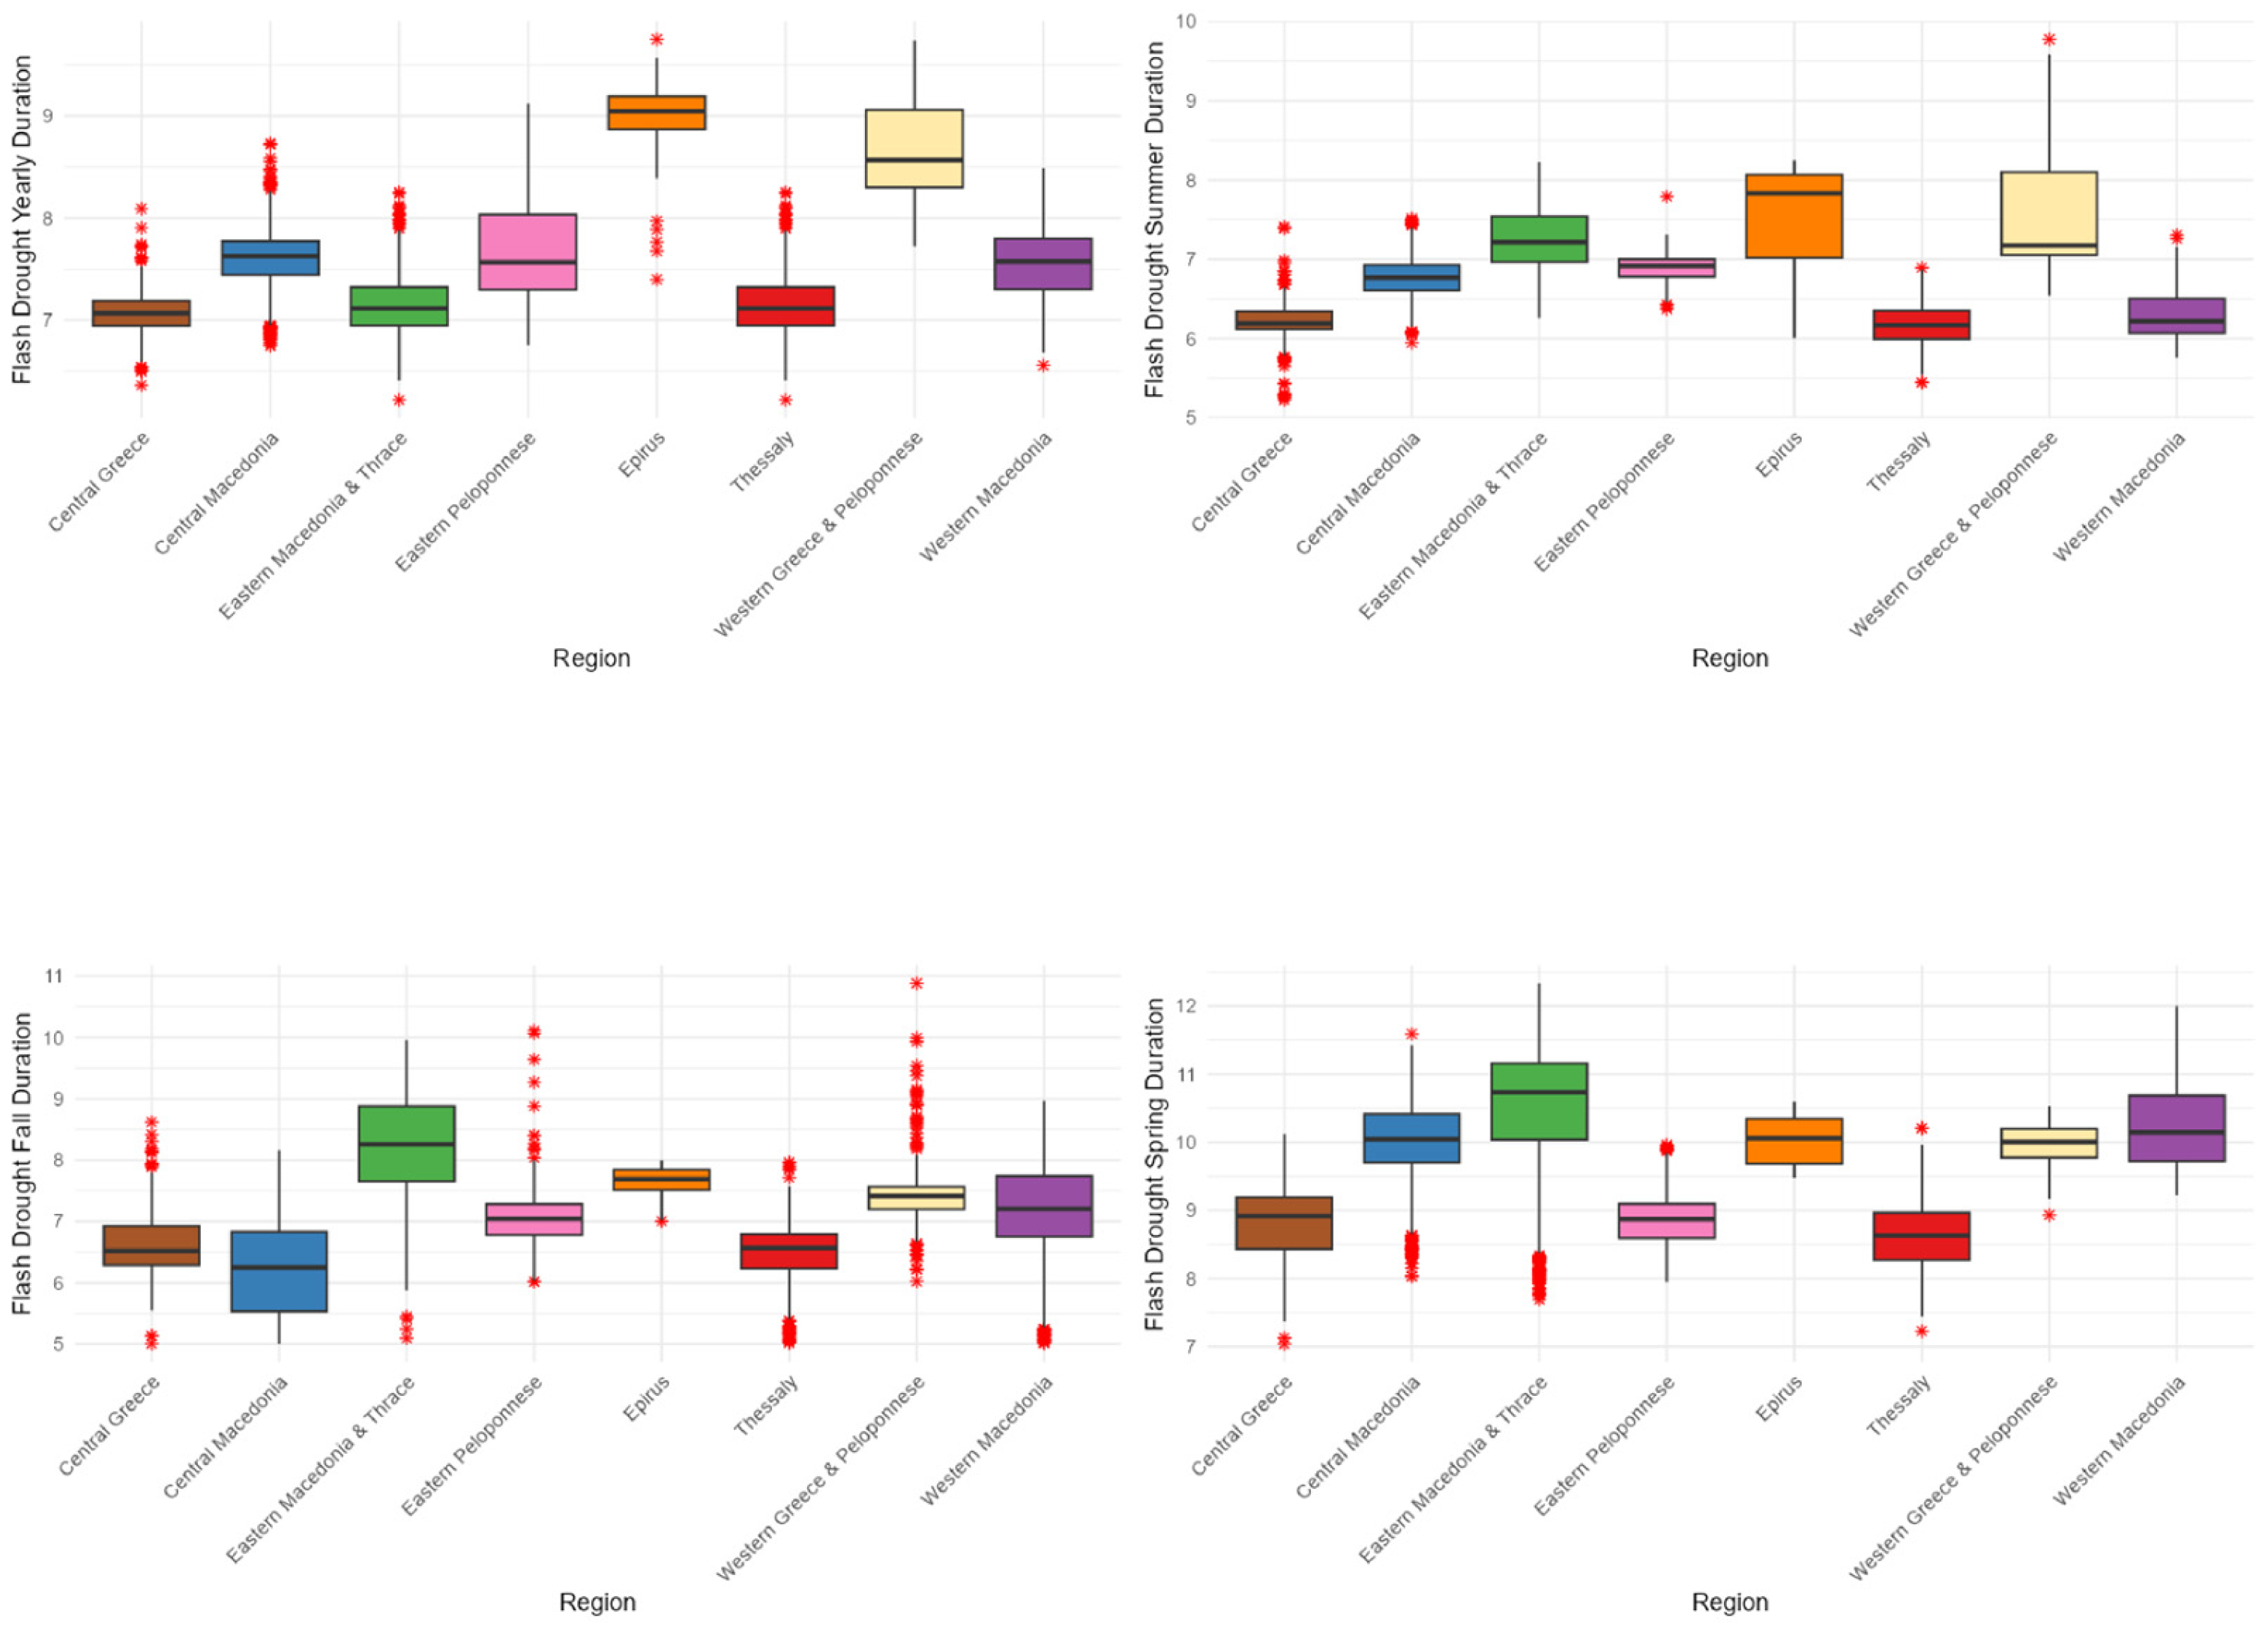
The analysis of flash drought duration over Greece for a 34-year period reveals pronounced spatial and seasonal variations in major agricultural regions. Western Greece and Peloponnese and Epirus consistently record the longest drought durations, with median values ranging between 35 and 45 days for the various seasons, and maximum values reaching up to 50–55 days during the spring season (Figure 12). Central and Western Macedonia, Epirus and Thrace present high persistence throughout the spring season, with a median duration of 50 days, rendering this season highly dominant in the northern parts. On the contrary, Central Greece, Eastern Peloponnese, and Thessaly present the shortest durations, with median values generally ranging between 30 and 35 days, particularly in the autumn season. Summer lengths are also elevated in areas like Epirus and Eastern Macedonia and Thrace, with medians of 35 to 40 days and interquartile ranges that exceed 33 days, implying the frequency of prolonged drought episodes. Areas with high irrigation activity, such as Thessaly, present the lowest duration (30). Even if summer presents high frequency record, duration, is the least variable, with most areas lying between 30 and 40 days, pointing to more shorter drought episodes and the impact of irrigation.

3.4. Magnitude on Regional Level

The boxplots illustrating the magnitude of flash droughts across various Greek regions over a 34-year timeframe demonstrate distinct spatial and seasonal variations (Figure 13). During the summer months, Thessaly and Western Macedonia exhibit the highest magnitudes, with medians surpassing 0.010 and displaying considerable variability; Central Greece and Central Macedonia also record significant values. In contrast, Epirus and Eastern Peloponnese consistently reflect the lowest summer magnitudes, generally remaining below 0.005. In the spring season, Central Macedonia, Western Macedonia, and Thessaly are notable for their median magnitudes approaching or exceeding 0.006, while Central Greece and Eastern Peloponnese maintain lower levels. Fall trends are characterized by elevated magnitudes in Central Macedonia, which demonstrates the greatest variability and extreme outliers, followed by Western Greece and Peloponnese, whereas most other regions hover near zero. On an annual basis, Western Macedonia and Western Greece and Peloponnese document the highest magnitudes (frequently exceeding 0.010), alongside Thessaly and Thrace, whereas Eastern Peloponnese and Epirus consistently remain at the lower spectrum. Collectively, these findings suggest that Western Macedonia, Thessaly, and Western Peloponnese are the most impacted by severe flash droughts, while Epirus and Eastern Peloponnese encounter relatively mild occurrences throughout the seasons.

3.5. Intensity on Regional Level

Boxplots of flash drought intensity for Greece’s significant agricultural areas for the 34-year period also exhibit distinct spatial and seasonal variations for the speed of onset (Figure 14). In summer, Central Macedonia, Thessaly and Central Greece exhibit maximum intensities, median intensities higher than 0.0025 and a prevalence of extreme outliers, while Eastern Peloponnese and Epirus consistently stay lower, often lower than 0.001. In spring, Central Macedonia, Western Macedonia, and Thessaly are characterized by median intensities of approximately 0.0008–0.0010, while Central Greece and Eastern Peloponnese display lower intensities. Fall intensities are characterized by Central Macedonia, the maximum and extreme outlier medians, followed by Western Greece and Peloponnese, while autumn intensities are minimal for most other areas. Annually, Central Macedonia and Western Macedonia display the maximum intensities, median intensities higher than 0.0015, and this is followed by Thessaly and Eastern Macedonia and Thrace, while Epirus and Eastern Peloponnese consistently display the lowest intensities. In general, it is found that eastern and northern areas, and especially Central Macedonia, Thessaly, and Western Macedonia, display the maximum sudden flash droughts, while Southern areas like Eastern Peloponnese and Epirus are characterized by relatively weak and slow-onset flash events.

3.6. Decline Rate on Regional Levels

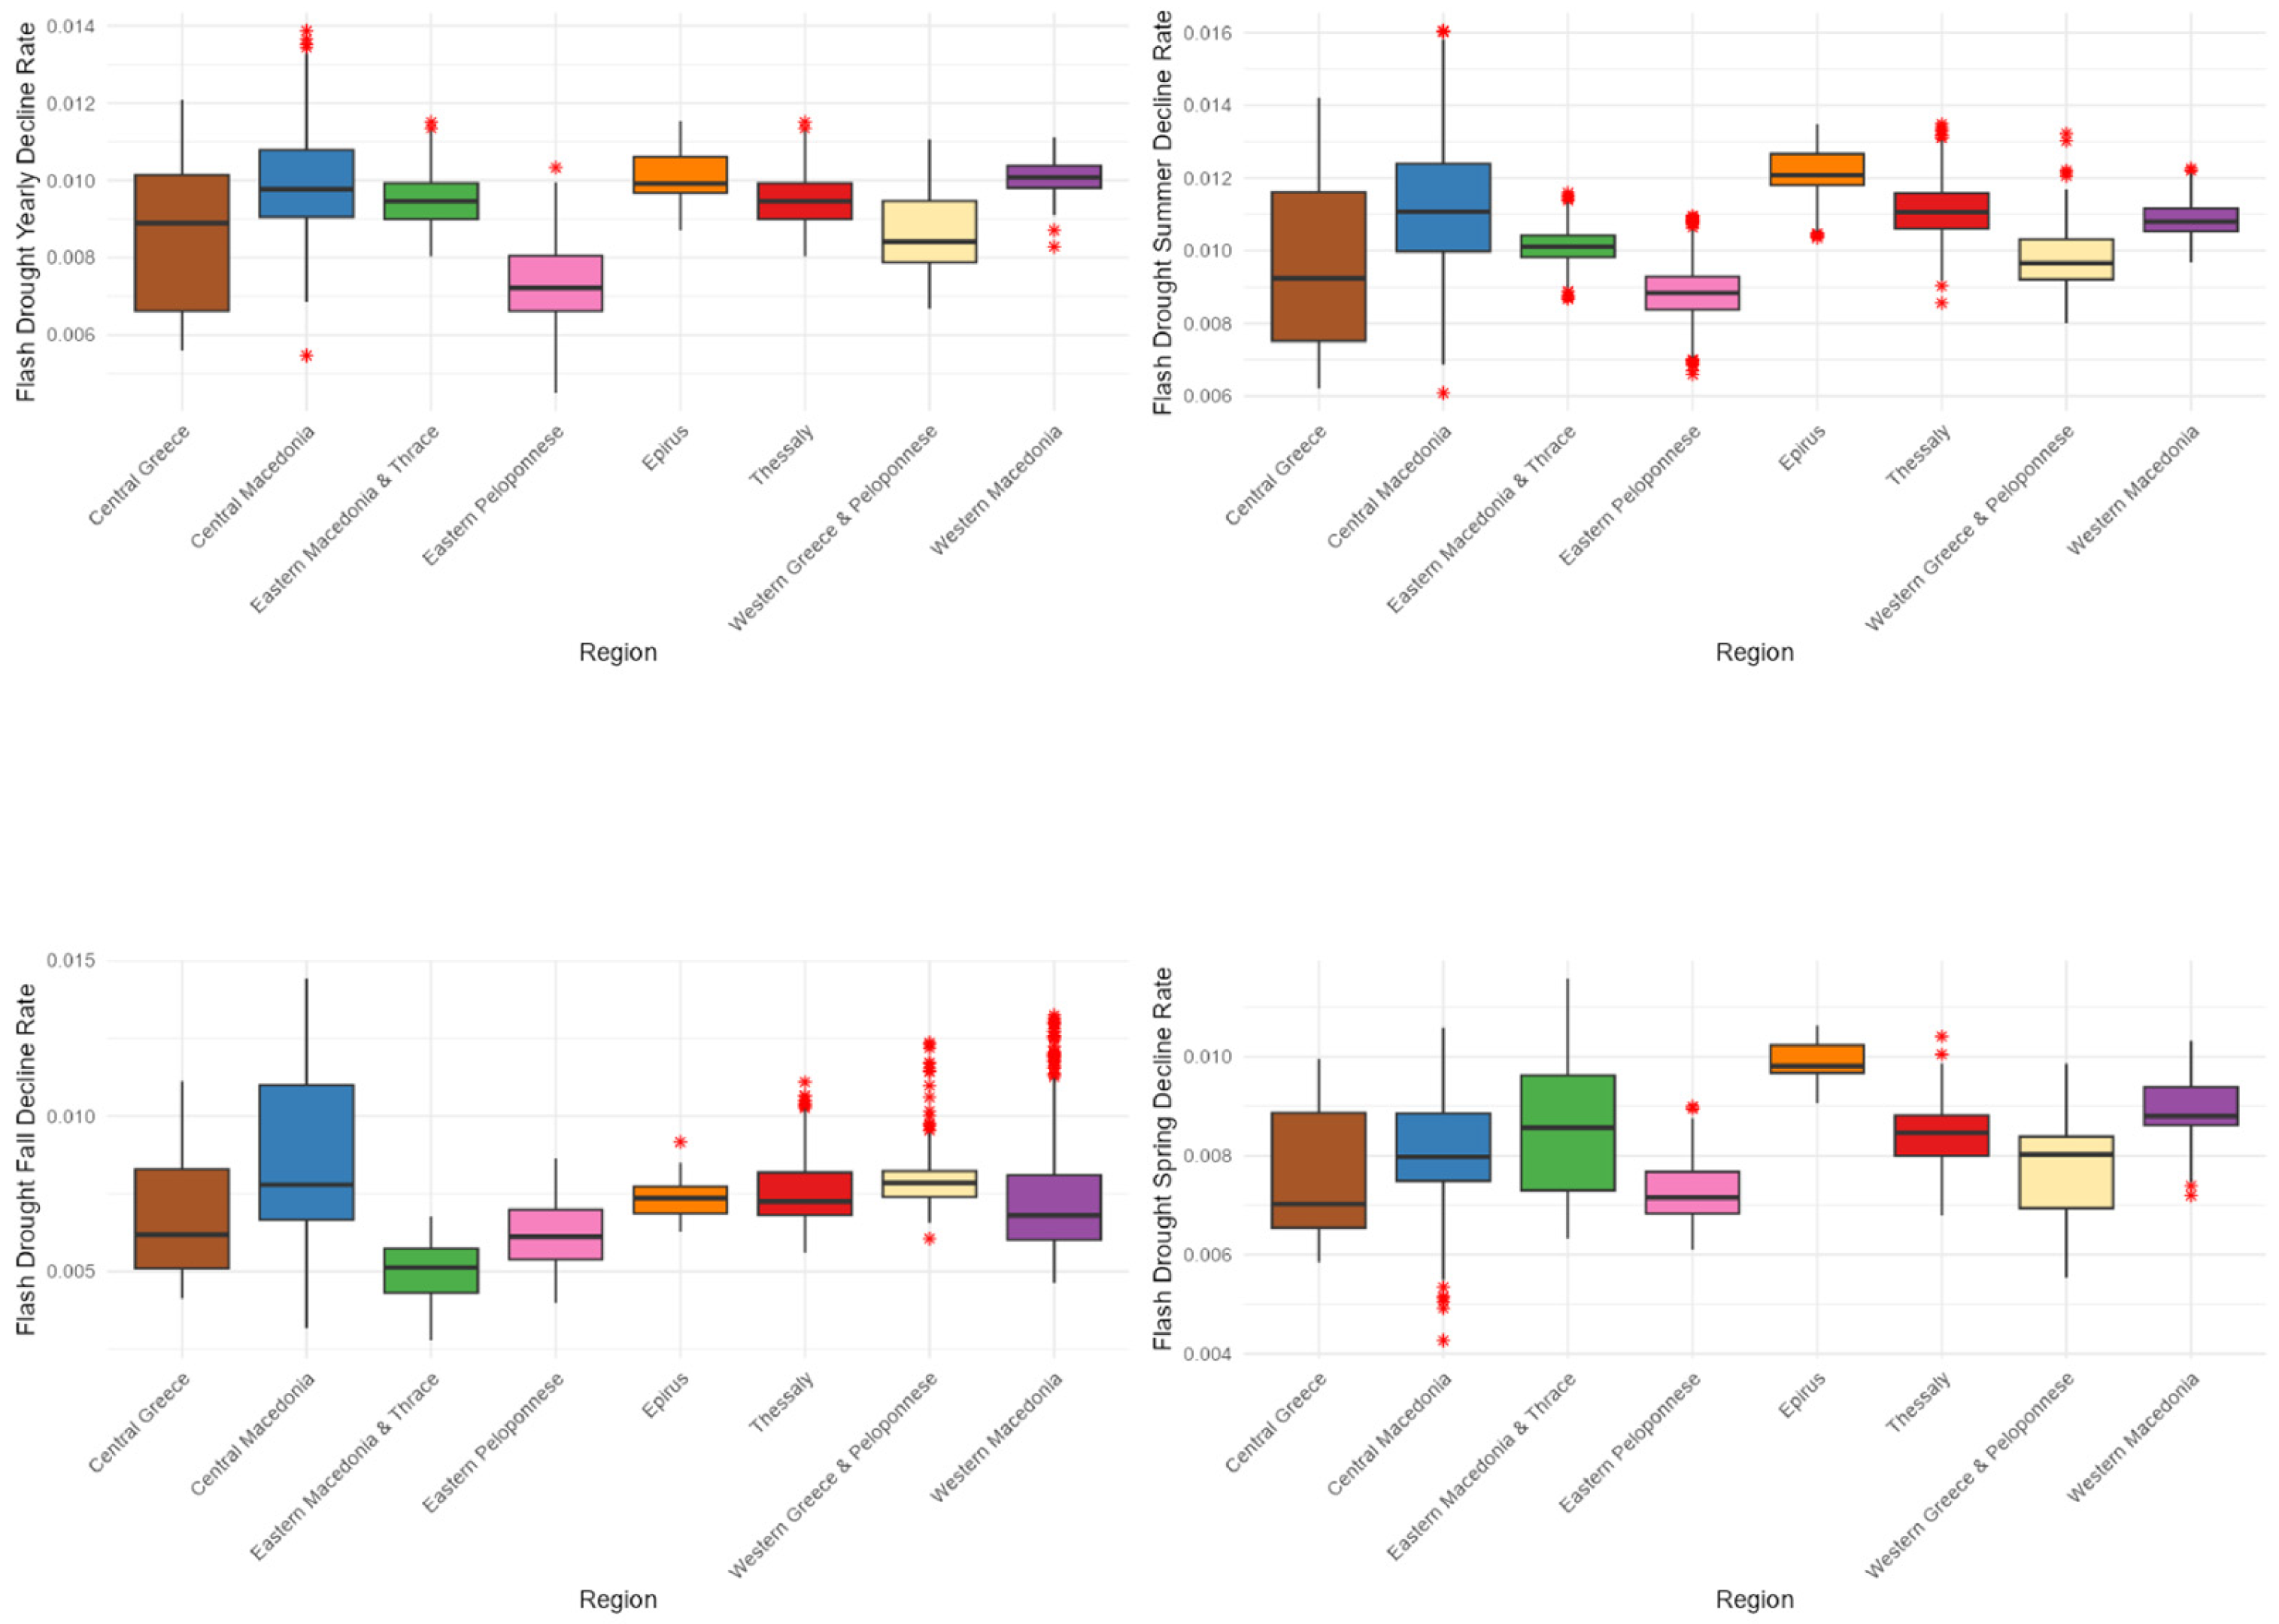
The boxplots for flash drought decline rates show clear spatial and seasonal variability for Greece’s principal areas of cultivation, indicative of the rate of soil moisture depletion at the onset of a flash drought (Figure 15). During summer, Central Greece and Central Macedonia show the steepest decline rates, often above 0.010 and with many extreme outliers, while Eastern Peloponnese and Epirus consistently stay lower, often below 0.007. During spring, the maximum decline rates (often near or above 0.010) are seen over Epirus, Thessaly, and Thrace, indicative of sharp flash drought onset, while lower values around or below 0.006 are observed for Central Greece. Fall patterns note Central Macedonia as extremely sensitive, indicated by the widest spread and many extreme maxima above or around 0.014, followed by Western Greece and Peloponnese, while Eastern Macedonia and Thrace and Western Macedonia stay relatively moderate. At an annual level, Central Macedonia, Thessaly, and Eastern Macedonia and Thrace are the regions experiencing maximum decline rates, often above or near 0.010, while consistently the lowest values near or around 0.006–0.007 are observed for Epirus and Eastern Peloponnese. Overall, the findings highlight that eastern and northern regions, and more critically Central Macedonia, Thessaly, and Eastern Macedonia and Thrace, are most susceptible to fast drying of the soil, while south and west regions like Epirus and Eastern Peloponnese are more typical for gradual flash onset.

3.7. Recovery Rate on Regional Levels

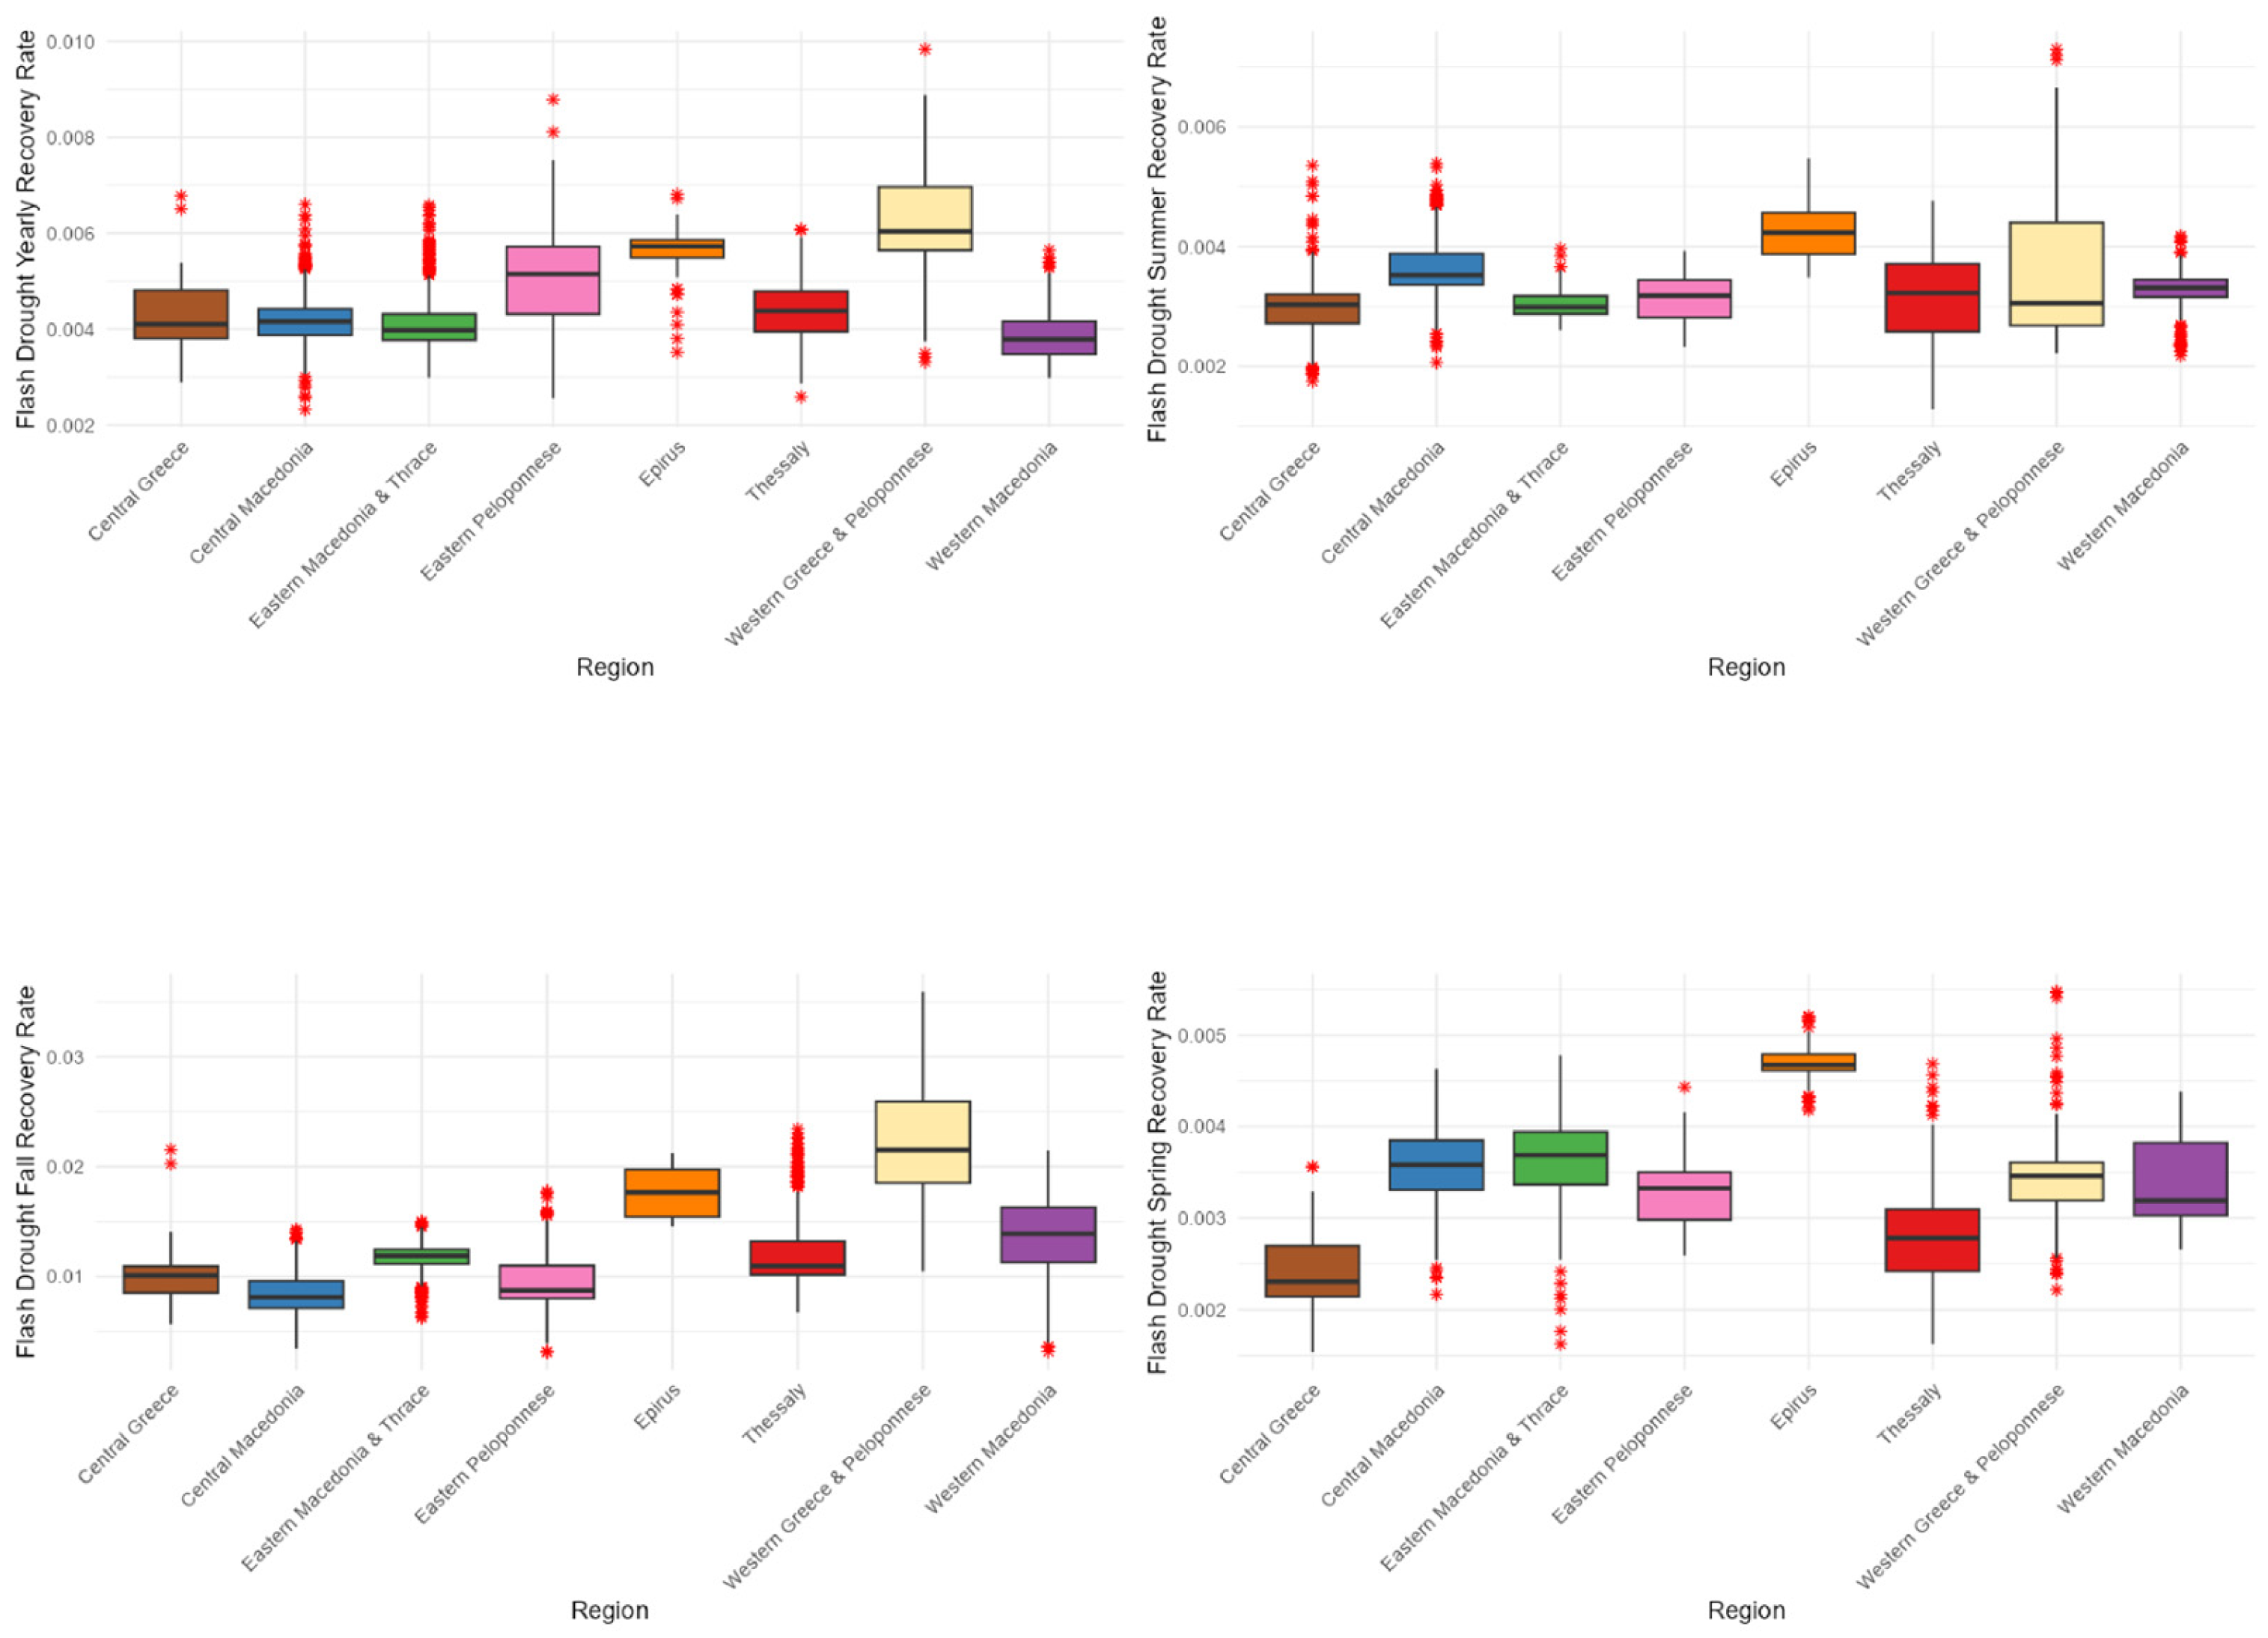
Boxplots illustrating recovery rates associated with flash droughts elucidate the rate of improvement in conditions following a drought event across various regions and seasons in Greece (Figure 16). Western Greece and the Peloponnese are particularly notable for exhibiting the highest annual median recovery rate, approximately 0.008, peaking at nearly 0.009 during the autumn season, indicative of robust recovery capabilities. Similarly, Western Macedonia exhibits consistently elevated recovery rates throughout all seasons, with median values falling within the range of 0.005 to 0.007. Conversely, regions such as Eastern Macedonia and Thrace, Thessaly, and Central Greece exhibit slower recovery trajectories, with annual median values fluctuating between 0.004 and 0.005. Spring is identified as the season characterized by the most limited recovery in nearly all regions, frequently displaying medians as low as 0.002 to 0.003. In contrast, fall is associated with the most vigorous recovery, particularly evident in Thessaly and Central Greece, where seasonal recovery rates surpass 0.006. Collectively, these trends underscore significant spatial and temporal variability, with western regions demonstrating a more rapid recovery than their eastern and northern counterparts, thereby highlighting the regional disparities in resilience to the impacts of drought.

3.8. Recovery Duration on Regional Levels

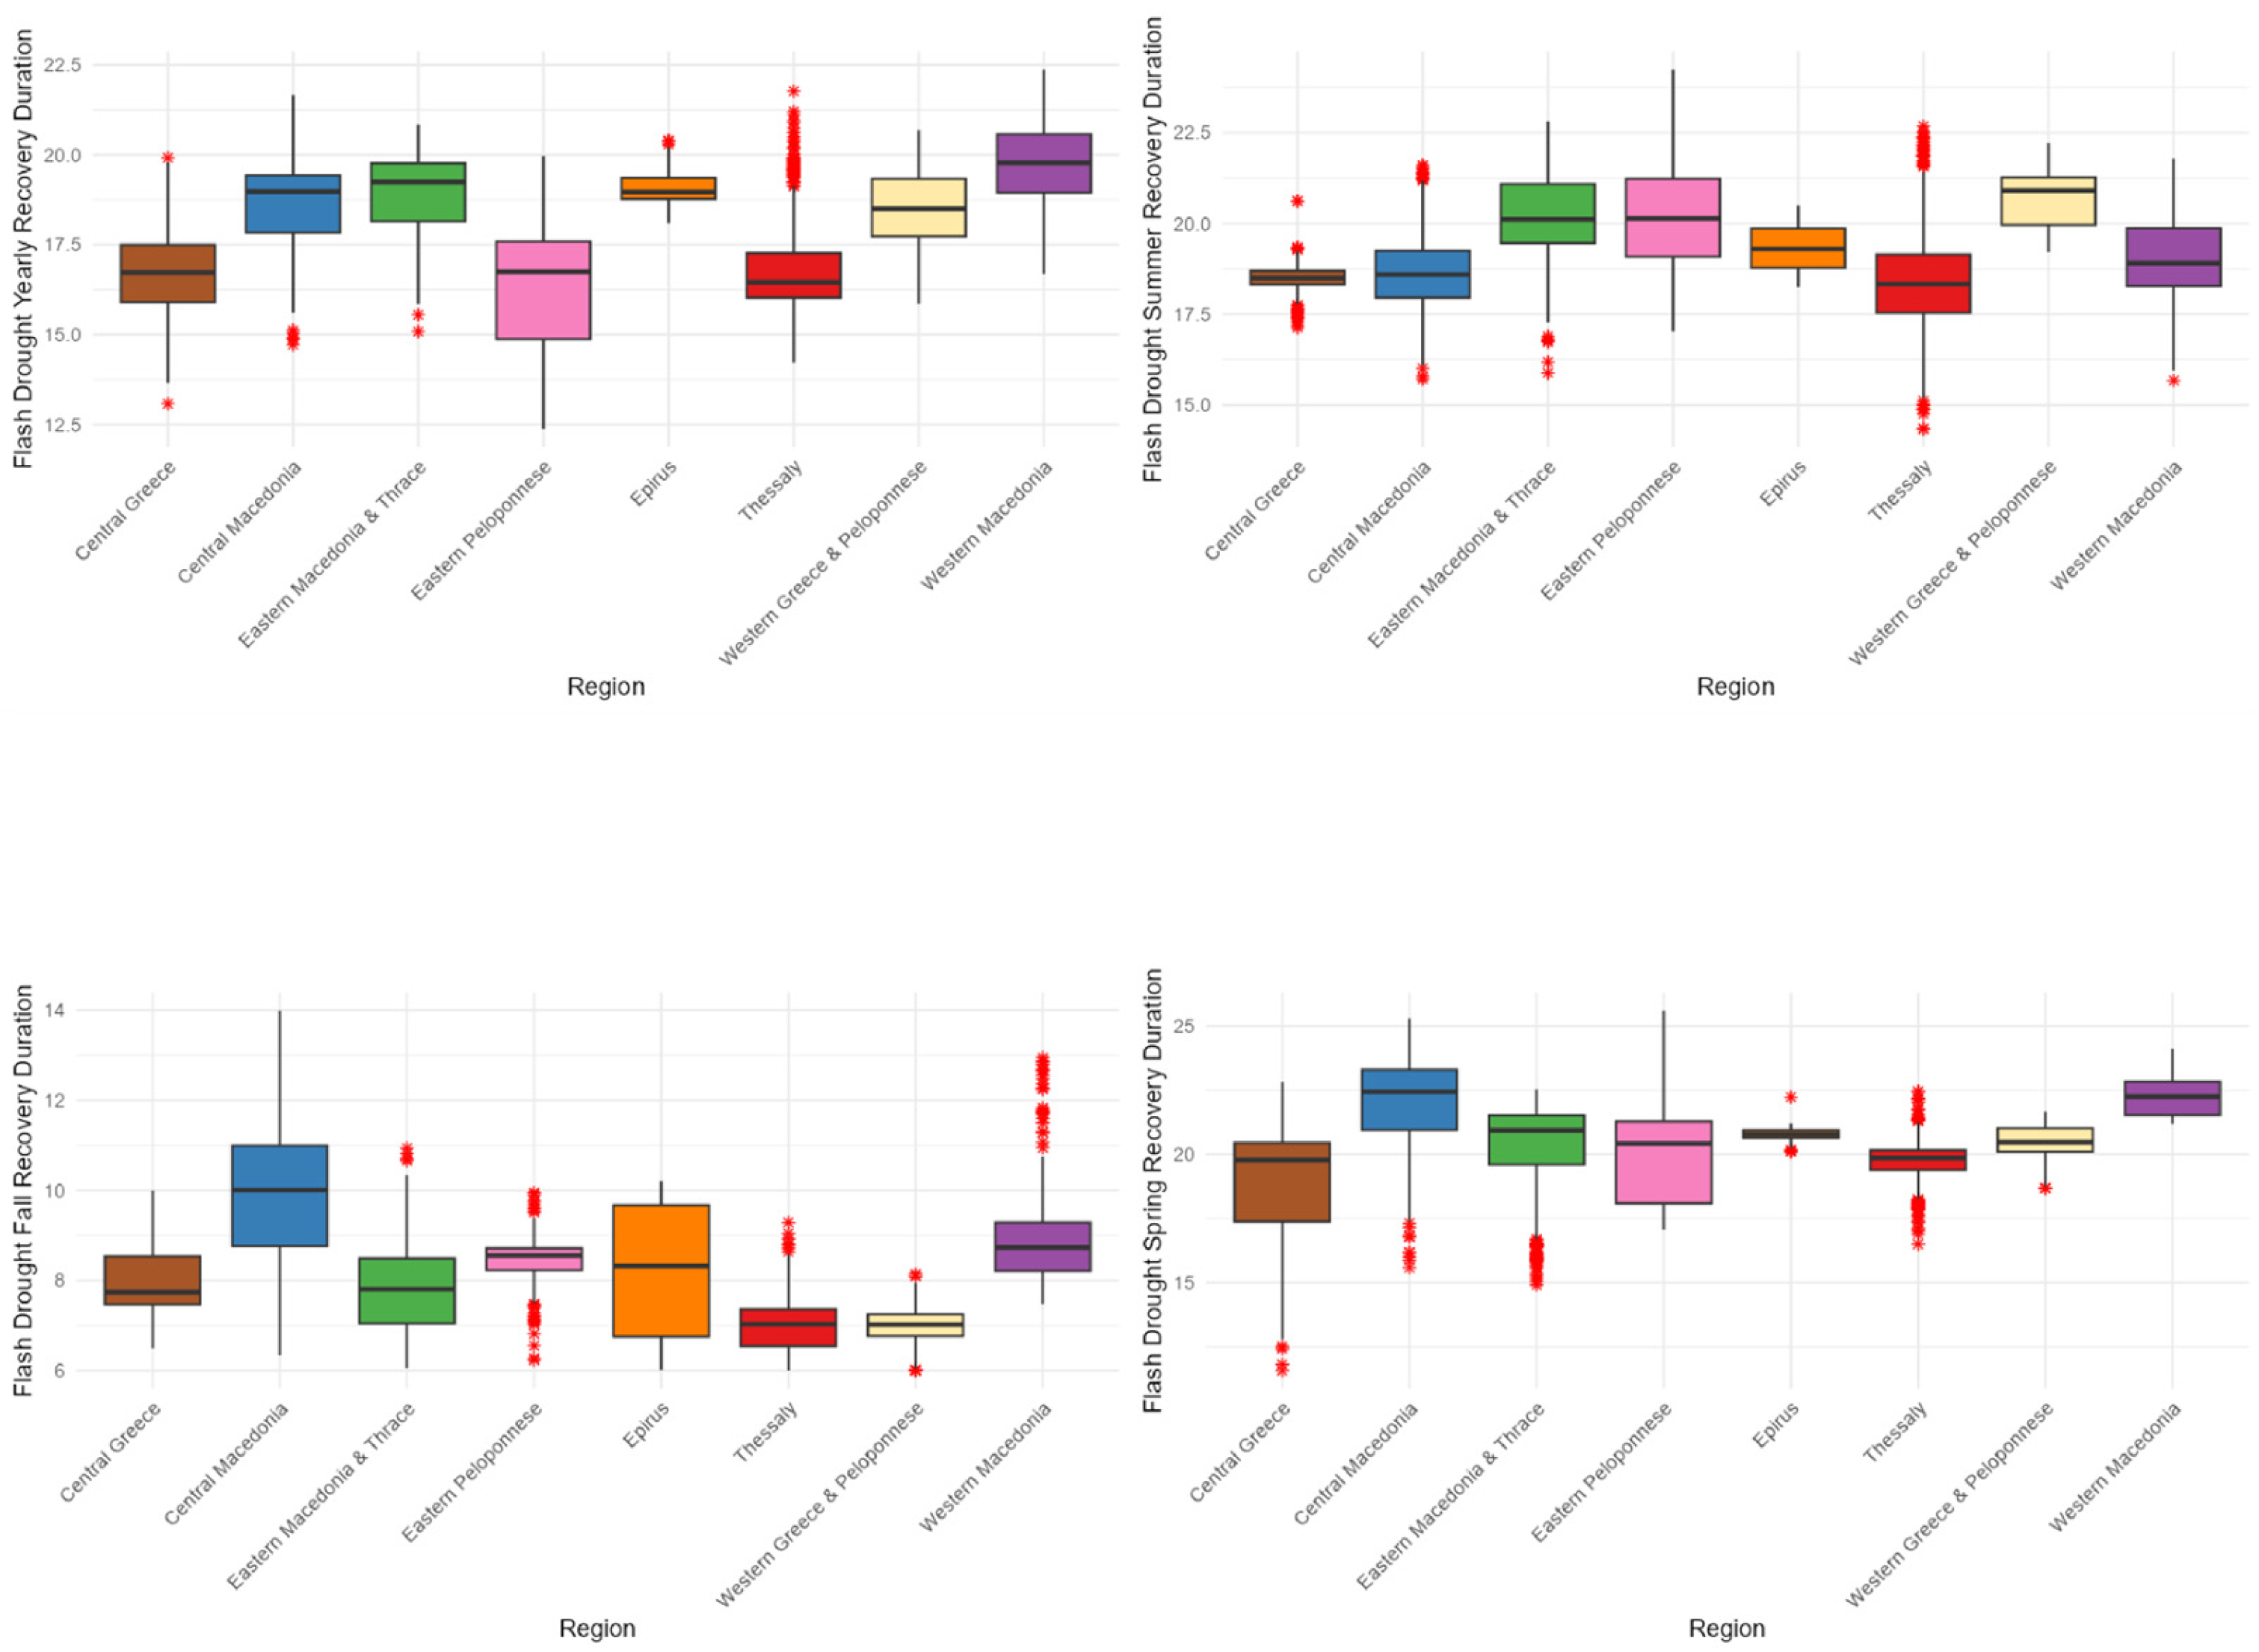
The boxplots of time until areas recover from flash droughts indicate significant differences in time required for recovery for various regions in Greece and at various seasons (Figure 17). Western Macedonia and Western Peloponnese record the longest recovery periods each year, at approximately 20–22 days and reaching over 25 days, mainly in spring and fall. Eastern Macedonia and Thrace also recovers for longer periods, at approximately yearly means of 18–20 days and occasionally reaching over 22 days. In contrast, Central Greece, Thessaly, and Epirus predominantly record recovery periods that are relatively lower, often at around 12–15 days or less, and summer records the lowest recovery time, often under approximately 10 days in Central Greece. Spring is the season when recovery is slowest for the majority of regions, recording always higher than 15-day means, and specifically slow in East Macedonia, reaching over 20 days. Generally, western Greek regions recover more slowly than those in the center, recording significant differences in their capacity for recovery from and adaptability during it.

3.9. Correlation Analysis

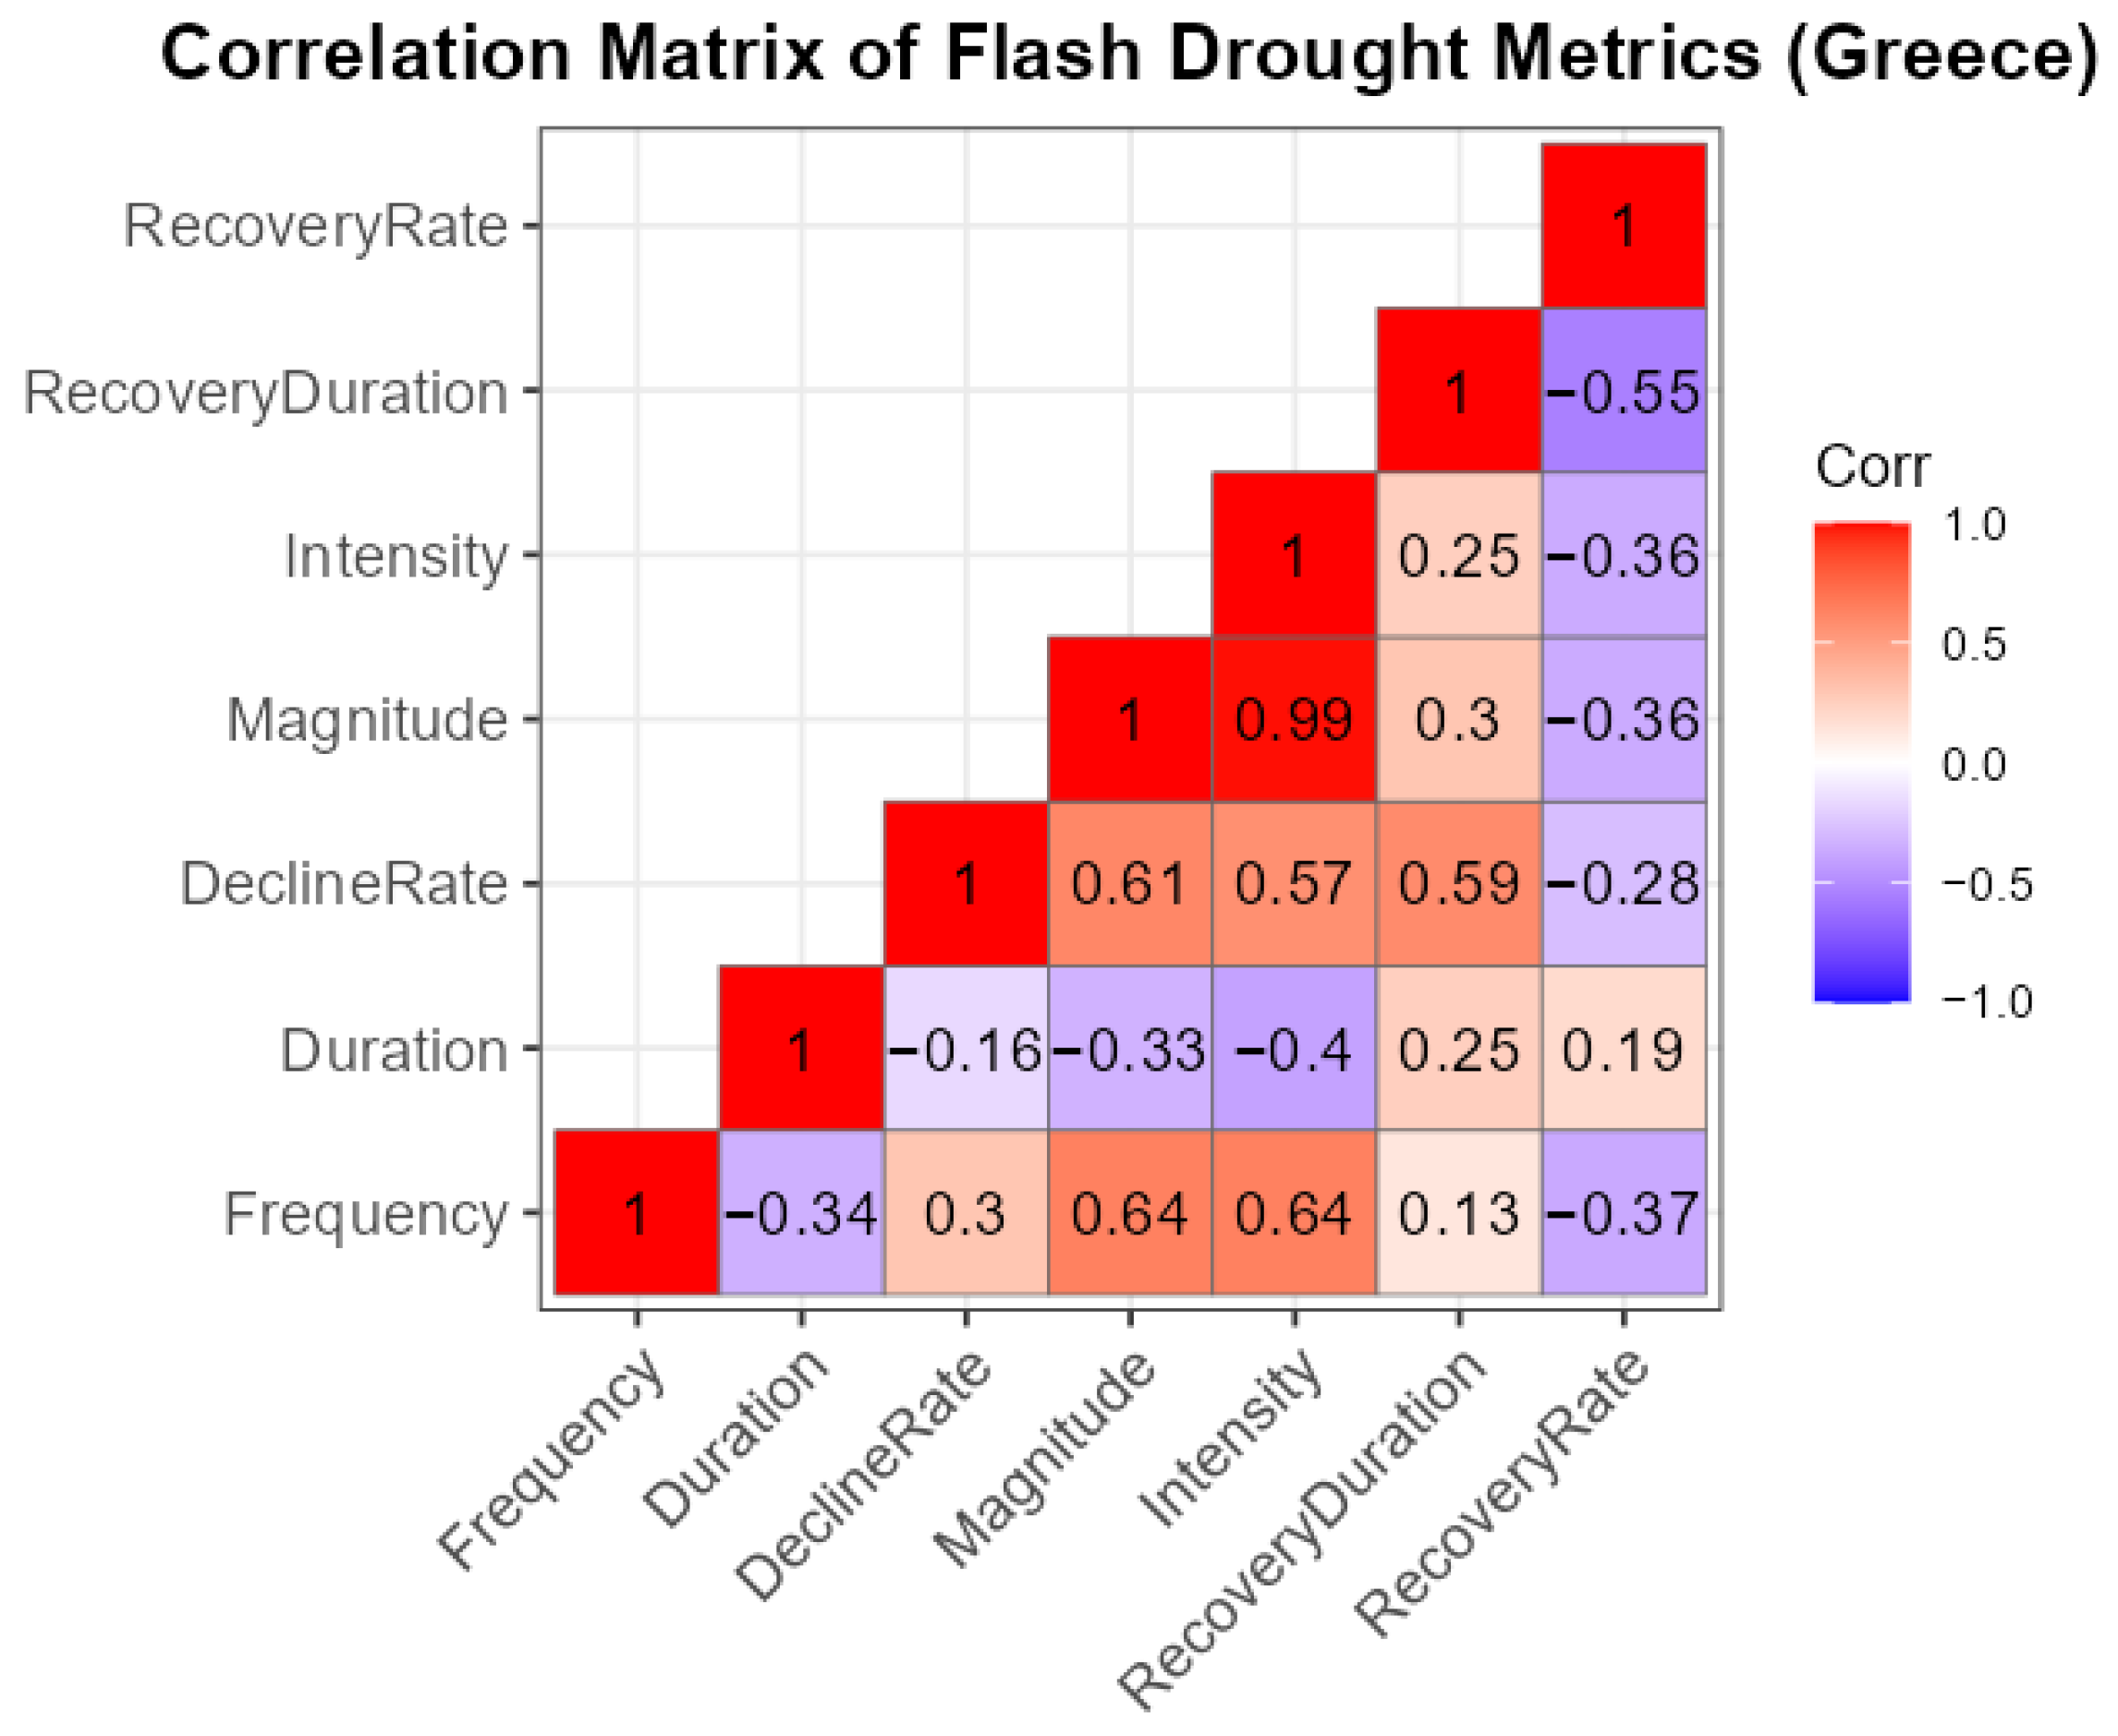
The correlation analysis between the flash drought parameters over Greece (Figure 18) reveals several strong interdependencies that highlight the mutually connected processes between drought onset and recovery. A highly significant positive correlation between magnitude and intensity (r = 0.99) exists, indicating that more intensive flash droughts are always accompanied by larger overall soil moisture depletion. Furthermore, the parameters also display moderate to strong positive correlations with decline rate (r = 0.57–0.61), suggesting that quickly developed droughts tend to accumulate larger deficits and display increased intensity. Frequency also reveals moderate positive correlations with magnitude and intensity (r ≈ 0.64), suggesting that areas prone to more frequent flash droughts are also prone to more pronounced soil moisture exceptions. However, recovery rate is negatively correlated with most onset-related parameters (r = −0.36 to −0.40), suggesting that more intensive and more quickly initiated droughts tend to recover more slowly. The opposite association between recovery rate and recovery duration (r = −0.55) further suggests that long durations display slower soil moisture replenishment. Indeed, duration is characterized by weak correlations with the majority of parameters (|r| < 0.4), suggesting that the flash drought duration has little effect on its magnitude and intensity. Taken together, these correlations reveal an asymmetric dynamic between the processes of drought onset and recovery processes where quick acceleration events tend to be accompanied by long and slowly progressing replenishment processes—the pattern consistent with the hydroclimatic characteristics typical to the Mediterranean region.

4. Discussion

It is a well-known obstacle that existing drought monitoring tools are struggling to cope with capturing the rapid evolution of flash droughts, as they are designed for traditional, slow-developing drought phenomena [11]. Consequently, enhancing our comprehension of the flash drought phenomena at a country-level through the spatiotemporal distribution of their characteristics is an essential step in order to build a stable foundation for future research. A plethora of studies have been conducted around the globe, indicating the causes, drivers and correlation of flash drought events through different methodologies and definitions [8,10,11,18,53].
Europe has been on an increasing frequency of flash droughts amid the recent warming. It is especially noticeable in the central European and Mediterranean regions, which demonstrate an increasing percentage in drought-affected areas over recent decades, ranging from nearly 5–8% of the total area in the 1980s to almost 12–25% in the 2010s [10]. As noted, only a few studies explored the flash drought events in the Mediterranean region (Spain), and it is an urgent call for more additions, as this phenomenon tends to increase its presence around the region [39,40].
Our study solely focuses on the country of Greece. As agriculture is vital for the country, there is a necessity for exploring the spatiotemporal distribution of flash drought phenomena. This research highlights the spatiotemporal distribution of flash drought characteristics in the country of Greece during the 1990–2024 period using the ERA5 soil moisture (0–100 cm) data based on the established methods and criteria. Additionally, research has been conducted on yearly and seasonal flash drought changes rather than during the growing season. Furthermore, this study focuses on creating an empirical map of flash drought categories based on the decline and recovery rates of these events. Among the main findings, Central Macedonia, Central Greece and Thessaly stand out as regions with the highest frequency of flash droughts, revealing a persistent vulnerability to short spells of moisture shortage [54,55]. The high susceptibility of Thessaly is especially relevant considering it is one of the most important agricultural hubs, where intensive irrigation activities may further enhance and be negatively impacted by such dry spells [55]. On the contrary, the lowest incidence rates are found in Western and Eastern Peloponnese and Epirus, revealing a lesser but not insignificant degree of risk. Regarding the duration of drought events, Western Greece and Peloponnese and Epirus have consistently long events, which last for more than 40 days, especially in the spring season, along with Western and Central Macedonia and Eastern Macedonia and Thrace. This trend suggests a high likelihood of agricultural and environmental stress for these areas. Interestingly, Central and Western Macedonia experience exceptionally long spring droughts, suggesting a local season responsiveness. In comparison, areas like Thessaly and Central Greece experience shorter, more stable drought durations, which may suggest relatively lower stress—although this may not be so if these events are accompanied by high severity or intensity. The declining rate is high in most districts of the country, especially in summer. It means that soil moisture in both regions can drop sharply, with increased danger to crops, especially if not tempered by well-timed irrigation. Eastern Peloponnese consistently experiences lower decline rates, allowing more lead time for drought mitigation. Recovery rate outputs reveal another important aspect of resilience. Not only do Western Greece and Peloponnese and Eastern Peloponnese face extreme droughts, but they also have relatively high recovery rates—meaning that after a drought, precipitation or irrigation helps them recover quickly. In contrast, Thessaly, Eastern Macedonia and Thrace, and Central Greece are slower to recover, especially in the spring, reflecting an ongoing shortage of water and less efficient resilience mechanisms. These slower recovery pathways enhance risk for more prolonged agricultural and hydrological effects. Lastly, the recovery time discloses a rather concerning perspective: Western and Central Macedonia and Eastern Macedonia and Thrace present the longest post-drought recovery times, both over 100 days per year, with spring events persisting over 100 days. Thessaly also records significant recovery times with extreme outliers, which can be explained by the excessive irrigation that takes place. However, Central Greece, Thessaly and Eastern Peloponnese experience shorter recoveries—particularly in fall—due to the aforementioned irrigation practices and the rainfall patterns that dominate western Greece during fall.
A key contribution of this research is based on the generation of an empirical map of flash drought categories across Greece, classified according to their decline and recovery rates. As shown in Figure 10, flash drought events were categorized into three distinct classes (Table 1):
  • Critical Flash Drought (green): Denoting severe decline rates with long recovery periods
  • Mild Persistent Drought (yellow): Characterized by a gradual decline rate and prolonged drought conditions.
  • Mild Fast Recovery (brown): Reflects moderate drought severity followed by a rapid recovery rate.
This classification reflects the heterogeneity of drought regimes over the Greek terrain and offers practical implications for adaptation strategies at the regional level. Interestingly, extensive regions in northern and central Greece, along with portions of the Peloponnese and Crete, were found to exhibit high frequencies of mild fast-recovery flash droughts. By contrast, Intense but Recovering events were found to be localized in specific regions of western Greece and the southern mainland, implying susceptibility to rapid-onset but short-lived drought occurrences. Furthermore, the region of Thessaly, the agricultural heartland of the country, is mainly dominated by mild flash drought with fast recovery, with some parts showing persistence of these events, while others are characterized by intense phenomena. This can be explained by the extensive irrigation practices and raises concerns for the water use policies. Critical Flash Drought areas are found in parts of Central Macedonia, showing the need for action and monitoring since these areas are also vital for the economy and food security of northern Greece. By intersecting conventional drought indices with the dynamics of flash drought initiation and termination, this research presents a more detailed conceptualization of flash droughts. Empirical classification and spatialization put forward in this research can be a valuable tool for stakeholders working on climate resilience, water resources management, and agricultural planning.
The outcomes of this research align directly with several UN Sustainable Development Goals, particularly SDG 2 (Zero Hunger), SDG 6 (Clean Water and Sanitation), and SDG 13 (Climate Action). By mapping flash drought frequency, duration, and recovery dynamics, this study provides evidence essential for supporting sustainable agricultural practices and efficient water resource allocation in drought-prone regions of Greece. These insights can guide the optimization of irrigation scheduling, early warning systems, and drought contingency planning, which are integral to enhancing national water and food security. Furthermore, the findings complement ongoing European and national frameworks, including the EU Common Agricultural Policy (CAP)—which promotes sustainable farming and climate-resilient rural development—and Greece’s National Recovery and Resilience Plan (NRRP), which emphasizes climate adaptation, efficient irrigation networks, and digital monitoring of natural resources. Integrating flash drought metrics into these policy instruments could strengthen regional drought preparedness, promote data-driven decision-making, and enhance long-term resilience of the Greek agricultural sector under intensifying climate variability. Although this study provides a comprehensive spatiotemporal analysis of Greek flash droughts, it faces certain constraints in the data used as input for this analysis. The key constraint of this study is the utilization of ERA5-Land soil moisture data, as this is a reanalysis dataset, which may not accurately portray Greek local conditions, as characterized by complex topography, contributing to possible bias in this study’s dataset. One of the critical issues associated with testing this study’s results is the scarcity of ground truth soil moisture data, which is currently sparse in Greece, making it difficult to accurately validate the actual soil moisture conditions in Greece. Moreover, examining the results, which portray the impacts of Greek flash droughts, is challenging because of the crop yield data, which is measured in terms of high frequency. Future research will focus on impacts on agriculture, enhance the resolution utilizing remote sensing data and overcome complex terrain obstacles. Generally, this study provides a stepping stone towards the ongoing development of flash drought definitions and regionally tailored early warning and response systems within Mediterranean climates.

5. Conclusions

This study offers a comprehensive analysis of the evolution of flash droughts in Greece from 1990 to 2024, using ERA5 soil moisture and a refined classification method incorporating decline and recovery metrics. The findings reveal unique patterns in the way flash droughts evolve in different areas. Thessaly and Central Greece are important areas due to their high frequency and slow recovery, sluggishly, especially during spring. Classification into three classes—Critical Flash Drought, Mild Persistent Drought, and Mild Fast Recovery—suggests the various states of drought throughout the country and emphasizes the significance of severity and capacity to recover while taking into account the impacts of drought. Central Macedonia experiences rapid and intense events, while significant agricultural areas like Thessaly and Eastern Macedonia and Thrace show persistent and slow recovery conditions, thus introducing risk for agriculture. Practical mapping and classification of droughts provide useful tools for the creation of specific early warning systems, adaptive water policies, and regional farming strategies. The correlation analysis indicated that the average coupling for Greece tends to be strong for magnitude, intensity, and decline rate, suggesting that rapidly evolving events are also more intense and profound with respect to soil moisture losses. In addition, the negative correlation for the rate of recovery and onset-related metrics highlights the fact that intense flash droughts are slow to recover, underscoring the asymmetric nature of the onset and recovery processes for Mediterranean climatic regions. However, there are a few limitations in this study, such as including no in situ validation of soil moisture over land, ERA5-Land’s relatively coarse spatial scales for field-scale studies, and no crop- or irrigation-specific datasets. Future studies will entail assimilating in situ and satellite data (e.g., ASCAT, SMAP), formulating flash drought indicators that are crop-sensitive, and linking flash drought dynamics with agricultural productivity as well as irrigation modeling for increased practical application. This research is critical and fundamental for improving flash drought mitigation plans in Mediterranean climates under the veil of climate change. Further research could support the Hellenic Legislation Framework, according to the auspices of WFD 2000/60, and be more specific and focused on any one of the 14 Water Districts of Greece, contributing to the optimum management of Water Resources, according to the various allocations, uses and unequal time and space distribution of supply and demand.

Author Contributions

Conceptualization, E.L.; Methodology, E.L.; Validation, E.F., O.T., S.K. and A.P.; Formal analysis, E.L.; Investigation, A.P.; Writing—original draft, E.L.; Writing—review & editing, E.F., O.T., S.K. and A.P. All authors have read and agreed to the published version of the manuscript.

Funding

This research received no external funding.

Data Availability Statement

These data were derived from the following resources available in the public domain: Copernicus Climate Change Service (C3S)(2019): ERA5-Land hourly data from 1950 to present. Copernicus Climate Change Service (C3S) Climate Data Store (CDS). https://doi.org/10.24381/cds.e2161bac.

Conflicts of Interest

The authors declare no conflict of interest.

References

  1. Orimoloye, I.R.; Belle, J.A.; Orimoloye, Y.M.; Olusola, A.O.; Ololade, O.O. Drought: A Common Environmental Disaster. Atmosphere 2022, 13, 111. [Google Scholar] [CrossRef]
  2. Mishra, A.K.; Singh, V.P. A review of drought concepts. J. Hydrol. 2010, 391, 202–216. [Google Scholar] [CrossRef]
  3. Wilhite, D.A.; Glantz, M.H. Understanding: The Drought Phenomenon: The Role of Definitions. Water Int. 1985, 10, 111–120. [Google Scholar] [CrossRef]
  4. Spinoni, J.; Barbosa, P.; Bucchignani, E.; Cassano, J.; Cavazos, T.; Christensen, J.H.; Christensen, O.B.; Coppola, E.; Evans, J.; Geyer, B.; et al. Future Global Meteorological Drought Hot Spots: A Study Based on CORDEX Data. J. Clim. 2020, 33, 3635–3661. [Google Scholar] [CrossRef]
  5. Svoboda, M.; LeComte, D.; Hayes, M.; Heim, R.; Gleason, K.; Angel, J.; Rippey, B.; Tinker, R.; Palecki, M.; Stooksbury, D.; et al. THE DROUGHT MONITOR. Bull. Am. Meteorol. Soc. 2002, 83, 1181–1190. [Google Scholar] [CrossRef]
  6. Christian, J.I.; Basara, J.B.; Hunt, E.D.; Otkin, J.A.; Furtado, J.C.; Mishra, V.; Xiao, X.; Randall, R.M. Global distribution, trends, and drivers of flash drought occurrence. Nat. Commun. 2021, 12, 6330. [Google Scholar] [CrossRef]
  7. Lovino, M.A.; Pierrestegui, M.J.; Müller, O.V.; Müller, G.V.; Berbery, E.H. The prevalent life cycle of agricultural flash droughts. npj Clim. Atmos. Sci. 2024, 7, 73. [Google Scholar] [CrossRef]
  8. Ford, T.W.; Labosier, C.F. Meteorological conditions associated with the onset of flash drought in the Eastern United States. Agric. For. Meteorol. 2017, 247, 414–423. [Google Scholar] [CrossRef]
  9. Svoboda, M. Changing the Slow Onset Mentality of Drought: A Case Study of Flash Drought in the United States and the Northern Plains. United Nations Office for Disaster Risk Reduction (UNDRR). 29 October 2024. Available online: https://www.preventionweb.net/resource/case-study/changing-slow-onset-mentality-drought-case-study-flash-drought-united-states (accessed on 1 January 2025).
  10. Shah, J.; Kumar, R.; Samaniego, L.; Markonis, Y.; Hanel, M.; Attinger, S.; Hari, V.; Rakovec, O. On the role of antecedent meteorological conditions on flash drought initialization in Europe. Environ. Res. Lett. 2023, 18, 064039. [Google Scholar] [CrossRef]
  11. Otkin, J.A.; Svoboda, M.; Hunt, E.D.; Ford, T.W.; Anderson, M.C.; Hain, C.; Basara, J.B. Flash Droughts: A Review and Assessment of the Challenges Imposed by Rapid-Onset Droughts in the United States. Bull. Am. Meteorol. Soc. 2018, 99, 911–919. [Google Scholar] [CrossRef]
  12. Yuan, X.; Wang, Y.; Ji, P.; Wu, P.; Sheffield, J.; Otkin, J.A. A global transition to flash droughts under climate change. Science 2023, 380, 187–191. [Google Scholar] [CrossRef]
  13. Pendergrass, A.G.; Meehl, G.A.; Pulwarty, R.; Hobbins, M.; Hoell, A.; AghaKouchak, A.; Bonfils, C.J.W.; Gallant, A.J.E.; Hoerling, M.; Hoffmann, D.; et al. Flash droughts present a new challenge for subseasonal-to-seasonal prediction. Nat. Clim. Change 2020, 10, 191–199. [Google Scholar] [CrossRef]
  14. NOAA/National Integrated Drought Information System; Lisonbee, J.; Woloszyn, M.; Skumanich, M. Making sense of flash drought: Definitions, indicators, and where we go from here. J. Appl. Serv. Climatol. 2021, 2021, 1–19. [Google Scholar] [CrossRef]
  15. Chen, L.G.; Gottschalck, J.; Hartman, A.; Miskus, D.; Tinker, R.; Artusa, A. Flash Drought Characteristics Based on U.S. Drought Monitor. Atmosphere 2019, 10, 498. [Google Scholar] [CrossRef]
  16. Christian, J.I.; Basara, J.B.; Otkin, J.A.; Hunt, E.D. Regional characteristics of flash droughts across the United States. Environ. Res. Commun. 2019, 1, 125004. [Google Scholar] [CrossRef]
  17. Walker, D.W.; Vergopolan, N.; Cavalcante, L.; Smith, K.H.; Agoungbome, S.M.D.; Almagro, A.; Apurv, T.; Dahal, N.M.; Hoffmann, D.; Singh, V.; et al. Flash Drought Typologies and Societal Impacts: A Worldwide Review of Occurrence, Nomenclature, and Experiences of Local Populations. Weather Clim. Soc. 2024, 16, 3–28. [Google Scholar] [CrossRef]
  18. Otkin, J.A.; Zhong, Y.; Hunt, E.D.; Christian, J.I.; Basara, J.B.; Nguyen, H.; Wheeler, M.C.; Ford, T.W.; Hoell, A.; Svoboda, M.; et al. Development of a Flash Drought Intensity Index. Atmosphere 2021, 12, 741. [Google Scholar] [CrossRef]
  19. Yuan, X.; Wang, L.; Wu, P.; Ji, P.; Sheffield, J.; Zhang, M. Anthropogenic shift towards higher risk of flash drought over China. Nat. Commun. 2019, 10, 4661. [Google Scholar] [CrossRef]
  20. Otkin, J.A.; Anderson, M.C.; Hain, C.; Mladenova, I.E.; Basara, J.B.; Svoboda, M. Examining Rapid Onset Drought Development Using the Thermal Infrared–Based Evaporative Stress Index. J. Hydrometeorol. 2013, 14, 1057–1074. [Google Scholar] [CrossRef]
  21. Li, J.; Wang, Z.; Wu, X.; Chen, J.; Guo, S.; Zhang, Z. A new framework for tracking flash drought events in space and time. CATENA 2020, 194, 104763. [Google Scholar] [CrossRef]
  22. Lesinger, K.; Tian, D. Trends, Variability, and Drivers of Flash Droughts in the Contiguous United States. Water Resour. Res. 2022, 58, e2022WR032186. [Google Scholar] [CrossRef]
  23. Hunt, E.D.; Hubbard, K.G.; Wilhite, D.A.; Arkebauer, T.J.; Dutcher, A.L. The development and evaluation of a soil moisture index. Int. J. Climatol. 2009, 29, 747–759. [Google Scholar] [CrossRef]
  24. Mo, K.C.; Lettenmaier, D.P. Heat wave flash droughts in decline. Geophys. Res. Lett. 2015, 42, 2823–2829. [Google Scholar] [CrossRef]
  25. Mo, K.C.; Lettenmaier, D.P. Precipitation Deficit Flash Droughts over the United States. J. Hydrometeorol. 2016, 17, 1169–1184. [Google Scholar] [CrossRef]
  26. He, M.; Kimball, J.S.; Yi, Y.; Running, S.; Guan, K.; Jensco, K.; Maxwell, B.; Maneta, M. Impacts of the 2017 flash drought in the US Northern plains informed by satellite-based evapotranspiration and solar-induced fluorescence. Environ. Res. Lett. 2019, 14, 074019. [Google Scholar] [CrossRef]
  27. Schwalm, C.R.; Anderegg, W.R.L.; Michalak, A.M.; Fisher, J.B.; Biondi, F.; Koch, G.; Litvak, M.; Ogle, K.; Shaw, J.D.; Wolf, A.; et al. Global patterns of drought recovery. Nature 2017, 548, 202–205. [Google Scholar] [CrossRef]
  28. Singh, R.; Mishra, V. Atmospheric and Land Drivers of Streamflow Flash Droughts in India. J. Geophys. Res. Atmos. 2024, 129, e2023JD040257. [Google Scholar] [CrossRef]
  29. Zhang, Y.; You, Q.; Mao, G.; Chen, C.; Li, X.; Yu, J. Flash Drought Characteristics by Different Severities in Humid Subtropical Basins: A Case Study in the Gan River Basin, China. J. Clim. 2021, 34, 7337–7357. [Google Scholar] [CrossRef]
  30. Jin, C.; Luo, X.; Xiao, X.; Dong, J.; Li, X.; Yang, J.; Zhao, D. The 2012 Flash Drought Threatened US Midwest Agroecosystems. Chin. Geogr. Sci. 2019, 29, 768–783. [Google Scholar] [CrossRef]
  31. Wang, L.; Yuan, X. Two Types of Flash Drought and Their Connections with Seasonal Drought. Adv. Atmos. Sci. 2018, 35, 1478–1490. [Google Scholar] [CrossRef]
  32. Zhong, L.; Chen, B.; Wu, C.; Yeh, P.J.-F.; Li, J.; Lv, W.; Zhao, J.; Zhou, J. Identification and risk assessment of flash drought in the Pearl River basin based on the Standardized Evaporative Stress Ratio. Theor. Appl. Climatol. 2022, 150, 1513–1529. [Google Scholar] [CrossRef]
  33. Parker, T.; Gallant, A.; Hobbins, M.; Hoffmann, D. Flash drought in Australia and its relationship to evaporative demand. Environ. Res. Lett. 2021, 16, 064033. [Google Scholar] [CrossRef]
  34. Rakkasagi, S.; Poonia, V.; Goyal, M.K. Flash drought as a new climate threat: Drought indices, insights from a study in India and implications for future research. J. Water Clim. Change 2023, 14, 3368–3384. [Google Scholar] [CrossRef]
  35. Barbosa, H.A. Flash Drought and Its Characteristics in Northeastern South America during 2004–2022 Using Satellite-Based Products. Atmosphere 2023, 14, 1629. [Google Scholar] [CrossRef]
  36. Řehoř, J.; Brázdil, R.; Trnka, M.; Balek, J. Flash droughts in Central Europe and their circulation drivers. Clim. Dyn. 2024, 62, 1107–1121. [Google Scholar] [CrossRef]
  37. Wang, M.; Menzel, L.; Jiang, S.; Ren, L.; Xu, C.-Y.; Cui, H. Evaluation of flash drought under the impact of heat wave events in southwestern Germany. Sci. Total Environ. 2023, 904, 166815. [Google Scholar] [CrossRef]
  38. Noguera, I.; Hannaford, J.; Tanguy, M. Distribution, trends, and drivers of flash droughts in the United Kingdom. Hydrol. Earth Syst. Sci. 2025, 29, 1295–1317. [Google Scholar] [CrossRef]
  39. Noguera, I.; Domínguez-Castro, F.; Vicente-Serrano, S.M. Characteristics and trends of flash droughts in Spain, 1961–2018. Ann. N. Y. Acad. Sci. 2020, 1472, 155–172. [Google Scholar] [CrossRef] [PubMed]
  40. Noguera, I.; Domínguez-Castro, F.; Vicente-Serrano, S.M.; García-Herrera, R.; Garrido-Pérez, J.M.; Trigo, R.M.; Sousa, P.M. Unravelling the atmospheric dynamics involved in flash drought development over Spain. Int. J. Climatol. 2024, 44, 4478–4494. [Google Scholar] [CrossRef]
  41. Kourgialas, N.N. A critical review of water resources in Greece: The key role of agricultural adaptation to climate-water effects. Sci. Total Environ. 2021, 775, 145857. [Google Scholar] [CrossRef] [PubMed]
  42. Kourgialas, N.N. Hydroclimatic impact on mediterranean tree crops area—Mapping hydrological extremes (drought/flood) prone parcels. J. Hydrol. 2021, 596, 125684. [Google Scholar] [CrossRef]
  43. Vasilakou, C.; Tsesmelis, D.E.; Kalogeropoulos, K.; Barouchas, P.E.; Machairas, I.; Feloni, E.G.; Tsatsaris, A.; Karavitis, C.A. Assessing Drought Severity in Greece Using Geospatial Data and Environmental Indices. Geomatics 2025, 5, 10. [Google Scholar] [CrossRef]
  44. Loukas, A.; Vasiliades, L.; Dalezios, N.R. Hydroclimatic Variability of Regional Droughts in Greece Using the Palmer Moisture Anomaly Index. Hydrol. Res. 2002, 33, 425–442. [Google Scholar] [CrossRef]
  45. Livada, I.; Assimakopoulos, V.D. Spatial and temporal analysis of drought in greece using the Standardized Precipitation Index (SPI). Theor. Appl. Climatol. 2007, 89, 143–153. [Google Scholar] [CrossRef]
  46. Kalamaras, N.; Michalopoulou, H.; Byun, H.R. Detection of drought events in Greece using daily precipitation. Hydrol. Res. 2010, 41, 126–133. [Google Scholar] [CrossRef]
  47. Karavitis, C.A.; Alexandris, S.; Tsesmelis, D.E.; Athanasopoulos, G. Application of the Standardized Precipitation Index (SPI) in Greece. Water 2011, 3, 787–805. [Google Scholar] [CrossRef]
  48. Politi, N.; Vlachogiannis, D.; Sfetsos, A.; Nastos, P.T.; Dalezios, N.R. High Resolution Future Projections of Drought Characteristics in Greece Based on SPI and SPEI Indices. Atmosphere 2022, 13, 1468. [Google Scholar] [CrossRef]
  49. Loukas, A.; Vasiliades, L. Probabilistic analysis of drought spatiotemporal characteristics inThessaly region, Greece. Nat. Hazards Earth Syst. Sci. 2004, 4, 719–731. [Google Scholar] [CrossRef]
  50. Sakellariou, S.; Spiliotopoulos, M.; Alpanakis, N.; Faraslis, I.; Sidiropoulos, P.; Tziatzios, G.A.; Karoutsos, G.; Dalezios, N.R.; Dercas, N. Spatiotemporal Drought Assessment Based on Gridded Standardized Precipitation Index (SPI) in Vulnerable Agroecosystems. Sustainability 2024, 16, 1240. [Google Scholar] [CrossRef]
  51. Karamoutsou, L.; Psilovikos, A. Deep Learning in Water Resources Management: Τhe Case Study of Kastoria Lake in Greece. Water 2021, 13, 3364. [Google Scholar] [CrossRef]
  52. Muñoz-Sabater, J.; Dutra, E.; Agustí-Panareda, A.; Albergel, C.; Arduini, G.; Balsamo, G.; Boussetta, S.; Choulga, M.; Harrigan, S.; Hersbach, H.; et al. ERA5-Land: A state-of-the-art global reanalysis dataset for land applications. Earth Syst. Sci. Data 2021, 13, 4349–4383. [Google Scholar] [CrossRef]
  53. Zhang, S.; Li, M.; Ma, Z.; Jian, D.; Lv, M.; Yang, Q.; Duan, Y.; Amin, D. The intensification of flash droughts across China from 1981 to 2021. Clim. Dyn. 2024, 62, 1233–1247. [Google Scholar] [CrossRef]
  54. Leivadiotis, E.; Psilovikos, A. The characteristics of flash droughts across Thessaly, Central Greece, from 1990 to 2024. In Proceedings of the 13th World Congress on Water Resources and Environment (EWRA 2025): New Challenges in Understanding and Managing Water-Related Risks in a Changing Environment, Palermo, Italy, 24–28 June 2025. [Google Scholar]
  55. Psilovikos, A.; Leivadiotis, E.; Papathanasiou, T.; Sakellariou, S.; Alpanakis, N.; Spiliotopoulos, M.; Tziatzios, G.A.; Faraslis, I.; Dalezios, N.R. Spatiotemporal drought patterns and their impact on water resources: A case study of Thessaly, Greece. In Proceedings of the 13th World Congress on Water Resources and Environment (EWRA 2025): New Challenges in Understanding and Managing Water-Related Risks in a Changing Environment, Palermo, Italy, 24–28 June 2025. [Google Scholar]
Figure 1. Land use/Land cover map of Greece and administrative divisions (ESRI Inc., Redlands, CA, USA, 2021 Esri land Cover. Available online: https://www.arcgis.com/home/item.html?id=d6642f8a4f6d4685a24ae2dc0c73d4ac (accessed 1 on January 2025).
Land 14 02290 g001
Figure 2. Schematic representation of flash drought definition based on the percentile of soil water volumetric level (SWVL): onset, termination, decline and recovery rate.
Land 14 02290 g002
Figure 3. Spatial distribution of frequency of flash drought events.
Land 14 02290 g003
Figure 4. Spatial distribution of duration of flash drought events.
Land 14 02290 g004
Figure 5. Spatial distribution of the magnitude of flash drought events.
Land 14 02290 g005
Figure 6. Spatial distribution of intensity of flash droughts.
Land 14 02290 g006
Figure 7. Spatial distribution of decline rate of flash drought events.
Land 14 02290 g007
Figure 8. Spatial distribution of the recovery rate of flash droughts.
Land 14 02290 g008
Figure 9. Spatial distribution of recovery duration of flash droughts.
Land 14 02290 g009
Figure 10. Flash drought classes according to recovery and decline rate classification.
Land 14 02290 g010
Figure 11. Boxplot of frequency values per region (* represents outliers, defined as values exceeding 1.5 times the interquartile range above the third quartile or below the first quartile).
Land 14 02290 g011
Figure 12. Boxplot of duration values per region (* represents outliers, defined as values exceeding 1.5 times the interquartile range above the third quartile or below the first quartile).
Land 14 02290 g012
Figure 13. Boxplot of magnitude values per region (* represents outliers, defined as values exceeding 1.5 times the interquartile range above the third quartile or below the first quartile).
Land 14 02290 g013
Figure 14. Boxplot of intensity values per region (* represents outliers, defined as values exceeding 1.5 times the interquartile range above the third quartile or below the first quartile).
Land 14 02290 g014
Figure 15. Boxplot of decline rate values per region (* represents outliers, defined as values exceeding 1.5 times the interquartile range above the third quartile or below the first quartile).
Land 14 02290 g015
Figure 16. Boxplot of recovery rate values per region (* represents outliers, defined as values exceeding 1.5 times the interquartile range above the third quartile or below the first quartile).
Land 14 02290 g016
Figure 17. Boxplot of recovery duration values per region (* represents outliers, defined as values exceeding 1.5 times the interquartile range above the third quartile or below the first quartile).
Land 14 02290 g017
Figure 18. Correlation matrix of flash drought characteristics.
Land 14 02290 g018
Table 1. Flash drought classification based on decline and recovery rates.
Decline Rate (≥0.012/Day)Recovery Rate (≥0.009/Day)Drought Type
YesNoCritical Flash Drought
YesYesIntense but Recovering
NoNoMild Persistent Drought
NoYesMild Fast Recovery
Disclaimer/Publisher’s Note: The statements, opinions and data contained in all publications are solely those of the individual author(s) and contributor(s) and not of MDPI and/or the editor(s). MDPI and/or the editor(s) disclaim responsibility for any injury to people or property resulting from any ideas, methods, instructions or products referred to in the content.