Abstract
Urban green spaces have emerged as a key outdoor natural space supporting social interaction since the pandemic and lockdowns, and particularly benefit the health and well-being of the elderly and children amid global population aging. However, the challenges of socialization among multi-age groups and the influence of green space quality on these interactions remain insufficiently understood. To create healthy multi-age spaces, this study aimed to compare the associations between urban green space quality and social interaction among the elderly, children, and the general population. To achieve this, we adopted a UAV vision method, integrating the SOSIP protocol with a vision-based behavioral recognition model to capture outdoor social interactions across multiple age groups. Multilevel regression models were applied to analyze the hierarchical data structure and assess the contributions of different green space quality indicators, including green space size, facility, amenity, aesthetic features, maintenance and cleanliness, incivility, and overall quality. The findings indicated that overall green space quality is the most significant contributor in promoting social interaction, while maintenance and cleanliness appeared equally important to children and the general population. The presence of facilities and a larger green space size encourage informal encounters and facilitate collective activities only among the general population. However, aesthetic features and the number of amenities had limited effects on the social interactions of multi-age groups. These results suggest that how green space quality influences social interaction varies among different age groups. Accordingly, targeted green space quality enhancement strategies are proposed to support the planning of sustainable, healthy multi-age spaces that could balance the needs of both the elderly and younger populations.
1. Introduction
As the global urban population continues to grow, the percentage of the world’s aging population is projected to double from 11% to 22% by 2050, underscoring the urgent need to preserve the health and well-being of elderly residents amid rapid urbanization [1]. This demographic shift highlights significant challenges in ensuring that urban environments cater to the diverse needs of aging populations. The COVID-19 pandemic further emphasized the disparities in health needs among sociodemographic groups, particularly children and the elderly. Prolonged lockdowns and restrictions prompted an increasing number of urban residents to seek outdoor spaces for physical activity, mental well-being, and social connections [2,3,4,5,6,7,8]. These trends underscore the critical role of urban green spaces in supporting public health and fostering social interaction, particularly among vulnerable populations.
Social interaction has been widely recognized as a key determinant of public health. It enhances mental well-being, mitigates loneliness, reduces anxiety and stress, and lowers mortality risks by providing social support networks [9,10,11,12,13]. Urban green spaces provide a unique setting for fostering these interactions, enabling residents to build community ties and develop social capital [14,15,16,17,18]. Beyond promoting physical activity [19], green spaces offer restorative experiences and opportunities for meaningful social engagement, contributing to individual and community well-being.
The importance of urban green spaces extends beyond health benefits; they are crucial environments where social bonds are formed and sustained. Features such as landscaping, accessibility, and maintenance have been shown to influence social behaviors, particularly among the elderly and children [20,21,22]. For instance, older adults often prefer natural, tranquil environments for leisurely activities [23], while children are more attracted to dynamic recreational settings such as playgrounds that encourage active play and peer interaction [24]. Despite the growing body of research on specific age groups, relatively few studies have systematically compared the social interaction patterns of the elderly, children, and the general population within urban green spaces [25,26]. This research gap limits our ability to develop inclusive urban planning strategies that address the diverse needs of multi-age populations.
Moreover, existing research often highlights the divergent preferences of different age groups, further emphasizing the need for comparative studies. For example, while elderly individuals value quiet, aesthetically pleasing environments with well-maintained facilities [27,28], younger populations prioritize active spaces with interactive features [29,30]. These differences not only reflect varying needs but also suggest potential areas for conflict or compromise in urban green space design. Addressing these distinctions through comprehensive planning is essential to ensure equitable access and enjoyment for all demographic groups.
The quality and features of green spaces play a pivotal role in shaping socialization opportunities. Scholars have identified specific green space quality indicators, such as vegetation density, water bodies, and spatial layout, as factors that enhance social interaction across demographic groups [31,32,33,34,35,36]. However, demographic variations often lead to differing green space preferences and usage patterns, further complicating efforts to design spaces that cater to all age groups. Understanding these nuanced preferences is essential for developing effective, evidence-based planning strategies.
For elderly residents, due to the decrease in the elderly’s physical conditions and social lives, features such as a peaceful and relaxed setting and the presence of various amenities and facilities often provide opportunities for spontaneous social encounters [26], whereas children, who have more opportunities to be socially engaged in green spaces, are more drawn to a larger space or facilities like interactive areas, playgrounds, or an obstacle course; however, gender and age may have an impact on their specific preferences [29,37,38]. To address these distinctions, existing studies have proposed quality assessment frameworks for green spaces—such as green space size, facilities, amenities, maintenance, and ecological indicators—that capture the spatial, environmental, and social qualities of green spaces. These frameworks underscore how vegetation structure, maintenance, and overall quality directly shape opportunities for cross-generational interaction, thereby linking environmental features to social dynamics. Building on prior studies, our study chose facilities, amenities, aesthetic features, maintenance and cleanliness, and incivility as indicators for assessing green space quality [14,39,40,41,42]. These indicators provide a consolidated foundation for analyzing how different environmental features influence social interaction across demographic groups.
Emerging technologies provide new opportunities to study the relationship between green space quality and social interaction. Traditional methods, such as in situ observational audits and walk-along interviews, have been instrumental in capturing user experiences [39,42,43]. However, these approaches are often time-consuming and limited in scalability. Recent advancements, such as the use of unmanned aerial vehicles (UAVs), offer a more efficient alternative for collecting spatial and behavioral data. UAV-assisted protocols, including the System for Observing Play and Recreation in Communities (SOPARC), have been effectively used to assess green space usage and physical activity patterns [44]. Furthermore, studies have demonstrated the potential of UAVs to capture detailed, real-time observations of outdoor activities, enhancing the accuracy and reliability of social interaction assessments [45,46]. To provide a standardized measurement, the SOSIP (Systematically Assess Social Interaction in Urban Parks) protocol was developed to evaluate social interaction through systematic observation in the outdoor built environment [46]. However, the manual workload is heavy, with some errors during the data collection process being inevitable. These conditions have created difficulties and complexities in assessing people’s social interactions while classifying their apparent socio-demographic characteristics, such as age group [25,47]. Thus, the efficiency and accuracy of data collection and processing approaches needs to be advanced.
These technological innovations could not only streamline data collection but also enable more precise analysis of multi-demographic distinctions.
To address these research gaps, this study aims to examine the associations between green space quality and outdoor social interactions among the general population and specific age groups, including the elderly and children. By leveraging advanced UAV-based methods and integrating insights from the existing literature, this research seeks to refine measurement approaches and provide actionable recommendations for age-friendly urban planning. In the context of global aging trends and the lingering impacts of the pandemic, this study makes critical contributions to the development of sustainable strategies for creating inclusive, multi-generational urban green spaces. These findings have the potential to inform urban policies and designs that prioritize health, socialization, and equity for diverse populations.
2. Methods
2.1. Study Setting and Sample
Logan and North Logan city, both metropolitan areas of Cache County, Utah (UT), USA, were selected as the setting of the case study, with a total area of 25.4 square miles. The total population in Logan was 52,420, the total population in North Logan was 10,705, and the population density was 2930 and 1501 people per square mile in Logan City and North Logan [48]. According to the local Parks and Recreation office, there were a total of 47 green spaces in the setting, varying in size and function. Therefore, this site provided a diverse demographic composition, including substantial elderly and youth populations, and a diverse range of green spaces. These features allowed the study to align with the research question, particularly regarding how green space indicators influence intergenerational social interaction. To avoid data bias, small green spaces (less than 0.5 acres) and green spaces with limited functions were excluded. A total of 30 green spaces were selected for the study, including 28 green spaces in Logan City and 2 green spaces in North Logan City (Figure 1) (Table A1).
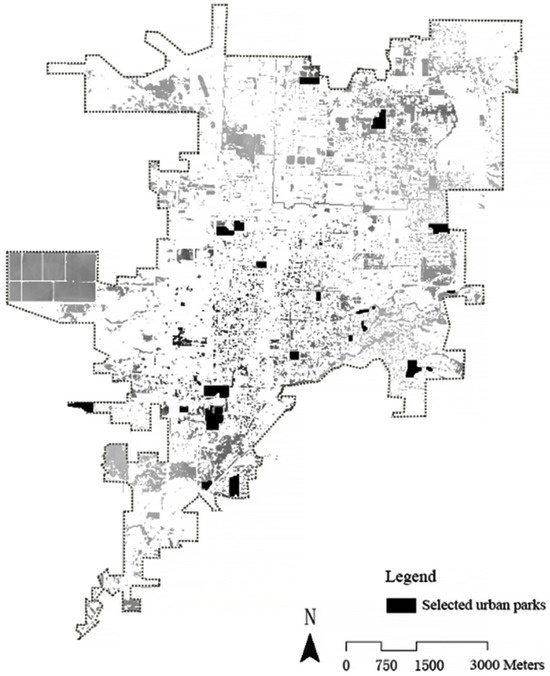
Figure 1.
Selected green spaces in Logan and North Logan, Utah, U.S.
2.2. Measurement of Social Interaction
The measurement of social interaction for specific age groups, serving as the Dependent Variable (DV), was based on the established SOSIP protocol [46]. This study integrated the UAV to collect images and applied vision-based behavioral recognition algorithms to optimize the SOSIP.
The behavioral data were obtained through observations of public activities using UAV recordings in urban parks, focusing only on participants’ apparent characteristics and behaviors, without capturing personally identifiable information. The study was reviewed and granted exemption by the Utah State University Institutional Review Board (Protocol #10783, 25 November 2019). All procedures complied with institutional ethical standards and the 1964 Helsinki Declaration and its later amendments.
2.2.1. UAV Image Acquisition
First, each sample green space was observed multiple times with the same frequency via UAV. During the data collection period, the UAV recorded the activities of green space users at least three days per week, including one weekday and both Saturday and Sunday, in each sample green space, to ensure image data was collected under consistent conditions. During the flight, the UAV was manually operated to fly through the predetermined waypoints, slowly passing through various areas of the sample green space to collect visual information of all individuals. Additionally, the date, time, weather, and temperature of the data collection day were recorded as significant control variables for the HLM to account for temporal and microclimatic differences during repeated observations.
2.2.2. Measurement of the Levels of Social Interactions with UAV Vision
Following the dual-stream framework of human activity recognition from UAV-captured video sequences [49], which processes both spatial (RGB) and temporal (optical flow) information, a behavioral recognition model incorporating a temporal segment network and feature fusion was established. The UAV-based object detection mechanism was defined as the UAV vision method in this study. SOSIP was selected as the foundational protocol to categorize the outdoor social interaction behaviors into six levels, using examples based on the activities observed in green spaces [45]. Each level was assigned a score ranging from 1 to 6 according to the SOSIP instruction (Table 1).

Table 1.
Classification of the social interaction in SOSIP.
According to the SOSIP, a deep learning temporal segment network model was constructed for a temporal segment network by incorporating various features of outdoor social behaviors (Table 1). The algorithm first detected individual and group entities in the UAV footage using an object detection module. Next, the images acquired by UAV were processed through the algorithm using the following steps: 1. RGB, optical flow, and sparse image data were input into the convolutional network, so the convolutional layer features of each data type could be extracted; 2. based on the low-level detailed information and high-level semantic information of the social interaction features learned by the model from SOSIP, the samples were classified and fused according to different sample types; 3. the social behaviors were assigned values using the SoftMax function, classifying both activity type and interaction intensity, and further grouped according to apparent demographic characteristics, including the elderly, children, and the general population (Figure 2).
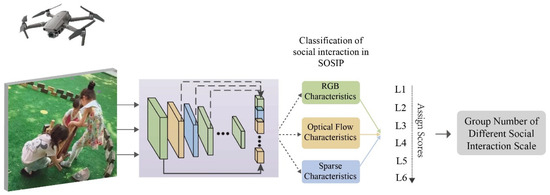
Figure 2.
The process of the temporal segment network model, distinguishing the levels and numbers of social interactions. Multiple convolutional layers (indicated by ellipsis) are omitted for clarity.
The data processing and model computation in this study emphasized the main steps of UAV-based behavioral recognition, including object detection, feature extraction, feature fusion, and classification. The computational workflow followed established techniques and frameworks in UAV vision and human activity recognition research [50,51,52]. The parameter configurations used in this study were maintained within the normal operational ranges, with learning rates typically between 0.001 and 0.01, batch sizes from 16 to 64, and validation accuracies generally exceeding 85%. Precision, recall, and F1 scores were within the standard performance range of 0.80–0.95, confirming that the computational outcomes were stable and reliable.
2.2.3. Calculation of Group Data
As the sample green spaces’ information was input into the established temporal segment network model, the social interactions among different age groups could be recognized. Furthermore, according to the SOSIP social interaction scale (L1 to L6, representing different assigned scores), the levels of each social interaction were classified. Simultaneously, the number of individuals corresponding to each level was extracted. Social interactions were quantitatively evaluated using Formula (1), shown below, where i is the coefficient for each group, and N is the number of individuals in each group.
SOSIP = ∑(SISUPi × Ni),
2.3. Urban Green Space Quality Assessment
The quality of the sample green spaces was selected as the Independent Variable (IV) in this study to assess urban green space quality. Based on a literature review of existing urban green space assessment tools, most tools measured environmental quality primarily from the perspective of whether physical activities were promoted [14,40,53,54,55,56]. The PARK (Parks, Activity, and Recreation among Kids) tool [57] was deemed a suitable tool for exploring the association between green space features and social interaction [46]. As certain green space features can indicate the quality of green spaces, the PARK tool was optimized based on the summary of relevant research and confirmed green space quality indicators in this study, including green space size [29,38], facilities [39,58], amenities, [39,41], aesthetic features (e.g., water features, decorative elements) [14,58], maintenance and cleanliness (e.g., the maintenance and cleanliness of swimming pools, toilets) [40], and incivility (e.g., safety measures, graffiti, and vandalism) [41,42]. All the separate green space indicators were summarized to indicate the overall green space quality. Each green space quality indicator was systematically audited and given a score. To validate the structure of these dimensions, a maximum likelihood factor analysis was conducted, showing that the extracted factors jointly explained over 80% of the total variance, which indicated a robust fit between the conceptual framework and the empirical data. The overall quality score of each park was then derived by summing the standardized values of the separated dimensions (Table 2). In addition to the park attributes, several control variables were included to account for contextual factors. Socioeconomic and neighborhood characteristics, including total population density, children population density, minority density, poverty density, unemployment rate, and renter rate, were obtained from the recent U.S. Census data. Incorporating these controls helps to isolate the effects of green space quality on social interaction and reduce potential confounding biases.
Table 2.
List of Independent Variables (IVs) and control variables and description.
Then, a preliminary experiment was conducted to evaluate both the subjective and objective attributes of the above-mentioned green space quality indicators as valid attributes of urban green space quality [40]. To ensure the reliability of subjective assessments, trained observers conducted a pilot evaluation of park quality following the standardized CPAT (Community Park Audit Tool) criteria. Using a 5-point Likert scale, inter-rater and test–retest consistency were examined through the Intraclass Correlation Coefficient (ICC). Only indicators that met acceptable reliability thresholds were retained for the full-scale evaluation. During the process of collecting data, considering boundaries, obstacles, and user gatherings, the UAV operators determined the flight path before data collection [59]. To improve the efficiency of the process, the operators set waypoints on the flight path after the UAV reached around 30 feet high; then, the UAV flew automatically, collecting visual information with manual adjustment to avoid tall trees, buildings, and other obstacles. Subjective indicators (e.g., aesthetic features, incivility, and cleanliness) were evaluated through a systematic on-site observation conducted by trained observers using a standardized protocol, while objective indicators (e.g., green space size, facilities, and amenities) were measured with UAV-assisted recordings. Each dimension was then standardized and synthesized into the overall green space quality variable, ensuring that both subjective and objective aspects were incorporated.
2.4. Analyses
While the sample green space quality remained unchanged and multiple quantitative assessments of social interaction yielded different scores, multiple DVs corresponding to the same IV resulted in a hierarchical data structure forming between the main variables. Accordingly, a two-level Hierarchical Linear Model (HLM) was selected to analyze hierarchical variable relationships. At level 1 (observation level), Yij represents the social interaction score at observation i in park j, Xij represents individual-level predictors (centered), β0j is the park-specific intercept, β1j are park-specific slopes, and eij is the random error (2).
Yij = β0j + β1jXij + eij
At level 2 (park level), Zj represents park-level quality indicators, γ represents fixed effects, and u0j, u1j are random effects, as shown in Formulas (3) and (4).
β0j = γ00 + γ01Zj + u0j
β1j = γ10 + u1j
To eliminate the potential spatial autocorrelation in the results, the lme4 package 1.1-26 in the R programming language was employed, where each random coefficient corresponds to a two-level HLM. Firstly, IVs were imported into R 4.0.3 to assess the presence of spatial autocorrelation interference through Moran’s I statistics. If interference existed, a hierarchical spatial autoregressive model was chosen to analyze variable relationships while controlling for spatial autocorrelation. If no interference existed, a general HLM was appropriate to explore the variable relationships (Figure 3). In this study, Moran’s I statistics showed that the dataset did not show significant spatial autocorrelation (p > 0.05), supporting the use of a general hierarchical linear model.
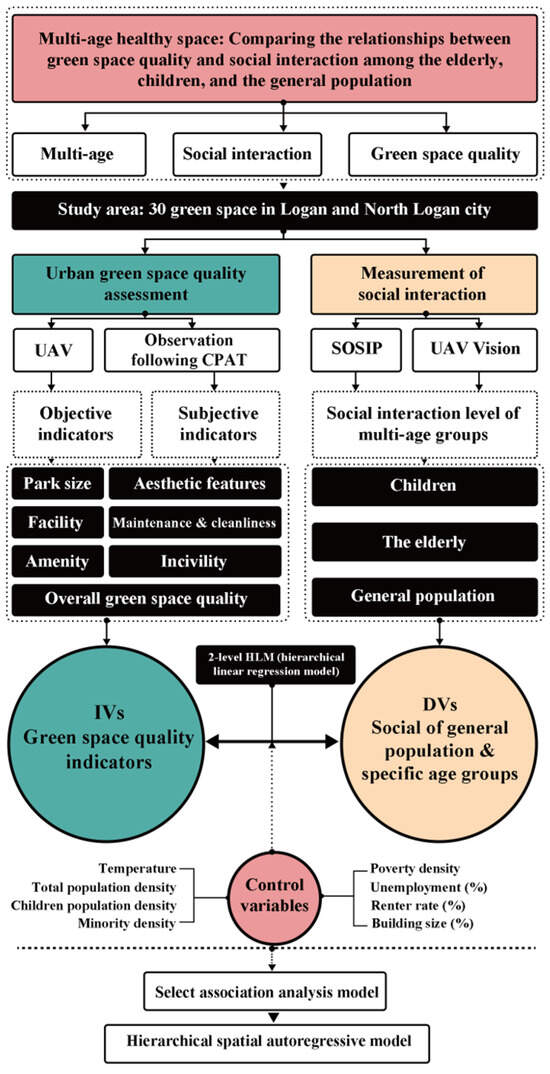
Figure 3.
Research framework and flowchart.
3. Results
3.1. Sample Characteristics
Table 3 illustrates the sample characteristics of the IVs, DVs, and the control variables. Initially, IBM SPSS (Statistical Package for the Social Sciences) Statistics 29 was utilized to conduct a basic data analysis of the sample variables. To ensure all variables were on the same scale, the processed data from the three categories of attributes were standardized. This involved scaling the attributes to a standard normal distribution using the attributes’ mean and standard deviation.
Table 3.
Descriptive statistics of the variables.
3.2. Associations Between Social Interaction and Green Space Quality Indicators
The unrestricted model was analyzed using R Studio (v9.0.190275) to validate the suitability of the dataset. The results showed a p-value of 0.003 and significant group differences within the stratified structure for this experiment. Moran’s I results indicated that no spatial autocorrelation existed in the data, and HLM was an appropriate model to explore the associations between social interaction and space quality. Before fitting the model with predictors, an unconditional model was estimated to examine between-group variance. The intraclass correlation coefficient (ICC) was 0.389, indicating significant differences across groups and confirming the appropriateness of using a multilevel modeling approach. Due to model convergence issues with the elderly subgroup (which showed near-zero Level-1 variance), the ICC for the elderly was not computable, but the significant p-value obtained from the unrestricted model supports the use of HLM for all groups.
Regarding the selection of coefficients in the regression model, since IV green space quality indicators were categorized as higher-level variables, using fixed coefficients would impose the same values for all hierarchical independent variables. On the other hand, random coefficients allow the intercept and coefficients to vary across higher-level variables. Therefore, the random coefficient HLM was chosen to explore the associative mechanisms. Based on the categorization of the dependent variable, there were three HLMs corresponding to the social interaction data of the general population, children, and the elderly. Table 4 displays the variance estimates of the HLMs for different DVs. By analyzing the variance estimates of the established HLMs, the impacts of green space quality indicators varied for different DVs (Table 4).
Table 4.
Estimate variance and residuals of the HLMs with different IVs.
When comparing the independent variables across categories, overall quality and maintenance and cleanliness had the most significant impact on the social interactions of both children and the general population. However, aesthetic features and green space size only stood out in their impact on the general population (Table 5).
Table 5.
Fixed effects of multilevel models examining the associations between green space quality indicators and social interaction scores.
4. Discussion
A substantial body of research demonstrated that outdoor green spaces are key natural spaces for outdoor activities and social interaction [32,60]. High-quality outdoor green spaces can facilitate spontaneous social interaction, thereby positively influencing mental health and well-being, particularly since the onset of the COVID-19 pandemic [61]. Under the pressure of aging urbanization, the need to improve the well-being and health of the elderly in urban areas has become prominent. Studies have also suggested that children are also a significant group in an aging society, as their needs may be overshadowed by those of other groups [62]. Promoting the health and well-being of both the elderly and children by encouraging social interaction in urban green spaces became more crucial after the global pandemic and lockdowns. Numerous scholars have investigated associations between green space quality and social activities among the elderly, children, and general population [17,27,32,63,64,65], with Gan Et Al. (2025) exploring how perceptions and utilization preferences regarding urban green spaces varied across age groups, yet few studies have compared the specific social needs of these groups [66]. The innovation of this study lies in comparing the social needs of both the elderly and young age groups with those of the general population and summarizing sustainable planning strategies for multi-age, health-oriented green spaces by enhancing green space quality. Additionally, to improve the extraction of social interaction data among different age groups, a UAV method was employed to assist the established protocol in obtaining innovative measurements.
This study explored the associations between green space quality indicators and social interactions among the elderly, children, and the general population, as summarized in Table 6. Social interaction within the general population was most significantly correlated with facilities and the overall space quality, followed by maintenance and cleanliness, and green space size. Existing research suggested that specific facilities and amenities could encourage social interaction [60]. For example, a study reported that playgrounds, shelters, seats, play courts, and pathways can improve social interaction [31], which was measured only as the number of people staying together. It was also stated that public amenities like pavilions and benches in parks can promote social interaction among residents [67]. In this study, we expanded the measurement to include both participant numbers and interaction level. The findings suggested that, for the general population, the presence of facilities remains important, but overall park quality and good maintenance played equally essential roles. Thus, strategies should balance the provision of facilities with efforts to maintain and improve overall quality.
Table 6.
Significant green space quality indicators for different groups.
Table 6 illustrated that none of the green space quality indicators exhibited a prominent influence on the elderly. In previous research, scholars found that amenities such as cafes, restrooms, trees, diverse vegetation, and wildlife are key elements [29]. Furthermore, a relaxed space, tree-lined paths, nature, and vegetation also have a significant impact on the elderly’s green space-based socialization [23]. Although, in this study, quality indicators did not show significance in the summarized table, it is worth noting that the proportion of social interaction level 2 in Table 3 was the highest among the elderly in our results, suggesting that their social engagement might depend more on habitual use and companionship patterns than on specific environmental attributes. Therefore, future studies could explore additional factors—such as accessibility, seating comfort, and safety perceptions—that might better capture elderly users’ social dynamics.
As illustrated in Table 6, children tended to socialize in overall high-quality urban green spaces, with well-maintained and clean spaces, similarly to the general population. It can be assumed that children tend to socialize independently but still depend on adults, so environment enhancements for children should consider not only specific age groups but also the needs of the general public. Previous studies have highlighted the influence of facilities and aesthetic features on children’s social activities [19,30,37,68], slightly differing from the current findings. This research emphasized that the physical dimensions carried less importance than subjective green space quality indicators such as maintenance and cleanliness, as well as overall green space quality, in promoting social interaction.
Global aging urbanization trends, particularly stimulated by the COVID-19 pandemic, have significantly modified the demographic structure and focal points of urban planning, and the health demands of different age groups have become more prominent [38]. This study indicates the importance of planning for future generations while providing special care for the elderly, while also addressing the needs of the general public. This approach offers sustainable green space quality enhancement strategies for creating multi-age, healthy, and friendly outdoor spaces. Based on a comparison of the mechanisms influencing the interaction between green space quality indicators and multi-age social interaction, it can be summarized that overall environmental quality has a more pronounced effect on promoting social interaction than individual indicators. Although separate indicators have been discussed in the literature, overall quality, which included facility, amenity, aesthetic features, maintenance and cleanliness, and incivility, should be incorporated to enhance the overall quality of the urban green space and drive broader patterns of social engagement.
Regarding the separate green space quality indicators, scholars suggested that the presence of specific facilities, amenities, and natural features contributes to social interaction [23,29,31,31,60,69,70,71]. Our results refine this understanding by showing that while facilities remain essential for the general population, increasing their quantity alone is insufficient to promote interaction among children or older adults. Instead, regular maintenance and overall environmental quality emerged as more consistent predictors. It is crucial for planners and decision-makers to avoid sole investment in the quantity of specific attributes but to instead emphasize sustainable planning for an overall high-quality green space by improving the condition of existing attributes.
Although aesthetic features are important for perception and identity [57], and certain aesthetic features can positively affect social interaction among the elderly [72], in this study, a direct association with social interaction did not emerge—possibly due to measurement variability or the particular behavioral dynamics captured by UAV observations. Therefore, planners should prioritize sustained upkeep, the condition of facilities, and participatory maintenance strategies, while considering aesthetics as a complementary but not decisive factor.
Maintenance and cleanliness were assessed according to the conditions of the overall environment, as well as separate indicators and the adjacent spaces. The experimental results suggested that future environmental planners may consider assigning more professionals to regularly maintain and repair the natural landscapes and facilities of green spaces and open spaces. Ensuring quality during the construction process would maximize the green space’s resilience and overall quality while effectively avoiding excessive maintenance costs in the later stages of planning. Strategies like increasing cleaning staff and considering long-term usage during the initial stage of green space planning were equally significant for creating healthy multi-age spaces and enhancing well-being. Planners may also consider adaptive and participatory strategies, such as engaging local communities in stewardship activities or tailoring interventions to the specific needs of different age groups.
Although studies have provided different definitions of aesthetics and maintenance, this comparative research revealed that the previous literature highlighted their importance in fostering social interaction. For example, Rasidi suggested that vegetation density, animal populations, undulating landforms, and water bodies can promote social interaction among the general population [31]. This aligns with studies that address how natural landscaping and maintenance influence green space-based social interaction [16,49,50,63,65]. However, in this study, aesthetic features did not show a significant statistical association with social interaction, suggesting that their effects may be more perceptual or context-dependent. In the future, the regular maintenance and cleanliness of natural landscapes, facilities, and amenities should remain a priority, while aesthetic enhancement may complement these efforts to improve users’ overall spatial experience.
Although this research filled the gap in exploring how to build multi-age-friendly spaces in urban areas, there were still limitations. For example, observations were conducted on sunny afternoons (2–6 pm) to ensure standardized lighting and UAV visibility across sites. This time-window constraint may reduce generalizability, particularly for elderly populations, who often visit parks in the mornings or evenings. Additionally, the construction of the SOSIP index may introduce a measurement bias, as higher scores could partly reflect park size or crowding rather than purely reflecting the quality of social interactions. We followed established frameworks for human activity recognition from UAV-captured videos [50] to construct the temporal segment network and classify social interactions. However, details regarding training and annotation datasets, model hyperparameters, cross-validation strategy, and performance metrics (e.g., precision, recall, F1 scores) are not reported, limiting reproducibility and evaluation.
5. Conclusions
Facing the challenges of aging populations and global urbanization, especially after the COVID pandemic, the creation of healthy outdoor spaces for multi-age populations is crucial for well-being and sustainable development across urban societies. This study explored the associations between green space quality and outdoor social interactions among multi-age populations and synthesized how green spaces impact the social activities of the elderly, children, and the general population. Utilizing the SOSIP protocol based on UAV vision techniques, this research compared the impacts of different quality indicators on different age groups using an efficient approach.
This study developed sustainable strategies for environmental quality improvement to foster multi-age social interactions. According to the findings, for children and the general population, enhancing overall green space quality is most effective in promoting social interaction, and the mechanisms underlying these effects suggest that maintenance and cleanliness primarily reduce environmental barriers and create a sense of comfort. For the general population, facilities and a larger green space provide opportunities for spontaneous encounters and group activities. While aesthetic features and the number of amenities had limited effects on social interactions, their maintenance and cleanliness were significant for multiple age populations. Rather than increasing investment in new facilities, this research endorses sustainable planning by combining the targeted provision and good condition of facilities with regular maintenance and overall green space quality improvements to encourage diverse populations to foster more connections in outdoor green spaces, ultimately contributing to the health and well-being of larger populations.
Author Contributions
Y.S.: writing—original draft, visualization, software, preparation, and data curation. S.C.: conceptualization, writing—review and editing; methodology; formal analysis and resources. O.S.: conceptualization; methodology. All authors have read and agreed to the published version of the manuscript.
Funding
This research was funded by “General Project of Philosophy and Social Sciences in Jiangsu Universities, grant number No. 2022SJYB0127”, “General Natural Science Research Project in Jiangsu Universities, grant number No. 23KJB560018”, “Youth Fund of the Natural Science Foundation of Jiangsu Province, grant number No. BK20230401” and “Youth Program of the National Natural Science Foundation of China, grant number No. 52308066”.
Institutional Review Board Statement
The authors are not permitted to share the research data or make the data public because human participants were involved in the research. The study was conducted in accordance with the Declaration of Helsinki, and ethical review and approval were waived by the Utah State University Institutional Review Board (Protocol #10783, approved on 25 November 2019) as the contents were obtained via an observation of public behaviors using an unmanned aerial vehicle recording to determine participants’ apparent characteristics and behaviors in public parks. Even though the study was granted an exemption from the Utah State University IRB review and the documentation of consent was not required from the IRB, the participants were informed about the study when the data was collected.
Informed Consent Statement
Informed consent was waived by the Utah State University Institutional Review Board (Protocol #10783) because the study involved nonintrusive observation of public behaviors in open spaces without collecting personal identifiers. All procedures performed in studies involving human participants were in accordance with the ethical standards of the institutional and national research committee and with the 1964 Helsinki Declaration and its later amendments.
Data Availability Statement
The data presented in this study are available on request from the corresponding author due to ethical restrictions. The data include UAV recordings of public behaviors and apparent personal characteristics. Therefore, public sharing is not permitted according to the Utah State University Institutional Review Board (Protocol #10783).
Conflicts of Interest
The authors declare no conflicts of interest.
Appendix A
Table A1.
Descriptive information for 30 parks in the study area.
Table A1.
Descriptive information for 30 parks in the study area.
| Park ID | Name | Size |
|---|---|---|
| 1 | Elk Ridge Park | 23.40 hm2 |
| 2 | Meadow View Park | 16.29 hm2 |
| 3 | Adams Park | 5.00 hm2 |
| 4 | Morningside Park | 0.94 hm2 |
| 5 | Lundstrom Park | 13.30 hm2 |
| 6 | Canyon Entrance Park | 5.44 hm2 |
| 7 | Canyon Road Memorial Park | 4.00 hm2 |
| 8 | River Hollow Park | 4.30 hm2 |
| 9 | Jens Johansen Park | 2.60 hm2 |
| 10 | Mt. Logan Park | 21.97 hm2 |
| 11 | Lynn and Merle Olsen Park | 1.00 hm2 |
| 12 | Merlin Olsen Central Park | 9.20 hm2 |
| 13 | Don Reese Park | 9.51 hm2 |
| 14 | Bridger Park | 13.61 hm2 |
| 15 | Jones Neighborhood Park | 1.25 hm2 |
| 16 | Bridgerland Park | 7.08 hm2 |
| 17 | Eliason Park | 0.46 hm2 |
| 18 | Kilowatt Park | 0.96 hm2 |
| 19 | Logan Meadows Park | 1.01 hm2 |
| 20 | Logan Skate Park | 5.50 hm2 |
| 21 | Fairview Park | 6.00 hm2 |
| 22 | Dahle Park | 4.27 hm2 |
| 23 | Mafestic Park | 1.20 hm2 |
| 24 | West Willow Park | 7.75 hm2 |
| 25 | Willow Horseshoe Park | 4.62 hm2 |
| 26 | Willow Park | 6.78 hm2 |
| 27 | Willow Park Sports Complex | 17.88 hm2 |
| 28 | Soccer Park Complex | 22.93 hm2 |
| 29 | Rendezvous Park | 8.76 hm2 |
| 30 | Trapper Park | 19.22 hm2 |
References
- Ferreira, F.R.; César, C.C.; Camargos, V.P.; Lima-Costa, M.F.; Proietti, F.A. Aging and Urbanization: The Neighborhood Perception and Functional Performance of Elderly Persons in Belo Horizonte Metropolitan Area—Brazil. J. Urban. Health 2010, 87, 54–66. [Google Scholar] [CrossRef]
- Mitra, R.; Campbell, J.E.; Vanderloo, L.M.; Faulkner, G.; Tremblay, M.S.; Rhodes, R.E.; Stone, M.R.; Moore, S.A. Child and Youth Physical Activity throughout the COVID-19 Pandemic: The Changing Role of the Neighbourhood Built and Social Environments. Health Place 2023, 84, 103127. [Google Scholar] [CrossRef]
- Sampaio, D. Ageing, Agency and Work: Brazilian Older Adults Building Spaces of Opportunity in the United States. Soc. Cult. Geogr. 2024, 25, 87–103. [Google Scholar]
- Doughty, K.; Hu, H.; Smit, J. Therapeutic Landscapes during the COVID-19 Pandemic: Increased and Intensified Interactions with Nature. Soc. Cult. Geogr. 2023, 24, 661–679. [Google Scholar] [CrossRef]
- Geng, D.; Innes, J.; Wu, W.; Wang, G. Impacts of COVID-19 Pandemic on Urban Park Visitation: A Global Analysis. J. For. Res. 2021, 32, 553–567. [Google Scholar] [CrossRef]
- Lu, Y.; Giuliano, G. Where Do People Meet? Time-Series Clustering for Social Interaction Levels in Daily-Life Spaces during the COVID-19 Pandemic. Cities 2023, 137, 104298. [Google Scholar] [CrossRef]
- Venter, Z.S.; Barton, D.N.; Gundersen, V.; Figari, H.; Nowell, M.S. Back to Nature: Norwegians Sustain Increased Recreational Use of Urban Green Space Months after the COVID-19 Outbreak. Landsc. Urban Plan. 2021, 214, 104175. [Google Scholar] [CrossRef]
- Bonsang, E.; van Soest, A. Satisfaction with Social Contacts of Older Europeans. Soc. Indic. Res. 2012, 105, 273–292. [Google Scholar] [CrossRef] [PubMed]
- James, P.; Banay, R.F.; Hart, J.E.; Laden, F. A Review of the Health Benefits of Greenness. Curr. Epidemiol. Rep. 2015, 2, 131–142. [Google Scholar] [CrossRef] [PubMed]
- Coyle, C.E.; Dugan, E. Social Isolation, Loneliness and Health Among Older Adults. J. Aging Health 2012, 24, 1346–1363. [Google Scholar] [CrossRef] [PubMed]
- Mcgraw, K.; Moore, S.; Fuller, A.; Bates, G. Family, Peer and School Connectedness in Final Year Secondary School Students. Aust. Psychol. 2008, 43, 27–37. [Google Scholar] [CrossRef]
- Beckley, T.M. Community Stability and the Relationship between Economic and Social Well-being in Forest-dependent Communities. Soc. Nat. Resour. 1995, 8, 261–266. [Google Scholar]
- Bedimo-Rung, A.L.; Mowen, A.J.; Cohen, D.A. The Significance of Parks to Physical Activity and Public Health: A Conceptual Model. Am. J. Prev. Med. 2005, 28, 159–168. [Google Scholar] [CrossRef] [PubMed]
- Kabisch, N.; Haase, D. Green Spaces of European Cities Revisited for 1990–2006. Landsc. Urban Plan. 2013, 110, 113–122. [Google Scholar] [CrossRef]
- Kuo, F.E.; Sullivan, W.C.; Coley, R.L.; Brunson, L. Fertile Ground for Community: Inner-City Neighborhood Common Spaces. Am. J. Community Psychol. 1998, 26, 823–851. [Google Scholar] [CrossRef]
- Peters, K.; Elands, B.; Buijs, A. Social Interactions in Urban Parks: Stimulating Social Cohesion? Urban For. Urban Green. 2010, 9, 93–100. [Google Scholar] [CrossRef]
- Holtan, M.T.; Dieterlen, S.L.; Sullivan, W.C. Social Life Under Cover: Tree Canopy and Social Capital in Baltimore, Maryland. Environ. Behav. 2015, 47, 502–525. [Google Scholar] [CrossRef]
- McCormack, G.R.; Rock, M.; Toohey, A.M.; Hignell, D. Characteristics of Urban Parks Associated with Park Use and Physical Activity: A Review of Qualitative Research. Health Place 2010, 16, 712–726. [Google Scholar] [CrossRef]
- Kemperman, A.; Timmermans, H. Green Spaces in the Direct Living Environment and Social Contacts of the Aging Population. Landsc. Urban Plan. 2014, 129, 44–54. [Google Scholar] [CrossRef]
- Sturge, J.; Klaassens, M.; Lager, D.; Weitkamp, G.; Vegter, D.; Meijering, L. Using the Concept of Activity Space to Understand the Social Health of Older Adults Living with Memory Problems and Dementia at Home. Soc. Sci. Med. 2021, 288, 113208. [Google Scholar] [CrossRef] [PubMed]
- Zhao, P.; Zhao, Z.; Liao, C.; Fang, Y.; Liu, Y. Urban Park Accessibility and the Mental Health of Older Adults: A Case Study of Haidian District, Beijing. Leis. Stud. 2023, 42, 235–252. [Google Scholar] [CrossRef]
- Van Puyvelde, A.; Deforche, B.; Mertens, L.; Rivera, E.; Van Dyck, D.; Veitch, J.; Poppe, L. Park Features That Encourage Park Visitation among Older Adults: A Qualitative Study. Urban For. Urban Green. 2023, 86, 128026. [Google Scholar] [CrossRef]
- Besenyi, G.M.; Kaczynski, A.T.; Wilhelm Stanis, S.A.; Vaughan, K.B. Demographic Variations in Observed Energy Expenditure across Park Activity Areas. Prev. Med. 2013, 56, 79–81. [Google Scholar] [CrossRef]
- Reece, R.; Elliott, L.; Bray, I.; Bornioli, A. How Properties of Urban Greenspaces Shape Well-Being across Age Groups: A Qualitative Study. Wellbeing Space Soc. 2024, 7, 100206. [Google Scholar] [CrossRef]
- Luo, W.; Chen, H.; Yang, Z.; Liu, J. Accessibility and Equity of Park Green Spaces: Considering Differences in Walking Speeds Across Age Groups. Land 2024, 13, 2240. [Google Scholar] [CrossRef]
- Veitch, J.; Ball, K.; Rivera, E.; Loh, V.; Deforche, B.; Best, K.; Timperio, A. What Entices Older Adults to Parks? Identification of Park Features That Encourage Park Visitation, Physical Activity, and Social Interaction. Landsc. Urban Plan. 2022, 217, 104254. [Google Scholar] [CrossRef]
- Tan, T.H.; Lee, J.H. Residential Environment, Third Places and Well-Being in Malaysian Older Adults. Soc. Indic. Res. 2022, 162, 721–738. [Google Scholar] [CrossRef]
- Rivera, E.; Timperio, A.; Loh, V.H.; Deforche, B.; Veitch, J. Important Park Features for Encouraging Park Visitation, Physical Activity and Social Interaction among Adolescents: A Conjoint Analysis. Health Place 2021, 70, 102617. [Google Scholar] [CrossRef]
- Veitch, J.; Ball, K.; Flowers, E.; Deforche, B.; Timperio, A. Children’s Ratings of Park Features That Encourage Park Visitation, Physical Activity and Social Interaction. Urban For. Urban Green. 2021, 58, 126963. [Google Scholar] [CrossRef]
- Rasidi, M.H.; Jamirsah, N.; Said, I. Urban Green Space Design Affects Urban Residents’ Social Interaction. Procedia-Social. Behav. Sci. 2012, 68, 464–480. [Google Scholar] [CrossRef]
- Enssle, F.; Kabisch, N. Urban Green Spaces for the Social Interaction, Health and Well-Being of Older People—An Integrated View of Urban Ecosystem Services and Socio-Environmental Justice. Environ. Sci. Policy 2020, 109, 36–44. [Google Scholar] [CrossRef]
- Dadvand, P.; Hariri, S.; Abbasi, B.; Heshmat, R.; Qorbani, M.; Motlagh, M.E.; Basagaña, X.; Kelishadi, R. Use of Green Spaces, Self-Satisfaction and Social Contacts in Adolescents: A Population-Based CASPIAN-V Study. Environ. Res. 2019, 168, 171–177. [Google Scholar] [CrossRef] [PubMed]
- Aram, F.; Solgi, E.; Holden, G. The Role of Green Spaces in Increasing Social Interactions in Neighborhoods with Periodic Markets. Habitat. Int. 2019, 84, 24–32. [Google Scholar] [CrossRef]
- Poppe, L.; Van Dyck, D.; De Keyser, E.; Van Puyvelde, A.; Veitch, J.; Deforche, B. The Impact of Renewal of an Urban Park in Belgium on Park Use, Park-Based Physical Activity, and Social Interaction: A Natural Experiment. Cities 2023, 140, 104428. [Google Scholar] [CrossRef]
- Zhang, F.; Qian, H. A Comprehensive Review of the Environmental Benefits of Urban Green Spaces. Environ. Res. 2024, 252, 118837. [Google Scholar] [CrossRef] [PubMed]
- Gidlow, C.; van Kempen, E.; Smith, G.; Triguero-Mas, M.; Kruize, H.; Gražulevičienė, R.; Ellis, N.; Hurst, G.; Masterson, D.; Cirach, M.; et al. Development of the Natural Environment Scoring Tool (NEST). Urban For. Urban Green. 2018, 29, 322–333. [Google Scholar] [CrossRef]
- Ziaesaeidi, P.; Flanders Cushing, D.; Washington, T.; Buys, L. “Just to Make New Friends and Play with Other Children”: Understanding Youth Engagement within Neighbourhood Parks Using a Photo-Choice Tool. Landsc. Urban Plan. 2023, 235, 104757. [Google Scholar] [CrossRef]
- Loukaitou-Sideris, A.; Sideris, A. What Brings Children to the Park? Analysis and Measurement of the Variables Affecting Children’s Use of Parks. J. Am. Plan. Assoc. 2009, 76, 89–107. [Google Scholar] [CrossRef]
- Dadvand, P.; Nieuwenhuijsen, M. Green Space and Health. In Integrating Human Health into Urban and Transport Planning: A Framework; Nieuwenhuijsen, M., Khreis, H., Eds.; Springer International Publishing: Cham, Switzerland, 2019; pp. 409–423. ISBN 978-3-319-74983-9. [Google Scholar]
- Lee, R.E.; Booth, K.M.; Reese-Smith, J.Y.; Regan, G.; Howard, H.H. The Physical Activity Resource Assessment (PARA) Instrument: Evaluating Features, Amenities and Incivilities of Physical Activity Resources in Urban Neighborhoods. Int. J. Behav. Nutr. Phys. Act. 2005, 2, 13. [Google Scholar] [CrossRef]
- Knobel, P.; Dadvand, P.; Alonso, L.; Costa, L.; Español, M.; Maneja, R. Development of the Urban Green Space Quality Assessment Tool (RECITAL). Urban For. Urban Green. 2021, 57, 126895. [Google Scholar] [CrossRef]
- Park, K.; Ewing, R. The Usability of Unmanned Aerial Vehicles (UAVs) for Pedestrian Observation. J. Plan. Educ. Res. 2022, 42, 206–217. [Google Scholar] [CrossRef]
- Hillier, A.; Han, B.; Eisenman, T.S.; Evenson, K.R.; McKenzie, T.L.; Cohen, D.A. Using Systematic Observations to Understand Conditions That Promote Interracial Experiences in Neighbourhood Parks. Urban Plan. 2016, 1, 51–64. [Google Scholar] [CrossRef] [PubMed]
- Xu, J.; Bian, Q.; Zhao, X. Observations of Physical Activity in Winter Urban Parks Using UAVs: A Case Study of Four City Parks, Harbin, China. In Proceedings of the Sustainability in Energy and Buildings 2018; Kaparaju, P., Howlett, R.J., Littlewood, J., Ekanyake, C., Vlacic, L., Eds.; Springer International Publishing: Cham, Switzerland, 2019; pp. 63–73. [Google Scholar]
- Chen, S.; Sleipness, O.; Christensen, K.; Yang, B.; Wang, H. Developing and Testing a Protocol to Systematically Assess Social Interaction with Urban Outdoor Environment. J. Environ. Psychol. 2023, 88, 102008. [Google Scholar] [CrossRef] [PubMed]
- Niu, Y.; Mi, X.; Wang, Z. Vitality Evaluation of the Waterfront Space in the Ancient City of Suzhou. Front. Archit. Res. 2021, 10, 729–740. [Google Scholar] [CrossRef]
- Bureau, U.C. 2021 Releases. Available online: https://www.census.gov/data/what-is-data-census-gov/latest-releases/2021.html (accessed on 8 September 2025).
- Crawford, D.; Timperio, A.; Giles-Corti, B.; Ball, K.; Hume, C.; Roberts, R.; Andrianopoulos, N.; Salmon, J. Do Features of Public Open Spaces Vary According to Neighbourhood Socio-Economic Status? Health Place 2008, 14, 889–893. [Google Scholar] [CrossRef]
- de Vries, S.; van Dillen, S.M.E.; Groenewegen, P.P.; Spreeuwenberg, P. Streetscape Greenery and Health: Stress, Social Cohesion and Physical Activity as Mediators. Soc. Sci. Med. 2013, 94, 26–33. [Google Scholar] [CrossRef] [PubMed]
- Mliki, H.; Bouhlel, F.; Hammami, M. Human Activity Recognition from UAV-Captured Video Sequences. Pattern Recognit. 2020, 100, 107140. [Google Scholar] [CrossRef]
- Abbas, Y.; Al Mudawi, N.; Alabdullah, B.; Sadiq, T.; Algarni, A.; Rahman, H.; Jalal, A. Unmanned Aerial Vehicles for Human Detection and Recognition Using Neural-Network Model. Front. Neurorobot. 2024, 18, 1443678. [Google Scholar] [CrossRef]
- Samma, H.; Sama, A.S.B. Optimized Deep Learning Vision System for Human Action Recognition from Drone Images. Multimed. Tools Appl. 2024, 83, 1143–1164. [Google Scholar] [CrossRef]
- Hoffimann, E.; Campelo, D.; Hooper, P.; Barros, H.; Ribeiro, A.I. Development of a Smartphone App to Evaluate the Quality of Public Open Space for Physical Activity. An Instrument for Health Researchers and Urban Planners. Landsc. Urban Plan. 2018, 177, 191–195. [Google Scholar] [CrossRef]
- Kaczynski, A.T.; Wilhelm Stanis, S.A.; Besenyi, G.M. Development and Testing of a Community Stakeholder Park Audit Tool. Am. J. Prev. Med. 2012, 42, 242–249. [Google Scholar] [CrossRef]
- Cardinali, M.; Beenackers, M.A.; van Timmeren, A.; Pottgiesser, U. The Relation between Proximity to and Characteristics of Green Spaces to Physical Activity and Health: A Multi-Dimensional Sensitivity Analysis in Four European Cities. Environ. Res. 2024, 241, 117605. [Google Scholar] [CrossRef]
- Bird, M.E.; Datta, G.D.; van Hulst, A.; Kestens, Y.; Barnett, T.A. A Reliability Assessment of a Direct-Observation Park Evaluation Tool: The Parks, Activity and Recreation among Kids (PARK) Tool. BMC Public Health 2015, 15, 906. [Google Scholar] [CrossRef]
- Saelens, B.E.; Frank, L.D.; Auffrey, C.; Whitaker, R.C.; Burdette, H.L.; Colabianchi, N. Measuring Physical Environments of Parks and Playgrounds: EAPRS Instrument Development and Inter-Rater Reliability. J. Phys. Act. Health 2006, 3, S190–S207. [Google Scholar] [CrossRef] [PubMed]
- Lee, H.-S. Developing and Testing the Senior Park Environment Assessment in Korea (SPEAK) Audit Tool. Landsc. Urban Plan. 2022, 227, 104545. [Google Scholar] [CrossRef]
- Jennings, V.; Bamkole, O. The Relationship between Social Cohesion and Urban Green Space: An Avenue for Health Promotion. Int. J. Environ. Res. Public Health 2019, 16, 452. [Google Scholar] [CrossRef] [PubMed]
- Lusseau, D.; Baillie, R. Disparities in Greenspace Access during COVID-19 Mobility Restrictions. Environ. Res. 2023, 225, 115551. [Google Scholar] [CrossRef]
- Richman, H.A.; Stagner, M.W. Children in an Aging Society: Treasured Resource or Forgotten Minority? Daedalus 1986, 115, 171–189. [Google Scholar]
- Clarke, M.; Wallace, C.; Cadaval, S.; Anderson, E.; Egerer, M.; Dinkins, L.; Platero, R. Factors That Enhance or Hinder Social Cohesion in Urban Greenspaces: A Literature Review. Urban For. Urban Green. 2023, 84, 127936. [Google Scholar] [CrossRef]
- Kamel, A.A.; Ford, P.B.; Kaczynski, A.T. Disparities in Park Availability, Features, and Characteristics by Social Determinants of Health within a U.S.–Mexico Border Urban Area. Prev. Med. 2014, 69, S111–S113. [Google Scholar] [CrossRef]
- Wan, C.; Shen, G.Q.; Choi, S. Underlying Relationships between Public Urban Green Spaces and Social Cohesion: A Systematic Literature Review. City Cult. Soc. 2021, 24, 100383. [Google Scholar] [CrossRef]
- Tang, Y.; Zhang, X. Spatiotemporal-Behavior-Based Neighborhood Interaction Opportunities and Subjective Neighborhood Perception in Mixed-Housing Neighborhoods: A Case Study of Fuzhou, China. Population, Space Place 2025, 31, e2881. [Google Scholar] [CrossRef]
- Gan, H.; Huang, Y.; Zhao, Z.; Liu, J.; Wen, Y. Green Space Perception and Utilization in Times of Pandemic from the Perspective of Urban Green Resilience: A Comparison Analysis across Age Groups. Ecol. Indic. 2025, 179, 114201. [Google Scholar] [CrossRef]
- Rigolon, A.; Browning, M.H.E.M.; Lee, K.; Shin, S. Access to Urban Green Space in Cities of the Global South: A Systematic Literature Review. Urban Sci. 2018, 2, 67. [Google Scholar] [CrossRef]
- Sunyer, J.; Dadvand, P.; Foraster, M.; Gilliland, F.; Nawrot, T. Environment and the COVID-19 Pandemic. Environ. Res. 2021, 195, 110819. [Google Scholar] [CrossRef]
- Kaźmierczak, A. The Contribution of Local Parks to Neighbourhood Social Ties. Landsc. Urban Plan. 2013, 109, 31–44. [Google Scholar] [CrossRef]
- Zhai, Y.; Li, D.; Wu, C.; Wu, H. Urban Park Facility Use and Intensity of Seniors’ Physical Activity – An Examination Combining Accelerometer and GPS Tracking. Landsc. Urban Plan. 2021, 205, 103950. [Google Scholar] [CrossRef]
- Xu, T.; Nordin, N.A.; Aini, A.M. Urban Green Space and Subjective Well-Being of Older People: A Systematic Literature Review. Int. J. Environ. Res. Public Health 2022, 19, 14227. [Google Scholar] [CrossRef]
- Coley, R.L.; Sullivan, W.C.; Kuo, F.E. Where Does Community Grow?: The Social Context Created by Nature in Urban Public Housing. Environ. Behav. 1997, 29, 468–494. [Google Scholar] [CrossRef]
Disclaimer/Publisher’s Note: The statements, opinions and data contained in all publications are solely those of the individual author(s) and contributor(s) and not of MDPI and/or the editor(s). MDPI and/or the editor(s) disclaim responsibility for any injury to people or property resulting from any ideas, methods, instructions or products referred to in the content. |
© 2025 by the authors. Licensee MDPI, Basel, Switzerland. This article is an open access article distributed under the terms and conditions of the Creative Commons Attribution (CC BY) license (https://creativecommons.org/licenses/by/4.0/).