Upstream River Buffer
The river buffer fragmentation analysis reveals changes in the upstream Ciliwung River. Based on
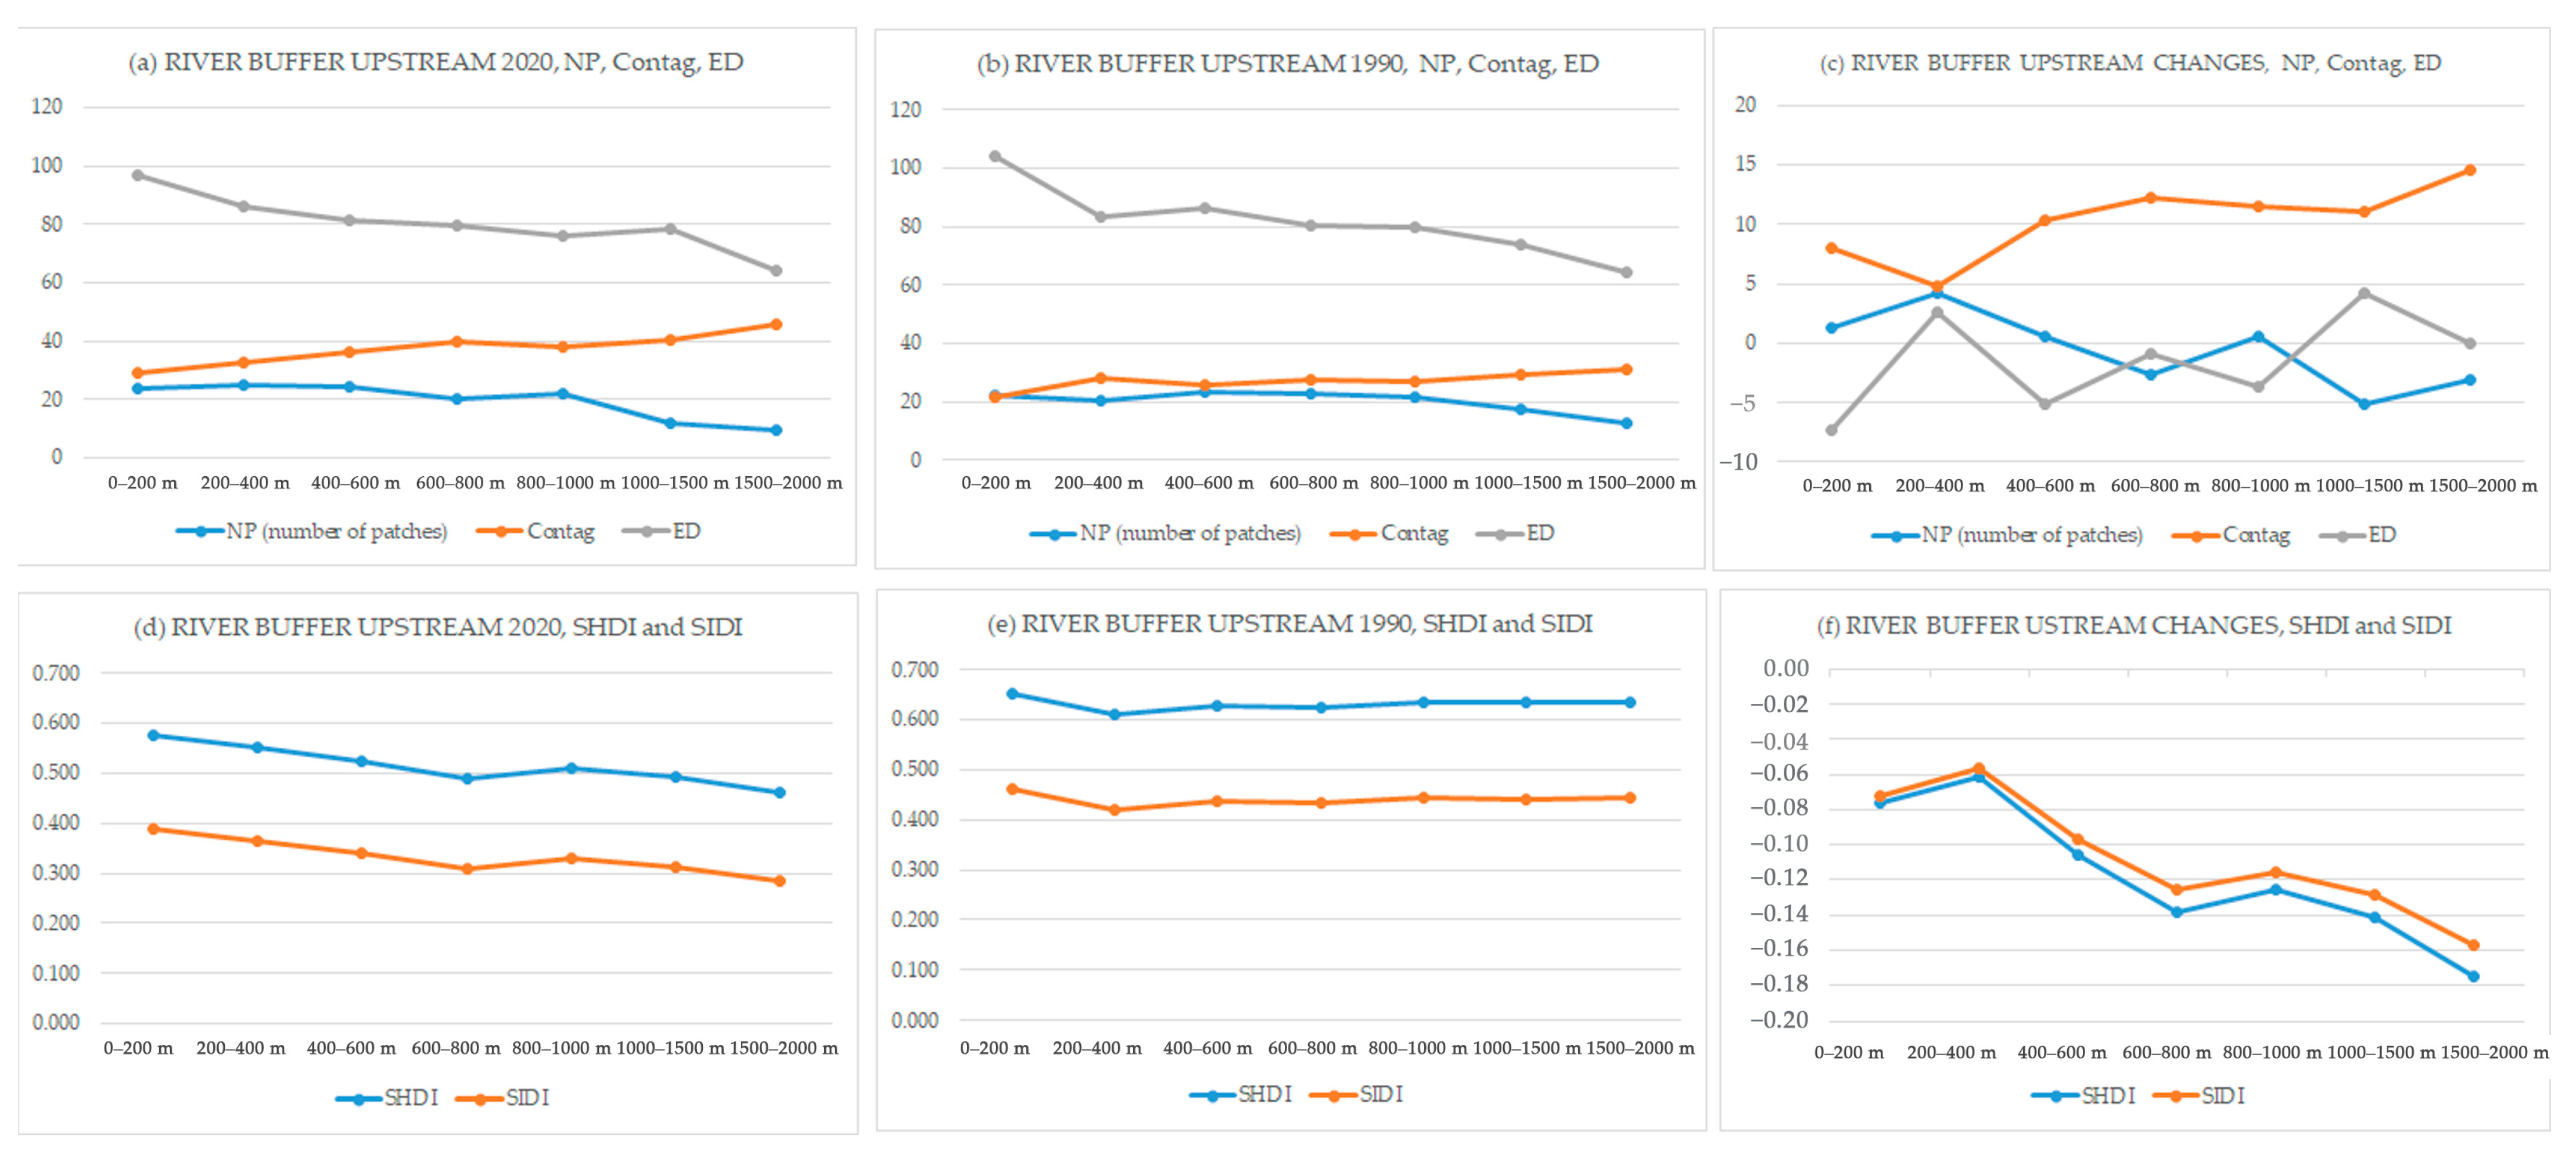
Figure 6, in 1990 and 2020, the NP initially increased before gradually decreasing across most buffer zones, from under 200 m to 2000 m. Notable exceptions to this trend include a decline in patch numbers within the 200–400 m zone in 1990, and the 600–800 m zone in 2020 (see
Figure 6a,b). The largest drops in NP were observed in the 1000–1500 m and 1500–2000 m zones. While the patches that occurred within the 400–600 m buffer zones (at 24% NP) remained stable in both years, the highest change in NP was a 4% increase within the 200–400 m zone (
Figure 6c).
Contag and ED results show opposite trends, as expected. A higher Contag value indicates greater connectivity, while a higher ED value suggests more fragmentation or “patchiness”. In both 1990 and 2020, the ED generally decreased as the distance from the river increased, suggesting that areas closer to the river are more fragmented. Conversely, the Contag index tended to increase with distance, indicating higher aggregation or connectivity further from the river (see
Figure 6a,b). The most significant change in Contag occurred within the 1500–2000 m zone, where a positive value means an increase in contagion. The ED changes were most pronounced in the under 200 m zone, which is a negative value, meaning a decrease in ED or more aggregation or less fragmentation than before (see
Figure 6c). An unusual condition was observed in the 1000–1500 m zone, where the ED change was at its positive peak, suggesting the area became more fragmented (
Figure 6c). This indicates substantial shifts in this zone over the 30-year period.
In terms of diversity indices, the SHDI and SIDI show similar patterns. In 1990, there was no significant difference in diversity across the buffer zones, except for a drop within the 200–400 m buffer. However, in 2020, diversity consistently decreased from the 200 m to the 2000 m buffer zones (see
Figure 6d,e). This decline is most pronounced in the change data, which shows a significant drop in both SHDI and SIDI from areas near the river to those furthest away, meaning there was a decline in diversity from 1990 to 2020 (see
Figure 6f). The highest change in diversity occurred in the 200–400 m zone, correlating with the highest change in NP in this area.
The table for the river buffer changes within the upstream area can be seen in
Appendix A,
Table A1.
Midstream River Buffer
Based on the data and graphs of
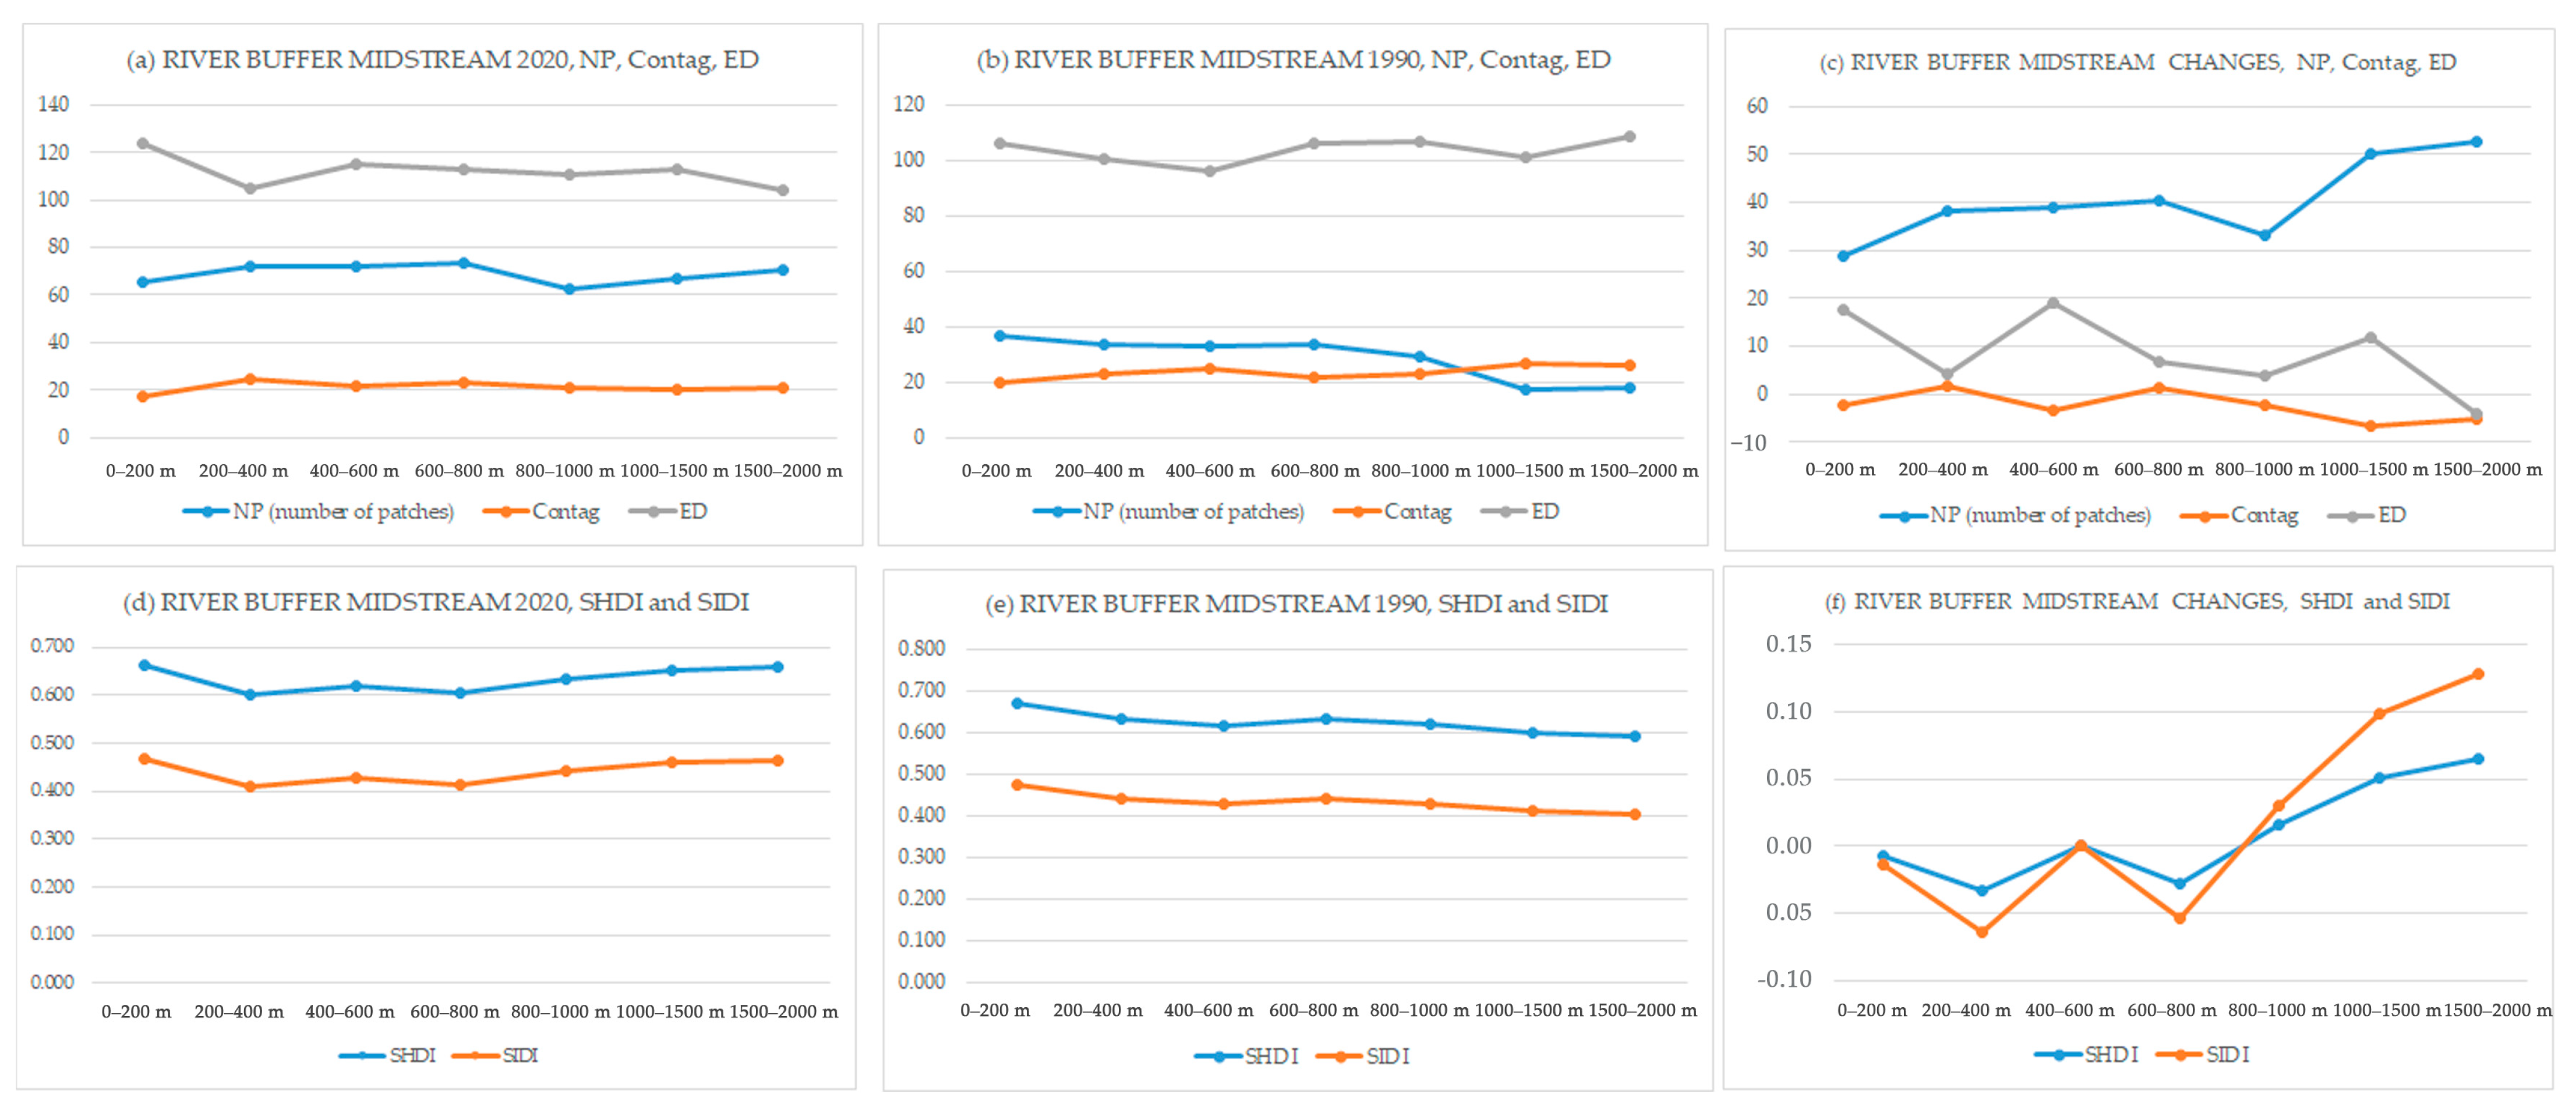
Figure 7, the analysis of the midstream section of the river reveals distinct fragmentation patterns. In 2020, generally, the NP was relatively stable, only dropping down within the 800–1000 m zone for the lowest and starting to increase until 2000 m. The highest values occurred between the 200 m and 800 m buffers, indicating a high degree of fragmentation in this zone at more than 70% (see
Figure 7a). This contrasts with 1990, when the highest NP was found in the buffer under 200 m and decreased with distance from the river and the percentage of the NP in all of the buffer zone was still under 50% (see
Figure 7b).
When tracking the changes from 1990 to 2020, the most significant increases in NP occurred in the 1000 m to 2000 m buffers at around 50%, while the lowest changes were observed in the area under 200 m, suggesting relatively stable remaining green areas near the river (see
Figure 7c).
The ED in 2020 was highest under 200 m before decreasing with distance. The contagion index remained relatively consistent over time across all buffers in 2020 and slightly increased in 1990 (see
Figure 7a,b), with a notable exception of a high change within the 200–400 m buffer, with a positive value meaning increasing contagion (see
Figure 7c).
The combination of a low NP but high ED and low Contag in the area closest to the river suggests a unique landscape fragmentation pattern of a few large, complexly shaped, yet disconnected patches, highlighting a distinct fragmentation dynamic that differs from the broader changes occurring further from the river.
Based on the analysis of the SHDI and SIDI indices in the midstream section of the Ciliwung River, the diversity patterns have shifted over 30 years. In 1990, diversity was highest closest to the river and decreased with distance. Conversely, in 2020, while the highest diversity was still found in the buffer under 200 m, the overall trend was for diversity to increase with distance. However, the highest diversity is under 200 m in both years at around SHDI = 0.66 and SIDI = 0.47 (see
Figure 7d,e). The table for the river buffer changes within the midstream area can be seen in
Appendix A,
Table A2.
Over the 30-year period, the changes in diversity were most significant further from the river (
Figure 7f) with the diversity indices showing a positive value increase, meaning more diversity, starting from the 800 m buffer and increasing to their highest positive changes in the 1000–2000 m buffers. This indicates that the greatest increase in landscape diversity over the study period occurred in the outer zones of the midstream river buffer.
Downstream River Buffer
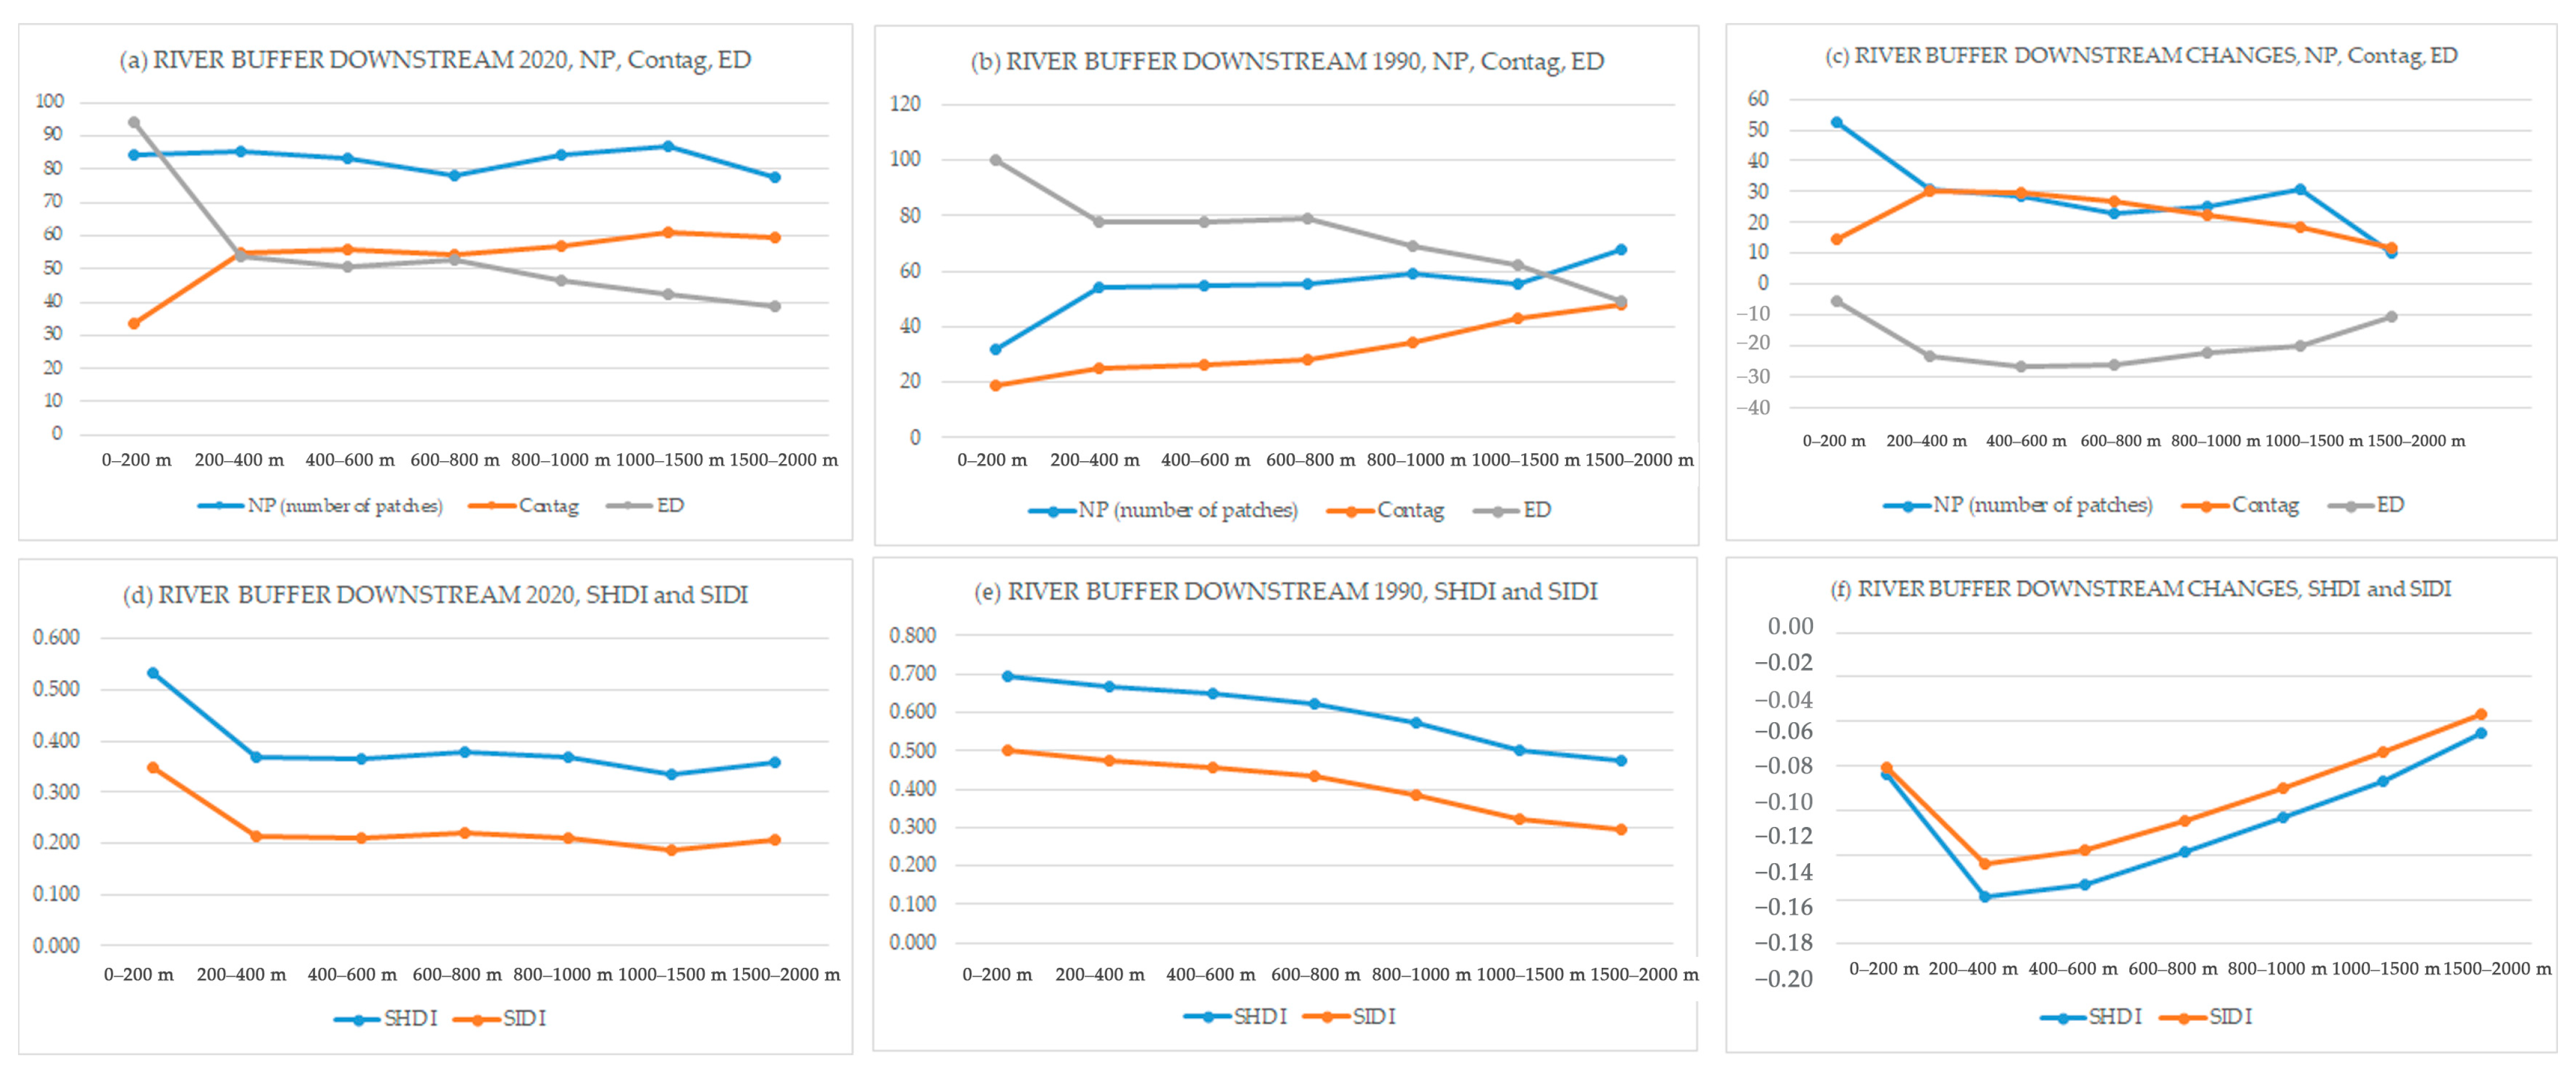
The NP in the Ciliwung River’s downstream buffer shows different trends between 1990 and 2020. In 2020, the NP remained relatively stable, though it was slightly lower in the 600–800 m and 1500–2000 m buffer zones (
Figure 8a). Conversely, in 1990, the NP generally increased as the distance from the river grew (
Figure 8b). The most significant change in NP, with a roughly 50% increase, was observed in the area closest to the river (under 200 m buffer) (
Figure 8c). This suggests that development has occurred primarily near the river within the time period. The lowest NP in 1990 was near the river, but in 2020, the NP was stable across all buffer zones. This, combined with the highest NP change occurring under 200 m, reinforces the conclusion that development has been most significant in the immediate vicinity of the river (
Figure 8c).
As expected, the ED and Contag metrics exhibit an inverse relationship. For both 1990 and 2020, ED values were lower further away from the river, while Contag values were higher. The changes in these metrics also show an opposite trend (
Figure 8a,b). The highest change in contagion occurred in the 200–600 m buffer areas, with a positive value, increasing aggregation, indicating a significant change in connectivity. Meanwhile, the lowest change in ED was within the 400–600 m buffer zone, with a negative value, meaning a decrease in patches or less fragmentation. This suggests that improvements, or at least a high change in connectivity, occurred in the 200–600 m areas (
Figure 8c). River buffer changes within the downstream area are shown in
Appendix A,
Table A3.
The diversity indices, including Shannon’s diversity index (SHDI) and Simpson’s diversity index (SIDI), were highest in the area closest to the river (under 200 m) in both 1990 and 2020 (
Figure 8d,e). The changes in diversity were also most pronounced in the area under 200 m, decreased in the 200–400 m range, and then started to increase again further from the river. The negative values indicate that overall diversity decreased from 1990 to 2020. Although diversity changes increase with distance from the river, this overall decline persisted (
Figure 8f).
Across the three river segments, the midstream Ciliwung watershed area exhibits a unique landscape fragmentation phenomenon. The NP is low close to the river, but high in ED and low in Contag. This suggests the area has complexly shaped, fragmented, few, large, but unconnected patches and showcases a pattern that differs from the fragmentation dynamics further from the river.
In the upstream area, the NP was high in the 0 to 600 m river buffer in both 1990 and 2020, with the greatest change occurring within the 200–400 m zone. The high ED in this area indicates low connectivity. Additionally, the diversity index showed a decline in the 200–400 m buffer in 1990, and a more consistent decrease with distance from the river in 2020.
However, in the downstream area, the area nearest to the river under a 200 m buffer experienced the most significant change in NP over the past 30 years. In both 1990 and 2020, this area showed low connectivity and a high degree of patchiness, evidenced by a low Contag and a high ED. Furthermore, all diversity indices across all buffer zones showed negative values, indicating an overall decrease in diversity from 1990 to 2020.
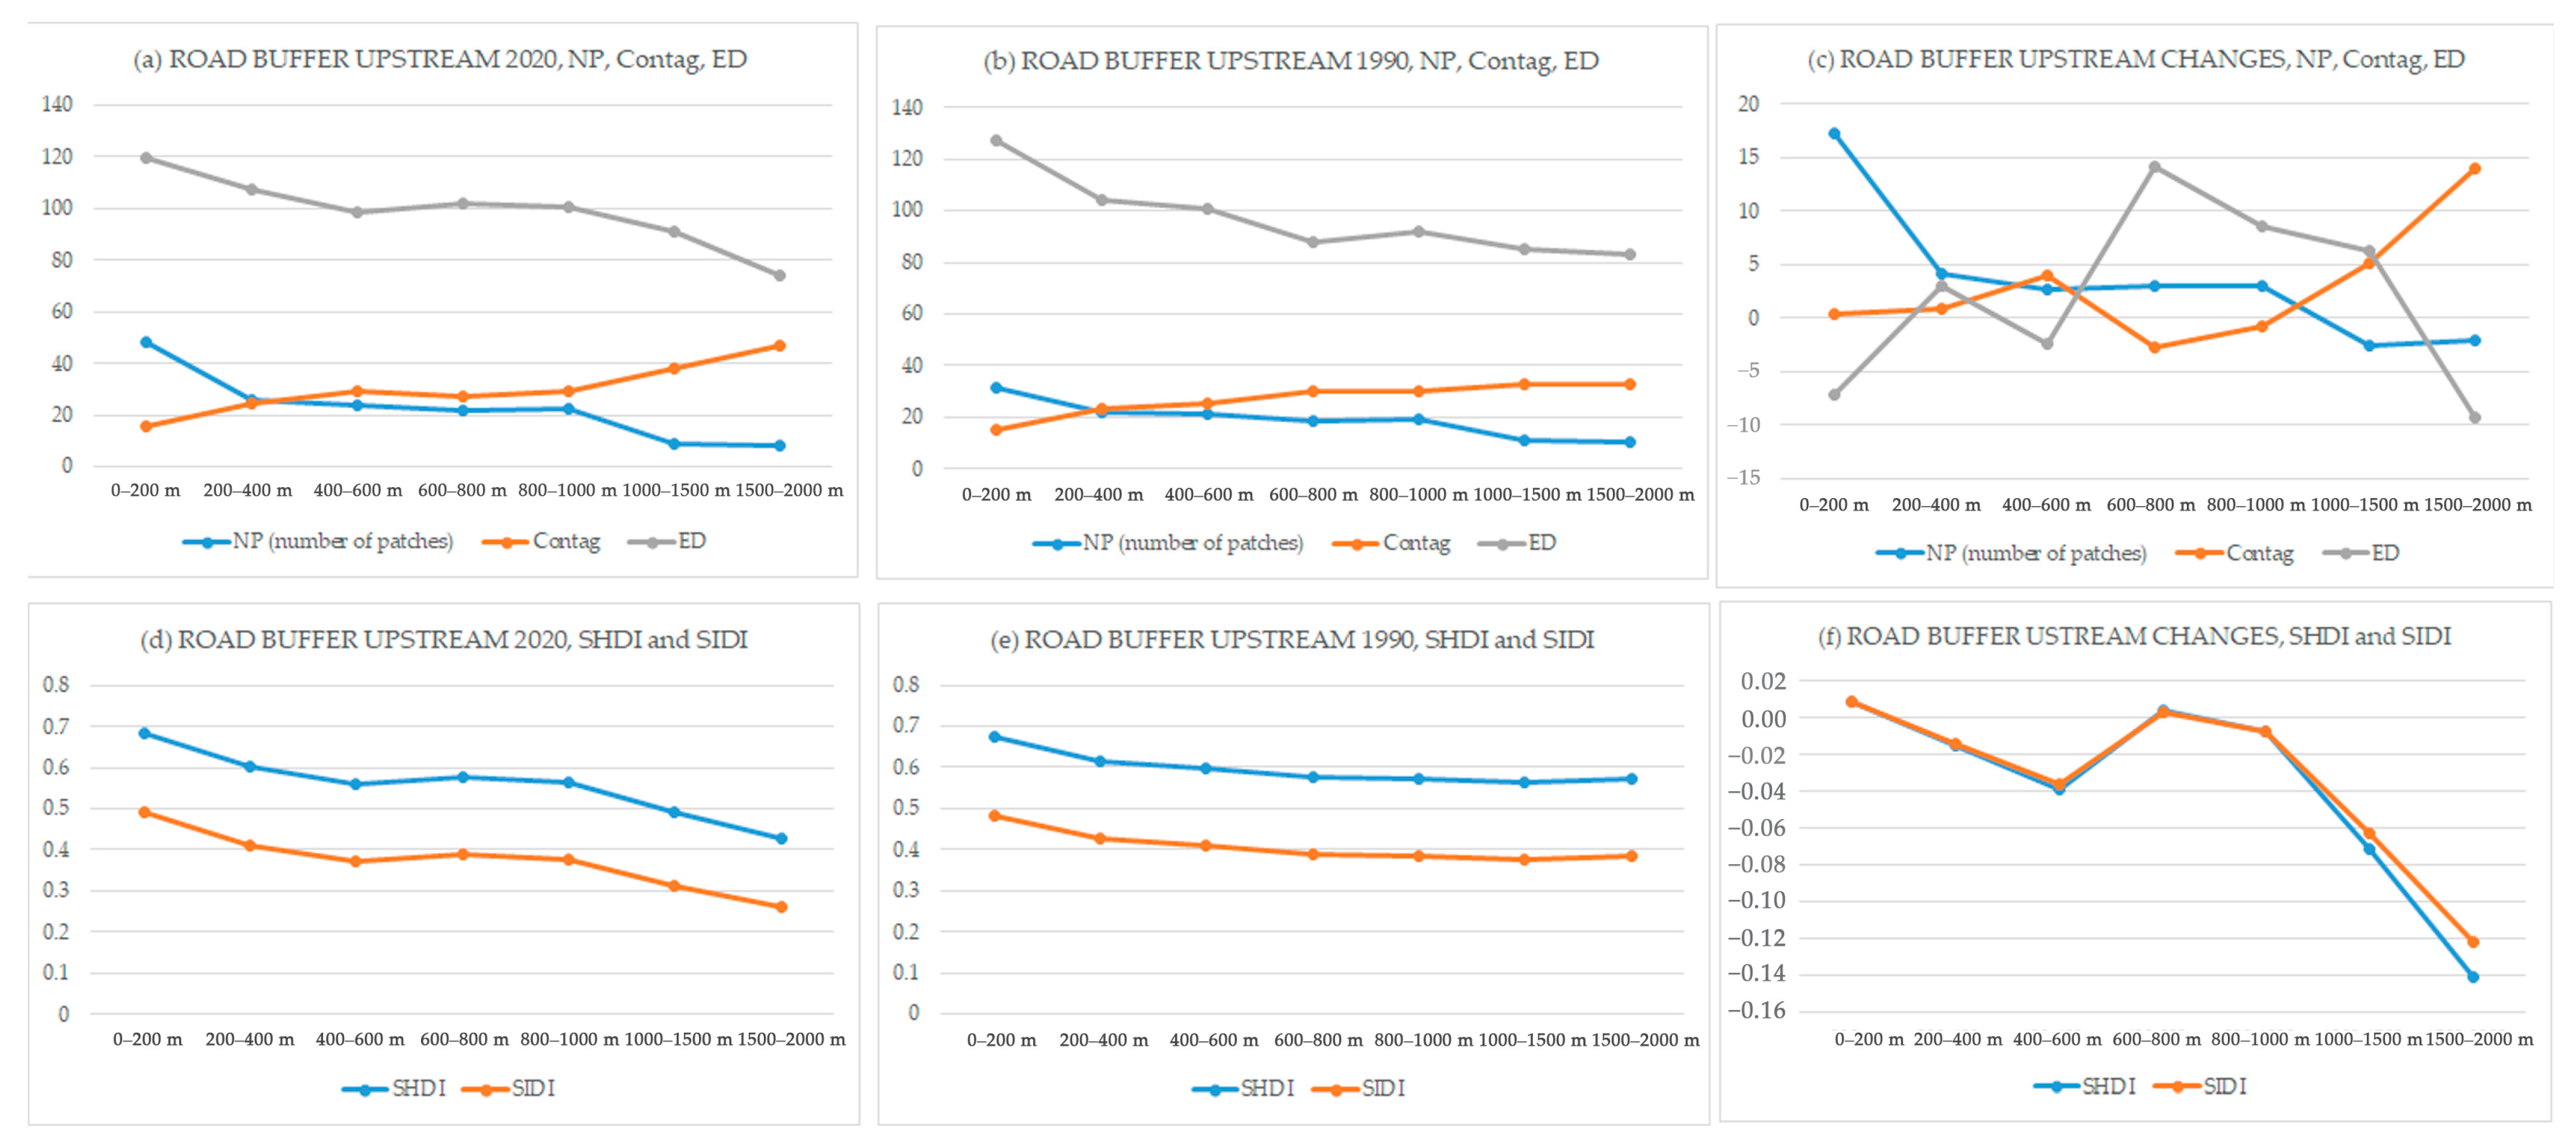
Upstream Road Buffer
Based on
Figure 9a,b, the NP in the upstream Ciliwung River/watershed, as a measure of fragmentation, shows a general decrease as the distance from the road increases for both the 1990 and 2020 timeframes. The area closest to the road (under 200 m) is the most fragmented, with the highest % NP in both years (49% in 2020 and 31% in 1990). The change in NP between 1990 and 2020 is most significant near the road, showing a large increase of 17% within the “under 200 m” zone (see
Figure 9c). This trend gradually diminishes with distance, eventually becoming a negative change at the 1000 m–1500 m and 1500 m–2000 m buffer zones, indicating a decrease in fragmentation in those areas over time. Contag, which signifies greater connectivity, generally increases with distance from the road for both 1990 and 2020, with the lowest values consistently found in the “under 200 m” buffer zone (
Figure 9c).
ED, which indicates higher patchiness, shows the opposite trend, with values generally decreasing as the distance from the road increases for both timeframes. This suggests that the area closest to the road is the most fragmented and least connected, as evidenced by a high ED (
Figure 9a,b). The changes in ED between 1990 and 2020 fluctuate across the buffer zones, while the changes in Contag generally increase with distance, showing a significant increase of 14 units at the furthest buffer zone (see
Figure 9c).
SHDI and SIDI consistently decrease with increasing distance from the road in both 1990 and 2020 (
Figure 9d,e). The highest diversity values for both timeframes are found in the “under 200 m” zone, dropping off significantly in the more distant buffer zones. The graphs show that the decrease in diversity is steeper for the 2020 data compared to the 1990 data, particularly in the 1500 m–2000 m range. The changes in both SHDI and SIDI between 1990 and 2020 are predominantly negative, indicating a decrease in diversity over time, with the most significant drop occurring beyond the 800 m buffer zone (see
Figure 9f). The table for the road buffer changes within the upstream area can be seen in
Appendix A,
Table A4.
Midstream Road Buffer
In 1990, the NP was highest near the road, within the under 200 m buffer, and decreased gradually with distance up to 1500–2000 m (
Figure 10b). However, the 2020 data presents a slightly different pattern, with the highest NP values observed near the road and again at the 1500–2000 m distance, creating a shallow U-shape on the graph (
Figure 10a). The change in NP between 1990 and 2020 was highest at the 1500–2000 m distance, with a difference of 60% (
Figure 10c).
The Contag in 1990 showed a pattern opposite to that of the NP, increasing with distance from the main road (
Figure 10b). In 2020, the Contag index followed a similar U-shaped pattern to the NP, with the highest values observed at the 1500–2000 m distance (
Figure 10a). The greatest negative change in the Contag index, indicating an increase in patchiness, occurred in the 1000–1500 m buffer with a decrease of 30 points between 1990 and 2020 (
Figure 10c).
In 1990, the ED had a pattern similar to the NP, decreasing from the 200 m buffer toward the 2000 m buffer (
Figure 10b). The pattern in 2020 was the opposite, with ED increasing until it peaked at the 800–1000 m buffer before declining toward 2000 m (
Figure 10a). The change in ED between 1990 and 2020 increased steadily from the road until reaching its peak difference within the 800–1000 and 1000–1500 m buffers, with a difference of 39 points in both areas (
Figure 10c). This significant change suggests that these areas became more fragmented and patchier over the 30-year period.
In 1990, SHDI and SIDI were highest near the road, in the under 200 m buffer, and gradually declined with distance up to 2000 m (
Figure 10e). The 2020 data shows a different trend, with both diversity indices starting low, increasing to a peak at the 1000–1500 m buffer, and then dropping sharply at the 1500–2000 m buffer (
Figure 10d). The changes in both SHDI and SIDI between 1990 and 2020 were most significant in the 1000–1500 m buffer, with positive changes of 0.26 and 0.24, respectively, indicating that diversity increased in this area over the period (
Figure 10f). At the 1500–2000 m buffer, however, the changes in the NP were high, which indicates greater fragmentation. Despite this, the diversity indices remained lower, showing only a slight increase in diversity compared to the peak observed at 1000–1500 m. Road buffer changes within the midstream area are shown in
Appendix A,
Table A5.
Downstream Road Buffer
Based on
Figure 11a,b, in 1990, the NP for the downstream road buffer of the Ciliwung River generally decreased from under 200 m to 2000 m. In contrast, the NP in 2020 showed a different trend, initially decreasing and then increasing, with a slight drop between 1000 and 1500 m before increasing again toward 2000 m.
The change in NP from 1990 to 2020 was a general increase across all buffer zones, with the highest increase observed in the 1500–2000 m zone (
Figure 11c). This suggests that the area became more fragmented or “patchy” over the 30-year period, particularly at a greater distance from the main road.
The contagion index (Contag) in 1990 followed a similar pattern to NP, decreasing from under 200 m to 1500 m. However, unlike NP, it then increased dramatically within the 1500–2000 m buffer. In 2020, the contagion index, however, generally followed the same pattern as NP (
Figure 11a,b). The highest increase in the contagion index from 1990 to 2020 was observed in the 800–1000 m buffer with 31 unit changes. This indicates an increase in connectivity within this area (
Figure 11c).
The ED showed an opposite pattern to the contagion index in both 1990 and 2020. In 1990, the ED was highest in the 1000–1500 m buffer zone, while in 2020, the highest ED value was in the 1500–2000 m zone (
Figure 11a,b). A higher ED indicates a more fragmented and patchy landscape. The changes in ED from 1990 to 2020 show a negative trend in most buffer zones, indicating a decrease in ED from 1990 to 2020. This suggests the area became less fragmented, with the exception of the 1500–2000 m zone, which saw a significant increase (
Figure 11c).
The diversity indices, including SHDI and SIDI, both showed almost a similar trend in 1990 and 2020 (
Figure 11d,e). In 1990, both indices generally increased gradually from under 200 m to 1500 m and then dropped. The 2020 data followed a similar pattern, although a slight decrease was observed within the 600–1000 m range.
The changes in diversity indices from 1990 to 2020 showed a significant increase in the 1000–2000 m range (
Figure 11f). This indicates a greater difference in diversity between the two periods. The positive values suggest an increase in diversity, which stands in contrast to other buffers that showed a decrease in diversity over the 30-year period, specifically in the 200 m to 1000 m buffers.
Based on the analysis of these landscape metrics, it appears that significant development or land-use change occurred in the downstream Ciliwung River road buffer. The NP was initially highest near the road in 1990, but by 2020, the NP had increased across all buffer zones, with the highest NP still located close to the main road (see
Figure 11a,b).
The data also indicates that the highest level of fragmentation and landscape change took place in the buffer zones starting from 800 m away from the roads, with the most pronounced changes occurring in the 1500–2000 m zone (see
Figure 11c). The trends of high changes in NP and ED, combined with high diversity indices and low Contag, all point to increased patchiness and less connectivity in the outer buffer zones over the 30-year period.
The table for the road buffer changes within the downstream area can be seen in
Appendix A,
Table A6.
Across the upstream, midstream, and downstream segments, the highest NP in both 1990 and 2020 consistently occurred in the buffer zone closest to the main road (under 200 m buffer zone), indicating that these areas were the most fragmented. In the upstream segment, this fragmentation near the road correlates with high ED, high diversity, and low Contag.
In the midstream and downstream segments, however, the most significant changes in fragmentation between 1990 and 2020 occurred within the 1500–2000 m buffer zone, which is furthest from the main road.
For the midstream segment, the increase in fragmentation is supported by a large positive change in NP, particularly in the 1500–2000 m buffer zone where the change was highest. The ED also showed significant positive changes within the 800–1500 m buffers, peaking at a 39-point increase, which indicates increased patchiness and fragmentation in these areas. However, the change in ED drops significantly in the 1500–2000 m buffer. When combined with the high NP change, this suggests that while the landscape became more fragmented and scattered into individual patches, the overall shape complexity of those patches decreased. This outcome aligns with findings on the effects of negative fragmentation [
45,
46].
Additionally, despite the fragmentation, there was a notable increase in diversity in the 1000–1500 m buffer, suggesting a more complex pattern of land-use change. This indicates that new types of land cover were introduced, even as the overall landscape became more fragmented and isolated.
In the downstream segment, the highest increase in fragmentation, as measured by a large positive change in NP, occurred in the 1500–2000 m buffer zone. This is further supported by a significant increase in ED in this same zone, indicating the creation of more patches with complex edges.
However, the data reveals a more nuanced picture. Contrary to a simple fragmentation narrative, there was a significant increase in connectivity (positive value change in contagion) in the 800–1000 m zone. This indicates that some parts of the landscape became more connected over the period.
Furthermore, the diversity indices (SHDI and SIDI) showed a general decrease from 1990 to 2020 within the 200–1500 m buffers. This trend then reverses, with a significant increase in diversity in the 1500–2000 m buffer, which stands in contrast to the trends observed in the midstream and upstream segments. This suggests that while fragmentation increased, it also led to a more diverse landscape in the areas furthest from the main road.
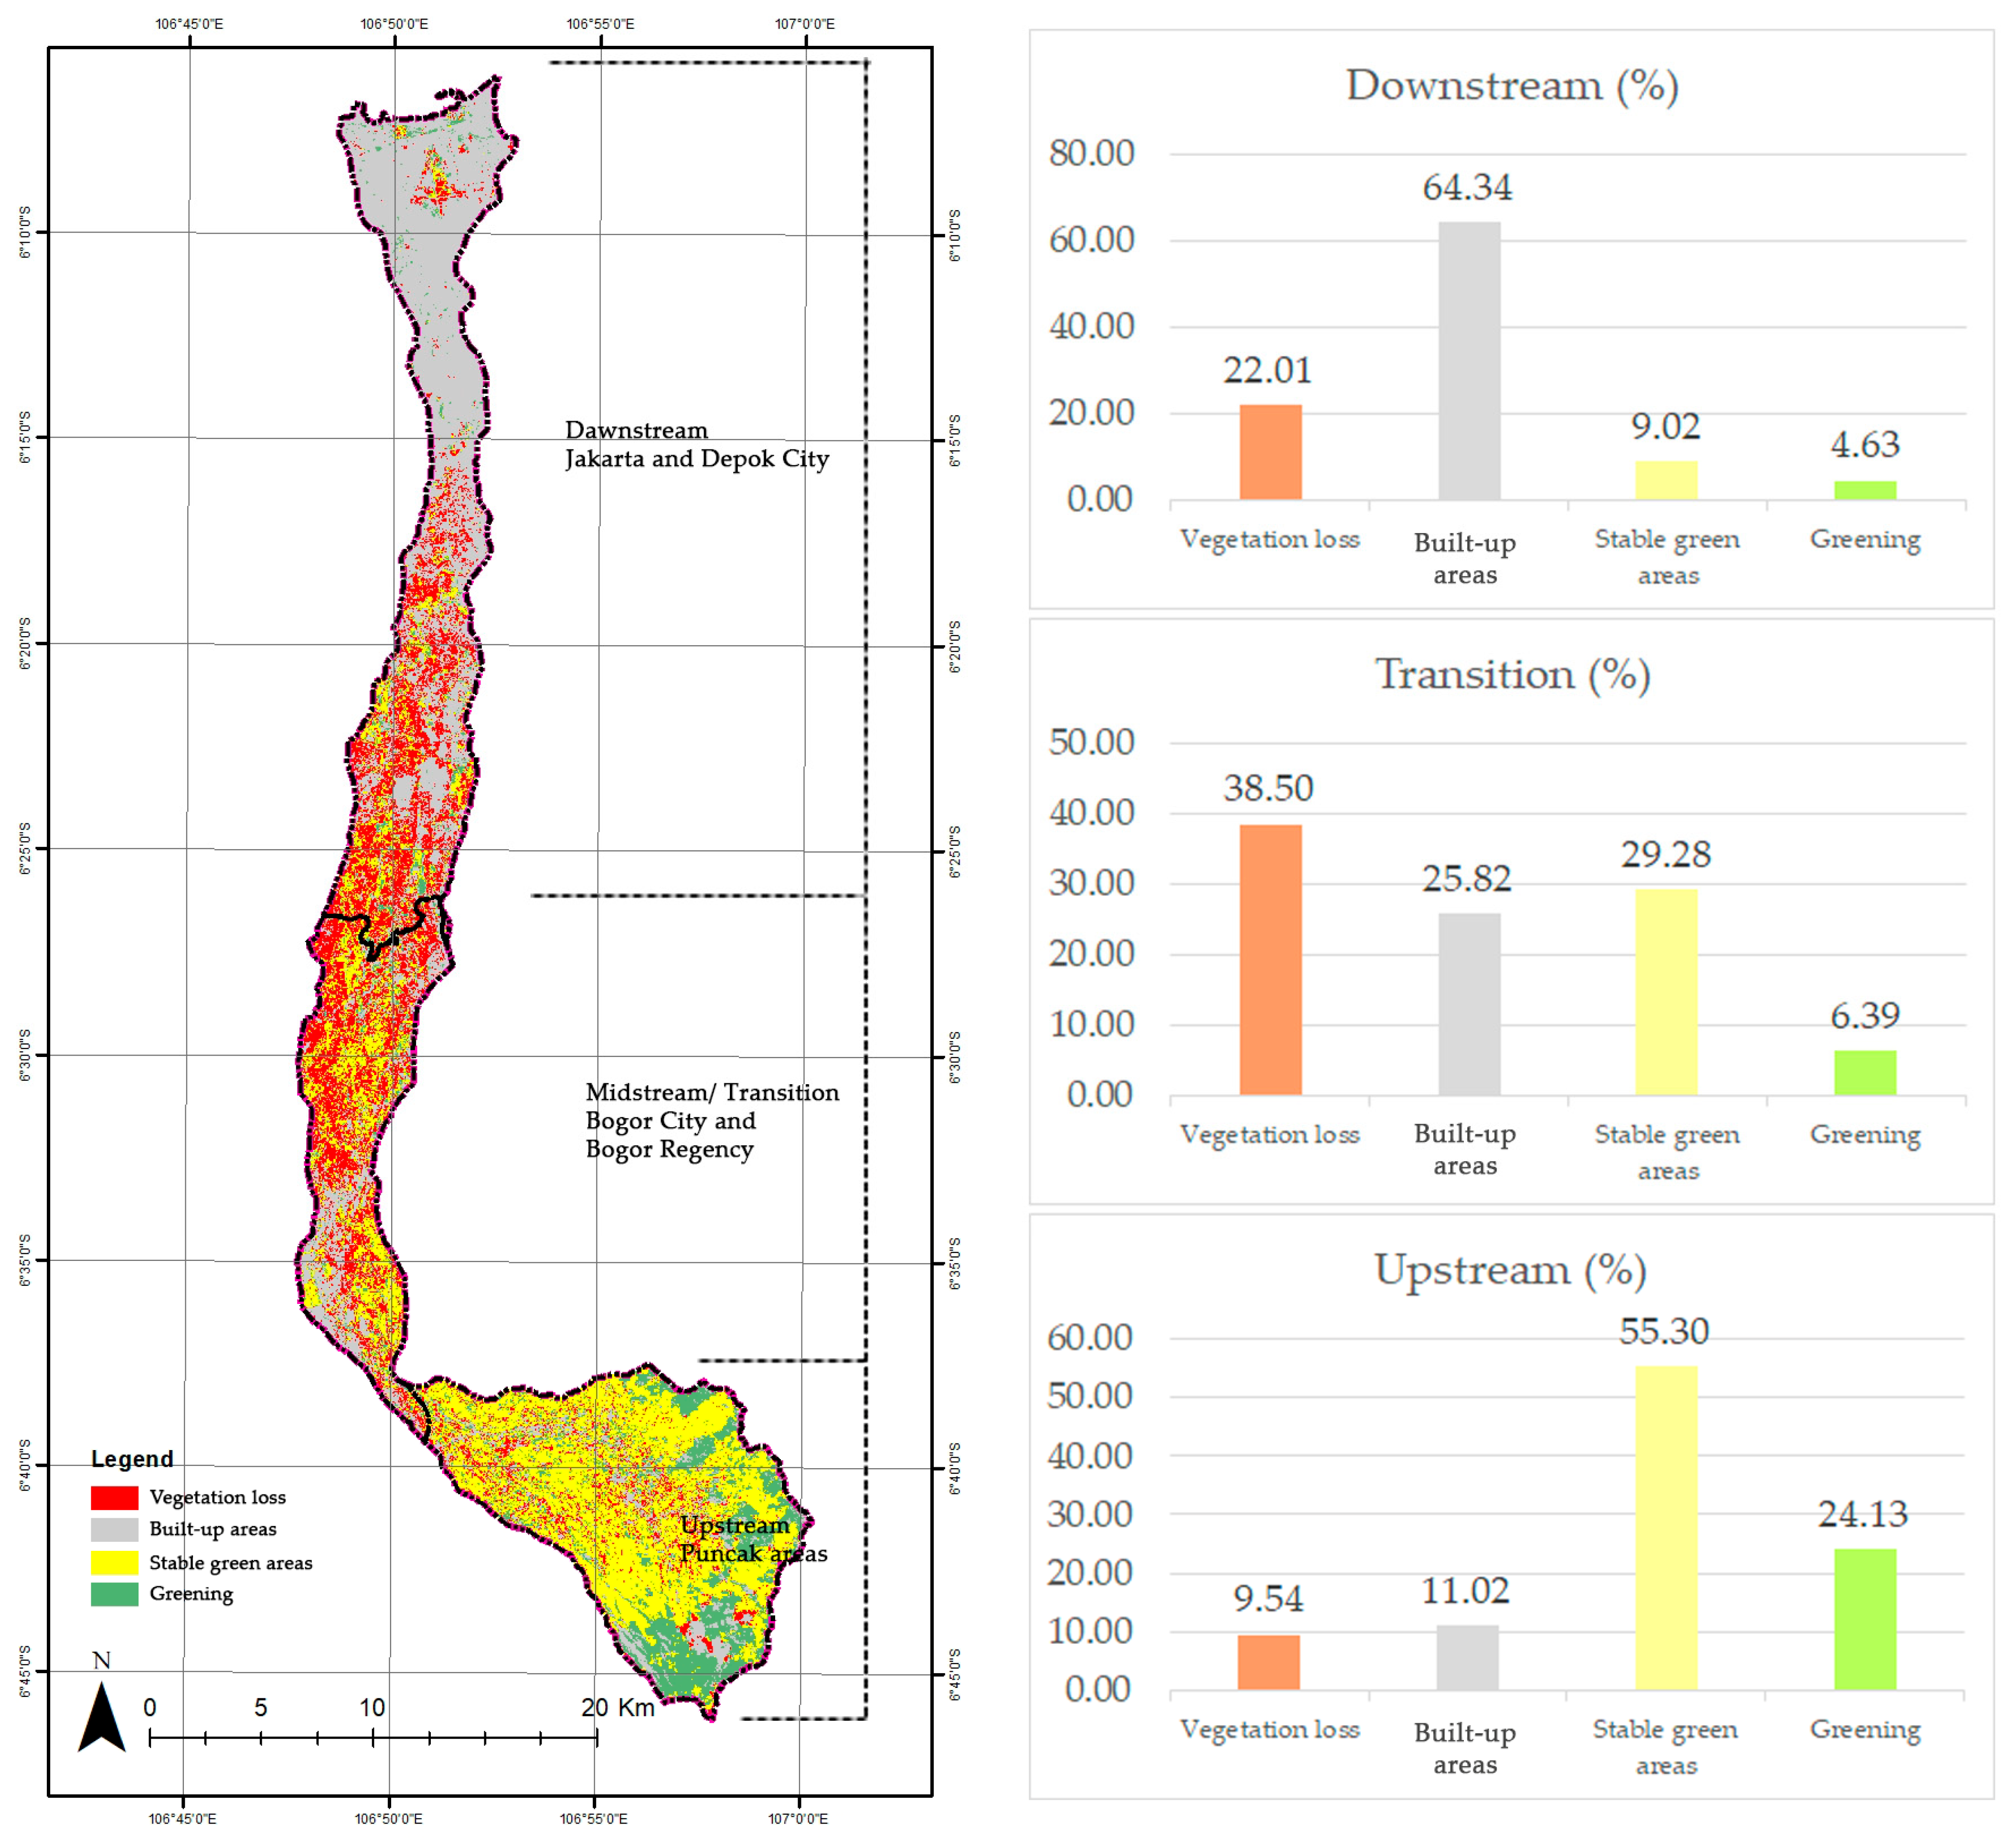
To sum up, while the area near the main road is consistently the most fragmented across all three segments, the most significant changes in fragmentation from 1990 to 2020 took place further from the road in the midstream and downstream areas. This fragmentation condition impacts LULC change. Specifically, the built-up area, including settlements, expanded within the study timeframe in both the midstream and downstream areas, heavily occurring far from the main road networks. In contrast, the upstream zone’s LULC change is characterised by ribbon infrastructure, with built-up areas predominantly dominating the land directly along the main road. These changes are not uniform and show complex interactions, such as increased fragmentation alongside increased diversity and, in some cases, increased connectivity.


