Abstract
With the rapid advancement of urbanization, urban heat environment issues have become increasingly severe, presenting significant challenges to sustainable urban development. Although previous research has demonstrated the substantial impact of urban morphology on land surface temperature (LST), there is still a lack of comprehensive research on the non-stationary effects of urban morphology on seasonal LST at the block scale. Therefore, this study establishes a comprehensive research framework, utilizing urban functional zones in the core area of Chongqing as the primary research unit, to investigate the seasonal fluctuations in the spatial distribution of LST across various functional zones. Combining Random Forest (RF) with multiscale geographically weighted regression methods (MGWR), the study systematically analyzes the numerical and spatial distribution characteristics of how urban morphology factors influence LST from global and local perspectives. The results indicate that (1) the LST in central Chongqing exhibits marked seasonal variation and a distinct “mountain-water pattern,” with industrial zones consistently hotter and public service areas cooler; (2) biophysical surface parameters and building morphological indicators make a high relative contribution to LST changes across seasons, particularly in public service and commercial areas; (3) building density (BD) and biophysical surface parameters primarily exert local impacts on LST changes, while floor area ratio (FAR) and building height range (RBH) have a global effect. These findings provide new insights into the driving mechanisms of urban heat environments and offer scientific evidence for regulating and mitigating urban heat environment issues across different seasons and urban types.
1. Introduction
With the continuous advancement of urbanization, the original land use/land cover types and spatial morphology of urban surfaces have undergone significant transformations. High-rise buildings and impervious surfaces have progressively emerged as dominant features of urban landscapes. The proliferation of impermeable surfaces exacerbates surface runoff and reduces water infiltration, thereby triggering a series of ecological and environmental challenges, among which the urban heat island (UHI) effect is particularly notable. The increase in urban surface temperature is primarily driven by multiple mechanisms, including enhanced absorption of solar radiation by low-albedo materials, reduced evapotranspiration resulting from vegetation loss, restricted air circulation due to compact urban morphology, and additional anthropogenic heat emissions. The UHI effect describes the phenomenon in which air or surface temperatures in urban areas are significantly elevated compared to those in adjacent suburban or rural regions [1]. This phenomenon not only alters the local climate of urban environments but also induces various adverse consequences, such as air pollution [2] and increased energy consumption [3,4], which negatively affect human health and sustainable development. Therefore, investigating the spatiotemporal characteristics and influencing mechanisms of UHI is crucial for addressing urban environmental issues and promoting sustainable and harmonious urban development.
Urban morphology reflects the generation, structure, and evolution of urban systems, encompassing both physical configurations and socioeconomic processes shaped by human activities. In this study, the concept of urban morphology is broadly defined to include not only the spatial layout of surface landscapes but also the composition and configuration of physical elements such as buildings and vegetation. The urban thermal environment is influenced by a multitude of factors, encompassing climate changes, land use, urban form and human activity perspectives. For instance, a study has shown that climate warming may delay the onset of precipitation in tropical regions, which in turn exacerbates summer heat and enhances the occurrence of extreme heat events [5]. In addition, studies have demonstrated significant correlations between the urban thermal environment and land cover characteristics, including, morphological characteristics [6], and spatial configurations [7], among others. For instance, Lin et al. (2024) [8] reported that the largest patch index of building patches (LPI_B) exerted the most substantial influence on diurnal LST changes, while the interaction between the largest patch indices of vegetation (LPI_V) and LPI_B notably amplified daytime LST. Building-related parameters such as the height [9], mean building height (MBH) [10], height variance [11], sky view factor [12], and floor area ratio [13] are commonly employed to characterize urban morphological structures and are widely acknowledged as key determinants influencing LST. These parameters can affect urban thermal conditions through mechanisms such as surface insulation, shading effects, and airflow regulation [14]. Notably, Mo et al. (2024) [15] observed that MBH can mitigate urban thermal conditions, with its effects varying seasonally. In addition to building morphology, urban trees serve as an effective natural intervention for mitigating urban heat [16], with numerous studies identifying a strong negative relationship between tree canopy height and LST [17]. Furthermore, variables such as population density and nighttime light intensity, reflective of human activity and socioeconomic conditions, are increasingly incorporated into studies of urban thermal environments [18]. Therefore, in this study, characteristics of human activities are also regarded as integral components of urban morphology in a broad sense, reflecting both physical and functional aspects of urban environments.
To systematically investigate the driving mechanisms underlying urban thermal environments and the spatiotemporal heterogeneity of UHI effects, it is essential to not only select appropriate influencing factors but also adopt suitable spatial analysis units and effective modeling approaches. In terms of spatial units, early studies predominantly employed geometric frameworks such as regular grids or multi-ring buffers. However, these units often fail to accurately capture the internal spatial structures of cities [19]. With the growing understanding of urban microclimates, Local Climate Zones (LCZs) have been widely utilized in thermal environment studies [20]. Nevertheless, LCZ classification primarily considers building compactness, height, and surface cover types [21], neglecting socioeconomic activities, which are critical sources of urban thermal emissions. Consequently, this approach presents certain limitations. In contrast, Urban Functional Zones (UFZs), which reflect diverse human activities and corresponding land use variations [22], offer a more comprehensive representation of urban spatial heterogeneity. Investigating the effects of urban morphological features on LST across different temporal periods and UFZs can provide more targeted insights for mitigating urban thermal risks.
In terms of methodology, previous studies have predominantly employed both linear and nonlinear models to examine the relationship between urban morphological factors and LST. Early research primarily utilized linear models such as correlation analysis [23], principal component analysis [24], ordinary least squares (OLS) [25], and multiple linear regression (MLR) [26] to explore the influence of influencing factors on heat environment variations. However, these models typically assume a linear association between predictors and outcomes, making them highly sensitive to outliers and inadequate for representing complex nonlinear processes, potentially leading to biased conclusions [27]. For example, Wan et al. (2025) [28] demonstrated that, when evaluating the effects of environmental characteristic indicators on LST and its spatial heterogeneity, MLR exhibited significantly inferior performance compared to machine learning approaches. Machine learning models, which iteratively optimize variable weights and biases over large datasets, have demonstrated superior capabilities in capturing nonlinear relationships. Methods such as boosted regression trees [29], random forest (RF) [30], and extreme gradient boosting (XGBoost) [31], gradient boosted regression trees [32] have been widely adopted. For instance, Khanifar and Khademalrasoul (2022) [33] employed XGBoost to analyze the spatiotemporal variations in LST and its relationship with multiscale terrain curvature in southwestern Iran, while Suthar et al. (2024) [34] used RF to predict LST in Bangalore and examine its association with urban morphology and air pollution. Similarly, Li et al. (2024) [35] confirmed the effectiveness of RF in capturing the nonlinear effects of urban form on thermal environments. Despite these advancements, both linear and nonlinear models often assume spatial stationarity, overlooking the spatial heterogeneity in the relationships between explanatory variables and LST [36]. To address this limitation, spatial regression models such as the geographical detector, spatial error model, and spatial lag model have been increasingly applied to explore spatial variations and determinants of LST [37]. Building on this, geographically weighted regression (GWR) and its extended forms have gained prominence for modeling spatially non-stationary relationships by constructing localized regression models at each spatial location. Multiscale geographically weighted regression (MGWR), an advancement over GWR, further enhances analytical precision by allowing each explanatory variable to operate at an individually optimized spatial scale and bandwidth [38]. For instance, the effect of building height on LST may be highly localized, whereas the influence of vegetation cover or water bodies may manifest over broader areas. By calibrating bandwidths for each variable individually, MGWR can more accurately capture scale-dependent spatial heterogeneity, reduce model bias, and provide nuanced insights into how generalized aspects of urban form influence LST differently across various areas of a city.
Although numerous studies have explored the influence of urban morphology indicators on LST from either a quantitative perspective or in terms of spatial heterogeneity—such as Liu et al. (2024) [39] who applied RF to assess the contributions and marginal effects of urban form factors on seasonal LST variations in Guangzhou, and Xu et al. (2024) [40], who used MGWR to examine the spatial patterns of the UHI and evaluate the spatial heterogeneity of urban morphological influences—few have systematically integrated these two methodological approaches. Specifically, existing studies face two main limitations: first, relatively few have simultaneously considered the nonlinear relationships and spatial distribution characteristics of influencing factors, making it difficult to comprehensively understand the underlying mechanisms; second, there is a methodological gap wherein quantitative models, though effective in identifying key variables, often fail to reflect their spatial heterogeneity, while spatial regression models capture spatial variation but lack the ability to model complex nonlinear interactions among variables. To address these limitations, this study attempts to integrate the interpretable RF algorithm with the MGWR, constructing a comprehensive analytical framework that can capture both nonlinear impacts between urban morphological factors and LST and reveal their spatial heterogeneity. This framework addresses the limitations of current methods in modeling nonlinear relationships and spatial distribution, providing a more comprehensive and precise framework for understanding the complex driving mechanisms of urban thermal environments.
Based on this framework, the study focuses on the central urban area of Chongqing and aims to systematically analyze the impact mechanisms of various urban morphological factors on seasonal LST across different functional zones. Specifically, the objectives of this study are: (1) to analyze the seasonal variations in LST across different functional zones; (2) to quantify the influence of urban form characteristics on LST during different seasons and further explore the marginal effects of these factors and their interactions; (3) to investigate the spatial heterogeneity of urban form impacts on LST. The findings of this research are expected to deepen the understanding of the driving mechanisms of LST and provide scientific support and theoretical guidance for urban planners and policymakers in managing thermal environments across different seasons and functional areas.
2. Study Area and Data
2.1. Study Area
Situated in the upper reaches of the Yangtze River, Chongqing is a typical mountainous city with a complex and highly undulating topography. It is densely populated and economically dynamic, with the urban green coverage rate surpassing 43%, which is crucial for the region’s ecological balance and livability. It belongs to the subtropical monsoon humid climate zone, where high summer temperatures are particularly notable, often exceeding 35 °C, and in some areas surpassing 40 °C. Due to its complex topography, Chongqing’s urban development mostly focuses on places with mild slopes and valley bottoms. The urban building clusters exhibit high-density and high-rise layouts, which impede airflow circulation due to their dense and irregular arrangement. This obstruction exacerbates heat accumulation, intensifying the urban heat island effect and posing multifaceted challenges to ecology, environment, society, and public health. Therefore, analyzing the impacts of urban characteristics within different functional areas of the central urban region of Chongqing on the seasonal surface heat environment holds significant research importance. Such an analysis could also provide a scientific foundation for developing targeted heat environment mitigation strategies applicable to other mountainous cities with similar geographic characteristics. This study focuses on the built-up areas of the central urban region as the research subject (Figure 1).
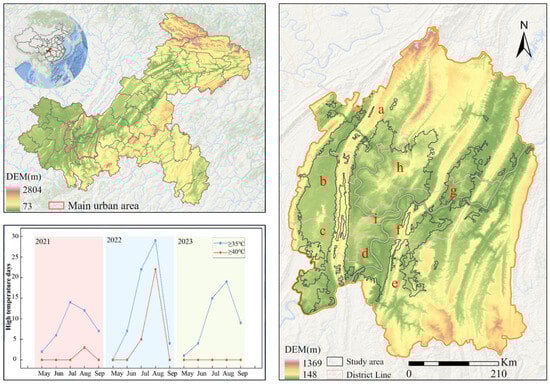
Figure 1.
The location of the study area. (a–i represent Beibei, Shapingba, Jiulongpo, Dadukou, Banan, Nan’an, Jiangbei, Yubei, and Yuzhong districts, respectively).
2.2. Data Sources
Multi-source datasets (Table 1) were collected for this study. Among them, OSM road data was used to delineate the basic research units. The Landsat 8/9 collection-2 level-2 dataset (Landsat 8/9 C2L2) was acquired by the Google Earth Engine (GEE) platform for LST processing and surface biophysical parameter calculations. The land use data were produced and provided by Yang and Huang (2021) [41], which were utilized to compute landscape indicators reflecting the land cover characteristics of the functional areas. Shi et al. (2024) [42] created and provided a building dataset that includes floor information and the footprint of the building, which is utilized to construct building form indicators. Building heights were completed by estimation, with an average height of 3.5 m for buildings with 6 floors and below, and an average height of 3 m for buildings with more than 6 floors [43]. Point of interest (POI) data were obtained from the Amap online platform for extracting functional area classification features related to socioeconomic characteristics. Sentinel-1A Level-1 GRD data and Sentinel-2A/B data were downloaded from the ESA Copernicus data ecosystem to extract texture features and reflectance for functional area identification. SDG-1 image data from the SDGSAT-1 Open Science Program website were used to derive nighttime lighting (NTL) information that reflects socioeconomic conditions. Landscan population data from the U.S. Department of Energy’s Oak Ridge National Laboratory (ORNL) were used to characterize the intensity of human activity. Canopy height data were produced by Lang et al. (2023) [44] to explore the effect of trees on surface temperature. Digital Elevation Model (DEM) data were obtained from NASA to reflect topographic differences within different functional blocks.

Table 1.
Data sources and description.
3. Methods
This study proposes an analytical framework based on urban functional zones that integrate RF and MGWR to explore the spatiotemporal heterogeneity of LST and how urban morphological factors affect LST in different seasons and urban functional zones (Figure 2). The framework consists of the following steps: First, urban functional zones are identified using multi-source data. Second, Landsat 8/9 C2L2 data are used to process the LST over four seasons and calculate surface biophysical parameters. Subsequently, urban morphological features are extracted by integrating land use data, building data, and other relevant sources. These features include 2D metrics, 3D metrics, and human activity intensity indicators, which are then allocated to each basic unit. Finally, an explainable RF and MGWR are applied to systematically analyze the relationships between urban morphological features and LST across different seasons and functional zones, revealing their spatiotemporal heterogeneity and driving mechanisms.
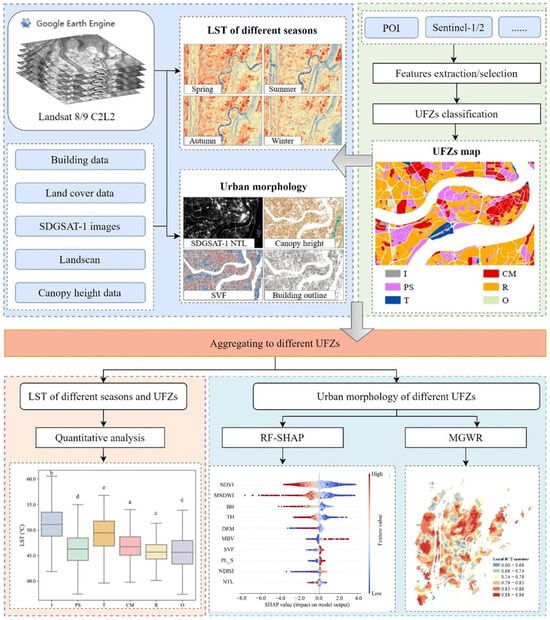
Figure 2.
The flowchart of this study.
3.1. Identification of Urban Functional Zones
In this research, we use the OSM road data to delineate basic research units. Subsequently, functional zoning is performed by integrating texture features and reflectance information extracted from Sentinel-1A and Sentinel-2A/B data, socioeconomic characteristics represented by POI data, building morphological features derived from building data, and so on. Support Vector Machine (SVM), Light Gradient Boosting Machine (LightGBM), and Adaptive Boosting (Adaboost) were identified as base classifiers for categorization based on experimental results in our previous study. According to the Urban Land Classification and Planning Construction Land Use Standards (GB50137) and the classification criteria of the Third National Land Survey, a majority voting ensemble approach is employed to classify research units into six land use types: industrial land (I), public service land (PS), transportation hub land (T), commercial land (CM), residential land (R), and other land (O) (Table 2). The classification in this study is based on the actual urban planning context of the study area. For other regions, especially different countries, adjustments can be made with reference to their respective urban planning systems. The functional zone identification results are primarily based on field-collected sample data, and the classification accuracy was evaluated using overall accuracy and the Kappa coefficient.
Table 2.
Description of the urban functional zones.
3.2. Processing of Land Surface Temperature and Urban Morphological Factors
This study uses the surface temperature (ST) data from the USGS Landsat Collection 2 dataset (https://www.usgs.gov/landsat-missions/landsat-collection-2-level-2-science-products) as the data source for processing LST. The surface temperature products of Landsat 8/9 (ST) are generated based on the Thermal Infrared Sensor (TIRS) Band 10 data from Collection 2 Level-1, combined with information such as top-of-atmosphere (TOA) reflectance and TOA brightness temperature (BT). These products are produced with the Landsat Surface Temperature Algorithm (version 1.3.0), collaboratively developed by the Rochester Institute of Technology and NASA’s Jet Propulsion Laboratory. The Landsat 8 product’s error is −0.56 K, and its uncertainty has been tested in various scenarios. Scientific evaluations have demonstrated the product’s great reliability and robustness [45,46]. The ST product is provided in Kelvin. Therefore, after image mosaicking and clipping on the GEE platform, the following formula is used for unit conversion to ensure that the land surface temperature is expressed in degrees Celsius:
where DN represents the DN value of the ST_B10 band.
Following Lu et al. (2023) [47], we categorized LST into five distinct classes—low, sub-low, moderate, sub-high, and high—by applying a mean-standard deviation scheme with 0.5 standard-deviation increments.
The city functions as an intricate system, intimately shaped by its physical form and diverse landscape constituents. This study follows the principles of data accessibility, scientific rigor, and wide applicability, as established by prior research. From the perspectives of 2D, 3D, and human activity, a series of widely used urban morphological indicators were selected to comprehensively describe urban morphological characteristics (Table 3).
Table 3.
Definition of urban morphology factors.
Previous studies have shown a significant correlation between landscape indices and LST [48]. Landscape metrics play a crucial role in urban thermodynamics by regulating heat retention and influencing energy exchange processes [49].Given that the primary focus of this study is on urban landscapes, four land use types—vegetation, bare land, impervious surfaces, and water—were selected to represent different landscape characteristics. Three commonly used indicators were employed to quantify landscape composition and spatial configuration from the perspectives of land use abundance and irregularity.
Additionally, surface biophysical parameters, which regulate the urban thermal environment by influencing energy exchange processes and vegetation-driven cooling effects [50], are often considered important influencing factors of LST [51]. Therefore, this study selected the Normalized Difference Vegetation Index (NDVI), the Modified Normalized Difference Water Index (MNDWI), and the Normalized Difference Impervious Surface Index (NDISI) to reflect the biophysical characteristics of vegetation, water, and impervious surfaces, respectively.
Besides surface cover types, building morphology also exerts a considerable influence on surface temperature by altering airflow, radiation, and energy balance within urban blocks, as revealed in previous studies [52,53]. Based on existing literature, this study selected typical indicators from the perspectives of density, area, height, and structure to describe building morphology. Human activities also impact changes in LST [54,55], so population density and nighttime light indices were selected to represent human economic activities. Considering the study area is a typical mountainous city, the DEM was also included in the selected indicators. Among these factors, NDVI was calculated separately for each of the four seasons. The remaining indicators, such as NDISI, do not exhibit significant seasonal variation; hence, their values were kept constant across all four seasons. The spatial texture pattern corresponding to the above indicators is illustrated in Figure 3.
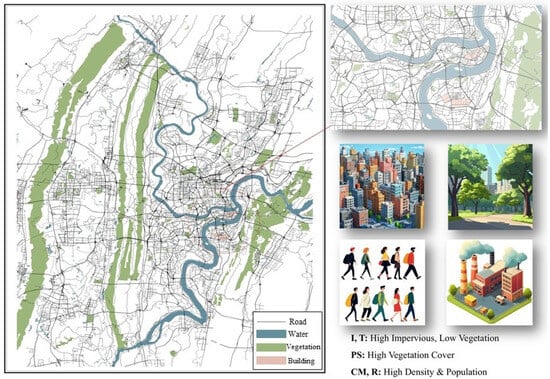
Figure 3.
Spatial characteristics of the urban fabric.
3.3. Evaluating the Effects of Urban Morphological Characteristics on LST
3.3.1. The Global Quantitative Analysis Model
Building upon a comparative analysis of seasonal LST fitting accuracy between RF and XGBoost models (Figure S1), this study employs RF to explore the nonlinear associations between urban morphological factors and the urban thermal environment. As an ensemble learning method, RF constructs multiple decision trees from distinct subsets of the data, thereby offering enhanced accuracy and stability compared to a single decision tree. It is widely used in both classification and regression tasks. Compared with other methods, RF effectively manages randomness in both samples and features, often achieving higher accuracy than linear models and various other nonlinear models [27]. Moreover, RF can efficiently assess the relative importance of each independent variable in predicting the dependent variable. However, RF does not explicitly account for spatial heterogeneity, as its regression analysis primarily relies on the numerical values of the input features. Accordingly, RF is treated as a global interpretation model in this study.
Although RF can partially address multicollinearity issues among variables, high multicollinearity may still affect the interpretability of its results. Therefore, this study firstly eliminates variables with a Variance Inflation Factor (VIF) greater than 10 through VIF testing to remove significant multicollinearity among indicators. Subsequently, the dataset is randomly divided into training (70%) and testing (30%) subsets. A ten-fold cross-validation method is then applied to quantify and rank the relative contributions of each indicator in influencing LST, thereby revealing the key factors influencing LST. The relevant hyperparameters of the RF model are optimized using a grid search method, as detailed in Table S1. In addition, we conducted a Sobol sensitivity analysis on the input variables and visualized the top ten variables that had the greatest impact on the results (Figure S2).
Since most advanced machine learning algorithms are considered black-box models [56], their reliability and transparency often require post hoc interpretability techniques to enhance understanding and trust. To this end, SHapley Additive exPlanations (SHAP) analysis is applied to interpret the impact of these influencing factors on LST. Drawing from the Shapley value concept in cooperative game theory, SHAP facilitates a detailed understanding of each feature’s contribution to the model’s predictions. Offering both global and local interpretability, SHAP is one of the most widely used interpretability frameworks.
For a model with N features, the Shapley value for feature i is determined by the following formula:
where N represents the set of all features, S is any subset of features that do not include the target features i, denotes the model’s prediction or output considering only the subset S, and represents the contribution on the model when the target feature i is added to the subset S.
3.3.2. The Local Spatial Non-Stationarity Impact Model
MGWR assigns distinct spatial scales to individual predictor variables, enabling a more nuanced characterization of the spatial relationships between predictors and the response variable. Compared with the traditional GWR, which assumes a single uniform bandwidth for all predictors, MGWR assigns variable-specific bandwidths, enabling the capture of both local and regional effects. In this study, the golden section search algorithm was employed to determine the optimal number of neighboring observations for each explanatory variable, with the minimum corrected Akaike Information Criterion (AICc) used as the evaluation criterion for selecting the optimal bandwidth. The MGWR’s formula is as follows:
where yi represents the dependent variable at the i-th observation point; is the intercept term; is the spatially varying coefficient of the k-th predictor; is the k-th predictor at the i-th observation point; represents the error term; and is the bandwidth of the k-th predictor, reflecting the extent of its spatial influence.
4. Results
4.1. The Result of Urban Functional Zones Mapping and LST Processing
The delineation of UFZs in Chongqing’s central urban region in this study predominantly emphasizes singular dominant functions, as illustrated in Figure 4a,b. The classification achieved an overall accuracy of 85.74% and a Kappa coefficient of 0.7942. In terms of land area proportions, public service land and residential land occupy the largest shares, whereas transportation hub facilities account for a relatively small proportion. Spatially, public service land exhibits a widespread and relatively balanced distribution, often located adjacent to residential areas. Transportation hub facilities exhibit significant spatial clustering in Yubei and Shapingba districts, while being sparsely distributed across other urban areas. Commercial land is mainly concentrated around significant commercial centers like Jiefangbei and Guanyinqiao, with radiation outward. Residential land is extensively distributed across the central urban area, typically forming relatively concentrated clusters. It is typically located near commercial and public service land while avoiding industrial areas. This spatial pattern aligns closely with the residential zone delineations in the secondary planning divisions of the Chongqing Metropolitan Territorial Spatial Master Plan (2021–2035), reflecting the city’s ongoing policy commitment to improving the quality of life for residents and advancing the equalization of basic public services. Industrial land is primarily located on the periphery of the central urban area, forming a ring-like distribution. Other land types are mainly found in transitional or marginal zones and exhibit a scattered, fragmented spatial pattern.
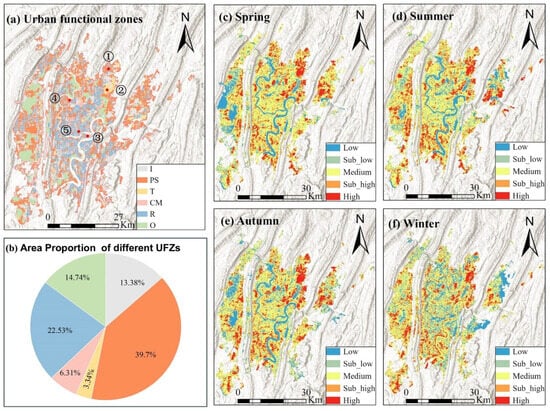
Figure 4.
Spatial distribution of UFZ and LST across different seasons. Panels (a,b) illustrate the urban functional zone mapping results, while panels (c–f) present the processed land surface temperature (LST) data for spring, summer, autumn, and winter, respectively. In panel (a), locations ① to ⑤ represent: ① Konggang, ② Jiangbei International Airport, ③ Jiefangbei, ④ Baiyun Mountain Park, and ⑤ Guanyinqiao.
Based on the processed LST results presented in Figure 4c–f, it is clearly evident that the spatial distribution of LST in Chongqing’s central area exhibits distinct “mountain-water city” characteristics. Cooler zones are mainly observed in the western part, while higher temperature zones dominate the east. A robust spatial association exists between the surface thermal environment and land cover types. Mountainous areas such as Tongluo Mountain, Zhongliang Mountain, and Jinyun Mountain, as well as river regions, including the Jialing River and the Yangtze River, generally exhibit low-temperature zones. In contrast, medium, sub-high, and high-temperature zones are concentrated in the urban core and the northeast, where population density, building density, and economic activity are higher.
From a temporal perspective, the spatial distribution of the surface thermal environment within Chongqing’s central urban region demonstrates significant seasonal variation. Specifically, high-temperature zones are most extensive in summer, with high concentrations found in the northeastern, southern, and western regions. Additionally, high-LST areas reach their peak coverage during summer, accounting for 12.92% of the total area. The spatial patterns of high and sub-high temperature zones in spring and autumn are similar, primarily concentrated in certain core areas as well as the northeastern and southwestern directions. Low-LST regions are predominantly concentrated in the western region and along the Jialing and the Yangtze Rivers. In winter, high and sub-high temperature zones are more scattered, while sub_low and medium-temperature zones cover a broader range. Low-LST areas are primarily concentrated in the eastern region.
4.2. Variations in Seasonal LST Across Different Urban Functional Zones
The results (Figure 5) demonstrate that LST significantly differs among various functional zones within the same season, as determined by a one-way analysis of variance (ANOVA). Notably, the distribution of LST values within the same functional zone type varies considerably across seasons,
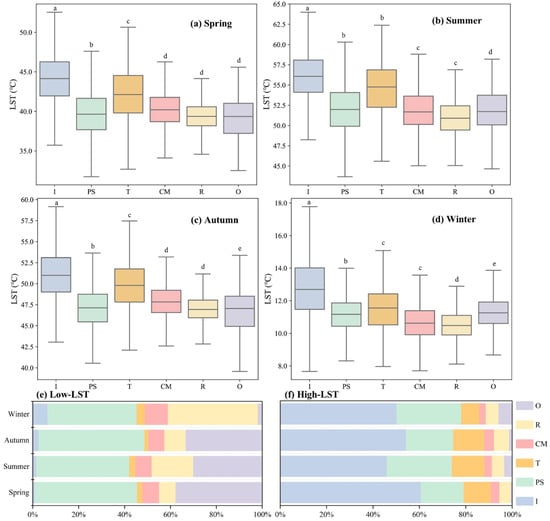
Figure 5.
(a–d) Boxplots of LST across UFZs demonstrate statistically significant differences in LST at p < 0.05, as denoted by different letters (a–e); (e–f) Bar charts showing the percentage of Low-LST and High-LST areas across different functional zone types.
Overall, LST reaches its peak in summer and its lowest levels in winter, with intermediate values in spring and autumn. Industrial and transportation hub areas exhibit particularly high surface temperatures, with industrial areas reaching an average summer LST of 56.11 °C, indicating severe thermal environmental issues. Additionally, industrial areas account for the largest proportion of high-LST areas across all seasons. Despite low population density, the high intensity of industrial activities, coupled with widespread energy-intensive equipment and impervious surfaces, leads to elevated LST in industrial areas. Transportation hub areas follow closely with an average summer LST of 54.14 °C. This phenomenon may be attributed to high population densities and energy consumption in this functional zone, resulting in increased anthropogenic heat emissions that influence the urban thermal environment. For commercial areas, active economic activities also contribute to anthropogenic heat emissions [57]. In contrast, public service, residential, and other functional zones maintain lower LST, playing a positive role in mitigating the urban heat environment. Among them, public service areas account for the highest proportion of low-LST areas across all seasons, followed by other functional zones and residential areas. This effect is linked to the higher vegetation coverage within these areas, which helps reduce LST through transpiration and shading effects.
4.3. Relative Contribution Analysis of Urban Morphology on Seasonal LST in Diverse Urban Functional Zones
In this study, the top ten variables—explaining 80–90% of LST variation—were selected for further analysis. As shown in Figure 6, NDVI and MNDWI exhibit significant cooling effects on LST during spring, summer, and autumn. However, in winter, the cooling effect of NDVI is notably weaker. Different building morphology factors exert distinct impacts on the urban thermal environment. MBV and BD significantly increase LST, particularly in winter. In contrast, BH demonstrates a consistent cooling effect across all seasons, aligning with the findings of Liu et al. (2024) [39]. Taller buildings reduce LST by blocking solar radiation and limiting surface heat absorption. Additionally, PL_S notably increases LST. Compared with other variables, human activity indicators exert a relatively smaller seasonal influence on surface temperatures. Regarding topographic factors, DEM has a more pronounced cooling effect on surface temperature in summer and autumn compared to spring and winter.
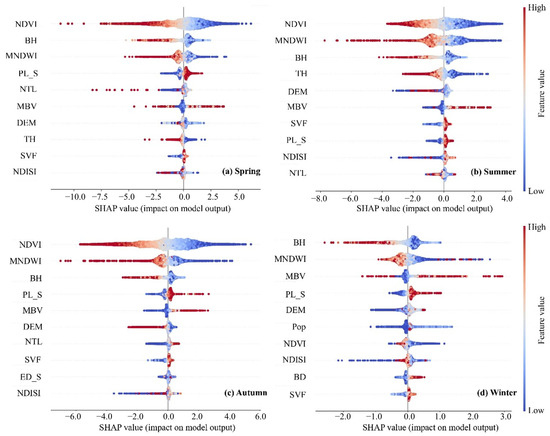
Figure 6.
The density scatter diagram of the top 10 features for LST.
From a functional zone perspective, LST is influenced by a complex interplay of factors, whose relative contributions differ by season and land use type. Specifically (Figure 7), for industrial land, PL_S contributes the most to LST variations in spring, summer, and autumn, with its highest contribution observed in summer, reaching 26.32%. Pop plays a critical role in winter, contributing 27.96% to LST variation. Public service land, which primarily includes parks, educational institutions, medical facilities, and cultural and sports venues, is characterized by extensive vegetation coverage and abundant water resources. As a result, NDVI, MNDWI, and TH are the primary factors influencing LST changes in these areas, with combined contributions across the four seasons reaching 56.84%, 55.41%, 58.95%, and 28.29%, respectively. In transportation hub zones, DEM is the most influential factor, with a peak contribution of 31.05%, followed by NDVI, MNDWI, and PL_S. For commercial and residential zones, MNDWI and NDVI are key determinants of LST variation. In residential areas, BH exerts a particularly strong cooling effect in summer, contributing 22.85%. In commercial areas, NTL becomes especially important in winter, with a contribution rate of 16.08%. Other lands are primarily located on the urban fringe, adjacent to forests and gardens. In these areas, NDVI is the most important factor influencing LST, reaching a maximum contribution rate of 46.27% in autumn. Additionally, this category includes areas under development and construction, where impervious surfaces and human activities also contribute to variations in the local thermal environment.
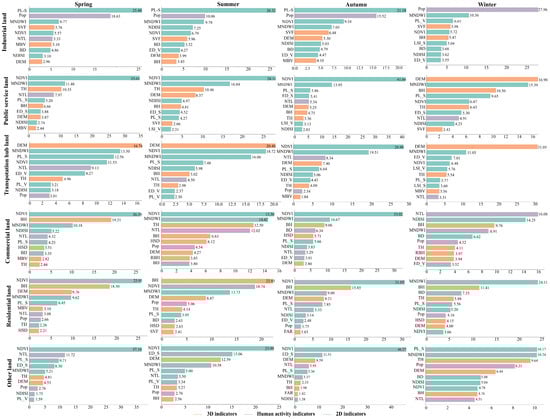
Figure 7.
Importance marking diagram of the top 10 features for LST across different UFZs in four seasons.
Building upon the analysis of the respective contributions of urban morphological variables to LST across different functional zones and seasonal periods, this study further examines the marginal effects of individual morphological factors as well as their interaction effects on LST. To better capture the complexity and seasonal variability of these influences, the top three contributing factors for each functional zone, along with the pairs of factors exhibiting the strongest interaction effects, were selected for visualization. The results for summer are presented in Figure 8, while those for the remaining three seasons are shown in Figures S3–S5. A detailed discussion of both the marginal and interaction effects is provided in Section 5.1.
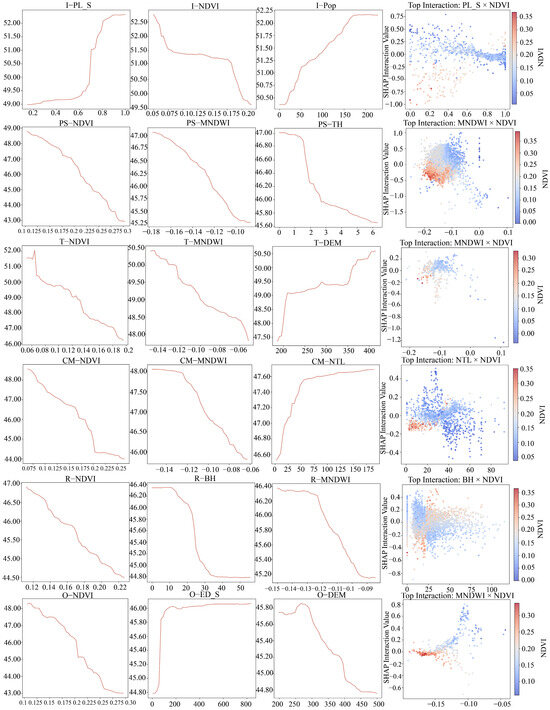
Figure 8.
Marginal effects of key variables and strongest interaction scatter plots across functional zones (summer).
4.4. Spatial Heterogeneity Analysis of the Effects of Urban Morphology on Seasonal LST
This study applies the MGWR model to analyze the spatial heterogeneity of factors affecting LST. The results show high model performance across all four seasons (R2 > 0.8). Moran’s I test of the residuals reveals statistically significant yet very low values (0.004–0.008), indicating weak spatial autocorrelation. This suggests that the MGWR model effectively reduces spatial dependence in residuals and reliably captures spatial heterogeneity in the influencing factors.
Table 4 presents the optimal bandwidths of each influencing factor across different seasons based on the MGWR model. The optimal bandwidths for the explanatory variables, such as BD, HSD, and MBV in building morphology characteristics; NDVI, NDISI, and MNDWI in surface biophysical parameters; Pop in the human activity index; and DEM range from 43 to 2195, accounting for 0.28–12.02% of the total blocks. This indicates that the impact of these variables on LST is localized, allowing for the adjustment of related index values within a limited spatial range to regulate the surface thermal environment. Conversely, the optimal bandwidths of PL_S (except spring), FAR and RBH are 15,196, indicating that their effects on LST are more consistent at larger spatial scales, with lower spatial heterogeneity. In addition, the influencing scale of some explanatory variables on LST varies significantly across seasons. For example, BH has a bandwidth of 5102 in summer, reflecting a more localized effect, while in other seasons, the bandwidth expands to 15,196, indicating broader spatial influence. This seasonal variation is likely driven by climatic differences: during summer, intense solar radiation enhances the localized cooling effect of BH on microclimate, whereas in other seasons, weaker radiation reduces this localized influence, resulting in a more spatially homogeneous effect identified by the model.
Table 4.
The optimal bandwidth of influencing factors across different seasons.
To illustrate spatial patterns, BD, NDVI, and DEM—representing building morphology, surface biophysical, and topographic parameters—were selected for coefficient visualization (Figure 9). BD exhibits a positive correlation with LST, indicating a strong warming effect, primarily attributable to its low evapotranspiration rate and high heat storage capacity [58], while NDVI and DEM show negative correlations, suggesting notable cooling effects. The influence of BD on LST is spatially and seasonally heterogeneous. In spring, summer, and autumn, BD generally increases LST across all land parcel types, with exceptions in some northeastern parcels, likely due to proximity to the Yangtze River and surrounding forested areas. In winter, some southern parcels, especially around Xipeng at the urban–rural fringe, display a cooling effect due to lower overall temperatures, which limit BD’s warming influence. The cooling effect of NDVI is most prominent in high-temperature zones, such as the Jiangbei International Airport and its adjacent industrial park in Yubei District. Vegetation-rich areas, such as Lijia Baiyunshan Park, also show significant NDVI-induced cooling. DEM displays seasonal variations in its effect on LST: in summer, it shows strong spatial heterogeneity, whereas in other seasons, higher DEM values generally correlate with cooling in the western and southern areas. In contrast, in the northeast—dominated by industrial and transport land use—higher DEM fails to mitigate heat accumulation due to dense impervious surfaces and anthropogenic heat, resulting instead in a warming effect.
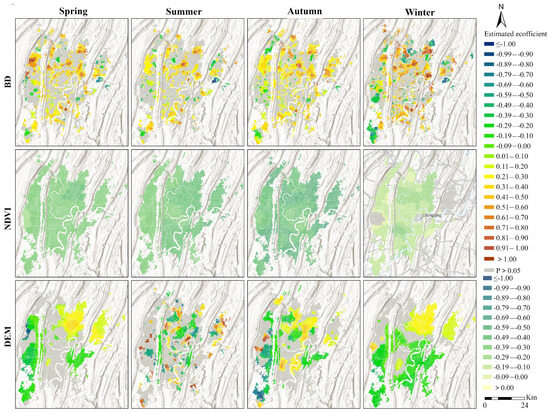
Figure 9.
Spatial distribution of the estimated coefficients of local variables for LST.
PL_S, FAR, and RBH—characterized by global effects on LST—were also visualized (Figure 10). The results indicate that PL_S exerts a significant warming effect, while FAR and RBH generally reduce LST. Spatially, PL_S shows seasonal variation, with a belt-shaped warming trend from northwest to southeast in summer, and a reversed pattern in winter. In autumn, the warming effect decreases from southwest to northeast. Spatial variation in PL_S coefficients remains minimal in most seasons, except in spring when localized heterogeneity intensifies, reaching a maximum coefficient difference of 0.2382. FAR’s impact follows a decreasing gradient from southwest to northeast and is negligible in winter, likely due to seasonal fluctuations in solar radiation Liu et al. (2024) [39]. Conversely, RBH demonstrates stronger effects in the southwest and weaker in the northeast. Its spatial distribution remains relatively consistent across seasons, with only slight regional variations in the coefficients, suggesting a geographically uniform effect on LST. Overall, the influence of urban morphological variables upon LST displays substantial spatial as well as seasonal variability, reflecting strong spatial heterogeneity and non-stationarity in their effects.
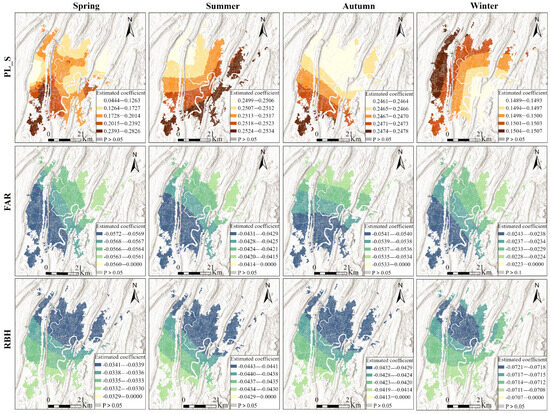
Figure 10.
Spatial distribution of the estimated coefficients of global variables for LST.
5. Discussion
5.1. Analysis of the Marginal and Interaction Effects of Urban Morphological Factors on Seasonal LST in Different Functional Zones
Section 4.3 presents a SHAP-based assessment of the marginal contributions and interaction effects of key determinants associated with LST variation across various urban functional zones. The relationships between individual predictors and model outcomes were further visualized using Partial Dependence Plots (PDPs). By varying one variable while holding others constant, PDPs illustrate the isolated relationship between the selected variable and LST predictions [59]. Additionally, SHAP-based interaction effects were analyzed to better interpret the combined impact of multiple urban morphological factors on LST.
The findings reveal that urban form variables affect LST differently across seasonal periods and functional zones. which to some extent confirms that the urban thermal environment results from the combined effects of intrinsic regional characteristics and spatial configuration. Moreover, the most pronounced thermal amplification or attenuation effects of urban morphological factors vary significantly among functional zones within the same season (Figure 8 and Figures S3–S5). Generally, PL_S and Pop act as consistent warming factors, whereas NDVI, MNDWI, and BH demonstrate stable cooling effects. Among these, PL_S exerts the strongest warming influence, while NDVI shows the most substantial cooling impact. Notably, during summer, the warming effect of PL_S is particularly pronounced in industrial zones, where an increase in PL_S can raise LST by up to 3.3 °C. This is largely attributed to the prevalence of large industrial buildings and expansive cement surfaces with high albedo in these areas, which intensify surface heat absorption [56,60]. Furthermore, various forms of anthropogenic heat have been identified as significant contributors to the regional temperatures [61]. The substantial release of industrial waste heat and air pollutants can result in the local temperature being significantly higher than that of surrounding regions [62].
NDVI and MNDWI exhibit strong negative correlations with LST, highlighting their notable cooling effects, particularly within public service areas. These areas often encompass parks, educational institutions, and other green spaces with high vegetation coverage. The presence of vegetation mitigates heat accumulation through evapotranspiration, while the relatively low proportion of exposed impervious surfaces reduces heat absorption, thereby lowering LST. The cooling effect of NDVI varies seasonally: it can reduce LST by approximately 5.5 °C in spring and 5.4 °C in autumn, while the effect diminishes to around 3.8 °C in summer due to generally elevated ambient temperatures. In addition to NDVI, TH also contributes to cooling through shading, particularly in residential areas. However, this effect follows a pattern of initial increase and subsequent decrease in winter, likely due to variations in vegetation types [63,64]. For instance, evergreen trees continue to block cold winds during winter, whereas deciduous trees lose this capacity.
BH also contributes to LST mitigation in residential and commercial zones. When other variables are held constant, LST tends to decrease with increasing building height, attributed to improved shading, air circulation, and heat exchange [39,65]. However, this cooling effect becomes statistically significant only when BH exceeds 10 m, after which the LST reduction stabilizes. In summer, the cooling effect of BH in residential areas is most apparent, with LST reductions of up to 2.2 °C.
Regarding DEM, a unique pattern emerges in transportation facility zones: LST decreases as DEM increases. This is likely because many transportation facilities in low-altitude areas (e.g., docks) are near water bodies, which provide a cooling effect. Conversely, facilities at higher elevations—such as Jiangbei International Airport—are often surrounded by industrial zones, which contribute to an increase in urban thermal conditions due to the influence of nearby heat island effects. As a result, the marginal effect of DEM in these areas differs from that in other functional zones.
In terms of interaction effects, NDVI and MNDWI form a relatively stable cooling synergy. The negative average interaction values indicate that the combination of vegetation and water bodies significantly contributes to the regulation of the urban microclimate. It is worth noting that this study only considered water bodies located within the built-up area of the central urban zone, excluding large rivers such as the Jialing and Yangtze Rivers. Although the proportion of water bodies is relatively low, strong cooling effects are observed when MNDWI values are near zero, suggesting the effective microclimatic regulation provided by small-scale water bodies in high-vegetation areas [66]. Moreover, interactions between NDVI and PL_S suggest that vegetation can effectively mitigate the warming impact of large plot sizes, indicating that increasing green space in high-temperature industrial zones can help alleviate the thermal environment. Additional interaction effects involving BH and NTL with NDVI reveal that NDVI has a stronger cooling effect in areas with low BH and NTL values. However, as BH and NTL increase, the cooling effect of NDVI is suppressed. In winter, the cooling role of BH is further weakened, and the interaction between BH and NTL becomes positive, indicating a synergistic warming effect under certain built environment configurations.
5.2. Applicability and Generalizability of the Research Findings
As a typical mountainous city, Chongqing’s complex terrain and subtropical monsoon humid climate together shape a distinctive urban thermal environment pattern. In this study, beyond considering elevation, we further analyzed the effects of secondary topographic factors—slope, terrain ruggedness, and surface roughness—on seasonal LST. The results show that slope, terrain ruggedness, and surface roughness are all negatively correlated with seasonal LST (Table S2), collectively underscoring the critical role of terrain modulation in the thermal dynamics of mountainous cities. This finding is largely consistent with the results of studies conducted by Chen et al. (2022) [12] and Zhao et al. (2025) [67] in Guiyang and Kunming, respectively.
However, due to differences in geographic environments and urban characteristics across study areas, the applicability of these findings to other types of cities may be limited. For example, Luo et al. (2023) [68] found that elevation had a significantly higher contribution to LST variation in Chongqing compared to Chengdu. Similarly, Shi et al. (2025) [69] reported that DEM had a stronger influence on LST in the Chengdu-Chongqing urban agglomeration, whereas its effect was relatively weaker in the middle reaches of the Yangtze River and the Yangtze River Delta. In addition, the effects of urban morphological factors on the thermal environment may also vary by city type. For instance, Wang et al. (2025) [59] found in their study of a plain city that BH within the range of 20–40 m significantly reduced LST, whereas in our study, the cooling effect of BH was mainly observed within the range of 10–40 m (Figure 8 and Figures S3–S5), a discrepancy potentially attributable to the interactive effects between building morphology and local terrain, which may alter ventilation and shading efficiency.
In summary, the findings of this study are more applicable to mountainous cities with similar topographic and climatic characteristics to Chongqing. In contrast, in cities with relatively flat terrain such as plains and basins, the regulating effect of topographic factors is comparatively limited, while urban morphological characteristics and human activities have a greater impact on the thermal environment. Therefore, when formulating thermal environment regulation strategies, cities with different topographic types should consider their unique geographical background and urban characteristics and adopt targeted optimization of spatial structure and urban form to achieve more effective thermal environment regulation and management. For instance, mountainous cities could consider the synergistic effects of topography in urban development and planning, and explore ways to enhance urban greening within constrained built-up spaces—such as through the implementation of green roofs and vertical greening initiatives [70]. In contrast, cities in plains may focus more on optimizing building morphology and strengthening blue–green infrastructure to achieve efficient and sustainable urban thermal environment management tailored to local conditions.
5.3. Research Contributions and Limitations
Despite substantial study on the factors affecting LST, a thorough and integrative understanding of the influence of urban spatial morphology on LST remains insufficient. This paper offers a comprehensive investigation of the impacts of urban morphological variables on seasonal LST, drawing from both global and local viewpoints. This study examines the geographical variation in the influence mechanisms of several urban structural features on LST across distinct functional zones in different seasons, providing essential insights for policymakers and planners to develop strategies for alleviating urban hot conditions.
However, this study has certain limitations: First, the research uses urban blocks defined by OSM as the basic study unit, treating blocks as the smallest analytical units and aggregating all urban spatial factors into average values within the blocks. It does not consider external influences, such as the effects of road units on the LST. Roads, primarily composed of engineering materials such as asphalt concrete, have high heat absorption rates and low heat capacity, making them closely related to the LST. Therefore, future research could incorporate factors related to urban road infrastructure into the analytical framework. For instance, integrating multi-source datasets such as road vector data, road intensity information, and remote sensing imagery, and applying advanced modeling approaches such as machine learning or deep learning techniques, would allow for a more accurate quantification of the effects of road elements on LST variation. Second, this research primarily focused on examining the influence of urban morphological indicators on seasonal LST variation based on functional zoning data, without considering diurnal differences. Given the significant temperature fluctuations between day and night, future studies could utilize remote sensing imagery captured at different times of day to explore how urban morphological characteristics influence LST on a diurnal scale. Such an approach would contribute to a more comprehensive understanding and refined regulation of urban thermal conditions.
6. Conclusions
This study adopts urban functional zones as the fundamental analytical unit to investigate the seasonal dynamics of LST spatial distribution. Employing interpretable machine learning methods and MGWR, the study analyzes the influence of mechanisms of various urban morphological factors on the LST in terms of both numerical magnitude and spatial distribution from global and local perspectives. The primary conclusions are as follows:
(1) The surface heat environment of Chongqing’s central urban area exhibits a distinct “mountain-water pattern” and significant seasonal variations. LST reaches its peak in summer and its lowest levels in winter. Among different functional zones, industrial areas consistently exhibit higher LST, whereas public service land maintains relatively lower LST, reflecting the modulating effects of building density, human activity, and green/water coverage. Therefore, urban planning should consider green and water coverage in industrial and high-density areas, especially in summer, to mitigate high temperatures and enhance residents’ thermal comfort.
(2) The influence of urban morphological indicators on the surface thermal environment varies with functional zone types and seasons. The relative contributions of these factors to LST remain relatively stable in spring and autumn, whereas significant divergences are observed during summer and winter. Biophysical surface parameters have a considerable impact on LST across various functional zones. The PL_S, Pop, and NTL significantly influence the LST of industrial land; DEM shows the highest relative contribution to the LST of transportation hubs; human activities and MBV are the primary contributors to temperature increases, while BH is the main cooling effect factor in commercial and residential areas. For public service and other land use types, NDVI and TH exhibit significant cooling effects. NDVI and MNDWI demonstrate a cooperative cooling synergy, and NDVI serves as a key moderating factor in alleviating the warming impacts induced by elevated levels of PL_S. There, planners should implement targeted interventions according to the specific characteristics of functional zones.
(3) The spatial patterns of urban morphological factors’ impact on LST show significant heterogeneity. FAR and RBH exhibit global consistency, while BD, surface biophysical parameters (such as NDVI and MNDWI), and Pop display significant local heterogeneity. Effective urban heat management requires both city-wide planning and targeted, localized interventions based on functional zone characteristics and heat island hotspots.
In summary, this study highlights the importance of considering functional zone types and seasonal variations when analyzing urban heat island mitigation. The findings provide actionable guidance for urban design and management, suggesting that planners can achieve refined thermal environment regulation by integrating strategies such as greening, water body development, building layout optimization, and human activity management according to functional zone characteristics and seasonal conditions.
Supplementary Materials
The following supporting information can be downloaded at: https://www.mdpi.com/article/10.3390/land14112117/s1. Figure S1: Performance comparison between RF and XGBoost models; Figure S2: Sobol’ sensitivity analysis results for the top 10 variables; Figure S3: Marginal effects of key variables and strongest interaction scatter plots across functional zones (spring); Figure S4: Marginal effects of key variables and strongest interaction scatter plots across functional zones (autumn); Figure S5: Marginal effects of key variables and strongest interaction scatter plots across functional zones (winter); Table S1: Parameter settings of the RF model; Table S2: The results of correlation analysis for topographic variables.
Author Contributions
Conceptualization, C.L. and Y.L.; Methodology, M.Z., C.L. and Y.L.; Software, M.Z.; Visualization, R.W.; Writing—Original Draft, M.Z.; Writing—Review and Editing, C.L., Y.L., B.H., R.W., Z.Q., F.W., Q.H., P.L., B.L. and Y.H. All authors have read and agreed to the published version of the manuscript.
Funding
This research was funded by the Research Project of Chongqing Municipal Bureau of Planning and Natural Resources, grant number KJ-2023039; the Fundamental Research Funds for the Central Universities, grant number SWU021003.
Data Availability Statement
Data will be made available on request.
Conflicts of Interest
The authors declare that they have no known competing financial interests or personal relationships that could have appeared to influence the work reported in this paper.
References
- Oke, T.R. The Energetic Basis of the Urban Heat Island. Q. J. Roy. Meteor. Soc. 1982, 108, 1–24. [Google Scholar] [CrossRef]
- Arunab, K.S.; Mathew, A. Quantifying Urban Heat Island and Pollutant Nexus: A Novel Geospatial Approach. Sustain. Cities Soc. 2024, 101, 105117. [Google Scholar] [CrossRef]
- Kumari, P.; Garg, V.; Kumar, R.; Kumar, K. Impact of Urban Heat Island Formation on Energy Consumption in Delhi. Urban Clim. 2021, 36, 100763. [Google Scholar] [CrossRef]
- Singh, M.; Sharston, R. Quantifying the Dualistic Nature of Urban Heat Island Effect (UHI) on Building Energy Consumption. Energy Build. 2022, 255, 111649. [Google Scholar] [CrossRef]
- Song, F.; Dong, H.; Wu, L.; Leung, L.R.; Lu, J.; Dong, L.; Wu, P.; Zhou, T. Hot Season Gets Hotter Due to Rainfall Delay over Tropical Land in a Warming Climate. Nat. Commun. 2025, 16, 2188. [Google Scholar] [CrossRef] [PubMed]
- Wang, L.; Hou, H.; Weng, J. Ordinary Least Squares Modelling of Urban Heat Island Intensity Based on Landscape Composition and Configuration: A Comparative Study among Three Megacities along the Yangtze River. Sustain. Cities Soc. 2020, 62, 102381. [Google Scholar] [CrossRef]
- Zhou, L.; Hu, F.; Wang, B.; Wei, C.; Sun, D.; Wang, S. Relationship between Urban Landscape Structure and Land Surface Temperature: Spatial Hierarchy and Interaction Effects. Sustain. Cities Soc. 2022, 80, 103795. [Google Scholar] [CrossRef]
- Lin, Z.; Xu, H.; Han, L.; Zhang, H.; Peng, J.; Yao, X. Day and Night: Impact of 2D/3D Urban Features on Land Surface Temperature and Their Spatiotemporal Non-Stationary Relationships in Urban Building Spaces. Sustain. Cities Soc. 2024, 108, 105507. [Google Scholar] [CrossRef]
- Han, D.; Xu, X.; Qiao, Z.; Wang, F.; Cai, H.; An, H.; Jia, K.; Liu, Y.; Sun, Z.; Wang, S.; et al. The Roles of Surrounding 2D/3D Landscapes in Park Cooling Effect: Analysis from Extreme Hot and Normal Weather Perspectives. Build. Environ. 2023, 231, 110053. [Google Scholar] [CrossRef]
- Lin, A.; Wu, H.; Luo, W.; Fan, K.; Liu, H. How Does Urban Heat Island Differ across Urban Functional Zones? Insights from 2D/3D Urban Morphology Using Geospatial Big Data. Urban Clim. 2024, 53, 101787. [Google Scholar] [CrossRef]
- Yuan, B.; Zhou, L.; Hu, F.; Wei, C. Effects of 2D/3D Urban Morphology on Land Surface Temperature: Contribution, Response, and Interaction. Urban Clim. 2024, 53, 101791. [Google Scholar] [CrossRef]
- Chen, X.; Wang, Z.; Bao, Y.; Luo, Q.; Wei, W. Combined Impacts of Buildings and Urban Remnant Mountains on Thermal Environment in Multi-Mountainous City. Sustain. Cities Soc. 2022, 87, 104247. [Google Scholar] [CrossRef]
- Lin, P.; Lau, S.S.Y.; Qin, H.; Gou, Z. Effects of Urban Planning Indicators on Urban Heat Island: A Case Study of Pocket Parks in High-Rise High-Density Environment. Landsc. Urban Plan. 2017, 168, 48–60. [Google Scholar] [CrossRef]
- Wang, R.; Murayama, Y.; Liu, F.; Zhang, X.; Hou, H.; Morimoto, T.; Derdouri, A. Impact of Urban Morphology on Land Surface Temperature: A Case Study of the Central Tokyo, Japan. City Environ. Interact. 2025, 28, 100227. [Google Scholar] [CrossRef]
- Mo, Y.; Bao, Y.; Wang, Z.; Wei, W.; Chen, X. Spatial Coupling Relationship between Architectural Landscape Characteristics and Urban Heat Island in Different Urban Functional Zones. Build. Environ. 2024, 257, 111545. [Google Scholar] [CrossRef]
- Iungman, T.; Cirach, M.; Marando, F.; Pereira Barboza, E.; Khomenko, S.; Masselot, P.; Quijal-Zamorano, M.; Mueller, N.; Gasparrini, A.; Urquiza, J.; et al. Cooling Cities through Urban Green Infrastructure: A Health Impact Assessment of European Cities. Lancet 2023, 401, 577–589. [Google Scholar] [CrossRef]
- Zhou, S.-Q.; Yu, Z.-W.; Ma, W.-Y.; Yao, X.-H.; Xiong, J.-Q.; Ma, W.-J.; Xiang, S.-Y.; Yuan, Q.; Hao, Y.-Y.; Xu, D.-F.; et al. Vertical Canopy Structure Dominates Cooling and Thermal Comfort of Urban Pocket Parks during Hot Summer Days. Landsc. Urban Plan. 2025, 254, 105242. [Google Scholar] [CrossRef]
- Yang, L.; Yu, K.; Ai, J.; Liu, Y.; Yang, W.; Liu, J. Dominant Factors and Spatial Heterogeneity of Land Surface Temperatures in Urban Areas: A Case Study in Fuzhou, China. Remote Sens. 2022, 14, 1266. [Google Scholar] [CrossRef]
- Tang, L.; Zhan, Q.; Fan, Y.; Liu, H.; Fan, Z. Exploring the Impacts of Greenspace Spatial Patterns on Land Surface Temperature across Different Urban Functional Zones: A Case Study in Wuhan Metropolitan Area, China. Ecol. Indic. 2023, 146, 109787. [Google Scholar] [CrossRef]
- Peng, F.; Cao, Y.; Sun, X.; Zou, B. Study on the Contributions of 2D and 3D Urban Morphologies to the Thermal Environment under Local Climate Zones. Build. Environ. 2024, 263, 111883. [Google Scholar] [CrossRef]
- Stewart, I.D.; Oke, T.R. Local Climate Zones for Urban Temperature Studies. B Am. Meteorol. Soc. 2012, 93, 1879–1900. [Google Scholar] [CrossRef]
- Wang, F.; Dong, W.; Zhao, Z.; Wang, H.; Li, W.; Chen, G.; Wang, F.; Zhao, Y.; Huang, J.; Zhou, T. Heavy Metal Pollution in Urban River Sediment of Different Urban Functional Areas and Its Influence on Microbial Community Structure. Sci. Total Environ. 2021, 778, 146383. [Google Scholar] [CrossRef]
- Huang, X.; Wang, Y. Investigating the Effects of 3D Urban Morphology on the Surface Urban Heat Island Effect in Urban Functional Zones by Using High-Resolution Remote Sensing Data: A Case Study of Wuhan, Central China. ISPRS J. Photogramm. Remote Sens. 2019, 152, 119–131. [Google Scholar] [CrossRef]
- Yue, W.; Liu, Y.; Fan, P.; Ye, X.; Wu, C. Assessing Spatial Pattern of Urban Thermal Environment in Shanghai, China. Stoch. Environ. Res. Risk Assess. 2012, 26, 899–911. [Google Scholar] [CrossRef]
- Liu, H.; Huang, B.; Zhan, Q.; Gao, S.; Li, R.; Fan, Z. The Influence of Urban Form on Surface Urban Heat Island and Its Planning Implications: Evidence from 1288 Urban Clusters in China. Sustain. Cities Soc. 2021, 71, 102987. [Google Scholar] [CrossRef]
- Garzón, J.; Molina, I.; Velasco, J.; Calabia, A. A Remote Sensing Approach for Surface Urban Heat Island Modeling in a Tropical Colombian City Using Regression Analysis and Machine Learning Algorithms. Remote Sens. 2021, 13, 4256. [Google Scholar] [CrossRef]
- Oukawa, G.Y.; Krecl, P.; Targino, A.C. Fine-Scale Modeling of the Urban Heat Island: A Comparison of Multiple Linear Regression and Random Forest Approaches. Sci. Total Environ. 2022, 815, 152836. [Google Scholar] [CrossRef]
- Wan, Y.; Du, H.; Yuan, L.; Xu, X.; Tang, H.; Zhang, J. Exploring the Influence of Block Environmental Characteristics on Land Surface Temperature and Its Spatial Heterogeneity for a High-Density City. Sustain. Cities Soc. 2025, 118, 105973. [Google Scholar] [CrossRef]
- Xu, J.; Xuan, L.; Li, C.; Wu, T.; Wang, Y.; Wang, Y.; Wang, X.; Wang, Y. Effect of Landscape Architectural Characteristics on LST in Different Zones of Zhengzhou City, China. Land 2025, 14, 1581. [Google Scholar] [CrossRef]
- He, R.; Wang, J.; Liu, D. Assessing the Impact of Urban Spatial Form on Land Surface Temperature Using Random Forest—Taking Beijing as a Case Study. Land 2025, 14, 1639. [Google Scholar] [CrossRef]
- Zhang, X.; Zhang, J. Exploring the Impact of Urban Characteristics on Diurnal Land Surface Temperature Based on LCZ and Machine Learning. Land 2025, 14, 1813. [Google Scholar] [CrossRef]
- Wang, Z.; Zhou, R.; Yu, Y. The Impact of Urban Morphology on Land Surface Temperature under Seasonal and Diurnal Variations: Marginal and Interaction Effects. Build. Environ. 2025, 272, 112673. [Google Scholar] [CrossRef]
- Khanifar, J.; Khademalrasoul, A. Modeling of Land Surface Temperature–Multiscale Curvatures Relationship Using XGBoost Algorithm (Case Study: Southwestern Iran). Int. J. Environ. Sci. Technol. 2022, 19, 11763–11774. [Google Scholar] [CrossRef]
- Suthar, G.; Kaul, N.; Khandelwal, S.; Singh, S. Predicting Land Surface Temperature and Examining Its Relationship with Air Pollution and Urban Parameters in Bengaluru: A Machine Learning Approach. Urban. Clim. 2024, 53, 101830. [Google Scholar] [CrossRef]
- Li, J.; Li, G.; Jiao, Y.; Li, C.; Yan, Q. Association of Neighborhood-Level Socioeconomic Status and Urban Heat in China: Evidence from Hangzhou. Environ. Res. 2024, 246, 118058. [Google Scholar] [CrossRef]
- Zhang, Z.; Li, Z.; Song, Y. On Ignoring the Heterogeneity in Spatial Autocorrelation: Consequences and Solutions. Int. J. Geogr. Inf. Sci. 2024, 38, 2545–2571. [Google Scholar] [CrossRef]
- Chen, H.; Mamitimin, Y.; Abulizi, A.; Huang, M.; Tao, T.; Ma, Y. Seasonal and Diurnal Characteristics and Drivers of Urban Heat Island Based on Optimal Parameters-Based Geo-Detector Model in Xinjiang, China. Atmosphere 2024, 15, 1377. [Google Scholar] [CrossRef]
- Fotheringham, A.S.; Yang, W.; Kang, W. Multiscale Geographically Weighted Regression (MGWR). Ann. Am. Assoc. Geogr. 2017, 107, 1247–1265. [Google Scholar] [CrossRef]
- Liu, Y.; Zhang, W.; Liu, W.; Tan, Z.; Hu, S.; Ao, Z.; Li, J.; Xing, H. Exploring the Seasonal Effects of Urban Morphology on Land Surface Temperature in Urban Functional Zones. Sustain. Cities Soc. 2024, 103, 105268. [Google Scholar] [CrossRef]
- Xu, D.; Wang, Y.; Zhou, D.; Wang, Y.; Zhang, Q.; Yang, Y. Influences of Urban Spatial Factors on Surface Urban Heat Island Effect and Its Spatial Heterogeneity: A Case Study of Xi’an. Build. Environ. 2024, 248, 111072. [Google Scholar] [CrossRef]
- Yang, J.; Huang, X. The 30 m Annual Land Cover Dataset and Its Dynamics in China from 1990 to 2019. Earth Syst. Sci. Data 2021, 13, 3907–3925. [Google Scholar] [CrossRef]
- Shi, Q.; Zhu, J.; Liu, Z.; Guo, H.; Gao, S.; Liu, M.; Liu, Z.; Liu, X. The Last Puzzle of Global Building Footprints—Mapping 280 Million Buildings in East Asia Based on VHR Images. J. Remote Sens. 2024, 4, 138. [Google Scholar] [CrossRef]
- Deng, X.; Cao, Q.; Wang, L.; Wang, W.; Wang, S.; Wang, S.; Wang, L. Characterizing Urban Densification and Quantifying Its Effects on Urban Thermal Environments and Human Thermal Comfort. Landsc. Urban Plan. 2023, 237, 104803. [Google Scholar] [CrossRef]
- Lang, N.; Jetz, W.; Schindler, K.; Wegner, J.D. A High-Resolution Canopy Height Model of the Earth. Nat. Ecol. Evol. 2023, 7, 1778–1789. [Google Scholar] [CrossRef] [PubMed]
- Chen, D.; Zhang, F.; Zhang, M.; Meng, Q.; Jim, C.Y.; Shi, J.; Tan, M.L.; Ma, X. Landscape and Vegetation Traits of Urban Green Space Can Predict Local Surface Temperature. Sci. Total Environ. 2022, 825, 154006. [Google Scholar] [CrossRef]
- Malakar, N.K.; Hulley, G.C.; Hook, S.J.; Laraby, K.; Cook, M.; Schott, J.R. An Operational Land Surface Temperature Product for Landsat Thermal Data: Methodology and Validation. IEEE T Geosci. Remote 2018, 56, 5717–5735. [Google Scholar] [CrossRef]
- Lu, L.; Fu, P.; Dewan, A.; Li, Q. Contrasting Determinants of Land Surface Temperature in Three Megacities: Implications to Cool Tropical Metropolitan Regions. Sustain. Cities Soc. 2023, 92, 104505. [Google Scholar] [CrossRef]
- Coseo, P.; Larsen, L. How Factors of Land Use/Land Cover, Building Configuration, and Adjacent Heat Sources and Sinks Explain Urban Heat Islands in Chicago. Landsc. Urban. Plan. 2014, 125, 117–129. [Google Scholar] [CrossRef]
- Chen, Y.; Zhang, R.; Alekouei, S.A.; Amani-Beni, M. Nonlinear Impacts of Landscape and Climatological Interactions on Urban Thermal Environment during a Hot and Rainy Summer. Ecol. Indic. 2024, 166, 112551. [Google Scholar] [CrossRef]
- Sützl, B.S.; Strebel, D.A.; Rubin, A.; Wen, J.; Carmeliet, J. Urban Morphology Clustering Analysis to Identify Heat-Prone Neighbourhoods in Cities. Sustain. Cities Soc. 2024, 107, 105360. [Google Scholar] [CrossRef]
- Zhou, S.; Liu, D.; Zhu, M.; Tang, W.; Chi, Q.; Ye, S.; Xu, S.; Cui, Y. Temporal and Spatial Variation of Land Surface Temperature and Its Driving Factors in Zhengzhou City in China from 2005 to 2020. Remote Sens. 2022, 14, 4281. [Google Scholar] [CrossRef]
- Chen, J.; Zhan, W.; Jin, S.; Han, W.; Du, P.; Xia, J.; Lai, J.; Li, J.; Liu, Z.; Li, L.; et al. Separate and Combined Impacts of Building and Tree on Urban Thermal Environment from Two- and Three-Dimensional Perspectives. Build. Environ. 2021, 194, 107650. [Google Scholar] [CrossRef]
- Firozjaei, M.K.; Mijani, N.; Fathololoumi, S.; Arsanjani, J.J. Forecasting Spatiotemporal Dynamics of Daytime Surface Urban Cool Islands in Response to Urbanization in Drylands: Case Study of Kerman and Zahedan Cities, Iran. Remote Sens. 2024, 16, 4416. [Google Scholar] [CrossRef]
- Cao, S.; Cai, Y.; Du, M.; Weng, Q.; Lu, L. Seasonal and Diurnal Surface Urban Heat Islands in China: An Investigation of Driving Factors with Three-Dimensional Urban Morphological Parameters. GIScience Remote Sens. 2022, 59, 1121–1142. [Google Scholar] [CrossRef]
- Yuan, Y.; Li, C.; Geng, X.; Yu, Z.; Fan, Z.; Wang, X. Natural-Anthropogenic Environment Interactively Causes the Surface Urban Heat Island Intensity Variations in Global Climate Zones. Environ. Int. 2022, 170, 107574. [Google Scholar] [CrossRef]
- Guan, Q.; Li, Y.; Huang, W.; Cao, W.; Liang, Z.; He, J.; Liang, X. The Impact of Sub-Pixel Scale Urban Function on Urban Heat Island: Insights Derived from Its Decomposition. Appl. Geogr. 2025, 178, 103572. [Google Scholar] [CrossRef]
- Gao, S.; Zhan, Q.; Yang, C.; Liu, H. The Diversified Impacts of Urban Morphology on Land Surface Temperature among Urban Functional Zones. Int. J. Environ. Res. Public. Health 2020, 17, 9578. [Google Scholar] [CrossRef]
- Wang, C.; Li, Z.; Su, Y.; Zhao, Q.; He, X.; Wu, Z.; Gao, W.; Wu, Z. Impact of Block Morphology on Urban Thermal Environment with the Consideration of Spatial Heterogeneity. Sustain. Cities Soc. 2024, 113, 105622. [Google Scholar] [CrossRef]
- Wang, Z.; Zhou, R.; Rui, J.; Yu, Y. Revealing the Impact of Urban Spatial Morphology on Land Surface Temperature in Plain and Plateau Cities Using Explainable Machine Learning. Sustain. Cities Soc. 2025, 118, 106046. [Google Scholar] [CrossRef]
- Li, T.; Cao, J.; Xu, M.; Wu, Q.; Yao, L. The Influence of Urban Spatial Pattern on Land Surface Temperature for Different Functional Zones. Landsc. Ecol. Eng. 2020, 16, 249–262. [Google Scholar] [CrossRef]
- Weng, Q.; Yang, S. Managing the Adverse Thermal Effects of Urban Development in a Densely Populated Chinese City. J. Environ. Manag. 2004, 70, 145–156. [Google Scholar] [CrossRef]
- Min, M.; Lin, C.; Duan, X.; Jin, Z.; Zhang, L. Spatial Distribution and Driving Force Analysis of Urban Heat Island Effect Based on Raster Data: A Case Study of the Nanjing Metropolitan Area, China. Sustain. Cities Soc. 2019, 50, 101637. [Google Scholar] [CrossRef]
- Chun, B.; Guldmann, J.-M. Impact of Greening on the Urban Heat Island: Seasonal Variations and Mitigation Strategies. Comput. Environ. Urban. Syst. 2018, 71, 165–176. [Google Scholar] [CrossRef]
- Liu, H.; Zhan, Q.; Gao, S.; Yang, C. Seasonal Variation of the Spatially Non-Stationary Association Between Land Surface Temperature and Urban Landscape. Remote Sens. 2019, 11, 1016. [Google Scholar] [CrossRef]
- Chen, Y.; Yang, J.; Yu, W.; Ren, J.; Xiao, X.; Xia, J.C. Relationship between Urban Spatial Form and Seasonal Land Surface Temperature under Different Grid Scales. Sustain. Cities Soc. 2023, 89, 104374. [Google Scholar] [CrossRef]
- Weng, Q.; Lu, D.; Schubring, J. Estimation of Land Surface Temperature–Vegetation Abundance Relationship for Urban Heat Island Studies. Remote Sens. Environ. 2004, 89, 467–483. [Google Scholar] [CrossRef]
- Zhao, F.; Zhang, M.; Zhu, S.; Zhang, X.; Ma, S.; Gao, Y.; Xia, J.; Wang, X.; Zhang, Y.; Zhang, S.; et al. Spatiotemporal Patterns of the Urban Thermal Environment and the Impact of Human Activities in Low-Latitude Plateau Cities. Int. J. Appl. Earth Obs. Geoinf. 2025, 142, 104703. [Google Scholar] [CrossRef]
- Luo, P.; Yu, B.; Li, P.; Liang, P.; Zhang, Q.; Yang, L. Understanding the Relationship between 2D/3D Variables and Land Surface Temperature in Plain and Mountainous Cities: Relative Importance and Interaction Effects. Build. Environ. 2023, 245, 110959. [Google Scholar] [CrossRef]
- Shi, S.; Ji, S.; Luo, Z. Spatial Heterogeneity, Interaction and Multi-Scale Effects of Driving Factors of Heat Island Intensity in Different Urban Agglomerations. Sustain. Cities Soc. 2025, 126, 106401. [Google Scholar] [CrossRef]
- Šuklje, T.; Medved, S.; Arkar, C. On Detailed Thermal Response Modeling of Vertical Greenery Systems as Cooling Measure for Buildings and Cities in Summer Conditions. Energy 2016, 115, 1055–1068. [Google Scholar] [CrossRef]
Disclaimer/Publisher’s Note: The statements, opinions and data contained in all publications are solely those of the individual author(s) and contributor(s) and not of MDPI and/or the editor(s). MDPI and/or the editor(s) disclaim responsibility for any injury to people or property resulting from any ideas, methods, instructions or products referred to in the content. |
© 2025 by the authors. Licensee MDPI, Basel, Switzerland. This article is an open access article distributed under the terms and conditions of the Creative Commons Attribution (CC BY) license (https://creativecommons.org/licenses/by/4.0/).