Article

Non-Negligible Urbanization Effects on Trend Estimates of Total and Extreme Precipitation in Northwest China

1
College of Geographic Science and Tourism, Jilin Normal University, Siping 136000, China
2
School of Geographical Sciences, Northeast Normal University, Changchun 130024, China
3
Department of Atmospheric Science, School of Environmental Studies, China University of Geosciences, Wuhan 430074, China
4
National Climate Center, China Meteorological Administration, Beijing 100081, China
*
Author to whom correspondence should be addressed.
Land 2025, 14(11), 2113; https://doi.org/10.3390/land14112113 (registering DOI)
Submission received: 6 September 2025 / Revised: 9 October 2025 / Accepted: 15 October 2025 / Published: 24 October 2025

Abstract

Quantifying and removing urbanization-induced biases in existing precipitation datasets is critical for climate change detection, model assessment, and attribution studies in Northwest China (NWC). The precipitation observational stations of NWC were divided into rural (reference) stations and urban stations using the percentage of urban areas calculated from the land use/land cover (LULC) satellite data of the European Space Agency (ESA) Climate Change Initiative (CCI) Land Cover project. The annual extreme precipitation index series for urban stations (all stations) and rural stations from 1961 to 2022 were calculated based on the categorization of meteorological stations, and the urbanization effects and their contributions to precipitation index series were quantitatively evaluated through estimating trends in the difference series between all stations and the rural stations. The results showed that the urbanization effect varies among different regions and indices. The R10mm, R95pTOT, R99pTOT, and PRCPTOT indices in the sampled urban areas of NWC exhibited statistically significant negative urbanization effects, reaching −0.075 days decade−1, −0.038 % decade−1, −0.024 % decade−1, and −0.035 % decade−1, respectively. However, the R95pTOT, SDII, CDD, and CWD indices at the urban station of the largest city, Urumqi, have been significantly positively affected by urbanization, which is inconsistent with the sampled urban areas of NWC, where the urbanization effect reached 0.069 % decade−1, 0.054 mm·d−1 decade−1, 2.319 days decade−1, and 0.112 days decade−1, respectively. Our analysis shows that the previously reported regional increase in total precipitation and extremes has been underestimated due to the negative urbanization effects in the precipitation data series of urban stations.

1. Introduction

Extreme climate change exerts significant influences on human productive activities and the successional processes of natural ecosystems, with extreme precipitation indices serving as crucial metrics for monitoring climate change [1,2]. Most regions in NWC are arid or semi-arid zones, where precipitation serves as a critical factor constraining regional development. Therefore, the systematic investigation of the long-term evolution patterns of precipitation in NWC is of great scientific significance for revealing regional climate response mechanisms and development.
Shi et al. initially proposed that NWC experienced a climatic regime shift from a “warm–dry” to a “warm–humid” pattern beginning in the 1980s based on paleoclimatic records derived from the Gulya and Donde ice cores [3]. Following the proposal of this transition scenario, scholars have launched extensive investigations and rigorous analyses regarding precipitation variability in NWC. Wang et al. revealed that the Tarim River’s runoff has been increasing [4]. Shi et al. further revealed that the regional climate began shifting from a “warm–dry” to a “warm–wet” pattern starting in 1987 based on hydrological and meteorological data from NWC [5]. Deng et al. found that both precipitation and temperature in NWC have shown overall upward trends using meteorological station data across the NWC region [6]. Zhang et al. investigated the spatiotemporal evolution characteristics of the warming–wetting trend in NWC through multiple approaches, including correlation analysis, trend analysis, integrated atmospheric water vapor accumulation, variable substitution, and variance analysis, based on meteorological observation data of precipitation and humidity [7]. Their research revealed that the “warming and wetting” phenomenon exhibits phased variations and spatial heterogeneity, while the frequency of extreme precipitation events has been increasing under this climatic trend. Zhang et al. also investigated precipitation trends in NWC during 1979–2019 and future periods through integrated analysis of observational data, Global Precipitation Climatology Center (GPCC) reanalysis dataset, and Coupled Model Intercomparison Project Phase 6 (CMIP6) simulation outputs [8]. Their findings revealed a persistent intensification of precipitation patterns in the region, with statistically significant wetting trends emerging under climate change projections. Chen et al. conducted a comprehensive analysis of precipitation and relative humidity variations in NWC using multi-source datasets (temperature, precipitation, vegetation, and runoff records from 1950 to 2019) coupled with EC-EARTH3 model simulations [9]. By employing the Penman–Monteith method to calculate the aridity index, their study demonstrated a significant moistening trend characterized by increased precipitation and enhanced atmospheric humidity. Notably, persistent wetting patterns were projected to continue in the northwestern arid zones under low-emission SSP126 and SSP245 scenarios, as validated through climate model ensemble analysis. Furthermore, Ding et al. and Yao et al. have substantiated the increasing moisture conditions in NWC through systematic analysis of meteorological station observations and auxiliary datasets [10,11].
Over recent decades, China has witnessed rapid urbanization, accompanied by a marked increase in urban LULC. The rapid urbanization process has caused numerous meteorological observation stations to become encircled by urban developments or situated in close proximity to built-up areas [12,13,14], inducing localized declines in wind speed around monitoring stations and thereby potentially introducing measurement biases in precipitation data captured by these stations [14]. Ren et al. conducted field investigations at national reference climate stations, national basic weather stations, and national routine weather stations across NWC, which revealed that urbanization processes have significantly impacted numerous observation stations [15]. Zhang et al. analyzed temperature records from eight meteorological stations in northern Xinjiang during the period 1961–2020, revealing that urbanization has significantly impacted regional temperature patterns through warming effects [16]. However, little work, if any, has been conducted so far to evaluate the urbanization-induced precipitation biases in the sampled urban areas of NWC. The main purpose of this paper is to apply the percentage of urban LULC to select rural stations as reference stations and to assess the urbanization effect on the changes in extreme precipitation indices in the sampled urban areas of NWC. By isolating the impact of urbanization from the changing trends of rainfall/extreme rainfall in NWC over the past few decades, we can obtain the changing trends of precipitation/extreme precipitation in the region under natural background conditions. This will enhance our understanding of the scientific facts regarding natural climate change in NWC.

2. Materials and Methods

2.1. Data Sources and Precipitation Indices

The present study utilizes two primary datasets: daily precipitation records and LULC data for NWC. Detailed descriptions of these datasets are provided below:
  • The daily precipitation data were obtained from the China Homogenized Daily Precipitation Dataset developed by the China Meteorological Administration (CMA). The dataset was homogenized using the RHtest v4 software [17], with the correction procedures following Cao et al. [18]. This dataset was primarily used to calculate precipitation indices. A total of 364 meteorological stations located in NWC were selected (as shown in Figure 1). Preliminary analysis revealed that these stations exhibited substantial missing data during 1951–1960. To ensure temporal consistency and observational reliability, the study period was therefore constrained to 1961–2022.
  • The LULC dataset was sourced from the European Space Agency (ESA) Climate Change Initiative (CCI) Land Cover project (https://climate.esa.int/en/projects/land-cover/data/, accessed on 20 April 2023). Developed within the ESA CCI framework, this satellite-derived global product [19] provides continuous land surface characterization at a 300 m spatial resolution. The analysis utilized the 2020 LULC product, which encompasses 38 distinct LULC classes. Detailed class definitions include anthropogenic surface types (urban areas, croplands), vegetated domains (tree-covered, grassland), and natural features (bare soil, water bodies), etc. [19].
Eleven precipitation indices developed by the Expert Team on Climate Change Detection and Indices (ETCCDI) were adopted, with detailed definitions provided in this website (http://etccdi.pacificclimate.org/list_27_indices.shtml, accessed on 11 September 2024). The precipitation indices were categorized into four classes based on their definitional criteria and climatic characteristics: (1) relative threshold indices: R95pTOT (annual total PRCP when RR > 95p); R99pTOT (annual total PRCP when RR > 99p), (2) absolute threshold indices: R10mm (annual count of days when PRCP 10 mm); R20mm (annual count of days when PRCP 20 mm); CDD (maximum number of consecutive days with RR < 1 mm); CWD (maximum number of consecutive days with RR 1 mm), (3) extreme value indices: Rx1day (monthly maximum 1-day precipitation); Rx5day (monthly maximum consecutive 5-day precipitation), and (4) other indices: PRCPTOT (annual total precipitation on wet days) and SDII (simple precipitation intensity index). The Rnnmm index is a user-defined index, where nn refers to a user-specified threshold. Initially, the 50 was used as the threshold parameter (R50mm), but this index was excluded from analytical consideration in this study, as preliminary research revealed that little daily precipitation exceeded this threshold across NWC during the study period 1961–2022. These indices were computed using the R package climdex.pcic v1.1-11 [20]. No annual precipitation indices will be calculated if more than 15 days were missing in a calendar year.

2.2. Selection of Rural Reference Stations

The percentage of urban LULC within 1–12 km buffer radii surrounding each observation station was calculated using the 2020 LULC product developed by ESA [19], following Zhang et al. [21] This multi-scale analysis employing twelve spatial dimensions (1 km incremental buffer zones) was designed to comprehensively quantify the urbanization level around individual stations. A pivotal methodological challenge in urban–rural station classification lies in determining the critical urban LULC percentage threshold. Based on the results of Zhang et al. [21], we operationalized the classification criterion through rigorous analysis: observation stations demonstrating < 4% urban land coverage across all 1–12 km buffer zones were classified as rural stations, with all others classified as urban. This criterion ultimately identified 54 rural stations and 310 urban stations meeting the spatial representativeness requirements (urban and rural station classification results shown in Figure 1). A station classified as rural has remained unaffected by urbanization since its establishment. In contrast, an urban station infers that it began to be affected by urbanization (to a greater or lesser extent) at some year in or before 2020. In the difference series (all stations minus rural stations), stations that transitioned from rural to urban contribute notably only after their transition, thereby still capturing the long-term urbanization signal.

2.3. Constructing Regional Average Time Series

The regional average time series of precipitation indices were calculated using the method proposed by Jones and Hulme [22], with the procedure detailed below:
Firstly, the original indices are transformed into anomalies or standardized anomalies according to the units of indices. The average altitude of the stations used in this study is 1400.2 m, distributed across different altitude tiers as follows: 43 stations below 500 m, 89 stations at 500–1000 m, 114 stations at 1000–1500 m, and 118 stations above 1500 m. Station elevation differs and affects precipitation. Apart from the altitude factor, other factors (such as distance from the sea, prevailing wind patterns, and local topography) can also lead to an unusually large spatial variability in precipitation. Therefore, prior to regional climate change analysis, raw precipitation indices should be converted to anomalies or standardized anomalies. For indices measured in days (e.g., the indices of R10mm), conversion to anomalies suffices; however, for indices measured in millimeters (e.g., the indices of PRCPTOT), further standardization is necessary because spatial variability remains substantial even after computing anomalies. Among the precipitation indices, those with units of days (d) or millimeters per day (mm·d−1)—including SDII, CWD, CDD, R10mm, and R20mm—were converted into anomalies using the following formula:
P i k = P i k P ¯ i
where P i k represents the anomaly for the i-th observation station in the k-th year, P i k denotes the observed value at the i-th observation station in the k-th year, and P ¯ i is the mean value of the i-th station over the reference period from 1961 to 1990. It is required that each station must have at least 10 years of non-missing data within the reference period to calculate its mean value. The remaining five precipitation indices measured in millimeters (Rx1day, Rx5day, R95pTOT, R99pTOT, and PRCPTOT) were calculated as standardized anomalies, with the computational formula provided as follows:
P s i k = P i k P ¯ i σ i
where P s i k is the standardized anomaly for the i-th observation station in the k-th year, σ i is the standard deviation of the i-th station during the reference period of 1961–1990, and P i k and P ¯ i terms are the same as in Formula (1).
The second step involves gridding. As illustrated in Figure 1, the station distribution in NWC exhibits low density and significant spatial variability, largely constrained by the widespread desert terrain. Direct application of the arithmetic mean from all stations to derive annual precipitation indices for NWC would result in climate change signals being dominated by regions with higher station density. To address this issue, the irregularly distributed station index data were converted into a regular latitude–longitude grid. When considering the gridding resolution in NWC, a series of experiments were carried out. Finally, the grid 2 ° × 2 ° scheme was adopted as a compromise—ensuring sufficient spatial coverage of the study area during gridding while avoiding excessively coarse resolution. Within each grid cell, a simple arithmetic averaging process was applied to all contained station observations. To ensure spatial comparability between urban and rural environments, we established a critical quality-control criterion: only grid cells which contain at least one urban station and one rural station were retained for subsequent analysis. Grid cells failing to meet this dual-category station requirement were systematically excluded from the computation process. Among the 171 grid cells, 85 grid cells were identified as lacking observational stations, whose spatial distribution demonstrated geographical coherence with desert cover patterns in NWC. At last, 26 representative grid cells containing 194 observational stations were ultimately selected for subsequent analysis, comprising 44 rural stations and 150 urban stations, which is a relatively small and uneven sample for a region as vast as NWC, and the results may be more representative of the sampled urban areas of NWC rather than the entire NWC region.
Finally, the regional averaged time series was obtained using a grid area-weighted averaging method. For regular latitude–longitude grids, the grid cell area decreases with increasing latitude. Therefore, area weighting should be considered when calculating regional annual means from gridded data. Although the NWC region is relatively small compared to the global scale, making the weighting effect potentially negligible, we nevertheless employed area weighting rather than simple arithmetic to ensure greater accuracy in our analysis. We implemented a cosine-latitude weighted averaging approach, where the weight for each grid cell corresponds to the cosine of its central latitude, proportional to the true surface area represented by the grid cell. The area-weighted value for each grid cell ( P j i w ) was calculated as follows:
P j i w = cos θ i × P j i i = 1 n cos θ i
where cos θ i represents the cosine of the central latitude for the i-th grid cell, P j i denotes the indices value of the i-th grid cell in j-th year, and i = 1 n cos θ i indicates the summation of cosine values across all valid grid cells in the NWC. The regional precipitation anomaly (or standardized anomaly) for each year was derived through this weight average of all valid grid cell values. The annual average time series of urban and rural stations of NWC were constructed using this method. To minimize uncertainties in the average time series calculation, only the grid cell series which contain at least 90% data completeness throughout the study period were used.

2.4. Urbanization Effect and Urbanization Contribution

The urbanization effect ( U E ) refers to the impacts of urbanization on the trend of regional average time series. Following the method of Ren et al. [23], we first calculated the annual average time series for all stations and rural stations across NWC, which are denoted as Y a l l and Y r u r a l . The trend of the difference time series ( Y d ) is defined as urbanization effect. The ratio of the trend of Y d to the trend of Y a l l refers to the urbanization contribution. The formula is detailed as follows:
Y d = Y a l l Y r u r a l
U c = Y d / Y a l l × 100 %
The contribution of urbanization was calculated only when the urbanization effect is statistically significant at the 0.05 level. If the urbanization contribution exceeds 100%, it is capped at 100%.

2.5. Trend Estimation Method

Given the potential non-normal distribution of precipitation indices series and the presence of outliers, the Sen’s slope estimator [24] was selected to estimate the trends of time series, with the trend significance assessed using the Mann–Kendall (MK) test [25,26]. In addition, serial correlation was also considered in this study, as it may artificially inflate significance levels in trend detection analyses [27]. To mitigate the influence of autocorrelation, the pre-whitening procedure initially developed by Zhang et al. [28] and subsequently refined by Wang and Swail [29] was implemented. This method follows an iterative approach: when the lag-1 autocorrelation coefficient ( ρ 1 ) falls below the 0.05 threshold, the original trend of estimates was used, and the corresponding significance test is considered statistically robust. Conversely, when ( ρ 1 ) exceeds 0.05, the pre-whitening process is applied iteratively until the residual autocorrelation meets the ρ 1   < 0.05 criterion. However, it was found that the serial autocorrelation of some grid cell series could not converge to below 0.05. In such cases, if the number of iterations exceeded 20, the iteration was terminated, and the last calculated trend and p-value were used.

3. Results

3.1. Precipitation Changes in NWC

The spatiotemporal characteristics of 10 precipitation indices across NWC were quantitatively characterized through regional averaged time series and spatial distribution patterns derived from observational networks, as presented in the supporting material (see Figures S1–S10 in the Supplementary Materials). Statistical analyses revealed distinct divergence in different indices trends: the consecutive wet days (CWD) exhibited non-significant temporal variability, whereas the consecutive dry days (CDD) revealed a marked decreasing tendency with robust statistical significance ( p < 0.05). In contrast, eight complementary precipitation extreme indices manifested consistent positive trends, all attaining statistical significance, as delineated in Table 1.
These findings collectively indicate that the sampled urban areas of NWC have experienced not only an augmentation in total precipitation but also intensification in both frequency and intensity of extreme precipitation events, accompanied by a reduction in persistent dry spells. Spatial distribution patterns revealed marked spatial heterogeneity in precipitation trends across NWC, with pronounced increasing trends ( p   < 0.05) observed in northern Xinjiang, central Gansu, and northern Qinghai—results that align with findings from earlier studies [5,9].

3.2. The Effects of Urbanization on Precipitation

3.2.1. Relative Threshold Indices

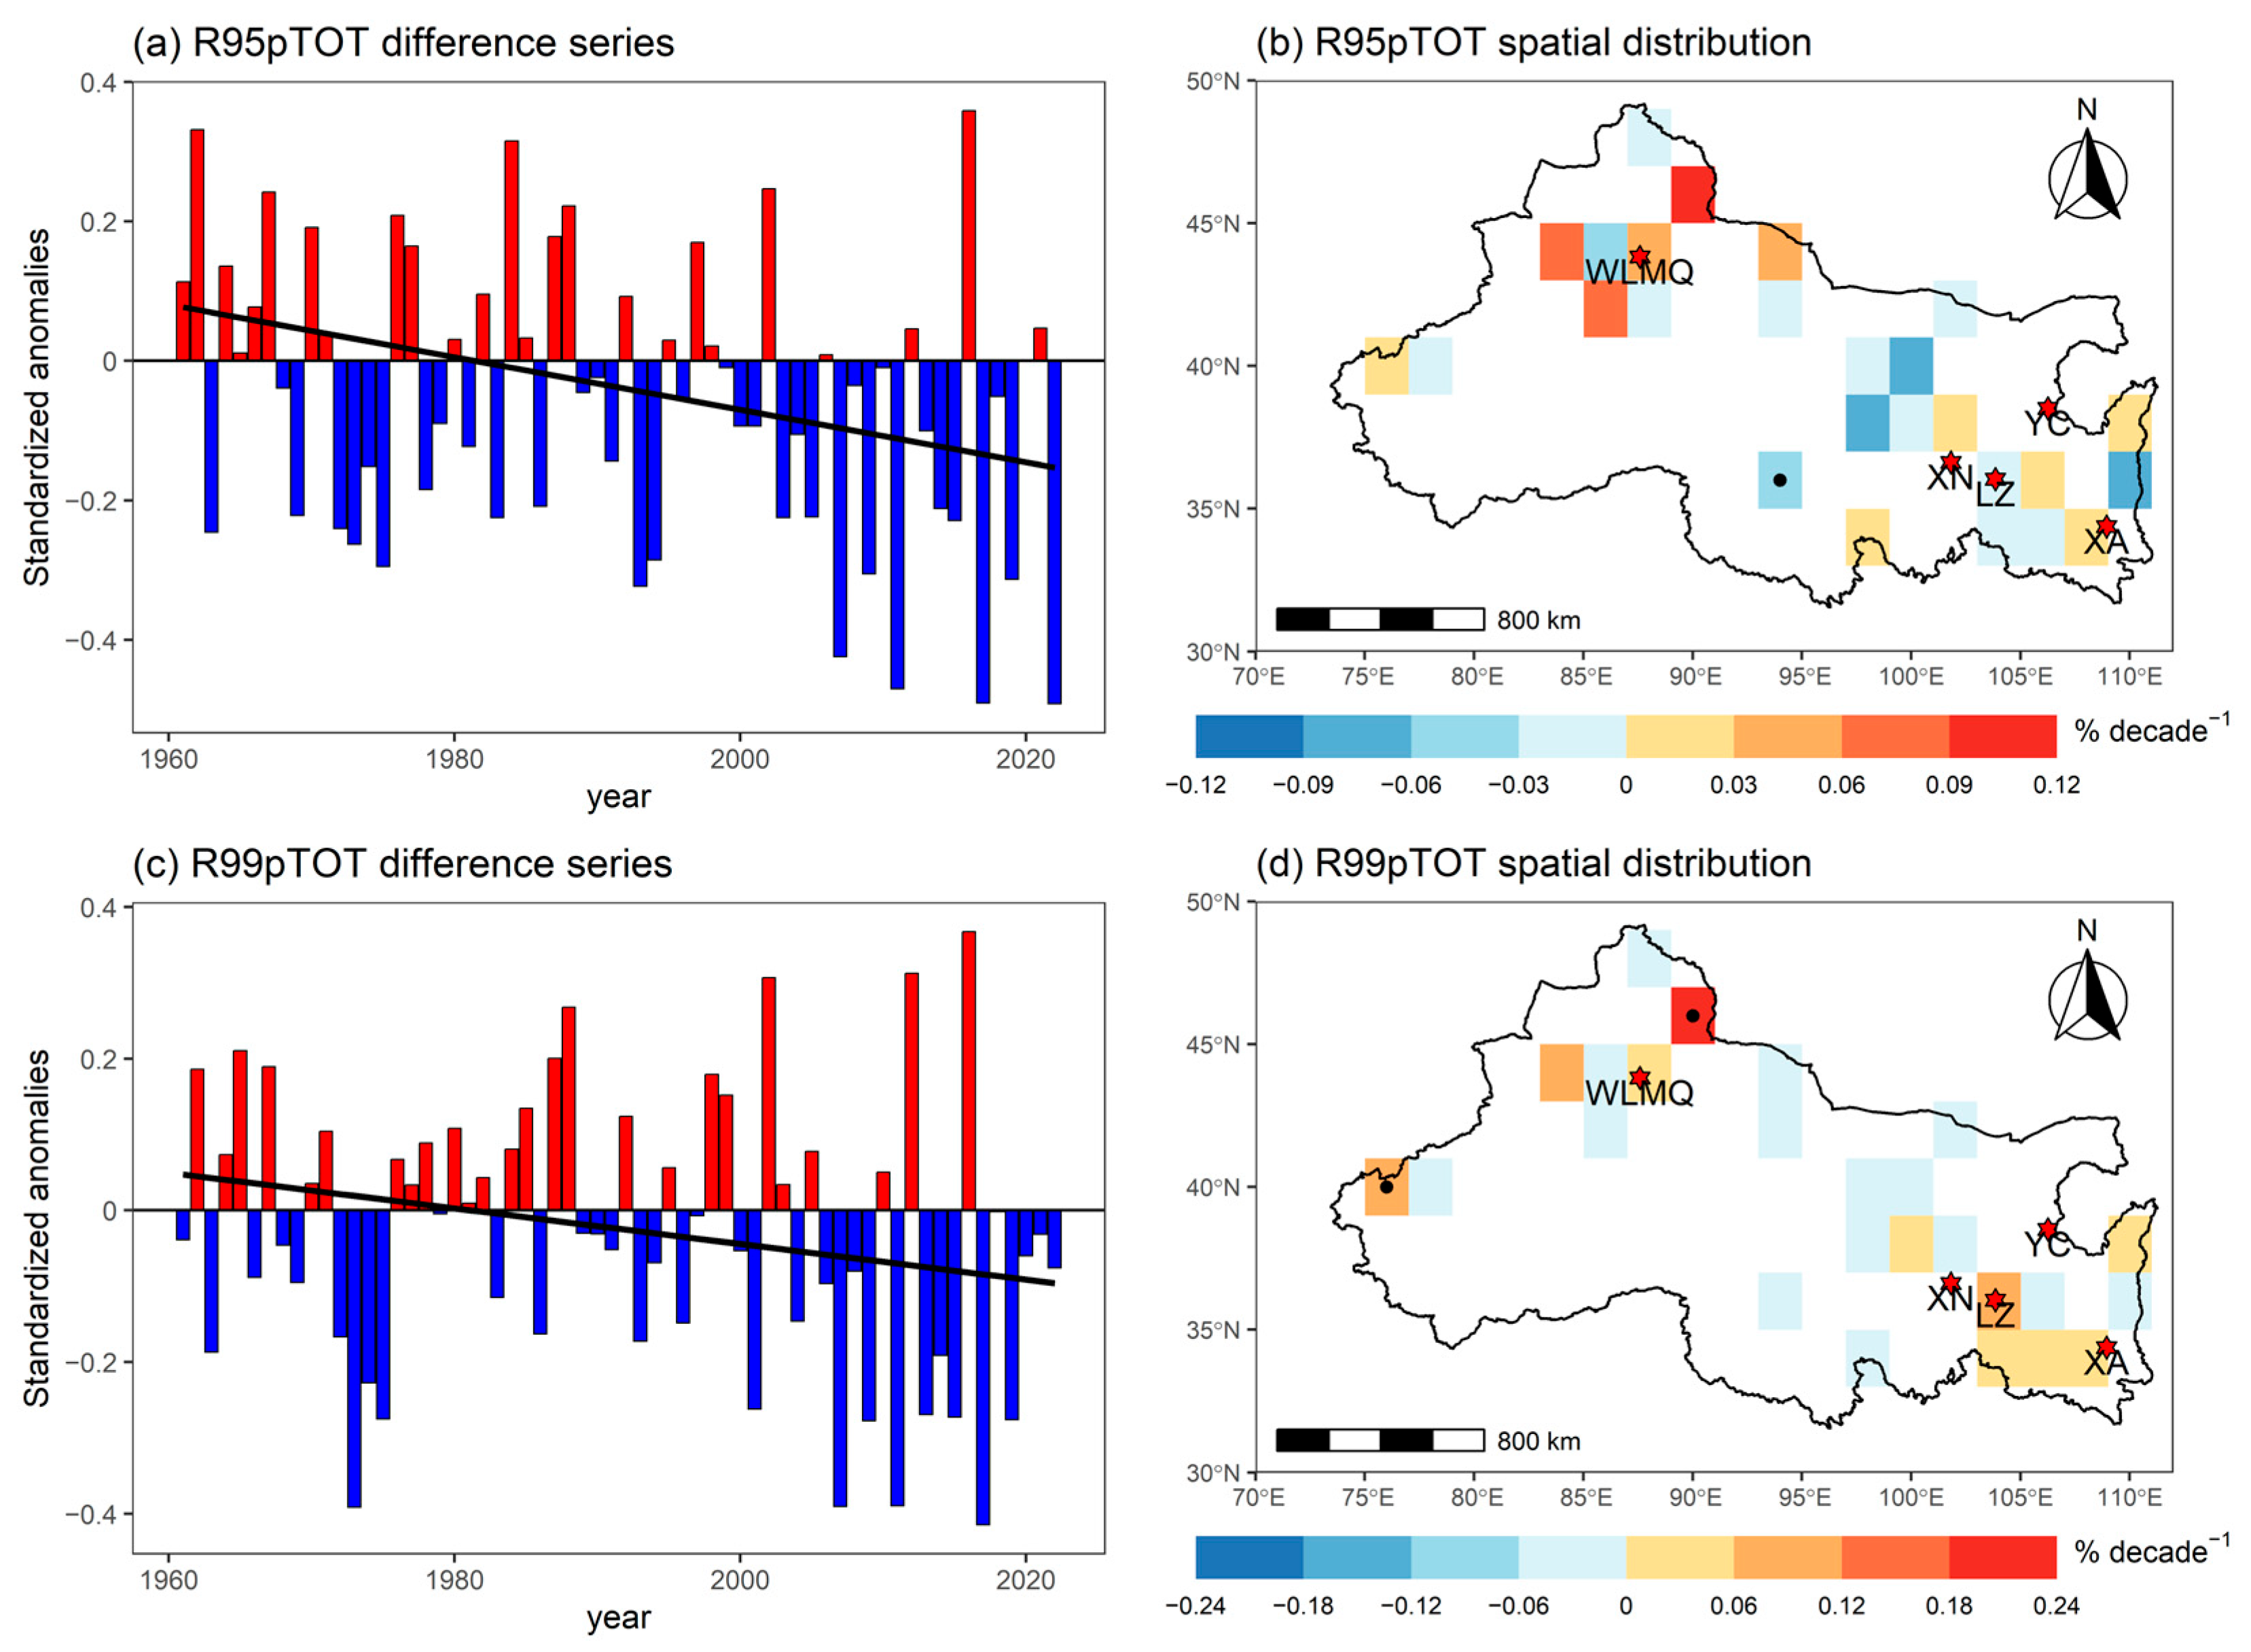
Figure 2 shows the time difference series (left) between all stations series and rural stations series and the spatial distribution patterns of urbanization effect (right) for relative threshold indices. Firstly, the difference series of R95pTOT and R99pTOT shows a downward trend and are statistically significant, and the urbanization contributions to the R95PTOT and R99pTOT indices are 44% and 35%, respectively, as shown in Figure 2a,c, and Table 1, which indicates that the increase in total extreme precipitation in urban areas is less than that in rural areas.
Secondly, it can be noted that the R95pTOT and R99pTOT contain more negative grid trends (i.e., the urbanization effect) of difference series between all station series and rural station series, as shown in Figure 2b,d. Furthermore, spatial distribution patterns analysis revealed different urbanization effects, with statistically significant positive and negative effects ( p   < 0.05). Only one grid cell is identified as statistically significant in the R95pTOT index, and the R99pTOT index only has two grids that show an upward trend and are statistically significant. However, although not many grid cells with statistically significant urbanization effects were identified, the urbanization effects on these two relative threshold indices within the region were indeed statistically significant.

3.2.2. Absolute Threshold Indices

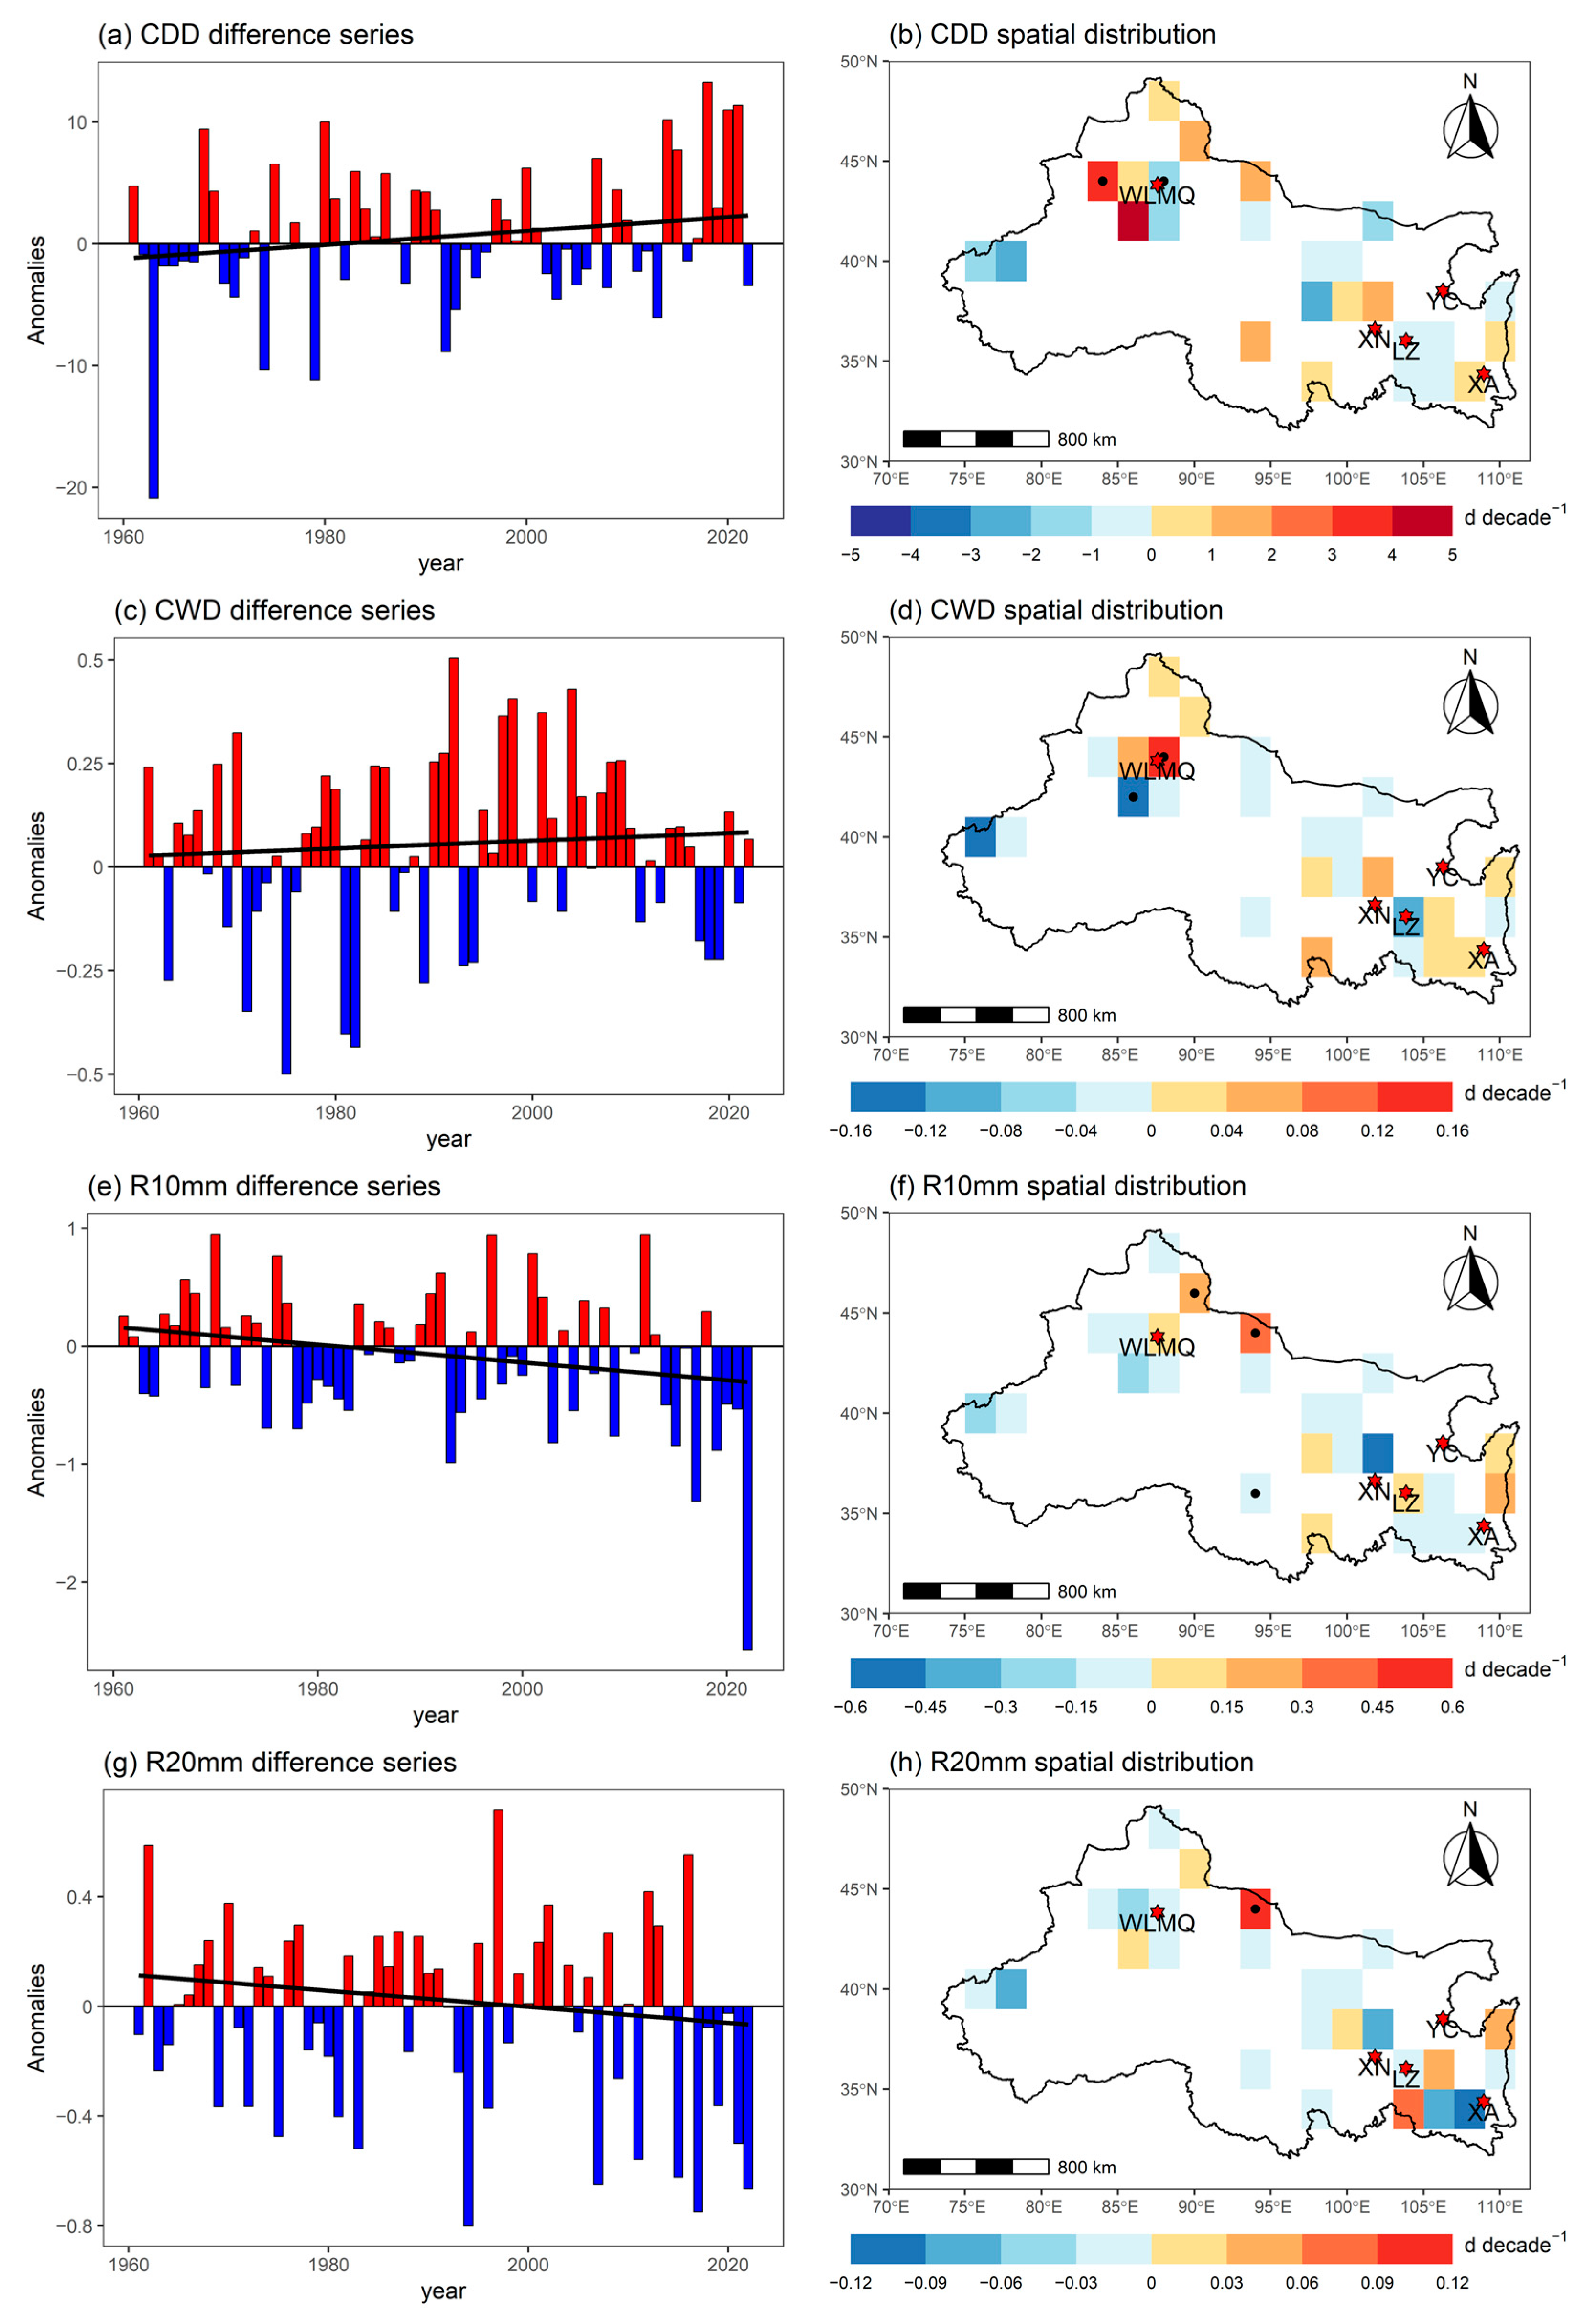
Figure 3 shows time difference series (left) between all stations series and rural stations series and the spatial distribution patterns of urbanization effect (right) for absolute threshold indices. Firstly, the linear fitting slope of the time difference series between CDD and CWD is positive, but this trend is not statistically significant, as shown in Figure 3a,c, and Table 1, indicating a potential upward trend in these two indices. In addition, it can be easily noticed that there was an abnormally low value in the difference series of CDD in 1963. Notably, the CDD (consecutive dry days) index algorithm aggregates these continuous dry periods over multiple years, culminating in the final year of the sequence. A striking example was observed at the Akdala station in 1963, which recorded an extraordinary 1027 consecutive dry days. Significantly, Akdala was a rural station, causing the abnormally low value. However, the non-parametric trend estimation and significance testing methods (Mann–Kendall test with Sen’s slope estimator) demonstrate robustness against such outliers. Our analysis revealed that after excluding this outlier from 1963, neither the trend of the series nor the results of the significance test showed any substantial changes (the trend after 1963 was 0.325 days decade−1, with a p-value of 0.323). The difference series of R10mm shows a downward trend and is statistically significant, and the urbanization contribution for R10mm is 43%, as shown in Figure 3e and Table 1, indicating that the increase in R10mm index in urban areas is smaller than that in rural areas. Furthermore, an abnormally low value was observed in the difference series of R10mm in 2022. Our analysis revealed that after excluding this outlier from 2022, neither the trend of the series nor the results of the significance test showed any substantial changes (the trend after removing 2022 was −0.063 days decade−1, with a p-value of 0.094), which is related to the non-parametric trend estimation and significance test methods we used [24,25].
In addition, it can be noted that the CDD, CWD, R10mm, and R20mm contain more negative grid trends (i.e., the urbanization effect) of difference series between all station series and rural station series, as shown in Figure 3b,d,f,h. Furthermore, spatial distribution patterns analysis revealed different urbanization effects, with statistically significant positive and negative effects ( p   < 0.05). All the indices (except R20mm) have a grid that shows a downward trend and is statistically significant, indicating that the negative urbanization effect in this grid has significantly decreased the number of continuous dry days, continuous wet days, and rainy days exceeding 10mm in urban areas. However, all the indices (except R10mm) have one grid that shows an upward trend and are statistically significant, indicating that the positive urbanization effect in this grid has significantly increased the number of continuous dry days, continuous wet days, and rainy days exceeding 20mm, as shown in Figure 3b,d,h. R10mm has two grids that show an upward trend and are statistically significant, indicating that the positive urbanization effect in these two grids has significantly increased the number of rainy days exceeding 10mm in urban areas, as shown in Figure 3f.

3.2.3. Extreme Value Indices

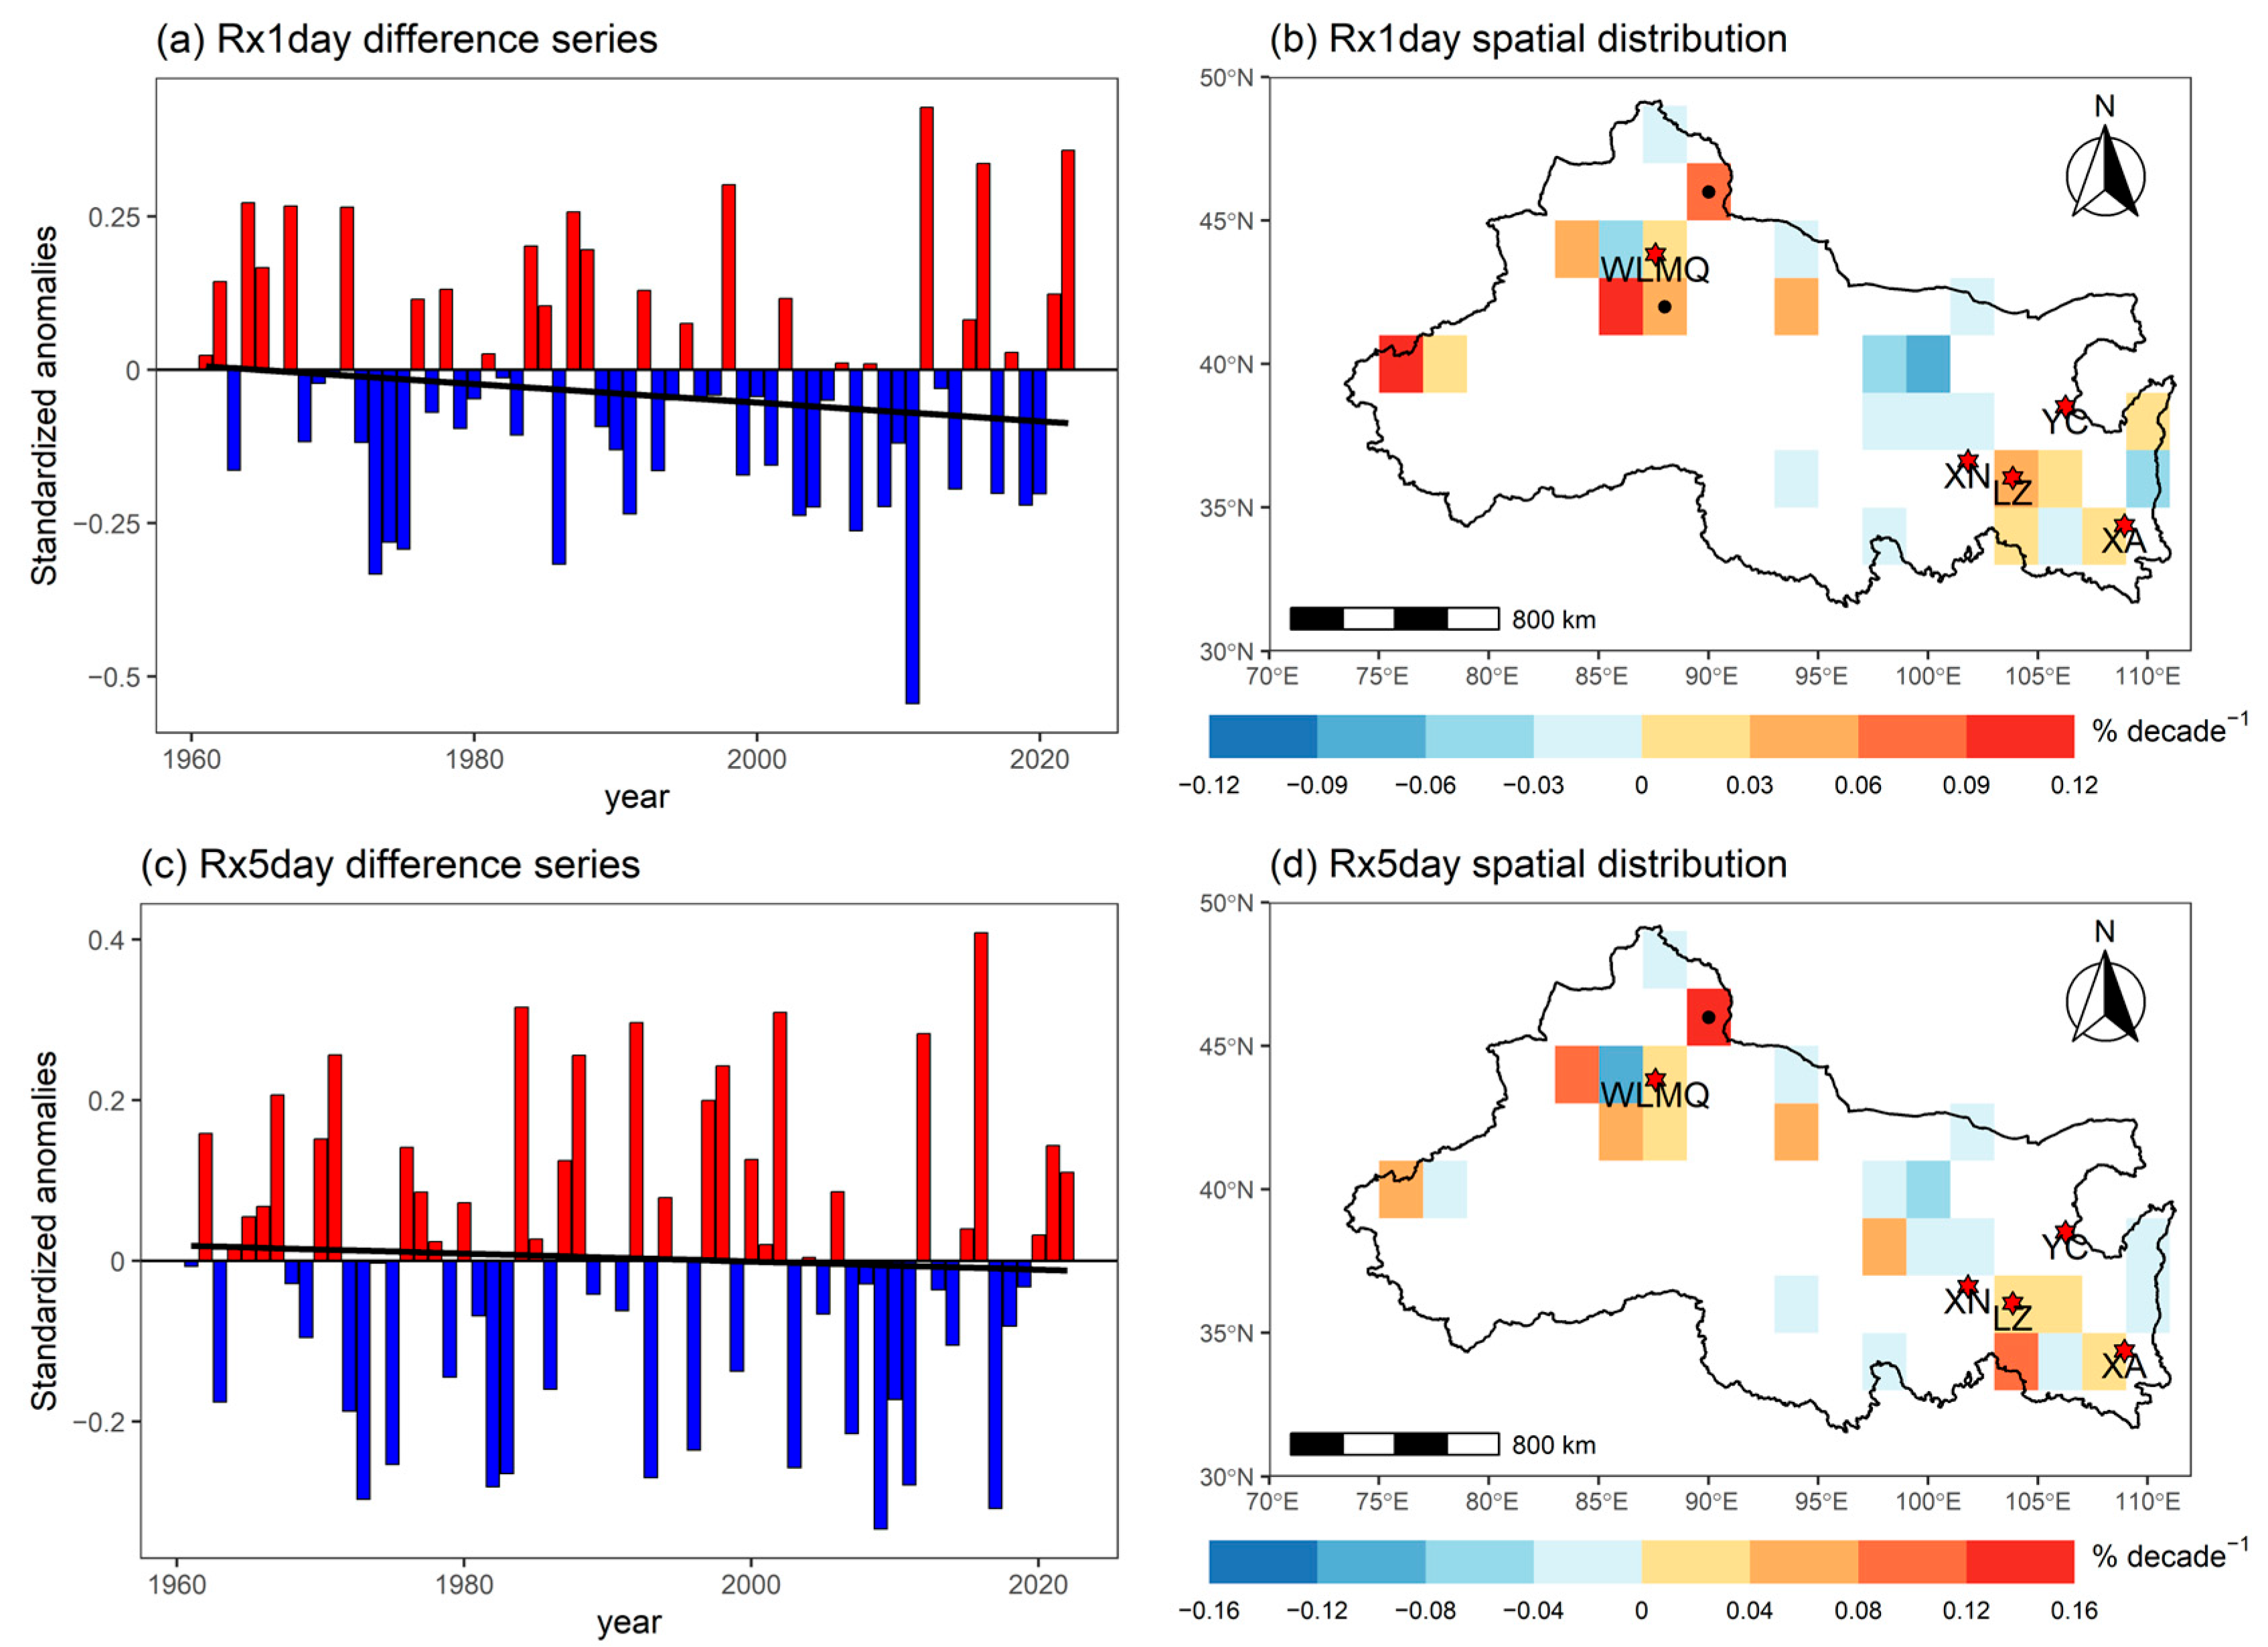
Figure 4 shows the time difference series (left) between all stations series and rural stations series and the spatial distribution patterns of urbanization effect (right) for extreme value indices. Firstly, the linear fitting slope of the time difference series between Rx1day and Rx5day is negative, but this trend is not statistically significant, as shown in Figure 4a,c, and Table 1, indicating a potential decreasing trend in these two indices. In addition, it can be noted that both Rx1day and Rx5day have positive grid trends (i.e., the urbanization effect) and are statistically significant in the difference series between all station series and rural station series, as shown in Figure 4b,d. Furthermore, spatial distribution patterns analysis revealed different urbanization effects.

3.2.4. Other Indices

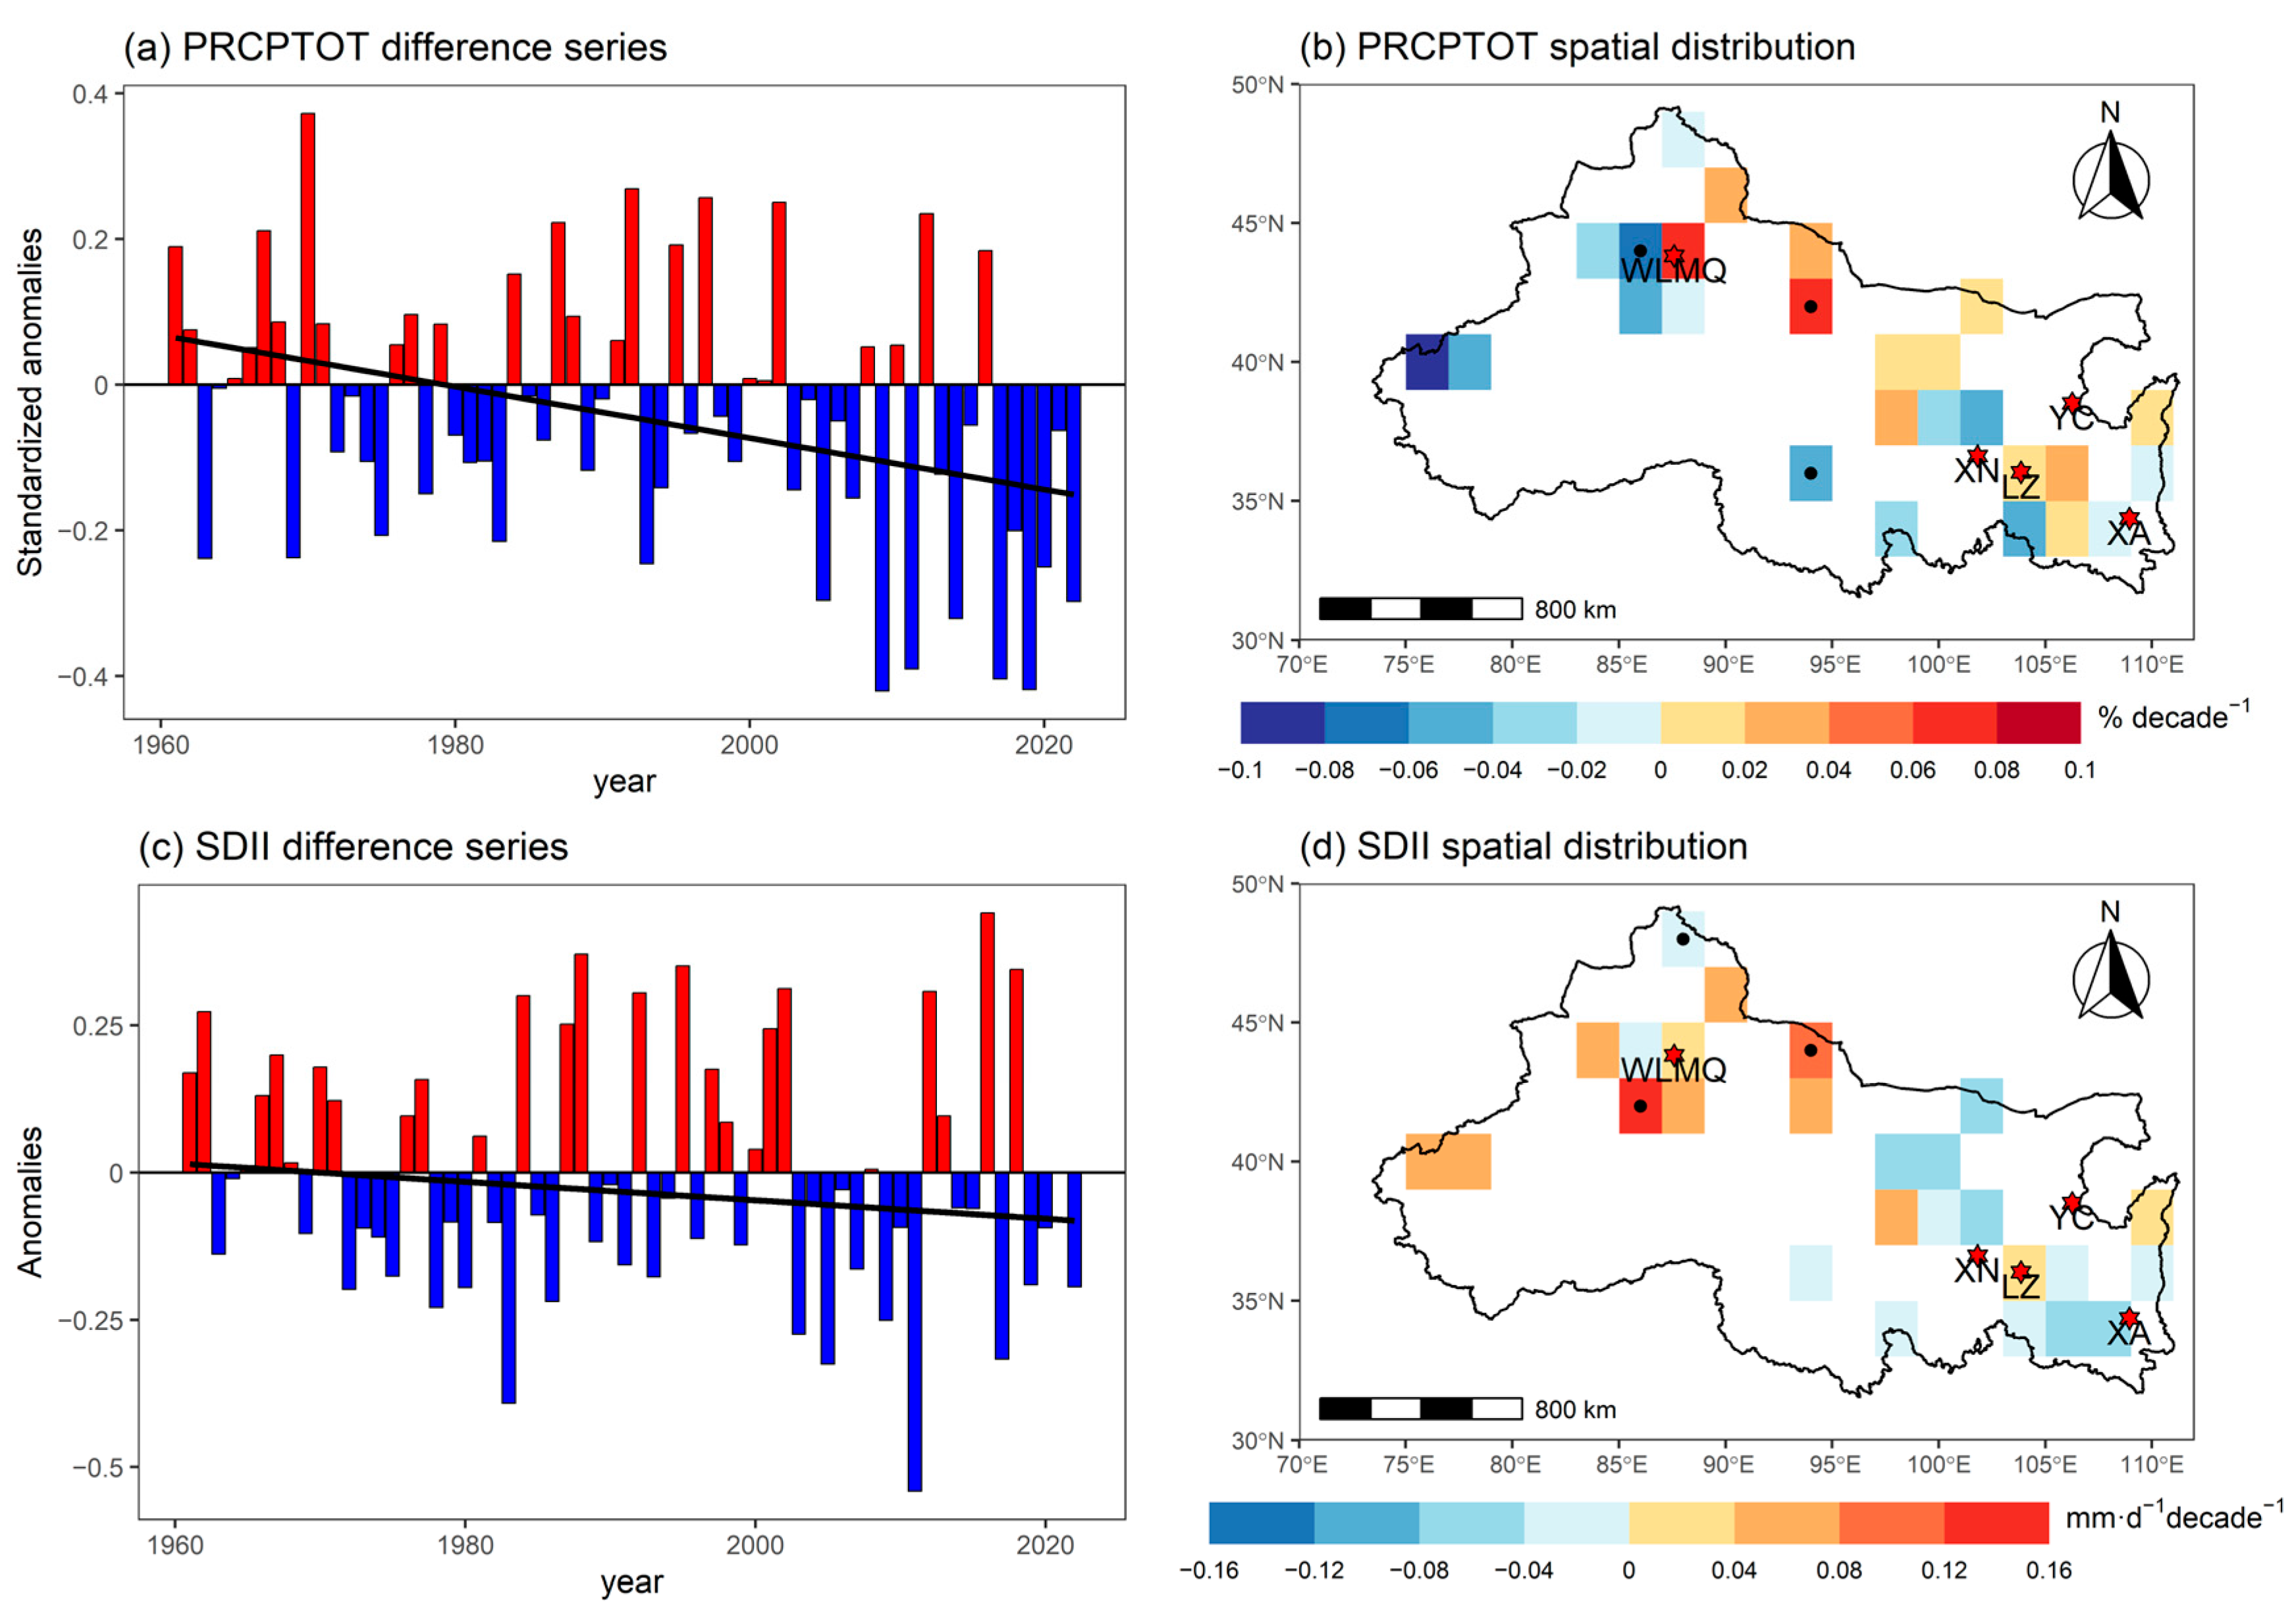
Figure 5 shows the time difference series (left) between all stations series and rural stations series and the spatial distribution patterns of urbanization effect (right) for PRCPTOT and SDII indices. The difference series of PRCPTOT shows a downward trend and is statistically significant, and the urbanization contribution for PRCPTOT is 33%, as shown in Figure 5a and Table 1, which indicates that the increase in indices of PRCPTOT in urban areas is less than that in rural areas. The linear fitting slope of the time difference series for SDII is negative, but this trend is not statistically significant, as shown in Figure 5c and Table 1, indicating a potential downward trend in SDII.
It can be noted that the number of grid cells with positive and negative urbanization effects on PRCPTOT and SDII indices are comparable, though slightly more grids exhibit negative effects. Specifically, for the PRCPTOT index, negative urbanization effects, indicating reduced total precipitation, dominate in the western and southern parts of NWC. In contrast, for the SDII index, most regions in western NWC show positive urbanization effects (suggesting increased precipitation intensity), whereas eastern regions primarily exhibit negative effects (indicating decreased precipitation intensity), as shown in Figure 5b,d.
In summary, by calculating the time difference series and the spatial distribution patterns of 10 indices in NWC, it can be found that the urbanization effect varies among different regions and indices. Urbanization effect has caused observational biases in precipitation estimates across NWC, manifesting as systematic underestimation in most regions but localized overestimation in specific metropolitan areas.

4. Discussion

Overall, we found that the difference series of some indices in NWC showed a downward trend and was statistically significant, indicating that the precipitation or rainy days in urban areas experienced a less increase than those in rural areas. Analysis of urbanization effects across the 10 indices reveals distinct spatial heterogeneity in NWC, with some indices demonstrating positive urbanization effect in Urumqi, as shown in Figure 3, Figure 4 and Figure 5. This is opposite against the regional averaged urbanization effects, which may be related to complex factors such as the level of urbanization, the spatial distribution of irrigated agricultural activities, and thermal circulation factors, etc. Therefore, we selected Urumqi, the largest city of NWC, as a case to study the effect on the observed precipitation data.
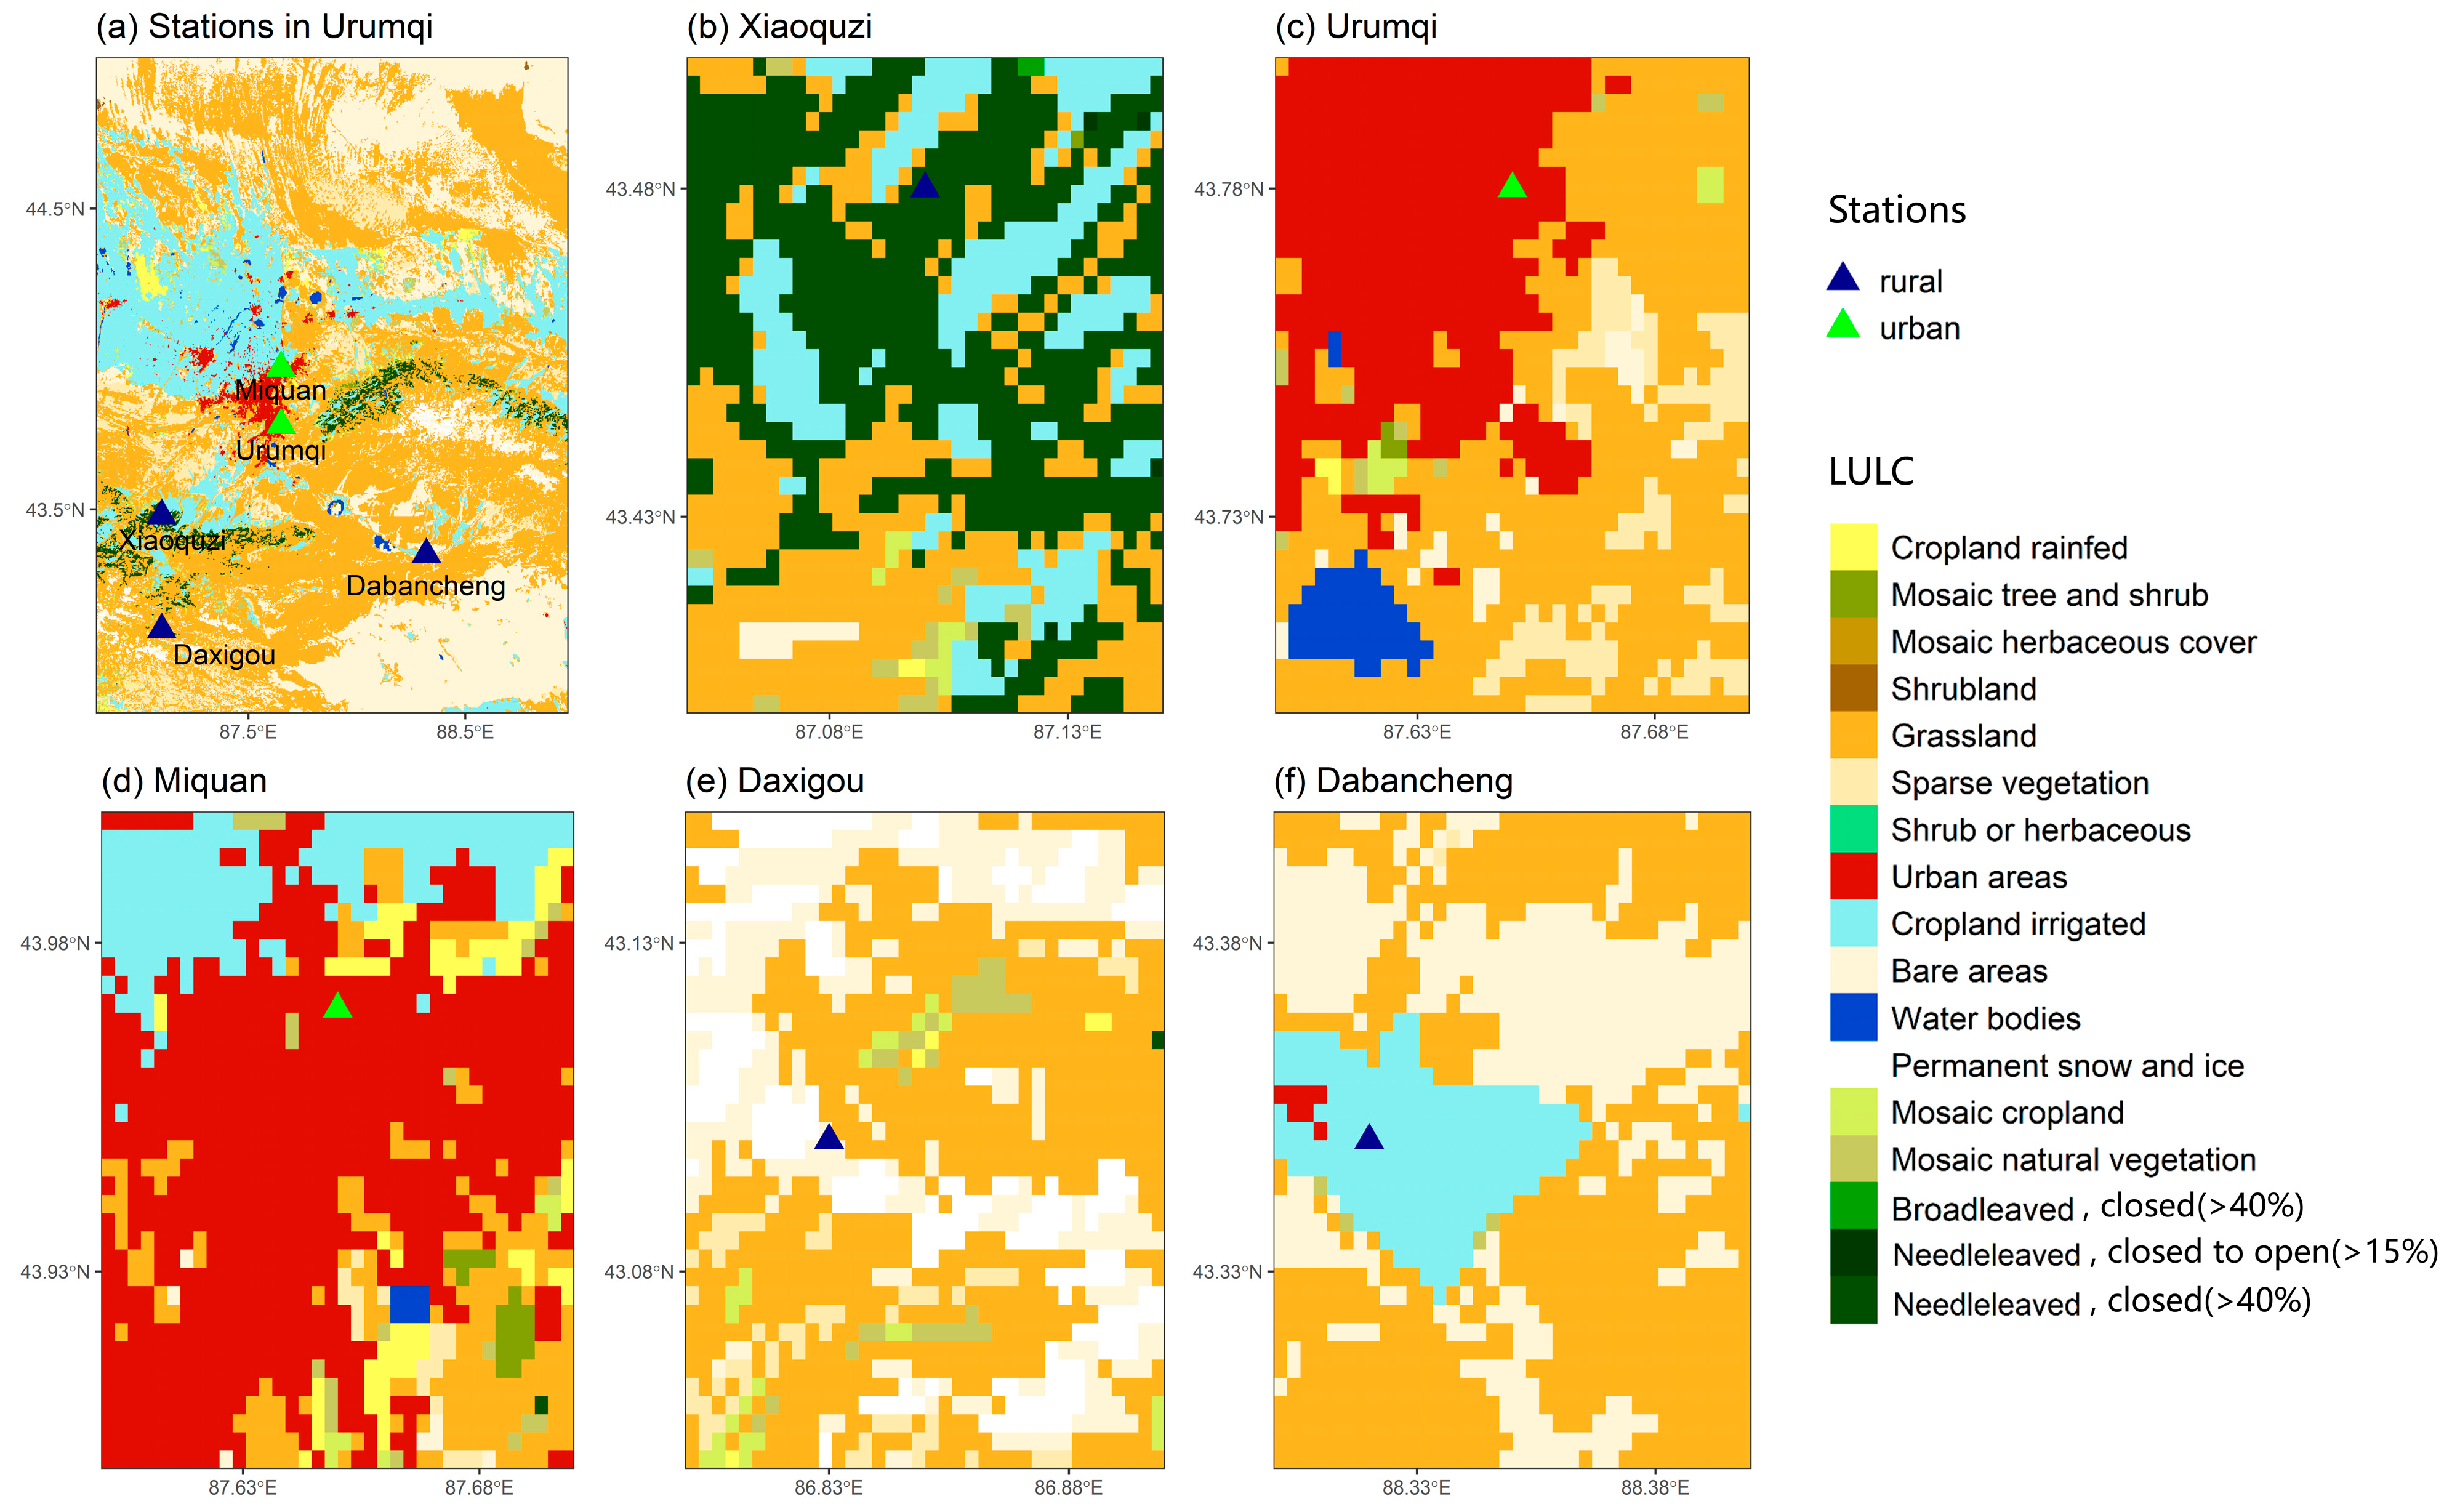
Urumqi is equipped with five national meteorological stations, of which two are in urban areas, namely the Miquan and Urumqi stations, while the remaining three, namely the Xiaoquzi, Daxigou, and Dabancheng stations, are situated in rural areas. This configuration results in a well-balanced ratio of urban to rural stations, facilitating robust comparative analysis. The spatial distribution of these meteorological stations in Urumqi, along with the associated LULC types in the surrounding regions, are shown in Figure 6.
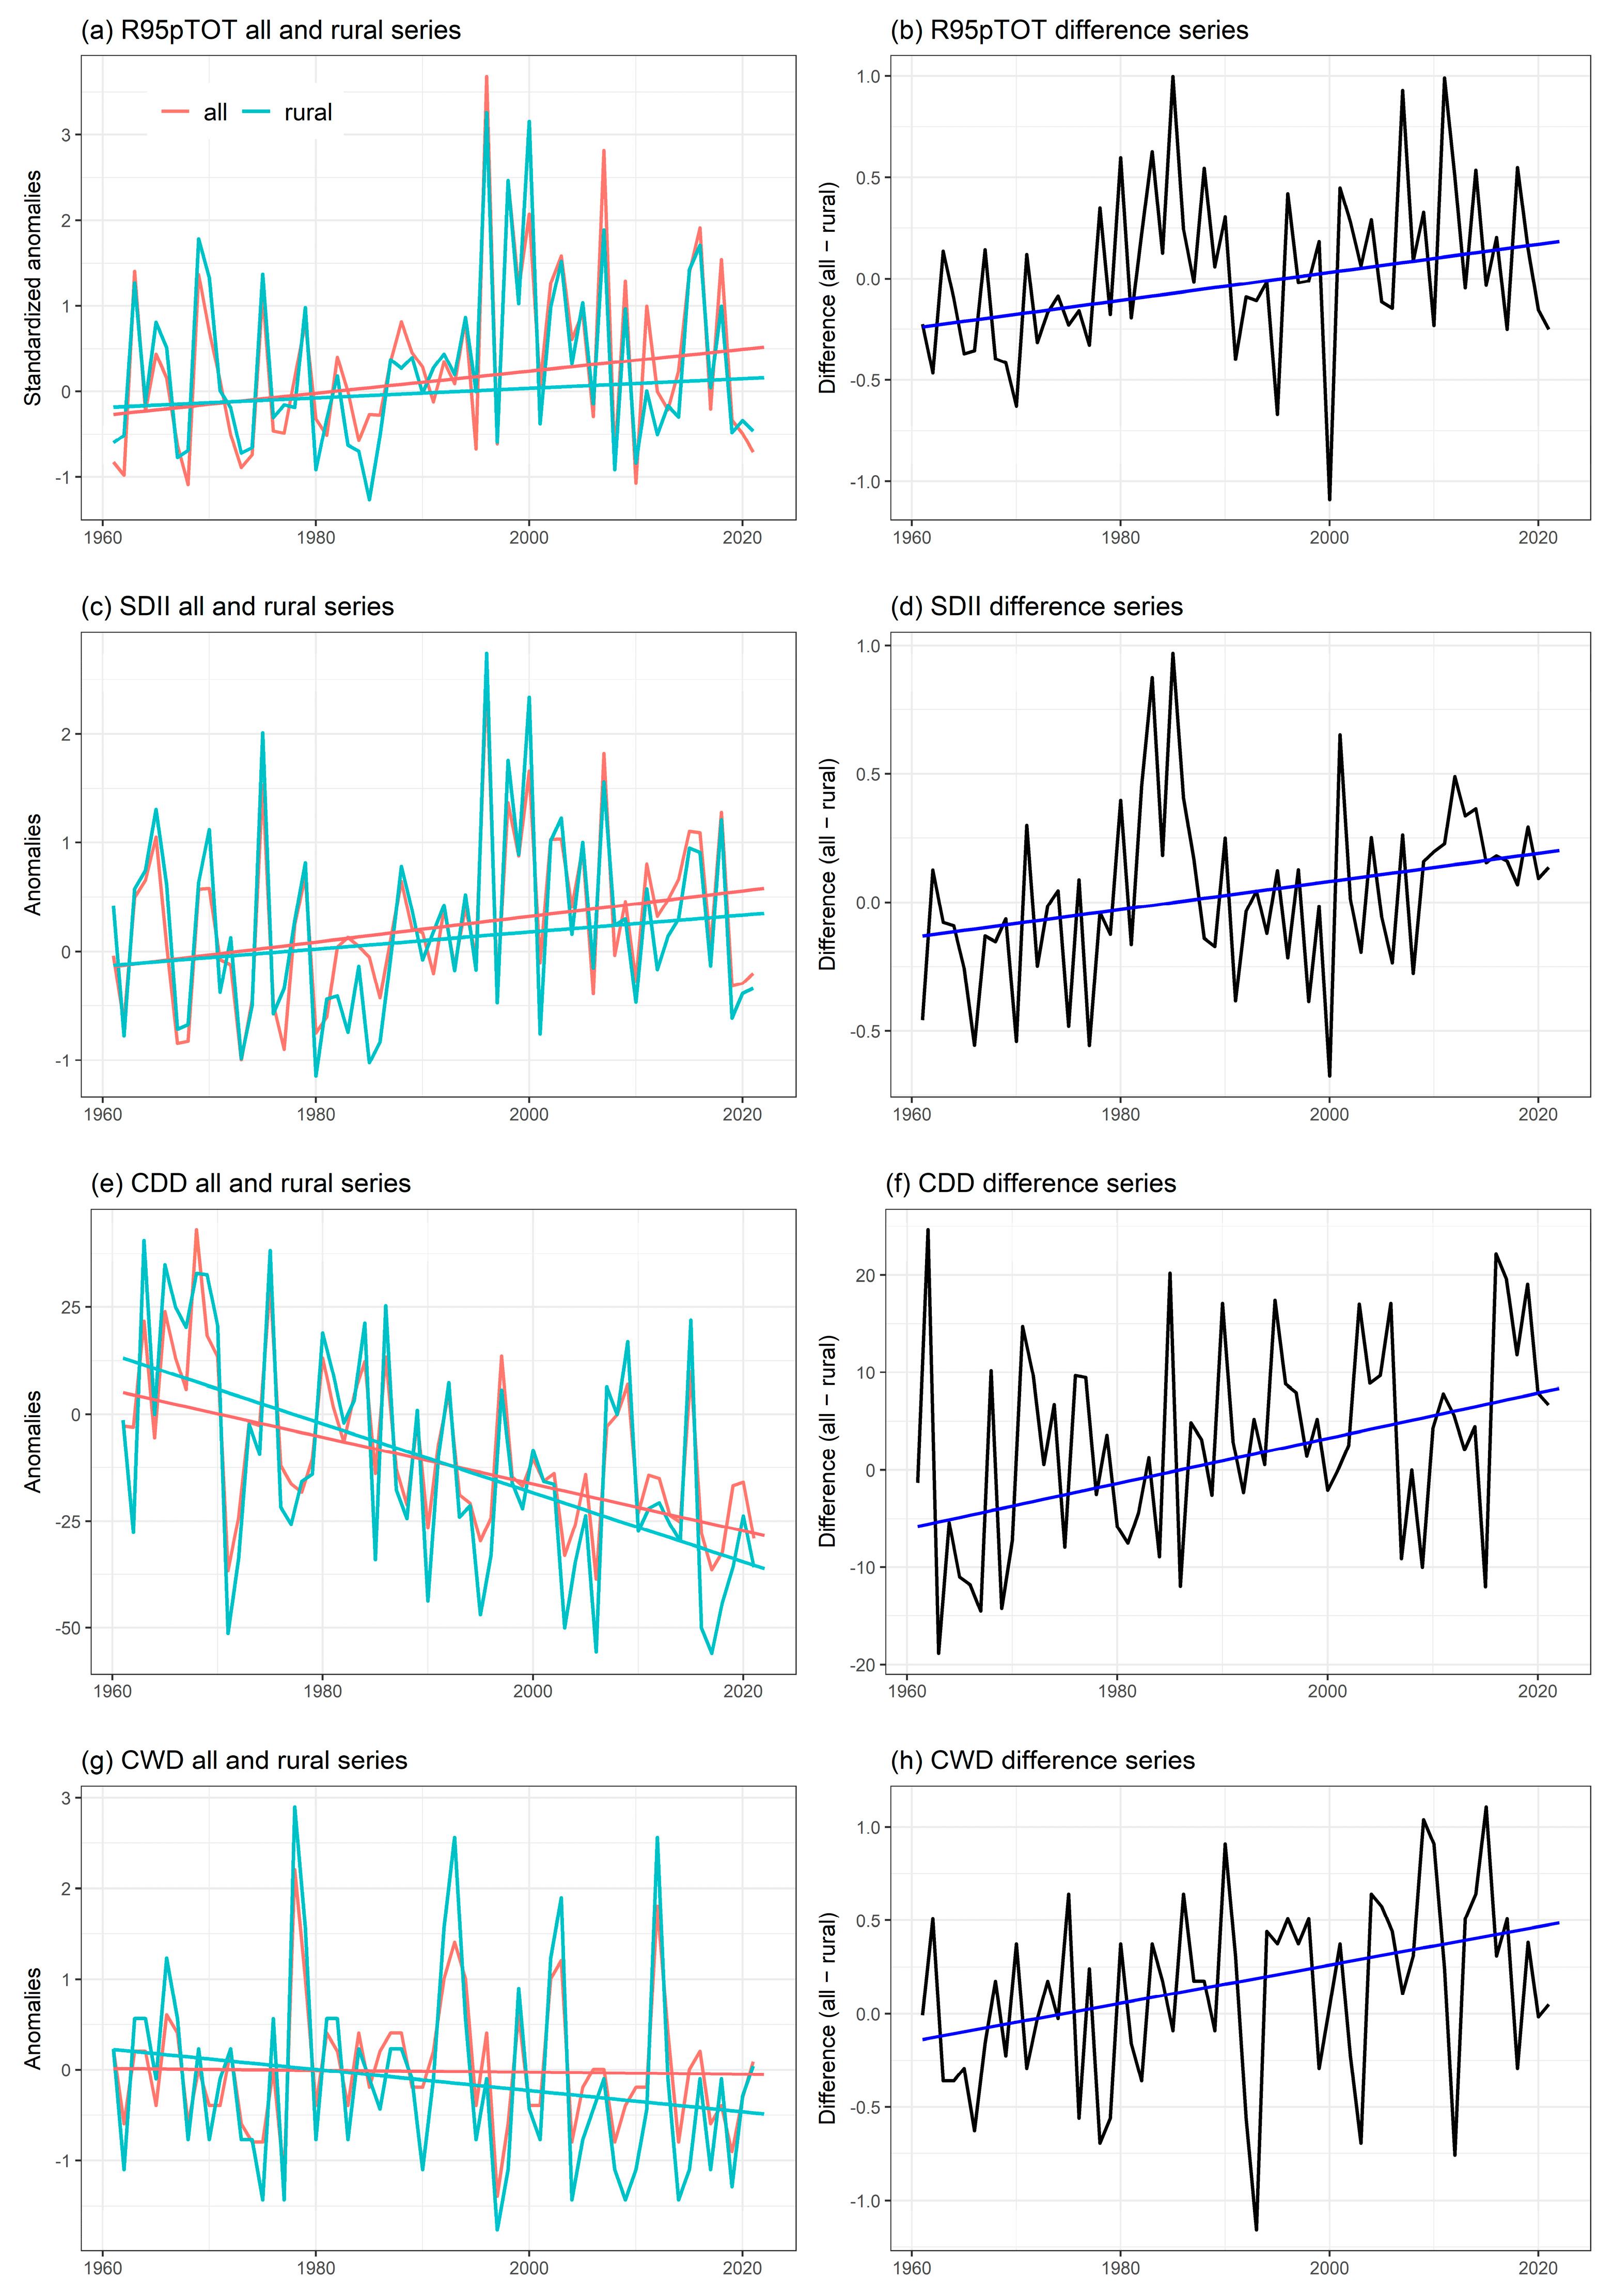
The time series of all stations and rural stations in Urumqi for the 10 indices were obtained using the method of simple arithmetic mean, but the results differ greatly from those for the sampled urban areas of NWC. The difference series of four precipitation indices in Urumqi city showed an upward trend, and the corresponding change trends were statistically significant, indicating that urban areas received more precipitation over time than rural areas. This demonstrates that the urbanization process of Urumqi city has led to an increase in precipitation and rainy days.
Figure 7 shows the standardized anomaly/anomalies time series of four indices obtained using all stations and rural stations in Urumqi city from 1961 to 2022 (left), as well as the time difference series between all stations and rural stations (right). Firstly, the difference series of R95pTOT, SDII, CDD, and CWD show an upward trend and are statistically significant at the 0.05 level (see Figure 7b,d,f,h), indicating that urbanization has led to more extreme precipitation and stronger precipitation intensity than rural areas. Secondly, the continuous wet and dry days are more common with temporal in urban areas than in rural areas. Continuous wet days refers to the largest number of consecutive days whose daily precipitation exceeds 1mm, while continuous dry days refers to the largest number of consecutive days whose daily precipitation is less than 1 mm. Therefore, we can observe that both the largest number of consecutive dry days and the largest number of consecutive wet days have increased in urban areas compared to those in rural areas, indicating that the climate has become more extreme due to the effect of urbanization. Due to space limitations of this paper, the calculation results of the other six precipitation indices in Urumqi city are shown in the Supplementary Materials (Figures S11–S16).
As mentioned above, the positive trends in most precipitation indices for both all and urban stations in NWC are not significantly greater than that of rural series. The reasons for the negative effects of urbanization may be explained as follows:
  • Most of the meteorological observation stations in NWC are in oasis areas, but some are in agricultural oasis and others in urban oasis. Compared to the deserts and Gobi areas, where there are usually no observation stations, oasis areas are characterized by larger actual evaporation and higher atmospheric moisture [30], with more precipitation and extreme intense precipitation. This has been assumed as one of the main causes for the increased precipitation as observed in the arid region of NWC [30].
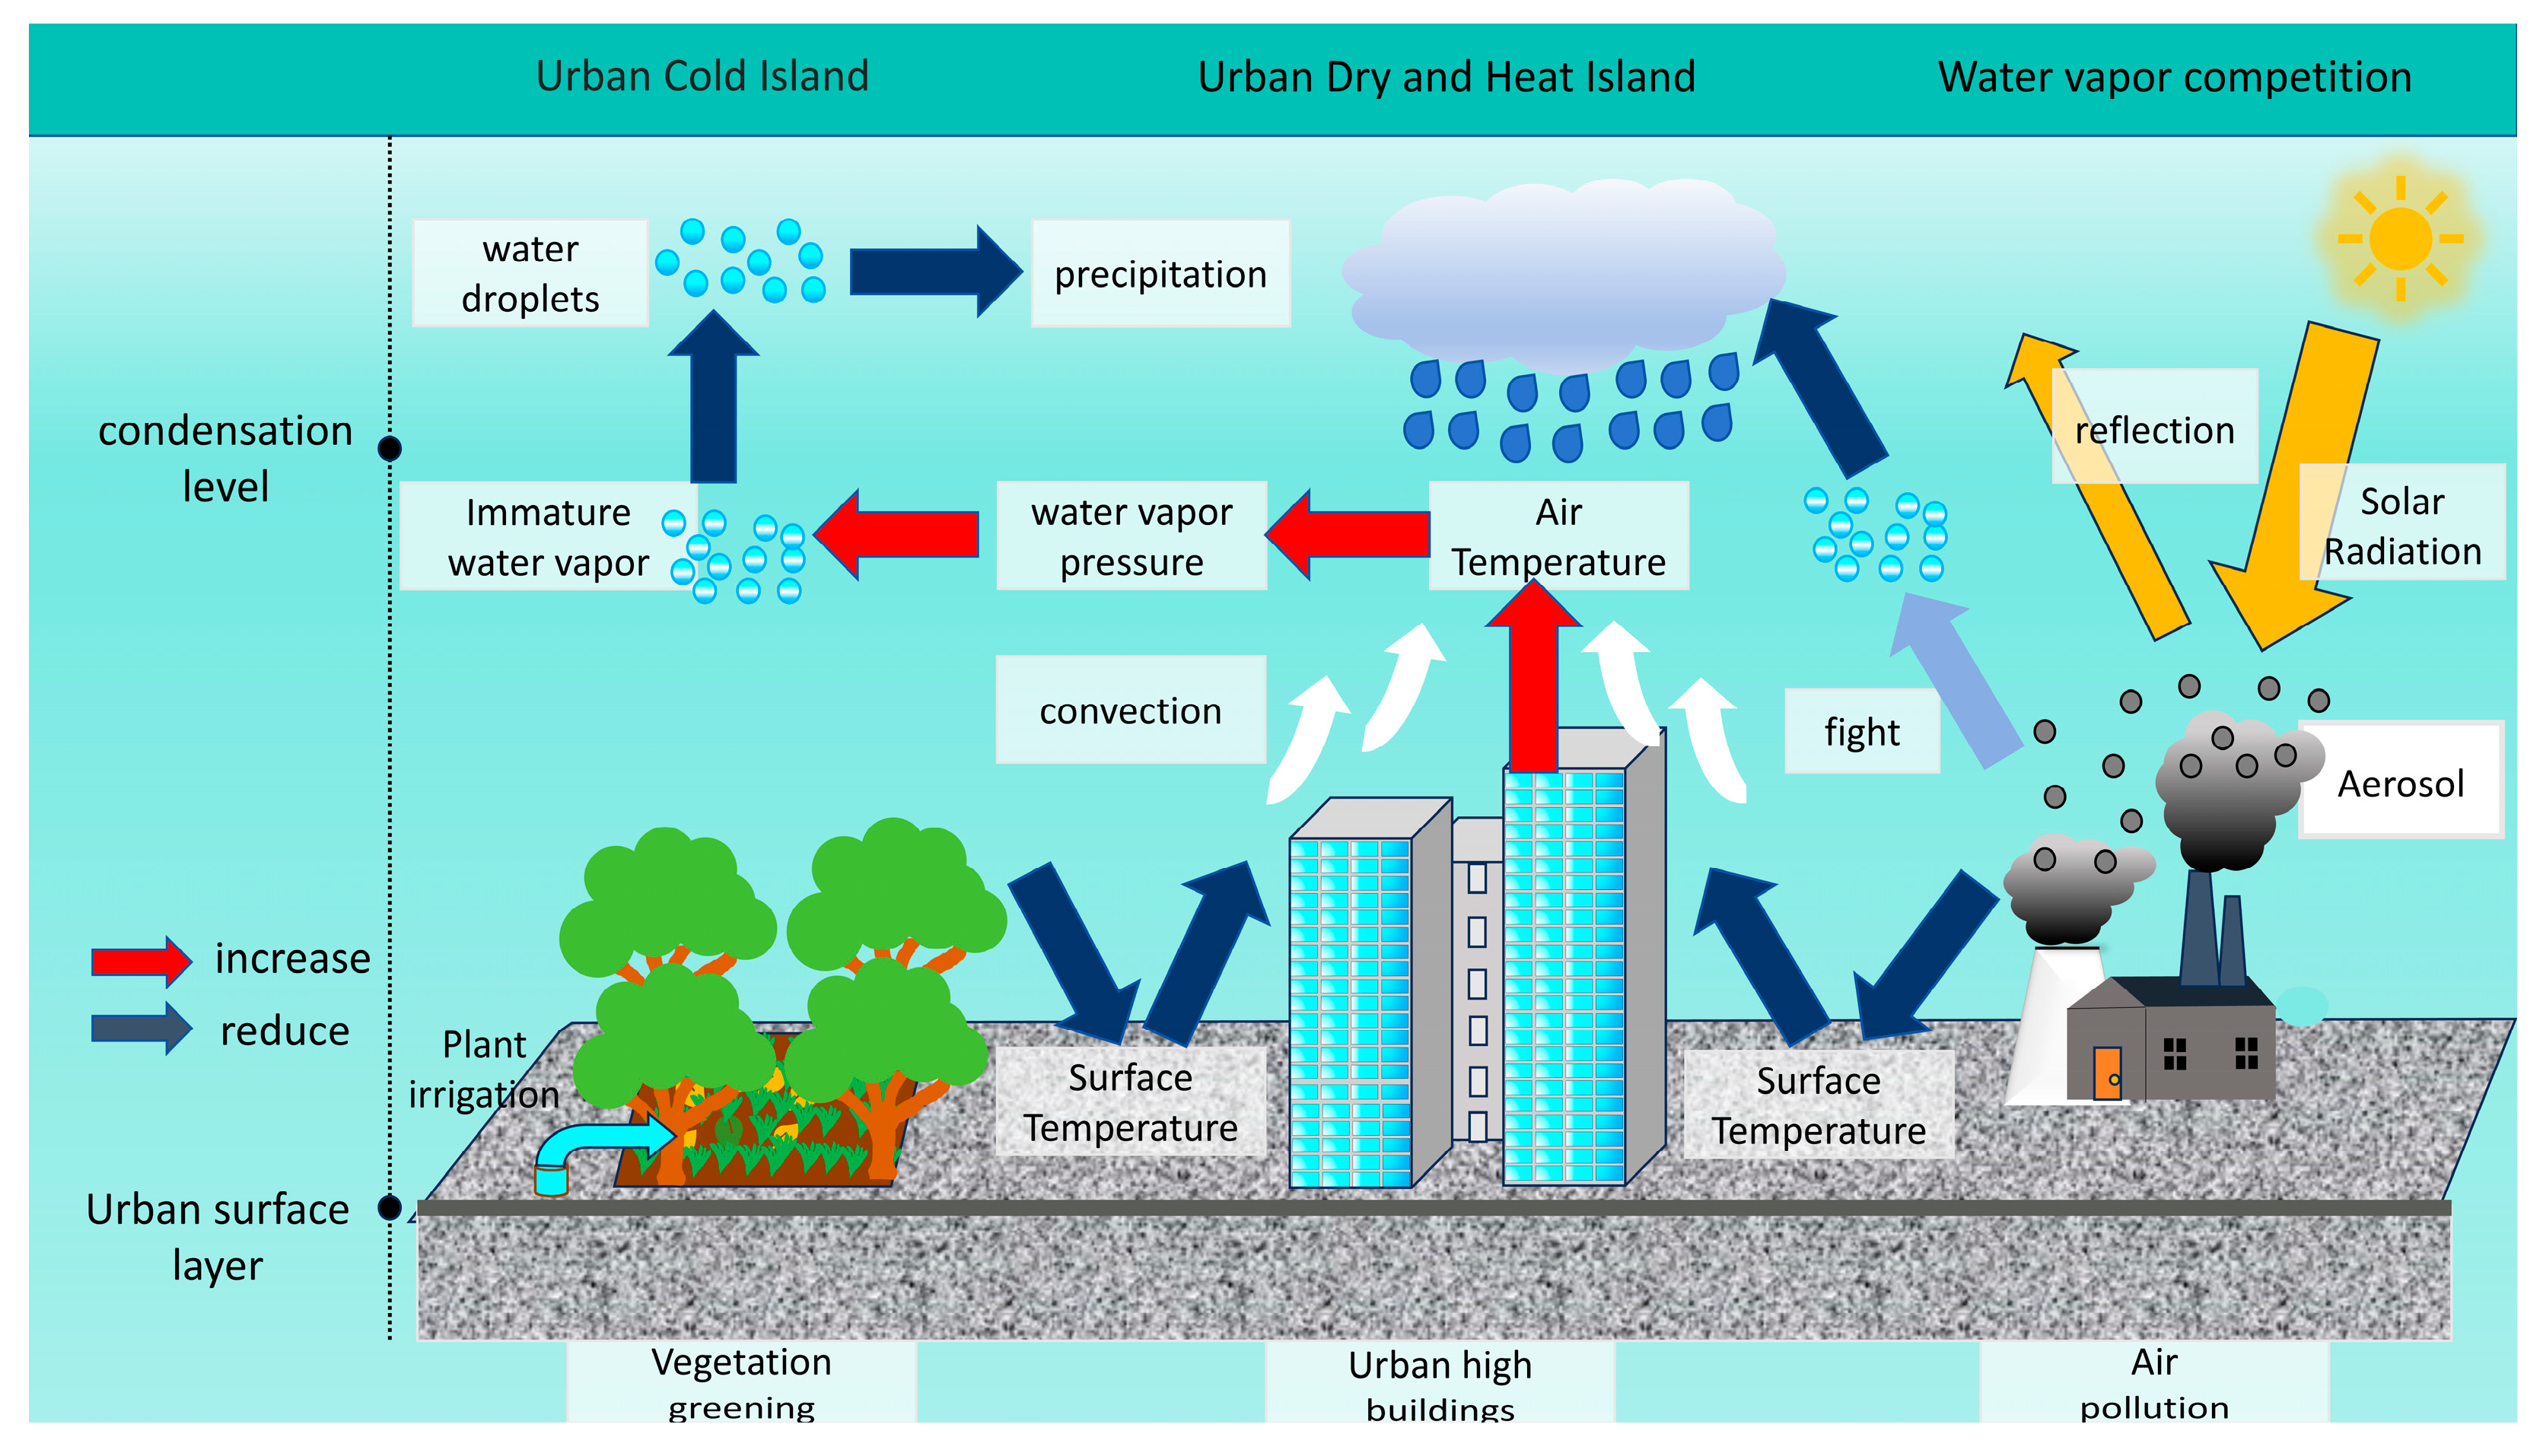
  • In urban oasis areas, however, the increases in actual evaporation and atmospheric moisture may have been smaller as compared to those in agricultural oasis areas, due to the relatively smaller proportion of vegetation or crop plants and the resulting lower consumption of water. The urban heat island (UHI) and urban dry island (UDI) in urban areas further increase the vapor pressure deficit (VPD) near urban stations, leading to a lower possibility for water vapor to condense in atmosphere and a lower precipitation frequency and precipitation amounts. As urbanization proceeds, urban stations may have seen relatively decreased precipitation total and extremes compared to the rural stations, which are mostly located in agricultural oasis areas (Figure 8).
  • It is also possible that the aerosol competition mechanism in urban areas plays a role. Due to urban traffic and industrial pollution, cloud droplet particles may decrease because of the excessive cloud condensation nuclei in urban areas compared to rural areas. The merging of cloud droplets is suppressed, slowing down the rate of cloud droplet transformation into rain droplets and causing less precipitation [30,31,32,33]. The radiation effect of aerosols can reduce the radiation reaching the ground, thereby reducing the energy used for evaporating surface water bodies and convection, resulting in reduced water evaporation and weakened convection in urban areas. The heat that is not reflected into space by aerosols is absorbed by the upper atmosphere, stabilizing the low-layer atmosphere and suppressing the generation of convective clouds [34,35] (Figure 8).
In Urumqi, however, the trend of urban precipitation series for most indices is significantly greater than that of rural series, with more extreme precipitation, more rainy days, and greater precipitation intensity in urban areas. The reason for this phenomenon needs to be further investigated, but it may have been related to the size of urbanization and the peculiar geographical location in NWC. Unlike most other cities in NWC, Urumqi is a super city, and it is also located in the northern Xinjiang Oasis Belt, with vast areas of agricultural oasis surrounding it [36]. The city thus may not lack atmospheric moisture even within the urban areas. This, combined with stronger UHI intensity and the resulting stronger convection, may have caused an increase in total and extreme precipitation [34,35] compared to the nearby rural areas. It is also possible that urbanization leads to a greater decrease in near-surface wind speed around the observational station rather than in other cities, which in turn leads to a more significant increase in rainfall capture rate of the gauges [30,37]. These issues need to be further investigated in future studies.

5. Conclusions

The percentage of urban LULC within a buffer radius of 1–12 km around each station was calculated using the global LULC dataset provided by the ESA, and reference stations were selected from all stations in NWC. Then, applying the grid area-weighted average method to obtain the regional average time series for all stations and rural stations, as proposed by Jones and Hulme [22]. Finally, the urbanization effect on precipitation indices was evaluated using the difference between all stations and rural stations, and the urbanization contribution was studied. The main conclusions are summarized as follows:
  • Precipitation in NWC is increasing. Temporally, the total precipitation (PRCPTOT) has shown an upward trend, alongside increases in the frequency (R10mm, R20mm) and intensity (SDII, Rx1day, Rx5day, R95pTOT, R99pTOT) of extreme precipitation events. In contrast, the duration of consecutive dry days (CDD) has decreased. These trends pose significant challenges for adapting to extreme climate variability. Spatially, precipitation has increased across most of NWC, but the spatial distribution of these increase exhibit pronounced heterogeneity, reflecting regional disparities in hydrological responses to climate change.
  • The precipitation in NWC is affected by urbanization, but the urbanization effect varies among different regions and indices. The difference series (all–rural) of the R10mm, R95pTOT, R99pTOT, and PRCPTOT indices across the sampled urban areas of NWC exhibited statistically significant decreasing trends ( p < 0.05), indicating substantial urbanization impacts on these four extreme precipitation indices. The estimated urbanization contributions were estimated as 43% for R10mm, 44% for R95pTOT, 35% for R99pTOT, and 33% for PRCPTOT, respectively. However, the difference series (all–rural) of the R95pTOT, SDII, CDD, and CWD indices in Urumqi exhibited statistically significant increasing trends ( p < 0.05), demonstrating a pronounced urbanization effect on these four indices. The urbanization contributions reached 54% for R95pTOT, 46% for SDII, 42% for CDD, and 100% for CWD.
  • Previously reported regional increases in total and extreme precipitation may have been underestimated due to the urbanization bias of precipitation data. The R10mm, R95pTOT, R99pTOT, and PRCPTOT indices in the sampled urban areas of NWC exhibited statistically significant negative urbanization effects at urban and all stations. The downward urbanization effects are opposite to the overall upward regional trends in the total precipitation and extreme precipitation indices.

Supplementary Materials

The following supporting information can be downloaded at: https://www.mdpi.com/article/10.3390/land14112113/s1, Figure S1: Regional annual average time series and spatial distribution map of Rx1day in NWC over 1961–2022 (all observational stations); Figure S2: As in Figure S1, but for Rx5day; Figure S3: As in Figure S1, but for SDII; Figure S4: As in Figure S1, but for R10mm; Figure S5: As in Figure S1, but for R20mm; Figure S6: As in Figure S1, but for CDD; Figure S7: As in Figure S1, but for CWD; Figure S8: As in Figure S1, but for R95pTOT; Figure S9: As in Figure S1, but for R99pTOT; Figure S10: As in Figure S1, but for PRCPTOT; Figure S11: (a) Annual average time series and (b) their corresponding difference time series for Rx1day in Urumqi city from 1961 to 2021; Figure S12: As in Figure S11, but for Rx5day; Figure S13: As in Figure S11, but for R10mm; Figure S14: As in Figure S11, but for R20mm; Figure S15: As in Figure S11, but for R99pTOT; Figure S16: As in Figure S11, but for PRCPTOT.

Author Contributions

Conceptualization, P.Z.; Data Curation, C.L. and P.Z.; Formal Analysis, P.Z. and H.D.; Funding Acquisition, P.Z. and G.R.; Investigation, G.R.; Methodology, C.L., P.Z. and G.R.; Project Administration, P.Z.; Resources, G.Y.; Software, C.L., P.Z. and G.R.; Supervision, G.R. and H.D.; Validation, G.R. and H.D.; Visualization, C.L. and P.Z.; Writing—Original Draft, C.L., P.Z., G.R. and Z.G.; Writing—Review and Editing, C.L., P.Z., G.R. and H.D. All authors have read and agreed to the published version of the manuscript.

Funding

This research was funded by National Natural Science Foundation of China, grant number 42205177 and the National Key R&D Program of China, grant number 2018YFA0605603.

Data Availability Statement

The daily precipitation dataset is not publicly available due to a complex interplay of regulatory constraints, national security priorities, data governance policies, and international exchange agreements, but is available to researchers with appropriate credentials. If researchers want to use this dataset, they can contact the author. In addition, if necessary, the code used during the research process can also be obtained from the author.

Acknowledgments

The global LULC dataset was provided by the ESA CCI Land Cover project (https://climate.esa.int/en/projects, accessed on 20 April 2023). The daily precipitation dataset was provided by the National Meteorological Information Center (NMIC), China Meteorological Administration (CMA).

Conflicts of Interest

The authors declare no conflicts of interest.

Abbreviations

The following abbreviations are used in this manuscript:
NWCNorthwest China
ESAEuropean Space Agency
CCIClimate Change Initiative
GPCCGlobal Precipitation Climatology Center
CMIP6Coupled Model Intercomparison Project Phase 6
ETCCDIExpert Team on Climate Change Detection and Indices

References

  1. Handmer, J.; Honda, Y.; Kundzewicz, Z.W.; Arnell, N.; Benito, G.; Hatfield, J.; Mohamed, I.F.; Peduzzi, P.; Wu, S.; Sherstyukov, B.; et al. Changes in Impacts of Climate Extremes: Human Systems and Ecosystems. In Managing the Risks of Extreme Events and Disasters to Advance Climate Change Adaptation: Special Report of the Intergovernmental Panel on Climate Change; Field, C.B., Barros, V., Stocker, T.F., Dahe, Q., Eds.; Cambridge University Press: Cambridge, UK, 2012; pp. 231–290. [Google Scholar]
  2. Zhang, X.; Alexander, L.; Hegerl, G.C.; Jones, P.; Tank, A.K.; Peterson, T.C.; Trewin, B.; Zwiers, F.W. Indices for Monitoring Changes in Extremes Based on Daily Temperature and Precipitation Data. Wiley Interdiscip. Rev. Clim. Change 2011, 2, 851–870. [Google Scholar] [CrossRef]
  3. Shi, Y.; Shen, Y.; Hu, R. Preliminary Study on Signal, Impact and Foreground of Climatic Shift from Warm-Dry to Warm-Humid in Northwest China. J. Glaciol. Geocryol. 2002, 24, 219–226. [Google Scholar]
  4. Wang, S.; Wang, Y.; Wang, J.; Mao, W.; Shen, Y. Change of Climate and Hydrology in the Tarim River Basin during Past 40 Years and Their Impact. J. Glaciol. Geocryol. 2003, 25, 315–320. [Google Scholar]
  5. Shi, Y.; Shen, Y.; Kang, E.; Li, D.; Ding, Y.; Zhang, G.; Hu, R. Recent and Future Climate Change in Northwest China. Clim. Change 2007, 80, 379–393. [Google Scholar] [CrossRef]
  6. Deng, H.; Chen, Y.; Shi, X.; Li, W.; Wang, H.; Zhang, S.; Fang, G. Dynamics of Temperature and Precipitation Extremes and Their Spatial Variation in the Arid Region of Northwest China. Atmos. Res. 2014, 138, 346–355. [Google Scholar] [CrossRef]
  7. Zhang, Q.; Yang, J.; Wang, P.; Yu, H.; Yue, P.; Liu, X.; Lin, J.; Duan, X.; Zhu, B.; Yan, X. Progress and Prospect on Climate Warming and Humidification Northwest China. Sci. Bull. 2023, 68, 1814–1828. [Google Scholar] [CrossRef]
  8. Zhang, S.; Hu, Y.; Li, Z.-B. Recent Changes and Future Projection of Precipitation in Northwest China. Clim. Change Res. 2022, 18, 683–694. [Google Scholar]
  9. Chen, F.; Xie, T.; Yang, Y.; Chen, S.; Chen, F.; Huang, W.; Chen, J. Discussion of the “warming and wetting” trend and its future variation in the drylands of Northwest China under global warming. Sci. China Earth Sci. 2023, 66, 1241–1257. [Google Scholar] [CrossRef]
  10. Ding, Y.; Liu, Y.; Xu, Y.; Wu, P.; Xue, T.; Wang, J.; Shi, Y.; Zhang, Y.; Song, Y.; Wang, P. Regional Responses to Global Climate Change: Progress and Prospects for Trend, Causes, and Projection of Climatic Warming-Wetting in Northwest China. Adv. Earth Sci. 2023, 38, 551–562. [Google Scholar]
  11. Yao, J.; Yang, Q.; Liu, Z.; Li, C.Z. Spatio-Temporal Change of Precipitation in Arid Region of the Northwest China. Acta Ecol. Sin. 2015, 35, 5846–5855. [Google Scholar] [CrossRef]
  12. Ren, G.; Ren, Y.; Zhan, Y.; Sun, X.; Liu, Y.; Chen, Y.; Wang, T. Spatial and temporal patterns of precipitation variability over mainland China: II: Recent trends. Adv. Water Sci. 2015, 26, 451–465. [Google Scholar]
  13. Ren, G.; Liu, Y.; Sun, X.; Zhang, L.; Ren, Y.; Xu, Y.; Zhang, H.; Zhan, Y.; Wang, T.; Guo, Y.; et al. Spatial and temporal patterns of precipitation variability over mainland China: III: Causes for recent trends. Adv. Water Sci. 2016, 27, 327–348. [Google Scholar]
  14. Wang, J.; Feng, J.; Yan, Z.; Zha, J. Urbanization Impact on Regional Wind Stilling: A Modeling Study in the Beijing-Tianjin-Hebei Region of China. J. Geophys. Res. Atmos. 2020, 125, e2020JD033132. [Google Scholar] [CrossRef]
  15. Ren, G.; Ren, Y.; Zhang, Y.; Zhang, T.; Zhang, S.; Xue, X.; Ye, D.; Jie, W.; Wu, X.; Cao, H.; et al. Some Thoughts on Observational Settings of Surface Meteorological Stations in Northwest China Arid Areas. Desert Oasis Meteorol. 2023, 17, 169–175. [Google Scholar]
  16. Zhang, A.; Ren, G.; Xue, X.; Suonan, K.; Zhang, P.; Zhang, S. Effect of Urbanization on Surface Air Temperature Trends Over Northern Xinjiang. Desert Oasis Meteorol. 2024, 18, 1–7. [Google Scholar]
  17. Wang, F.; Ge, Q. Estimation of Urbanization Bias in Observed Surface Temperature Change in China from 1980 to 2009 Using Satellite Land-Use Data. Chin. Sci. Bull. 2012, 57, 1708–1715. [Google Scholar] [CrossRef]
  18. Cao, L.; Zhu, Y.; Tang, G.; Yuan, F.; Yan, Z. Climatic Warming in China According to a Homogenized Data Set from 2419 Stations. Int. J. Climatol. 2016, 36, 4384–4392. [Google Scholar] [CrossRef]
  19. Hollmann, R.; Merchant, C.J.; Saunders, R.; Downy, C.; Buchwitz, M.; Cazenave, A.; Chuvieco, E.; Defourny, P.; de Leeuw, G.; Forsberg, R.; et al. The ESA Climate Change Initiative: Satellite Data Records for Essential Climate Variables. Bull. Am. Meteorol. Soc. 2013, 94, 1541–1552. [Google Scholar] [CrossRef]
  20. Bronaugh, D. Climdex.Pcic: PCIC Implementation of Climdex Routines. R Package Version 1.1-11. 2020. Available online: https://cran.r-project.org/src/contrib/Archive/climdex.pcic/ (accessed on 30 July 2021).
  21. Zhang, P.; Ren, G.; Qin, Y.; Zhai, Y.; Sun, X. Urbanization Effects on Estimates of Global Trends in Mean and Extreme Air Temperature. J. Clim. 2021, 34, 1923–1945. [Google Scholar] [CrossRef]
  22. Jones, P.D.; Hulme, M. Calculating Regional Climatic Time Series for Temperature and Precipitation: Methods and Illustrations. Int. J. Climatol. 1996, 16, 361–377. [Google Scholar] [CrossRef]
  23. Ren, G.; Zhou, Y.; Chu, Z.; Zhou, J.; Zhang, A.; Guo, J.; Liu, X. Urbanization Effects on Observed Surface Air Temperature Trends in North China. J. Clim. 2008, 21, 1333–1348. [Google Scholar] [CrossRef]
  24. Sen, P.K. Estimates of the Regression Coefficient Based on Kendall’s Tau. J. Am. Stat. Assoc. 1968, 63, 1379–1389. [Google Scholar] [CrossRef]
  25. Mann, H.B. Nonparametric Tests Against Trend. Econom. Soc. 1945, 13, 245. [Google Scholar] [CrossRef]
  26. Kendall, M.G. Rank Correlation Methods, 2nd ed.; Hafner Publishing Co.: London, UK, 1955. [Google Scholar]
  27. Von Storch, H.; Navarra, A. Misuses of Statistical Analysis in Climate Research. In Analysis of Climate Variability: Applications of Statistical Techniques; Springer: Berlin/Heidelberg, Germany, 1999; pp. 11–26. [Google Scholar]
  28. Zhang, X.; Vincent, L.A.; Hogg, W.D.; Niitsoo, A. Temperature and Precipitation Trends in Canada During the 20th Century. Atmosphere-Ocean 2000, 38, 395–429. [Google Scholar] [CrossRef]
  29. Wang, X.L. Changes of Extreme Wave Heights in Northern Hemisphere Oceans and Related Atmospheric Circulation Regimes. J. Clim. 2001, 14, 2204–2221. [Google Scholar] [CrossRef]
  30. Ren, G.; Yuan, Y.; Liu, Y.; Ren, Y.; Wang, T.; Ren, X. Changes in Precipitation over Northwest China. Arid Zone Res. 2016, 33, 1–19. [Google Scholar]
  31. Rosenfeld, D. Suppression of Rain and Snow by Urban and Industrial Air Pollution. Science 2000, 287, 1793–1796. [Google Scholar] [CrossRef]
  32. Rosenfeld, D.; Lohmann, U.; Raga, G.B.; O’Dowd, C.D.; Kulmala, M.; Fuzzi, S.; Reissell, A.; Andreae, M.O. Flood or Drought: How Do Aerosols Affect Precipitation? Science 2008, 321, 1309–1313. [Google Scholar] [CrossRef]
  33. Stevens, B.; Feingold, G. Untangling Aerosol Effects on Clouds and Precipitation in a Buffered System. Nature 2009, 461, 607–613. [Google Scholar] [CrossRef]
  34. Ramanathan, V.; Crutzen, P.; Kiehl, J.; Rosenfeld, D. Aerosols, Climate, and the Hydrological Cycle. Science 2002, 294, 2119–2124. [Google Scholar] [CrossRef]
  35. Koren, I.; Kaufman, Y.; Rosenfeld, D.; Remer, L.; Rudich, Y. Aerosol Invigoration and Restructuring of Atlantic Convective Clouds. Geophys. Res. Lett. 2005, 32, 1–4. [Google Scholar] [CrossRef]
  36. Jiapaer, K.; Halik, Ü.; Keyimu, M.; Bilal, I.; Shi, L.; Mumin, R. Influence of Meteorological and Ambient Air Quality Factors on Artemisia Pollen Counts in Urumqi, Northwest China. Heliyon 2024, 10, e25124. [Google Scholar] [CrossRef] [PubMed]
  37. Zhang, Y.; Ren, Y.; Ren, G.; Wang, G. Precipitation Trends Over Mainland China From 1961–2016 After Removal of Measurement Biases. J. Geophys. Res. Atmos. 2020, 125, e2019JD031728. [Google Scholar] [CrossRef]
Figure 1. Spatial distribution of rural and urban stations in NWC. The study area encompasses the entirety of Xinjiang, Shanxi, Gansu, Qinghai, and Ningxia, as well as the western part of Inner Mongolia. The LULC in this map is down-sampled to a resolution to 600   m × 600   m by the mode method because of the huge amount of data caused slow calculation speed. The thick black solid line with gray shadow is the national boundary, the thin solid line is the provincial boundary. In this figure, the abbreviations XA, WLMQ, XN, LZ, and YC refer to Xi’an, Urumqi, Xining, Lanzhou, and Yinchuan, respectively, and are marked with green stars on the map. The blue line in the inset denotes the study area boundary. Due to the excessive number of LULC types, the legends in this figure are overcrowded and overlap with one another. Therefore, the LULC types were reclassified into seven major categories. During the reclassification process, the original urban areas, permanent snow, water bodies, and bare areas were preserved, and the remaining LULC were reclassified into three categories: grassland, cropland, and tree cover. For example, the LULC of deciduous broadleaved tree, deciduous needleleaved tree, and mixed leaf type (broadleaved and needleleaved) were reclassified as tree cover.
Land 14 02113 g001
Figure 2. Annual time difference series (a,c) of relative threshold indices between all stations and rural stations in NWC over 1961–2022, along with the corresponding urbanization impact of grid cells (the trends of differences for all stations series minus rural stations series) (b,d). Each grid cell contains at least one rural station and one urban station. Solid dots within the grid cells indicate trends statistically significant at the 5% level. In the above figures, the abbreviations XA, WLMQ, XN, LZ, and YC denote Xi’an, Urumqi, Xining, Lanzhou, and Yinchuan, respectively. Positive and negative values are shown in red and blue bars, respectively, while the fitted trend line is indicated by a black solid line.
Land 14 02113 g002
Figure 3. As in Figure 2, but for absolute threshold indices (CDD, CWD, R10mm, and R20mm).
Land 14 02113 g003
Figure 4. As in Figure 2, but for extreme value indices (Rx1day and Rx5day).
Land 14 02113 g004
Figure 5. As in Figure 2, but for PRCPTOT and SDII.
Land 14 02113 g005
Figure 6. Spatial distribution of meteorological stations in Urumqi city and the LULC patterns surrounding each station. Green triangles denote urban stations, while blue triangles represent rural stations. The LULC in this study utilizes the raw data at its original 300-meter resolution, without applying reclassification or resampling, because of the relatively small spatial extent of the study area and the limited number of LULC types contained within it.
Land 14 02113 g006
Figure 7. Annual average time series (a,c,e,g) and their corresponding difference time series (b,d,f,h) for four precipitation indices (R95pTOT, SDII, CDD, and CWD) in Urumqi city from 1961 to 2021. The fitted trend line is indicated by a blue solid line.
Land 14 02113 g007
Figure 8. Possible mechanisms for why urban areas in the NWC generally receive less precipitation than rural areas.
Land 14 02113 g008
Table 1. Trends and p-value of precipitation changes in NWC from 1961 to 2022, including all stations and rural stations. Urbanization effect ( U E ) of the sampled urban areas of NWC.
IndicesAll StationsRural Stations U E of NWC U c of NWC
1Rx1day0.061 ***0.074 ***−0.015
2Rx5day0.057 ***0.057 **−0.005
3SDII0.083 ***0.093 ***−0.016
4R10mm0.174 **0.283 ***−0.075 **43%
5R20mm0.066 *0.101 **−0.029
6CDD−3.675 ***−4.199 ***0.567
7CWD−0.016−0.0190.009
8R95pTOT0.086 ***0.123 ***−0.038 **44%
9R99pTOT0.067 ***0.092 ***−0.024 *35%
10PRCPTOT0.106 ***0.137 ***−0.035 ***33%
Note: * indicates the trends are significant at the 0.1 level, ** indicates significance at the 0.05 level, and *** indicates significance at the 0.01 level. The trends for all stations, rural stations, and the urbanization effect ( U E ) are expressed in days decade−1 for the indices CWD, CDD, R10mm, and R20mm, and in mm·d−1 decade−1 for SDII. For Rx1day, Rx5day, R95pTOT, R99pTOT, and PRCPTOT, the original millimeter values were converted to percentages; consequently, their trends are given in % decade−1. A dash (—) indicates that U c was not calculated in this study.
Disclaimer/Publisher’s Note: The statements, opinions and data contained in all publications are solely those of the individual author(s) and contributor(s) and not of MDPI and/or the editor(s). MDPI and/or the editor(s) disclaim responsibility for any injury to people or property resulting from any ideas, methods, instructions or products referred to in the content.