Abstract
Soil erosion is a growing environmental issue around the world, including in Malta. This study focused on estimating soil loss in the San Blas and Binġemma valleys on the island of Gozo, the second largest in the Maltese archipelago. To do this, we used the RUSLE model combined with GIS tools, supported by fieldwork and lab testing of soil properties like texture and organic matter to ensure accurate, ground-based data. A key part of the research was also to understand how much the C-factor in RUSLE, which relates to crop cover, affects erosion in the area. We compared present-day erosion patterns with those from 1957 by analyzing old aerial photos and reconstructing land use back then. The findings show that in 1957, soil erosion was more widespread but generally milder, with most areas losing less than 2.0 t ha−1 yr−1. In contrast, in 2021, erosion tends to be more intense but limited to specific areas, especially along the valley floor, where losses reached up to 13.0 t ha−1 yr−1 compared to 5.5 t ha−1 yr−1 in 1957. The results also suggest that fields under cultivation are more prone to erosion compared to areas that have been abandoned. Based on these trends, this study recommends maintaining traditional erosion control methods like terraces and dry stone-walls, and encouraging farmers to adopt practices such as crop rotation, conservation tillage, contour planting, and strip cropping. It also suggests carrying out similar assessments in other valleys to guide valley-specific actions.
1. Introduction
Soil is a limited and delicate resource, essential for food security, sustaining agriculture and keeping ecosystems healthy. The Mediterranean region, which is characterized by climate change, rugged landscapes and long-standing farming traditions, exhibits persistent and widespread soil erosion, seen as a serious threat to its farmland. Erosion processes remain difficult to monitor at the scales where both management and policy decisions are made, especially on small islands like Malta.
Nowhere is this mismatch between problem resolution and policy resolution felt more pronounced than in Gozo, Malta’s sister island, where traditional terrace systems have long held back erosion but are now increasingly abandoned, fragmented, or repurposed [1]. Here, the compounding effects of agronomic intensification, land abandonment, mechanization, and climate variability [2] has slowly changed the hydrology and slope stability of valley systems. While national erosion estimates for Malta remain labelled as “data deficient” in major European inventories (e.g., [3]), official reports suggest that soil loss is accelerating, and doing so unevenly at a country level [4]. The lack of high-resolution, spatially explicit soil-erosion baselines has reduced the island’s scientific capacity to holistically integrate soil protection into environmental regulation, agri-environmental schemes, and spatial planning.
A major contributor to the evaluation of soil conservation is the Universal Soil Loss Equation (USLE [5]). It has been used in many types of climates and soil. Many USLE modifications exist, such as the Modified Universal Soil Loss Equation (MUSLE [6]) and the Revised Universal Soil Loss Equation (RUSLE [7]). Its combination with GIS analysis helps to map out the estimation of soil loss as well as identifying high-risk areas [8].
The application of the RUSLE model to semi-arid Mediterranean islands is scientifically justified on both empirical, methodological and research grounds. For example, studies in Cephalonia and Crete show that RUSLE, when paired with robust parameters, is capable of capturing spatial heterogeneity in erosion processes with impressive granularity [9,10]. This is particularly valuable for Mediterranean islands where land use changes, microclimatic variability, and episodic disturbances can drastically affect erosion patterns over short distances. Despite the importance of monitoring and mapping to manage soil erosion in Malta and Gozo, most high-risk areas are still unmapped at the desired spatial resolution to allow for specific and direct soil conservation interventions. The present study directly addresses this gap by applying the RUSLE at 1 m spatial resolution across San Blas-Binġemma Valley, a 4.1 km2 catchment in north-eastern Gozo. This work builds on and expands a study [11] which implemented for the first time a GIS-RUSLE analysis of the estimated current and future soil loss at the Ramla watershed using 1 m national Light Detection and Ranging (LiDAR) data, ground-truthing, local soil data and climate projections of precipitation. By digitizing past land uses, reconstructing terrace patterns, and validating modern soil properties with laboratory tests, the present study aims at establishing a new and rich spatio-temporal database of erosion risk within another agriculturally-important valley system. After doing so, we then extend and rearticulate our findings to emphasize their thematic significance in both National and Mediterranean soil systems, by linking empirical soil-loss estimates to emergent policy questions about terraced field restoration, sustainable farming, and climate adaptation.
The San Blas-Binġemma Valley represents an ideal case study for this purpose. Agriculturally, it embodies Malta’s mixed reality: intensive vegetable production on accessible midslopes and valley floor; declining citrus, apple and summer fruit tree orchards maintained by aging farmers; and abandoned terraced hillsides now overgrown with Pistacia, Prunus, and emergent maquis. These land-use contrasts map directly onto erosion risk, yet without high-resolution data they remain analytically invisible. This is done under dual-year scenarios; notably, the integration of 1957 aerial photography and 2021 fieldwork into GIS workflows allowed a rare temporal comparison by giving insights into how structural and agronomic changes over six decades shaped erosion trajectories.
Four interrelated research questions form the basis of this study, namely (a) what is the magnitude and spatial distribution of soil loss in San Blas-Binġemma Valley in 1957 and 2021? (b) to what extent are the observed changes driven by shifts in cover-management practices as opposed to changes in rainfall-induced erosivity? (c) how related is catchment-average soil loss to moderate improvements or declines in cover-management practices as defined by the RUSLE? and (d) what are the implications of these patterns for land management and policy in Malta’s field terraced systems?
In exploring these research questions, we place particular emphasis on translating numerical outputs into relevant policy implementation. The aim of this study is to bridge geomorphological analysis with policy relevance and offer a roadmap for sustainable land stewardship in a changing climate and a nationally shifting agricultural economy.
2. Materials and Methods
2.1. Study Area and Landscape Context
The San Blas-Binġemma valley is a 4.1 km2 catchment situated in the north-eastern Gozo, Malta (Figure 1a,b). Situated in a semi-arid archipelago exposed to a Mediterranean climate [2,12], this valley has for a long time featured terraced agriculture and related hydrological intervention. Elevations range from sea level to approximately 138 m, with average slopes exceeding 15%, and local relief defined by short, steep hillsides. The catchment’s geology features a sequence of Upper Coralline Limestone overlying Globigerina Marl, with intervening patches of Blue Clay, resulting in variable soil textures and drainage patterns [13].
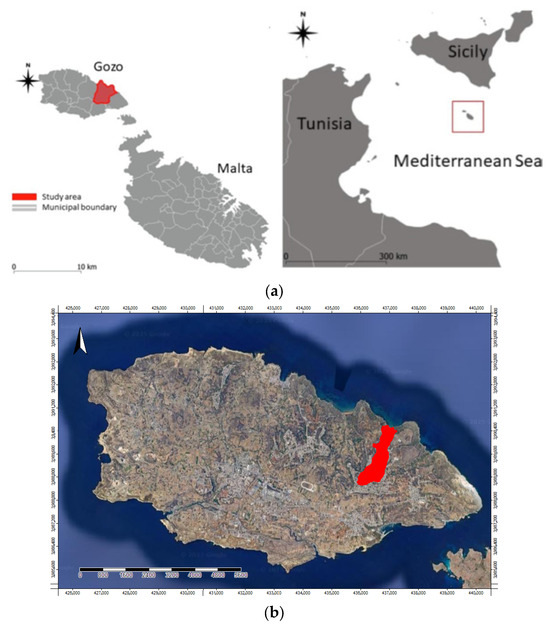
Figure 1.
(a) Map of the location of Malta in the central Mediterranean Sea (Border vector source: thematic mapping.org), (b) San Blas-Binġemma valley (red area) on a map of Gozo, Malta (edited from Google Earth 7.3.6. 10441).
Traditional dry stone-wall terrace systems dominate the topography (Figure 2). These structures historically enabled cultivation of citrus, vines, and vegetables, but their maintenance has diminished through the years. The upper and marginal slopes have experienced progressive abandonment and encroachment by urban building and spontaneous maquis vegetation, while midslopes remain under cultivation, often with mechanized access and reduced conservation practices. This spatial heterogeneity makes the valley an ideal case for assessing soil loss trajectories under changing land-use intensities.
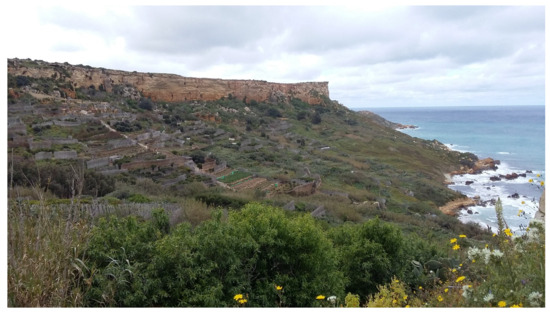
Figure 2.
Traditional dry-stone wall terracing dominates the topography of the San Blas-Binġemma valley. This spatial heterogeneity is reflected in the upper and marginal slopes, showing progressive abandonment with increasingly maquis vegetation, while some of the midslopes remain under seasonal cultivation.
2.2. Research Design and Temporal Framework
This study adopts a dual-year erosion modelling approach, comparing 1957 and 2021 to assess how changes in land-cover and management influence soil loss. The year 1957 was selected due to the availability of orthorectified Royal Air Force (RAF) aerial photographs with sufficient resolution to reconstruct terrace layouts and land cover. At the time of this study, the 2021 reference reflected the most recent full year for which ground truthing, LiDAR topography and meteorological inputs were available.
The methodological framework draws directly from [11], which introduced the first high-resolution, spatially explicit RUSLE-based erosion model for an important valley system in Gozo. The workflow involved generating all RUSLE factor layers (R, K, LS, C, P) at 1 m spatial resolution, supported by legacy datasets, field-derived data, and geospatial modelling.
2.3. LiDAR-Based Terrain Modeling
Topographic inputs were generated from a 1 m Digital Elevation Model (DEM; [14]); created using airborne LiDAR data collected in 2012. The highly dense point cloud (average point density ~4.3 points/m2) that has been used in the collection of this National dataset ensures accurate ground-surface representation. The DEM was derived from the tiled LiDAR raster dataset using SAGA-GIS (v.7.8.2) which entailed a structured sequence of geospatial data processing steps, designed to transform discrete elevation measurements into a continuous surface representation of the terrain. The elevation points must be interpolated to generate a continuous raster surface. In the case of our high-density datasets (e.g., 4.3 points/m2), a grid resolution of 1 m was used to preserve terrain detail without introducing excessive noise. Geomorphological and terrain derivatives such as slope, slope-length, watershed, stream channels, topographical wetness index, surface terrain classification, and flow accumulation were subsequently computed in SAGA-GIS.
2.4. Land-Use Classification: 1957 and 2021
Land use for 1957 was reconstructed by vectorizing georeferenced RAF aerial photographs. Agricultural land parcels were manually classified based on photointerpretation using features like tone, texture, pattern, shape, size, shadow siting and association [15], and local field work. Eight categories were identified: citrus orchards, open vegetable fields, fallow land, abandoned terraces, built-up areas, roads, semi-natural scrub, and bare soil.
For 2021, land cover was primarily classified through fieldwork. For any inaccessible areas, Google Earth imagery was utilized for interpretation, following which ground validation was performed with 60 field-truthed polygons. This allowed accurate identification of cropped parcels, bare soil, intercropping, and rewilded plots.
2.5. Soil Type Classification
The soil type classification used for this study reflects the system that was historically employed in the Maltese islands, specifically from 1957 until approximately 2003, and remains the basis for the most comprehensive soil map currently available for Malta. While the World Reference Base for Soil Resources (WRBS) system offers a more globally harmonized framework, the use of Lang’s 1960 [16] soil map classification of Malta provides greater detail and relevance for the Maltese context. This is because the WRBS-based map available to us is comparatively limited in resolution and usability. Therefore, for the purposes of this study, the chosen system provides the most accurate and practical foundation.
Nevertheless, to maintain scientific rigor and compatibility with international standards, WRBS equivalents for the soil series used in this study are provided hereby: the soil series referenced include the Nadur series, San Lawrenz series, and the Iklin Complex; these correspond to WRBS categories such as Regosols, modified Leptosols, and potentially Vertosols, depending on specific site characteristics.
The sampling strategy implemented in this study differed from the initial plan due to field access constraints. Access to sampling sites was limited to locations where landowner permission could be secured. Despite these limitations, samples were collected from a total of 14 sites, while ensuring soil type diversity (Figure 3). At each site, multiple samples were taken from five subpoints to a depth of 20 cm. This is the range where most detachment and transport occur due to rainfall impact and runoff. Moreover, the valley soil is not deep and as rotavation and cultivation mix the soil, there is no soil profile development with depth.
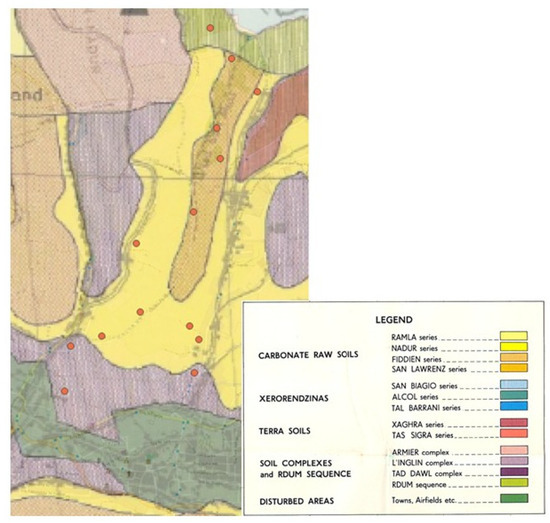
Figure 3.
Map of San Blas valley with the approximate soil sampling sites (in orange) overlaid over Lang’s [16] soil map.
In total, 70 samples were pooled and analyzed in the laboratory so as to ensure accuracy for the purposes of this study.
Soil Sample Analysis
For the study area, soil texture was assessed using the hydrometer method [17]. For each sample, 20 g of soil was mixed with 20 mL of a 1.625 M sodium hexametaphosphate solution (4% hexametaphosphate and 1% sodium carbonate) and topped up to 400 mL with distilled water. Since Malta’s soils are calcareous, carbonates were not removed from the fractions, as acid treatment would have altered the sand fraction, which is primarily carbonate-based. Each sample was duplicated and shaken for 16 h at 110 rpm, alongside a blank solution. The mixtures were then passed through a 63 μm sieve to separate the sand (which was oven-dried and weighed), while silt and clay entered sedimentation cylinders. The cylinders were placed in a 30 °C water bath. After temperature stabilization, the suspensions were mixed and hydrometer readings were taken after 50 s, 5 min, 2 h, and overnight. These readings were used to determine the proportions of clay, silt, and sand. Each soil sample texture was classified twice for accuracy and the results obtained were fitted into a soil texture triangulation pyramid to determine their textural classification.
Soil organic matter was measured according to the Walkley-Black [18] wet oxidation method, without supplemental heating. In brief, approximately 1 g of air-dried soil was treated with 10 mL of 0.167 M potassium dichromate and 20 mL of concentrated sulphuric acid, then left for 10 min in an Erlenmeyer flask to oxidize the organic material. Next, 200 mL of distilled water, 10 mL of concentrated phosphoric acid, and a few drops of barium diphenylamine-4-sulphonate redox indicator were added, and the solution was titrated with 0.922 M ferrous sulphate. For accuracy, 0.5 mL of dichromate were added to restore the blue color, and the solution was titrated again to obtain a more accurate end point.
To determine soil dry matter content, approximately 20 g of soil was oven-dried for 24 h at 105 °C. Soil dry matter content was used to calibrate the organic matter content on a dry soil basis.
Figure 4 shows the soil texture of our soil samples (red points). The total of 28 data points rests on the fact that each soil sample was duplicated during laboratory analysis, and triplicated in the case of organic matter assessments to ensure reliability and reproducibility.
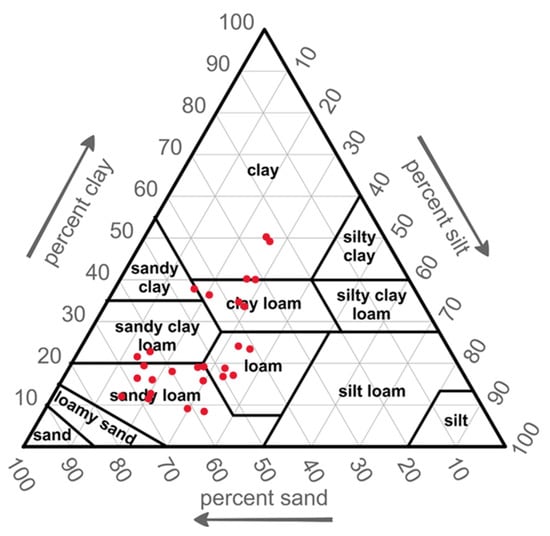
Figure 4.
Soil texture triangular pyramid displaying soil sample classification for the study samples (red points).
2.6. Derivation of the RUSLE Factors
The methodological core of this work rests on a refined implementation of RUSLE, a semi-empirical model widely used across Europe but rarely executed at meter-scale or under dual-year scenarios. The RUSLE equation, expressed as:
estimates the average annual soil loss (A, in t ha−1 yr−1) as the product of five factors: rainfall–runoff erosivity (R), soil erodibility (K), slope length and steepness (LS), cover–management (C), and support practices (P). In this study, each factor was derived using advanced spatial techniques: LiDAR-derived topography for LS and terrace delineation; legacy soil mapping [16] cross-referenced with 14 sites for K; historical orthophoto classification for C; and field-surveyed terrace integrity for P. The application of the RUSLE using its five factors was done using GIS tools. The software used included SAGA GIS v.7.8.2 [19] and ArcGIS v.10.8 [20]. All spatial data used a map projection of WGS 1984-UTM Zone 33N coordinate system.
A = R × K × LS × C × P
Various supporting datasets were needed to compute each RUSLE factor and were sourced from multiple references (see Table 1).

Table 1.
Data used and source.
2.6.1. Rainfall-Runoff Erosivity (R-Factor)
The R-factor for both years was derived from rainfall erosivity indices using the approaches taken by [11] using the [21,22] method and modified Fournier index (F):
where,
- N = number of months,
- pi = monthly rainfall, mm,
- p = mean annual rainfall, mm.
The precipitation datasets used in this study included monthly average values for two distinct periods: 1955–1959 and 2010–2020. From these, annual averages were calculated, followed by the computation of the Fournier index. Although various equations exist to estimate the R-factor from the Fournier index, their applicability to a specific region is not always guaranteed [23]. To address this uncertainty, four different relationships involving R, precipitation (P), and the Fournier index (F) were applied to derive an average R-factor for the region of interest (ROI) [11], as shown in Table 2 and Table 3. Each year’s R-factor layer was converted into a single polygon, and the corresponding average R-factor value was added to the attribute table of that layer.

Table 2.
Equations used to determine the average R-factor.

Table 3.
F-index, total precipitation and the average R-factor.
2.6.2. Soil Sampling and Erodibility (K-Factor)
The K-factor in the RUSLE model represents how easily soil can be eroded, and it is mainly influenced by the soil’s texture and organic matter content, apart from permeability and other minor factors. To determine this, 14 soil samples from the valley were analyzed and compared with Lang’s 1960 soil classification map of the Maltese Islands. Although Lang’s map is based on the Kubiëna classification system [27] and does not explicitly record soil texture, it provides valuable categorical information that complements field observations.
The consistency between Lang’s classification and our findings was evaluated. Soils mapped by Lang as belonging to the Nadur series in the Nadur-Xagħra region were described as sandy loams. This description aligns closely with the sandy loam and sandy clay loam cluster identified in our soil texture triangle, suggesting consistency between historical classification and current field data. Similarly, the clay and clay loam cluster observed in our analysis corresponds well with the San Lawrenz soil type and the Iklin Complex as mapped by Lang, further supporting the relevance of his categorization.
Finally, the stability of soil texture was considered. Since the relative proportion of sand, silt, and clay in a soil remains largely unchanged over time unless subject to significant disturbances or catastrophic changes, Lang’s map was regarded as a reliable proxy for present-day conditions. This approach allowed for the integration of historical soil mapping with current field data in the absence of more detailed or accurate alternatives.
Using ArcGIS, a polygon layer based on Lang’s map was created to represent the valley’s soil texture. A separate vector point layer was also created to show the organic matter percentages in the attribute table.
Based on the soil texture and whether the organic matter content was above or below 2%, the K-factor was determined using Table 4. These values were then added to the attribute table of the polygon layer, providing a spatial representation of soil erodibility across the valley.

Table 4.
Values used for the K-factor that were based on the texture and percentage organic content of the main soil types collected from the study area. These local K-factor values were derived from the SOILPRO Project LIFE08ENV/IT/000428 database [28].
2.6.3. Slope-Length Factor (LS-Factor)
The LS-factor in the RUSLE model represents both the length and steepness of slopes. To calculate it, the high-resolution (1 m) LiDAR-derived DEM was used to extract LS values using SAGA-GIS. We visually validated the derived DEM using known terrace configurations, in line with Mediterranean terrace modelling practice. To reduce noise created by high features like dry stone-walls and trees, the results were considered as meaningful of the surface terrain when they exceeded an LS-factor value of 3. This value was determined based on the LS values assigned to dry stone-wall features as calculated from the DEM.
2.6.4. Cover-Management Factor (C-Factor)
C-factors represent one of the most dynamic and sensitive inputs in erosion modelling. For 1957, values were assigned based on land-use class and known cropping practices, adjusted through grayscale interpretation of aerial imagery. The C-factor for 2021 was primarily based on fieldwork data. The collected data was then vectorized on ArcGIS as polygon features, and crop type classifications were inputted into the attribute table. Each class was assigned a C-factor value based on the crop type as adapted from scholarly literature related to regional RUSLE studies [11,29,30,31], where each crop type is assigned a specific value based on its classification, as outlined in Table 5.

Table 5.
Crop type and C-factor value (Adapted from [11,29,30,31]).
Each field was also assessed to determine whether it was tilled or not, and this information was added to the attribute table (see Table 6). Tillage status was inferred based on land use: fields actively used for crop production were considered tilled, while those that appeared abandoned were assumed to be non-tilled.

Table 6.
Presence of tillage and C-factor (Adapted from [11]).
All fields in the area of interest were digitized in ArcGIS as polygon features on a new layer, and crop type classifications for the years 2021 and 1957 were added to each feature’s attribute table.
2.6.5. Support Practices Factor (P-Factor)
The P-factor in the RUSLE model reflects how land is managed to reduce erosion. For this study a recommended peer-reviewed, published value for the P-factor [32] was assigned for our area, considering the presence of terracing, and dry stone-walls, all of which contribute to erosion control.
2.6.6. Model Implementation and Statistical Analysis
The RUSLE equation was applied in SAGA-GIS using raster algebra with consistent 1 m resolution across all input layers. Factor surfaces were aligned, resampled, and multiplied to produce total annual soil loss estimates for each year. Outputs included cell-wise erosion maps, spatial difference maps, and land-use class summaries. To assess temporal changes in erosion potential between the two study epochs, we applied Pearson correlation analysis to the RUSLE outputs. Pearson correlation is particularly appropriate in this context, as it offers a simple, transparent, yet rigorous diagnostic of change that preserves the comparability of results within the established RUSLE framework.
3. Results
3.1. Geomorphology of the San Blas-Binġemma Watershed
Understanding the geomorphometry of valley systems is essential for interpreting their evolution, hydrological functioning, and landscape stability. This study used a suite of advanced processing workflows to derive raster and vector data layer geomorphometric products, which included: slope, valley depth, topographic wetness index (TWI), channel analysis, and terrain classification. These were chosen for their analytical power and ability to capture core structural and functional features of the terrain, thus providing a comprehensive analysis of the valley system ranging from steep gradients that influence erosion and runoff, to incision depth reflecting landscape dissection and geological imprint. The inclusion of TWI for example, allows for insights into moisture accumulation and hydrological connectivity, while slope contextualizes the position of terrain elements within the vertical profile of the valley. Lastly, terrain surface classification synthesizes complex morphometric inputs into meaningful terrain categories, allowing for a clearer interpretation of the form and function of the San Blas-Binġemma Valley.
3.1.1. Valley Depth
The valley depth (Figure 5) is a measure from valley floors to adjacent ridges and is instrumental to quantify incision, erosional potential and the evolution of valley development. Results show that the valley is a shallow to moderately deep valley (>50 m). The shallow part of the valley (<30 m) indicates incipient valet or low-relief floodplains. For ease of reference, the valley is divided into three parts (pA, pB, and pC). The steep gradient found along the sides of the deepest part of the valley within pA suggests strong erosion potential, where such depth is often attributed to incised or fault-determined channels.
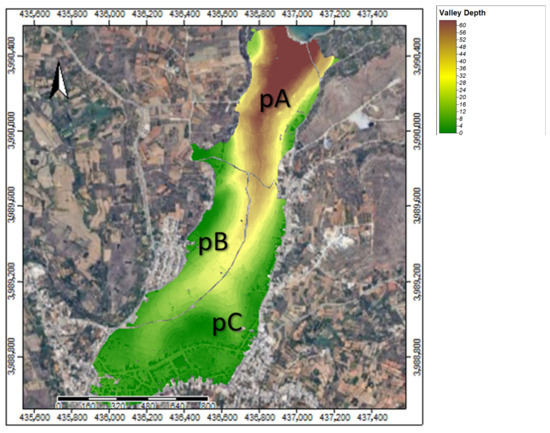
Figure 5.
Depth (m) of the San Blas-Binġemma Valley.
3.1.2. Terrain Surface Classification
The study area is mainly characterized by both ridges and channels almost to the same extent, followed by relatively minute percentages of planar, saddle, and peak terrain in descending order. The systematic classification of the terrain surface (Figure 6) shows simplifies the complex structure of the valley into three major discrete units, namely: very steep slope, fine texture, high convexity (13%), followed by very steep slope, coarse texture, low convexity (10.8%) and very steep slope, coarse texture, high convexity (10.7%).
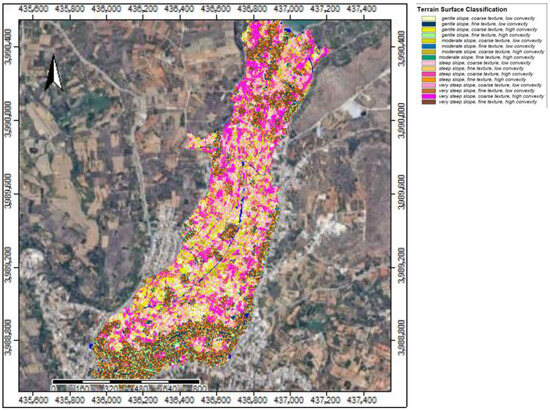
Figure 6.
Terrain surface classification of the San Blas-Binġemma Valley.
3.1.3. Stream Network
The structure of the valley’s stream network (Figure 7) reveals a classic, branching drainage system composed of 5 stream orders, ranging from the smallest headwater channels (order 1) to the main trunk streams (order 5). The first-order streams are the most numerous, with 770 segments contributing a combined length of approximately 26.8 km. This pattern, where smaller-order channels dominate in number and total length, points towards a natural fluvial system. The second-order streams are longest on average, before length begins to decrease at higher orders. This trend could be shaped by changes in slope, valley confinement, or human alteration of the landscape. Notably, the rapid drop in both stream numbers and total length at the highest orders may point to either natural convergence into a few dominant channels or limited downstream development, potentially affecting how water and sediment are transported through the system.
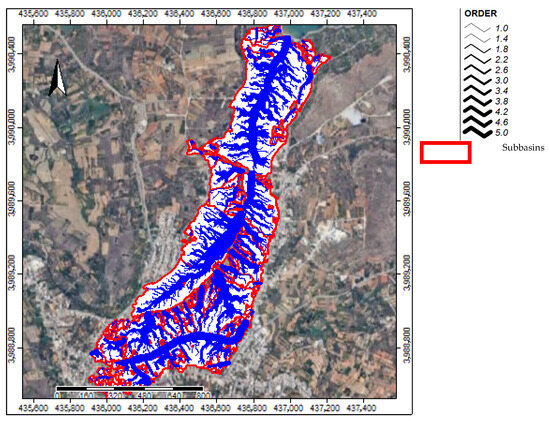
Figure 7.
Stream channel order of the San Blas-Binġemma Valley.
The bifurcation ratio, which measures how many streams of one order join to form those of the next, falls within expected natural ranges (≈2.7), suggesting a relatively undisturbed and mature network. However, the sudden jump in bifurcation ratio from order 4 to order 5 (a value exceeding 58) could indicate possible different scenarios, namely that only a few large channels dominate the valley’s lower reaches or that the DEM captures only a partial extent of the full network, perhaps truncated by valley boundaries, vegetation canopy, or other landscape artifacts.
Overall, the stream network of this valley paints a picture of a highly dissected upper basin with good coverage of first- and second-order channels, efficiently collecting runoff. Yet, the abrupt reduction in high-order streams suggests that longitudinal flow paths may be constrained, either by natural controls or human interventions. This network structure has important implications for flood risk and channel stability, particularly in the valley’s lower sections where flow becomes concentrated into fewer, more dominant paths.
3.1.4. Slope Information
The slope information (Figure 8) as the first-order derivative of elevation, quantifies the gradient of the terrain, which directly affects the erosion potential, sediment transport and hydrological flow velocity. The low to gentle slope class of values (equivalent to 0–10%) is evident in the mid-inner parts of the valley. The overall asymmetry across the valley from the outer to the mid portion of the valley, i.e., from pA to pB and pC is indicative of both geologic, but especially differential, erosion, given that at some point in its history, this valley was being intensively farmed as can be attested by remnants of field boundary walls.
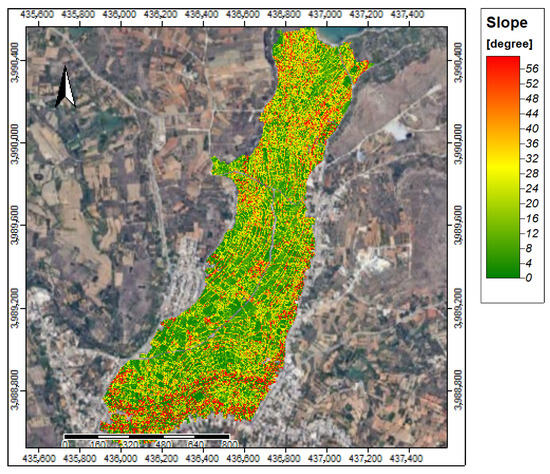
Figure 8.
Slope (in degrees) of the San Blas-Binġemma Valley.
3.1.5. Topographic Wetness Index
The low TWI values on the steep slopes (Figure 9) of pA suggest fast-draining, erosion-prone areas especially along the upper and midslopes. This is also the case along the eastern escarpment of pC, with possibly higher erosion rates than the western escarpment of pB to the opposite side. From a terrain surface classification, pB contains more of the moderate to gentle slope, with coarse to fine texture and low convexity. Higher convexity is attributed to the eastern escarpment of pC, again supporting the other morphometric characteristics of high slope and low TWI as compared to its western side of pB.
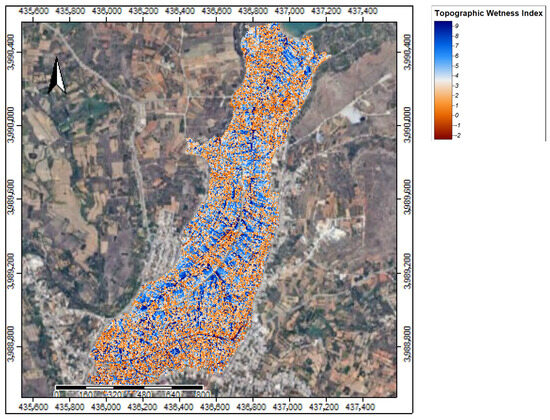
Figure 9.
Topographic Wetness Index (TWI) of the San Blas-Binġemma Valley.
3.2. Variations in Land Use Management and Extent of Field Abandonment
Figure 10 displays the vectorized C-factor for 1957, revealing distinct past patterns, across the San Blas-Binġemma valley, of crop cover (and related tillage methods). In contrast, Figure 11 presents the more recent, vectorized C-factor for 2021, illustrating differences in crop cover. Each field is color-coded according to its specific crop type, which, alongside the tillage method, contributes to the C-factor value. This map provides a detailed spatial representation of vegetation cover and agricultural practices influencing soil erosion in the contemporary period. A comparison between the 1957 and 2021 C-factor maps immediately brings out significant changes in land use over time. These variations in C-factor values (R2 = 0.007; Standard error = 0.22) directly reflect shifts in agricultural practices and land abandonment, which are critical in understanding the differing soil erosion patterns observed between the two periods.
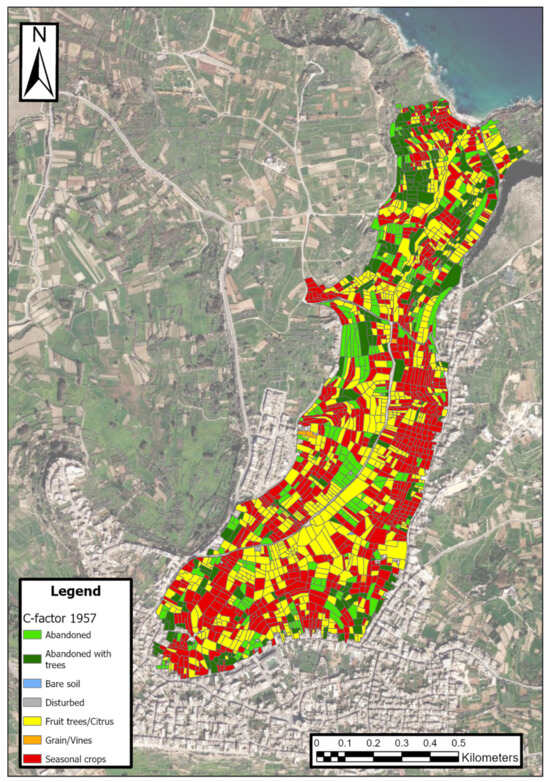
Figure 10.
C-factor for 1957 (Source of basemap: ESRI).
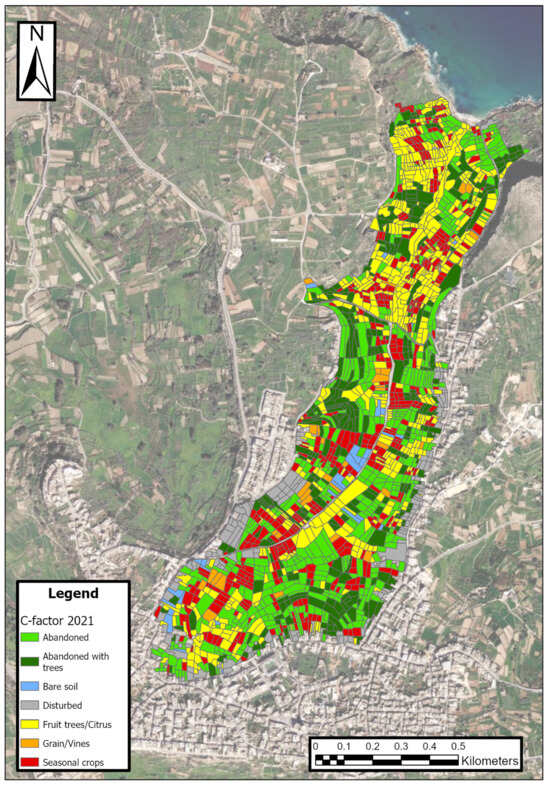
Figure 11.
C-factor for 2021 (Source of basemap: ESRI).
3.3. Spatial Distribution and Intensity of Soil Loss in 1957
The erosion patterns estimated by the RUSLE model for 1957 reveal a landscape already subject to meaningful soil loss despite the widespread presence of well-maintained terracing and intense agriculture management. As shown in Figure 12, the maximum annual soil loss recorded for this baseline year was approximately 5.5 t ha−1 yr−1, concentrated mainly in the central corridor of the catchment and along mid-slope cultivated plots on the western edge.
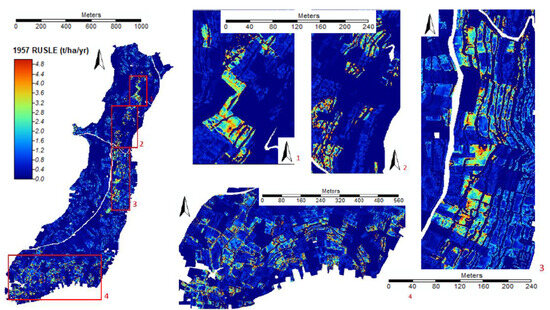
Figure 12.
1957 RUSLE map showing areas with high erosion.
Although values above 3.0 t ha−1 yr−1 were spatially limited, their geographic clustering corresponded strongly with steeply sloped vegetable fields located adjacent to terraced stream valleys. In these zones, the combination of longer slope lengths (LS-factor), moderate C-factor values for actively farmed land (~0.3–0.55), and relatively high rainfall erosivity resulted in localized acceleration of erosion processes. By contrast, large segments of the upper slopes exhibited erosion rates below 1.0 t ha−1 yr−1, particularly in areas with semi-natural cover, suggesting effective retention by both slope morphology and vegetative ground cover.
In terms of spatial extent, the 1957 erosion map displayed a broad distribution of low-to-moderate erosion across the entire catchment, with no single erosion “hotspot” dominating the landscape. This pattern is consistent with the prevailing land management regime at the time, where terraces were largely intact, and mechanization was absent. Even in cultivated fields, routine tillage and intercropping appeared to moderate erosion rates, as inferred from the aerial textures and documented field conditions by the present study.
3.4. Soil Loss Characteristics in 2021
By 2021, the spatial and numerical character of erosion in the valley had shifted significantly. The estimated maximum soil loss increased to 13.0 t ha−1 yr−1, more than doubling the highest value observed in 1957 (Figure 13). The 2021 results show that the upper limit of soil loss was reached in intensively tilled, tractor-accessible parcels in the western mid-slope areas of the catchment. While the average catchment-wide erosion rate remained below 5.0 t ha−1 yr−1, the localized concentration of severe erosion intensified markedly compared to the mid-20th-century baseline. It is interesting to note that Panagos et al.’s [3] Malta average was estimated to be 6.02 t ha−1 yr−1, while the EU average of 2.46 t ha−1 yr−1.
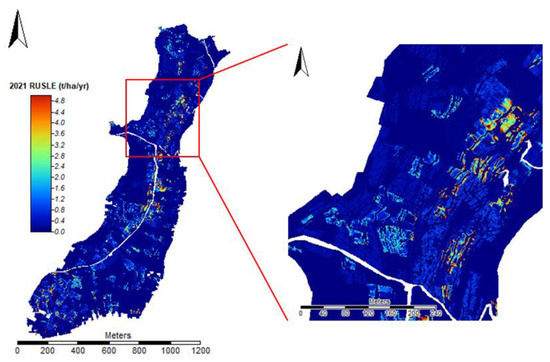
Figure 13.
2021 RUSLE map showing an area of high erosion.
Spatially, the 2021 erosion map exhibits greater clustering of high-risk zones, especially around areas of reclaimed or intensified cultivation. Highest erosion values are in the middle of the valley and on the landward western side where the values are mostly between 3 to 6 t ha−1 yr−1. Parcels with seasonal vegetable production and exposed topsoil, particularly those left bare post-harvest, produced erosion rates approaching or exceeding 10.0 t ha−1 yr−1. The LS-factor in these areas was often elevated, compounding the impact of increasing C-factors that ranged from 0.45 to 0.65, depending on the seasonal residue cover.
This rise in soil loss is also partly attributable to increased rainfall erosivity: the R-factor for 2021 was calculated at 234.6 MJ mm ha−1 h−1 yr−1, up from 197.6 MJ mm ha−1 h−1 yr−1 in 1957. While this estimated 18.7% increase is not negligible, the spatial analyses show that erosivity increase alone does not explain the magnitude or localization of erosion intensification. Areas experiencing the most significant changes in estimated soil loss were almost exclusively those where land-use change and terrace degradation had occurred.
One of the most notable features of the 2021 results is the erosion mitigation observed in the upper catchment. These areas, once under marginal cultivation or grazing, had largely transitioned to dense maquis cover. Their C-factors fell below 0.1, leading to predicted soil losses of less than 0.5 t ha−1 yr−1. This passive abandonment effect suggests that under the right conditions, it can deliver substantial erosion mitigation, although it must be pointed out that this may introduce other risks such as fire fuel build-up or biodiversity homogenization.
3.5. Temporal Comparison and Spatial Change Patterns
The dual-year RUSLE model enabled a direct spatial comparison of erosion dynamics between 1957 and 2021 (Figure 14). A difference map of soil loss (Figure 15) clearly illustrates zones of significant change (R2 = 0.09; Standard error = 0.81). Three dominant trends emerge:
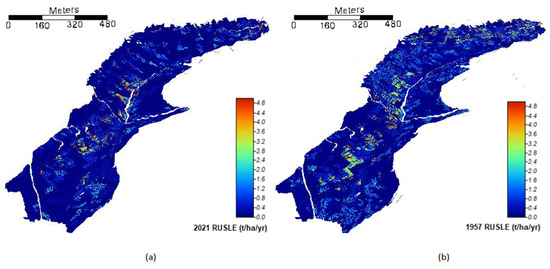
Figure 14.
3D RUSLE maps facing landwards. (a) 2021; (b) 1957.
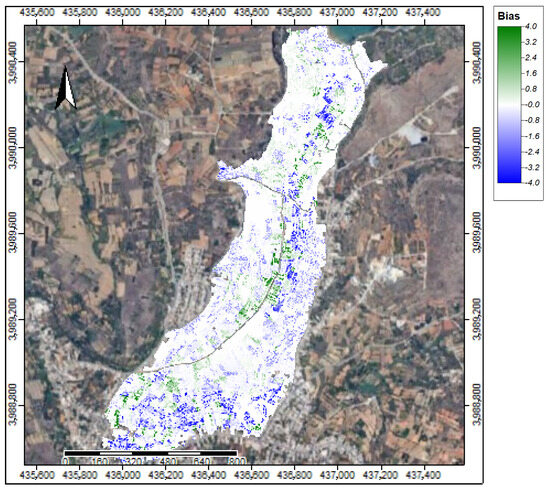
Figure 15.
Erosional difference (t ha−1 yr−1) between 2021 and 1957.
- Increase in erosion in tilled fields: Mid-slope areas once occupied by citrus or intercropped vegetables in 1957 had, by 2021, shifted to more intensive monocultures with reduced ground cover (see Figure 10 and Figure 11). These plots recorded an increase in estimated soil erosion of up to 8.0 t ha−1 yr−1. The driving factor in these zones was a rise in the C-factor, often from ~0.35 to >0.55. Areas where C-values rose due to reduced cover, bare soil exposure, or fallow fields were almost universally those where erosion increased. This effect was particularly pronounced in vegetable plots subjected to tillage without sufficient post-harvest residue management. Conversely, zones where C-factor declined, either due to abandonment or more permanent vegetation, showed the largest reductions in soil loss.
- Reduction in erosion due to field abandonment: Several formerly cultivated areas along the north-east and ridge-top boundaries transitioned to shrub-dominated maquis with dense canopy closure. Here, predicted erosion decreased by 1.0 to 3.0 t ha−1 yr−1 over the 64-year period.
- Erosion stability in low-slope areas: Valley-floor field parcels with shallow gradients and perennial crops retained low erosion rates across both times. These areas had minimal change in slope length or land cover, and their soil retention capacity remained high.
3.6. Landscape Drivers of Erosion Change
These spatial shifts reinforce the dominant role of land management for the San Blas-Binġemma valley, particularly cover and tillage practices, in shaping erosion risk. Despite moderate increases in erosivity, most of the catchment would have maintained low erosion rates had the cover–management profile remained similar to 1957.
It is interesting to note that analysis by land-use class confirms these spatial observations. In 1957, citrus plots exhibited moderate erosion (mean ~2.5 t ha−1 yr−1) due to continuous cover and intact walls. By contrast, open vegetable fields showed higher mean losses (~4.2 t ha−1 yr−1), especially on convex slopes.
During the 2021 ground truthing, bare or lightly mulched fields surpassed 6.0 t ha−1 yr−1, with maxima near 13.0 t ha−1 yr−1, while farmland rewilded areas with natural vegetation fell below 1.0 t ha−1 yr−1. This divergence demonstrates that soil erosion trajectories are not only spatially heterogeneous but also increasingly stratified by land-use intensity and accessibility.
Moreover, the topographic and soil-type overlays suggest further distinctions in that valley parts consisting of loam and clay loam under cultivation produced the highest soil loss values, especially where strong slope length and gradient co-occurred. On the other hand, sandy zones, though inherently less erodible, still exhibited significant loss where vegetation was sparse or terraces had been breached.
Spatial overlays also indicate that erosion “hotspots” migrated over time, with 2021 clusters forming primarily where mechanized access was possible and traditional maintenance was discontinued.
4. Discussion
4.1. Interpreting Erosion Dynamics in a Semi-Arid Mediterranean Agroecosystem
The results of this study highlight a shifting erosion regime in the San Blas-Binġemma valley system over six decades of both land use and climate transformation [2,11]. While the catchment did not exhibit high overall erosion by European standards, the spatial reconfiguration of soil loss, i.e., from diffuse and moderate in 1957 to more localized yet severe in 2021, reveals concerning trends about the underlying socio-ecological processes at play.
According to the present results, this transformation is largely attributable to the transformation of land management practices. In the earlier period, a mosaic of low-intensity mechanized cultivation and well-maintained terraces helped maintain soil stability across large swaths of the valley. While not vulnerable, these systems functioned as effective buffers against concentrated runoff and slope failure. By 2021 the landscape had clearly diverged into two contrasting states: on one side, tracts undergoing farmland abandonment that now resist erosion, and on the other, exposed, heavily mechanized fields that face markedly higher erosion risk. This split is not peculiar to the island of Gozo; it mirrors a broader Mediterranean pattern in which abandoned marginal lands exist alongside ever-intensifying productive areas [33,34].
With regards to the organic matter dynamics between the two periods, it is important to note the investigations conducted by [34] who observed no statistically significant deviation from the baseline data presented in Lang’s 1960 soil map over a 16-year interval, and also corroborated with [35]. This temporal stability in organic matter content suggests that the soil systems under study may have remained relatively undisturbed or were governed by resilient pedogenic processes. Such consistency across decades and independent studies implies that the organic matter profile of these soils may be inherently stable, possibly due to consistent land use practices, climatic conditions, or intrinsic soil properties [36]. These findings reinforce the reliability of Lang’s 1960 historical soil data for long-term ecological assessments and highlights the value of legacy datasets in contemporary soil science in Malta.
Among all modelled parameters, the cover-management factor (C) emerges and, to a lesser extent the rainfall erosivity factor (R), is the primary determinant of spatial and temporal changes in soil loss within our study area. This conclusion is supported by both qualitative and quantitative comparisons between the two RUSLE timeframes. The observed changes in the C-factor alone could explain much of the difference in erosion severity between 1957 and 2021. The spatial distribution of erosion in both years corresponded closely with zones of exposed soil, sparse vegetation, or poorly managed plots. Seasonal vegetables, often left bare post-harvest and tilled without conservation, registered the highest erosion rates. This link between tillage-based management and soil loss echoes broader findings in the Mediterranean basin (e.g., [29,31]), and validates the semi-empirical C-factor approach employed in this study.
Conversely, abandoned fields that transitioned to spontaneous maquis vegetation with closer canopy cover seem to exhibit a significant reduction in soil loss over time. This assumption is based on observed patterns suggesting that spontaneous vegetative regrowth contributes to improved ground cover and stabilization, thereby mitigating soil loss in the absence of active land management. Despite some variation in shrub composition and slope gradient, these areas benefited from low C-factors (<0.1) and increasingly stable topsoils. This farmland abandonment effect provides some evidence for the restorative potential of abandonment under certain bioclimatic and soil conditions.
4.2. Soil Loss and the Role of Landscape Infrastructure
While the C-factor dictated erosion hotspots, structural elements such as terraces and field boundary dry stone-walls continued to exert a meaningful, if underestimated, control over hydrological redistribution. The observed terraces remain partially functional in most cultivated areas, but on-site degradation is particularly visible, especially on abandoned or inaccessible slopes.
The P-factor was held constant in this study at 0.5, based on an average functional state of terraces across the catchment. However, it is evident from field observations that this simplification masks a degree of local variation. Boundary walls in disrepair, collapsed risers, and eroded outlets are common in higher valley zones, likely contributing to localized sediment mobilization despite seemingly low erosion estimates. The study’s photo documentation supports this, suggesting that infrastructure conditions may serve as a latent variable influencing C-factor expression and sediment routing.
Our observations highlight the need for future mapping of terrace condition and typology in fine detail. As studies in similar landscapes have shown (e.g., [37]), even partial terrace rehabilitation can dramatically alter runoff dynamics, provided slope angle and land use are appropriately matched.
4.3. Connection Between Soil Erosion and Farmland Abandonment
The effects of agricultural abandonment on soil erosion vary widely depending on local conditions, making the relationship complex and highly context dependent. In the San Blas-Binġemma valley, we estimate that erosion generally declines in abandoned areas, owing to natural vegetation colonization and reduced tillage. This contradicts a common perception that abandonment necessarily increases erosion due to terrace neglect and vegetation gaps.
In this case, abandonment often resulted in spontaneous revegetation with grasses, shrubs, and opportunistic fruit trees, stabilizing the surface and increasing infiltration. Some abandoned parcels were also seen bordered by prickly pears or low dry-stone walls that continued to act as sediment barriers. This study also confirms that the modelled erosion decrease in such areas was not merely due to lower slope or less erosive soils, but rather suggesting that land abandonment, when occurring in zones with favorable slope and aspect, may serve as an unintentional soil conservation measure.
However, this finding must be applied with caution. On steeper slopes, especially those without stable terrace remnants, abandonment could lead to wall collapse, vegetation gaps, and increased rill formation over time. The positive effect observed here reflects both the physiographic context and the intermediate successional state of vegetation in the valley. Hence the need for finer, on-site mapping and evaluations.
4.4. Comparison with Other Watersheds
This study’s findings are also notable when compared with similar work in neighboring valleys [11]; for example, we report maximum erosion rates of up to 20 t ha−1 yr−1 in the neighboring Ramla Valley (also located in Gozo), which is higher than the 13 t ha−1 yr−1 maximum observed in San Blas-Binġemma. This difference was attributed to more active farming of the area, coupled with intensive tillage, less abandonment, and higher silt content, this leading to a higher erosivity estimation shown by the San Blas-Binġemma Valley. This comparison situates our study area within a broader typology of Malta’s semi-arid catchments: relatively well-preserved, semi-abandoned, and topographically buffered. It underscores (1) the need to assign tailored conservation interventions which are suitable for different physiographic contexts, and (2) the role of local land-use transformations in shaping erosion outcomes, and challenges the general assumption that climate alone dictates erosion risk [38].
4.5. Implications for Soil Protection Policy in Malta
The findings of this study carry substantial implications for tailored soil conservation policy in Malta. They primarily reinforce the importance of land-cover continuity as a protective mechanism against soil loss. This study shows that those fields that retained perennial cover, whether through agriculture or abandonment, had significantly lower erosion rates. Conversely, seasonal crop plots without post-harvest cover and intensive tillage conditions were most vulnerable.
From a policy point of view, this study paves the way to a number of practical, science-based actions that could help tackle soil erosion more effectively across Mediterranean farming landscapes. It could definitely help reduce Malta’s estimated 0.116MEur losses estimated for 2010 by [39], which could be used instead to support soil conservation reforms. For example, by promoting cover cropping and intercropping in tilled vegetable fields, the C-factor values can be reduced substantially. With the right mix of support that could range from well-targeted financial support to hands-on technical advice, farmers could see benefits quickly, both in the protection of their land and improving its long-term productivity.
Another important finding is the value of traditional features like terraces and dry-stone walls. These are more than just reminders of the island’s agricultural tradition, since they serve both hydrological and cultural presentation functions. Government-supported scheme initiatives towards their conservation need to be upheld as they continue to be particularly effective in this regard [40].
At the same time, abandoned land parcels should not uniformly be targeted for reclamation. In areas where they contribute to erosion mitigation through natural vegetation cover, a case could be made for recognizing their ecosystem service value. Stewardship schemes that reward passive abandonment may offer a novel policy angle.
In addition, this study exposes a knowledge gap by noting the limited understanding among some landowners regarding erosion-prone crop types and soil-specific management needs. Farmer-targeted guidance, backed by high resolution erosion maps and tailored recommendations, could have a high uptake, especially if linked to compliance or incentives.
Finally, we strongly feel that catchment-wide erosion monitoring must be institutionalized. This study relied on a unique combination of field data, high resolution topographic information derived by LiDAR, and historical orthophotography. Such multi-temporal, spatially explicit erosion modelling should be expanded and made operational across other Gozitan and Maltese valleys, creating a national soil risk inventory that is regularly updated.
4.6. Limitations and Paths for Future Research
While this study provides a robust account of soil erosion trends, several limitations constrain its generalizability. While fixing the P-factor at a constant value such as 0.5 inevitably simplifies the spatial variability of conservation practices, it represents the most defensible and widely adopted approach when detailed field-level data are unavailable. In such contexts, the use of a handbook-based constant as well as peer-reviewed, published recommendations specifically for the Maltese islands, ensures methodological transparency and avoids introducing greater uncertainty through unsupported assumptions. The C-factor values for 1957 were derived from visual interpretation of black-and-white orthophotos, introducing potential bias. Similarly, R-factor estimates relied on a single weather station per epoch, limiting spatial granularity. Soil sampling, while well-distributed, was constrained to 14 sampling points due to technical limitations. These and other limitations suggest several priorities for future work, including (1) integration of in situ erosion measurements, such as sediment traps or runoff plots, to allow for model validation and calibration, enhancing estimative accuracy, and (2) socioeconomic modelling of land abandonment and farmer decision-making could shed light on barriers to tailored conservation uptake and inform incentive design.
Another limitation is that this study lacked the resources to enable the incorporation of auxiliary approaches to explore the relative influence of different spatial covariates on modeled erosion patterns, such as classification and regression trees (CART) or ensemble derivatives like random forests. Such approaches typically require additional datasets, particularly observed erosion inventories or independent empirical measurements, which are not available.
5. Conclusions
The San Blas-Binġemma catchment serves as a living laboratory for understanding soil erosion in the context of both local and Mediterranean agriculture land-use transitions. The comparative structure of this study, i.e., modelling two distinct temporal scenarios (1957 and 2021), enabled an effective diagnostic of the relation between land-cover dynamics, soil erodibility and required management changes. This study contributes to the knowledge base necessary for Malta’s compliance with EU soil protection principles, including those embedded in the Common Agricultural Policy (CAP) and prospective European Soil Health Law.
This study applied the Revised Universal Soil Loss Equation (RUSLE) within a geospatial framework to assess long-term soil erosion dynamics in the San Blas-Binġemma Valley, Gozo, comparing conditions in 1957 with those in 2021. Using high-resolution LiDAR-derived topography, remotely sensed land-use data, field-based soil measurements, and historical aerial photography, the research offers a spatially explicit, temporally comparative analysis of erosion trends separated by over six decades. The findings affirm the sensitivity of Mediterranean terraced agro-ecosystems to changes in land management and vegetation cover.
Overall, the results show that while the majority of the catchment continues to experience low to very low erosion rates, the severity of soil loss has increased in specific locations. Maximum soil loss rose from 5.5 t ha−1 yr−1 in 1957 to 13 t ha−1 yr−1 in 2021, even though much of the valley remains under minimal erosion pressure. Spatially, erosion has been estimated to be more widespread in 1957, likely due to intensive land cultivation and fewer abandoned parcels. In contrast, erosion in 2021 was more spatially concentrated, but more severe in those zones where soil disturbance and exposure had intensified due to mechanization and bare-soil tillage practices.
This study attributes this shift primarily to changes in the cover–management factor (C-factor). Land under seasonal crops in 2021, often left bare after harvest and lacking conservation practices, recorded the highest erosion rates. Conversely, abandoned plots that transformed into shrubland and maquis showed significant reductions in the estimated erosion. These observations confirm that land management practices, particularly vegetation retention and minimal tillage, play a decisive role in erosion control. This study does not frame land abandonment as either good or bad, but rather as context dependent. Where passive abandonment stabilizes soil and enhances ecological value, it should be recognized and, perhaps, promoted. Where tillage erodes fragile topsoil, conservation intervention then becomes warranted.
Crucially, this study also reinforces the role of terrace infrastructure and traditional soil conservation elements, such as dry stone-walls and prickly pear hedgerows, in stabilizing slopes and disrupting flow concentration. Though the P-factor was held constant due to the lack of a terrace condition inventory, field observations suggest that wall degradation and reduced maintenance likely amplify erosion in some areas.
The implications for land management are clear. While parts of the valley benefit from passive conservation through abandonment and revegetation, other zones, particularly the mid-slope parcels under active cultivation, face growing erosion risks. This bifurcated trajectory points to the need for context-sensitive conservation measures that promote vegetative cover, limit bare-soil exposure, and maintain or restore structural soil-retaining features.
From a policy perspective, these results support calls for (a) incentivizing conservation tillage and cover cropping, (b) continued funding for terrace and dry stone-wall maintenance, (c) developing spatially tailored erosion risk maps, and (d) recognizing abandonment of land as providing erosion-regulating ecosystem services. The evidence presented here underscores the urgency of proactive soil conservation planning, not only to preserve agronomic productivity, but also to safeguard ecosystem stability and landscape heritage in a fragile Mediterranean island context.
Finally, the research highlights the value of integrating temporal land-use comparison into erosion modelling. By bridging past and present, this study reveals not only how much soil is lost, but how the processes and pressures that drive erosion evolve over time. It serves as a foundation for further work in other Maltese valleys, encouraging national-scale assessments that incorporate terrain complexity, socio-economic change, and climate variability.
Author Contributions
Conceptualization, C.G.; methodology, C.G., A.S. and S.M.; software, C.G. and S.M.; formal analysis, S.M. and C.G.; investigation, S.M. and C.G.; data curation, S.M. and C.G.; writing—original draft preparation, C.G.; writing—review and editing, C.G., S.M. and A.S.; supervision, C.G. All authors have read and agreed to the published version of the manuscript.
Funding
This research received no external funding.
Data Availability Statement
The datasets presented in this article are not readily available because restrictions apply to the datasets.
Acknowledgments
This study acknowledges the use of ERDF 156 data (2013) made available by the Malta Planning Authority, as well as extensive meteorological data made available by the Meteorological Office MIA plc.
Conflicts of Interest
The authors declare no conflicts of interest.
Abbreviations
The following abbreviations are used in this manuscript:
| RUSLE | Revised Universal Soil Loss Equation |
| LiDAR | Light Detection and Ranging |
References
- Muscat, D. Land Abandoment in Gozo: Case Study: Nadur. Unpublished Dissertation, University of Malta, Msida, Malta, 2005. [Google Scholar]
- Galdies, C. The State of the Climate 2022—A Multidecadal Report and Assessment of Malta’s Climate; National Statistics Office: Valletta, Malta, 2022; xvii + 38 p.
- Panagos, P.; Borrelli, P.; Poesen, J.; Ballabio, C.; Lugato, E.; Meusburger, K.; Montanarella, L.; Alewell, C. The new assessment of soil loss by water erosion in Europe. Environ. Sci. Policy 2015, 54, 438–447. [Google Scholar] [CrossRef]
- ERA. Chapter 4: Land and Coast. Reporting Status from 2009 to 2015. In State of the Environment Report; ERA: Parma, Italy, 2018; 68p, Available online: https://era.org.mt/wp-content/uploads/2019/05/Chapter4_LandCoast_26Nov2018.pdf (accessed on 30 September 2025).
- Wischmeier, W.; Smith, D. Predicting Rainfall Erosion Losses—A Guide to Conservation Planning; Agriculture Handbook No. 537; United States Department of Agriculture (USDA): Washington, DC, USA, 1978.
- Williams, J. Sediment-yield prediction with universal soil loss equation using runoff energy factor. Present and Pro-spective Technology for Predicting Sediment Yields and Sources. In Proceedings of the Sediment Yield Workshop; U.S. Department of Agriculture, Agricultural Research Service: Washington, DC, USA, 1975; pp. 244–252. [Google Scholar]
- Renard, K.; Foster, G.; Weesies, G.; McCool, D.; Yoder, D. Predicting Soil Erosion by Water: A Guide to Conservation Planning with the Revised Universal Soil Loss Equation (RUSLE); USDA Agricultural Handbook No. 703; US Government Printing Office: Washington, DC, USA, 1997.
- Grimm, M.; Jones, M.; Montanarella, L. Soil Erosion Risk in Europe; EUR 19939 EN; European Soil Bureau Institute for Environment and Sustainability Joint Research Centre: Ispra, Italy, 2002. [Google Scholar]
- Stefanidis, S.; Alexandridis, V.; Ghosal, K. Assessment of water-induced soil erosion as a threat to Natura 2000 protected areas in Crete Island, Greece. Sustainability 2022, 14, 2738. [Google Scholar] [CrossRef]
- Xanthakis, M.; Minetos, P.; Lisitsa, G.; Kamari, G. Numerical modelling of soil erosion on Cephalonia Island, Greece using geographical information systems and the Revised Universal Soil Loss Equation (RUSLE). In Proceedings of the EWaS International Conference on Insights on the Water-Energy-Food Nexus, Lefkada Island, Greece, 27–30 June 2018; Volume 2, p. 618. [Google Scholar] [CrossRef]
- Galdies, C.; Azzopardi, D.; Sacco, A. Estimates of soil erosion rates in a principal watershed in Gozo, Malta under current and future climatic conditions. Catena 2022, 210, 105900. [Google Scholar] [CrossRef]
- Galdies, C. Malta’s Climate Anomaly Trends and Possible Related Socio-Economic Impacts; National Statistics Office: Valletta, Malta, 2011; 45p.
- Pedley, H.M.; House, M.R.; Waugh, B. The geology of Malta and Gozo. Proc. Geol. Assoc. 1976, 87, 325–341. [Google Scholar] [CrossRef]
- ERDF 156 Data, Developing National Environmental Monitoring Infrastructure and Capacity; Malta Environment and Planning Authority: Floriana, Malta, 2013.
- Galdies, C.; Betts, J.; Vassallo, A.; Micallef, A. High resolution agriculture land cover using aerial digital photography and GIS—A case study for small island states. In Future Preparedness: Thematic and Spatial Issues for the Environment and Sustainability; Formosa, S., Ed.; Department of Criminology, Faculty for Social Wellbeing, University of Malta: Floriana, Malta; Malta Environment & Planning Authority: Floriana, Malta, 2014; pp. 127–145. [Google Scholar]
- Lang, D.M. Soils of Malta and Gozo; His/Her Majesty’s Stationary Office (HMSO): London, UK, 1960.
- Van Reeuwijk, L. Procedures for Soil Analysis, 5th ed.; ISRIC: Wageningen, The Netherlands; FAO: Rome, Italy, 1995. [Google Scholar]
- Walkley, A.; Black, I. Estimation of soil organic carbon by the chromic acid titration method. Soil Sci. 1934, 37, 29–38. [Google Scholar] [CrossRef]
- Conrad, O.; Bechtel, B.; Bock, M.; Dietrich, H.; Fischer, E.; Gerlitz, L.; Wehberg, J.; Wichmann, V.; Böhner, J. System for Automated Geoscientific Analyses (SAGA) v. 2.1.4. Geosci. Model Dev. 2015, 8, 1991–2007. [Google Scholar] [CrossRef]
- ESRI. ArcGIS Desktop, Version Release 10.8; Environmental Systems Research Institute: Redlands, CA, USA, 2019. [Google Scholar]
- Arnoldus, H.M.J. An Approximation of the Rainfall Factor in the Universal Soil Loss Equation; Assessment of Erosion, De Boodt, M., Gabriels, D., Eds.; Wiley: Chichester, UK, 1980; pp. 127–132. [Google Scholar]
- Renard, K.; Freimund, J. Using monthly precipitation data to estimate the R-factor in the revised USLE. J. Hydrol. 1994, 157, 287–306. [Google Scholar] [CrossRef]
- Suhara, K.K.S.; Varughese, A.; Sunny, A.C.; Krishna, P.R.A. Erosivity Factor of the Revised Universal Soil Loss Equation (RUSLE)—A Systematized Review. Curr. World Environ. J. 2023, 18, 433–445. [Google Scholar] [CrossRef]
- Kassam, A.H.; Velthuizen, H.T.; Mitchell, A.J.B.; Fischer, G.W.; Shah, M.M. A Case Study of Kenya Resources Data Base and Land productivity. In AgroEcological Land Resources Assessment for Agricultural Development Planning; Technical Annex 2. Soil Erosion and Productivity; FAO: Rome, Italy, 1992. [Google Scholar]
- Roose, E. Erosion Et Ruissellement En Afrique De L’ouest—Vingt Annees De Mesures En Petites Parcelles Experimentales; Travaux et Documents de l’ORSTOM No. 78; ORSTOM: Paris, France, 1977. [Google Scholar]
- Singh, G.; Babu, R.; Chandra, S. Soil Loss Prediction Research in India Technical Bulletin T-12/D-9; Central Soil and Water Conservation Research and Training Institute: Dehradun, India, 1981. [Google Scholar]
- Kubiëna, W.L. The Soils of Europe; Thomas Murby and Co.: London, UK, 1953. [Google Scholar]
- MEPA. Development of Environmental Monitoring Strategy and Environmental Monitoring Baseline Surveys; Soil Lot 1; MEPA: Floriana, Malta, 2013; 112p.
- Panagos, P.; Borrelli, P.; Meusburger, K.; Alewell, C.; Lugato, E.; Montanarella, L. Estimating the soil erosion cover-management factor at the European scale. Land Use Policy 2015, 48, 38–50. [Google Scholar] [CrossRef]
- Schürz, C.; Mehdi, B.; Kiesel, J.; Schulz, K.; Herrnegger, M. Supplement of A systematic assessment of uncertainties in large-scale soil loss estimation from different representations of USLE input factors—A case study for Kenya and Uganda. Hydrol. Earth Syst. Sci. 2020, 24, 4463–4489. [Google Scholar] [CrossRef]
- Benavidez, R.; Jackson, B.; Maxwell, D.; Norton, K. A review of the (Revised) Universal Soil Loss Equation ((R)USLE): With a view to increasing its global applicability and improving soil loss estimates. Hydrol. Earth Syst. Sci. 2018, 22, 6059–6086. [Google Scholar] [CrossRef]
- Panagos, P.; Borrelli, P.; Meusburger, K.; van der Zanden, E.H.; Poesen, J.; Alewell, C. Modelling the effect of support practices (P-factor) on the reduction of soil erosion by water at European scale. Environ. Sci. Policy 2015, 51, 23–34. [Google Scholar] [CrossRef]
- Hatna, E.; Bakker, M.M. Abandonment and Expansion of Arable Land in Europe. Ecosystems 2011, 14, 720–731. [Google Scholar] [CrossRef]
- Koulouri, M.; Giourga, C. Land abandonment and slope gradient as key factors of soil erosion in Mediterranean terraced lands. Catena 2007, 69, 274–281. [Google Scholar] [CrossRef]
- Sacco, A.; Agius, M.; Didier, C. Variations in Soil Organic Matter Content in Cultivated and Uncultivated Calcareous Soils from the Mediterranean Island of Malta after 15 Years of Cultivation. Open J. Soil Sci. 2024, 14, 210–226. [Google Scholar] [CrossRef]
- Sivarajasingham, S. The Soils of Malta. In UNOP/SF Project MAT/5, Water Disposal and Water Supply; Food and Agriculture Organization of the United Nations: Rome, Italy, 1971. [Google Scholar]
- Bazzoffi, P.; Gardin, L. Effectiveness of the GAEC standard of cross compliance retain terraces on soil erosion control. Ital. J. Agron. 2011, 6, 43–51. [Google Scholar] [CrossRef]
- Guerra, C.A.; Rosa, I.M.D.; Valentini, E.; Wolf, F.; Filipponi, F.; Karger, D.N.; Nguyen Xuan, A.; Mathieu, J.; Lavelle, P.; Eisenhauer, N. Global vulnerability of soil ecosystems to erosion. Landsc. Ecol. 2020, 35, 823–842. [Google Scholar] [CrossRef] [PubMed]
- Panagos, P.; Standardi, G.; Borrelli, P.; Lugato, E.; Montanarella, L.; Bosello, F. Cost of agricultural productivity loss due to soil erosion in the European Union: From direct cost evaluation approaches to the use of macroeconomic models. Land Degrad. Dev. 2018, 29, 471–484. [Google Scholar] [CrossRef]
- Rubble Walls and Rural Structures (Conservation and Maintenance) Regulations S.L.552.01. 1998. Available online: https://legislation.mt/eli/sl/552.1/eng/pdf (accessed on 9 August 2025).
Disclaimer/Publisher’s Note: The statements, opinions and data contained in all publications are solely those of the individual author(s) and contributor(s) and not of MDPI and/or the editor(s). MDPI and/or the editor(s) disclaim responsibility for any injury to people or property resulting from any ideas, methods, instructions or products referred to in the content. |
© 2025 by the authors. Licensee MDPI, Basel, Switzerland. This article is an open access article distributed under the terms and conditions of the Creative Commons Attribution (CC BY) license (https://creativecommons.org/licenses/by/4.0/).