Article

Divergent Urban Canopy Heat Island Responses to Heatwave Type over the Tibetan Plateau: A Case Study of Xining

1
State Key Laboratory of Plateau Ecology and Agriculture, Qinghai University, Xining 810016, China
2
Key Laboratory of Water Ecology Remediation and Protection at Headwater Regions of Big Rivers, Ministry of Water Resources, Xining 810016, China
3
School of Geological Engineering, Qinghai University, Xining 810016, China
4
Laboratory for Climate Studies, National Climate Center, China Meteorological Administration, Beijing 100081, China
*
Author to whom correspondence should be addressed.
These authors contributed equally to this work.
Land 2025, 14(10), 2033; https://doi.org/10.3390/land14102033 (registering DOI)
Submission received: 14 August 2025 / Revised: 22 September 2025 / Accepted: 30 September 2025 / Published: 12 October 2025

Abstract

The escalating heatwave risks over the Tibetan Plateau (TP) highlight unresolved gaps in understanding multitype mechanisms and diurnal urban canopy heat island (UCHI) responses. Using Xining’s high-density observational network (2018–2023) and by employing comparative analysis (urban–rural, heatwave versus non-heatwave days) and composite analysis, we found: During the record-breaking July 2022 heatwave across the TP, Xining reached an extreme UCHI peak (z-score: 3.0). Critically asymmetric UCHI responses as daytime heatwaves amplify mean intensity by 0.35 °C via extreme value shifts, whereas nighttime events suppress it by 0.31 °C. Crucially, heatwaves induce negligible daytime UCHI modulation but drive comparable magnitude nighttime UCHI intensification (during daytime events) and reduction (during nighttime events), demonstrating type-dependent and diurnally asymmetric urban thermal sensitivities. Heatwaves driven by distinct synoptic patterns; daytime events are controlled by an anomaly anticyclone (cloudless, dry conditions), while nighttime events occur under plateau-north anticyclones (cloudy, humid conditions). These patterns fundamentally reshape heatwave–UCHI interactions through divergent mechanisms: Daytime/nighttime heatwaves amplify/suppress nocturnal UCHI through enhanced/reduced urban heat storage and accelerated/inhibited rural radiative cooling. Our case study demonstrates that although heatwaves generally amplify nocturnal UCHI, in dry regions, their synoptic drivers significantly modify this nighttime synergy. The nocturnal UCHI during heatwave is not only driven by humidity effects but also modulated by cloud cover-regulated rural radiative cooling and urban thermal storage. These findings establish a mechanistic framework for heatwaves–UCHI interactions and provide actionable insights for heat-resilient planning in high-altitude arid cities.

1. Introduction

Heatwaves are defined as extended periods of abnormally high temperatures persisting through consecutive days and nights, triggering extensive socio-economic impacts [1,2,3]. Understanding the physical drivers of these extreme events is critical for enhancing forecasting systems and developing effective mitigation strategies.
Persistence anomalous atmospheric circulation directly drives heatwaves by maintaining abnormally high temperatures. Specifically, anticyclonic systems dominate heatwaves genesis through associated thermodynamic and dynamic processes [4]. Research indicates that Rossby wave trains play a significant role in influencing heatwave events across different regions of the globe [5,6,7]. Land–atmosphere feedback is also recognized as another important factor in the initiation and maintenance of heatwaves [8,9,10,11]. Over the Tibetan Plateau (TP), heatwave intensity has increased markedly since 2000, particularly during warm seasons [12]. This intensification is spatially governed by downward shortwave radiation. Shortwave radiation controls heatwave magnitude heterogeneity, whereas temperature trends dominate spatial heterogeneity in intensification rates. Altitude and land cover also play a role. Zhang et al. [7] revealed that springtime heatwaves over the southeastern TP are triggered by a circumglobally teleconnection pattern: Rossby wave trains split over Eurasia, converge near the plateau’s southeastern edge, and generate anomalous anticyclones that induce subsidence, clear skies, reduced rainfall, and resultant extreme temperatures. Land–atmosphere interactions amplify such events, as demonstrated during the 2022 Qiangtang Plateau heatwave where high soil moisture–temperature coupling and strengthened latent heat flux–soil moisture correlations are observed [13]. Heatwaves occurring over lake and glacier surfaces have also been focused, similarly exhibiting increased frequency, intensity, and duration [14].
Notably, unlike the drier conditions typically associated with daytime heatwaves, nighttime events are usually accompanied by increased cloud cover, higher humidity, and a low-level warm advection [15,16,17,18]. Furthermore, recent research has focused on the physical mechanisms underlying day–night compound heatwaves [15,19,20]. Anomalous anticyclonic circulation and its associated subsidence induce adiabatic warming, while additional moisture transport suppresses radiative cooling at night. This combination of mechanisms facilitates the persistence of abnormally high temperatures from daytime to nighttime.
Concurrently, urbanization has emerged as a key anthropogenic modulator of regional thermal environments. As a significant driver of local and regional climate warming [21,22], it amplifies heatwave intensity and spatial heterogeneity [23]. Although some studies report synergistic intensification between heatwaves and the urban heat island [24,25,26,27,28], which further intensifies urban heat risks, others argue that the synergistic interaction is not clearly evident [29,30,31,32]. This synergistic effect is critically modulated by climatic background, with established amplification in humid regions [29,33,34,35]. For instance, climate modeling of 50 U.S. cities reveals significant sensitivity of urban heat intensity–heatwave interactions to local climate, with temperate cities showing significant synergistic effects [35]. In humid regions, abundant moisture in rural areas boosts heatwave evaporation, while impermeable urban surfaces constrain it. This evaporation contrast serves as the primary driver for intensifying the synergy effect. Furthermore, moisture feedback processes (radiative warming and convective suppression) and temperature inversion effects also play roles: abundant moisture intensifies its radiative effect as a greenhouse gas; urban areas in humid zones exhibit reduced aerodynamic roughness, hindering vertical heat dispersion; high-rise building clusters facilitate inversion layer formation, trapping warm air. Dense warm air in humid environments further reinforces this inversion effect. In contrast, the nature of heatwave-urban heat islands interactions in arid and semi-arid regions remains uncertain. The established mechanistic framework for humid regions becomes inapplicable in moisture-limited environments. Consequently, the processes governing synergy (or lack thereof) in dry regions are likely fundamentally different.
Furthermore, as mentioned above, heatwaves during the day and at night are driven by fundamentally different weather conditions, especially dry sunshine and humid, cloudy environments. Based on this dichotomy, we propose the hypothesis: whether the interaction between urban heat islands and heatwaves varies depending on the type of heat wave event. In addition, while new evidence confirms increasing occurrences of single-type heatwaves over the TP [20,36], existing large-scale analyses remain constrained by coarse resolutions that obscure fine-scale heterogeneity. Critically, prior studies predominantly examine singular heatwave categories, leaving mechanistic processes governing distinct heatwave types inadequately explored.
Xining City, as the most populous city on the TP (Figure 1a) plays a significant role in promoting economic development and improving people’s livelihood in this region. Under the impetus of the Western Development Initiative, Xining City has experienced a rapid process of economic and social development since 2000. The permanent urban resident population has increased from 1.12 million to 2 million in 2023, and the built-up area has grown from 54 km2 to 108 km2 [37,38]. Thus, Xining is selected as case study city with exceptional observational records from a dense meteorological network of 90 stations spanning six years (2018–2023) in Xining City. This study classifies heatwaves into types to quantify hourly urban canopy heat island (UCHI, based on near-surface air temperature) responses across categories, thereby resolving diurnal synergy dynamics.

2. Data and Methods

2.1. Data

This study utilizes multi-source data to ensure a comprehensive analysis of heatwaves and their interaction with the UCHI effect. The daily maximum (Tmax) and minimum (Tmin) temperatures are derived from the National Oceanic and Atmospheric Administration (NOAA) Climate Prediction Center (CPC) Global Unified Temperature datasets. To investigate the synoptic-scale atmospheric conditions associated with heatwaves, the ERA5 reanalysis dataset from the European Centre for Medium-Range Weather Forecasts (ECMWF, 0.25° × 0.25°) covering summer periods from 1990 to 2023 is utilized, extracting key atmospheric variables, including multi-level geopotential heights (500 hPa), and 700 hPa specific humidity with zonal/meridional wind components, along with total cloud cover. The selected observation times at 04:00 and 15:00 UTC, corresponding to local standard time (Beijing Time) 12:00 (midday) and 23:00 (nighttime), respectively, were chosen to capture critical diurnal extremes in both atmospheric dynamics and surface energy fluxes, enabling comprehensive analysis of diurnal heatwave–UCHI interactions.
Station-based observational 2 m surface air temperature (SAT) data during the period of 2018–2023 is employed, encompassing Xining and its surrounding areas (36.2–36.5° N, 101.2–102.2° E) (Figure 1b). The quality of the station data was controlled by removing obvious outliers and ensuring temporal continuity. Urban expansion around Xining is quantified using the Global Artificial Impervious Areas dataset for 2018 [39]. The elevation data with a spatial resolution of 90 m and land use/land cover of 1 km are from the Resources and Environmental Science Data Platform (https://www.resdc.cn), accessed on 30 September 2025. In addition, while the analysis of regional heatwave patterns over the TP spans the period 1990–2024 based on reanalysis data, the quantification of heatwave–UCHI synergy is limited to the 2018–2023 period due to the availability of high-density station observations.

2.2. Method

Independent daytime/nighttime heatwaves are defined as the Tmax/Tmin meets or exceeds its threshold lasting three or more consecutive days during summer, but the Tmin/Tmax remains below its threshold lasting three or more consecutive days. Compound heatwaves are defined as events lasting three or more consecutive summer days where both the Tmax and Tmin meet or exceed their threshold. The critical thresholds, Tmax90p and Tmin90p, are calculated for each calendar day as the 90th percentile of daily Tmax and Tmin, respectively, based on a 15-day moving window centered on that day, using data from the reference period 1981–2010. Additionally, the sensitivity results indicate that our findings are robust when using different sliding window lengths (15-day and 29-day) for calculating heatwave thresholds.
Regional-scale heatwave events over the TP are identified using spatially aggregated daily maximum SAT and minimum SAT, using composite analysis to investigate the formation mechanisms of these heatwaves and their synergistic interactions with UCHI. Urban Canopy Heat Island Intensity (UCHII) is quantified as the SAT difference between urban and rural stations. Rural station selection implements dual constraints: elevation control maintains all sites within ±50 m of the urban stations’ mean elevation to eliminate orographic thermal bias. This criterion reflects a practical balance between scientific rigor and the availability of suitable rural stations in the topographically complex area surrounding Xining. The spatial uniformity mandates balanced distribution across four cardinal directions surrounding the urban periphery. This procedure ensures that observed UCHI primarily reflects local anthropogenic heating. Specifically, 29 urban and 6 rural stations are systematically selected (Figure 1b).
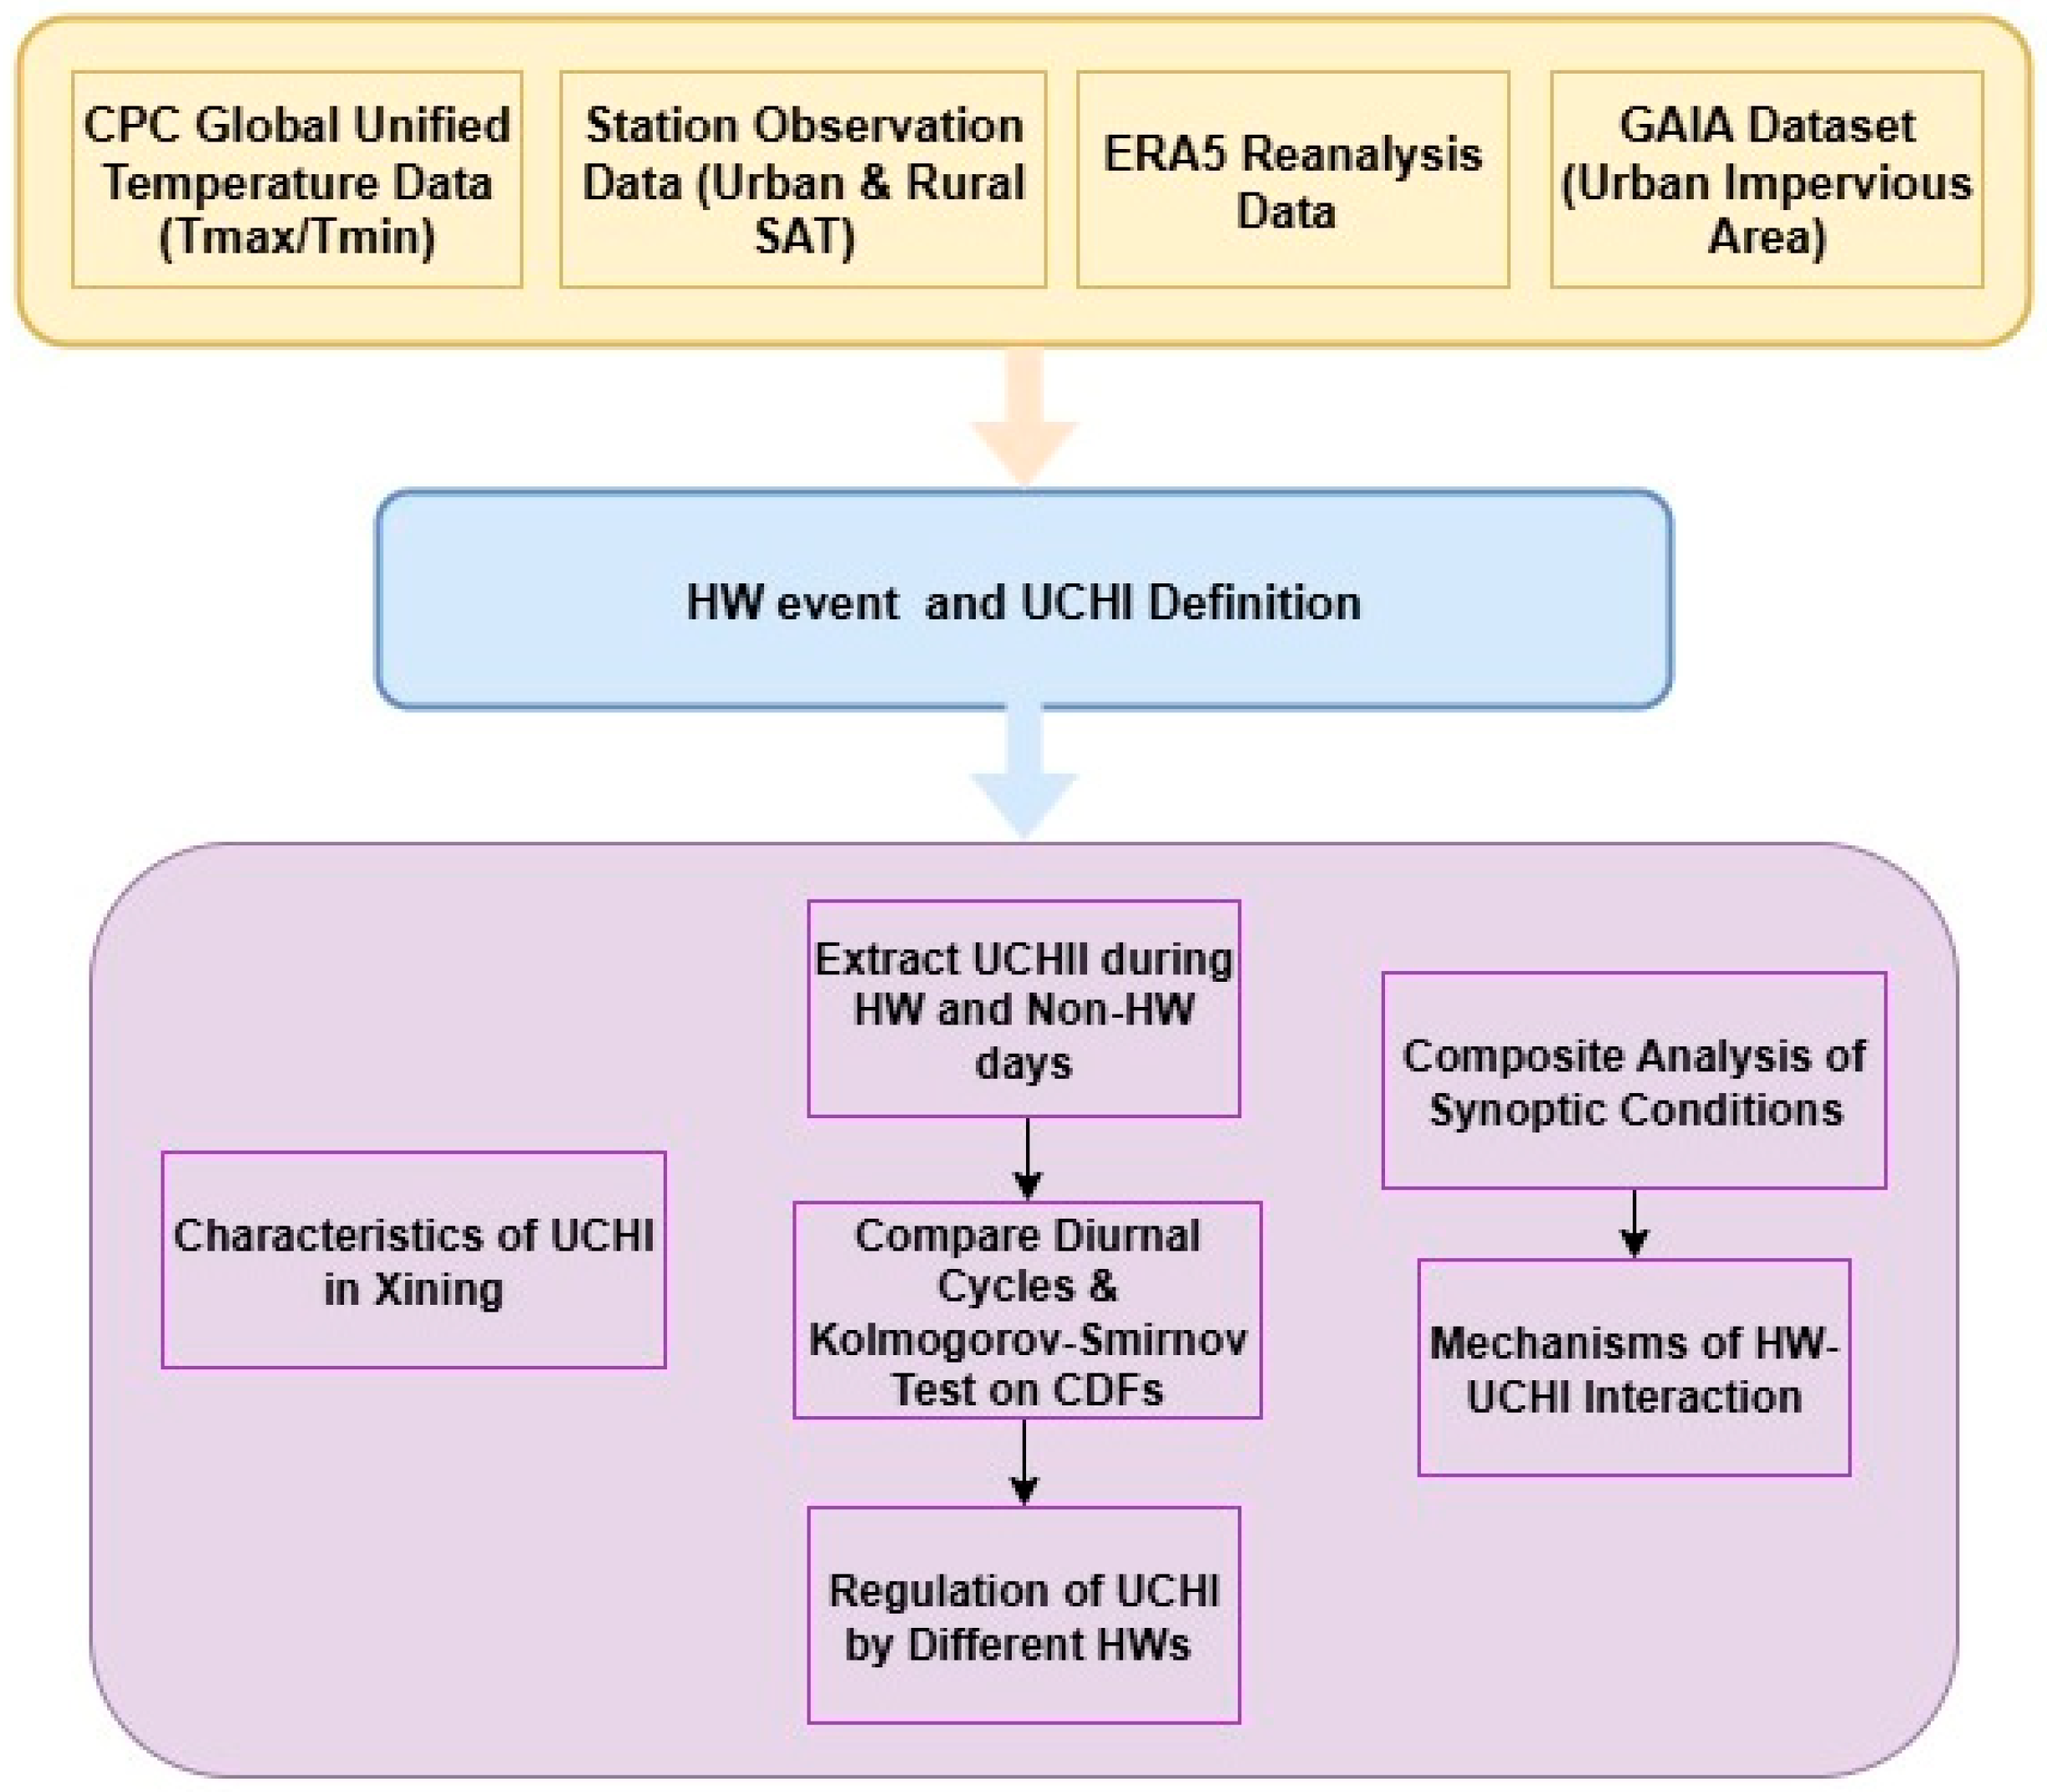
In addition, to investigate the response of UCHII to multiple heatwave types (daytime, nighttime, compound) and characterize its diurnal variations, UCHII and its diurnal variation during different heatwave types and non-heatwave periods are compared and quantified. Meanwhile, the Kolmogorov–Smirnov test was applied to compare the cumulative distribution functions of UCHII between heatwave types and non-heatwave periods, statistically assessing the significance of distributional differences. Non-heatwave days refer to calendar-matched dates (identical month and day) from different years corresponding to the heatwave event dates. The flowchart of this study is shown in Figure 2.

3. Results and Discussion

3.1. Characteristics of UCHI in Xining City from 2018 to 2023

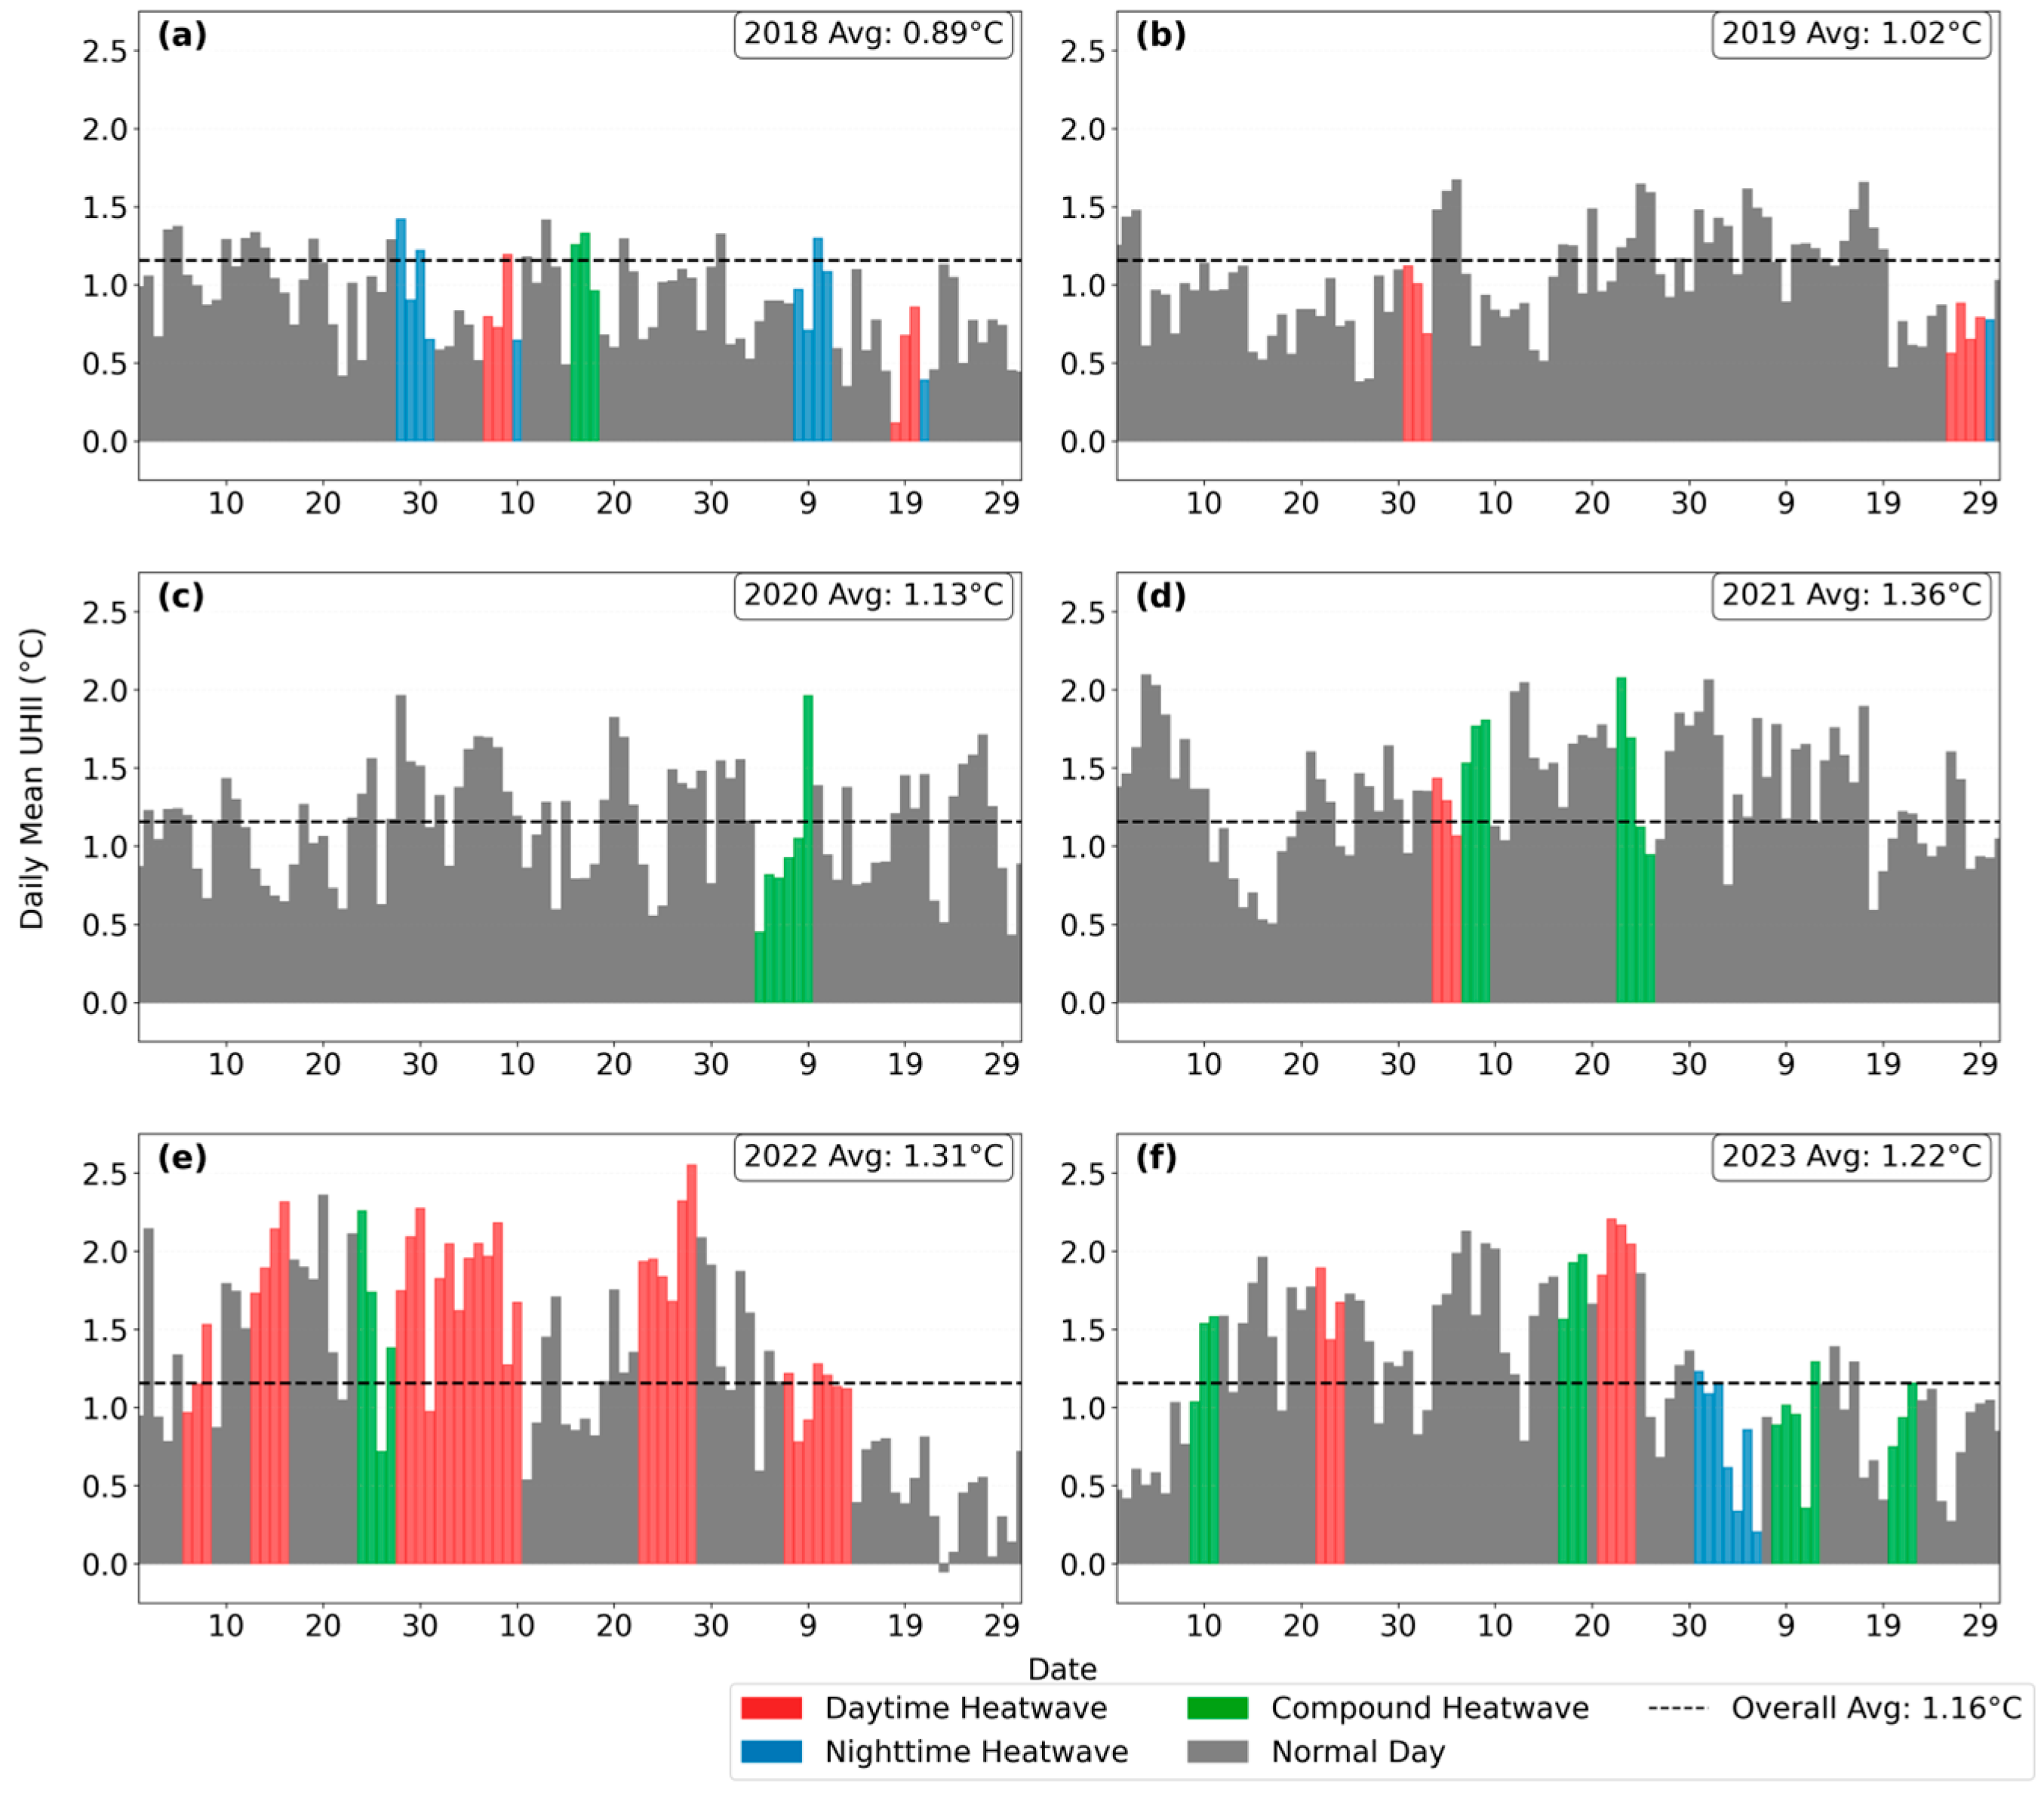
It manifests a UCHI phenomenon in observed 2 m SAT on nearly all days between 2018 and 2023 during summertime in Xining City, with a mean intensity of 1.0 °C (Figure 3). Specifically, the summer mean UCHII exceeds 1.2 °C for the recent three years (Figure 3d,e). However, daily mean UCHII exhibits significantly greater variability in 2022, reaching an extreme value on July 28th, with a z-score of 3.0. Previous studies noted that in July 2022, a widespread, record-breaking heatwave struck regions on the TP, with some areas experiencing daily Tmax anomalies exceeding 4 °C [13]. It highlights an anomalous positive deviation from the 6-year UCHII average appears during the 2022 TP regional heatwave, although UCHII showed an increasing trend for the past six years.
The intensification of UCHII in Xining has profound implications for urban sustainability and public welfare. Under the combined effect of regional climate change and urban heat islands, a growing population is being exposed to more frequent and intense extreme heat. This significantly increases health risks related to heat stress, reduces outdoor thermal comfort, and drives up energy demands for cooling, thereby threatening the sustainability of urban settlements. Secondly, the UCHI effect can exacerbate urban air pollution problems. Different urban–rural temperature gradients alter turbulence and the mixing rate within the atmospheric boundary layer, subsequently influencing the concentration of pollutants like PM2.5.
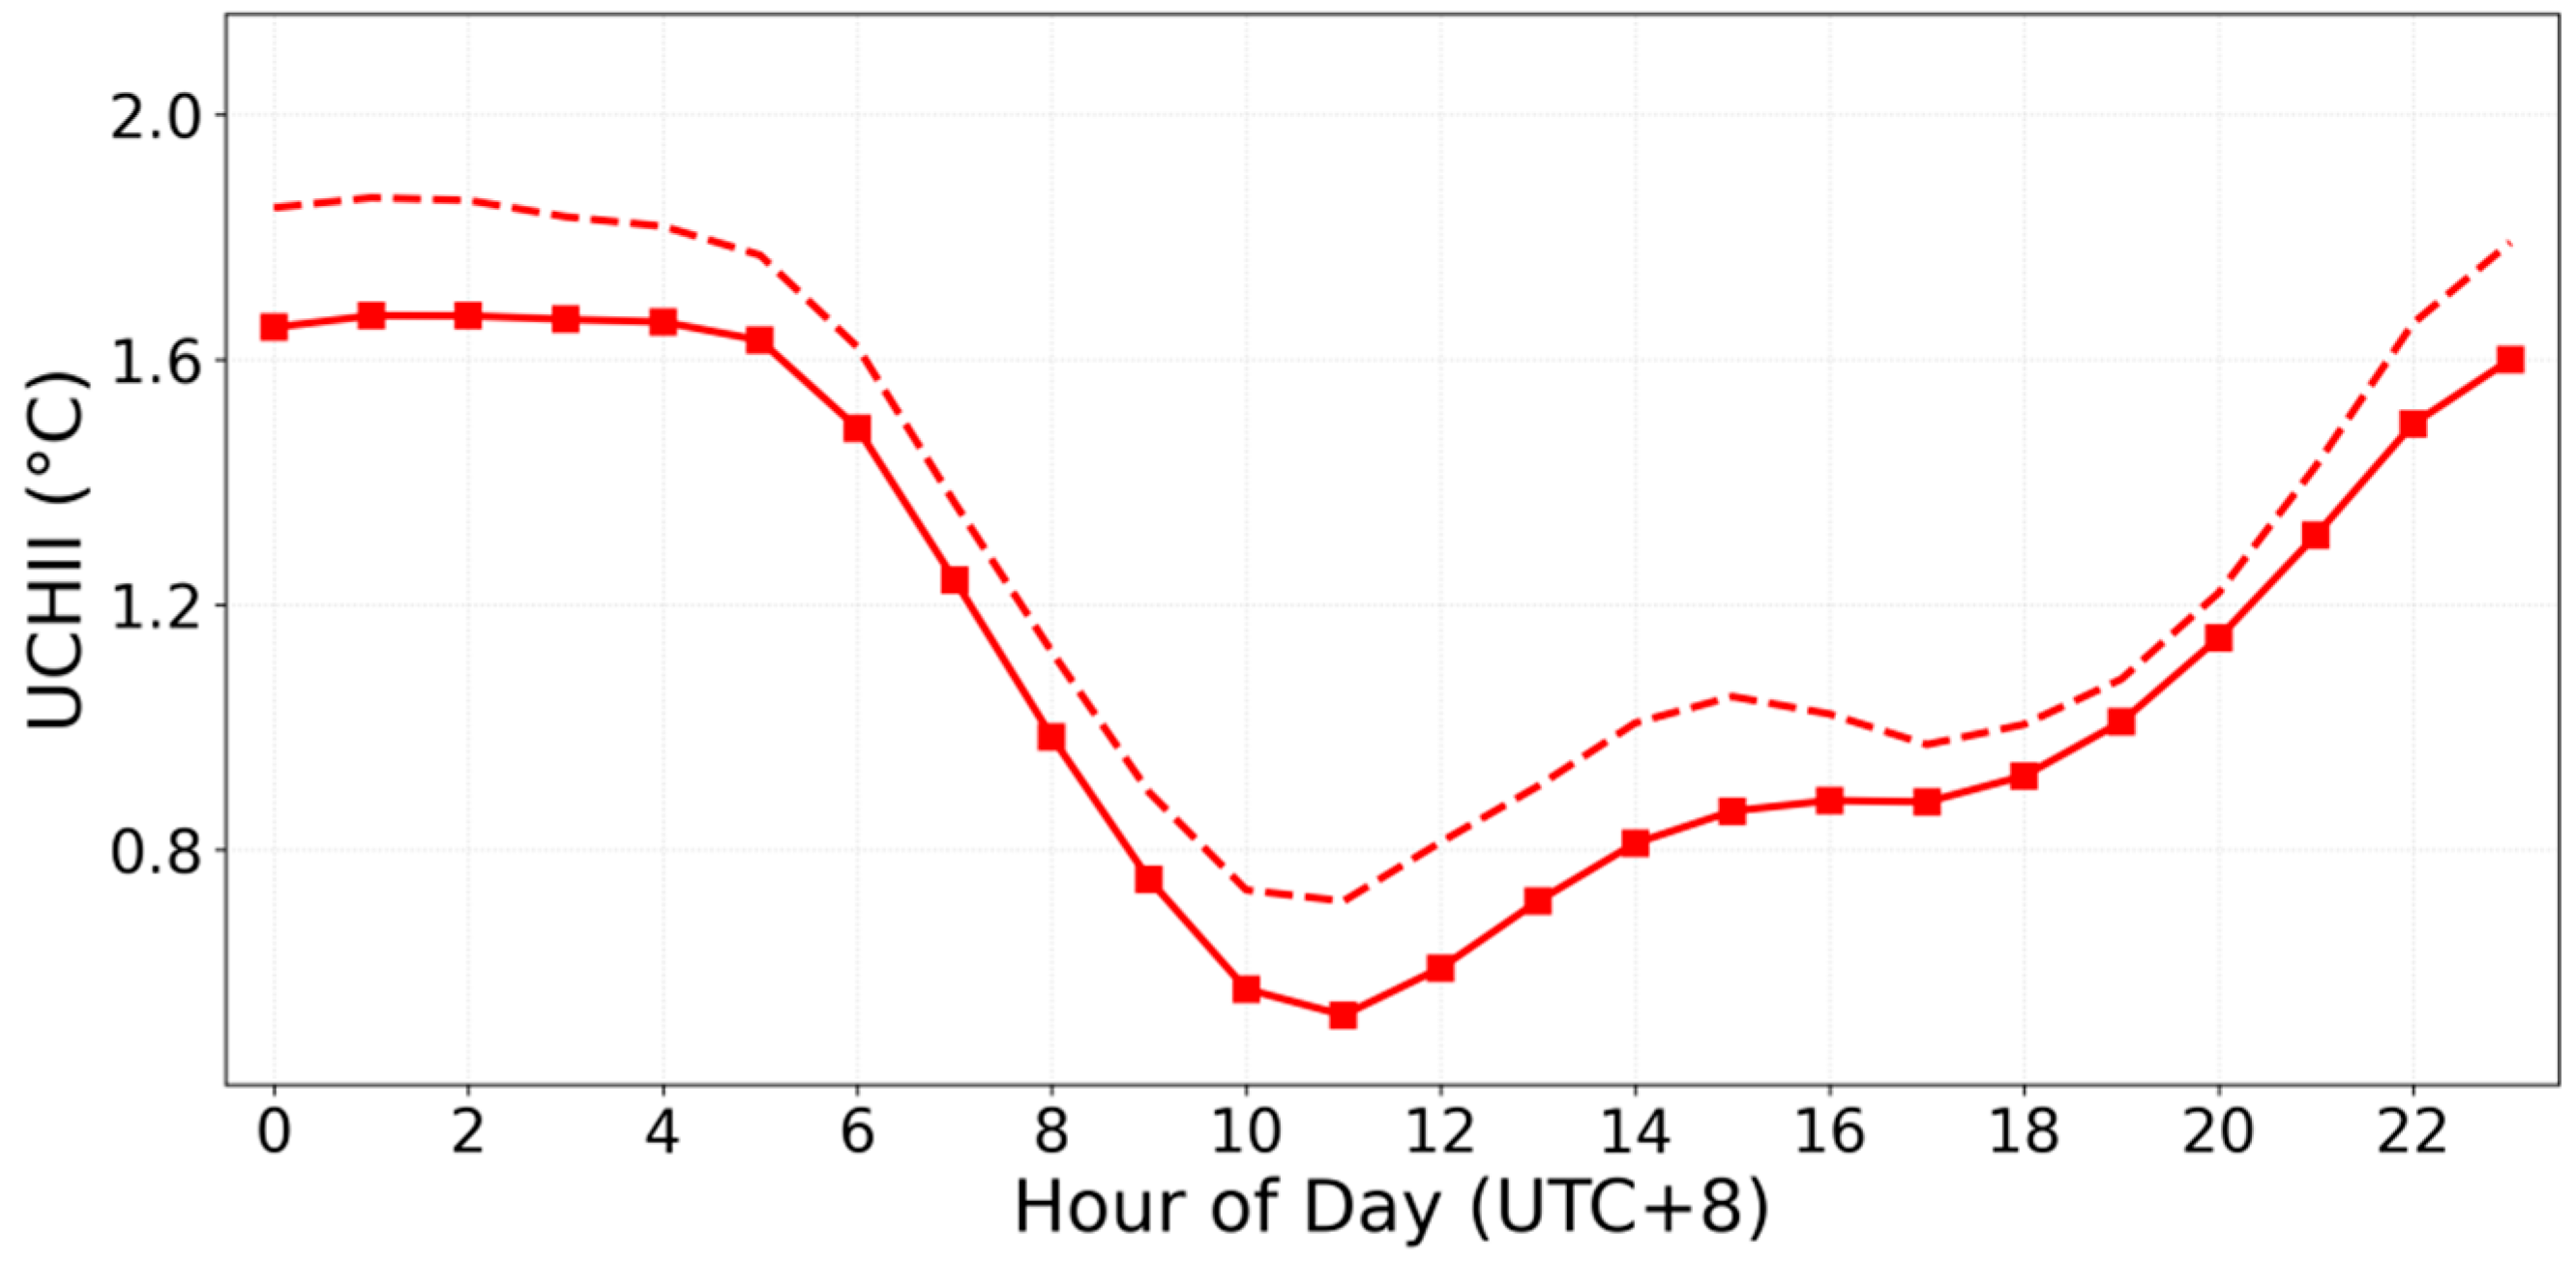
The UCHI shows pronounced diurnal variability (Figure 4), characterized by sustained nocturnal peaks followed by rapid attenuation at sunrise and gradual recovery from early afternoon. While daytime SAT showed minimal urban–rural differences, the difference is still positive. The diurnal variability of UCHII intensified notably in 2022, particularly during the nocturnal peak phase and the early afternoon recovery period.
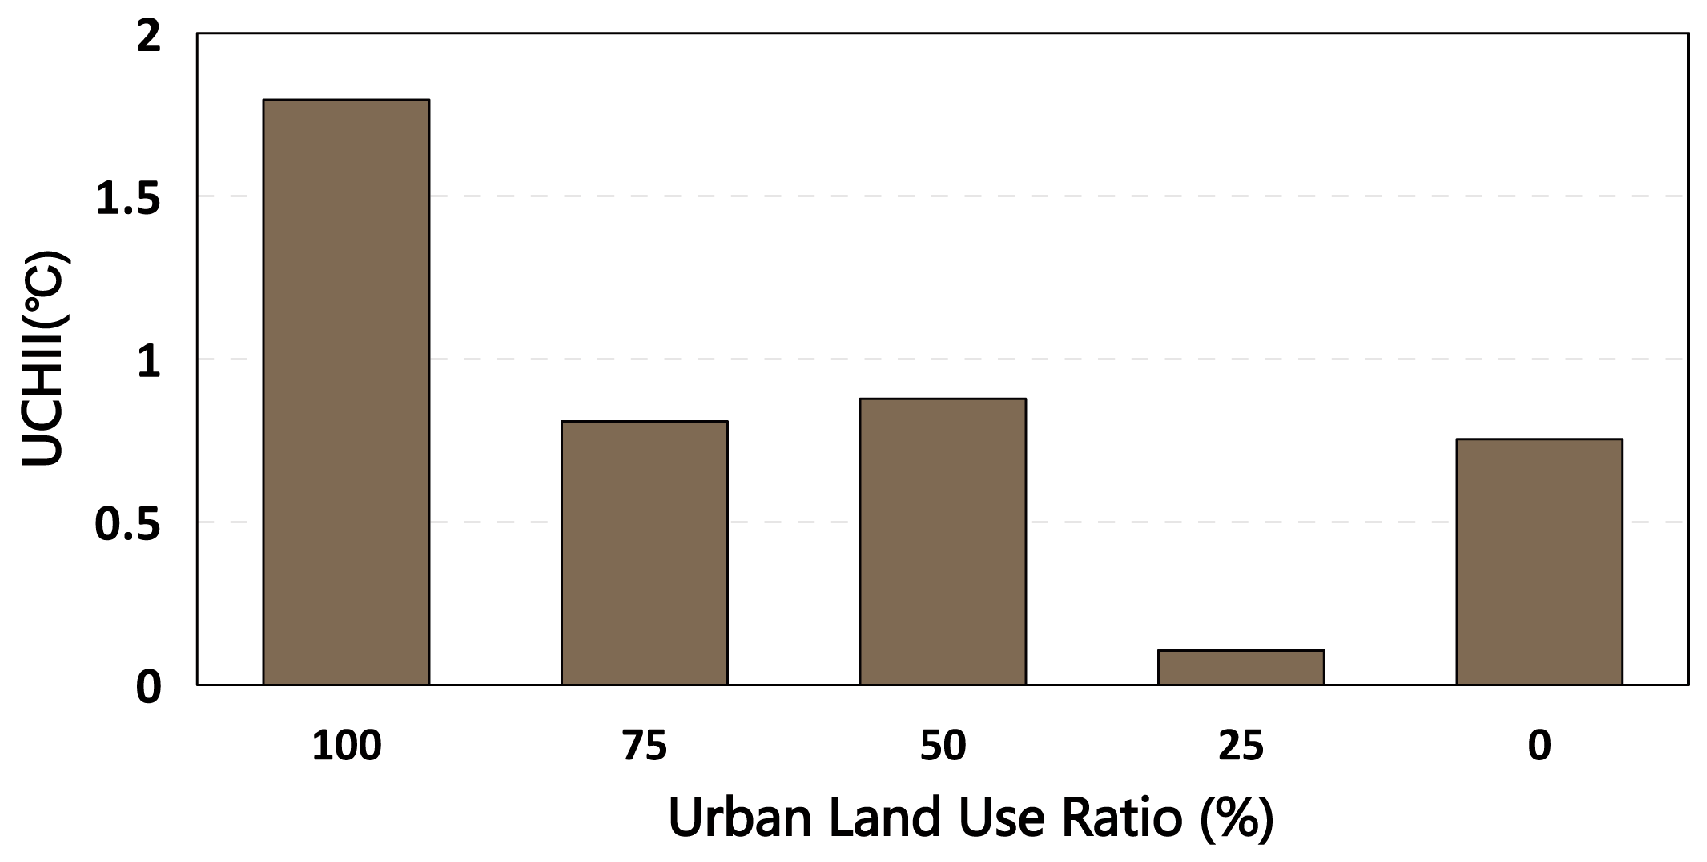
To quantitatively assess the impact of urban surface characteristics on UCHII, we examined the relationship between the urban land use ratio around each station (within a 1 km buffer) and the station-based UCHII magnitude (Figure 5). The analysis reveals a strong positive correlation: UCHII significantly increases with the expansion of urban land use. Specifically, for stations completely surrounded by urban land use (urban land use ration = 100%, n = 10), the mean UCHII reaches 1.80 °C. In contrast, for stations located in purely natural settings (urban land use ration = 0%, predominantly cropland and grassland, n = 2), the mean UCHII drops markedly to 0.23 °C. This nearly eightfold difference provides robust observational evidence that urban land cover expansion is a dominant driver of the UCHI effect in Xining. Beyond the impervious surfaces, the primary land cover types in the vicinity of the stations are cropland and grassland, which exhibit much weaker warming effects compared to artificial materials.

3.2. The Regulation of UCHI by Different Heatwave Events

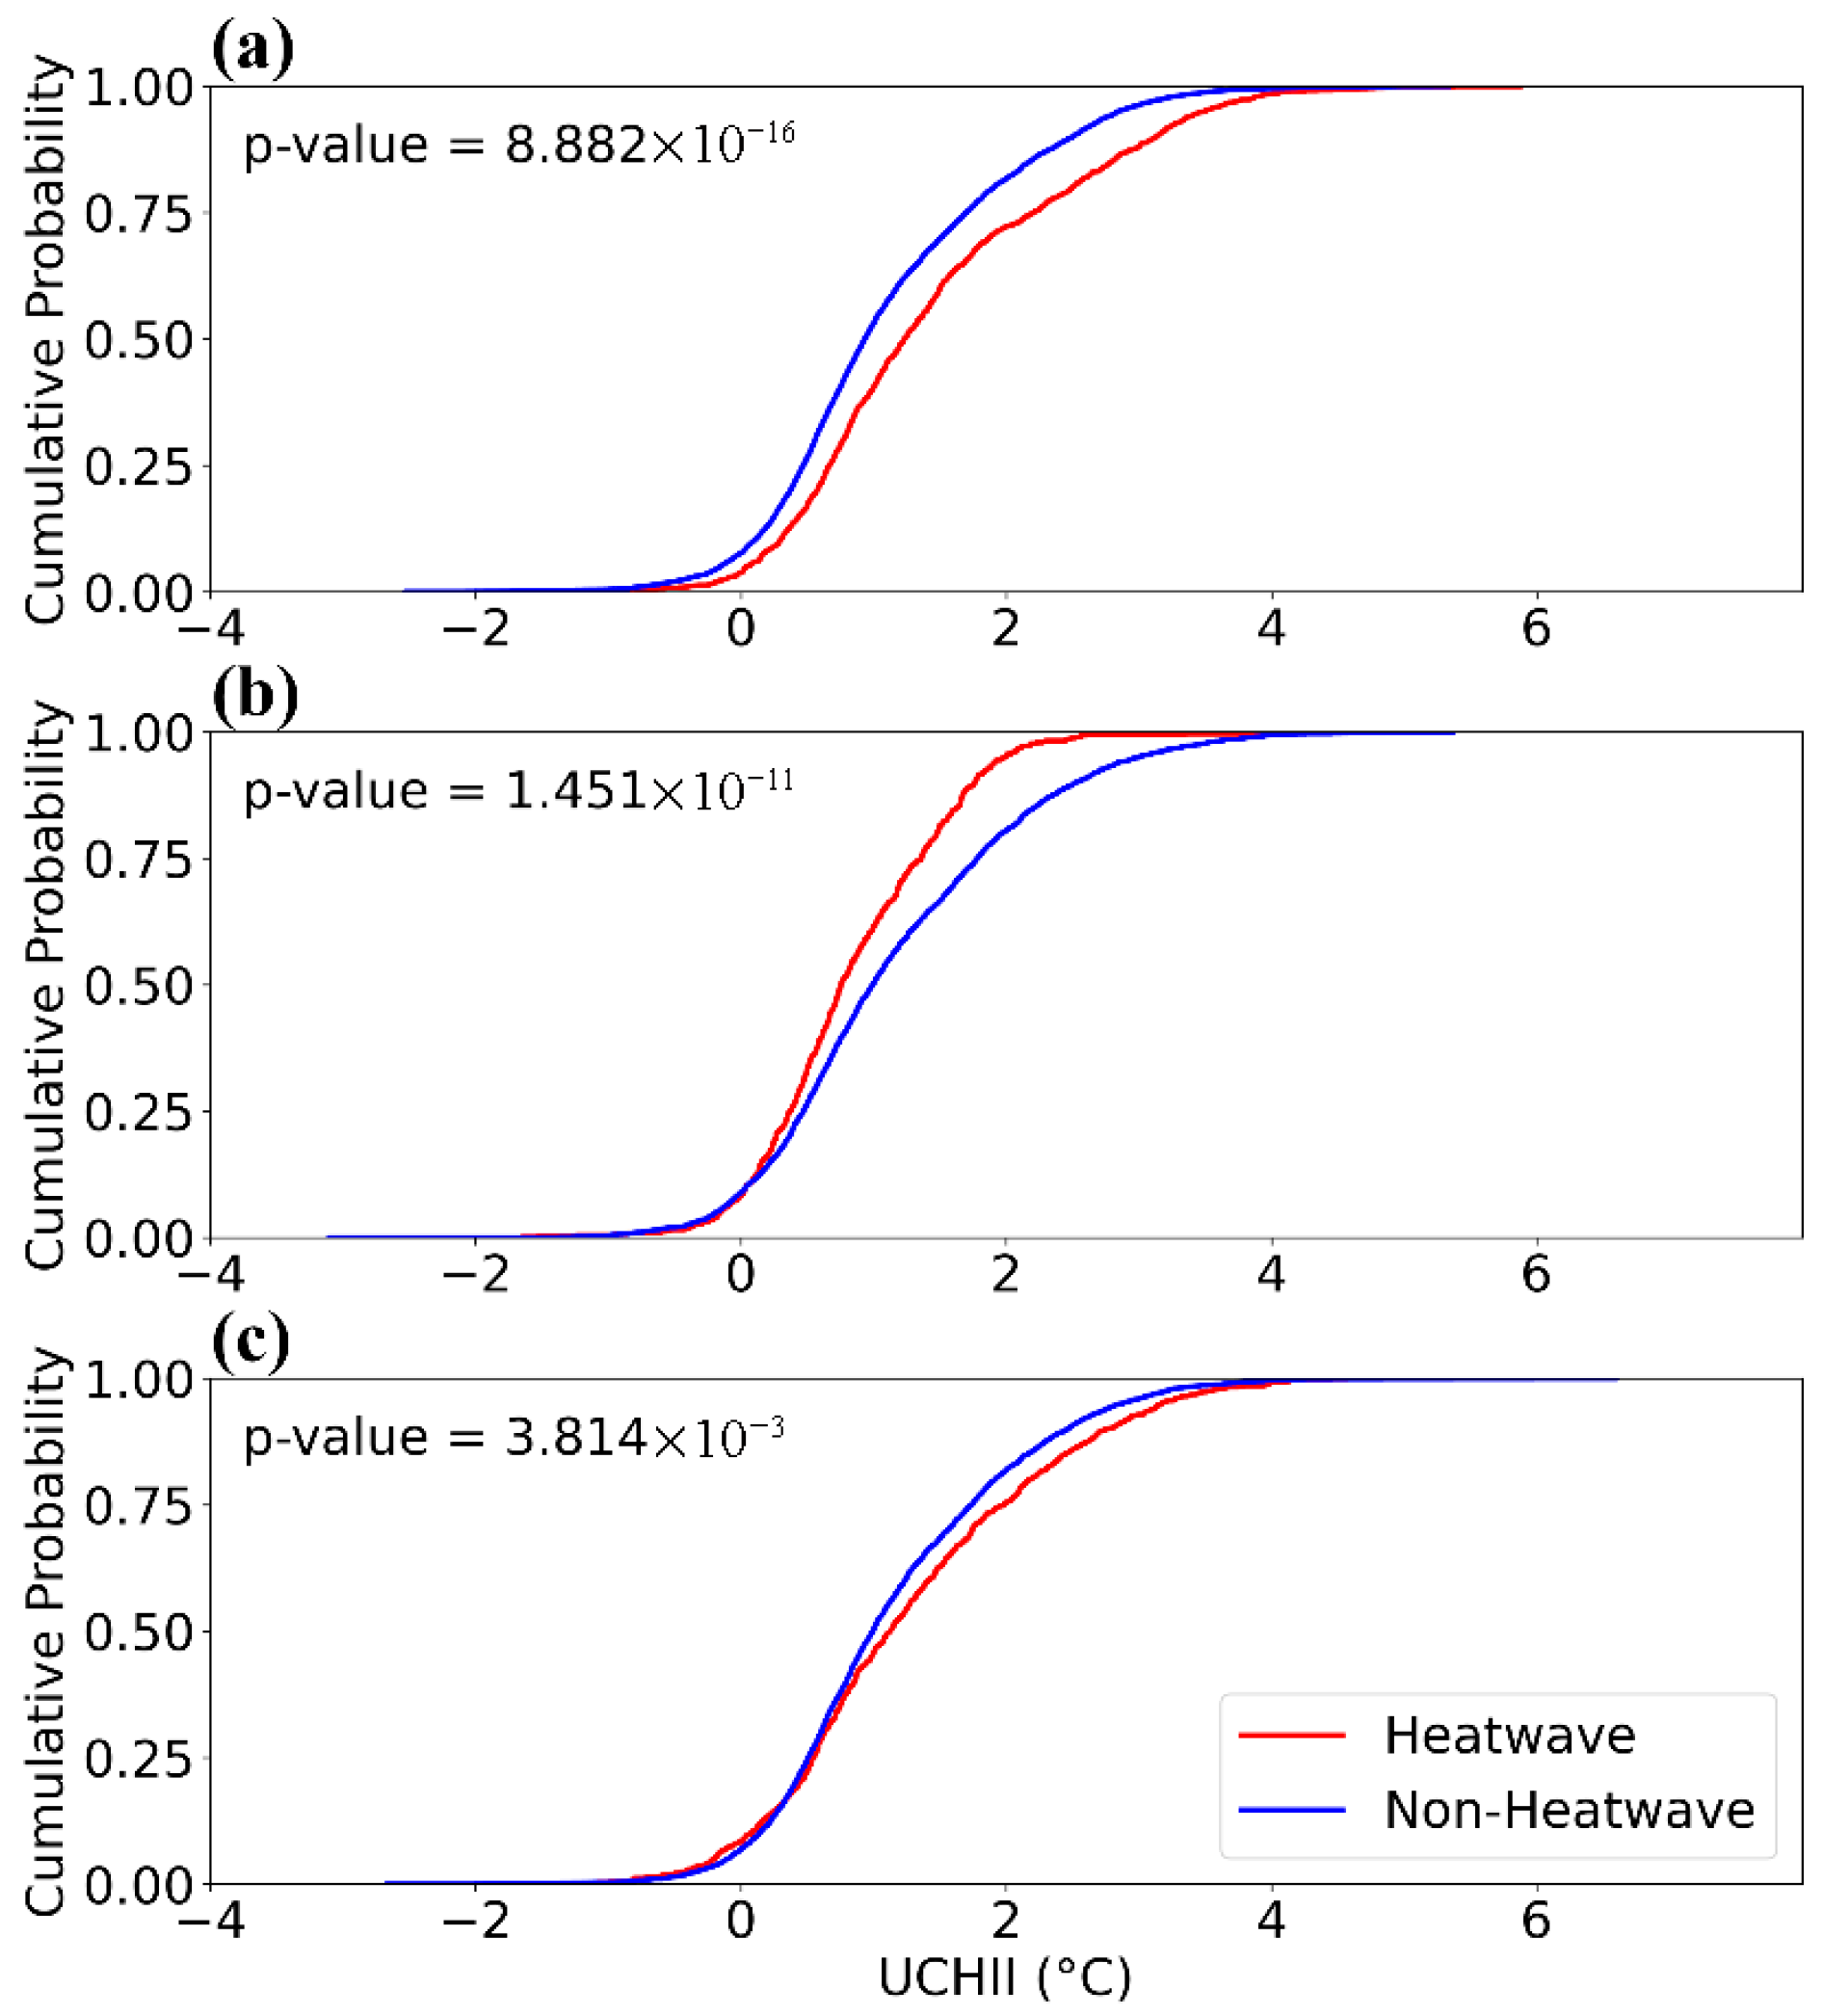
Over the six-year period, the TP has primarily experienced single-type heatwaves, with daytime events concentrate in the southern regions and nighttime events dominating the central and eastern areas (Figure 6). Furthermore, the total counts of regional-scale heatwaves selected in composite analysis are 12 daytime events, 6 nighttime events, and 9 compound events (Figure 3). The response of UCHI to varying heatwave types is further investigated, respectively. Daytime heatwaves enhanced UCHII by 0.35 °C compared to non-heatwave periods (mean: 1.47 °C versus 1.12° C) (Figure 7a). The cumulative distribution of UCHII shifts toward higher values, with a distinct rightward shift in the upper tail, which confirms amplified extreme UCHI conditions during heatwave events. Conversely, nighttime heatwaves produce a distinct thermal response, suppressing mean UCHII by 0.31 °C (0.85 °C vs. 1.16 °C; Figure 7b). The overall UCHII distribution also shifts toward lower intensities during heatwave events, with values concentrating within the range of 0–2 °C. During compound heatwave events, UCHII increased by approximately 0.12 °C (Figure 7c). However, UCHII distributions differed significantly between compound heatwaves and non-heatwave periods.
The responses of diurnal variation in UCHII to different heatwaves are further examined. Figure 6 illustrates the diurnal variation in UCHII during heatwave and non-heatwave periods, along with their differences. It reveals that heatwaves primarily affect nocturnal UCHII but elicit no obvious daytime UCHII response. In particular, the UCHII increases occur predominantly in nocturnal SAT during daytime and compound heatwaves (Figure 8a,c). Conversely, during nighttime heatwaves, the UCHII reductions are likewise centered on nocturnal SAT (Figure 8b). In addition, the magnitude of nocturnal UCHI intensification and reduction is comparable during both single types of heatwave.

3.3. Possible Mechanisms Underlying Heatwave–UCHI Interactions

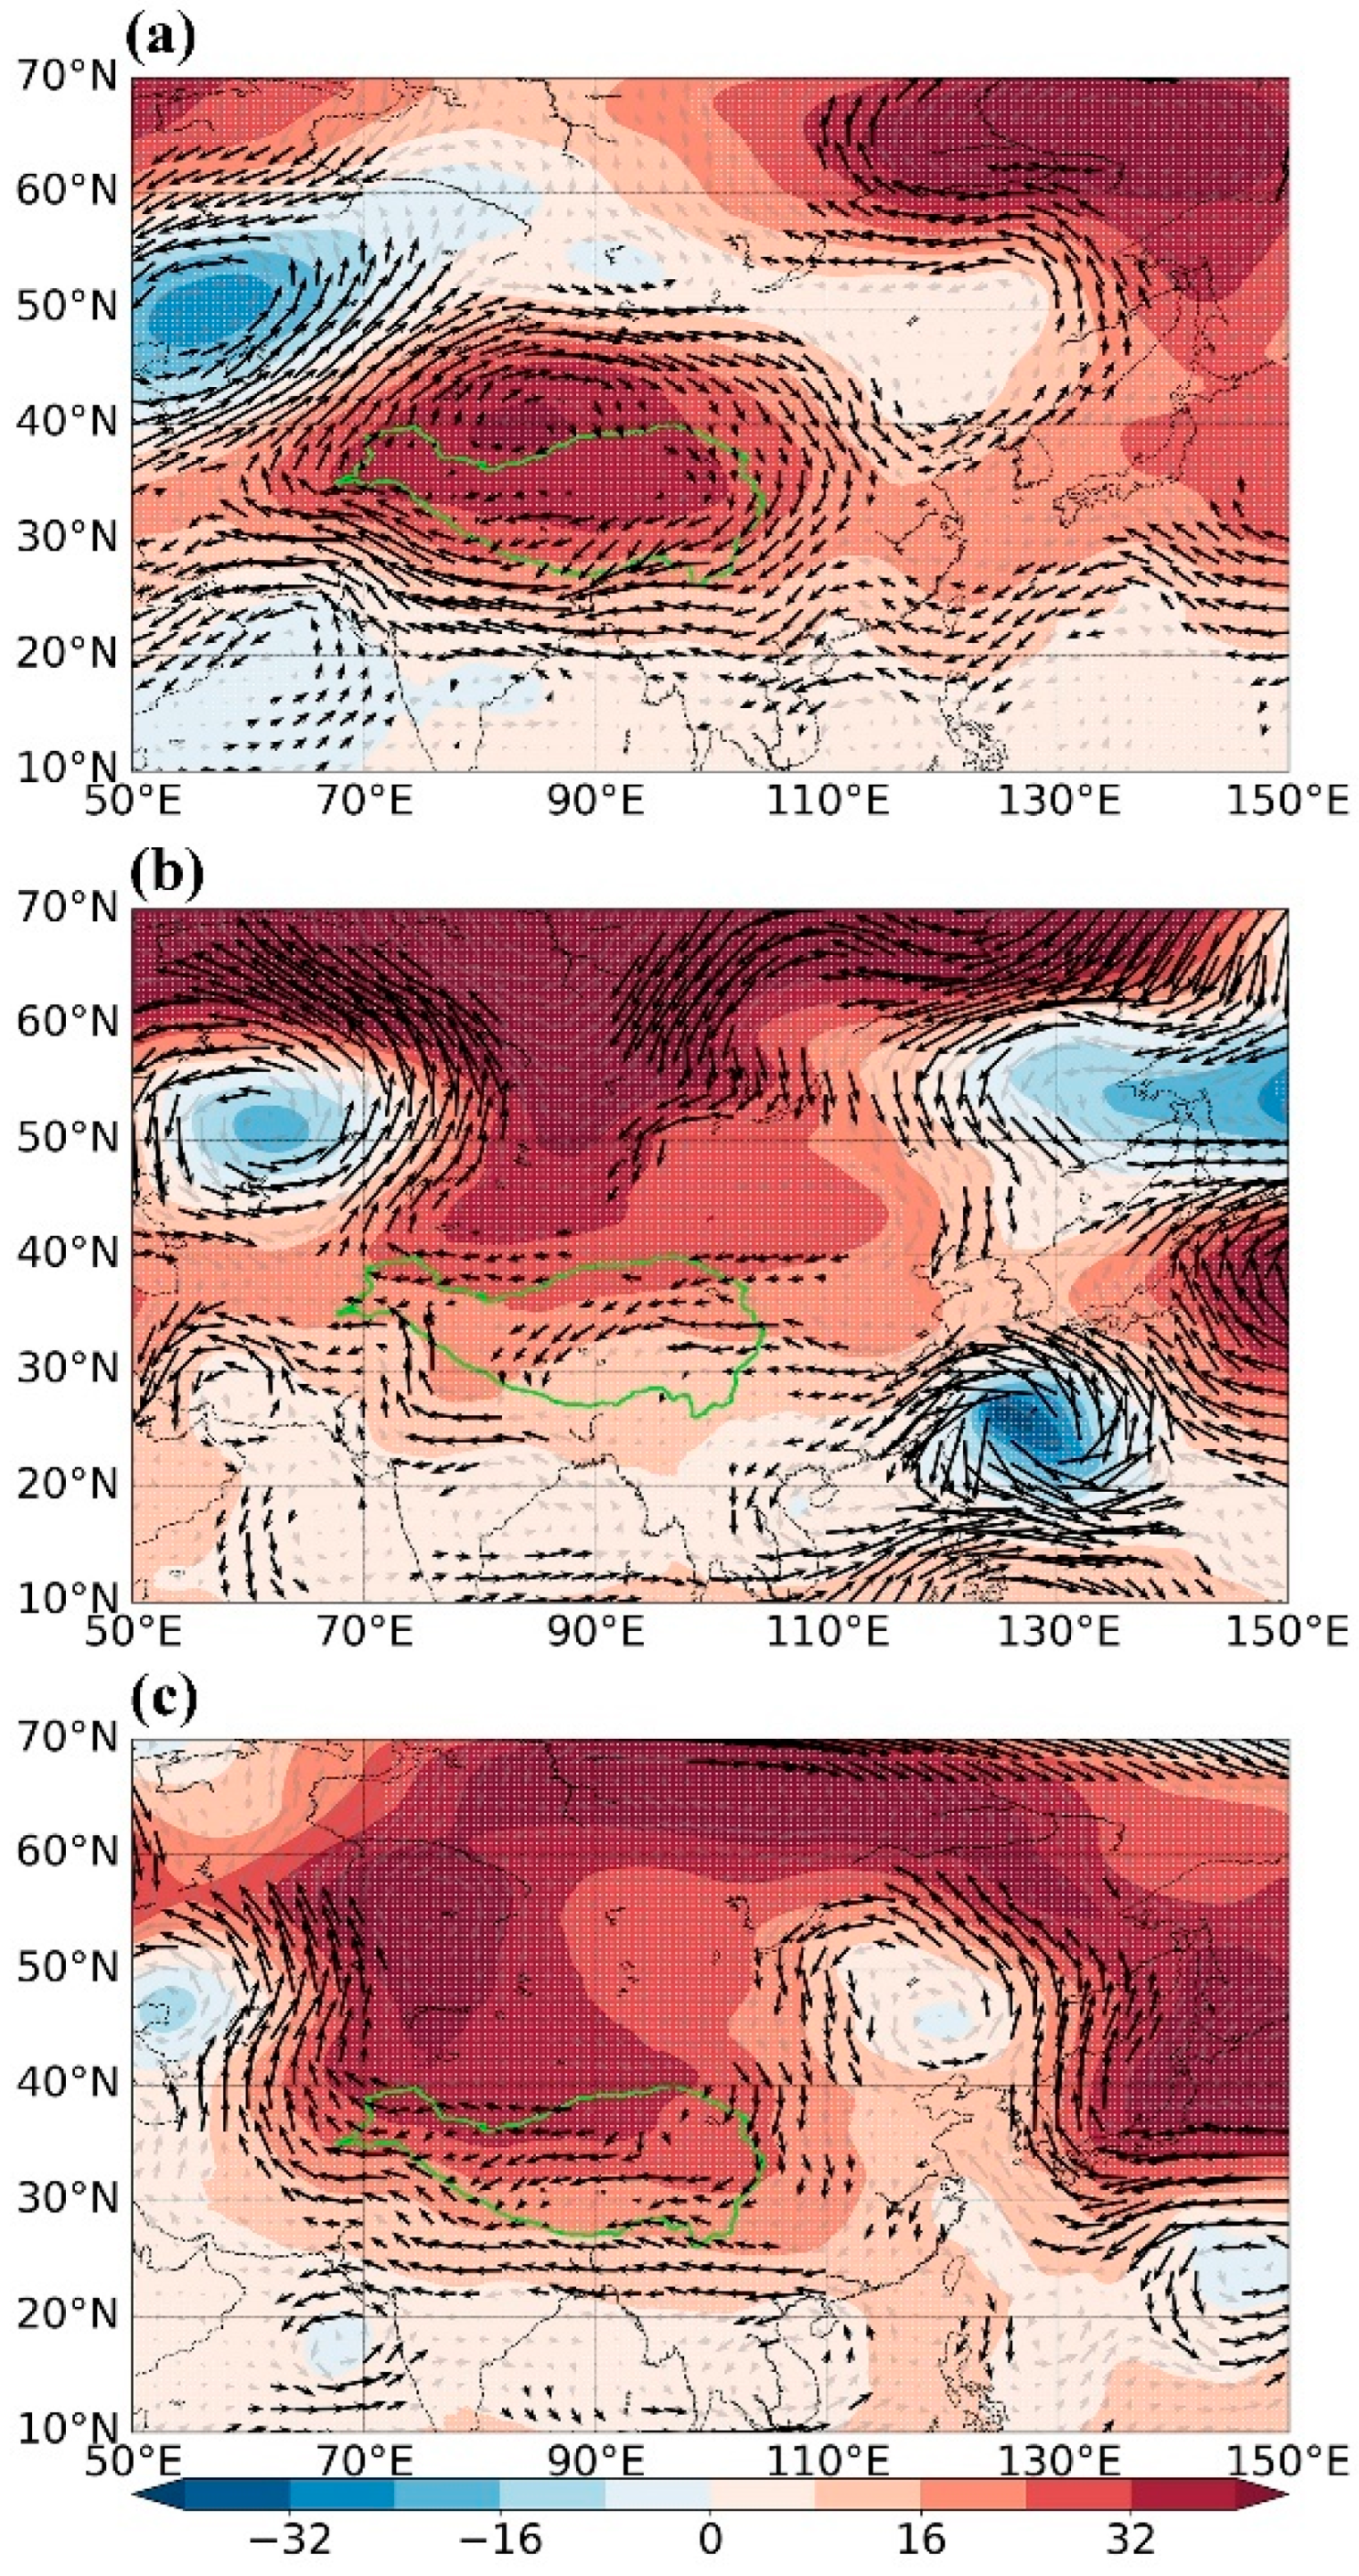
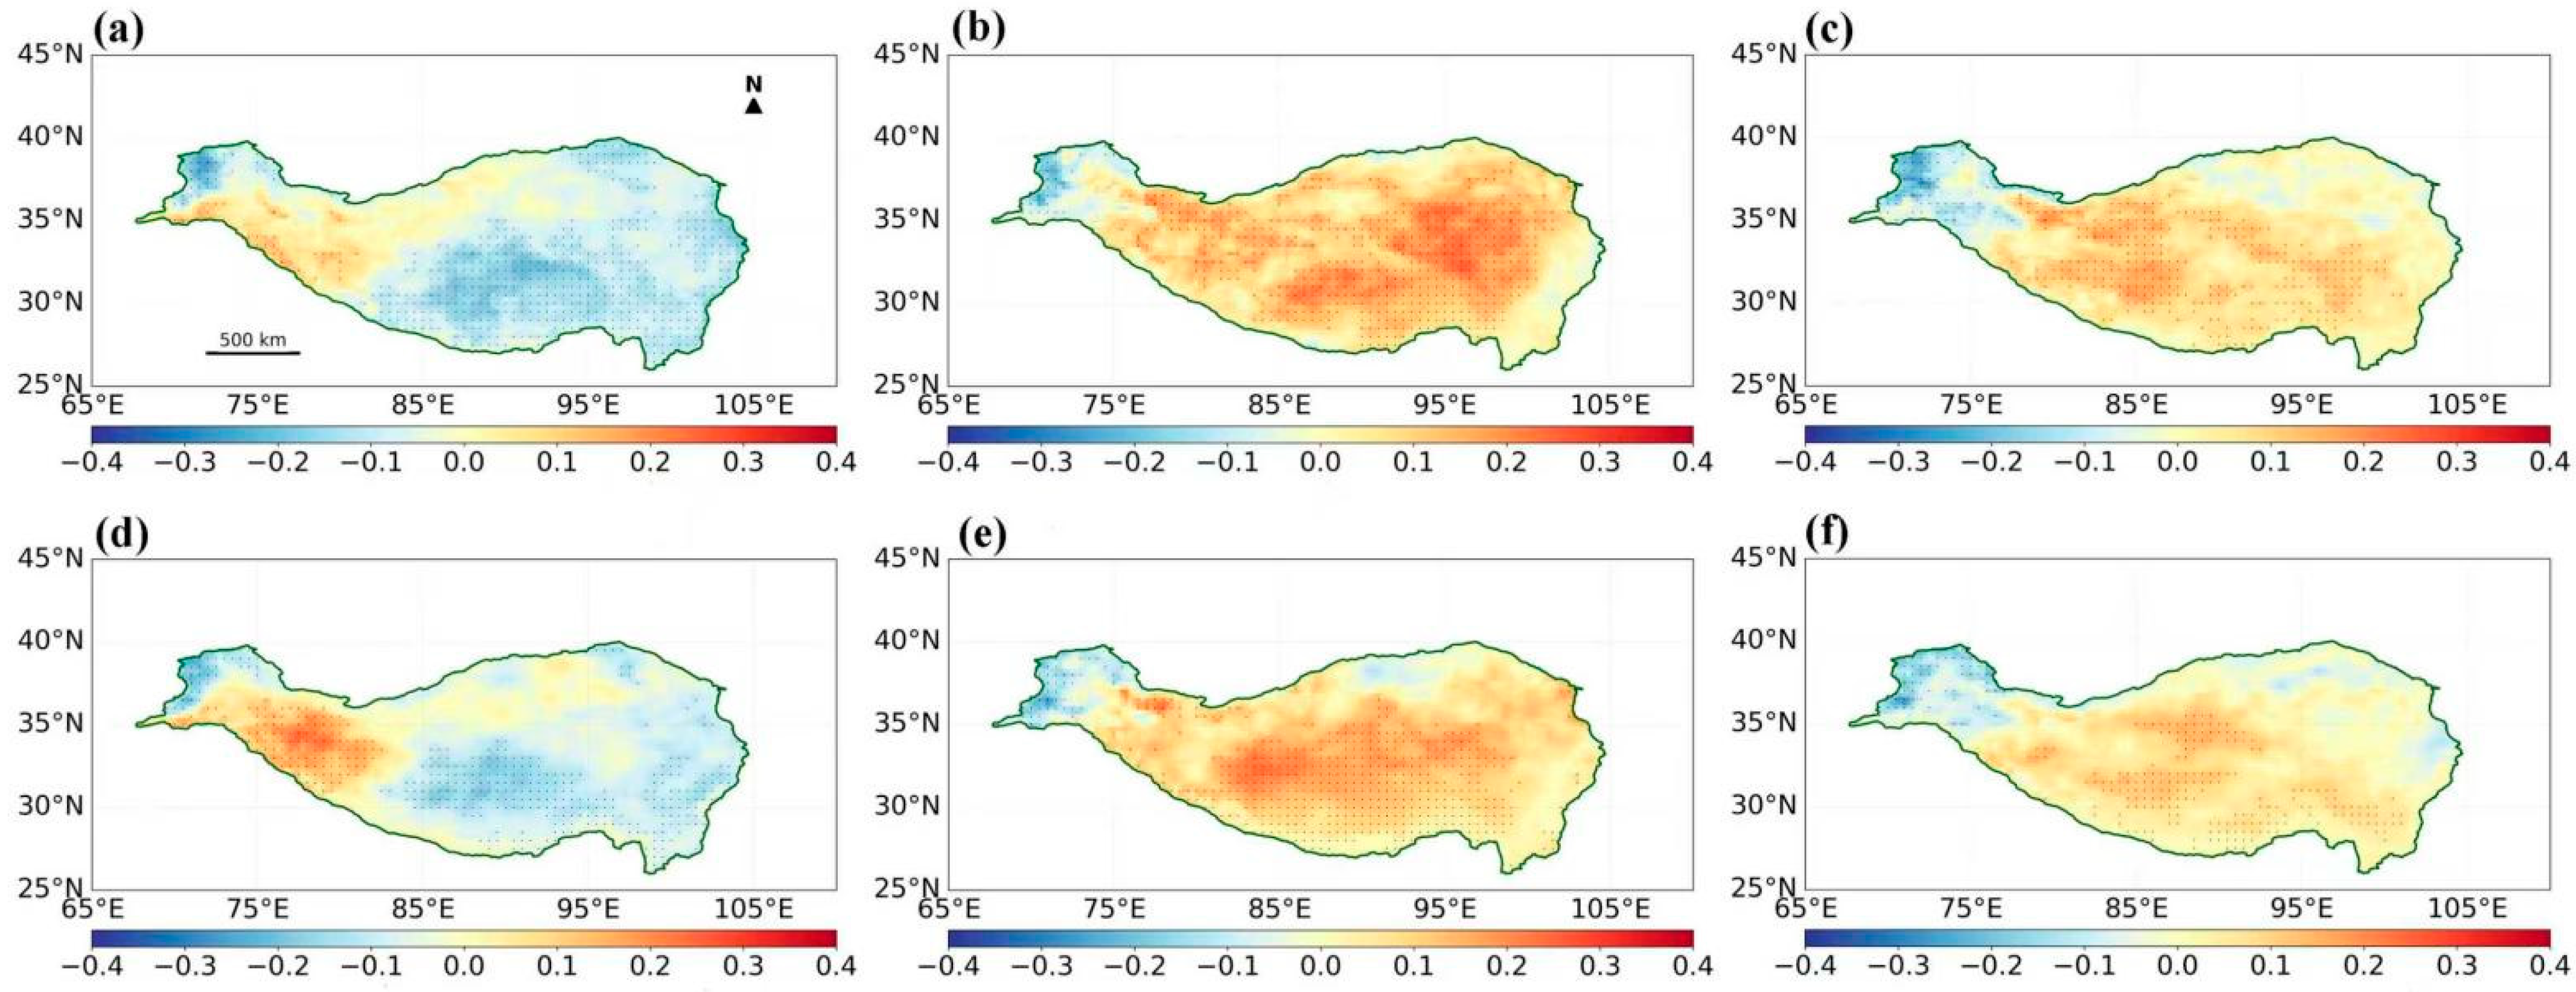
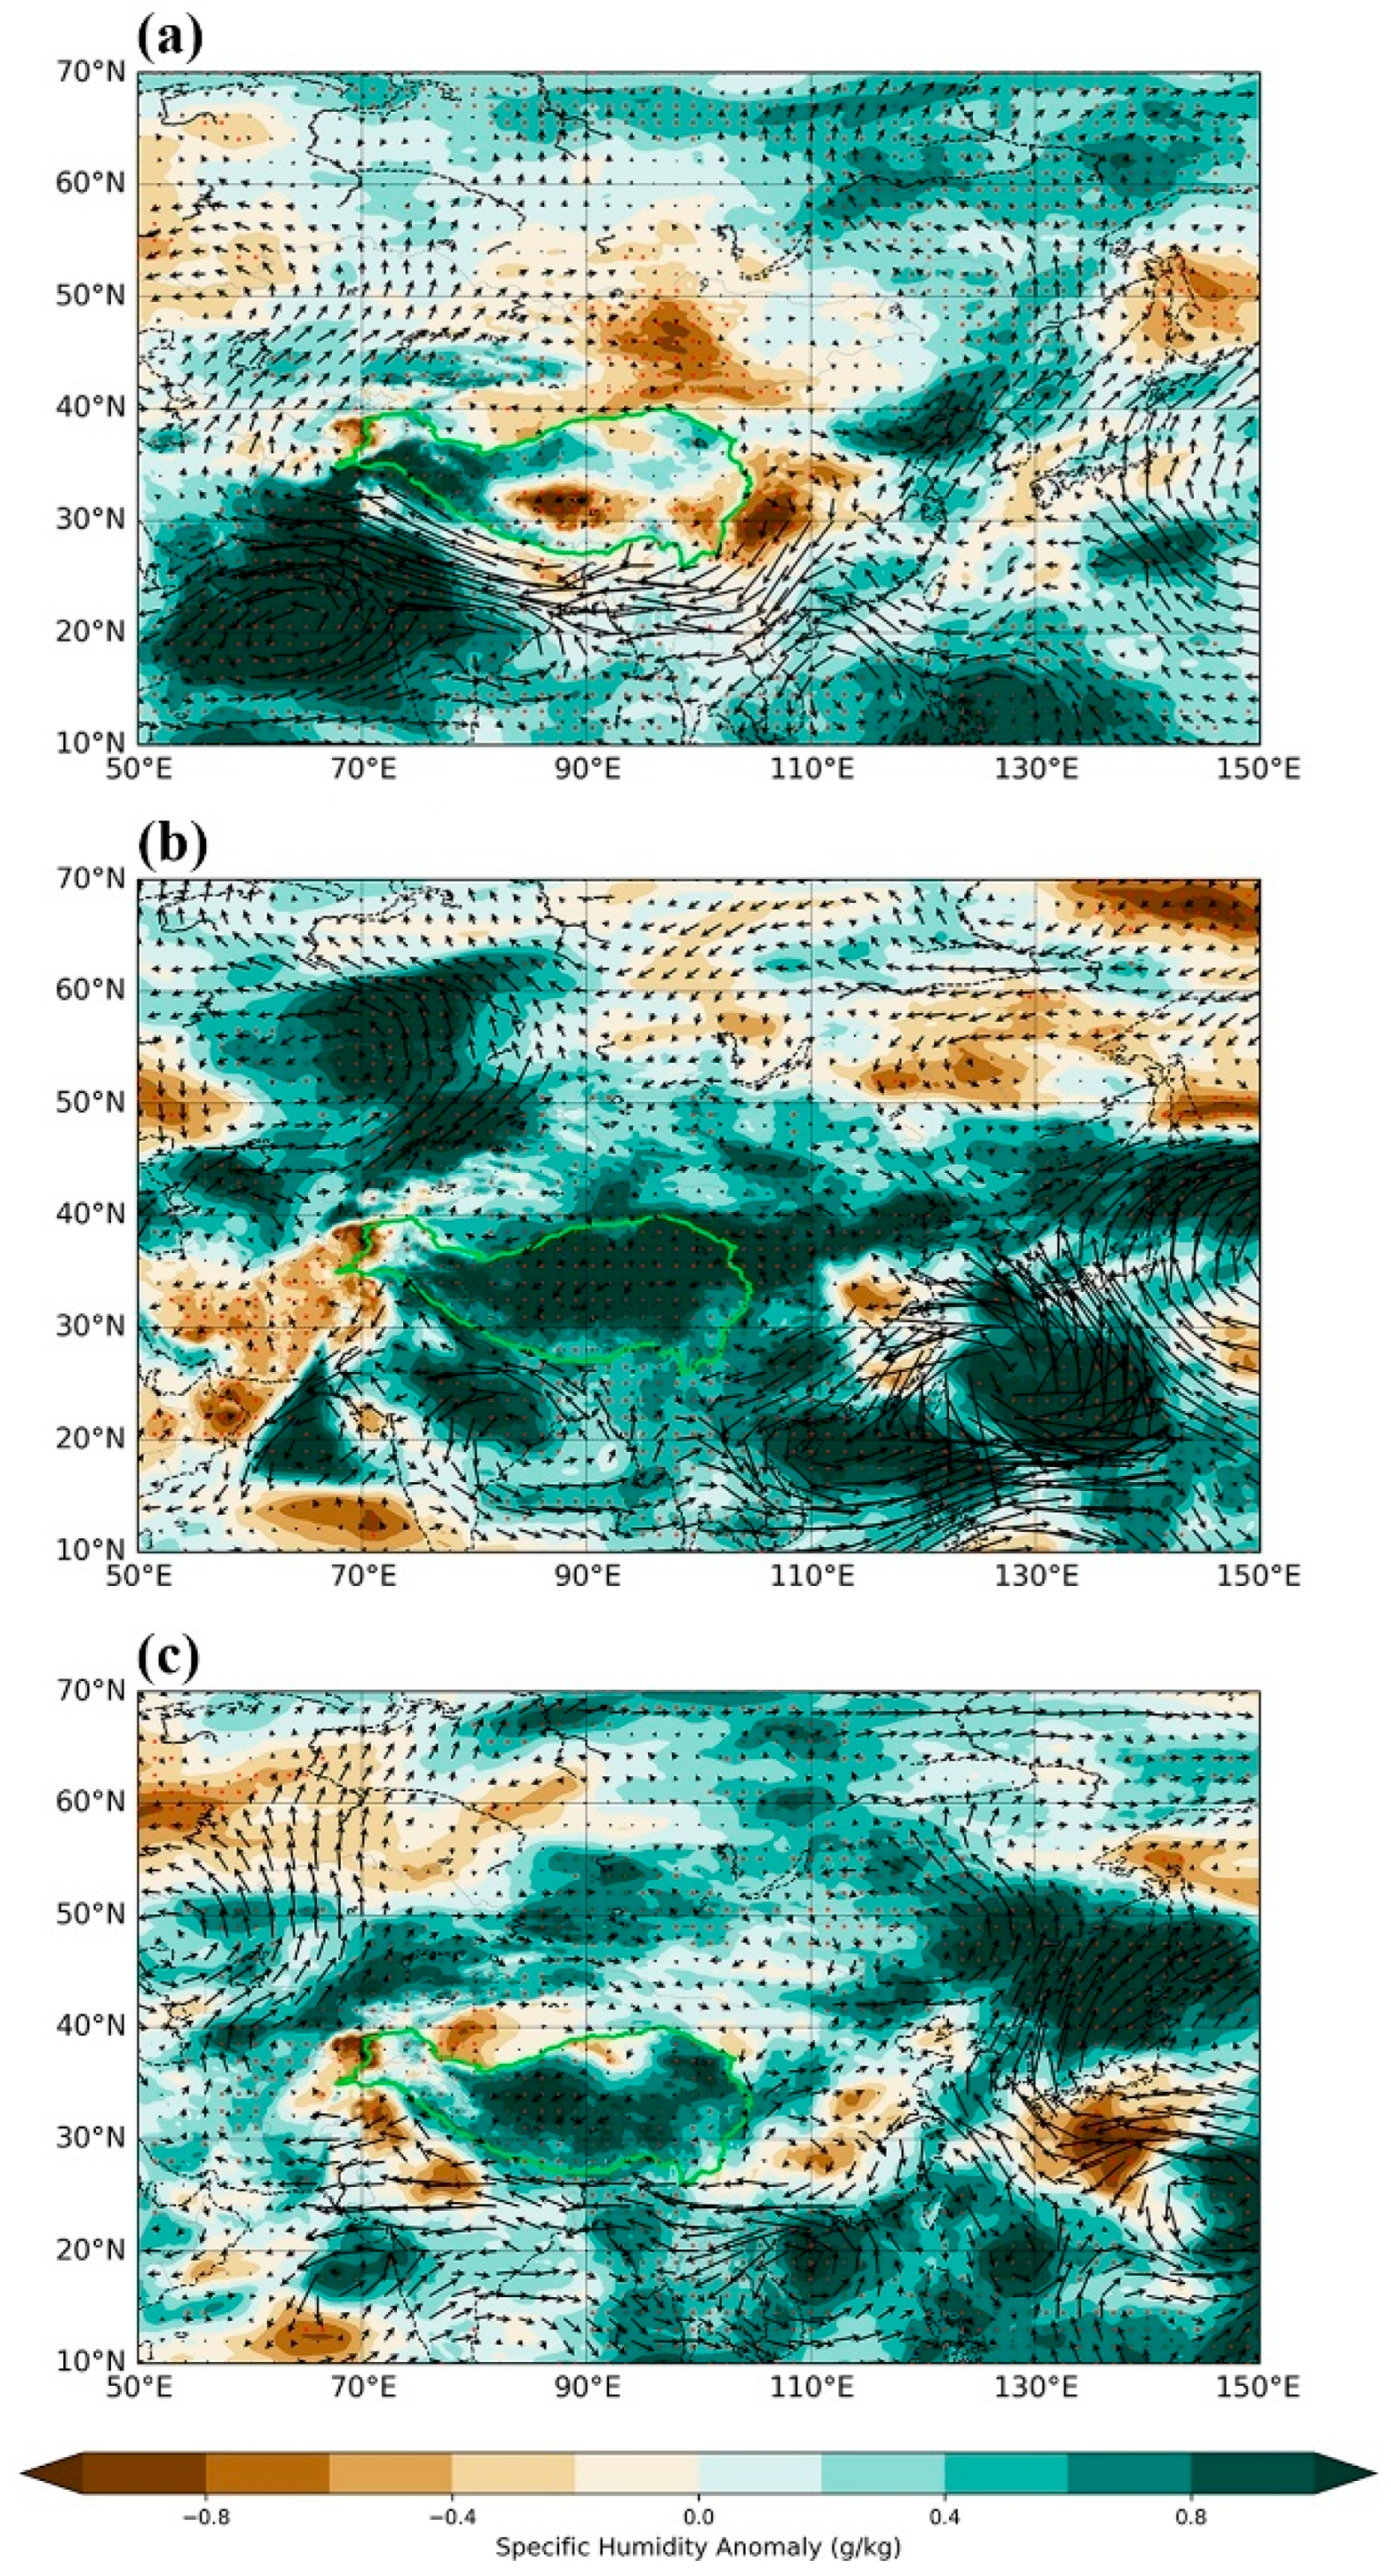
Composite analysis reveals that daytime heatwaves over the TP are controlled by an anomalous anticyclonic at 500 hPa (Figure 9), characterized by cloudless (Figure 10) and dry synoptic conditions that are exhibited in water vapor flux and specific humidity at 700 hPa (Figure 11). Conversely, during nighttime heatwaves, characterized by an anomalous anticyclonic over the north of the plateau, with higher cloud cover (Figure 10) and humidity (Figure 11) synoptic conditions.
The UCHI effect is inherently a nocturnal phenomenon, as urban environment cool slower than rural areas at night [40]. UCHII is modulated by meteorological variables with different synoptic patters, particularly cloud cover and wind speed [40,41,42]. Peak UCHII generally occurs during calm, cloudless nights due to three interconnected mechanisms [40]; Divergent cooling rates occur where rural areas experience rapid temperature drops via efficient radiative cooling under clear skies, while urban cooling is attenuated by slow release of heat stored in high-thermal-capacity building materials, reduced radiative efficiency in urban complex structures and persistent nighttime anthropogenic heat emissions. This cooling differential is reinforced by stable boundary layer dynamics that restrict horizontal and vertical heat transport.
Nighttime heatwaves, characterized by cloudy and humid conditions, fundamentally alter this dynamic. Under large-scale warm, moist advection, both urban and rural temperatures rise substantially. Critically, the open rural areas, which are more sensitive to synoptic and surface conditions, experience amplified temperature fluctuations. Cloud layers absorb and re-radiate downward longwave radiation emitted from the ground, inhibiting surface and near-surface cooling. Thus, the urban–rural temperature differential often narrows, as the suppressed radiative cooling in rural areas. Thus, while heatwaves consistently amplify nocturnal UCHI across all climate regions [35,43], this study further reveals that in dry regions, the synoptic pattern driving a heatwave significantly alters this synergistic effect.
In addition, the UCHI–heatwave interaction is strongly contingent on the dry/humid state of heatwaves, an influence that may outweigh climatic background effects [44]. Specifically, dry heatwaves trigger strong synergistic effects that significantly amplify nocturnal UHII, whereas humid heatwaves diminish nocturnal UHII. This aligns with our findings, given the fundamental difference in moisture regimes between daytime (dry-dominant) and nighttime (humid-dominant) heatwaves. However, their study further identifies relative humidity as the key meteorological driver of nocturnal UCHII during heatwaves: Humidity variations modulate urban–rural temperature differentials through impacts on suburban radiative cooling efficiency. Notably, our research emphasizes that beyond humidity’s role in suburban cooling, the effect of urban heat storage and rural radiative cooling that modulated by daily cloud cover on UCHII also varies between two types of heatwaves (Figure 10b), since the synergy effect at night is mainly caused by the enhanced heat storage release and anthropogenic heat emissions [35]. However, numerical modeling studies are further needed to understand the quantitative contributions.
This study provides a crucial case analysis of heatwave–UCHI synergy for a major city on the TP and within a semi-arid climate. However, we underscore that the quantitative findings and the precise nature of the interactions documented here are particular to Xining, due to its unique confluence of local attributes. The city’s specific topographic context (e.g., its valley location), urban form, and the distinct atmospheric processes influenced by the surrounding plateau topography all play a defining role. Consequently, while the methodological framework may be applicable elsewhere, extrapolating our specific results to other high-altitude or semi-arid cities should be carried out with extreme caution. The complex interactions we describe are inherently place-specific, and their generalizability requires further investigation across a diverse set of cities. Moreover, while this study provides a detailed mechanistic understanding for Xining, its applicability to other cities on the Tibetan Plateau (e.g., Lhasa) requires further validation. The current lack of comparable high-resolution observational studies and the distinct topographic, demographic, and climatic conditions of each city preclude a direct quantitative comparison at this stage. However, the methodological framework established here, particularly the classification of heatwave types and the analysis of their diurnally asymmetric impacts on UCHI, offers a valuable template for future comparative work across the Plateau. We recommend that subsequent studies apply this framework to other cities to build a more comprehensive understanding of heatwave–UCHI interactions in high-altitude arid and semi-arid environments.
In this study, the six years (2018–2023) for quantifying synergies were constrained by the availability of high-density station data. While this period captured consistent synoptic signals during heatwave events, a longer timeframe would be beneficial for assessing the very rarest extreme events. Future research should integrate longer-term, homogenized station datasets to extend the analysis. Furthermore, while the 34-year reference period (1990–2023) used for threshold calculation is climatologically standard, employing an even longer baseline or incorporating future climate scenario analysis (e.g., SSP-RCP scenarios) could further enhance the robustness of heatwave identification and project future changes in heatwave-urban interactions. Such analyses represent a valuable direction for subsequent research. Finally, although the rural stations in this study have passed strict screening, their number is limited, and they may not be able to fully capture the subtle temperature changes under all the complex terrains and land use types around Xining. If future study can integrate more stations, it will help further verify the conclusion of this study on the definition of rural background temperature.

4. Conclusions

Leveraging dense station observations from summertime (2018–2023) in Xining, the largest city on the Tibetan Plateau, this study examines interactions between heatwaves and urban canopy heat islands across distinct heatwave types within moisture-limited high-altitude environments. The key findings:
  • It exhibited a mean urban canopy heat island intensity of 1.0 °C in Xining City over the past six years, with characteristic diurnal variability sustaining nocturnal peaks. An extreme urban canopy heat island peak (z-score: 3.0) is recorded on 28 July 2022, potentially linked to the concurrent record-breaking regional heatwave on the Tibetan Plateau.
  • While daytime heatwaves amplify hourly urban canopy heat island intensity with distribution shifts confirming extreme intensification, nighttime events suppress it through concentration toward lower intensities, whereas compound heatwaves drive a slightly increase, collectively demonstrating statistically significant distributional differences across all heatwave types. Crucially, heatwaves induce statistically negligible daytime urban canopy heat island intensity responses, they drive comparable-magnitude intensification and reduction in nocturnal urban canopy heat island intensity during daytime and nighttime heatwaves, respectively. Nocturnal urban canopy heat island intensity increases slightly during compound heatwave.
  • Heatwaves driven by different synoptic patterns have significantly altered the synergy at night. Daytime heatwaves, controlled by a 500 hPa anticyclone and characterized by cloudless, dry conditions, significantly amplify nocturnal urban canopy heat island intensity by accelerating rural radiative cooling. Conversely, nighttime heatwaves exhibit high cloud cover and humidity; clouds absorb and re-radiate surface longwave radiation, suppressing rural radiative cooling. Moreover, the impact of urban thermal storage modulated by cloud cover may also play a role in the interaction between heatwaves and urban canopy heat islands.
  • Our findings offer concrete implications for urban planning and public health strategies in Xining City. Against daytime/dry heatwaves: Urban cooling strategies should prioritize increasing surface albedo (e.g., promoting cool roofs and reflective pavements) and expanding green infrastructure (e.g., urban parks, green corridors). Against nighttime/humid heatwaves: Mitigation efforts should focus on improving urban ventilation through aerodynamic building design and preserving natural wind corridors. Early warning systems should also be tailored to different heatwave types, daytime heatwave warnings should emphasize the risk of prolonged nocturnal heat exposure in Xining City, guiding targeted protection for vulnerable populations.

Author Contributions

Conceptualization: X.L. and G.C.; methodology: X.L., S.Z. and Q.L.; investigation: G.C., X.L. and S.K.T.; visualization: G.C., X.L. and Q.L.; supervision: S.K.T.; writing—original draft: X.L. and S.K.T.; writing—review and editing: G.C. and S.K.T. All authors have read and agreed to the published version of the manuscript.

Funding

This study was supported by Qinghai Province Key Research and Development and Transformation Plan (2025-HZ-805) and Qinghai University Research Ability Enhancement Project (2025KTSA03).

Data Availability Statement

The ERA-5 reanalysis product used in this study is openly available in the Climate Data Store at https://cds.climate.copernicus.eu/datasets, accessed on 30 September 2025. The Global Artificial Impervious Areas dataset is openly accessible via the Peng Cheng Laboratory repository at https://data-starcloud.pcl.ac.cn/iearthdata/, accessed on 30 September 2025.

Acknowledgments

The authors gratefully acknowledge Guoyu Ren for his valuable suggestions regarding the logical structure of this article.

Conflicts of Interest

There are no relevant financial or non-financial competing interests to report.

References

  1. Chen, R.; Lu, R. Dry Tropical Nights and Wet Extreme Heat in Beijing: Atypical Configurations between High Temperature and Humidity. Mon. Weather Rev. 2014, 142, 1792–1802. [Google Scholar] [CrossRef]
  2. Ding, T.; Qian, W.; Yan, Z. Changes in hot days and heat waves in China during 1961–2007. Int. J. Climatol. 2010, 30, 1452–1462. [Google Scholar] [CrossRef]
  3. Sun, J. Record-breaking SST over mid-North Atlantic and extreme high temperature over the Jianghuai–Jiangnan region of China in 2013. Chin. Sci. Bull. 2014, 59, 3465–3470. [Google Scholar] [CrossRef]
  4. Chen, R.; Lu, R. Comparisons of the Circulation Anomalies Associated with Extreme Heat in Different Regions of Eastern China. J. Clim. 2015, 28, 5830–5844. [Google Scholar] [CrossRef]
  5. Deng, K.; Yang, S.; Ting, M.; Zhao, P.; Wang, Z. Dominant Modes of China Summer Heat Waves Driven by Global Sea Surface Temperature and Atmospheric Internal Variability. J. Clim. 2019, 32, 3761–3775. [Google Scholar] [CrossRef]
  6. Wu, Z.; Lin, H.; Li, J.; Jiang, Z.; Ma, T. Heat wave frequency variability over North America: Two distinct leading modes. J. Geophys. Res. Atmos. 2012, 117. [Google Scholar] [CrossRef]
  7. Zhang, T.; Jiang, X.; Chen, J.; Yang, S.; Deng, Y.; Wei, W.; Hu, P.; Gao, P. Interannual Variability of Springtime Extreme Heat Events over the Southeastern Edge of the Tibetan Plateau: Role of a Spring-Type Circumglobal Teleconnection Pattern. J. Clim. 2021, 34, 9915–9930. [Google Scholar] [CrossRef]
  8. Fischer, E.M.; Seneviratne, S.I.; Vidale, P.L.; Lüthi, D.; Schär, C. Soil Moisture–Atmosphere Interactions during the 2003 European Summer Heat Wave. J. Clim. 2007, 20, 5081–5099. [Google Scholar] [CrossRef]
  9. Ford, T.W.; Dirmeyer, P.A.; Benson, D.O. Evaluation of heat wave forecasts seamlessly across subseasonal timescales. NPJ Clim. Atmos. Sci. 2018, 1, 20. [Google Scholar] [CrossRef]
  10. Qiao, L.; Zuo, Z.; Zhang, R.; Piao, S.; Xiao, D.; Zhang, K. Soil moisture–atmosphere coupling accelerates global warming. Nat. Commun. 2023, 14, 4908. [Google Scholar] [CrossRef]
  11. Zhou, T. The dry-hot feedback between soil moisture and atmosphere and the accelerated global warming. Sci. China Earth Sci. 2024, 67, 890–891. [Google Scholar] [CrossRef]
  12. Zhang, T.; Deng, G.; Liu, X.; He, Y.; Shen, Q.; Chen, Q. Heatwave magnitude quantization and impact factors analysis over the Tibetan Plateau. NPJ Clim. Atmos. Sci. 2025, 8, 2. [Google Scholar] [CrossRef]
  13. Gui, K.; Zhou, T.; Zhang, W.; Zhang, X. Land-atmosphere coupling amplified the record-breaking heatwave at altitudes above 5000 meters on the Tibetan Plateau in July 2022. Weather Clim. Extremes 2024, 45, 100717. [Google Scholar] [CrossRef]
  14. Chen, W.; Yao, T.; Zhang, G.; Woolway, R.I.; Yang, W.; Xu, F.; Zhou, T. Glacier Surface Heatwaves Over the Tibetan Plateau. Geophys. Res. Lett. 2023, 50, e2022GL101115. [Google Scholar] [CrossRef]
  15. Chen, R.; Lu, R. Large-scale circulation anomalies associated with ‘tropical night’ weather in Beijing, China. Int. J. Climatol. 2014, 34, 1980–1989. [Google Scholar] [CrossRef]
  16. Hong, J.-S.; Yeh, S.-W.; Seo, K.-H. Diagnosing Physical Mechanisms Leading to Pure Heat Waves Versus Pure Tropical Nights Over the Korean Peninsula. J. Geophys. Res. Atmos. 2018, 123, 7149–7160. [Google Scholar] [CrossRef]
  17. Jong-Kil, P.; Riyu, L.U.; Chaofan, L.I.; Byul, K.I.M.E. Interannual Variation of Tropical Night Frequency in Beijing and Associated Large-Scale Circulation Background. Adv. Atmos. Sci. 2012, 29, 295–306. [Google Scholar]
  18. Thomas, N.P.; Bosilovich, M.G.; Collow, A.B.M.; Koster, R.D.; Schubert, S.D.; Dezfuli, A.; Mahanama, S.P. Mechanisms Associated with Daytime and Nighttime Heat Waves over the Contiguous United States. J. Appl. Meteorol. Climatol. 2020, 59, 1865–1882. [Google Scholar] [CrossRef]
  19. Li, Y.; Ding, Y.; Liu, Y. Mechanisms for regional compound hot extremes in the mid-lower reaches of the Yangtze River. Int. J. Climatol. 2021, 41, 1292–1304. [Google Scholar] [CrossRef]
  20. Wu, S.; Luo, M.; Zhao, R.; Li, J.; Sun, P.; Liu, Z.; Wang, X.; Wang, P.; Zhang, H. Local mechanisms for global daytime, nighttime, and compound heatwaves. NPJ Clim. Atmos. Sci. 2023, 6, 36. [Google Scholar] [CrossRef]
  21. Sun, Y.; Zhang, X.; Ren, G.; Zwiers, F.W.; Hu, T. Contribution of urbanization to warming in China. Nat. Clim. Change 2016, 6, 706–709. [Google Scholar] [CrossRef]
  22. Tysa, S.K.; Ren, G.; Qin, Y.; Zhang, P.; Ren, Y.; Jia, W.; Wen, K. Urbanization Effect in Regional Temperature Series Based on a Remote Sensing Classification Scheme of Stations. J. Geophys. Res. Atmos. 2019, 124, 10646–10661. [Google Scholar] [CrossRef]
  23. Yang, X.; Chen, B.; Hu, K. A review of impacts of urbanization on extreme heat events. Prog. Geogr. 2015, 34, 1219–1228. (In Chinese) [Google Scholar]
  24. Ao, X.; Tan, J.; Zhi, X.; Guo, J.; Lu, Y.; Liu, D. Synergistic interaction between urban heat island and heat waves and its impact factors in Shanghai. Acta Geogr. Sin. 2019, 74, 1789–1802. (In Chinese) [Google Scholar]
  25. Founda, D.; Santamouris, M. Synergies between Urban Heat Island and Heat Waves in Athens (Greece), during an extremely hot summer (2012). Sci. Rep. 2017, 7, 10973. [Google Scholar] [CrossRef]
  26. Jiang, S.; Lee, X.; Wang, J.; Wang, K. Amplified Urban Heat Islands during Heat Wave Periods. J. Geophys. Res. Atmos. 2019, 124, 7797–7812. [Google Scholar] [CrossRef]
  27. Ramamurthy, P.; Bou-Zeid, E. Heatwaves and urban heat islands: A comparative analysis of multiple cities. J. Geophys. Res. Atmos. 2017, 122, 168–178. [Google Scholar] [CrossRef]
  28. Xue, J.; Zong, L.; Yang, Y.; Bi, X.; Zhang, Y.; Zhao, M. Diurnal and interannual variations of canopy urban heat island (CUHI) effects over a mountain–valley city with a semi-arid climate. Urban Clim. 2023, 48, 101425. [Google Scholar] [CrossRef]
  29. Chew, L.W.; Liu, X.; Li, X.-X.; Norford, L.K. Interaction between heat wave and urban heat island: A case study in a tropical coastal city, Singapore. Atmos. Res. 2021, 247, 105134. [Google Scholar] [CrossRef]
  30. Richard, Y.; Pohl, B.; Rega, M.; Pergaud, J.; Thevenin, T.; Emery, J.; Dudek, J.; Vairet, T.; Zito, S.; Chateau-Smith, C. Is Urban Heat Island intensity higher during hot spells and heat waves (Dijon, France, 2014–2019)? Urban Clim. 2021, 35, 100747. [Google Scholar] [CrossRef]
  31. Rogers, C.D.W.; Gallant, A.J.E.; Tapper, N.J. Is the urban heat island exacerbated during heatwaves in southern Australian cities? Theor. Appl. Climatol. 2019, 137, 441–457. [Google Scholar] [CrossRef]
  32. Scott, A.A.; Waugh, D.W.; Zaitchik, B.F. Reduced Urban Heat Island intensity under warmer conditions. Environ. Res. Lett. 2018, 13, 064003. [Google Scholar] [CrossRef]
  33. Feinberg, A. Urban Heat Island High Water-Vapor Feedback Estimates and Heatwave Issues: A Temperature Difference Approach to Feedback Assessments. Sci 2022, 4, 44. [Google Scholar] [CrossRef]
  34. Shi, Z.; Jia, G. Changes in urban heat island intensity during heatwaves in China. Environ. Res. Lett. 2024, 19, 074061. [Google Scholar] [CrossRef]
  35. Zhao, L.; Oppenheimer, M.; Zhu, Q.; Baldwin, J.W.; Ebi, K.L.; Bou-Zeid, E.; Guan, K.; Liu, X. Interactions between urban heat islands and heat waves. Environ. Res. Lett. 2018, 13, 034003. [Google Scholar] [CrossRef]
  36. Luo, Y.; Yang, S.; Zhang, T.; Yu, Y.; Luo, M.; Xu, L. Distinctive local and large-scale processes associated with daytime, nighttime and compound heatwaves in China. Weather Clim. Extrem. 2025, 47, 100749. [Google Scholar] [CrossRef]
  37. Liu, Z.; Liu, S.; Qi, W.; Jin, H. The settlement intention of floating population and the factors in Qinghai-Tibet Plateau: An analysis from the perspective of short-distance and long-distance migrants. Acta Geogr. Sin. 2021, 76, 2142–2156. [Google Scholar]
  38. Zuo, Y.; Zhang, C.; Lin, Z.; Mao, F.; Liu, S.; Liu, Z. A Multi-scale evaluation study on the shading effects of street trees at noon in summer in Xining City. Acta Ecol. Sin. 2025, 45, 4728–4742. [Google Scholar]
  39. Gong, P.; Li, X.; Wang, J.; Bai, Y.; Chen, B.; Hu, T.; Liu, X.; Xu, B.; Yang, J.; Zhang, W. Annual maps of global artificial impervious area (GAIA) between 1985 and 2018. Remote Sens. Environ. 2020, 236, 111510. [Google Scholar] [CrossRef]
  40. Oke, T.R.; Mills, G.; Christen, A.; Voogt, J. Urban Climates; Cambridge University Press: Cambridge, UK, 2017. [Google Scholar]
  41. Arnfield, A.J. Two decades of urban climate research: A review of turbulence, exchanges of energy and water, and the urban heat island. Int. J. Climatol. 2003, 23, 1–26. [Google Scholar] [CrossRef]
  42. Hardin, A.W.; Liu, Y.; Cao, G.; Vanos, J.K. Urban heat island intensity and spatial variability by synoptic weather type in the northeast U.S. Urban Clim. 2018, 24, 747–762. [Google Scholar] [CrossRef]
  43. Wang, N.; Chen, J.; He, T.; Xu, X.; Liu, L.; Sun, Z.; Qiao, Z.; Han, D. Understanding the differences in the effect of urbanization on land surface temperature and air temperature in China: Insights from heatwave and non-heatwave conditions. Environ. Res. Lett. 2023, 18, 104038. [Google Scholar] [CrossRef]
  44. Kim, D.-H.; Park, K.; Baik, J.-J.; Jin, H.-G.; Han, B.-S. Contrasting interactions of urban heat islands with dry and moist heat waves and their implications for urban heat stress. Urban Clim. 2024, 56, 102050. [Google Scholar] [CrossRef]
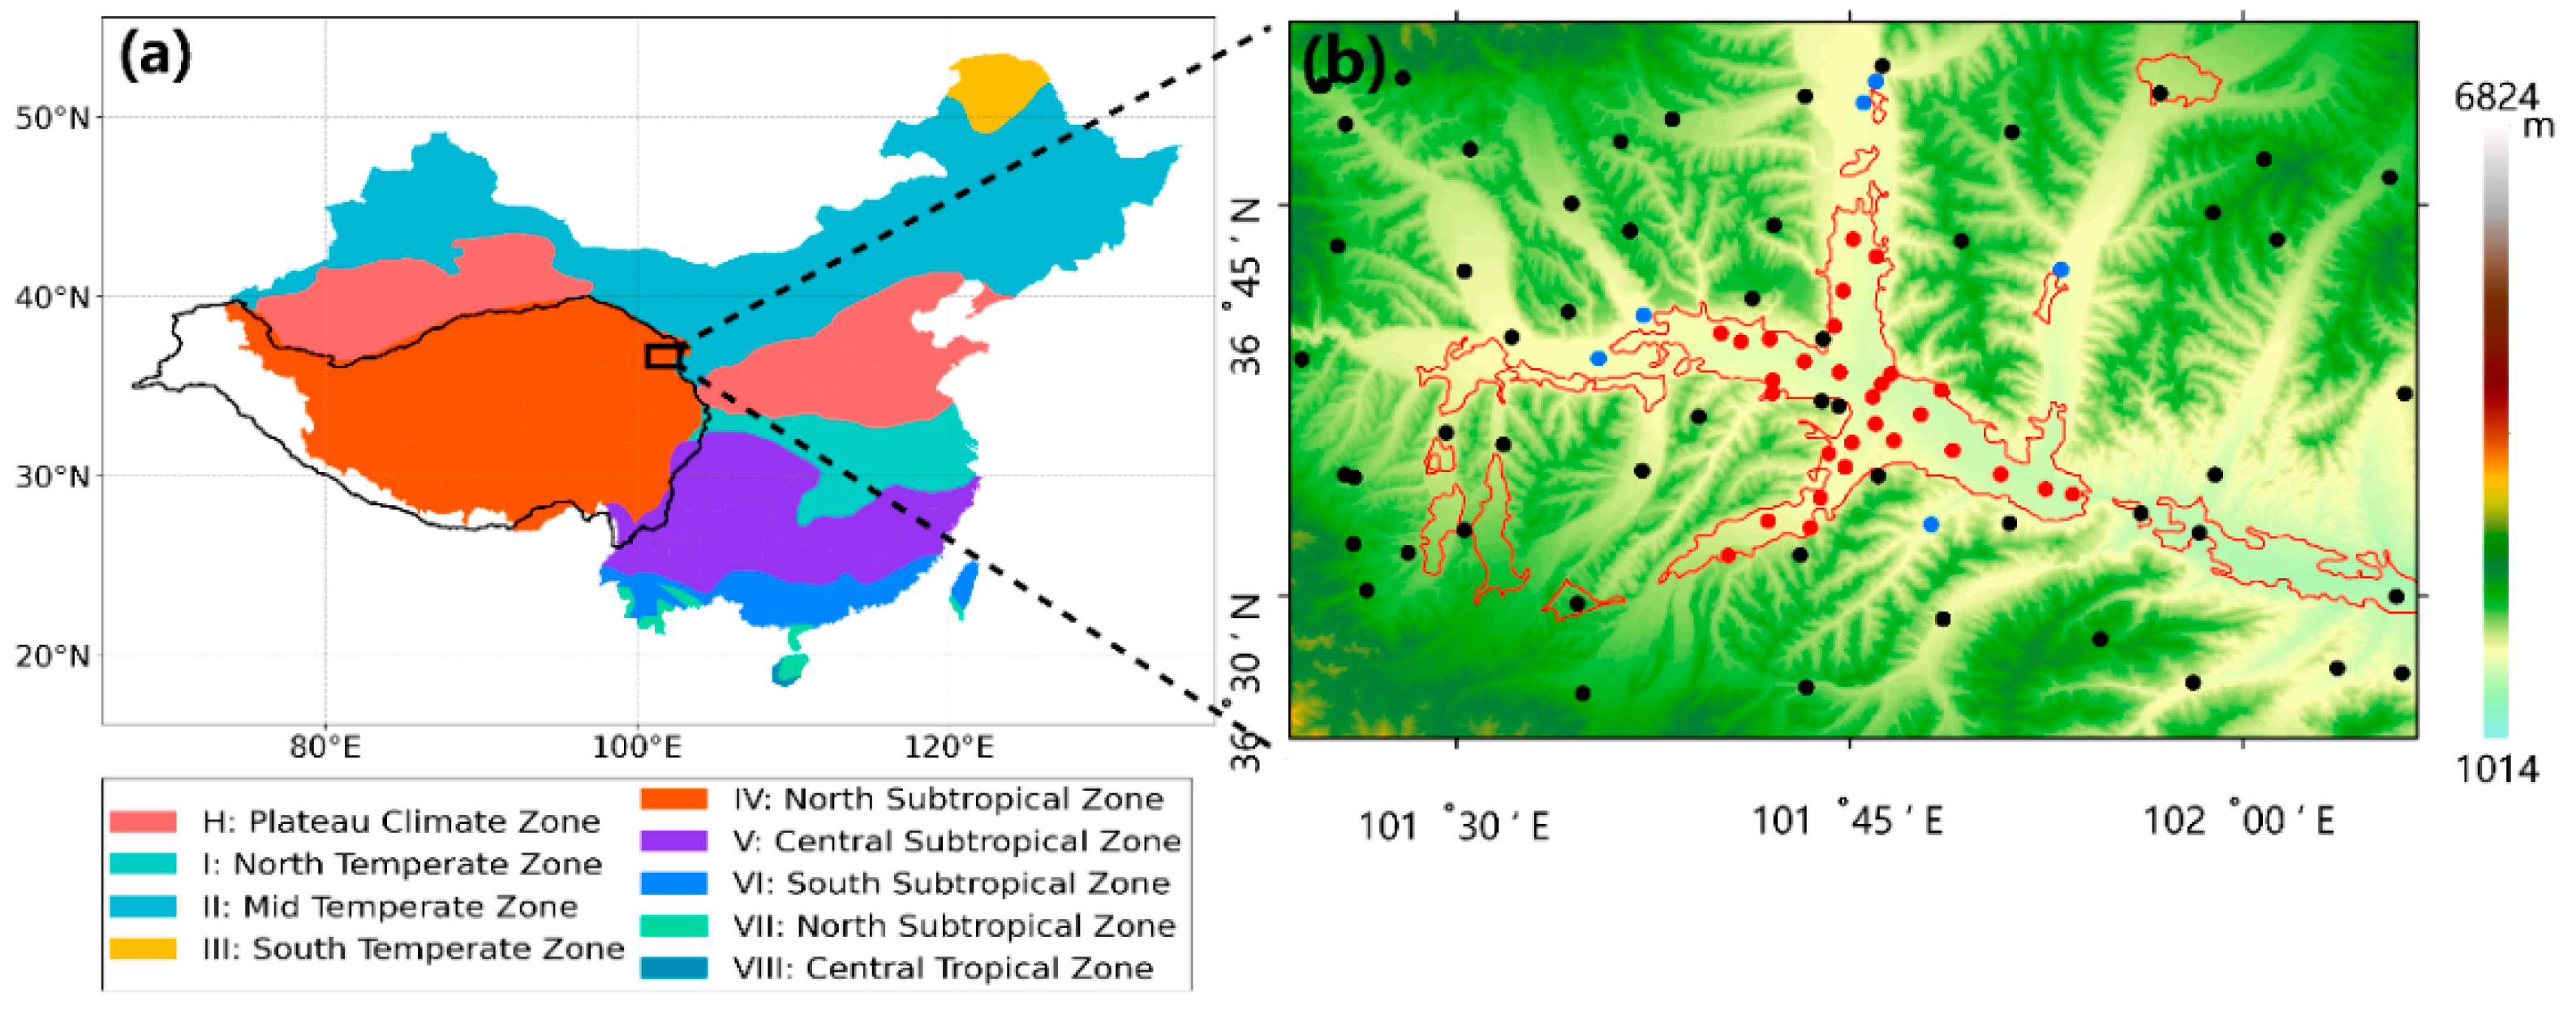
Figure 1. (a) Climate zoning in China (shading) and the boundary line of the TP (black line). (b) Observational stations around Xining City (dots) and elevation (shading). Urban stations: red dots; rural stations: blue dots; other stations: black dots. The red line delineating the 2018 artificial impervious areas boundary.
Land 14 02033 g001
Figure 2. The flowchart of methodology.
Land 14 02033 g002
Figure 3. (af) Daily mean UCHII during the period of 2018–2023. The black dotted line shows the 6-year UCHII average. Black bars represent non-heatwave days, and red, blue and green bars represent daytime, nighttime and compound heatwaves. The right-top black box displays the annual UCHII average.
Land 14 02033 g003
Figure 4. Diurnal variation in UCHII for 6 years (solid curve, 5-points smooth) and 2022 (dash line, 5-points smooth) over the Xining City. Unit: °C.
Land 14 02033 g004
Figure 5. The UCHII at the station with different urban land use ratio.
Land 14 02033 g005
Figure 6. Spatial distribution of total count for summer daytime, nighttime and compound (ac) heatwave over the TP, 2018–2023. The green line represents the boundary line of the TP.
Land 14 02033 g006
Figure 7. Cumulative distribution function of UCHII during heatwave (red curve) and non-heatwave (blue curve) (daytime, nighttime and compound, (ac)), and the p values is calculated based on Kolmogorov–Smirnov test.
Land 14 02033 g007
Figure 8. Diurnal variation in UCHII during heatwave (red curve) and non-heatwave (blue curve) periods, and their differences (yellow curve) (daytime, nighttime and compound, (ac)). The shading area and black line represent standard deviation and zero line, respectively.
Land 14 02033 g008
Figure 9. Composite anomalies of 500 hPa geopotential height (shading; units: gpm) and horizontal wind (vectors; units: m s−1) for the daytime, nighttime and compound heatwaves (ac). White dots and black vectors denote passing the 0.05 significance level. TP is outlined by green solid line.
Land 14 02033 g009
Figure 10. Composite anomalies of daytime (1200 UTC+8, (ae)) and nighttime (2300 UTC+8, (df)) total cloud cover for the daytime (a,d), nighttime (b,e) and compound (c,f) heatwaves. Black dots denote passing the 0.05 significance level. units: %. TP is outlined by green solid line.
Land 14 02033 g010
Figure 11. Composite anomalies of water vapor flux (vectors) and specific humidity (shading) at 700 hPa for the daytime, nighttime and compound heatwaves (ac). Red dots and black vectors denote passing the 0.05 significance level. Units: g/kg. TP is outlined by green solid line.
Land 14 02033 g011
Disclaimer/Publisher’s Note: The statements, opinions and data contained in all publications are solely those of the individual author(s) and contributor(s) and not of MDPI and/or the editor(s). MDPI and/or the editor(s) disclaim responsibility for any injury to people or property resulting from any ideas, methods, instructions or products referred to in the content.