Article

The Human–Nature Paradox: Spatiotemporal Coupling and Drivers of Habitat Quality and Human Footprint in China

1
Tourism College, Xinyang Normal University, Xinyang 464000, China
2
Department of Geography, School of Geography and Information Engineering, China University of Geosciences, Wuhan 430078, China
*
Author to whom correspondence should be addressed.
Land 2025, 14(10), 2089; https://doi.org/10.3390/land14102089
Submission received: 15 September 2025 / Revised: 14 October 2025 / Accepted: 16 October 2025 / Published: 20 October 2025

Abstract

Human activities inevitably lead to drastic transformations in land use, thereby significantly impacting natural ecosystems. As a crucial indicator of ecosystem health, habitat quality (HQ) provides appropriate conditions for human survival and development. Elucidating the relationships between human activities and HQ can offer scientific insights into the sustainability of socioeconomic development and ecological environmental protection. Although numerous studies have focused on the correlations between human activities and HQ at various scales, analysis on the interactive coercive relationship between human activities and HQ at the county level in China remains limited. Therefore, we employed the human footprint (HFP) to characterize human activities and the InVEST model to assess HQ, then applied the coupling coordination degree (CCD) model and GeoDetector to identify their interactive coercive relationship and driving factors in China. The results show that the average HQ in China was 0.555, 0.551, 0.547, 0.538, and 0.531 in 2000, 2005, 2010, 2015, and 2020, respectively, showing a declining trend. Furthermore, the average HFP during the same period was 18.3, 18.9, 19.3, 20.1, and 21.6, reflecting an opposite trend. The CCD between HQ and HFP increased continuously from 0.644 in 2000 to 0.659 in 2020 at the county level in China, indicating a highly coupled state with an improving trend. In terms of driving factors, land use intensity was the primary driver of the CCD between HQ and HFP, followed by precipitation, temperature, and night-time light. Notably, the driving force of natural environmental factors showed a declining trend while that of socioeconomic factors increased, and the interaction between natural and socioeconomic factors strengthened. These findings provide important scientific guidance for county-level economic development and ecological environmental protection in China.

1. Introduction

With the rapid growth of the global population, there are inevitable changes in land use patterns, profound effects on terrestrial biogeochemical cycles, and pressure on the biosphere that is increasing at an accelerating rate [1,2,3]. Despite extensive efforts to mitigate the impact of human interference on ecosystems, the degradation of global ecosystems and habitat destruction caused by human activities remain severe [4,5]. The Global Biodiversity Framework and the United Nations Sustainable Development Goals (SDGs) have repeatedly emphasized the critical importance of biodiversity for human well-being, planetary health, economic growth, and sustainable development [1]. These initiatives have also prompted countries worldwide to establish protected areas to address current biodiversity challenges and to develop policies aimed at reversing the loss of biodiversity and sustaining human well-being [6,7]. However, fully understanding the impacts of human disturbance on terrestrial ecosystems remains a significant challenge.
Habitat quality (HQ) is an important indicator of the health of terrestrial ecosystems and represents the ability of an ecosystem to provide favorable conditions for the survival and development of organisms across different times and spaces [4,8,9]. It plays a significant role in protecting biodiversity, balancing the supply and demand of ecosystem services, and establishing an ecological security pattern [10,11,12]. To evaluate the HQ in different regions, representative evaluation models have emerged, including, MaxEnt (Maximum Entropy Model) [13], HSI (Habitat Suitability Index) [14], SolVES (Social Values for Ecosystem Services) [15], and the InVEST model [4,16], among others. Moreover, there has been a significant increase in research on driving factor analysis and future scenario simulation, prediction, and optimization regarding HQ [4,17,18]. With the continuous advancement of science and technology, many scholars have begun to utilize multi-source remote sensing data and ecological modeling techniques to assess the spatiotemporal evolution characteristics of HQ at the regional, national, and even global scales [4,19]. Notably, the InVEST model has been widely applied in regional, national, and global HQ studies due to its comprehensive functionality, high accuracy, broad applicability, and result visualization capabilities [4,20,21]. Furthermore, the model includes a wide range of additional tools, such as carbon storage, water yield, and soil retention modules [22,23]. As a result, the InVEST model has been well validated in global ecosystem research.
However, against the backdrop of intensifying human activities, global HQ has widely degraded [20,24]. Generally, increased human activity is a significant factor leading to the decline in HQ. For instance, the concentration of construction land, population agglomeration, and cropland consolidation are key manifestations of human activities, which directly impact the ecosystem processes in specific regions, thereby affecting HQ [20,25]. The growing frequency and intensity of human activities have severely compromised the effectiveness of HQ, especially in countries such as China, which are experiencing rapid population and economic growth [4]. Therefore, understanding the spatiotemporal evolution relationship between HQ and human activities, as well as its driving mechanisms, is of great significance for guiding scientific ecosystem management and the precise formulation and implementation of relevant policies.
To further clarify the complex relationships between HQ and human activities, scientists have conducted extensive research. For example, assessments of human activities have been performed based on single indicators, such as urbanization level [26], land use change [27], and human activity intensity (e.g., night-time light) [28]. However, single indicators often fail to comprehensively capture the fundamental spatiotemporal dynamics of human activities. Consequently, in recent years, many researchers have leveraged advancements in 3S technology and data modeling to develop more comprehensive and systematic composite indicators for human activities. Sanderson et al. were among the first to use remote sensing imagery to map the global human footprint (HFP) [29]—an approach that has been further refined in subsequent studies [30]. As a comprehensive assessment method for analyzing the intensity of human disturbance, HFP demonstrates significant advantages in reflecting the pressures exerted by natural landscape changes on ecological processes and the environment [30,31]. HFP surpasses traditional land cover/use assessments or single indicators by comprehensively evaluating the impacts of multiple factors, such as construction land, population density, night-time light, roads, and croplands [29,30]. This approach enables a more holistic understanding of anthropogenic influences and is regarded as a major advancement in mapping human pressures. Nevertheless, due to variations in economic activities and population distributions across different regions, the accuracy and applicability of these assessment indicators require further improvement. To better accommodate regional human activity assessments, numerous scholars have adaptively adjusted aspects such as indicator selection, the range of individual pressure values, and threshold standards while exploring diverse HFP mapping methodologies [30,31,32,33]. The global HFP dataset developed by Mu et al., with its advantages of long-term and continuous coverage, has been widely adopted [34,35]. At present, the HFP index is widely used to analyze the impacts of human activities on ecosystem services, ecosystem health, ecological security, and HQ at various scales [3,35,36,37].
The negative impact of human activities on HQ has been demonstrated in numerous studies [37,38,39]. With societal development, achieving a balance between human activities and ecological conservation has become a critical concern for nations promoting economic growth and enhancing living conditions. The question of balancing the relationship between human activities and HQ has emerged as a significant challenge faced by countries worldwide. In this context, clarifying the complex coupling and coordination relationship between HQ and HFP, as well as its driving factors, is of great importance for formulating national economic development plans, biodiversity conservation strategies, and ecological security policies. Domestically and internationally, scholarly research continues to yield findings on ecological conservation, the intensity of human activities, and their coupling and coordination relationships [4,40]. To better explore the interactions, feedback mechanisms, and multiscale dynamics between human activities and natural ecosystems, numerous coupled models have been employed. Commonly used coupling methods include the Environmental Kuznets Curve (EKC) [41], Pressure–State–Response (PSR) models, and the coupling coordination degree (CCD) model [37], among others. This study employs the widely used CCD model to assess the CCD between the HFP and HQ.
In terms of driving factors, the spatiotemporal evolution of HQ is influenced by various factors, including natural environmental factors (such as terrain, climate, and vegetation) and socioeconomic factors (such as population density and economic development). Researchers often employ Ordinary Least Squares (OLS) and Geographically Weighted Regression (GWR) for single-factor analysis [42,43], or they utilize GeoDetector [44] to examine two-factor interactions, thereby assessing individual or combined influences. However, studies on the drivers of the CCD between HFP and HQ remain relatively scarce. Given the complex CCD between HQ and HFP, we adopt the widely used GeoDetector method to explore the individual and interactive effects of natural environmental and socioeconomic factors on their CCD.
Previous studies have indicated that research conclusions may vary across different scales. This study aims to fill this gap by examining the spatial relationship between HQ and HFP at the county level in China. China is the largest developing country in the world, with a population exceeding 1.4 billion. Its urbanization rate is significantly higher than the global average, and it has a vast land area with complex geographical and climatic conditions. These characteristics make China a representative region for studying human–land interactions. Since 1978, China has implemented a series of regional development strategies, gradually leading to an uneven spatial development pattern. Meanwhile, the intensification of human activities, the exacerbation of climate change, and other factors have jointly impacted China’s HQ. To address the ongoing degradation of HQ, the Chinese government has made significant efforts, such as establishing nature reserves and biodiversity conservation priority areas. However, substantial work remains to be carried out in this regard. In summary, this study was conducted using the county-level administrative units in China, delving into the spatio-temporal coupling relationship between HQ and HFP and the driving factors, with the aim of providing scientific recommendations for policymakers to formulate effective ecological conservation policies in the future. The study explores the following three questions: (1) What was the spatiotemporal evolution patterns of HQ and HFP in China from 2000 to 2020? (2) How can the spatial relationships and CCD between HQ and HFP be assessed? (3) What are the driving factors influencing the CCD between HQ and HFP?

2. Materials and Methods

2.1. Study Area

China has complex terrain features, with an elevation trend of high in the west and low in the east. In addition, based on the characteristics of agricultural production climate, terrain, and administrative boundaries, China’s agricultural development can be divided into nine major agricultural regions (Figure 1). Since the implementation of reform and opening-up policies, China has undergone large-scale economic development and urban expansion. The per capita GDP increased from 381 yuan (approximately 155 US dollars) in 1978 to 72,447 yuan (approximately 10,504 US dollars) in 2020. During the same period, the net population growth reached 450 million, while the urbanization rate rose from 19.92% in 1978 to 63.89% in 2020. Consequently, China’s development over recent decades have been remarkable, with growth rates far exceeding the global average. However, this rapid economic expansion has also brought about a series of challenges, including regional development disparities and ecological environmental degradation. The rapid population growth, land urbanization, and significant regional inequalities in China have led to profound transformations in land use patterns and severe HQ deterioration. In response, China has proposed a strategy for high-quality economic development, aiming to comprehensively build a modern socialist country and promote sustained and healthy economic and social progress. Against this backdrop of pursuing high-quality economic development, it is particularly important to conduct in-depth exploration of the relationships between human activities and HQ.

2.2. Data Sources and Preprocessing

2.2.1. Land Use Data

This study utilized the China Land Cover Dataset from 2000 to 2020, provided on the Google Earth Engine (GEE) platform (Table 1). The dataset was developed by Professor Huang Xin from Wuhan University, who generated China’s annual land cover maps using 335,709 Landsat images available on GEE [45]. In this research, land use was classified into nine major categories: Forest, Shrub, Grassland, Cropland, Construction land, Wetland, Snow/Ice, Water, and Barren. Compared with an actual field survey and records, the overall accuracy of this dataset is 79.31% [45].

2.2.2. HFP Data

To investigate the spatiotemporal distribution of the HFP in China and its CCD’s relationship with HQ, we selected the global HFP data provided by Mu et al. (2022) [31], which were obtained from the corresponding website (Table 1). This dataset demonstrates high consistency with the global HFP datasets developed by Venter and Williams et al., with correlation coefficients of 0.72 and 0.93, respectively [31,32,33]. It has been widely applied in studies focusing on human–nature interactions [37,46,47]. The temporal scope of the data spans from 2000 to 2020, corresponding to the period of HQ analysis. Finally, the zonal statistics tool in ArcGIS 10.8 was employed to derive the average HFP values for each county in China for the respective years.

2.2.3. Driving Factor Data

Based on the current state of research in related fields [35,43], we selected nine factors from both natural environmental and socioeconomic dimensions to characterize the driving factors influencing the CCD between HQ and HFP. The natural environmental factors include the following: the Digital Elevation Model (DEM), slope, annual average precipitation, annual average temperature, and Normalized Difference Vegetation Index (NDVI). The socioeconomic factors include the following: population density, GDP, night-time lights, and land use intensity (LUI). As the driving factor analysis in this study was conducted at the county level, the zonal statistics tool in ArcGIS 10.8 was employed to aggregate all driving factors to the county-level administrative units by calculating their mean values for further analysis. The data sources and acquisition methods for the relevant driving factors are summarized in Table 1.
Table 1. Driving factors data.
Data TypeUtilization Data SourceWebsiteAccuracy
Land use dataCalculate HQNational Cryosphere Desert Data Center https://www.ncdc.ac.cn/portal/ (accessed on 15 December 2024)30 m
Human footprint DataCalculate HFPUrban Environmental Monitoring and Modeling (UEMM) team of China Agricultural Universityhttps://figshare.com/articles/dataset/_b_Tracking_spatiotemporal_dynamics_of_crop-specific_areas_through_machine_learning_and_statistics_disaggregating_b_/26028769 (accessed on 15 December 2024)1 km
Natural environment dataDigital Elevation Model (DEM, X1) and slope (X2)Geospatial Data Cloudhttp://www.gscloud.cn/ (accessed on 15 December 2024)30 m
Annual average temperature (X3) and Annual average precipitation (X4)National Tibetan Plateau Data Center https://data.tpdc.ac.cn/zh-hans/ (accessed on 15 December 2024)1 km
Normalized Difference Vegetation Index (NDVI, X5)EARTHDATA https://www.earthdata.nasa.gov/ (accessed on 15 December 2024)500 m
Socioeconomic data Population density (X6)LANDSCANS https://landscan.ornl.gov/ (accessed on 15 December 2024)1 km
Night-time lights (X7)National Earth System Science Data Center http://www.geodata.cn/ (accessed on 15 December 2024)500 m
Gross domestic product (GDP, X8)Resource and Environmental Science Data Platform https://www.resdc.cn/Default.aspx (accessed on 15 December 2024)1 km
Calculate land use intensity (LUI, X9) [48]National Cryosphere Desert Data Center https://www.ncdc.ac.cn/portal/ (accessed on 15 December 2024)30 m

2.3. Evaluation Analysis Module

2.3.1. InVEST-HQ Model

Developed by Stanford University, the InVEST model is designed to quantify multiple aspects of ecosystem services and offers distinct advantages in assessing HQ and supporting land use planning [49]. The HQ module utilizes land use/land cover data, incorporating the sensitivity of habitat types to threat factors, the distance between habitats and threat sources, the intensity of external threats, and spatial weighting to evaluate HQ across different regions. The impact of threat factors on HQ varies due to differences between threat sources and habitats. For instance, the influence of threats gradually diminishes as the distance between habitats and threat sources increases. Additionally, different habitat types exhibit varying sensitivities to threat factors; the higher the sensitivity of a habitat to a specific threat, the greater the impact it experiences. Following the InVEST manual and relevant studies [4,35,49], this study selected construction land, cropland, and barren land as the threat factors. Based on previous research, combined with the InVEST model usage guide and the current situation in China’s counties, a table for estimating habitat threat factors and related parameters (Table 1) was constructed, as well as a table for assessing the sensitivity of threat factors (Table 2) [4,37,49,50]. These parameters were proposed by Xue et al. (2024, 2025) and determined through exploratory ensemble modeling methods and expert knowledge scoring approaches [4,37]. Furthermore, these parameters have been validated as effective for HQ assessment using the InVEST model in China. Table 2 and Table 3 provide detailed parameters for the sensitivity of each habitat type to these threats and the corresponding threat factors. The influence of threat sources on habitats decreases with distance, which can be described using either linear or exponential decay functions [4,49]. Accordingly, both linear and exponential decay approaches were employed to calculate the impact of threat sources. The specific calculation formulas are as follows:
H Q x j = H j 1 D x j z / ( D x j z + k z )
where H Q x j indicates the HQ of county x within land use type j, with values ranging from 0 to 1; H j indicates the assigned HQ score for land use j. The parameter k, representing the half-saturation constant, was fixed at 0.5 in this research. To account for spatial variability, a scaling factor z (commonly set to 2.5) was applied. Additionally, D x j quantifies the level of habitat degradation under external pressures.
D x j = r = 1 n y = 1 m w r / r = 1 n w r   ×   r y   ×   i r x y   ×   β x   ×   S j r
where n refers to the total count of stress factors, while m signifies the number of impacted counties. The weighting coefficient for stressor r is given by w r , and r y denotes the intensity of stressor r at location y. β x measures the accessibility (or resistance) of county x, and S j r quantifies how sensitive habitat j is to stressor r.
i r x y = 1 d x y / d r m a x ( Linear )   exp 2.99 d x y / d r m a x ( Exponential )
where i r x y quantifies the effect of stressor r y originating from grid cell y on target habitat cell x. The variable d x y represents the linear distance between cells x and y, while d r m a x indicates the maximum effective range of stressor r. As shown in Equation (3), the calculation of i r x y follows distinct procedures for linear and exponential decay functions.

2.3.2. CCD Model

The CCD model is a mathematical model that is widely applied in multiple disciplines to evaluate the interactions between two or more systems [51,52]. Based on the dynamic behaviors and relationships among systems, it quantitatively analyzes their correlations and coordinated development status. In this study, the CCD model is used to quantitatively reflect the interaction and synergistic effects between HQ and HFP at the county level in China, enabling a more direct exploration of the coupling relationships between these systems. The calculation formula is as follows:
C = f ( x ) × g ( x ) ( f x + g ( x ) ) / 2
T = α f x + β g ( x )
D = C × T
where C denotes the degree of coupling between HQ and HFP, while f x and g ( x ) represent the standardized values of HQ and HFP, respectively. T serves as an integrated coordination index assessing their interaction. The parameters α and β are weighting coefficients, though their exact values lack consensus in existing research. Given that HQ and HFP contribute similarly to system development in this study, both coefficients were assigned equal weights of 0.5. Additionally, D quantifies the CCD of the two systems, ranging from 0 to 1. To further investigate the spatiotemporal evolution of the CCD between the HFP and HQ systems, we classified the CCD into five levels based on previous research [37] using the natural breaks method: very low (<0.41), low (0.41–0.56), medium (0.56–0.64), high (0.64–0.69), and very high (>0.69).

2.3.3. GeoDetector

The GeoDetector model, developed by Wang and Xu (2017), is a widely used tool for geospatial data analysis [44,53,54]. This model is employed to identify ecological phenomena and uncover underlying driving factors, enabling not only the quantification of single-factor explanatory power but also the examination of interactive effects between two factors on target variables. Therefore, this study utilizes the factor detector and interaction detector modules of the GeoDetector model to assess the individual explanatory power and two-factor interactions of nine driving factors influencing the CCD between HQ and HFP in China. First, the zonal statistics function in ArcGIS was applied to aggregate natural environmental and socioeconomic raster data, calculating the average values of influencing factors for each county in China. Subsequently, each driving factor was discretized using the natural breaks, equal interval, quantile, geometric interval, and standard deviation methods. Then, the factor and interaction detector modules of the GeoDetector model were used to analyze the response relationships among different variables, thereby detecting the impact of each driving factor on HQ. Finally, we selected the natural breaks method for analysis, as it is both commonly used and yields favorable q-values and statistical significance. The calculation method for the q-statistic is as follows:
q = 1 h = 1 L N h σ h 2 N σ 2
where q represents the influence of the driving factor, while h denotes the stratification level of both the driving factor and HQ. The terms σ h and σ indicate the standard deviations for stratum h and the whole study area, respectively. Additionally, N and N refer to the total units within stratum h and the entire region, respectively.

3. Results

3.1. Spatiotemporal Patterns of HQ in China from 2000 to 2020

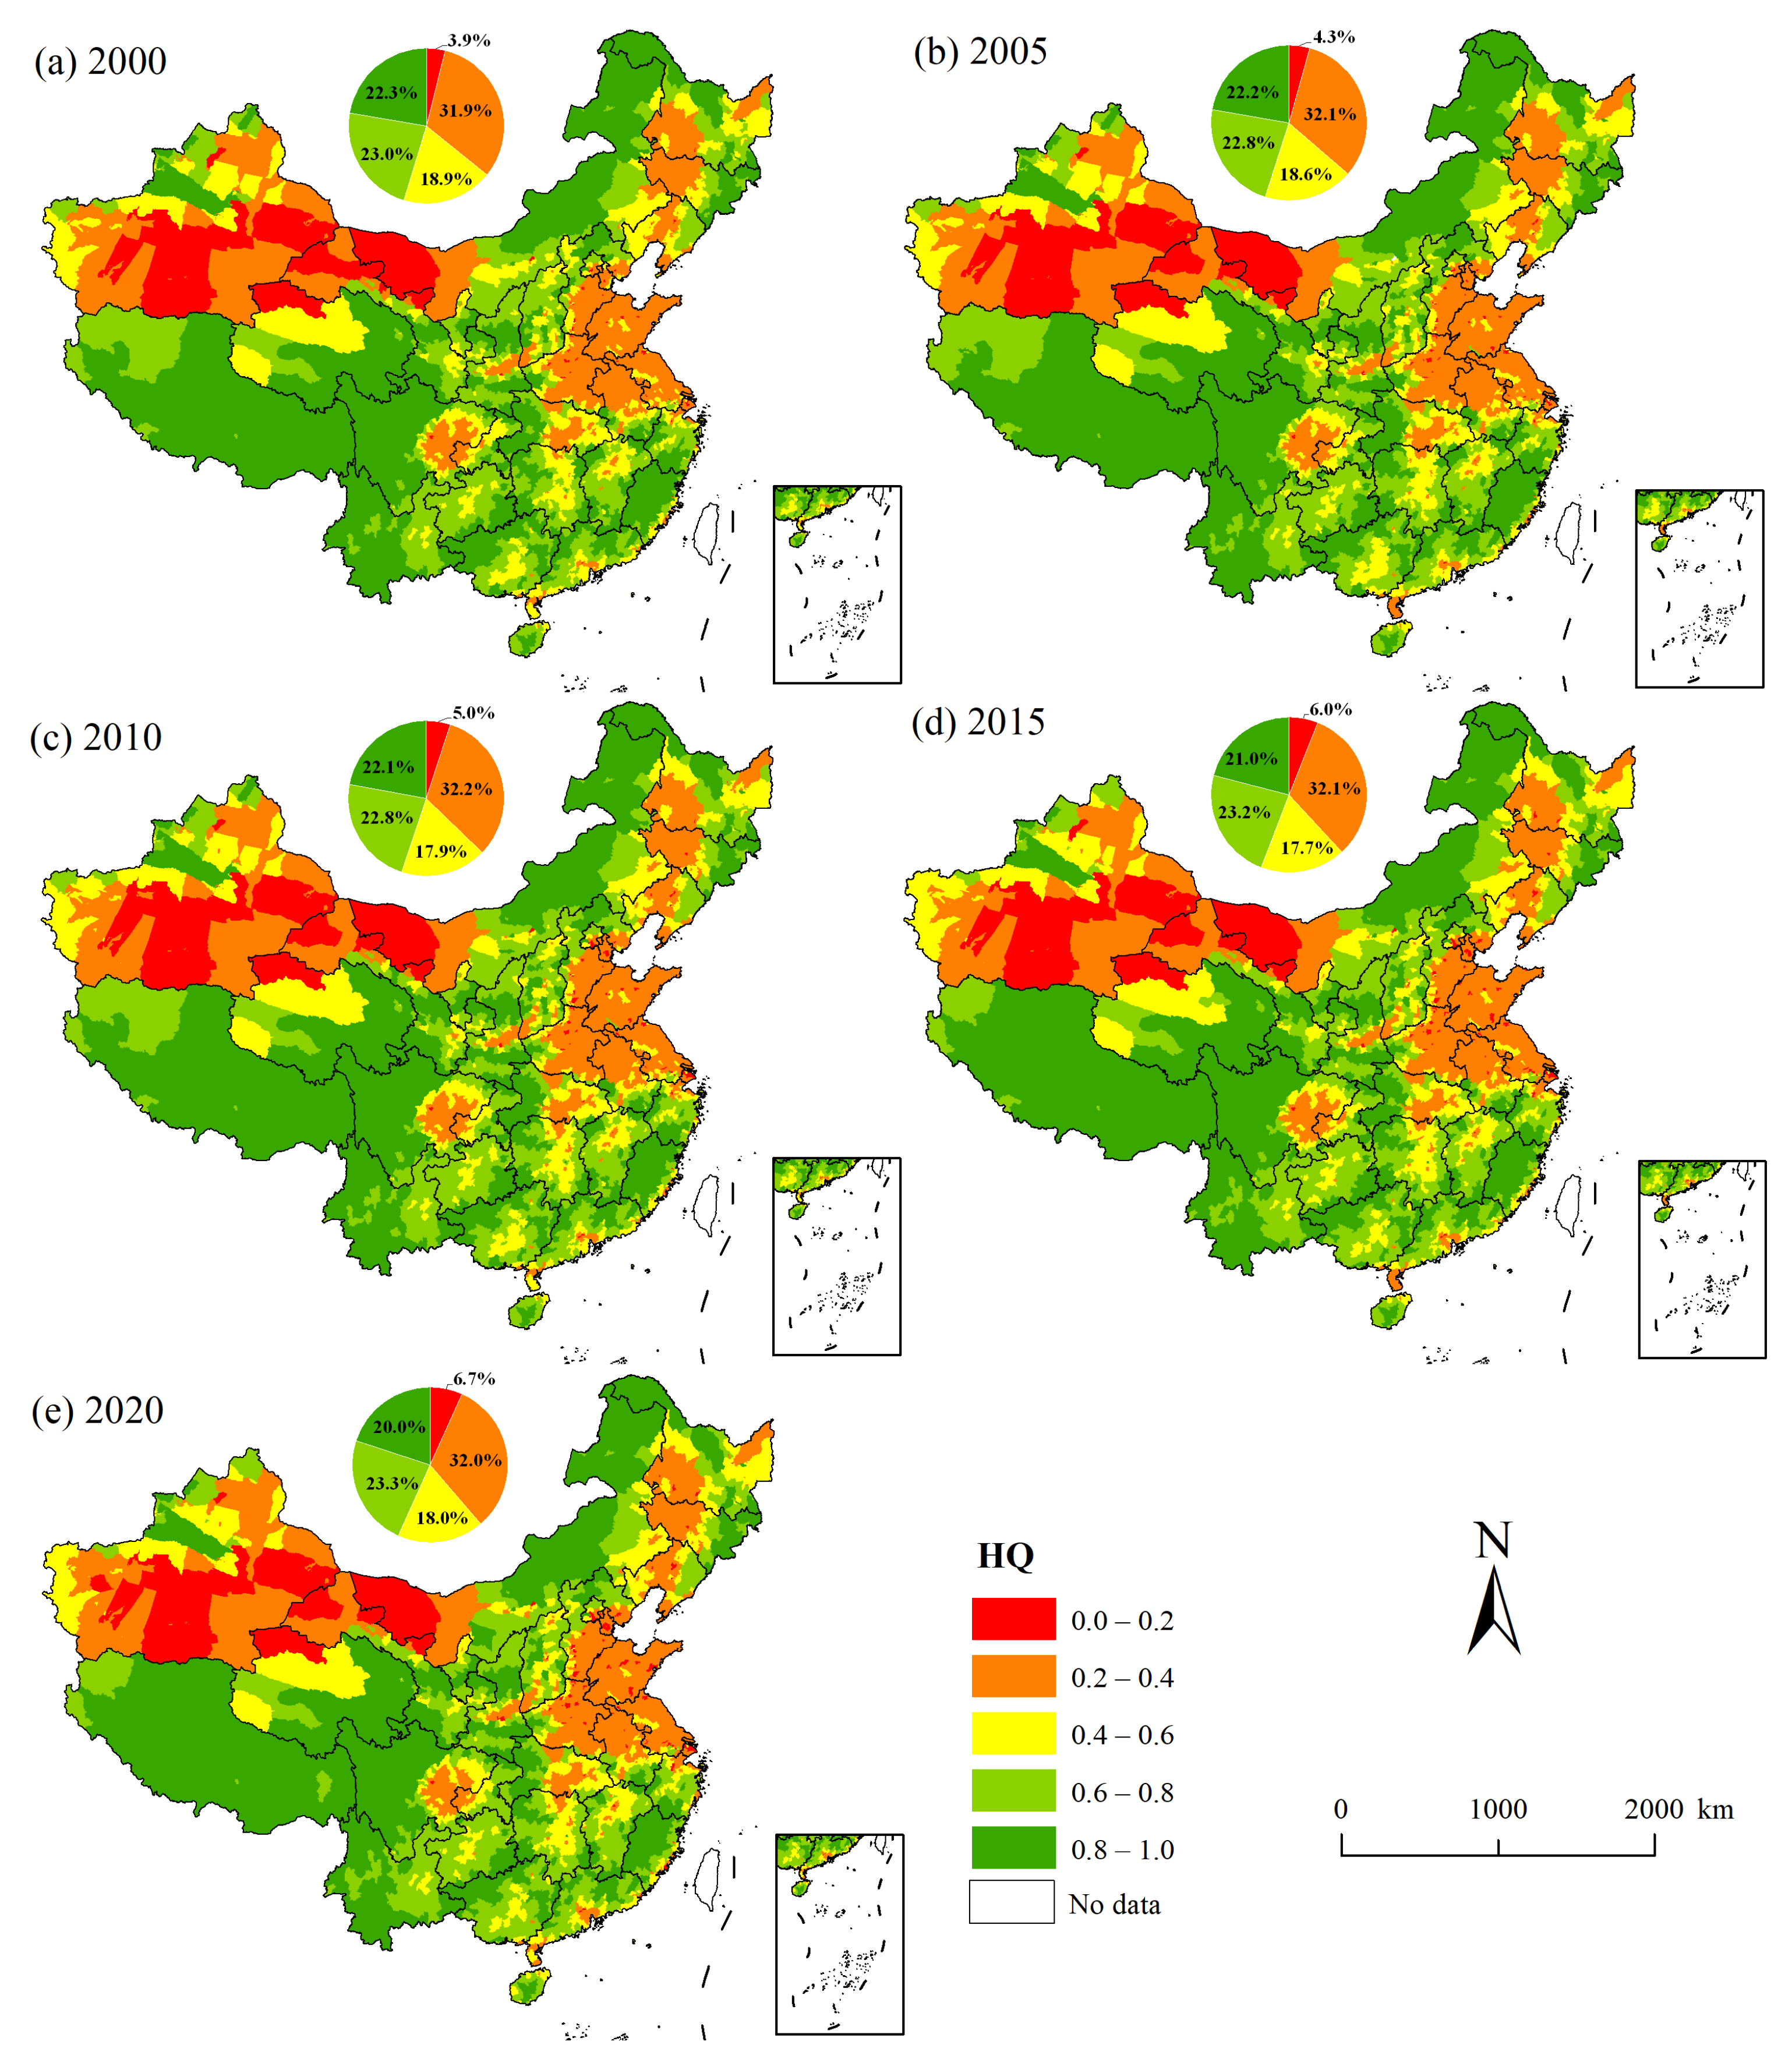
During the study period from 2000 to 2020, the average HQ in China was 0.555, 0.551, 0.547, 0.538, and 0.531, respectively, indicating a consistent declining trend, though the spatial distribution pattern remained largely stable (Figure 2). Overall, HQ in southern China was higher than in the northern regions. However, counties with low HQ were also observed in southwestern China, while some northern counties still exhibited high HQ values. HQ in mountainous areas of China was significantly higher than in plain regions. Low-value HQ counties were primarily concentrated in plain areas, including the Northeast China Plain, Huang–Huai–Hai Plain, Sichuan Basin, and Middle-Lower Yangtze Plain, as well as major urban agglomerations and their surrounding counties. Simultaneously, northwestern China also showed lower HQ due to its low annual precipitation and vegetation coverage. Counties with high-value HQ were most densely distributed in the Tibetan Plateau region. Additionally, continuous high-value HQ areas were observed in the Yunnan–Guizhou Plateau in the southwest and the Wuyi Mountains in the south, as well as the Greater Khingan Range, Hulunbuir Grassland, and Xilingol Grassland in the northeast. Moreover, mountainous regions such as the Taihang Mountains, Daba Mountains, and Xuefeng Mountains in central China also exhibited counties with relatively high HQ. Over time, the proportion of counties with extremely low HQ significantly increased, rising from 3.9% in 2000 to 6.7% in 2020, while the proportion of counties with extremely high HQ notably decreased, declining from 22.3% in 2000 to 20.0% in 2020. The proportions of counties in other HQ grades remained relatively stable.
To further analyze the intensity of spatiotemporal changes in HQ and their spatial patterns, we categorized the changes in county-level HQ across China into five grades: severe degradation (HQ Change < −0.05), slight degradation (−0.05 < HQ Change < 0.00), no change (HQ Change = 0), slight improvement (0 < HQ Change < 0.05), and significant improvement (HQ Change > 0.05) (Figure 3). The results indicate that the proportion of counties experiencing severe degradation varied considerably across different periods, with the highest proportion (1.3%) observed during 2010–2015 and the lowest (0.7%) during 2015–2020. The proportion of counties with slight degradation consistently increased, rising from 63.3% during 2000–2005 to 79.8% during 2015–2020, suggesting that HQ at the county level in China faced ongoing threats. In contrast, both slight and significant improvement trends showed a decline, decreasing from 34.5% and 1.2% during 2000–2005 to 19.1% and 0.2% during 2015–2020, respectively. Spatially, counties with improved HQ were primarily distributed in western China, while those with degraded HQ were mainly concentrated in eastern regions. Particularly after 2005, the number of counties experiencing HQ degradation expanded rapidly. By 2020, most counties across various provinces showed a declining trend in HQ, except for western Xizang, eastern Sichuan, central Chongqing, and central Guizhou.

3.2. Spatiotemporal Patterns of HFP in China from 2000 to 2020

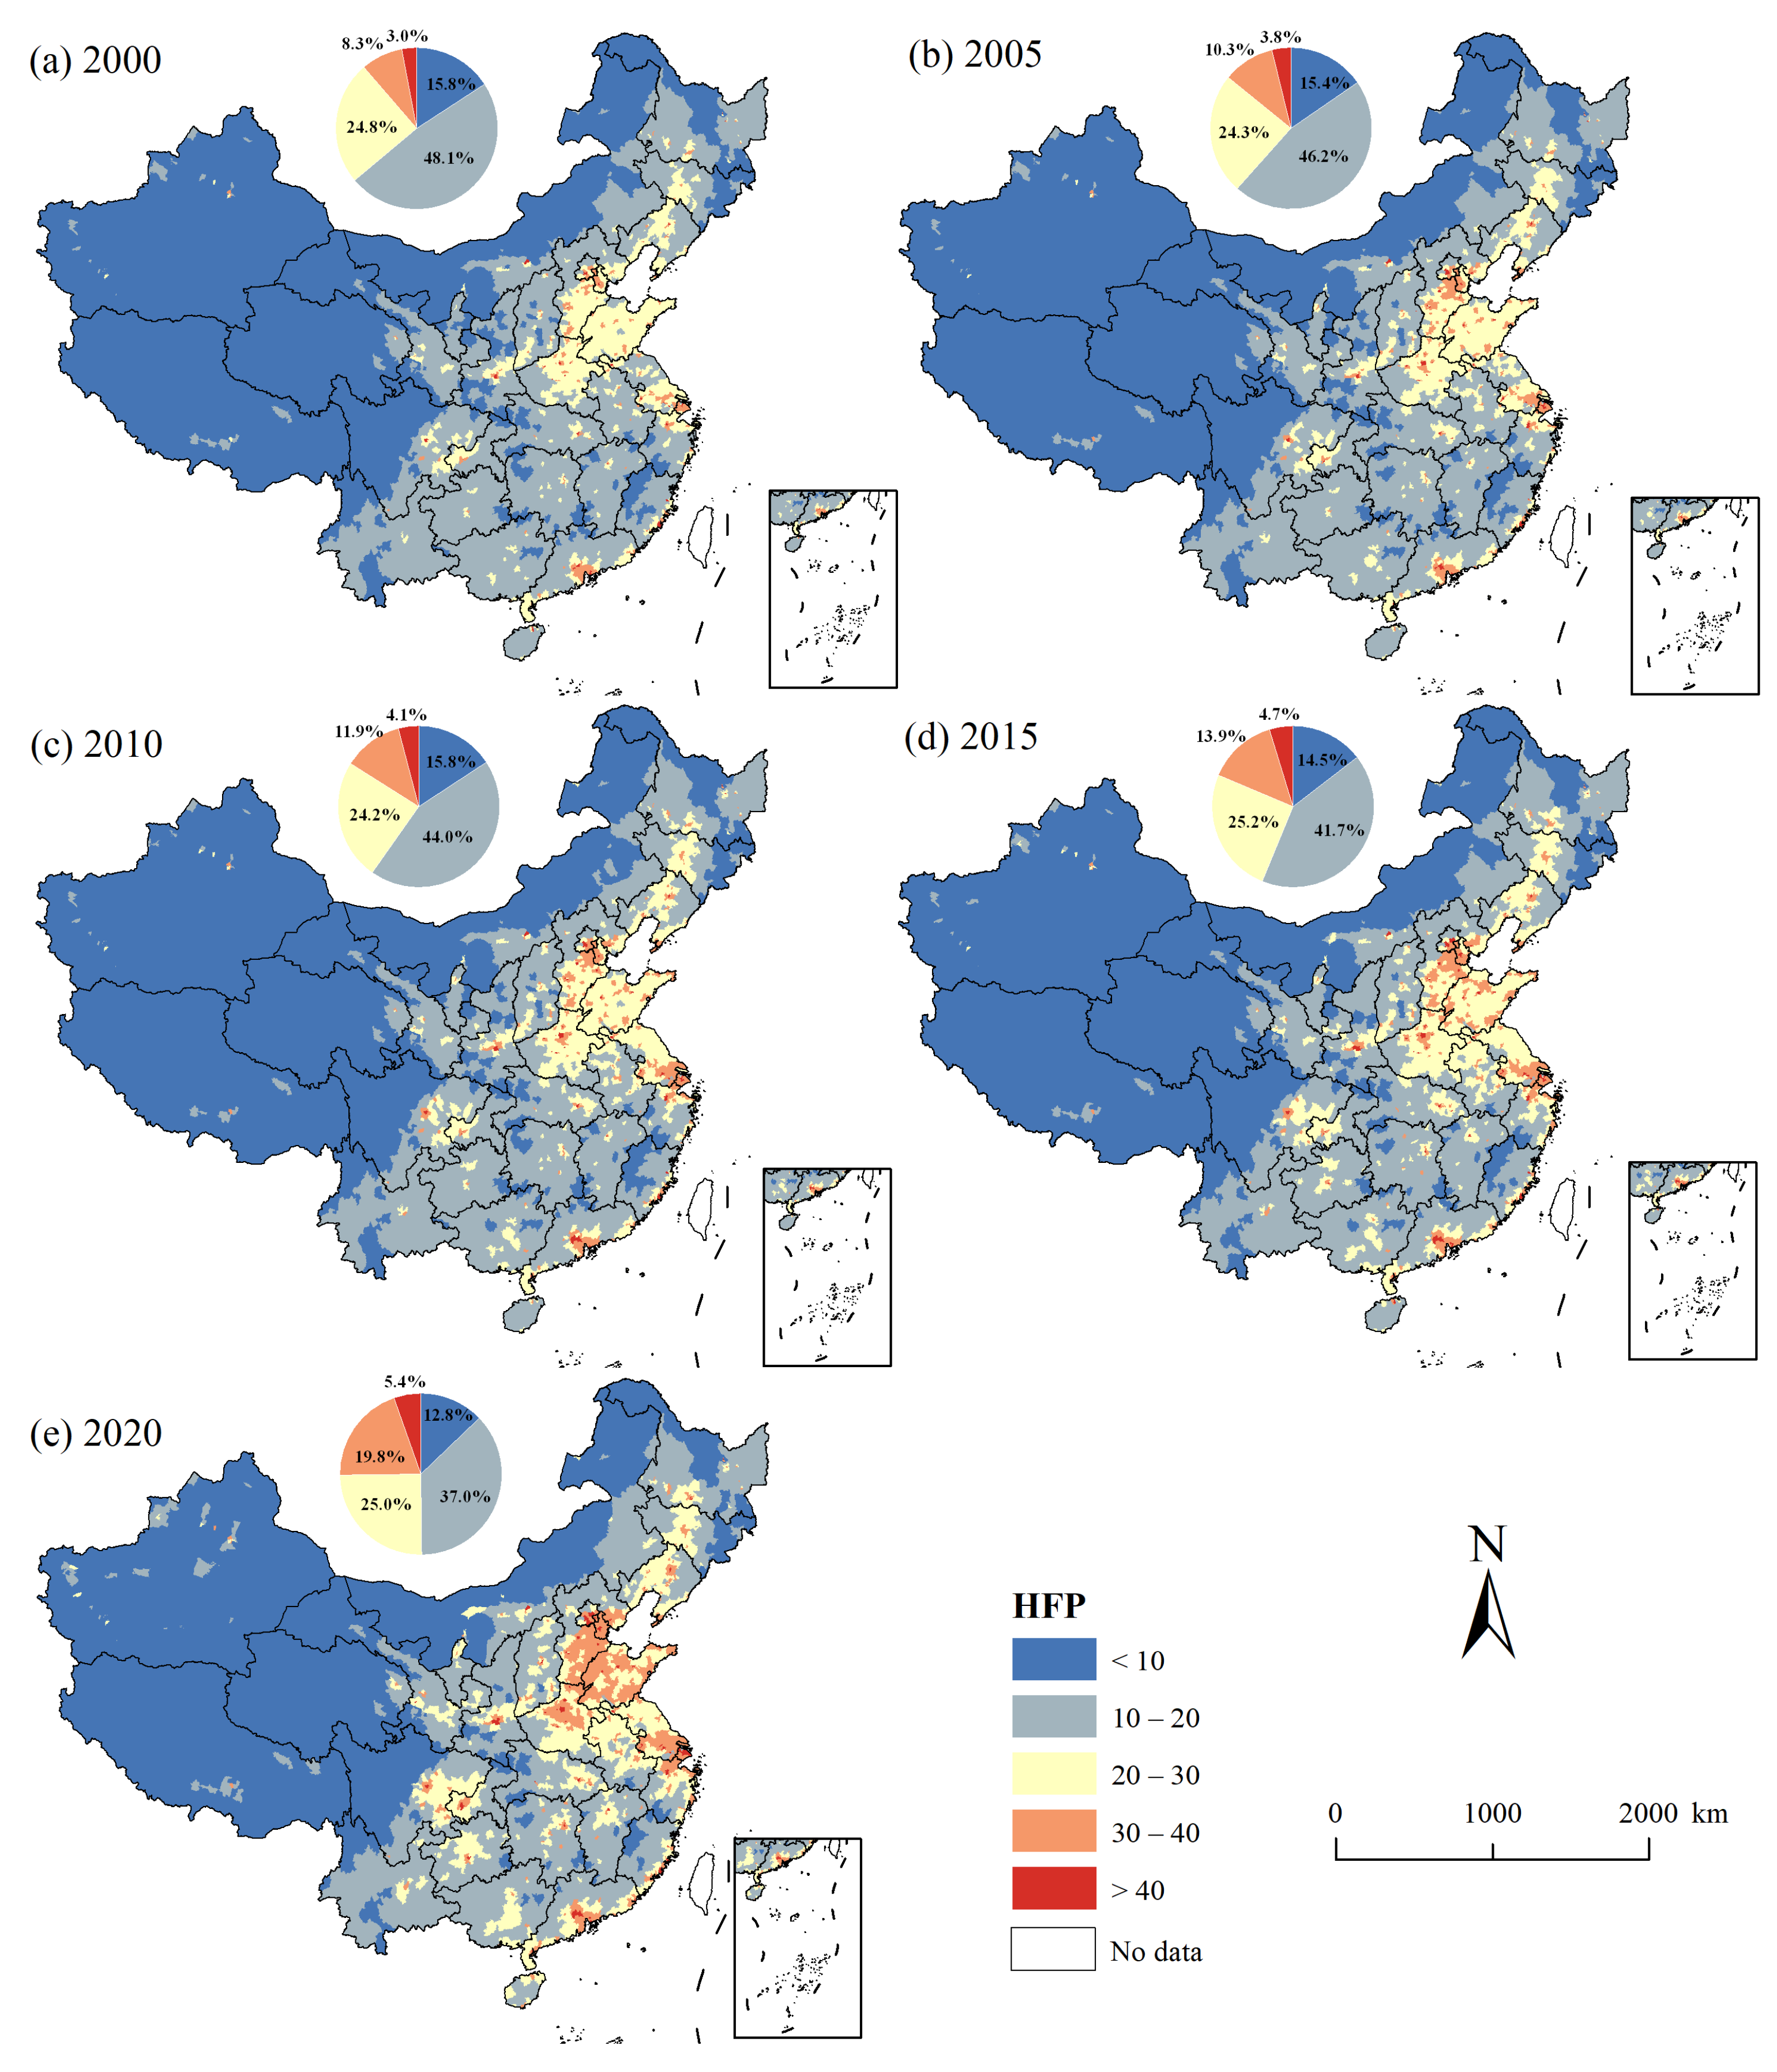
The average HFP at the county level in China was 18.3, 18.9, 19.3, 20.1, and 21.6 in 2000, 2005, 2010, 2015, and 2020, respectively, showing a consistent increasing trend (Figure 4). Among all counties in China, the proportion of counties within various HFP ranges changed significantly during the study period. The highest proportion of counties had an HFP between 10 and 20, but this percentage decreased from 48.1% in 2000 to 37.0% in 2020. Similarly, counties with an HFP of less than 10 also exhibited an overall continuous declining trend. However, the proportion of counties with an HFP between 20 and 30 fluctuated within the range of 24–25% during the study period. Notably, the proportion of counties with an HFP between 30 and 40 increased consistently from 8.3% in 2000 to 19.8% in 2020, indicating a rapid intensification of human activities in China’s counties. Meanwhile, the proportion of counties in the highest HFP category also showed a relatively fast increase. Spatially, the distribution of HFP exhibited significant regional disparities. Counties with high HFP levels were primarily concentrated in the Huang–Huai–Hai Plain, Sichuan Basin, and the two major coastal urban agglomerations (Yangtze River Delta (YRD) and Pearl River Delta (PRD)), mainly due to their relatively dense populations and high proportion of urban land use in these regions. During the study period, these high-HFP counties continued to expand outward, gradually forming contiguous regions of high HFP levels.
During the study period, the proportional distribution of HFP change grades in China exhibited significant fluctuations. Between the periods of 2000–2005 and 2005–2010, 13.3% and 34.0% of counties, respectively, showed an HFP change less than 0 (Figure 5). Meanwhile, the proportions of counties with changes in the 1–2 and greater-than-2 ranges decreased from 16.0% and 9.0% during 2000–2005 to 13.7% and 2.7% during 2005–2010. However, after 2010, these trends reversed. During 2010–2015 and 2015–2020, the proportion of counties with an HFP change less than 0 sharply decreased to 4.6% and 3.3%, respectively. The proportion of counties with a change of 1–2 and greater than 2 increased rapidly from 22.6% and 8.3% during 2010–2015 to 29.0% and 29.2% during 2015–2020, respectively, indicating a dramatic intensification of human activities in most Chinese counties over the last decade. It is worth noting that the proportion of counties with HFP changes between 0 and 1 was highest during 2010–2015 and lowest during 2015–2020. Nevertheless, throughout the entire study period, these changes consistently accounted for the largest proportion of counties. Spatially, regions with low HFP changes were primarily concentrated in western and northeastern China, while areas with high changes were mainly located in central China and the southeastern coast. However, regional variations were observed across different time periods. During 2000–2005, counties with high HFP changes were largely distributed in the Huang–Huai–Hai Plain and the YRD. By 2010–2015, high-change areas began expanding toward core counties within major urban agglomerations along the Yangtze River Basin and the southern coastal region. In the 2015–2020 period, existing high-change areas further expanded outward, while new high-change counties emerged in northwestern Xinjiang and the Northeast China Plain.

3.3. CCD Between HFP and HQ

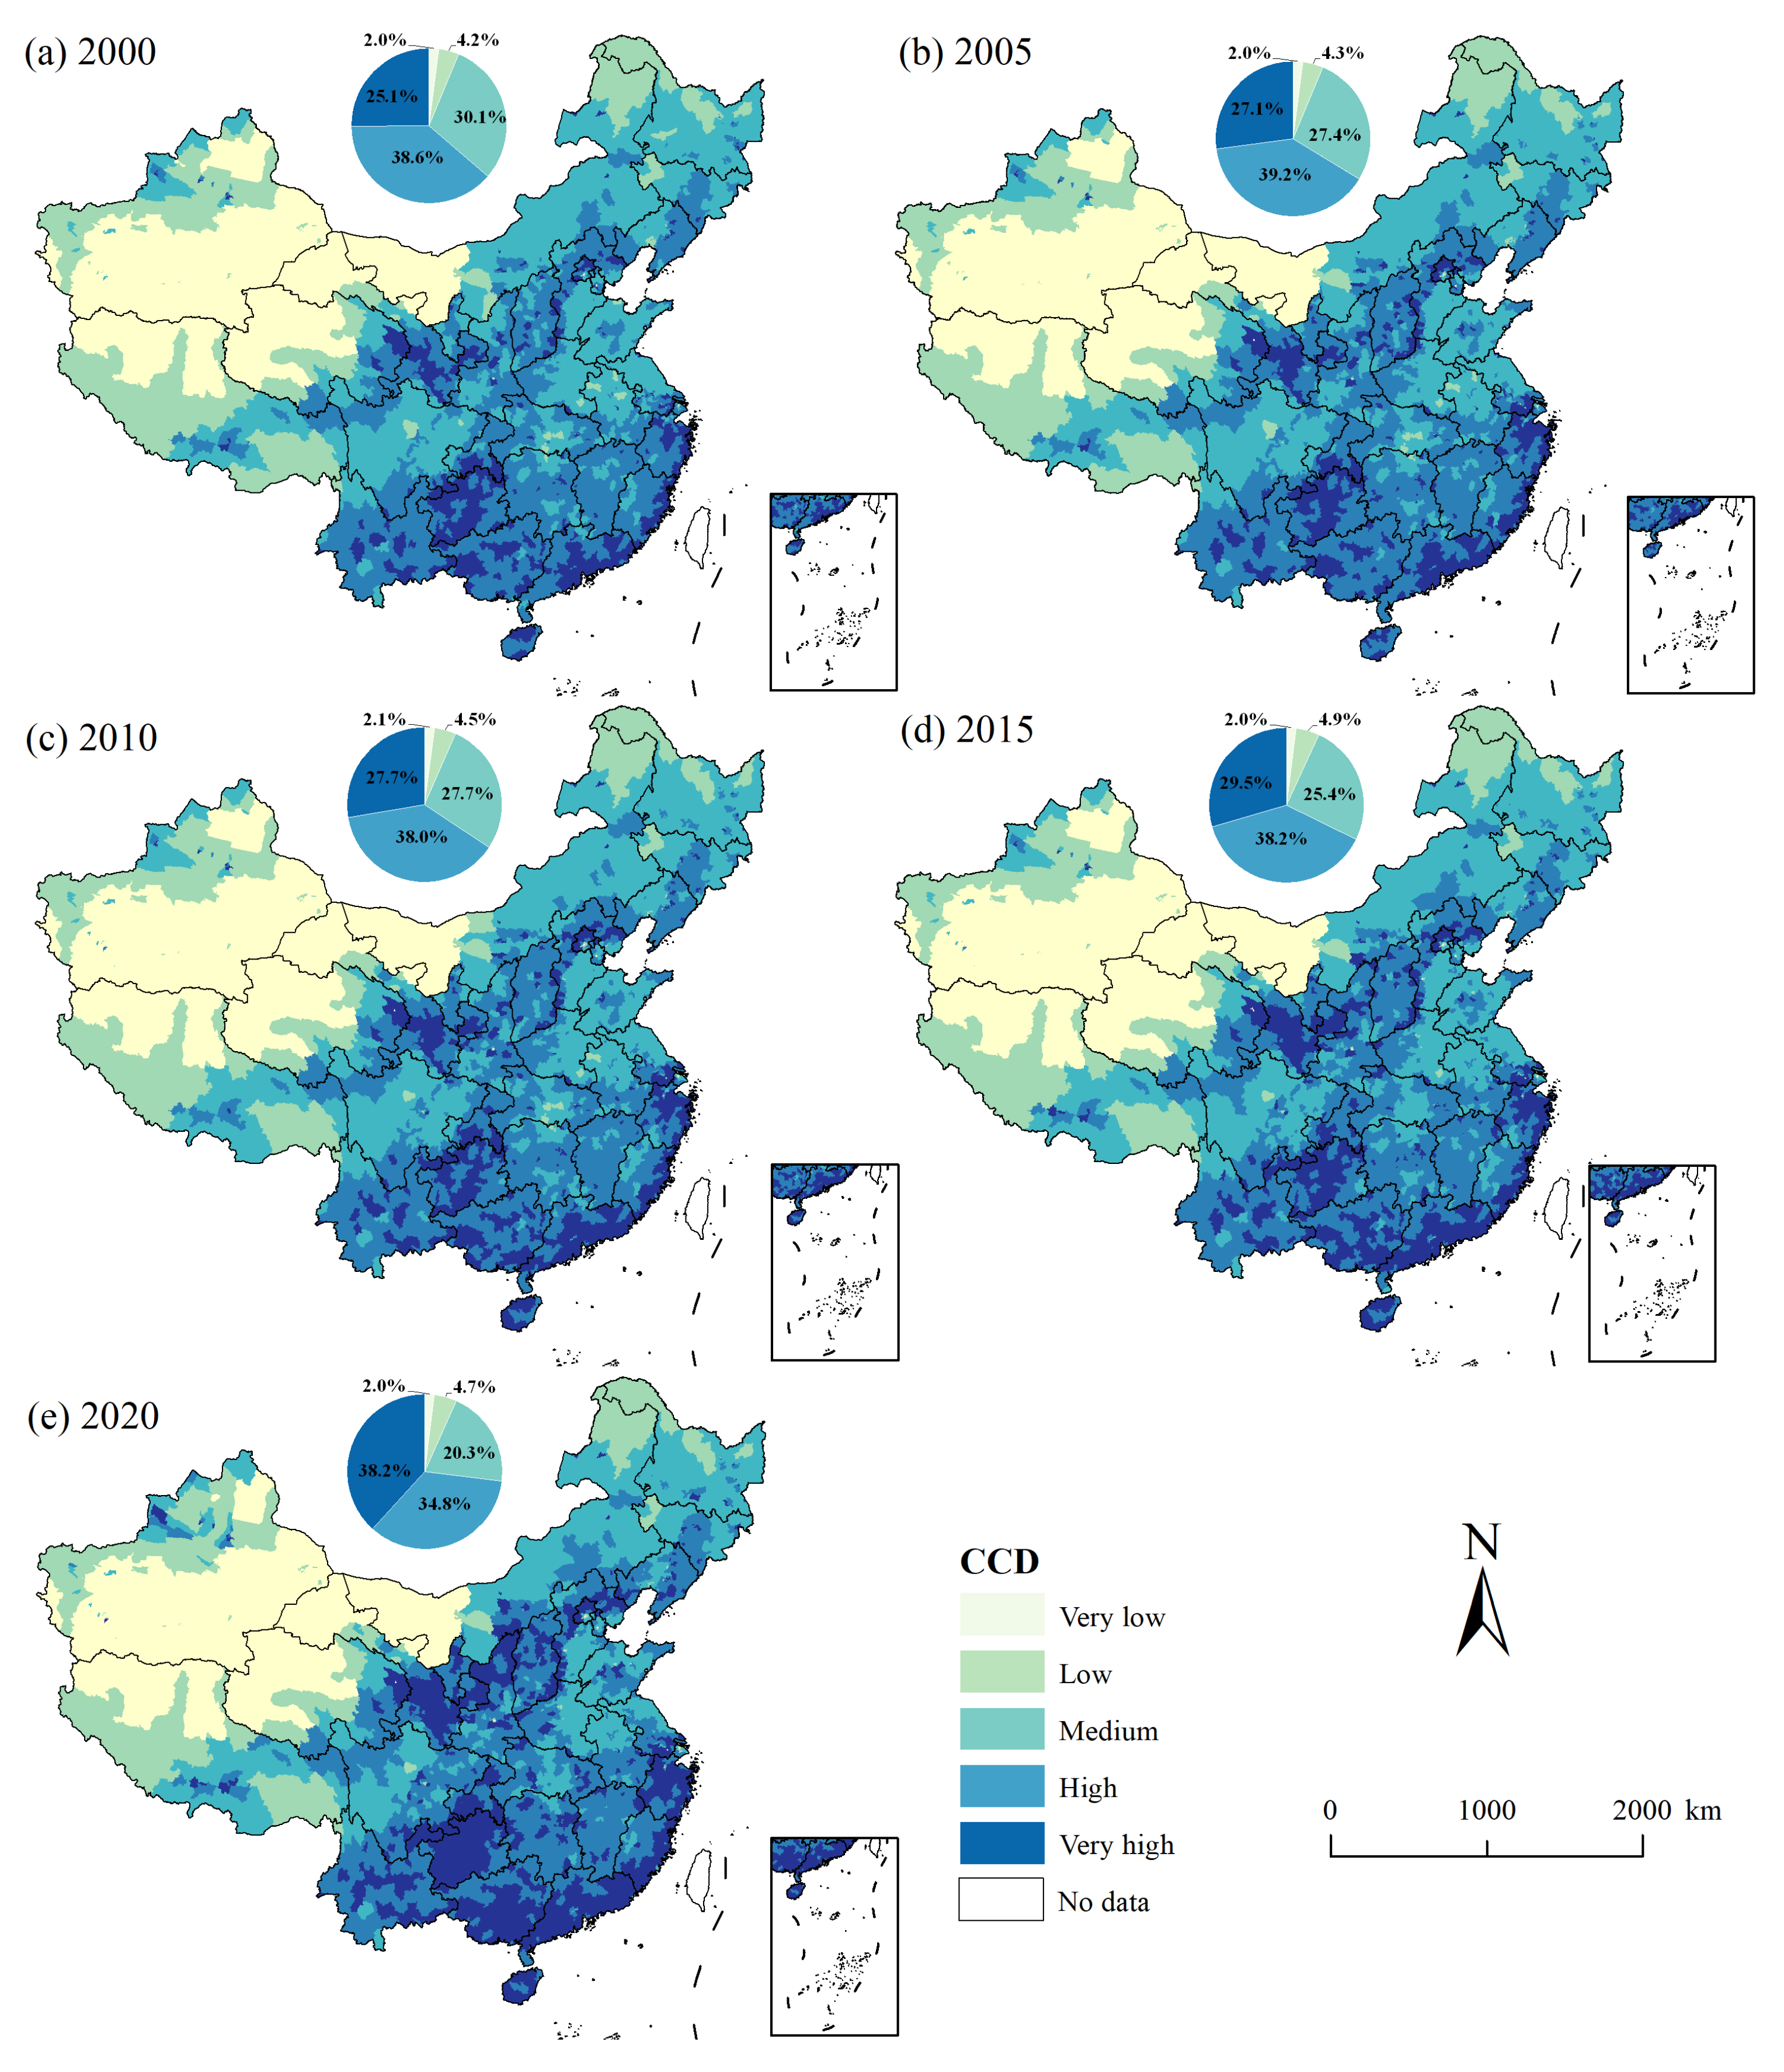
During the study period, the CCD between HFP and HQ at the county level in China showed a continuous increasing trend, with values of 0.644, 0.647, 0.647, 0.649, and 0.659 in 2000, 2005, 2010, 2015, and 2020, respectively (Figure 6). The proportions of counties with very high and low CCDs exhibited an increasing trend, rising from 25.1% and 4.2% in 2000 to 38.2% and 4.7% in 2020, respectively. Notably, the proportion of counties with very high CCDs increased by 13.1% over the last two decades, indicating significant efforts by Chinese counties to balance human activities and ecological conservation. In contrast, other CCD levels showed a declining trend, with the medium CCD category experiencing the largest decrease of 9.8% over the 20-year period, primarily transitioning to higher CCD grades.
Spatially, the overall pattern of CCD across Chinese counties was characterized by lower values in the northwest and higher values in the southeast. Very-low- and low- CCD areas were mainly concentrated in the northwestern regions (including most of Xinjiang and Xizang, as well as Inner Mongolia, Gansu, and northern Qinghai). Medium-CCD areas were primarily distributed in Northeast China, the Huang–Huai–Hai Plain, and the Sichuan Basin. High- and very-high-CCD areas were largely found in the middle and upper reaches of the Yellow River and regions south of the Yangtze River. During the study period, the spatial distribution of very-low- and low-CCD areas remained relatively stable, while medium-CCD areas gradually transitioned to high-CCD areas, and high-CCD areas progressively evolved into very-high-CCD areas. By 2020, contiguous very-high-CCD areas had formed in the middle reaches of the Yellow River, Guizhou Province, and the southeastern coastal regions.

3.4. Driving Factors of CCD Between HFP and HQ

GeoDetector analysis revealed that X9 (LUI) and X5 (NDVI) were the primary factors influencing the CCD between HFP and HQ at the county level in China, with average q-values of 0.56 and 0.37, respectively (Figure 7). The secondary influential factors included X3 (Annual average precipitation), X4 (Annual average temperature), X7 (Night-time light), and X2 (Slope), all with average q-values above 0.1. The q-values of other influencing factors were all below 0.1. The specific significance tests for the natural condition and socioeconomic factors selected in this study are shown in Figure 7. Over time, the q-values of each driving factor exhibited certain changes. The q-values of X6 (Population density) and X7 consistently increased from 0.07 and 0.08 in 2000 to 0.10 and 0.14 in 2020, respectively. Additionally, X2, X5, X8 (GDP), and X9 generally showed an upward trend. In contrast, X1 (DEM), X3, and X4 exhibited a declining trend. These results indicate that socioeconomic factors, including population density, night-time light, GDP, and land use intensity, have increasingly influenced the CCD development of HFP and HQ in Chinese counties. Meanwhile, the influence of natural environmental factors, such as DEM, annual average temperature and precipitation, on the CCD between HFP and HQ was gradually weakened.
The interaction detection of factors revealed that the combined influence of any two interacting factors exceeded the impact of any single factor (Figure 8). Furthermore, these interactions manifested in two distinct forms: bivariate enhancement and nonlinear enhancement. This indicates that the development of the CCD between HQ and HFP at the county level in China results from complex interactions among various factors. During the study period, the interactions between X9 (LUI) and socioeconomic factors (X6, X7, and X8) were particularly significant, representing the most influential drivers of the CCD, with q-values consistently exceeding 0.63. Notably, the interactions between X9 and natural environmental factors also played important roles, and their interactive q-values showed an increasing trend over time.

4. Discussion

4.1. Interpretation of Findings

We found that the average HQ values in China were 0.555, 0.551, 0.547, 0.538, and 0.531 in 2000, 2005, 2010, 2015, and 2020, respectively, showing a continuous declining trend. This indicates that HQ in China has been under persistent threat. This finding is consistent with the study by Xue et al. (2025) [4], who reported a sustained decline in HQ across two-thirds of China’s regions. We also observed that counties with high HQ were primarily concentrated in the Qinghai–Xizang Plateau, the Yunnan–Guizhou Plateau, the Greater Khingan Range in northeastern China, and mountainous areas in the south. These regions, particularly the Qinghai–Xizang Plateau and the Yunnan–Guizhou Plateau, generally exhibit climatic conditions suitable for vegetation growth and are among the key distribution areas of forest and grassland ecosystems [1]. Moreover, their complex and diverse topography limits human activities, contributing to their high HQ levels. However, with further intensification of human activities, HQ in these regions faces increasing threats of degradation. Especially after 2010, HQ in the eastern Qinghai–Xizang Plateau and the Yunnan–Guizhou Plateau continued to decline (Figure 2), while mountainous regions in the south faced similar pressures. Therefore, it is crucial to strengthen ecological conservation efforts in these areas.
The intensification of human activities is an inevitable trend in social development [35], and it is projected that both the intensity and scope of human impacts will continue to increase in the future [55]. Such high-intensity expansion may severely affect natural habitats [20,56], highlighting the urgency of elucidating the interactive coercive relationship between human activities and HQ. As revealed by our findings, the average HFP at the county level in China was 18.3, 18.9, 19.3, 20.1, and 21.6 in 2000, 2005, 2010, 2015, and 2020, respectively, demonstrating a consistent upward trend. This trajectory of HFP inevitably exerts substantial pressure on the ecological environment. During the study period, the proportion of counties with an HFP index ranging from 30 to 40 increased the fastest, from 8.3% in 2000 to 19.8% in 2020. Spatially, counties with higher HFP were primarily distributed in the Huang–Huai–Hai Plain, the YRD, and the PRD. Generally, these regions possess superior natural conditions (such as favorable climate and flat terrain) and advantageous locational features (well-developed transportation networks), making them highly suitable for human activities [20]. Simultaneously, accompanied by urbanization development, construction land for urban areas, industrial parks, and transportation infrastructure continues to expand in these areas, attracting a large influx of rural population. Ultimately, this leads to a continuous increase in the intensity of human activities in these regions [57,58]. Additionally, the continuous population growth in China is another key factor driving the sustained increase in HFP.
Sustainable development is an important development model currently pursued by humans worldwide, which requires a comprehensive consideration of the relationship between natural environmental processes and human activities [59,60]. However, previous studies have predominantly focused on single aspects such as population density, proportion of construction land, and nighttime light intensity, which are commonly used indicators in global contexts [61,62,63]. However, different dimensions of human activities may influence HQ in distinct ways. The HFP used in this study is a composite indicator that integrates demographic, social, and economic dimensions, offering certain advantages in assessing human impacts. Our results indicate that during the study period, only about 2.0% of Chinese counties had a very low CCD between HQ and HFP, with most of them being were located in the northwestern regions. These areas exhibit relatively harsh natural environments, dominated by desert or Gobi landscapes with low vegetation coverage, resulting in both low HQ and low HFP. In contrast, most counties in regions with intensive human activities, such as the Huang–Huai–Hai Plain, the Sichuan Basin, and northeastern China, demonstrated a moderate level of coordination (CCD between 0.56 and 0.64). These regions are characterized by extensive agricultural ecosystems, but rapid urban expansion in recent years has posed certain threats to the coordinated development of humans and nature [58]. Nevertheless, counties with very high CCD were mainly concentrated in the middle reaches of the Yellow River, Guizhou Province, and the southeastern coastal areas, showing a continuous expansion trend. This also suggests that, despite the adverse environmental impacts of human activities, harmonious sustainable development between humans and nature can still be achieved through advancements in science and technology and increased environmental awareness.

4.2. Spatial and Temporal Heterogeneity of Driving Factors for the CCD

The influence of various selected driving factors on the CCD between HQ and HFP at the county level in China exhibits significant heterogeneity [4,35,38]. China’s vast territory, complex and diverse topography, and variations in climate and vegetation across latitudes and longitudes, combined with regional differences in human activities, result in distinct spatial patterns of the CCD between HQ and HFP. Natural environmental factors continue to exert a significant influence on CCD. Numerous studies have demonstrated that natural conditions fundamentally shape the CCD, as regional disparities in natural resources directly affect the distribution of HQ and the intensity of HFP [37,54]. For example, areas with favorable climates and flat terrain are more likely to develop agriculture and become hubs of human activity, while regions with harsh climates and sparse vegetation, such as deserts, face greater environmental risks, resulting in both poor HQ and low HFP intensity [37,54]. This study also confirms that, besides land use intensity, factors such as the NDVI, precipitation, and temperature are important drivers of the CCD between HQ and HFP. Notably, the influence of natural environmental factors on the CCD has been gradually declining over time. This may be due to the changing ways in which humans have been utilizing natural ecosystems in recent years. Studies indicate that global cropland is increasingly shifting toward higher elevations [64], which could diminish the impact of topography on HQ and HFP and reduce the influence of DEMs on the CCD. Meanwhile, research has shown that urban expansion has offset the climate-driven increase in aboveground net primary productivity [65], indicating that urban expansion not only directly affects ecosystems but also indirectly influences related ecosystem functions by altering climatic effects. Additionally, both urban construction land and cropland are significant threat factors in HQ assessment, as their spatial distribution patterns directly impact HQ [35,49]. On the other hand, humanity has also been making substantial efforts to protect the ecological environment, such as establishing a series of nature reserves, which promotes more harmonious development between humans and nature [66]. Meanwhile, technological advancements—including the construction of numerous water conservancy projects and the application of high-efficiency water-saving technologies—have reduced the constraints of natural precipitation on human activities, making previously precipitation-limited areas more suitable for human development [67]. As a result, the influence of climatic factors on HQ, HFP, and their CCD is also diminishing.
In contrast, as human activities continue to intensify nationally and globally, their scope of influence is expanding [20,68]. On one hand, the continuous growth of the global population requires more space to meet humanity’s most basic production and living needs. On the other hand, with the continuous improvement of productivity, human demand for higher living standards is also increasing, including more convenient transportation, larger urban spaces, and more comfortable living environments. To a certain extent, these demands are met at the cost of ecological degradation [69]. As a result, the impact of socioeconomic factors on HQ, HFP, and their CCD is becoming increasingly evident. Additionally, land use intensity serves as a comprehensive indicator measuring the extent of human development and utilization of land. It describes the concentration of capital, labor, technology, and energy inputs from human activities per unit area of land and directly leads to changes in HQ [48]. Simultaneously, it is also a key indicator of human activity and plays a central role in shaping the CCD.
The spatiotemporal evolution of the CCD between HQ and HFP exhibits complexity and dynamism. These changes are influenced not only independently by natural constraints and anthropogenic drivers, but also by their interactions. In recent years, humans have gradually realized the negative impact of human activities on the ecological environment. While developing the economy, various ecological protection projects have also been initiated. Efforts such as the implementation of ecological conservation redlines and major national ecological engineering projects aim to balance the impact of human activities on the ecological environment and have yielded certain results [70,71]. The factors affecting the CCD are diverse and vary regionally. Therefore, scientifically elucidating the spatiotemporal differentiation of natural and anthropogenic driving forces in the evolution process of China’s CCD is crucial for understanding and determining the development trajectory and evolution trend of the CCD.

4.3. Policy Implications

With the continuous intensification of human activities, it is generally believed that the CCD between HQ and HFP often faces the problems of imbalance and dislocation [4,35]. It is an urgent issue to formulate targeted regional coordinated development strategies by deeply studying deep-seated driving factors such as natural environmental differences, uneven economic development, and heterogeneous population distribution within county regions.
HQ is an important indicator of sustainable development in human society. High-HQ areas are always characterized by forests, plains, rivers, and lakes, and have good ecological conditions. However, regions suitable for human activities are often located near high-quality ecosystems [20,72], implying that human activities inevitably exert negative impacts on HQ [19,73]. Therefore, protecting areas with high HQ is particularly important. Future human development should not come at the expense of these critical regions. Instead, a development model that prioritizes economic efficiency should be reconsidered, and environmental protection should be regarded as a fundamental aspect of human survival and development. Special attention should be paid to ecologically sensitive areas, including the Qinghai–Xizang Plateau, the Yunnan–Guizhou Plateau, and the Loess Plateau.
In terms of ecological environmental protection, efforts should first focus on strengthening the conservation of existing high-quality ecological environments to avoid unnecessary damage. This can be achieved by establishing sound ecological compensation mechanisms and environmental governance systems to foster harmonious coexistence among ecological, economic, and social development [74,75]. Second, necessary restoration measures should be implemented in areas that have been degraded or are under severe threat. For example, in regions affected by water pollution, comprehensive sewage collection and treatment systems should be constructed to reduce direct discharges of industrial, agricultural, and domestic wastewater. Additionally, non-point source agricultural pollution should be addressed by promoting ecological agriculture practices and reducing the use of chemical fertilizers and pesticides.
Furthermore, promoting the coordinated development of HQ and HFP requires collective efforts from all sectors, including the government, enterprises, and the public. The government should enhance policy and financial support, improve environmental protection systems, and invest in the construction of environmental infrastructure. Enterprises should strengthen their sense of social responsibility by adopting new technologies and equipment to improve efficiency while effectively reducing environmental pollution. The public needs to raise their awareness of environmental protection, supervise and report environmentally harmful behaviors, and ultimately contribute to the harmonious coexistence of humans and nature.

4.4. Limitations and Future Directions

It should be noted that the evaluation results exhibit a certain degree of subjectivity. Future research is needed to further refine and objectify the spatiotemporal evolution characteristics of HQ and HFP. Although this study employed the widely used InVEST model for HQ assessment, the reliance on a single land use dataset may have influenced the findings. In future studies, we plan to incorporate multiple land use datasets to enhance the accuracy of HQ evaluation. The selection of driving factors is crucial in studying the CCD between HQ and HFP. To better understand and address CCD-related issues, it is necessary to strengthen the construction of monitoring and analytical systems for driving factors. This includes establishing a comprehensive monitoring network and database to collect and organize data on the numerous factors influencing the CCD, as well as utilizing modern technological tools for data analysis and modeling. Additionally, although this study explored factors affecting the CCD, such as natural environmental and socioeconomic elements, it did not cover all key variables due to data accessibility challenges and the complexity of model construction. Future research should expand the scope of influencing factors to include more complex variables, establish a more comprehensive and systematic analytical framework, and deepen our understanding of the CCD. Furthermore, while the GeoDetector model used in this study effectively distinguished the influence of individual driving factors and revealed two-factor interactions, it did not fully capture the specific pathways through which these factors operate. Future studies should adopt more sophisticated and diverse models, such as the GTWR (Geographically and Temporally Weighted Regression) model, structural equation modeling, and machine learning approaches, to deeply explore the relationships among HQ, human activities, and the natural environment. Furthermore, climate change serves as a critical factor influencing the ecological environment, and recent years have witnessed growing uncertainty in climatic patterns. Therefore, subsequent research should pay particular attention to the role of climate change within the human–nature relationship.

5. Conclusions

This study revealed the spatiotemporal evolution characteristics of HQ and HFP at the county level in China from 2000 to 2020, as well as the spatial heterogeneity of driving factors influencing their CCD. During the study period, both HQ and HFP exhibited significant deteriorating trends: the average HQ at the county level in China was 0.555, 0.551, 0.547, 0.538, and 0.531 in 2000, 2005, 2010, 2015, and 2020, respectively, showing a continuous decline, while the HFP values were 18.3, 18.9, 19.3, 20.1, and 21.6, reflecting an opposite trend. Spatially, HQ demonstrated a pattern of higher values in the south and lower values in the north, whereas HFP exhibited higher values in the east and lower values in the west. In terms of spatiotemporal evolution, both HQ and HFP showed significant deterioration in the southeastern regions, while the northwestern regions experienced slight deterioration or even some improvement. The CCD results indicated a gradual increase in the CCD between HQ and HFP at the county level in China, rising from 0.644 in 2000 to 0.659 in 2020. High-value CCD areas were primarily distributed in the middle and upper reaches of the Yellow River and regions south of the Yangtze River. The formation of the CCD between HQ and HFP in Chinese counties is the result of combined natural and socioeconomic factors, displaying distinct spatial heterogeneity. This study provides potential research pathways for achieving China’s goals of economic development and environmental protection. Simultaneously, it offers valuable references and insights for other countries and regions to promote ecological health and sustainable development amid intensifying global human activities.

Author Contributions

Conceptualization, M.Z. and W.C.; methodology, M.Z. and W.C.; software, M.Z. and W.C.; validation, W.C.; formal analysis, M.Z. and W.C.; investigation, M.Z. and W.C.; resources, M.Z. and W.C.; data curation, M.Z.; writing—original draft preparation, M.Z.; writing—review and editing, M.Z. and W.C.; visualization, M.Z. and W.C.; funding acquisition, M.Z.; supervision, W.C.; project administration, W.C. All authors have read and agreed to the published version of the manuscript.

Funding

This research was funded by the Henan Province Science and Technology Research Projects (Grant No. 242102321157) and Philosophy and Social Science Planning Project of Henan Province (Grant NO. 2024BJJ168).

Data Availability Statement

The data that support the findings of this study are available from the corresponding author upon reasonable request.

Acknowledgments

The authors would like to thank the anonymous reviewers for their constructive comments on improving this paper.

Conflicts of Interest

The authors declare no conflicts of interest.

References

  1. Zhou, J.; Wu, N.; Lu, T. Mapping human footprint changes over Qingzang Plateau. Geo. Sus. 2025, 6, 100249. [Google Scholar] [CrossRef]
  2. Suraci, J.P.; Gaynor, K.M.; Allen, M.L.; Alexander, P.; Brashares, J.S.; Cendejas-Zarelli, S.; Crooks, K.; Elbroch, L.M.; Forrester, T.; Green, A.M.; et al. Disturbance type and species life history predict mammal responses to humans. Glob. Change Biol. 2021, 27, 3718–3731. [Google Scholar] [CrossRef] [PubMed]
  3. Skinner, E.B.; Glidden, C.K.; MacDonald, A.J.; Mordecai, E.A. Human footprint is associated with shifts in the assemblages of major vector-borne diseases. Nat. Sustain. 2023, 6, 652–661. [Google Scholar] [CrossRef] [PubMed]
  4. Xue, Q.; Zhang, Y.; Zhang, Q.; Wu, Q.; Zhang, X.; Lu, L.; Qin, C. Towards ecological security: Two-thirds of China’s ecoregions experienced a decline in habitat quality from 1992 to 2020. Ecol. Indic. 2025, 172, 113275. [Google Scholar] [CrossRef]
  5. Chang, X.; Tian, Z.; Chen, Y.; Bai, T.; Song, Z.; Sun, K. Human activities dominantly driven the greening of China during 2001 to 2020. Remote Sens. 2025, 17, 2446. [Google Scholar] [CrossRef]
  6. Zhu, Y.N.; Li, C.; Feng, J.M. The protected areas system policy enhances habitat quality conservation effectiveness in Dongting Lake Eco-Economic Zone. J. Clean. Prod. 2025, 504, 145425. [Google Scholar] [CrossRef]
  7. Zolyomi, A.; Franklin, A.; Smith, B.; Soliev, I. Ecosystem services as the silver bullet? A systematic review of how ecosystem services assessments impact biodiversity prioritisation in policy. Earth Syst. Gov. 2023, 16, 100178. [Google Scholar] [CrossRef]
  8. Costanza, R.; Darge, R.C.; De Groot, R.; Farber, S.; Grasso, M.; Hannon, B.; Limburg, K.E.; Naeem, S.; Oneill, R.V.; Paruelo, J.M. The value of the world’s ecosystem services and natural capital. Nature 1997, 387, 253–260. [Google Scholar] [CrossRef]
  9. Bi, M.Y.; Zhong, Y.X.; Xiao, Z.P.; Feng, X.H.; Ma, H.Z. Spatial and temporal change of habitat quality of Poyang Lake Basin in China at small watershed scale and its multidimensional response to landscape pattern. Chin. Geogr. Sci. 2023, 33, 565–582. [Google Scholar] [CrossRef]
  10. Gong, J.; Xie, Y.; Cao, E.; Huang, Q.; Li, H. Integration of InVEST-habitat quality model with landscape pattern indexes to assess mountain plant biodiversity change: A case study of Bailongjiang watershed in Gansu Province. J. Geogr. Sci. 2019, 29, 1193–1210. [Google Scholar] [CrossRef]
  11. Bolcato, S.; Aplin, L. The effect of habitat health and environmental change on cultural diversity and richness in animals. Phil. Trans. R. Soc. B 2025, 380, 20240141. [Google Scholar] [CrossRef]
  12. Seok, Y.; Kim, D.G.; Son, J.; Park, J.; Lee, J. The importance of the Mujechineup wetland for biodiversity: An evaluation of habitat quality and ecosystem service value. Landsc. Ecol. Eng. 2022, 18, 477–491. [Google Scholar] [CrossRef]
  13. Jeong, A.; Kim, M.; Lee, S. Analysis of priority conservation areas using habitat quality models and MaxEnt models. Animals 2024, 14, 1680. [Google Scholar] [CrossRef] [PubMed]
  14. Jato-Espino, D.; Lierow, S. Spatiotemporal analysis of landscape dynamics and their use as input for the design of a habitat suitability index: A case study of in a Mediterranean region. Ecol. Inform. 2024, 82, 102731. [Google Scholar] [CrossRef]
  15. Sherrouse, B.C.; Semmens, D.J. Social values for Ecosystem services, version 3.0 (SolVES 3.0)—Documentation and user manual. In Open-File Report 2015–1008; U.S. Geological Survey: Reston, VA, USA, 2015. [Google Scholar]
  16. Sahle, M.; Almarines, N.R.; Lahoti, S.A.; Tiburan, C.L.; Pulhin, J.M.; Saito, O. Exploring the interplay between food provision and habitat quality assessment for sustainable coexistence in the bioproduction systems of the Philippines. Resources 2025, 14, 45. [Google Scholar] [CrossRef]
  17. Yang, F.; Yang, L.; Fang, Q.; Yao, X. Impact of landscape pattern on habitat quality in the Yangtze River Economic Belt from 2000 to 2030. Ecol. Indic. 2024, 166, 112480. [Google Scholar] [CrossRef]
  18. Čistý, M.; Doláková, G.; Štefunková, Z. A methodology simplifying river habitat quality assessment through regression analysis: Application in Slovakia. Environ. Process. 2025, 12, 4. [Google Scholar] [CrossRef]
  19. Chen, Z.; Chen, Y.; Zhang, H.; Zhang, H.; Xu, M. Understanding spatiotemporal changes and influencing factors in the habitat quality of coastal waters: A case study of Jiangsu Province, China (2006–2020). Ecol. Indic. 2025, 170, 113125. [Google Scholar] [CrossRef]
  20. Li, W.; Wu, J.; Yuan, Y.; Duan, B.; Pan, S.; Chen, W.; Chen, Y. Global urbanization and habitat quality: Interactive coercive relationships. Land 2024, 13, 1943. [Google Scholar] [CrossRef]
  21. Yohannes, H.; Soromessa, T.; Argaw, M.; Dewan, A. Spatio-temporal changes in habitat quality and linkage with landscape characteristics in the Beressa watershed, Blue Nile basin of Ethiopian highlands. J. Environ. Manag. 2021, 281, 111885. [Google Scholar] [CrossRef]
  22. Zhou, J.; Yang, J.; Tang, Z.S.; Xue, L.Y.; Zhang, W.L.; Zhang, J. Driving mechanisms of ecosystem services and their trade-offs and synergies in the transition zone between the Qinghai-Tibet Plateau and the Loess Plateau. Ecol. Indic. 2025, 171, 113148. [Google Scholar] [CrossRef]
  23. Nabikandi, B.V.; Shahbazi, F.; Biswas, A. Evaluating ecosystem services under various trajectories and land use/land cover changes in a densely populated area, Iran. Earth Sci. Inform. 2025, 18, 372. [Google Scholar] [CrossRef]
  24. Segan, D.B.; Murray, K.A.; Watson, J.E.M. A global assessment of current and future biodiversity vulnerability to habitat loss–climate change interactions. Glob. Ecol. Conserv. 2016, 5, 12–21. [Google Scholar] [CrossRef]
  25. Nie, Y.; Zhang, X.; Yang, Y.; Liu, Z.; He, C.; Chen, X.; Lu, T. Assessing the impacts of historical and future land-use/cover change on habitat quality in the urbanizing Lhasa River Basin on the Tibetan Plateau. Ecol. Indic. 2023, 148, 110147. [Google Scholar] [CrossRef]
  26. Li, L.; Wang, N.; Hao, Z.Z.; Sun, B.; Gao, B.T.; Gou, M.M.; Wang, P.; Pei, N.C. Urbanization intensifies the imbalance between human development and biodiversity conservation: Insights from the coupling analysis of human activities and habitat quality. Land Degrad. Dev. 2024, 35, 3606–3626. [Google Scholar] [CrossRef]
  27. Qi, L.; Lu, M.; Uddin, M.; Wang, M.; Su, J.; Zhang, X.; Huang, J.; Hu, J. Impacts of land use change on habitat quality and its driving mechanisms in the lake basin of Central Yunnan. Sci. Rep. 2025, 15, 18318. [Google Scholar] [CrossRef]
  28. Zhao, Y.H.; Qu, Z.; Zhang, Y.; Ao, Y.; Han, L.; Kang, S.Z.; Sun, Y.Y. Effects of human activity intensity on habitat quality based on nighttime light remote sensing: A case study of Northern Shaanxi, China. Sci. Total Environ. 2022, 851, 113148. [Google Scholar] [CrossRef]
  29. Sanderson, E.W. The Human Footprint and the Last of the Wild. BioScience 2002, 52, 891–904. [Google Scholar] [CrossRef]
  30. Jones, K.R.; Venter, O.; Fuller, R.A.; Allan, J.R.; Maxwell, S.L.; Negret, P.J.; Watson, J.E.M. One-third of global protected land is under intense human pressure. Science 2018, 360, 788–791. [Google Scholar] [CrossRef]
  31. Mu, H.; Li, X.; Wen, Y.; Huang, J.; Du, P.; Su, W.; Miao, S.; Geng, M. A global record of annual terrestrial Human Footprint dataset from 2000 to 2018. Sci. Data 2022, 9, 176. [Google Scholar] [CrossRef]
  32. Williams, B.A.; Venter, O.; Allan, J.R.; Atkinson, S.C.; Rehbein, J.A.; Ward, M.; Di Marco, M.; Grantham, H.S.; Ervin, J.; Goetz, S.J.; et al. Change in terrestrial human footprint drives continued loss of intact ecosystems. One Earth 2020, 3, 371–382. [Google Scholar] [CrossRef]
  33. Venter, O.; Sanderson, E.W.; Magrach, A.; Allan, J.R.; Beher, J.; Jones, K.R.; Possingham, H.P.; Laurance, W.F.; Wood, P.; Fekete, B.M.; et al. Sixteen years of change in the global terrestrial human footprint and implications for biodiversity conservation. Nat. Commun. 2016, 7, 12558. [Google Scholar] [CrossRef] [PubMed]
  34. Yang, D.Z.; Liu, Y.Q. Heterogeneous impacts of human activities and climate change on transformed vegetation dynamics on the Qinghai-Tibet Plateau. J. Environ. Manag. 2025, 392, 126575. [Google Scholar] [CrossRef] [PubMed]
  35. Tang, J.; Jin, X.; Mu, H.; Yang, S.; He, R.; Li, X.; Wang, W.; Huang, S.; Zu, J.; Wang, H.; et al. Impacts of human footprint on habitat quality and permafrost environment in Northeast China. Ecol. Indic. 2025, 175, 113587. [Google Scholar] [CrossRef]
  36. Shrestha, N.; Xu, X.; Meng, J.; Wang, Z. Vulnerabilities of protected lands in the face of climate and human footprint changes. Nat. Commun. 2021, 12, 1632. [Google Scholar] [CrossRef]
  37. Xue, Q.; Lu, L.; Zhang, Y.; Qin, C. Spatiotemporal evolution and coupling analysis of human footprints and habitat quality: Evidence of 21 consecutive years in China. Land 2024, 13, 980. [Google Scholar] [CrossRef]
  38. Nickel, B.A.; Suraci, J.P.; Allen, M.L.; Wilmers, C.C. Human presence and human footprint have non-equivalent effects on wildlife spatiotemporal habitat use. Biol. Conserv. 2020, 241, 108383. [Google Scholar] [CrossRef]
  39. Yang, L.; Bian, C.; Pan, S.; Chen, W.; Zeng, J.; Xu, H.; Gu, T. Assessing the conservation effectiveness of the World’s protected areas: A habitat quality and human activities perspective. J. Clean. Prod. 2023, 431, 139772. [Google Scholar] [CrossRef]
  40. Ai, Z.; Yao, Y.; Dang, X.; Li, X.; Hou, M.; Deng, Y.; Xiao, L.; Li, T.; Wang, T. Study on the trade-off/synergy between ecosystem services and human well-being based on land use in Weinan City, China. Environ. Sci. Pollut. Res. 2024, 31, 13549–13562. [Google Scholar] [CrossRef]
  41. Grossman, G.M.; Krueger, A.B. Economic growth and the environment. Q. J. Econ. 1995, 110, 353–377. [Google Scholar] [CrossRef]
  42. Li, Z.X.; Xu, Z.Q.; Chen, Y.D.; Gu, S.H.; Li, C. Impacts of landscape patterns on habitat quality in coal resource-exhausted cities: Spatial-temporal dynamics and non-stationary scale effects. Environ. Monit. Assess. 2025, 197, 297. [Google Scholar] [CrossRef] [PubMed]
  43. Chen, Y.D.; Chang, J.; Li, Z.X.; Ming, L.; Li, C.K. Influence of land use change on habitat quality: A case study of coal mining subsidence areas. Environ. Monit. Assess. 2024, 196, 535. [Google Scholar] [CrossRef] [PubMed]
  44. Wang, J.; Xu, C. Geodetector: Principle and prospective. Acta Geogr. Sin. 2017, 72, 116–134. [Google Scholar]
  45. Yang, J.; Huang, X. The 30 m annual land cover dataset and its dynamics in China from 1990 to 2019. Earth Syst. Sci. Data 2021, 13, 3907–3925. [Google Scholar] [CrossRef]
  46. Feng, C.; Yan, K.; Wang, H.; Luo, M.; Ma, B.; Zhao, W.; Wang, W. A framework for assessing the impact of human pressure on priority core habitats of rare and endangered species. Ecol. Indic. 2025, 178, 114051. [Google Scholar] [CrossRef]
  47. Baptista, L.; Domingos, T.; Santos, J.; Proença, V. How do bird population trends relate to human pressures compared to economic growth? Sustainability 2025, 17, 3506. [Google Scholar] [CrossRef]
  48. Chen, W.; Zeng, J.; Li, N. Change in land-use structure due to urbanisation in China. J. Clean. Prod. 2021, 321, 128986. [Google Scholar] [CrossRef]
  49. Sharp, R.; Tallis, H.T.; Ricketts, T.; Guerry, A.D.; Wood, S.A.; Chaplin-Kramer, R. InVEST 3.7.0 User’s Guide; The Natural Capital Project: Standford, CA, USA, 2018. [Google Scholar]
  50. Yue, Z.L.; Xiao, C.W.; Feng, Z.M.; Wang, Y.; Yan, H.M. Accelerating decline of habitat quality in Chinese border areas. Resour. Conserv. Recycl. 2024, 206, 107665. [Google Scholar] [CrossRef]
  51. Xu, F.; Wang, H.; Zuo, D.Y.; Gong, Z.Q. How does the coupling coordination relationship between high-quality urbanization and land use evolve in China? New evidence based on exploratory spatiotemporal analyses. J. Geogr. Sci. 2024, 34, 871–890. [Google Scholar] [CrossRef]
  52. Huang, Y.; Li, Y.B.; Sheng, M.C.; Li, T.; Shao, J.A.; Zhao, W.X. Coupling response of ecosystem service value to human activity intensity in mountainous areas: A case study of the Three Gorges Reservoir Hinterland, China. Land Degrad. Dev. 2025, 36, 1356–1370. [Google Scholar] [CrossRef]
  53. Yang, S.; Zhang, Z.; Zhang, J.; Bai, X.; Hu, F.; Zhang, K.; Wang, S. The coupling relationship and driving mechanism between ecological environment and high-quality economic development in the Middle Yellow River Basin. Sci. Rep. 2025, 15, 10688. [Google Scholar] [CrossRef]
  54. Wu, C.B.; Cui, Y.Y.; Zhen, J.L.; Huang, G.H. Spatio-temporal change of habitat quality in northeast china: Driving factors exploration based on land use and land cover change. Land Degrad. Dev. 2025, 36, 3742–3755. [Google Scholar] [CrossRef]
  55. Angel, S.; Parent, J.; Civco, D.L.; Blei, A.; Potere, D. The dimensions of global urban expansion: Estimates and projections for all countries, 2000–2050. Prog. Plann. 2011, 75, 53–107. [Google Scholar] [CrossRef]
  56. Seto, K.C.; Giineralp, B.; Hutyra, L.R. Global forecasts of urban expansion to 2030 and direct impacts on biodiversity and carbon pools. Proc. Natl. Acad. Sci. USA 2012, 109, 16083–16088. [Google Scholar] [CrossRef] [PubMed]
  57. Fan, Q.; Zhang, Y.; Wei, G.; Huang, X. Coupling coordination analysis of urban social vulnerability and human activity intensity. Environ. Res. Commun. 2025, 7, 035009. [Google Scholar] [CrossRef]
  58. Tang, J.; Zhou, L.; Dang, X.; Hu, F.; Yuan, B.; Yuan, Z.; Wei, L. Impacts and predictions of urban expansion on habitat quality in the densely populated areas: A case study of the Yellow River Basin, China. Ecol. Indic. 2023, 151, 110320. [Google Scholar] [CrossRef]
  59. Terra dos Santos, L.C.; Frimaio, A.; Giannetti, B.F.; Agostinho, F.; Liu, G.; Almeida, C.M.V.B. Integrating environmental, social, and economic dimensions to monitor sustainability in the G20 countries. Sustainability 2023, 15, 6502. [Google Scholar] [CrossRef]
  60. Wang, K.; Li, X.B.; Lyu, X.; Dang, D.L.; Cao, W.Y.; Du, Y.X. Unraveling the complex interconnections between food-energy-water nexus sustainability and the supply-demand of related ecosystem services. J. Environ. Manag. 2024, 370, 122532. [Google Scholar]
  61. Chen, Y.; Yang, J. The Chinese socio-cultural sustainability approach: The impact of conservation planning on local population and residential mobility. Sustainability 2018, 10, 4195. [Google Scholar] [CrossRef]
  62. Yang, L.; Chen, W.; Fang, C.; Zeng, J. How does the coordinated development of population urbanization and land urbanization affect residents’ living standards? Empirical evidence from China. Cities 2024, 149, 104922. [Google Scholar] [CrossRef]
  63. Mokhtari, Z.; Bergantino, A.S.; Intini, M.; Elia, M.; Buongiorno, A.; Giannico, V.; Sanesi, G.; Lafortezza, R. Nighttime light extent and intensity explain the dynamics of human activity in coastal zones. Sci. Rep. 2025, 15, 1663. [Google Scholar] [CrossRef]
  64. Chen, W.; Yuan, Y.; Gu, T.; Ma, H.; Zeng, J. What factors drove the global cropland expansion into highlands? Earth’s Future 2025, 13, e2024EF005337. [Google Scholar] [CrossRef]
  65. Liu, X.; Pei, F.; Wen, Y.; Li, X.; Wang, S.; Wu, C.; Cai, Y.; Wu, J.; Chen, J.; Feng, K.; et al. Global urban expansion offsets climate-driven increases in terrestrial net primary productivity. Nat. Commun. 2019, 10, 5558. [Google Scholar] [CrossRef] [PubMed]
  66. Jiang, M.; Tian, Y.; Sun, Y.; Guo, X.; Zhao, X.; Yin, L.; Zhang, B. Assessment of the conservation effectiveness of nature reserves on the Qinghai-Tibet plateau using human activity and habitat quality indicators. Ecol. Inform. 2024, 84, 102872. [Google Scholar] [CrossRef]
  67. Shen, C.; Wang, T.; Chi, J. Does the South-to-North Water Diversion Project promote the growth of enterprises above designated size in the water-receiving areas?—Evidence from 31 provincial-level administrative regions in China. PLoS ONE 2024, 19, e0297566. [Google Scholar]
  68. Yang, L.; Xu, H.; Pan, S.; Chen, W.; Zeng, J. Identifying the impact of global human activities expansion on natural habitats. J. Clean. Prod. 2024, 434, 140247. [Google Scholar] [CrossRef]
  69. Wang, Y.X.; Ren, Y.F.; Zhang, B.T.; Li, G.D.; Zhang, F.; Jiang, Q.N. Disentangling the intricate nexus among economic growth, urbanization, carbon emission and human well-being: The evidence from 143 countries. J. Clean. Prod. 2025, 523, 146390. [Google Scholar] [CrossRef]
  70. Guo, X.Y.; Zhang, Y.X.; Guo, D.F.; Lu, W.T.; Xu, H. How does ecological protection redline policy affect regional land use and ecosystem services? Environ. Impact Asses. 2023, 100, 107062. [Google Scholar] [CrossRef]
  71. Shao, Q.; Liu, S.; Ning, J.; Liu, G.; Yang, F.; Zhang, X.; Niu, L.; Huang, H.; Fan, J.; Liu, J. Remote sensing assessment of the ecological benefits provided by national key ecological projects in China during 2000–2019. J. Geogr. Sci. 2023, 33, 1587–1613. [Google Scholar] [CrossRef]
  72. Seto, K.C.; Kaufmann, R.K.; Woodcock, C.E. Landsat reveals China’s farmland reserves, but they’re vanishing fast. Nature 2000, 406, 121. [Google Scholar] [CrossRef]
  73. Sun, X.; Li, Y.; Hu, Y.; Li, Y. Human and natural factors affect habitat quality in ecologically fragile areas: Evidence from Songnen Plain, China. Front. Plant Sci. 2024, 15, 1444163. [Google Scholar] [CrossRef] [PubMed]
  74. Liu, J.X.; Liu, W.X.; Allechy, F.B.; Zheng, Z.W.; Liu, R.; Kouadio, K.L. Machine learning-based techniques for land subsidence simulation in an urban area. J. Environ. Manag. 2024, 352, 120078. [Google Scholar] [CrossRef] [PubMed]
  75. Pouzols, F.M.; Toivonen, T.; Di Minin, E.; Kukkala, A.S.; Kullberg, P.; Kuusterä, J.; Lehtomäki, J.; Tenkanen, H.; Verburg, P.H.; Moilanen, A. Global protected area expansion is compromised by projected land-use and parochialism. Nature 2014, 516, 383–386. [Google Scholar] [CrossRef]
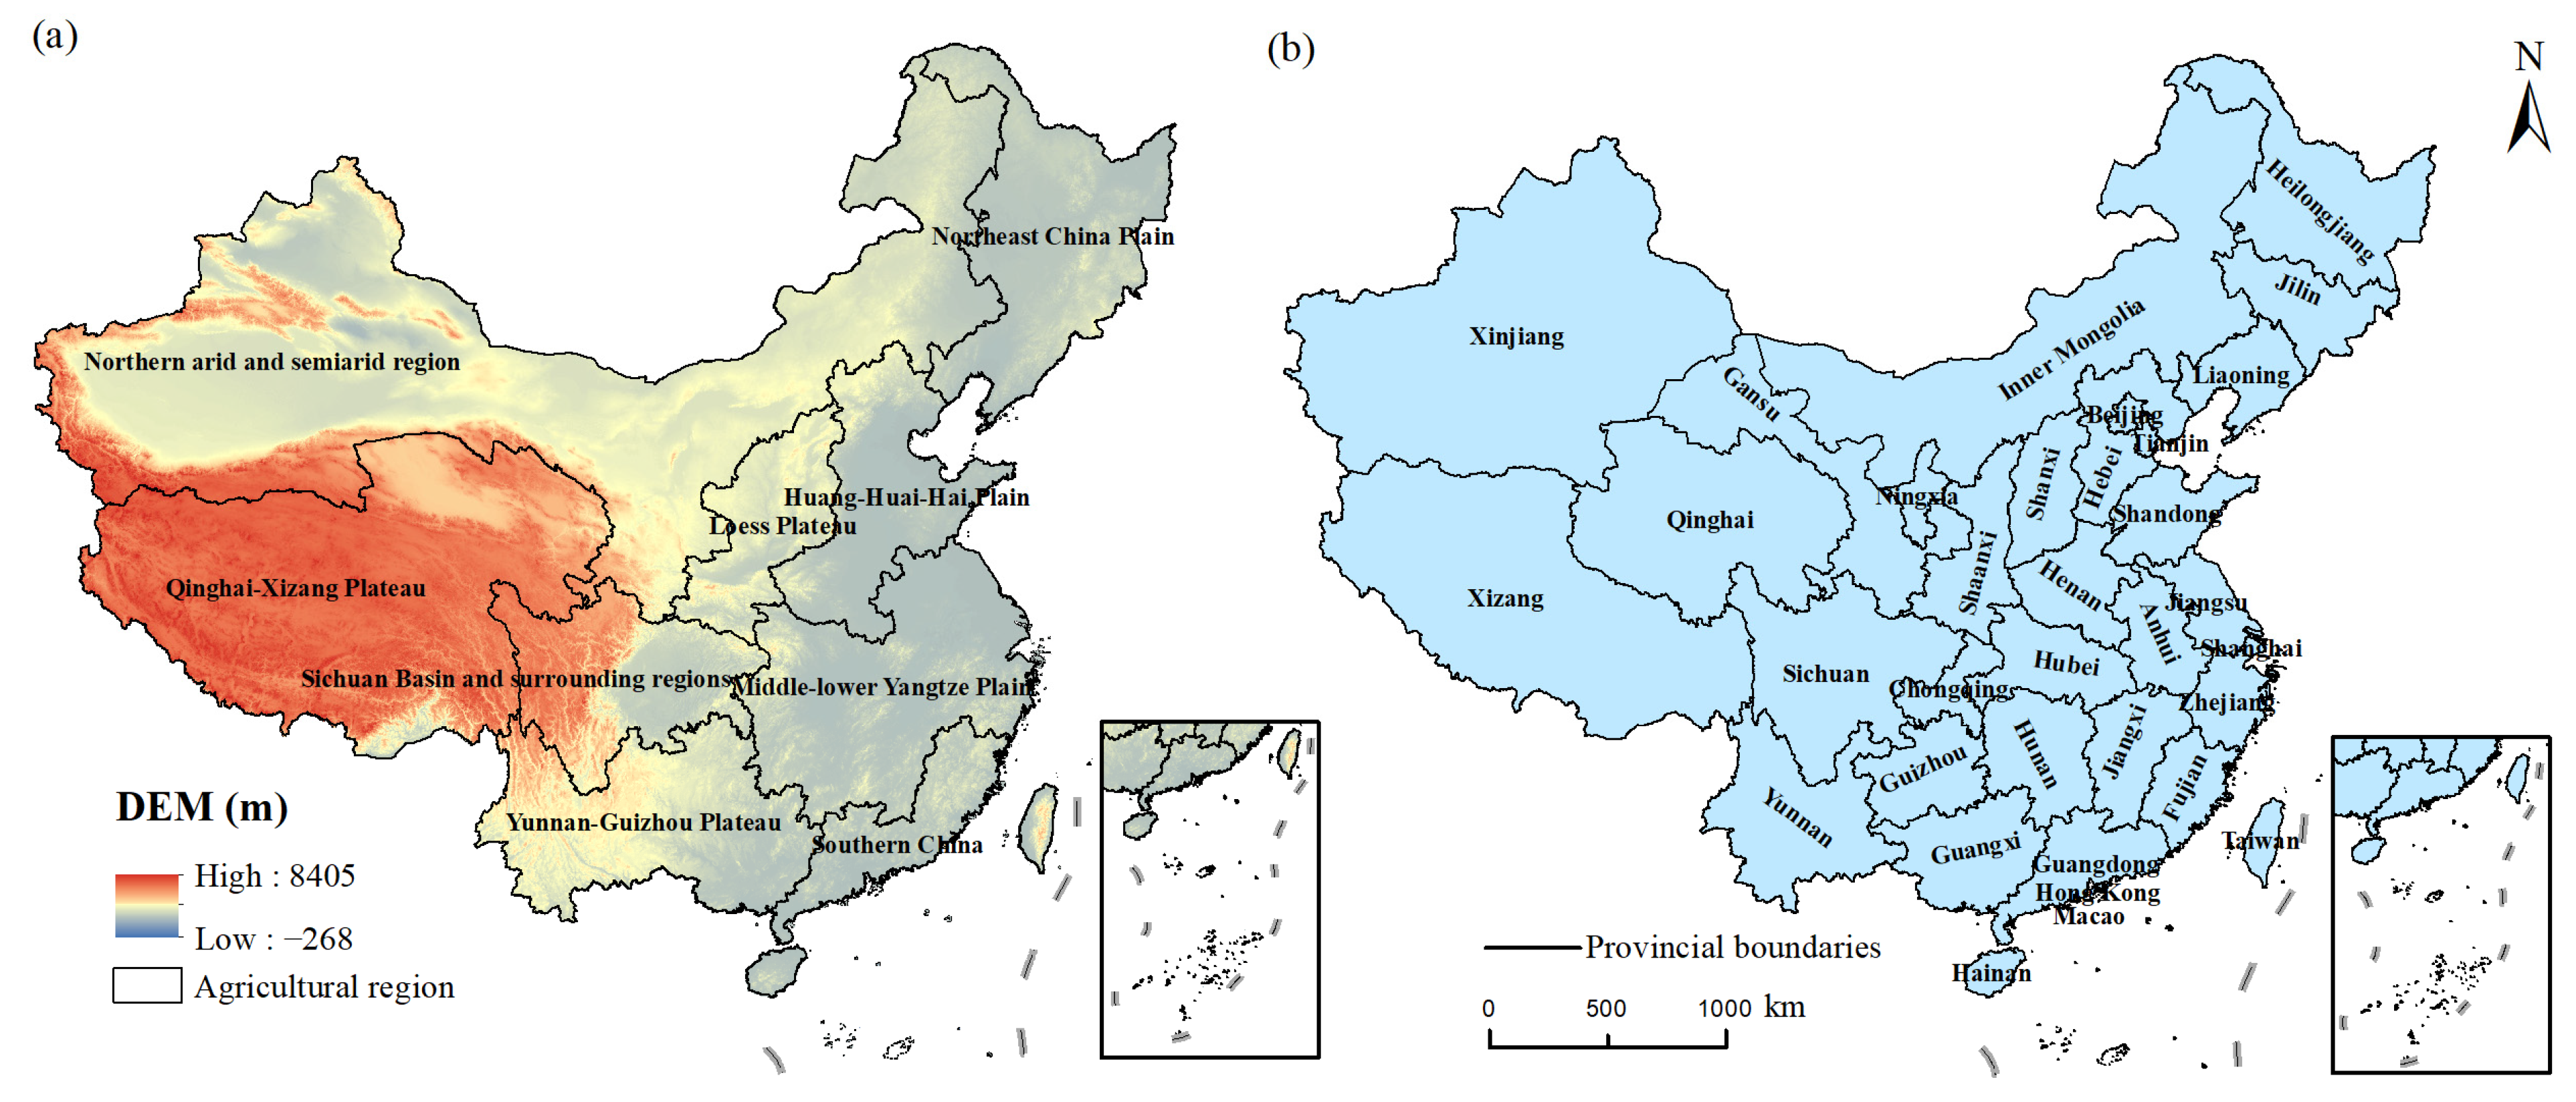
Figure 1. Agricultural region (a) and provincial divisions (b) of the study area.
Land 14 02089 g001
Figure 2. Spatial and temporal distribution characteristics of HQ in China from 2000 to 2020.
Land 14 02089 g002
Figure 3. Changes in HQ in China from 2000 to 2020.
Land 14 02089 g003
Figure 4. Spatial and temporal distribution characteristics of HFP in China from 2000 to 2020.
Land 14 02089 g004
Figure 5. Changes in HFP at the county level in China from 2000 to 2020.
Land 14 02089 g005
Figure 6. Spatial and temporal distribution characteristics of the CCD between HQ and HFP in China from 2000 to 2020.
Land 14 02089 g006
Figure 7. The explanatory power (q value) of influencing factors in different years. “X1” indicates DEM, “X2” indicates slope, “X3” indicates annual average temperature, “X4” indicates average precipitation, “X5” indicates NDVI, “X6” indicates population density, “X7” indicates night-time lights, “X8” indicates GDP, and “X9” indicates LUI. Notes: * p < 0.05, ** p < 0.01, and *** p < 0.001.
Land 14 02089 g007
Figure 8. Interactive detection results for factors. “X1” indicates DEM, “X2” indicates slope, “X3” indicates annual average temperature, “X4” indicates annual average precipitation, “X5” indicates NDVI, “X6” indicates population density, “X7” indicates night-time lights, “X8” indicates GDP, and “X9” indicates LUI.
Land 14 02089 g008
Table 2. Threat factors and related coefficients.
Threat FactorsMaximum Stress Distance/kmWeightDecay
Cropland30.3Linear
Construction land81Exponential
Barran land50.75Exponential
Table 3. Sensitivity of different land types to threat factors.
Land Use TypeHabitat SuitabilityCroplandConstruction LandBarren Land
Cropland0.300.30
Forest land10.650.750.6
Grassland10.60.650.5
Wetland10.550.70.55
Water10.350.50.3
Construction0000
Barren land0.1000
Disclaimer/Publisher’s Note: The statements, opinions and data contained in all publications are solely those of the individual author(s) and contributor(s) and not of MDPI and/or the editor(s). MDPI and/or the editor(s) disclaim responsibility for any injury to people or property resulting from any ideas, methods, instructions or products referred to in the content.