Abstract
In the urgent context of global climate change and carbon neutrality goals, effective carbon balance regulation is critical for achieving temperature control targets. Metropolitan areas encounter significant challenges in carbon emission reduction, energy transition advancement, and enhancement of sequestration capabilities. However, traditional carbon balance analysis methods have limitations in capturing dynamic changes and guiding precise regulation. Therefore, this study developed a dynamic–static classification system for carbon balance based on the Ecological Support Coefficient (ESC) and the Economic Contributive Coefficient (ECC). This system examined carbon emissions and carbon sequestration in China’s 14 national-level metropolitan areas from 2000 to 2020. The results showed that: (1) Carbon emissions showed an increasing trend, exhibiting a spatial distribution with higher levels in the north, moderate levels in the central region, and the lowest levels in the southeast. In contrast, carbon sequestration exhibited a spatial pattern with higher levels in the east, moderate levels in the central region, and lower levels in the west. (2) Static classification revealed that the ECC and ESC of metropolitan areas in the central and northern regions were relatively weaker than those in other regions. Dynamic classification further showed an upward trend in the economic and ecological capabilities of these central and northern metropolitan areas. In contrast, metropolitan areas along the coast and within the Yangtze River Economic Belt needed to optimize their economic–ecological coordination efficiency. Although southern coastal metropolitan areas demonstrated robust economic vitality, they encountered significant ecological support pressures. (3) Economic development level and ecological environmental quality were the predominant factors in metropolitan area classification. Regions with a higher ECC tended to exhibit an enhanced ESC, while regions with a stronger ESC prioritized economic growth. This classification system provided a solid scientific basis for formulating differentiated low-carbon transformation strategies, thereby supporting high-quality development in China’s metropolitan areas while maintaining a dynamic balance between economic and ecologic objectives. Moreover, it offered both theoretical foundations and practical guidance for optimizing sustainable development pathways in similar metropolitan areas globally.
1. Introduction
Carbon balance refers to the equilibrium between carbon emissions and carbon absorption within a region and serves as a critical indicator of the sustainability of ecosystems and economic activities [1]. As research on global climate change progresses, carbon balance has emerged as a pivotal strategy for reducing greenhouse gas emissions and mitigating global warming [2,3]. It represents an essential aspect of global climate change and one of the core strategies for addressing its impact [4,5,6]. In 2008, Achim Steiner first introduced the concept of a carbon-balanced nation, which describes a development model where a country achieves a dynamic balance between greenhouse gas emissions and absorption through measures such as emission reduction, enhancement of carbon sinks, and technologies, such as carbon capture and storage. This framework provides a scientific basis for countries striving towards carbon neutrality [7]. Since then, countries worldwide have set carbon reduction targets and developed strategies to explore ways of reducing emissions and achieving carbon balance [8,9]. However, fossil fuels still account for over 60% of global primary energy consumption, driving rapid increases in carbon emissions. Additionally, urbanization and agricultural expansion have led to the degradation of approximately 40% of global land, diminishing the carbon sequestration capacity of ecosystems. Consequently, in many regions, carbon emissions significantly surpass absorption, exacerbating carbon imbalance. This imbalance poses substantial challenges to achieving carbon neutrality targets. Therefore, enhancing research on carbon balance has become a critical issue of global concern in the international community [10,11,12].
Despite the increasing global awareness of carbon balance, significant disparities in economic structures, resource endowments, and technological capabilities across countries and regions have rendered unified carbon reduction strategies less effective [3]. Carbon balance zoning is a scientific management approach that leverages regional carbon source and sink characteristics to evaluate spatiotemporal distribution differences between regional carbon emissions and absorption. This method addresses issues, such as regional carbon balance disparities, mismatches between economic development and ecological protection, and insufficient carbon compensation capacity [13,14,15]. Currently, traditional carbon balance zoning methods include the indicator-based zoning method and the spatial association zoning method. The former categorizes the study area into carbon surplus zones, carbon balance zones, and carbon deficit zones [16,17,18] based on the relative relationship between regional carbon sources and sinks, thereby establishing a foundation for regional carbon balance zoning. The latter identifies spatial patterns of carbon emission aggregation by employing social network analysis and GIS spatial analysis to uncover synergistic relationships and core–periphery structures among regions [19], thus enabling functions according to carbon emission flow characteristics and spatial associations. In comparison, the indicator-based zoning method provides more direct and effective guidance for regional carbon balance management through quantitative analysis, precise matching, and scientific zoning [14,20,21], which has made it more widely adopted and recognized in practice applications. However, relying exclusively on the two single indicators of carbon emissions and absorption to evaluate regional carbon balance has significant limitations. This approach focuses primarily on the quantitative relationship between regional carbon emissions and absorption but overlooks the complex factors influencing the regional carbon budget process. By integrating “economic performance” and “ecological benefits” into a comprehensive indicator system, this approach addresses the deficiencies of traditional research that narrowly focuses on either “carbon emissions” or “carbon absorption”. Such a multidimensional evaluation framework represents a significant research direction in environmental and ecological economics. In 2012, scholars such as Lu et al. introduced the concepts of the economic contributive coefficient (ECC) and the ecological support coefficient (ESC) to address the imbalance between regional carbon emissions and economic development [22]. By considering both the contribution of economic development to the region and the capacity of the ecological environment to support it, a more integrated “carbon balance zoning model” was established. Based on the alignment between the ECC and ESC, regions were classified into carbon sink development zones, economic development zones, and low-carbon conservation zones, providing robust theoretical support and practical pathways for managing regional carbon balance [23].
Currently, carbon balance zoning research, as a critical tool for addressing climate change, has achieved significant phased results at global, national, provincial, and metropolitan scales [24]. Existing studies have effectively identified the spatial differentiation characteristics of carbon source/sink areas through carbon budget accounting and spatial visualization technologies, revealing the synergistic relationship between regional economic development and ecological protection. By integrating multidimensional driving factors, such as energy structure, industrial evolution, and land use changes, these studies have deepened our understanding of the mechanisms underlying carbon balance formation, providing robust scientific evidence for differentiated governance. Notably, approximately 70% of global carbon emissions are concentrated in urbanized areas [25,26]. Metropolitan areas, as advanced spatial forms of urbanization dominated by core cities and functional urban areas that transcend administrative boundaries [27], exhibit high-density economic activities and intense carbon emissions. Consequently, they are key targets for global carbon governance. Conducting carbon balance zoning research at the metropolitan area scale is not only theoretically essential for addressing the “locked-in carbon emissions” of urban regions but also practically crucial for achieving high-quality, collaborative development of metropolitan areas. While existing research has laid a solid foundation for carbon balance theory, three main limitations remain: First, the methodology predominantly focuses on static cross-sectional analysis, which hinders capturing the dynamic evolution of carbon balance states; Second, the indicator system overly relies on static parameters, lacking time-sensitive indicators that reflect the system’s dynamic responses; Third, most studies concentrate on single regions, limiting the generalizability of conclusions. Addressing these issues, this study proposes a dynamic classification framework that incorporates multiple regions, time dimensions, and indicators of temporal variation intensity. This approach enables a systematic analysis of carbon balance evolution patterns in metropolitan areas at different development stages, thereby providing more adaptable decision support for designing differentiated low-carbon pathways at the regional level.
In 2006, China became the world’s largest carbon emitter, a status that highlighted its critical role in global climate change and posed significant challenges for international climate governance [28,29]. In response, China announced its “30–60” dual carbon goals in 2020, committing to peak carbon emissions before 2030 and achieve carbon neutrality before 2060 [30]. To meet this goal, China has emphasized the dual importance of environmental protection and economic development, advocating for sustainable economic growth while simultaneously reducing carbon emissions. As a result, regional carbon balance has become a critical factor in achieving these targets. Metropolitan areas, as spatial hubs for regional carbon balance governance, play a decisive role in attaining carbon goals due to their distinctive carbon emission characteristics and spatial organization models. Chinese metropolitan areas, as epicenters of urbanization and industrialization, exhibit an urbanization spatial pattern characterized by economic agglomeration, population density, efficient transportation networks, and functional complementarity within a one-hour commuting radius [31,32]. Historically, these regions have accounted for over 30% of the country’s total emissions [33], underscoring their strategic significance in national carbon emission dynamics. By developing metropolitan areas, a coordination mechanism based on shared responsibilities and mutual benefits can be strengthened, fostering urban cooperation and enabling central cities to drive the development of peripheral cities, thereby promoting regional integration and collaborative development, and unlocking the emission reduction potential of integrated regions. Therefore, conducting in-depth research on the carbon balance classification of metropolitan areas, which precisely identifies the carbon emission characteristics of each region through differentiated categorization, and subsequently developing tailored low-carbon strategies, offers a robust scientific foundation for managing urban carbon balance. This method holds practical significance for facilitating regional emission reductions and promoting high-quality collaborative development.
Based on this, this study focuses on 14 national-level metropolitan areas, analyzing their carbon balance status from a spatiotemporal dynamic perspective using carbon emission and carbon sequestration data. By employing a classification framework based on the ECC and ESC and integrating the dynamic characteristics of variation intensity, the study investigates the spatiotemporal evolution of the matching relationship between regional carbon emissions and carbon sequestration. The aim is to enhance the understanding of the carbon budget balance and propose differentiated carbon regulation strategies for metropolitan areas to facilitate the realization of carbon neutrality and sustainable development. The specific objectives are as follows (Figure 1): (1) to analyze the spatiotemporal evolution characteristics of the carbon budget in national-level metropolitan areas, thereby revealing its spatiotemporal variation patterns; (2) to evaluate the distribution of ESC and ECC in metropolitan areas, exploring their roles in maintaining ecological balance and promoting economic development, along with their spatial heterogeneity; and (3) to adopt a combined dynamic-static approach to further examine the evolution patterns of carbon balance status in national-level metropolitan areas.
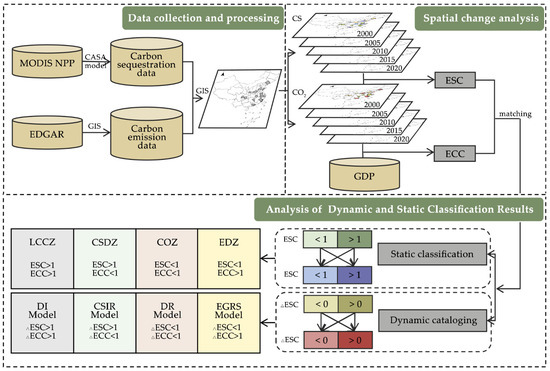
Figure 1.
Research framework.
2. Materials and Methods
2.1. Study Area
The National Development and Reform Commission of China has approved 14 national-level metropolitan areas, which collectively form the study area (Table 1). These metropolitan areas are characterized by “multi-center collaboration, high-density agglomeration, and cross-regional integration” (Figure 2). Their designation is guided by national strategic directives, regional balanced development principles, and evaluations of development potential. These metropolitan areas encompass key growth poles across China’s eastern, central, and western regions. They not only include well-established urban clusters, such as the Yangtze River Delta and Pearl River Delta, to enhance international competitiveness but also incorporate emerging hubs in central and western regions, such as Chengdu, Chongqing, and Xi’an, to promote coordinated regional development. Under unified national planning, their development and governance models exhibit comparability, providing a robust analytical foundation for this study.

Table 1.
Basic information on national-level metropolitan areas.
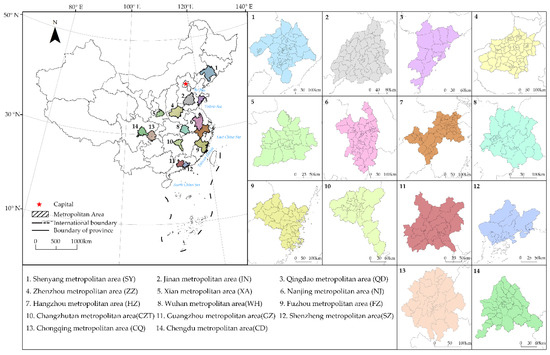
Figure 2.
Distribution of China’s national-level metropolitan areas.
Among these national-level metropolitan areas, Guangzhou, Shenzhen, Hangzhou, and Nanjing are distinguished by their strong focus on the digital economy and high-end manufacturing. Despite their large populations, these regions encounter challenges, such as limited land resources and significant carbon emission pressures. Chengdu, Chongqing, Wuhan, Zhengzhou, Xi’an, and Qingdao leverage their traditional manufacturing bases to foster emerging industries, demonstrating a population distribution characterized by a “strong center, weak periphery” trend. Meanwhile, Shenyang, Changsha–Zhuzhou–Xiangtan (abbreviated as “Chang-Zhu-Tan”), Fuzhou, and Jinan prioritize upgrading old industries and specialized sectors, experiencing relatively slow population growth and notable ecological disparities. Overall, a clear gradient pattern emerges: eastern regions lead in innovation, central and western regions focus on industrial upgrading, while the northeast emphasizes revitalization. Population movement and ecological carrying capacity serve as critical constraints. Given that these national-level metropolitan areas account for over 30% of the country’s total economic output and carbon emissions, and considering the substantial disparities in development stages, industrial structures, and resource endowments, this study aims to explore their carbon balance zoning. Through an in-depth analysis of the carbon balance matching status of these national-level metropolitan areas, we aim to identify differentiated transformation models and provide replicable and scalable governance frameworks to achieve the national “dual carbon” goals.
2.2. Research Data
This paper primarily employs the following types of data for its research (Table 2):
Table 2.
Data sources.
(1) The carbon emission data utilized in this study were sourced from the Emissions Database for Global Atmospheric Research (EDGAR) [34]. EDGAR is a globally recognized greenhouse gas emissions database collaboratively developed by the European Commission’s Joint Research Centre (JRC) and the International Energy Agency (IEA). It provides estimates of greenhouse gas emissions from 1970 to 2022, covering major gases, such as CO2, CH4, and N2O, with a spatial resolution of 0.1° × 0.1° (approximately 11.1 km × 11.1 km). The database integrates activity data from organizations such as IEA and FAO, the scientific literature and expert judgments, and is widely used for national emission inventories, climate change research, and policy formulation, offering critical support for global climate change responses.
(2) GDP data were derived from the China GDP Spatial Distribution Grid Data Set [35]. This dataset was generated through spatial interpolation using county-level GDP statistical data, taking into considering multiple factors, such as land use types and population density, with a spatial resolution of 1 km × 1 km.
(3) Net primary productivity (NPP) data were obtained from NASA’s MOD17A3H dataset [36], which is based on satellite remote sensing data from MODIS (Moderate Resolution Imaging Spectroradiometer). The dataset provides annual net primary productivity (NPP) information at a spatial resolution of 500 m.
The carbon sequestration data can be derived by utilizing NPP. The specific calculation formula is presented as follows [37]:
where, CS is the carbon sequestration amount, and NPP is the net primary productivity (kg C·m2).
2.3. Research Methods
Carbon balance coefficient analysis evaluates regional carbon balance from both economic and ecological dimensions by calculating the ECC and ESC. The matching types are based on the combined characteristics of the ECC and ESC, dividing the region into different functional zones to implement differentiated carbon management strategies.
2.3.1. Carbon Balance Coefficient Analysis
(1) Economic Contributive Coefficient (ECC)
The ECC is an indicator that measures the contribution of carbon emissions to economic growth in a region, reflecting the economic value created per unit of carbon emission [38,39,40]. The calculation formula is as follows:
where and represent the GDP of a specific region and the total GDP of the metropolitan area to which the region belongs, respectively; and and represent the carbon emissions of a specific region and the total carbon emissions of the metropolitan area to which the region belongs, respectively.
When ECC > 1, it indicates that the economic contribution rate is greater than the contribution rate of carbon emissions, suggesting that the region has higher energy efficiency and carbon productivity. When ECC < 1, it indicates that the region has relatively weak energy efficiency and carbon productivity.
(2) Ecological Support Coefficient (ESC)
The ESC is an indicator that measures the carbon sequestration capacity of a region, reflecting the carbon absorption capacity corresponding to each unit of carbon emission. The calculation formula is as follows:
where and represent the carbon sequestration amount of a specific region and the total carbon sequestration of the metropolitan area to which the region belongs, respectively; and and represent the carbon emissions of a specific region and the total carbon emissions of the metropolitan area to which the region belongs, respectively.
When ESC > 1, it indicates that the carbon sequestration capacity of the region exceeds the carbon absorption capacity relative to carbon emissions, suggesting that the region still has some capacity and redundancy in carbon sequestration. When ESC < 1, it indicates that the region’s ecosystem is under excessive carbon emission pressure and its carbon sequestration capacity is relatively weak.
2.3.2. Carbon Balance Type Classification
(1) Static Classification Model
The static classification method of carbon balance types utilized the ECC and ESC as the horizontal and vertical axes, with a threshold of 1 to divide regions into four types. Specifically, the ESC reflects a region’s relative advantage in carbon sequestration capacity, while the ECC measures the carbon efficiency of economic activities. This dual-index design not only considers the absolute amount of carbon emissions but also incorporates the relative contributions of regions in both economic and ecological dimensions, thereby providing a more comprehensive characterization of regional carbon balance patterns.
Table 3 presents the static classification results of carbon balance types, which are divided into the low-carbon conservation zone (LCCZ), carbon sink development zone (CSDZ), comprehensive optimization zone (COZ), and economic development zone (EDZ) [13,21]. The detailed descriptions of each zone are provided as follows:
Table 3.
Static classification of carbon balance.
- LCCZ: This indicates that the region’s ECC exceeds its carbon emissions contribution, and its ESC also exceeds carbon emissions. This zone has high carbon emission economic efficiency and strong ecological support capacity.
- CSDZ: This indicates that the region’s ECC is lower than its carbon emissions contribution, but its ESC exceeds carbon emissions, suggesting a strong ecological support capacity.
- COZ: This indicates that the region’s ECC is lower than its carbon emissions contribution, and its ESC is also lower than carbon emissions, with both low-carbon emission economic efficiency and weak ecological support capacity.
- EDZ: This indicates that the region’s ECC is higher than its carbon emissions contribution, but its ESC is lower than its carbon emissions. This zone has high carbon emission economic efficiency but weak ecological support capacity.
(2) Dynamic Classification Model
Although the static classification method can reflect the carbon balance characteristics at a specific point in time, it fails to capture the evolutionary process of regional carbon balance. To address this limitation, this study developed a dynamic matching classification method based on the variation intensity of the ECC and ESC. This method calculates the temporal change rates of both coefficients to capture the dynamic evolution trends of regional economic contribution and ecological carrying capacity. Specifically, the dynamic classification method not only considers the absolute values of the coefficients but also incorporates their rate of change, enabling the identification of regional transition pathways and potential in carbon balance development. The specific formula is as follows:
In this context, ∆ECC and ∆ESC represent the change intensities of the ECC and ESC, respectively; ECCa and ECCb represent the ECC values at time points a and b, respectively; and ESCa and ESCb represent the ESC values at time points a and b, respectively.
The results illustrate the classification outcomes of the dynamic model in Table 4. Using the change intensities of the ECC and ESC as the horizontal and vertical coordinates, combined with the four-quadrant method, four dynamic types based on the dual coefficients are classified: the Dual Increase Model (DI Model), Carbon Sink Increase with Economic Reduction Model (CSIR Model), Dual Reduction Model (DR Model), and Economic Growth with Carbon Sink Reduction Model (EGRS Model). The specifics are as follows:
Table 4.
Dynamic classification of carbon balance.
- DI Model: Both coefficients have positive change intensities, indicating that the carbon emission increase effect driven by economic growth is more pronounced, while the ecosystem’s carrying capacity is also improving.
- CSIR Model: Economic activities contribute less to carbon emissions, while the ecosystem’s carrying capacity is increasing (this is the ideal state).
- DR Model: Economic activities contribute less to carbon emissions, and the ecosystem’s carrying capacity is also decreasing.
- EGRS Model: Economic activities contribute more to carbon emissions, while the ecosystem’s carrying capacity is decreasing.
3. Results
3.1. Spatiotemporal Evolution of Carbon Balance in National-Level Metropolitan Areas
3.1.1. Spatiotemporal Evolution of Carbon Emissions in National-Level Metropolitan Areas
Regarding total carbon emissions (Figure 3), the carbon emissions of the 14 national-level metropolitan areas exhibited an upward trend between 2000 and 2020, increasing from 1029.68 Mt in 2000 to 3556.32 Mt in 2020, with an annual growth rate of 6.39%. This growth could be divided into two distinct phases: a rapid growth phase (2000–2010), followed by a slower growth phase (2010–2020). Specifically, carbon emissions growth rate increased sharply by 73.67% from 2000 to 2005, then rose further by 54.19% from 2005 to 2010. After 2010, the growth rate of carbon emissions began to slow. From 2010 to 2015, the growth rate decreased to 16.82%, and between 2015 and 2020, it further decelerated to 10.41%, indicating a transition toward stabilization.
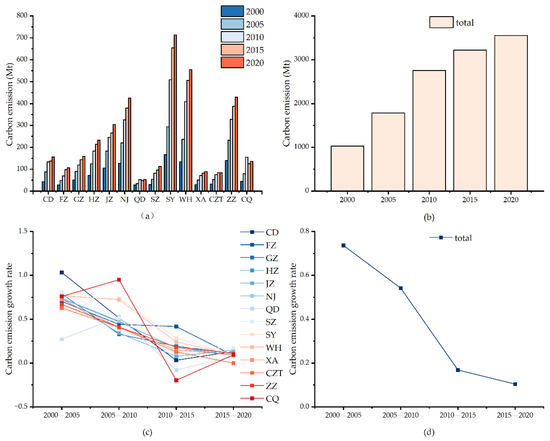
Figure 3.
Changes in carbon emissions of national-level metropolitan areas from 2000 to 2020: (a) Trend of carbon emissions changes, (b) Trend of total carbon emissions changes, (c) Growth trend of carbon emissions, (d) Growth trend of total carbon emissions.
At the level of individual metropolitan areas, significant variations in carbon emissions were observed. Between 2000 and 2005, carbon emissions increased sharply across all metropolitan areas, except for the Qingdao metropolitan area, with growth rates exceeding 60% in each region. From 2005 to 2010, China implemented energy-saving and emission-reduction policies, which were complemented by a range of measures, including enhancing industrial energy efficiency and formulating strategies to mitigate climate change in response to rising energy consumption and environmental degradation. During this period, except for Shenyang, Wuhan, and Chongqing, the carbon emission growth rates of the other metropolitan areas began to decline. Between 2010 and 2015, China restructured its industrial composition and established mandatory energy-saving and emission-reduction targets, which further slowed carbon emissions growth. In this phase, only the Fuzhou metropolitan area recorded a growth rate above 40%. From 2015 to 2020, China intensified its focus on emissions reduction and enforced stricter policies to achieve green, low-carbon, and sustainable development objectives. Consequently, carbon emissions growth stabilized across metropolitan areas, with growth rates generally around 10%, while the Chang-Zhu-Tan metropolitan area even experienced negative growth.
From the spatial changes of national-level metropolitan areas (Figure 4), the carbon emissions spatial pattern remained relatively stable. The distribution characteristics showed that the northern region had the highest emissions than the south, and the southeast had the lowest emissions. From 2000 to 2020, the high-carbon emission areas expanded to six, with an average carbon emission of 443.43 Mt. As a result, their share of total emissions increased to 74.81%. At the same time, the low-carbon emission areas, which were mainly located in the western and southern regions, decreased in number from eight to one. Although the average carbon emissions in these areas rose from 35.83 Mt to 52.57 Mt, their share of total emissions drastically decreased from 27.83% to 1.84%.
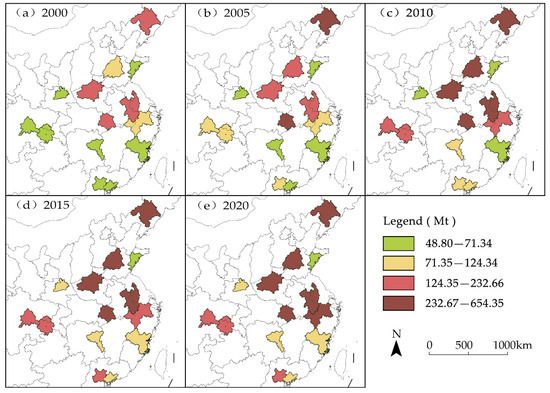
Figure 4.
Spatiotemporal pattern of carbon emissions in national-level metropolitan areas from 2000 to 2020.
In summary, during the study period from 2000 to 2020, the carbon emissions of national-level metropolitan areas exhibited significant changes. Driven by national policies, metropolitan areas generally transitioned from a phase of rapid growth to a phase of slower growth. Meanwhile, considerable heterogeneity was observed in the spatial patterns of carbon emissions among different metropolitan areas.
3.1.2. The Spatiotemporal Evolution Characteristics of Carbon Sequestration in National-Level Metropolitan Areas
In terms of total carbon sequestration (Figure 5), from 2000 to 2020, the carbon sequestration in national-level metropolitan areas showed a fluctuating growth trend. From 2000 to 2005, carbon sequestration exhibited slow growth, increasing from 1.490 × 10⁶ t in 2000 to 1.765 × 10⁶ t in 2005. From 2005 to 2010, carbon sequestration stagnated at 1.764 × 10⁶ t, with a growth rate of −0.06%. Afterward, carbon sequestration began to rise steadily again, increasing from 1.943 × 10⁶ t in 2015 to 1.990 × 10⁶ t in 2020, with a growth rate of 2.42%.
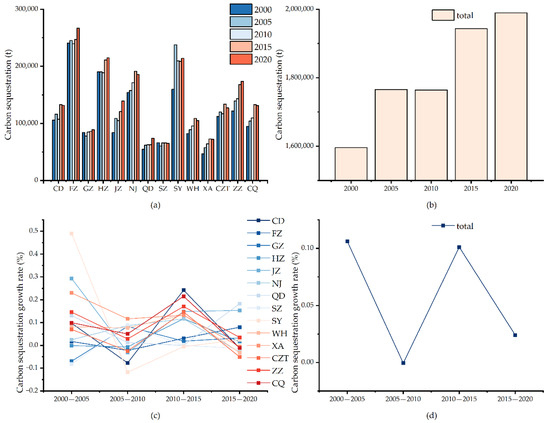
Figure 5.
Changes in carbon sequestration in national-level metropolitan areas from 2000 to 2020: (a) Trends in carbon sequestration, (b) Total carbon sequestration, (c) Growth Trends in carbon sequestration, (d) Growth Trends in total carbon sequestration.
There were significant differences in carbon sequestration across national-level metropolitan areas from 2000 to 2020. Between 2000 and 2005, the carbon sequestration in Guangzhou, Shenzhen, and Hangzhou metropolitan areas declined, with rates of change of −6.91%, −8.24%, and −0.09%, respectively. However, as the national government placed more emphasis on environmental protection, ecological restoration, and policies, such as the “National Ecological Environment Construction Plan”, carbon sinks began to increase. Subsequently, carbon sequestration exhibited a steady upward. In 2010, China actively explored the establishment of a carbon emission trading market and focused on enhancing forestry carbon sink projects, a key strategy for achieving carbon neutrality goals. As a result, although the carbon sequestration in Jinan, Chengdu, Shenyang, Fuzhou, and Chang-Zhu-Tan metropolitan areas experienced varying degrees of decline, the overall rate of change remained relatively minor, reflecting a more stable sequestration trend. By 2015, only the Shenyang metropolitan area exhibited a slight decline in carbon sequestration, with a decrease of 968.36 t. With further efforts in strengthening the implementation and management of forestry carbon sink projects, by 2020, the carbon sequestration in national-level metropolitan areas continued to maintain a steady growth trajectory.
Despite this, the carbon sequestration in Wuhan, Xi’an, Chongqing, Chengdu, Jinan, Shenzhen and Nanjing metropolitan areas showed a decline in 2020, with reductions exceeding −0.50%. This trend suggested that, although national policies supporting carbon sequestration had a positive impact, national-level metropolitan areas still faced notable challenges and pressures in their carbon sequestration efforts.
In terms of spatial changes, the spatial pattern of carbon sequestration was characterized by the highest sequestration in the eastern region, followed by the central region, and the lowest in the western region (Figure 6). From 2000 to 2020, the geographical distribution of high-carbon sequestration areas underwent significant shifts, expanding from the southeastern region to the entire eastern region. The number of high-sequestration areas increased from two to five, with the average carbon sequestration rising from 173,291.36 t to 210,933.31 t. Moreover, their contribution to total carbon sequestration grew from 23.25% to 53.01%. The changes in low-value sequestration areas were relatively minor. Initially, low-value areas included the metropolitan areas of Qingdao, Shenzhen, Wuhan, and Xi’an, but by 2020, only Qingdao, Shenzhen, and Wuhan remained in this category. The average carbon sequestration in these low-value areas rose from 62,371.50 t to 70,490.49 t, while their share of total carbon sequestration declined from 16.74% to 10.63%.
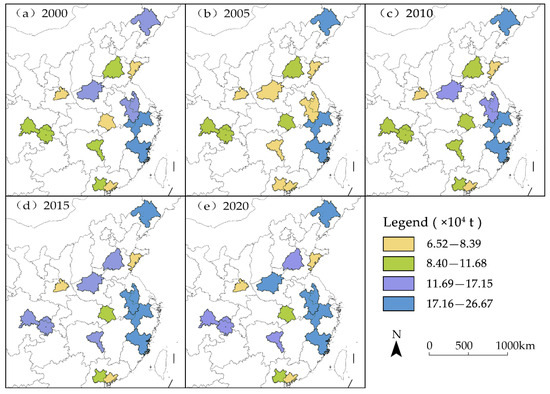
Figure 6.
Spatiotemporal pattern of carbon sequestration in national-level metropolitan areas from 2000 to 2020.
Between 2000 and 2020, the carbon sequestration trends in national-level metropolitan areas exhibited significant dynamic characteristics. Specifically, the carbon sequestration capacity of national-level metropolitan areas exhibited clear growth both in magnitude and spatial distribution. This underscores the significant achievements China has made in ecological environment construction and low-carbon development. It also reflects China’s strong determination and effectiveness in promoting green development and achieving sustainable development goals.
3.2. Evolution of Carbon Balance Patterns in National-Level Metropolitan Areas Based on Economic Contributive Coefficient and Ecological Support Coefficient
3.2.1. Spatiotemporal Evolution Characteristics of Economic Contributive Coefficient
During the study period, the spatial distribution of the ECC across all national-level metropolitan areas generally exhibited a pattern of lower values in the central region and higher values along the coast (Figure 7). Coastal metropolitan areas, such as Shenzhen, Guangzhou, Fuzhou, and Qingdao, consistently maintained ECC values above 1.45, ranking among the highest across all metropolitan areas, and indicating high energy efficiency. In contrast, metropolitan areas in central regions had ECC values mostly ranging between 0 and 1.45, which fluctuated over time. Notably, the Wuhan and Shenyang metropolitan areas consistently recorded ECC values below 1, placing them at the lowest levels across all national-level metropolitan areas throughout the study period.
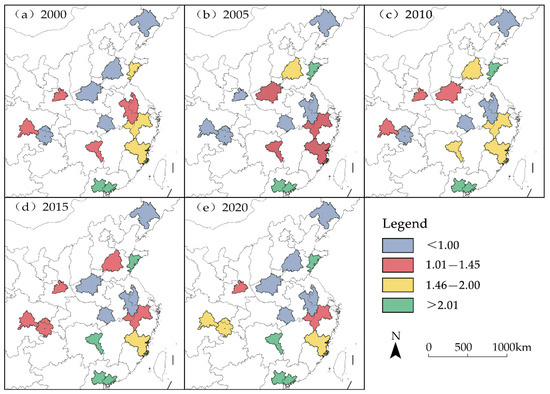
Figure 7.
Changes in the economic contributive coefficient of national-level metropolitan areas from 2000 to 2020.
From 2000 to 2005, the coastal metropolitan areas, such as Guangzhou, Shenzhen, and Qingdao, had ECC values exceeding 2, while inland metropolitan areas, such as Shenyang, Chongqing, and Wuhan, exhibited comparatively lower levels. Meanwhile, The ECC of metropolitan areas in Zhengzhou and Jinan rose significantly, with eight national-level metropolitan areas recording ECC values than 1. Between 2005 and 2010, ECC values for inland metropolitan areas rose significantly, and reduced the number of metropolitan areas with an ECC below 1 to four. However, Guangzhou, Shenzhen, and Qingdao remained the only coastal metropolitan areas with ECC values above 2. From 2010 to 2015, ECC values remained generally stable, and maintained the status quo. In the period from 2015 to 2020, metropolitan areas such as Chongqing, Chengdu, and Chang-Zhu-Tan showed significant increases in their ECC, while only Guangzhou, Shenzhen, Chang-Zhu-Tan, and Qingdao maintained ECC values above 2.
Overall, 71.43% of national-level metropolitan areas recorded ECC values greater than 1 during the study period, demonstrating high economic output and growth momentum. Specifically, the metropolitan areas exhibiting an upward ECC trend included Chengdu, Guangzhou, Xi’an, Chang-Zhu-Tan, and Chongqing. Areas with fluctuating ECC trends were Fuzhou, Hangzhou, Nanjing, Shenzhen, Wuhan, Qingdao and Zhengzhou. Meanwhile, metropolitan areas experiencing a declining ECC trend included Jinan, and Shenyang.
3.2.2. Spatiotemporal Evolution Characteristics of Ecological Support Coefficient
From 2000 to 2020, significant spatial differences were observed in the ESC across national-level metropolitan areas (Figure 8). The spatial distribution of ESC was consistent with that of the ECC, low-value areas were primarily located in the northern and southern regions, while areas with fluctuating ECC trends were found in the southwest and central-south regions. metropolitan areas such as Chengdu, Fuzhou, Qingdao, Shenzhen, and Xi’an maintained an ESC value consistently above 1, with Fuzhou’s ESC consistently exceeding 1.93, indicating strong ecological conditions and a relatively stable ecosystem in this region. In contrast, metropolitan areas such as Jinan, Nanjing, Zhengzhou, Shenyang, and Wuhan had ESC values below 1, which suggested that the ecological support capacity in these regions needs to be strengthened.
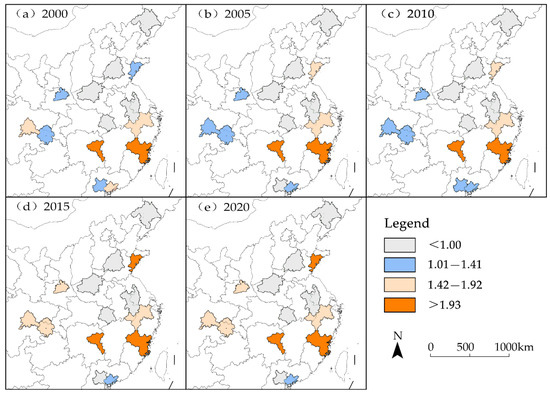
Figure 8.
Changes in the ecological support coefficient of national-level metropolitan areas from 2000 to 2020.
The ESC of national-level metropolitan areas remained relatively stable throughout the study period, with no significant upward or downward trends. Specifically, the ESC of Shenzhen exhibited a declining trend, while Qingdao demonstrated an increasing trajectory. For other metropolitan areas, there were no notable fluctuations in ESC over the study period.
3.3. Carbon Balance Matching Relationship of National-Level Metropolitan Areas Based on Economic Contributive Coefficient and Ecological Support Coefficient
3.3.1. Static Classification
From 2000 to 2020, the static classification of national-level metropolitan areas based on ESC and ECC exhibited a diversified pattern (Figure 9). By 2020, these classifications gradually converged, primarily concentrating in the LCCZ and COZ. This shift reflects a clearer and more unified development trajectory in national-level metropolitan areas as they sought to balance economic development and environmental protection.
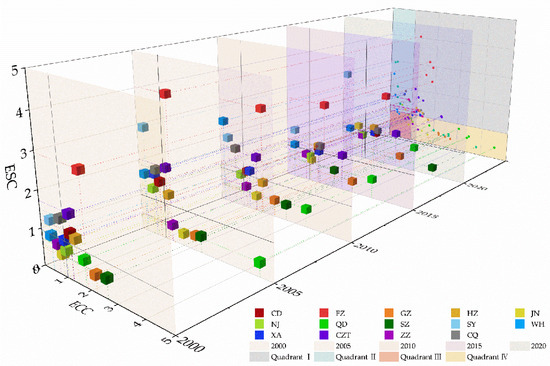
Figure 9.
The static classification changes of ECC and ESC in national-level metropolitan areas from 2000 to 2020.
Specifically, the classification results of seven national-level metropolitan areas remained stable. The metropolitan areas of Fuzhou, Chang-Zhu-Tan, Qingdao, Shenzhen, and Hangzhou remained consistently in the LCCZ. In contrast, the Shenyang and Wuhan metropolitan areas were situated in the COZ.
The Fuzhou and Chang-Zhu-Tan metropolitan area exhibited ESC values significantly exceeding their ECC values. Notably, the ESC of Fuzhou was three times greater than its ECC, highlighting the strong potential of its ecological environment to support economic activities. The Chang-Zhu-Tan metropolitan area demonstrated a balanced trajectory, maintaining an equilibrium between economic growth and environmental protection over time.
In contrast, the metropolitan areas of Qingdao and Shenzhen had ECC significantly higher than their ESC, emphasizing the substantial economic advantages of these developed regions. The Hangzhou metropolitan area maintained a stable development pattern, with both coefficients remaining relatively balanced throughout the study period.
The metropolitan areas of Shenyang and Wuhan exhibited ECC slightly lower than their ESC, maintaining a relatively balanced state overall. However, both coefficients remained consistently below 1, keeping these areas in the COZ for an extended period. The carbon sequestration capacity and economic development levels in these metropolitan areas were insufficient to fully support their current carbon emission levels, resulting in significant pressure to reduce emissions.
The metropolitan areas of Chengdu, Xi’an, Chongqing, and Guangzhou underwent brief transitions between types before ultimately stabilizing in the LCCZ.
As the only three national-level metropolitan areas in the western region, Chengdu, Xi’an, and Chongqing exhibited similar patterns, with relatively balanced ECC and ESC values. They were primarily positioned near the boundary between the first and second quadrants of the coordinate system. While driving economic growth, these metropolitan areas simultaneously prioritized environmental protection, striving for a win–win situation between economic development and ecological preservation.
The Guangzhou metropolitan area, a coastal city, enjoyed significant advantages in economic activity. Its ECC outpaced its ESC, reflecting strong economic growth potential. After experiencing a brief phase of rapid economic expansion and increased environmental pressure, both coefficients gradually stabilized, fostering a positive synergy between economic development and environmental protection.
The metropolitan areas of Jinan, Nanjing, and Zhengzhou exhibited fluctuating static classifications during the research period. Their ECC and ESC remained unbalanced, shifting mainly between the EDZ and COZ, ultimately settling in the COZ. These three metropolitan areas consistently maintained a leading GDP share, but their carbon sequestration performance remained moderate. As environmental awareness and carbon reduction efforts intensified, pure economic expansion was no longer the sole objective; instead, a dual transition integrating economic growth and environmental sustainability became imperative.
3.3.2. Dynamic Classification
From 2000 to 2020, the variation intensity of the ESC and ECC of the 14 national-level metropolitan areas gradually shifted from multiple types to a single type (Figure 10):
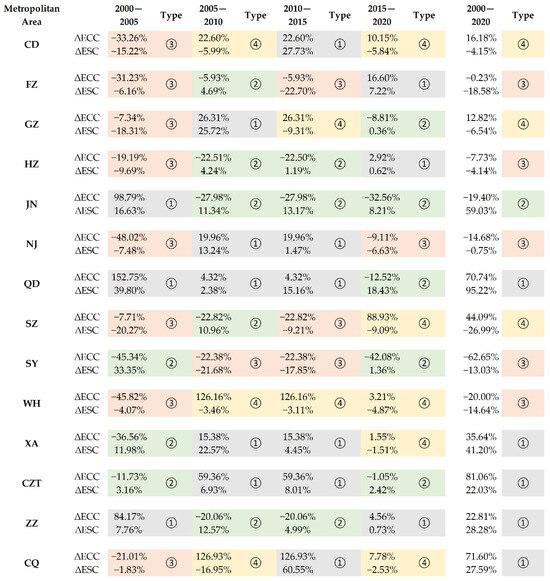
Figure 10.
The dynamic classification changes of ECC and ESC in national-level metropolitan areas from 2000 to 2020: ① dual increase model (DI Model), ② carbon sink increase with economic reduction model (CSIR Model), ③ dual reduction model (DR Model), ④ economic growth with carbon sink reduction model (EGRS Model).
Between 2000 and 2015, the variation intensity of the dual coefficients exhibited diverse and volatile transformation types. However, from 2015 to 2020, these transitions stabilized, primarily concentrating in Type ② and Type ④. Furthermore, it can be observed that the dynamic evolution trajectory of the dual coefficients in national-level metropolitan areas generally presented four distinct trends:
(1) Stable Trend: The dynamic variation intensity of the coefficients remained basically unchanged. Overall, after the first type of transformation, the national-level metropolitan areas in this category tended to maintain the same type of variation trend. These metropolitan areas included the Jinan, Qingdao, and Wuhan.
The Jinan metropolitan area (①→②→②→②) actively mitigated its economic growth rate through ecological conservation in the Yellow River Basin and the transition to new driving forces. actively slowed down its economic growth rate, promoting continuous ecological benefits. However, its reliance on traditional industries and lack of cross-city collaboration limited its shift from the “high carbon lock-in, low eco-efficiency” model to the “dual growth” model.
The Qingdao metropolitan area (①→①→①→②) capitalized on its marine economy and green industrial transformation, successfully achieving simultaneous ecological and economic growth.
The Wuhan metropolitan area (③→④→④→④) leveraged the Central Yangtze River city cluster to drive economic expansion through industrial clusters in optoelectronics, integrated circuits, and digital technology. However, persistent ecological deficits kept Wuhan locked in Type ③ for two decades.
(2) Cyclic Trend: The variation intensity of both coefficients fluctuated cyclically, returning to their original classification by the end of the study period. The national-level metropolitan areas exhibiting this cyclic trend included Chang-Zhu-Tan, Zhengzhou, Nanjing, and Shenyang.
The Chang-Zhu-Tan metropolitan area (②→①→①→②) and the Zhengzhou metropolitan area (①→②→②→①), despite undergoing fluctuations, ultimately achieved balance within the Dual Increase Model (Type ①). The former accomplished this through the governance of the Xiangjiang River Basin and the greening of the construction machinery industry, while the latter relied on ecological restoration of the Yellow River floodplain and industrial collaboration between Zhengzhou and Kaifeng, effectively addressing the “strong core, weak periphery” contradiction in the central metropolitan areas during a strategic opportunity period.
The Nanjing metropolitan area (③→①→①→③) and Shenyang metropolitan area (②→③→③→②) faced system resilience constraints. Despite Nanjing’s efforts in Yangtze River coastline restoration and cross-provincial innovation corridors, high land development intensity of 32.7% exacerbated its Type ③ classification. Similarly, Shenyang, as a traditional industrial hub, pursued intelligent manufacturing transformation and pollution control but struggled with population loss and carbon lock-in effects, leaving it trapped in the economic–environmental dual reduction dilemma.
(3) Positive Trend: The variation intensity of the coefficients gradually shifted from the economic growth with carbon sink reduction model (Type ④) to the ecological growth with economic reduction model (Type ②). After undergoing multiple transformations during the study period, the national-level metropolitan areas in this trend eventually moved towards the more desirable ecological growth with economic reduction model. These metropolitan areas included Hangzhou, Fuzhou, and Guangzhou.
The metropolitan areas of Hangzhou and Fuzhou exhibited similar eco-economic transformation paths (③→②→①). This suggests that both significantly improved their ecological governance and collaborative efficiency through integrated management of the Qiantang River Basin (Hangzhou metropolitan area) and the marine ecological product value realization mechanism (Fuzhou metropolitan area). However, their long-term dynamic trajectories still indicated they remained in the Type ③, reflecting that under rapid economic expansion, they continued to face challenges, such as intensifying land development pressure nearing thresholds and ongoing coastal ecological restoration.
In contrast, the Guangzhou metropolitan area followed a nonlinear fluctuation path (③→①→④→②). By leveraging the industrial collaboration advantages of the Guangdong-Hong Kong-Macau Greater Bay Area, it achieved economic agglomeration. However, the degradation of the Pearl River Estuary wetlands and the increase in carbon emission intensity exposed the lag in its low-carbon transformation. This underscored the urgent need to balance the expansion of advanced manufacturing clusters with the ongoing pursuit of carbon neutrality goals.
(4) Declining Trend: In contrast to the positive trend, this type of national-level metropolitan area experienced a shift from a relatively ideal Type ② to Type ④ during the study period. These metropolitan areas included Shenzhen, Xi’an, Chengdu, and Chongqing.
The Shenzhen metropolitan area underwent a spiral evolution with the path (③→②→③→④). Initially, significant ecological restoration efforts yielded positive results, but later, high-intensity development impacts led to a shift. Ultimately, the metropolitan area relied on its digital economy advantages and cross-domain industrial collaboration to achieve a low-carbon transformation, highlighting the feasibility of overcoming ecological constraints through technological iteration in economic agglomeration areas.
The Xi’an metropolitan area, starting from Type ②, focused on economic growth in the context of ecological protection in the Yellow River Basin and the Belt and Road Initiative’s land port construction. This demonstrated the development priority choices faced by inland hub cities during strategic opportunities.
The Chengdu and Chongqing metropolitan areas shared a similar trajectory (③→④→①→④). However, the Chongqing metropolitan area achieved an 18.5% reduction in energy consumption per unit GDP by relying on the construction of the upstream ecological barrier of the Yangtze River, while the Chengdu metropolitan area still needed to address the spatial conflict between arable land protection and industrial expansion. This underscored the key impact of regional resource endowment differences on system resilience within a similar strategic framework.
4. Discussion
4.1. Spatiotemporal Evolution Patterns of Carbon Emissions and Sequestration in China’s National-Level Metropolitan Areas
The total carbon emissions in China’s national-level metropolitan areas exhibited an overall upward trend during the study period, transitioning from a phase of rapid growth to one of slow growth. This trend is consistent with other studies conducted in both domestic and international regions [24,41,42,43,44]. Specifically, the rapid increase in carbon emissions was driven by multiple factors, such as energy consumption patterns, economic development stages, and population growth [45,46,47,48,49]. However, under the influence of government-implemented energy-saving and carbon-reduction policies, these metropolitan areas adopted strategies, such as optimizing energy structures, promoting technological innovation and application, and establishing market mechanisms, to effectively curb the growth of carbon emissions. As a result, the rate of carbon emissions growth began to slow down. Spatially, China’s national-level metropolitan areas demonstrated significant spatial differentiation. Inland and old industrial base metropolitan areas, characterized by a high proportion of traditional industries and coal-based energy structures, coupled with delayed river basin ecological restoration, experienced high carbon balances. In contrast, coastal and emerging economic metropolitan areas, driven by the integration of the digital economy, clean energy substitution, and marine carbon sink development, established a “low emissions—high carbon sequestration” carbon balance optimization pattern. The east-west gradient difference reflected a transformation pathway divergence of an “inland high-carbon lock-in” and a “coastal low-carbon transition.” Further investigation revealed that this spatial differentiation is intricately related to regional economic development levels, the speed of industrial structure transformation, and the effectiveness of policy implementation. In the future, as the carbon market mechanism matures and green technologies diffuse, the carbon emission pattern of national-level metropolitan areas is expected to shift from “east-west differentiation” to “multi-point collaboration”, providing a novel spatial governance model for achieving regional carbon balance.
4.2. Carbon Balance Matching Relationship in China’s National-Level Metropolitan Areas
Under the static carbon balance classification, China’s national-level metropolitan areas exhibited a significant dual-track differentiation pattern. Progressive metropolitan areas achieve simultaneous improvements in both ECC and ESC through deep integration of the digital economy and ecological industrialization, demonstrating the feasibility of synergistic economic–ecological gains under a green growth model. Their success was driven by technological innovation in low-carbon industries, supported by carbon trading markets (ETS) and green financial instruments that established a “low emissions—high value-added—strong carbon sequestration” virtuous cycle. These practices provided replicable regional models for carbon neutrality, particularly in coastal metropolitan areas.
In contrast, underperforming metropolitan areas (Jinan, Nanjing, Shenyang) were constrained by three structural barriers: (1) path dependency on traditional industries, (2) deficient cross-jurisdictional coordination mechanisms, (3) fragmented ecological governance systems. Their ECC and ESC values remained below 1, trapping them in a “high carbon lock-in—inefficient governance” model. Political pressures from the national carbon peaking/neutrality agenda intensified local governments’ accountability, while ETS and green finance policies partially redirected resources toward low-carbon sectors. However, policy effectiveness was limited by regional disparities and institutional implementation capacity gaps.
From the dynamic carbon balance perspective, metropolitan area emission trajectories were closely aligned with Five-Year Plan strategies: During the 10th Five-Year Plan period (2001–2005), economic expansion correlated strongly with carbon emission growth. The 11th Five-Year Plan (2006–2010) initiated a low-carbon pathway, with energy consumption per unit of GDP declining, but total carbon emissions still continued to rise. In the 12th Five-Year Plan (2011–2015), stricter industry access regulations and the promotion of renewable energy led to the first decline in carbon emission intensity, with some coastal metropolitan areas experiencing an inflection point in total carbon emissions. The 13th Five-Year Plan (2016–2020) focused on controlling total carbon emissions and enhancing carbon sequestration capacity.
This evolutionary process revealed the carbon balance transcended technical-economic dimensions, embodying institutional design sophistication and governance modernization. In the future, it will be necessary to further strengthen the three-dimensional coordination of “policy tools—market mechanisms—technological innovation” and drive carbon neutrality from goal-oriented actions to system reconstruction through dynamic carbon balance adaptation.
4.3. Low-Carbon Pathways of National-Level Metropolitan Areas Based on the Carbon Balance Classification Method
In accordance with the national dual-carbon goals, national-level metropolitan areas should proactively explore and implement low-carbon development strategies to facilitate the green transformation and sustainable development of the economy and society. In this process, low-carbon maintenance areas, which are most consistent with the core principles of low-carbon development, should be established as a shared objective for all metropolitan areas. Each metropolitan area should prioritize this goal, optimizing industrial structures, enhancing energy efficiency, promoting green transportation and buildings, and reinforcing ecological protection and restoration, thereby progressively transitioning towards low-carbon maintenance areas.
Based on the static and dynamic classification results of the national-level metropolitan areas, we observed the following: when a metropolitan area was categorized as an economic development area in the static classification, its dynamic classification frequently exhibited the characteristics of “carbon sink increase and economic reduction” (Type ②). This indicates that carbon sequestration capacity increased, while economic growth slowed compared to the previous rate. Conversely, when a national-level metropolitan area was classified as a carbon sink development area in the static classification, the corresponding dynamic classification result was predominantly “economic growth and carbon sink reduction” (Type ④), implying that these areas experienced rapid economic development alongside a decline in carbon sequestration capacity. This phenomenon highlights the intricate interplay between economic development and ecological environmental protection in metropolitan areas. It suggested that achieving sustainable development requires balancing economic growth with significant emphasis on ecological protection and restoration.
Therefore, to realize low-carbon development, national-level metropolitan areas must advance green transformation and optimize their industrial structure according to their unique characteristics, reinforce ecological restoration and carbon sink management, and ensure harmonious coordinated development of the economy and the environment. The specific transitions were as follows:
(1) I: Continuously optimize the industrial structure, improve energy efficiency, and strengthen ecological protection on the existing foundation to maintain and optimize the low-carbon model. The experience of this model can provide guidance for metropolitan areas with low-carbon foundations or good ecological endowments. Through the “industrial upgrading–ecological value enhancement” dual-driven framework, it promotes the replication of a high-efficiency, low-emission development model, facilitating a systemic transition towards low-carbon maintenance areas. This approach was suitable for metropolitan areas such as Chengdu, Fuzhou, Guangzhou, Hangzhou, Qingdao, Shenzhen, Xi’an, Chang-Zhu-Tan, and Chongqing.
(2) III → II → I: Based on the economic industrial structure and resource endowment of the metropolitan area, priority should have been given to strengthening ecological carrying capacity, thereby enhancing the regional carbon sink function. Then, actively promote the development of green and low-carbon industries to drive sustainable economic growth. By leveraging local natural resource advantages, this model aims to achieve synergistic progress between economic growth and ecological protection, ultimately achieving a positive interaction between the two. The “ecology first—industrial iteration” path can offer guidance for traditional industrial bases and ecologically fragile areas, solving high-carbon lock-in issues through policy support and institutional innovation, and achieving the coordinated optimization of economy and ecology. This approach is suitable for metropolitan areas such as Shenyang, Jinan, and Zhengzhou.
(3) III → IV → I: Based on fully utilizing the ecological and environmental advantages of metropolitan areas, initially optimize the industrial structure, enhance economic strength, and simultaneously promote energy conservation, emission reduction, and the development of green, low-carbon industries. Then, based on economic vitality, improve ecological quality and transition to a low-carbon development area. Gradually guide metropolitan areas towards low-carbon development areas, achieving dual improvements in both the economy and ecology. The “economic–ecological” bidirectional gain path can provide guidance for ecologically rich areas, avoiding the “pollute first, clean up later” trap through a dynamic balancing mechanism, and achieving high-quality development in coordination with the carbon neutrality goal. This approach is suitable for metropolitan areas such as Nanjing and Wuhan.
This study’s analysis of China’s metropolitan classification framework and transition pathways showed its broad applicability, offering insights for global low-carbon urban development. Cities worldwide have long faced a dilemma between economic growth and ecological conservation. For instance, the Ruhr region in Germany and the Rust Belt in the United States experienced “economic slowdown–ecological restoration” [50,51], while emerging industrial cities in Southeast Asia struggled with “economic growth–ecological degradation” [52]. This suggests that cities at different development stages share common low-carbon transition patterns, making this study’s approach a useful reference.
Developed regions that completed industrialization pursued low-carbon industrial transformation through green technology innovation and ecological product valuation [53,54]. Traditional industrial bases and ecologically fragile areas adopted a synergistic ecological restoration and industrial substitution approach, using policy tools to support emerging industries [50,51,55]. Meanwhile, regions with abundant natural resources but relatively weaker economies fostered ecological industrialization by leveraging their natural assets for sustainable development [56].
4.4. Limitations and Future Outlook
Although this study systematically investigated the spatial differentiation of carbon balance matching in China’s national-level metropolitan areas through an ECC-ESC classification framework, its metropolitan areas analysis limited insights into intra-regional carbon flow dynamics and driving mechanisms. Future research should explore the following directions: By integrating high-resolution remote sensing data with micro-level enterprise carbon emission data, a multi-layered analysis framework spanning “metropolitan area–functional zone–enterprise” could be developed, enhancing the precision of carbon balance assessments. Introducing a dynamic policy response module would allow for the quantification of contributions from green technology innovation and industrial restructuring to carbon balance optimization, improving the model’s predictive and regulatory capabilities. Conducting long-term studies on the effectiveness of policy interventions, such as carbon trading and green finance, would provide empirical evidence for refining policy approaches.
These advancements would help transition carbon balance matching from a “static description” to a “dynamic governance” framework, providing more actionable scientific insights for achieving regional carbon neutrality goals.
5. Conclusions
This study uses the ECC and ESC to perform static classification of the carbon balance in 14 national metropolitan areas. Additionally, based on the intensity of changes in these two coefficients, a dynamic classification is conducted to comprehensively assess the carbon balance status of these national-level metropolitan areas. On this basis, targeted carbon neutrality paths are proposed for national-level metropolitan areas of different classifications, aiming to promote the coordinated progress of economic development and ecological environmental protection in metropolitan areas. The research results show that:
(1) The total carbon emissions and carbon sequestration in the 14 national-level metropolitan areas have shown an overall upward trend. However, the annual growth rate of carbon emissions has been effectively controlled at only 6.39%. In contrast, the development of carbon sequestration is much more rapid, with an annual growth rate as high as 33.51%.
(2) Coastal national-level metropolitan areas, leveraging their open advantages and industrial agglomeration effects, have formed high-value areas in terms of the ECC. However, the high intensity of development has led to a generally low ESC. Central metropolitan areas, constrained by their inland location and industrial structure, have a relatively lower ECC, but rely on the ecological foundation of the Yangtze and Yellow River basins, resulting in a higher ESC.
(3) From the static classification perspective, 65% of national-level metropolitan areas have successfully transitioned to LCCZ during the study period, showing a positive trend toward transitioning to a green low-carbon development model. However, metropolitan areas such as Jinan, Nanjing, Shenyang, Wuhan, and Zhengzhou are still classified as COZ. These regions are constrained by traditional industrial inertia, lack of inter-regional coordination, and fragmented ecological governance. They need to overcome the dual constraints of “high-carbon lock-in and inefficient governance” through institutional innovation (such as ecological compensation), technological empowerment (such as green transformation), and precise policy coordination, accelerating their full-scale green transformation.
From the dynamic classification perspective, the carbon balance changes in the 14 national-level metropolitan areas closely align with the carbon neutrality policy orientation promoted by the national government, fully reflecting a positive response to the carbon neutrality goals outlined in the country’s long-term development plans.
Author Contributions
Conceptualization, M.L. and Y.Y.; methodology, M.L., M.Z. and P.W.; software, M.L. and M.Z.; validation, N.S., Y.R. and Y.Y.; investigation, D.Z.; resources, P.W.; data curation, M.L. and D.Z.; writing—original draft preparation, M.L. and D.Z.; writing—review and editing, P.W. and Y.Y.; visualization, M.L. and N.S. All authors have read and agreed to the published version of the manuscript.
Funding
This research was funded by National Natural Science Foundation of China (42001132).
Data Availability Statement
All data and materials are available upon request.
Conflicts of Interest
The authors declare no conflicts of interest.
Abbreviations
The following abbreviations are used in this manuscript:
| ECC | Economic Contributive Coefficient |
| ESC | Ecological Support Coefficient |
| LCCZ | Low-Carbon Conservation Zone |
| CSDZ | Carbon Sink Development Zone |
| COZ | Comprehensive Optimization Zone |
| EDZ | Economic Development Zone |
| DI | Dual Increase Model |
| CSIR | Carbon Sink Increase with Economic Reduction Model |
| DR | Dual Reduction Model |
| EGRS | Economic Growth with Carbon Sink Reduction Model |
References
- Mancini, M.S.; Galli, A.; Niccolucci, V.; Lin, D.; Bastianoni, S.; Wackernagel, M.; Marchettini, N. Ecological Footprint: Refining the carbon Footprint calculation. Ecol. Indic. 2016, 61, 390–403. [Google Scholar] [CrossRef]
- Evro, S.; Oni, B.A.; Tomomewo, O.S. Global strategies for a low-carbon future: Lessons from the US, China, and EU’s pursuit of carbon neutrality. J. Clean. Prod. 2024, 461, 142635. [Google Scholar] [CrossRef]
- Piao, S.; Fang, J.; Ciais, P.; Peylin, P.; Huang, Y.; Sitch, S.; Wang, T. The carbon balance of terrestrial ecosystems in China. Nature 2009, 458, 1009–1013. [Google Scholar] [CrossRef]
- United Nations Framework Convention on Climate Change. THE PARIS AGREEMENT. Available online: https://unfccc.int/sites/default/files/chinese_paris_agreement.pdf (accessed on 8 September 2024).
- United Nations. United Nations Framework Convention on Climate Change. Available online: https://unfccc.int/sites/default/files/convchin.pdf (accessed on 9 January 2024).
- United Nations. Kyoto Protocol. Available online: https://unfccc.int/resource/docs/convkp/kpchinese.pdf (accessed on 12 October 2024).
- UN Environment Management Group. Moving Towards a Climate Neutral UN The UN System’s Footprint and Efforts to Reduce It. 2009. Available online: https://www.icao.int/environmental-protection/Documents/CNUN_report_09.pdf (accessed on 9 January 2024).
- Kassai, J.R.; Feltran-Barbieri, R.; Carvalho, L.N.; Cintra, Y.C.; Afonso, L.E.; Foschine, A. The Environmental balance sheet of nations: Reflections on global climate change scenarios. Braz. Bus. Rev. 2012, 9, 60–102. [Google Scholar] [CrossRef][Green Version]
- Hahn, T.; Morfeldt, J.; Höglund, R.; Karlsson, M.; Fetzer, I. Estimating countries’ additional carbon accountability for closing the mitigation gap based on past and future emissions. Nat. Commun. 2024, 15, 9707. [Google Scholar] [CrossRef]
- Guo, R.; Zhao, Y.; Shi, Y.; Li, F.; Hu, J.; Yang, H. Low carbon development and local sustainability from a carbon balance perspective. Resour. Conserv. Recycl. 2017, 122, 270–279. [Google Scholar] [CrossRef]
- Yue, C.; Xu, M.; Ciais, P.; Tao, S.; Shen, H.; Chang, J.; Li, W.; Deng, L.; He, J.; Leng, Y.; et al. Contributions of ecological restoration policies to China’s land carbon balance. Nat. Commun. 2024, 15, 9708. [Google Scholar] [CrossRef]
- Shigeto, S.; Yamagata, Y.; Ii, R.; Hidaka, M.; Horio, M. An easily traceable scenario for 80% CO2 emission reduction in Japan through the final consumption-based CO2 emission approach: A case study of Kyoto-city. Appl. Energy 2012, 90, 201–205. [Google Scholar] [CrossRef]
- Guo, H.; Sun, W. Carbon Balance Zoning and Spatially Synergistic Carbon Reduction Pathways—A Case Study in the Yangtze River Delta in China. Land 2024, 13, 943. [Google Scholar] [CrossRef]
- Wu, J.; Liu, C.; Guo, H.; Li, P.; Sun, W. Examining intra-city carbon budget and carbon balance zoning based on firm-level big data: A case study of Nanjing, China. Ecol. Indic. 2024, 166, 112304. [Google Scholar] [CrossRef]
- Li, J.; Guo, X.; Chuai, X.; Xie, F.; Yang, F.; Gao, R.; Ji, X. Reexamine China’s terrestrial ecosystem carbon balance under land use-type and climate change. Land Use Policy 2021, 102, 105275. [Google Scholar] [CrossRef]
- Tian, H.; Melillo, J.; Lu, C.; Kicklighter, D.; Liu, M.; Ren, W.; Xu, X.; Chen, G.; Zhang, C.; Pan, S.; et al. China’s terrestrial carbon balance: Contributions from multiple global change factors. Glob. Biogeochem. Cycles 2011, 25, GB1007. [Google Scholar] [CrossRef]
- Li, S.; Liu, Y.; Wei, G.; Bi, M.; He, B.-J. Carbon surplus or carbon deficit under land use transformation in China? Land Use Policy 2024, 143, 107218. [Google Scholar] [CrossRef]
- He, J.; Liu, X.; Wang, X.; Li, X.; Yu, L.; Niu, B. Spatiotemporal Evolution of Territorial Spaces and Its Effect on Carbon Emissions in Qingdao City, China. Land 2024, 13, 1717. [Google Scholar] [CrossRef]
- Guo, W.Q.; Shi, R.X.; Lei, M.; Wei, X.Y.; Zhang, W.P. Structural characteristics and carbon balance zoning of interprovincial carbon emission spatial correlation network in China. Acta Ecol. Sin. 2024, 44, 8003–8020. [Google Scholar] [CrossRef]
- Pei, J.; Niu, Z.; Wang, L.; Song, X.-P.; Huang, N.; Geng, J.; Wu, Y.-B.; Jiang, H.-H. Spatial-temporal dynamics of carbon emissions and carbon sinks in economically developed areas of China: A case study of Guangdong Province. Sci. Rep. 2018, 8, 13383. [Google Scholar] [CrossRef]
- Zhang, Z.; Jin, G. Spatiotemporal differentiation of carbon budget and balance zoning: Insights from the middle reaches of the Yangtze River Urban Agglomeration, China. Appl. Geogr. 2024, 167, 103293. [Google Scholar] [CrossRef]
- Lu, J.Y.; Huang, J.X.; Chen, Y.; Xiao, X. Temporal and spatial evolution of carbon footprint in China’s provincial regions based on energy consumption. Geogr. Res. 2013, 32, 326–336. [Google Scholar]
- Xue, H.; Shi, Z.; Huo, J.; Zhu, W.; Wang, Z. Spatial difference of carbon budget and carbon balance zoning based on land use change: A case study of Henan Province, China. Environ. Sci. Pollut. Res. 2023, 30, 109145–109161. [Google Scholar] [CrossRef]
- Xiong, S.; Yang, F.; Li, J.; Xu, Z.; Ou, J. Temporal-spatial variation and regulatory mechanism of carbon budgets in territorial space through the lens of carbon balance: A case of the middle reaches of the Yangtze River urban agglomerations, China. Ecol. Indic. 2023, 154, 110885. [Google Scholar] [CrossRef]
- World Bank Group. United Nations Population Division. World Urbanization Prospects: 2018 Revision. Available online: https://data.worldbank.org/indicator/SP.URB.TOTL.IN.ZS (accessed on 20 August 2024).
- Yang, Y.; Bao, W.; Liu, Y. Coupling coordination analysis of rural production-living-ecological space in the Beijing-Tianjin-Hebei region. Ecol. Indic. 2020, 117, 106512. [Google Scholar] [CrossRef]
- United Nations Statistics Division. Statistical Products and Databases. Available online: https://unstats.un.org/unsd/demographic/products/default.htm (accessed on 10 September 2024).
- Rodríguez, M.; Pena-Boquete, Y. Carbon intensity changes in the Asian Dragons. Lessons for climate policy design. Energy Econ. 2017, 66, 17–26. [Google Scholar] [CrossRef]
- Fan, Y.; Liu, L.-C.; Wu, G.; Tsai, H.-T.; Wei, Y.-M. Changes in carbon intensity in China: Empirical findings from 1980–2003. Ecol. Econ. 2007, 62, 683–691. [Google Scholar] [CrossRef]
- The State Council, The People’s Republic of China. Opinions of the Central Committee of the Communist Party of China and the State Council on the Complete, Accurate and Comprehensive Implementation of the New Development Concept to Do a Good Job of Carbon Peak Carbon Neutrality. Available online: https://www.gov.cn/zhengce/2021-10/24/content_5644613.htm (accessed on 16 August 2024).
- Chen, T.; Gu, Y.; Zou, B. China’s commuting-based metropolitan areas. J. Urban Econ. 2024, 144, 103715. [Google Scholar] [CrossRef]
- Brown, M.A.; Southworth, F.; Sarzynski, A. The geography of metropolitan carbon footprints. Policy Soc. 2009, 27, 285–304. [Google Scholar] [CrossRef]
- Yi, C.D.; Ceng, S.A. Research on collaborative governance of carbon emission in metropolitan area under the “double carbon” target. J. Cent. Party Sch. 2023, 27, 96–104. [Google Scholar] [CrossRef]
- Crippa, M.; Guizzardi, D.; Butler, T.; Keating, T.; Wu, R.; Kaminski, J.; Kuenen, J.; Kurokawa, J.; Chatani, S.; Morikawa, T.; et al. The HTAP_v3.1 emission mosaic: Merging regional and global monthly emissions (2000–2018) to support air quality modelling and policies. Earth Syst. Sci. Data 2023, 15, 2667–2694. [Google Scholar] [CrossRef]
- Huang, Y.; Jiang, D.; Fu, J. 1 km Grid GDP Dataset of China (2005, 2010); Global Change Research Data Publishing and Repository: Beijing, China, 2014. [Google Scholar] [CrossRef]
- Running, S.; Zhao, M. MODIS/Terra Net Primary Production Gap-Filled Yearly L4 Global 500m SIN Grid V061. Available online: https://lpdaac.usgs.gov/products/mod17a3hgfv061/ (accessed on 20 September 2024).
- Luo, J.; Zhou, X.L.; Li, L.; Niu, Y.D.; Xu, J.L.; Wu, X.L.; Yao, M.; Wang, Y.; Zhang, Z.H.; Chen, B.; et al. Assessment of forest ecosystem services in ecological green heart area of Changsha-Zhuzhou-Xiangtan urban agglomeration. Hunan For. Sci. Technol. 2021, 6, 50–56. [Google Scholar] [CrossRef]
- Liu, X.; Wei, Y.; Jin, X.; Luo, X.; Zhou, Y. County-level carbon compensation zoning based on China’s major function-oriented zones. J. Environ. Manag. 2024, 367, 121988. [Google Scholar] [CrossRef]
- Rong, T.; Zhang, P.; Jing, W.; Zhang, Y.; Li, Y.; Yang, D.; Yang, J.; Chang, H.; Ge, L. Carbon Dioxide Emissions and Their Driving Forces of Land Use Change Based on Economic Contributive Coefficient (ECC) and Ecological Support Coefficient (ESC) in the Lower Yellow River Region (1995–2018). Energies 2020, 13, 2600. [Google Scholar] [CrossRef]
- Fan, M.; Wang, Z.; Xue, Z. Spatiotemporal evolution characteristics, influencing factors of land use carbon emissions, and low-carbon development in Hubei Province, China. Ecol. Inform. 2024, 81, 102567. [Google Scholar] [CrossRef]
- Mengist, W.; Soromessa, T. Assessment of forest ecosystem service research trends and methodological approaches at global level: A meta-analysis. Environ. Syst. Res. 2019, 8, 22. [Google Scholar] [CrossRef]
- Li, Z.-Z.; Li, R.Y.M.; Malik, M.Y.; Murshed, M.; Khan, Z.; Umar, M. Determinants of Carbon Emission in China: How Good is Green Investment? Sustain. Prod. Consum. 2021, 27, 392–401. [Google Scholar] [CrossRef]
- Zhang, D.; Zhao, Y.; Wu, J. Assessment of carbon balance attribution and carbon storage potential in China’s terrestrial ecosystem. Resour. Conserv. Recycl. 2023, 189, 106748. [Google Scholar] [CrossRef]
- Xu, P.; Zhou, G.; Zhao, Q.; Lu, Y.; Chen, J. Spatial-temporal dynamics and influencing factors of city level carbon emission of mainland China. Ecol. Indic. 2024, 167, 112672. [Google Scholar] [CrossRef]
- Dong, F.; Yu, B.; Hadachin, T.; Dai, Y.; Wang, Y.; Zhang, S.; Long, R. Drivers of carbon emission intensity change in China. Resour. Conserv. Recycl. 2018, 129, 187–201. [Google Scholar] [CrossRef]
- Wang, G.; Deng, X.; Wang, J.; Zhang, F.; Liang, S. Carbon emission efficiency in China: A spatial panel data analysis. China Econ. Rev. 2019, 56, 101313. [Google Scholar] [CrossRef]
- Wang, Z.; Zhu, Y.; Zhu, Y.; Shi, Y. Energy structure change and carbon emission trends in China. Energy 2016, 115, 369–377. [Google Scholar] [CrossRef]
- Zhang, G.; Chang, F.; Liu, J. Carbon emission prediction of 275 cities in China considering artificial intelligence effects and feature interaction: A heterogeneous deep learning modeling framework. Sustain. Cities Soc. 2024, 114, 105776. [Google Scholar] [CrossRef]
- Han, X.; Cao, T.; Sun, T. Analysis on the variation rule and influencing factors of energy consumption carbon emission intensity in China’s urbanization construction. J. Clean. Prod. 2019, 238, 117958. [Google Scholar] [CrossRef]
- Neumann, T. Remaking the Rust Belt: The Postindustrial Transformation of North America; University of Pennsylvania Press: Philadelphia, PA, USA, 2016. [Google Scholar]
- Röhl, K.-H. Das Ruhrgebiet: Der anhaltende industrielle Strukturwandel im Spiegel der Regionalpolitik. Wirtschaftsdienst 2019, 99, 49–55. [Google Scholar] [CrossRef]
- Bong, A.; Premaratne, G. Regional integration and economic growth in Southeast Asia. Glob. Bus. Rev. 2018, 19, 1403–1415. [Google Scholar] [CrossRef]
- Tyner, E.H.; Boyer, T.A. Applying best-worst scaling to rank ecosystem and economic benefits of restoration and conservation in the Great Lakes. J. Environ. Manag. 2020, 255, 109888. [Google Scholar] [CrossRef]
- Fan, P.; Ouyang, Z.; Basnou, C.; Pino, J.; Park, H.; Chen, J. Nature-based solutions for urban landscapes under post-industrialization and globalization: Barcelona versus Shanghai. Environ. Res. 2017, 156, 272–283. [Google Scholar] [CrossRef]
- Sahoo, M.; Sethi, N. The dynamic impact of urbanization, structural transformation, and technological innovation on ecological footprint and PM2.5: Evidence from newly industrialized countries. Environ. Dev. Sustain. 2022, 24, 4244–4277. [Google Scholar] [CrossRef]
- Fan, P.; Chen, J.; John, R. Urbanization and environmental change during the economic transition on the Mongolian Plateau: Hohhot and Ulaanbaatar. Environ. Res. 2016, 144, 96–112. [Google Scholar] [CrossRef]
Disclaimer/Publisher’s Note: The statements, opinions and data contained in all publications are solely those of the individual author(s) and contributor(s) and not of MDPI and/or the editor(s). MDPI and/or the editor(s) disclaim responsibility for any injury to people or property resulting from any ideas, methods, instructions or products referred to in the content. |
© 2025 by the authors. Licensee MDPI, Basel, Switzerland. This article is an open access article distributed under the terms and conditions of the Creative Commons Attribution (CC BY) license (https://creativecommons.org/licenses/by/4.0/).