Abstract
Accurate and reliable precipitation data are important for analyzing regional precipitation distribution, water resource management, and ecological environment construction. Due to the scarcity of meteorological stations in the Turpan–Hami region, precipitation observation conditions are limited, and it is difficult to obtain precipitation data. Firstly, the applicability of TRMM 3B43v7, GPM_3IMERGM 06, and CMORPH CDR satellite precipitation data for the Turpan–Hami Region was evaluated, and the products with better applicability were selected. Next, the Extreme Gradient Boosting Algorithm (XGBoost) and the Shapley Additive Explanations for Machine Learning (SHAP) model were combined to carry out a feature importance analysis on the climate factors affecting precipitation (mean temperature, actual evapotranspiration, wind speed, cloud cover), from which climate factors with a greater influence on precipitation were selected. Combined with climate factors, normalized difference vegetation index (NDVI), slope, aspect, and elevation as explanatory variables, a Multi-Scale Geographically Weighted Regression (MGWR) model was constructed to obtain the monthly precipitation data of 1 km spatial resolution in the Turpan–Hami area from 2001 to 2020. Finally, the spatiotemporal distribution characteristics and changing trend of precipitation in the Turpan–Hami region from 2001 to 2020 were analyzed. The results show that (1) GPM_3IMERGM 06 satellite precipitation data exhibits good applicability in the Turpan–Hami region. (2) The precision verification of the downscaling results from a monthly scale and an annual scale shows that the accuracy and spatial resolution of the data are improved after downscaling. (3) From 2001 to 2020, the precipitation in the Turpan–Hami region showed an insignificantly increasing trend.
1. Introduction
Precipitation is an important component of the climate system and the global water cycle [1], with significant impacts on global ecosystems, energy cycles, water resource allocation, etc. [2,3,4,5]. Reliable precipitation data are essential for conducting scientific research, such as hydrological process modeling, flood forecasting, and water resource monitoring [6]. Traditional precipitation observations based on meteorological stations are constrained by topographical and environmental factors, making it difficult to obtain the spatial and temporal distribution of precipitation [7,8,9,10]. Satellite precipitation data products are not limited by terrain, have wide coverage, and are capable of monitoring continuous spatial and temporal changes in precipitation, especially in areas where information is scarce or unavailable, exhibiting additional obvious advantages [11].
Advances in remote sensing technology have led to the widespread use of satellite precipitation products, for instance, the Tropical Rainfall Measuring Mission (TRMM) [12], the Global Precipitation Measurement Mission (GPM) [13], and the Climate Prediction Center (CPC) Morphing Technique (CMORPH), etc. [14]. Satellite precipitation observation effectively makes up for the deficiencies that exist in traditional observation methods, but due to its own inversion algorithms, sample uncertainty, and the influence of complex hydrometeorological elements, the accuracy of the product may vary in different areas, so it is crucial to make an assessment of the performance of the satellite precipitation data before using it [15,16]. When satellite precipitation products are applied to hydrological studies in localized areas, the spatial resolution is still coarse and cannot present the subtle changes in the spatial distribution of precipitation [17]. Therefore, improving the spatial resolution of satellite precipitation products is a difficult problem that needs to be solved immediately.
Downscaling makes it possible to convert data information from big scales and poor spatial resolution to small scales and great spatial resolution [18]. A wide variety of statistical downscaling models, such as the exponential regression model [19], the multiple linear regression model [20], the random forest model [21], the improved multiple linear regression model [22], the artificial neural network model [23], etc., are applied to spatial downscaling studies of precipitation data. These models presume that the relationship between precipitation and environmental variables is spatially homogeneous, ignoring the spatial heterogeneity between precipitation and environmental variables, which can easily lead to overfitting and scale-matching errors [24].
The selection of environmental variables in the spatial downscaling process is crucial. Precipitation is a complex process that is influenced by a variety of environmental variables such as surface features, topographic factors, and water vapor sources [3,25].Previous studies have focused on constructing spatial downscaling models using the normalized difference vegetation index (NDVI), slope, aspect, and elevation as environmental variables, while less consideration has been given to climatic factors affecting changes in precipitation distribution, such as mean air temperature, actual evapotranspiration, cloudiness, and wind speed.
In fact, precipitation variations are closely related to evapotranspiration [26] and mean air temperature, etc. [27]. Therefore, this study first quantified the contribution of climatic factors to precipitation changes with the help of the Extreme Gradient Boosting Tree (XGBoost) model, combined with the SHAP importance algorithm, to rationally select environmental variables in spatial downscaling. Meanwhile, in order to address the spatial heterogeneity between precipitation and environmental variables, the study chose to construct a multi-scale geographically weighted regression model (MGWR) for spatial downscaling. By setting different bandwidth structures for different parameters, the MGWR model better presents the scale differences in the mechanism of different environmental factors regarding precipitation, which can more accurately analyze the relationship between precipitation and environmental variables and improve the spatial resolution of precipitation data.
The Turpan–Hami region is short of water resources and has a fragile ecological environment. Precipitation is a direct source of water resources, and obtaining accurate and reliable precipitation data is crucial to the scientific allocation of water resources and ecological environment construction in this region. In order to obtain high-resolution precipitation data in the Turpan–Hami region and analyze its precipitation variation characteristics, the following work was carried out in this study: (1) the applicability of three precipitation data products (TRMM 3B43 v7, GPM 3IMERGM 06, and CMORPH CDR) was analyzed in the Turpan–Hami region to select the one with the best applicability; (2) the XGBoost gradient boosting tree algorithm and the SHAP feature importance analysis method are used to analyze the feature importance of climate factors affecting precipitation, and a multi-scale geographically weighted regression (MGWR) model was constructed to obtain a long time-series, high-resolution monthly precipitation dataset for the Turpan–Hami region; (3) the spatiotemporal distribution of precipitation were analyzed in Turpan–Hami area.
2. Materials and Methods
2.1. Study Area
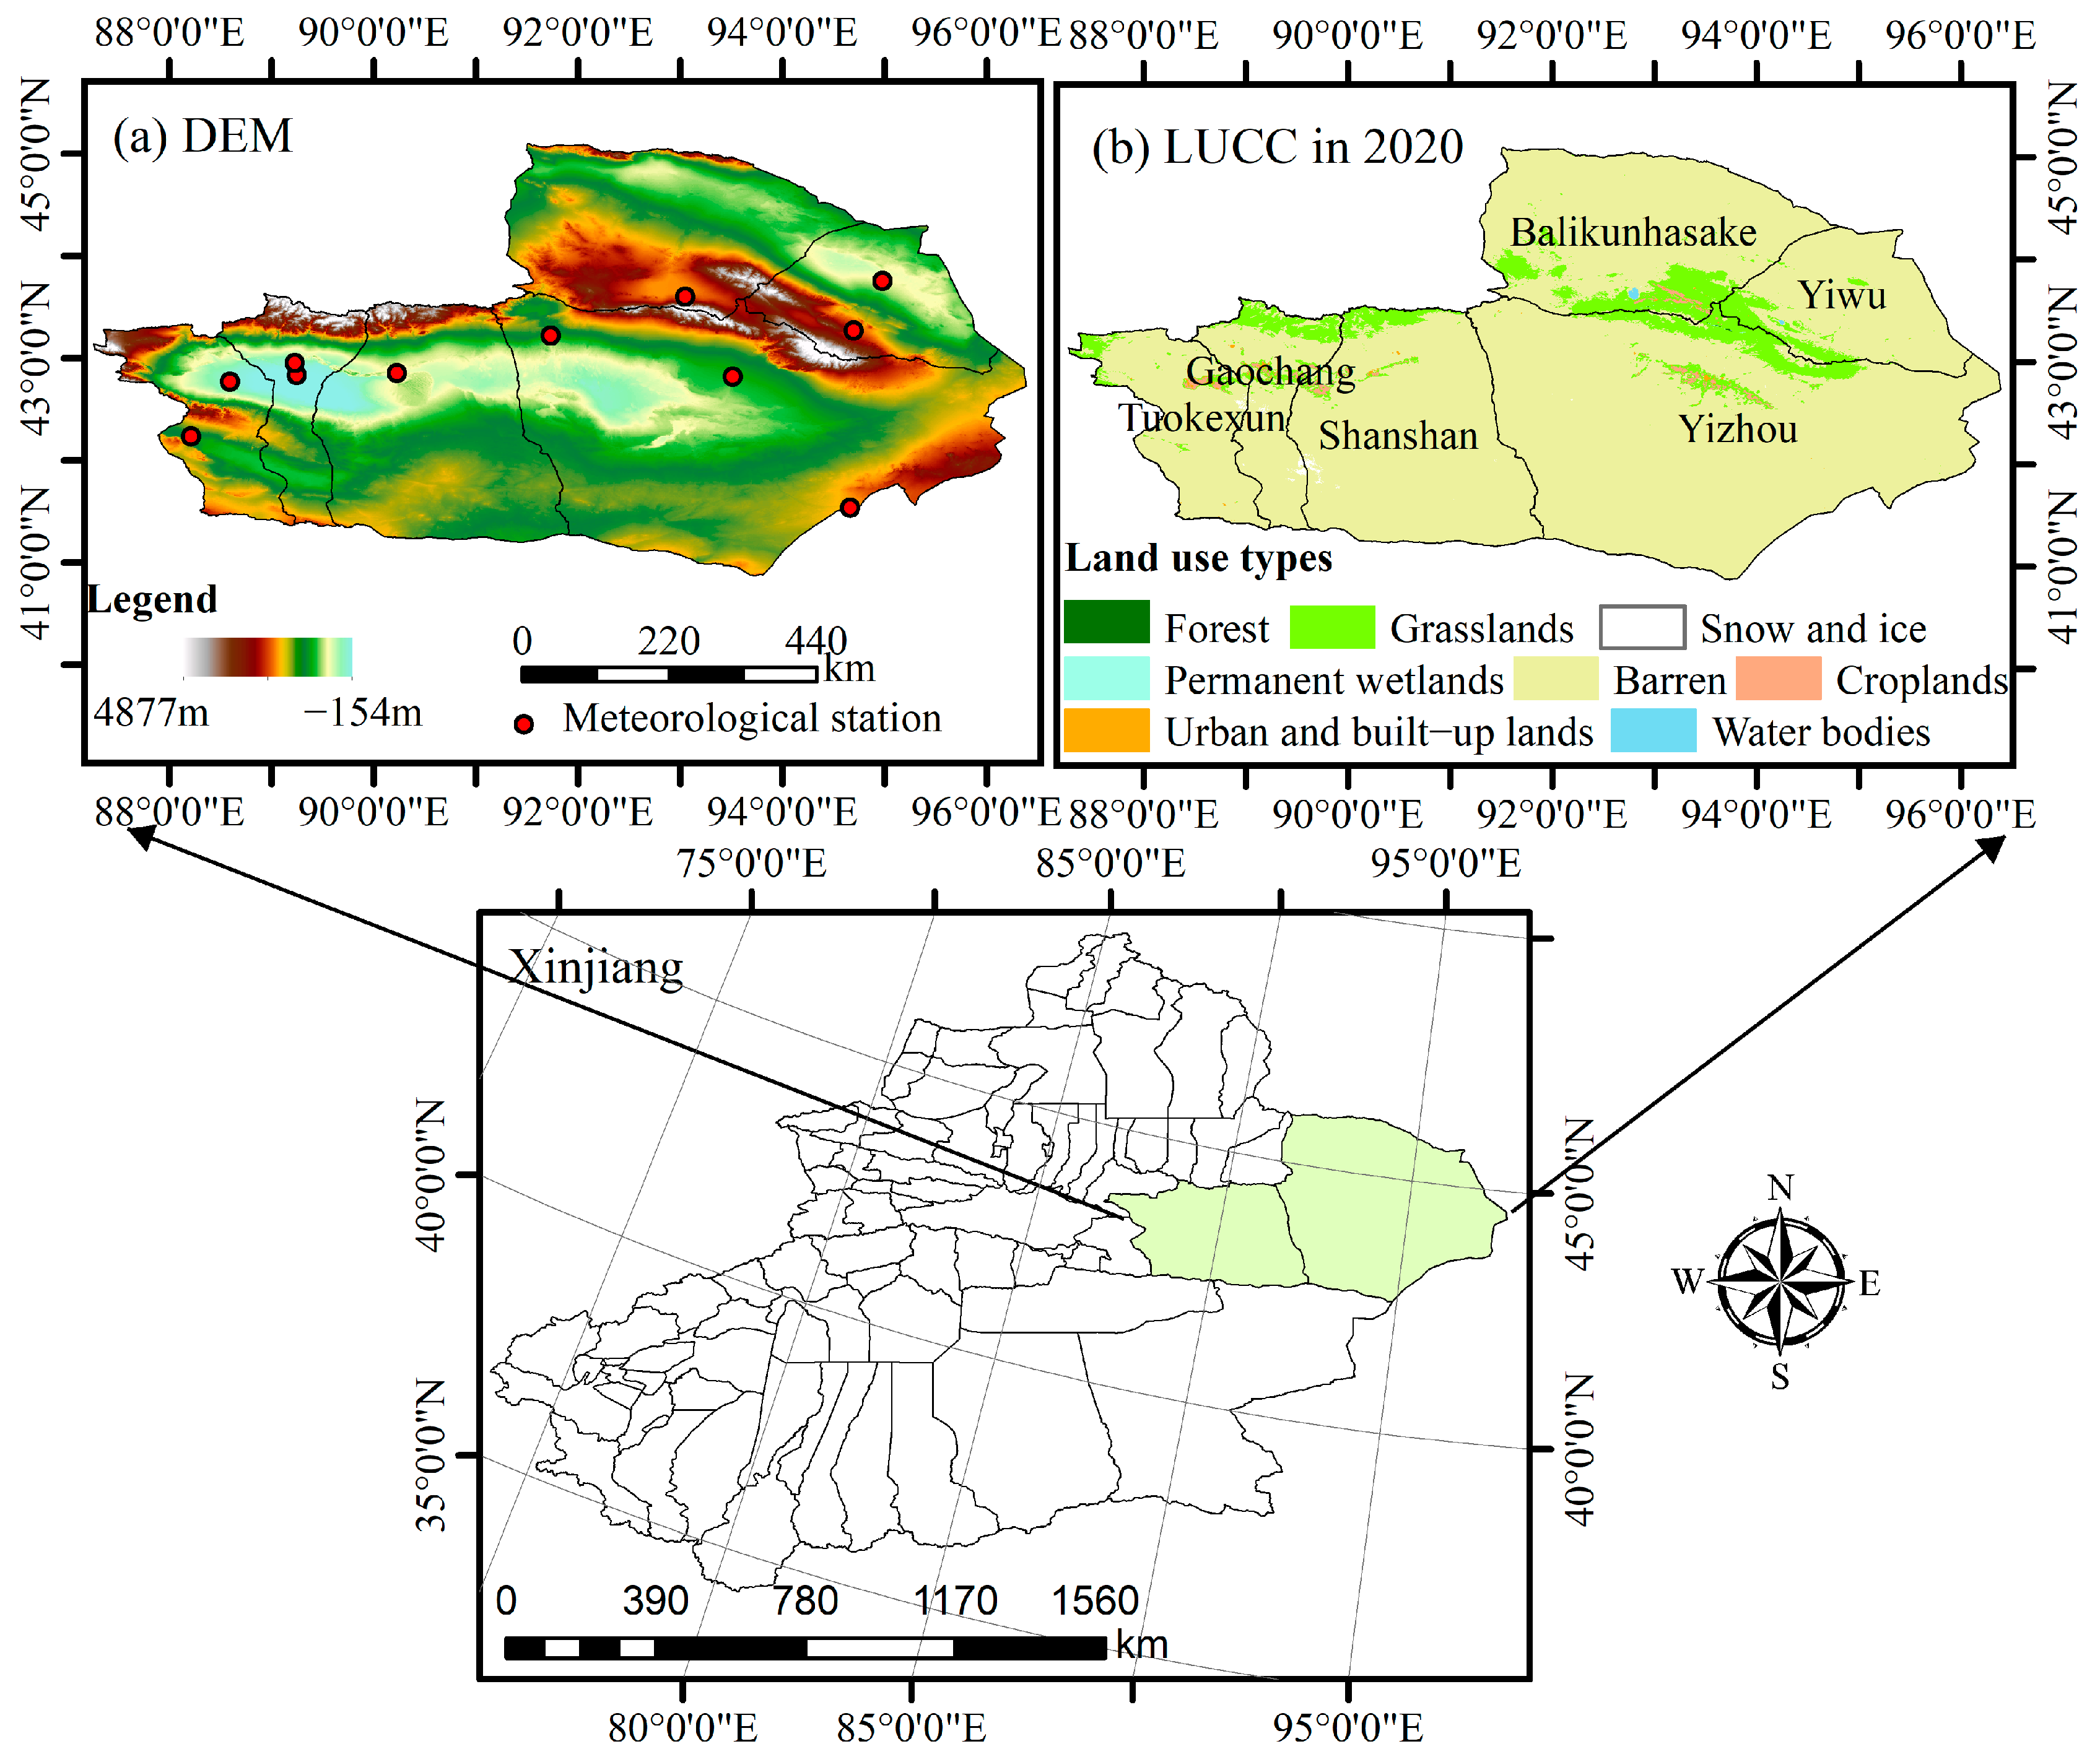
The Turpan–Hami region is located in eastern Xinjiang and is the collective name for the Turpan and Hami regions. The administrative division includes Gaochang District, Shanshan County, and Tuokexun County in the Turpan region, and Yizhou District, Balikun Hasake Autonomous County, and Yiwu County in the Hami region. The region exhibits a typical temperate continental arid climate, with high temperature and heat throughout the year, low precipitation, high evaporation, heavy solar radiation, and long daylight hours [28]. The Turpan–Hami region is surrounded by mountains and has a typical mountain–oasis–desert ecosystem, with a serious shortage of water resources and a fragile ecological environment [29]. Therefore, it is valuable to conduct spatial downscaling studies of precipitation in the region to obtain high-resolution precipitation data for energy industry layout and efficient water resource allocation.
2.2. Data Used in the Study
2.2.1. Satellite Precipitation Products
For the precipitation data in the study, the data measured at meteorological stations were used, as well as three kinds of satellite precipitation data. (Table 1). Among these, the meteorological stations’ measured data were collected from the official website of the China Meteorological Administration and the Xinjiang Provincial Meteorological Bureau. The spatial distribution of meteorological stations in the Turpan–Hami region is shown in Figure 1. The study ensured the reliability of the data by integrating the measured data from meteorological stations provided by the China Meteorological Administration and the Xinjiang Meteorological Administration, which were processed through missing value compensation and quality control. TRMM precipitation data integrate TRMM satellites with other satellites and with ground-based observations of precipitation data, maximizing the use of available detection information; its versions include TRMM 3B42 v7, with a temporal resolution of 3 h and a spatial resolution of 0.25°, and TRMM 3B43 v7, with a temporal resolution of months and a spatial resolution of 0.25° [30]. GPM precipitation data have a higher spatial resolution than TRMM precipitation data and provide more accurate observations of trace and solid precipitation; its versions include GPM_3IMERGHH 06, with a time resolution of 30 min and a spatial resolution of 0.1°, and GPM_3IMERGM 06, with a time resolution of months and a spatial resolution of 0.1° [31]. Although both TRMM precipitation data and GPM precipitation data provide hourly-scale and monthly-scale precipitation data, TRMM 3B43 V7 (hereafter referred to as TRMM) and GPM_3IMERGM 06 (hereafter referred to as GPM) monthly-scale data were selected for the study because of the scarcity of precipitation in the Turpan–Hami region and the weak correlation of some explanatory variables with precipitation on the daily scale. The CMORPH Climate Data Record (CDR) product (hereafter referred to as CMORPH), with a spatial resolution of 0.25° × 0.25° and a temporal resolution of daily scales, is a global, high-resolution precipitation analysis of bias-corrected and re-processed data from the U.S. Climate Prediction Center (CPC), using deformation techniques [32]. To obtain monthly-scale precipitation data, the daily scale was combined into a monthly scale. Since the TRMM 3B43 product ceased to be updated on 31 December 2019, the timeframe used for the applicability analysis of the three precipitation products is 1 January 2001 to 31 December 2019.

Table 1.
All data products used in this study.
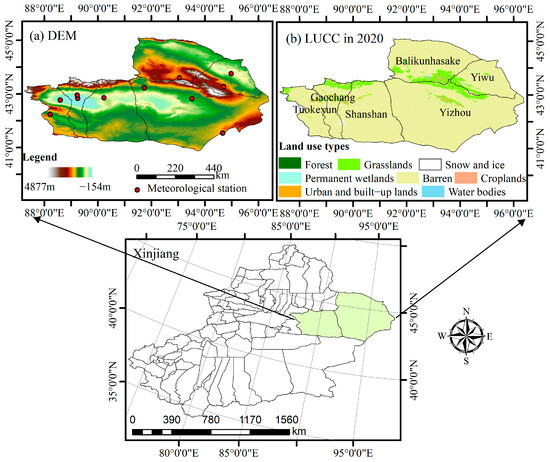
Figure 1.
Overview of the study area; (a) elevation and distribution of meteorological stations in Turpan–Hami region; (b) land use type map in Turpan–Hami region in 2020.
2.2.2. Environmental Variables
The study first analyzed the impact of the characteristics of four climatic factors, namely, cloud cover, wind speed, mean air temperature, and actual evapotranspiration, on precipitation, from which the factor with higher degree of importance was selected. After that, the MGWR model was constructed by combining the elevation, slope, aspect, and the normalized difference vegetation index as the environmental variables, and the specific information is shown in Table 1. In this case, slope and aspect are generated from DEM data. The years used for the normalized difference vegetation index data were 2001–2020, and the data were image spliced, the outliers were processed, and the format converted, followed by projection transformation and cropping. The mean air temperature (Temp) data are validated using China’s monthly average temperature data from 496 independent meteorological observation points, and the validation results are credible [33,34,35,36,37]. The actual evapotranspiration (ET) data are based on the monthly dataset of 1 km ET in the Turpan–Hami region, which was produced during the Third Scientific Expedition of Xinjiang for the special topography of the Turpan–Hami region, and it has been verified that the performance of this dataset is good [29]. Sources of Cloud [38] cover and Wind Speed [39] data are shown in Table 1.
2.3. Methods
2.3.1. MGWR Downscaling Method
In 2017, Fotheringham et al. [40] proposed the multi-scale geographically weighted regression (MGWR) model that takes into account the differentiated spatial bandwidths of independent variables by considering the use of differentiated bandwidths of different independent variables to characterize the scales of differentiated effects of different independent variables. The expression of MGWR at the observation point with coordinates is:
where is the implicit variable; is the jth explanatory variable at point i; denotes the spatial location of the sample point in the study area; is the constant term at sample point i; is the local regression coefficient of the jth independent variable at sample point i; is the residuals of the model regression.
Due to the large spatial heterogeneity of the geographic environment and climatic conditions in arid zones, precipitation distributions usually show obvious spatial non-stationarity [17]. The MGWR model considers the spatial non-stationarity and heterogeneity of precipitation data in space, which can be spatially modeled by local regression. The model uses different regression coefficients at each spatial location to better capture the associations between precipitation and environmental variables, thus providing a more precise characterization of the spatial distribution of precipitation. Therefore, the study uses the MGWR model to conduct spatial downscaling research on precipitation data in order to obtain high-resolution precipitation data in arid areas and provide reference for solving the problem of missing high-resolution precipitation data in arid areas.
In this study, 578 points were generated in the study area using randomly generated points to obtain samples for modeling, as there are fewer meteorological observation stations in the Turpan–Hami region. Due to the uneven distribution of randomly generated points, an adaptive bi-square kernel function is used to compute the optimal bandwidth for each variable, and the optimal bandwidth search type is set to be the golden section algorithm.
2.3.2. Analysis of the Importance of Features
Climatic factors that have an impact on precipitation are: cloud cover, wind speed, air temperature, and actual evapotranspiration; the extent to which these variables affect precipitation is not clear. Therefore, the study utilizes the Extreme Gradient Boosting Tree (XGBoost) model and the SHAP [41] interpretable machine learning model to analyze the importance of the effect of actual evapotranspiration (ET), mean air temperature (Temp), cloud cover, and wind speed (WS) on the degree of precipitation and to select the factors that have a significant impact on precipitation, which will provide a basis for the construction of the MGWR model. XGBoost [42] is an optimization model with the characteristics of both a linear model and a tree model. Compared with the simple linear statistical analysis method, the model establishes a nonlinear relationship between multiple factors and target variables, which has the benefit of a fast training speed and resistance to overfitting. However, the model is poorly interpretable, and although it shows the overall degree of influence of each factor on precipitation, it does not explain how each factor affects precipitation. The SHAP value can compensate for the shortcomings of the XGBoost model by separating the marginal contribution of each factor to precipitation. The combination of the two quantifies the contribution of each factor to precipitation and also analyzes the interaction of different factors in regards to precipitation.
2.3.3. MGWR Model Construction
The specific modeling process for the MGWR model is as follows:
- Data preparation: original satellite precipitation data and 1 km resolution explanatory variables were prepared separately.
- MGWR modeling: the explanatory variables were resampled to the same original resolution of the satellite precipitation data. The MGWR model was built using the original resolution satellite precipitation data and the same resolution explanatory variables to obtain the constant term, local regression coefficients, and regression residuals in the equation. The MGWR 2.2 software was used to build the MGWR model in this study (https://sgsup.asu.edu/sparc/multiscale-gwr, accessed on 1 March 2024).
- Parameter interpolation: the inverse distance weight interpolation method was used to interpolate the intercept, slope, and residuals of step (2) to obtain the corresponding 1 km resolution raster data.
- Downscaling calculation: based on Formula (1), the downscaling results were obtained using ArcGIS, employing the explanatory variables and the corresponding coefficients, constants, and residuals at 1 km resolution.
2.3.4. Precision Evaluation
The applicability of the three types of precipitation data in the Turpan–Hami region was analyzed using the measured precipitation data from the meteorological stations as the “real values”. The precipitation data were evaluated using three commonly used metrics: correlation coefficient (R), root mean squared error (RMSE), and relative bias (BIAS) [43]. In this case, the correlation coefficient (R) measures the degree of correlation between the precipitation product and the measured data from the meteorological station; the root mean square error (RMSE) reflects the overall error level and the accuracy of precipitation products; the relative bias (BIAS) is used to measure the average trend of the precipitation product with respect to the error in the measured precipitation value. The closer the R value is to 1 and the closer the RMSE and BIAS values are to 0, the smaller the product error. The formulas for the indicators are shown below:
where n is the sample size; (mm) and (mm) are the surface-observed precipitation and precipitation data products, respectively; (mm) and (mm) are averages of the surface-observed precipitation and precipitation data products, respectively.
2.3.5. Statistical Analysis
The study analyzes the spatiotemporal variability of precipitation in the Turpan–Hami region from 2001 to 2020 using the center of gravity migration, standard deviation ellipse [28], Sen’s, and Mann–Kendall methods [44].
3. Results
3.1. Applicability Analysis and Selection of Explanatory Variables
3.1.1. Analysis of the Applicability of Precipitation Data
The applicability of the three types of precipitation data was analyzed using three accuracy evaluation indexes, namely, correlation coefficient (R), root-mean-square error (RMSE), and relative bias (BIAS) methods, with the complete time-series of ground-based meteorological station measurements in the Turpan–Hami region from 2001–2019 as the “real values”. In order to minimize the additional errors associated with station interpolation, the study directly extracts the grid point precipitation values corresponding to the station locations as the precipitation values for the satellite precipitation products. The results of the accuracy evaluation indexes of the three satellite precipitation products at each station are shown in Figure 2, in which the correlation coefficients between the satellite precipitation data and the ground-measured precipitation data exhibit GPM > TRMM > CMORPH. The lowest root mean square error (RMSE) was observed for the GPM precipitation data, and the largest RMSE was observed for CMORPH, except for in the of the Hongliuhe station. Regarding relative bias (BIAS), except for the Balikun, Yiwu, and Hongliuhe stations, the relative bias of the GPM shows the smallest bias. Therefore, of the three precipitation data products, the GPM precipitation data estimate of precipitation in the Turpan–Hami area shows the best performance and can well reflect the actual precipitation information at the station. The results from this study are similar to those from the assessments of other scholars. Therefore, in the absence of measured precipitation data, the GPM precipitation dataset was selected for spatial downscaling to obtain high-resolution precipitation data in this study.
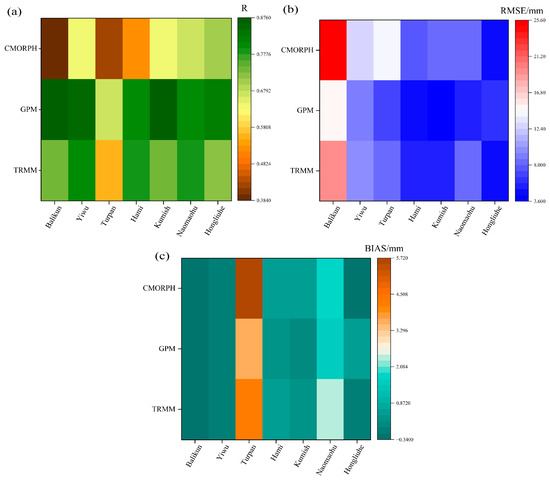
Figure 2.
Precision evaluation index of satellite precipitation data: (a) correlation coefficients, (b) root-mean-square errors, and (c) relative bias.
3.1.2. Selection of Downscaled Explanatory Variables
Finding suitable explanatory variables is a key step in constructing downscaling models. Precipitation is affected by many factors such as regional vegetation, terrain, and meteorological factors [45]. Oasis and desert are interleaved in the Turpan–Hami area, and vegetation growth mainly depends on precipitation. At the same time, the transpiration of vegetation can improve the air humidity, and the growth of vegetation reflects the abundance of precipitation in the Turpan–Hami area. Topography has a significant influence on precipitation; for example, the windward slope tends to receive more precipitation, while the leeward slope has less precipitation, and the precipitation changes with the change in altitude. Numerous studies [19,46,47,48] have shown that in the process of spatial downscaling of precipitation data, the normalized difference vegetation index (NDVI) is used to represent regional vegetation factors; and elevation, slope, and aspect are used to represent regional topographic factors. By constructing the relationship between NDVI, slope, aspect, elevation, and precipitation, the spatial resolution and accuracy of the precipitation data have been improved. On the basis of existing spatial downscaling studies, this study analyzed the degree of influence of the meteorological elements on precipitation, and the results are shown in Figure 3. Figure 3a shows that the influence of meteorological elements on precipitation decreases from top to bottom. It can be seen that the actual evapotranspiration has the greatest influence on the precipitation in the Turpan–Hami region, followed by the average temperature. Figure 3b shows the impact of meteorological elements on precipitation, in detail. The actual evapotranspiration increase has a positive impact on precipitation, while the actual evapotranspiration decrease has a negative impact on precipitation. Both excessively high and excessively low temperatures have negative effects on precipitation. Based on the influence of each factor on precipitation, six variables, including elevation, slope, aspect, normalized difference vegetation index, actual evapotranspiration, and average temperature, were selected as environmental variables under spatial downscaling to construct the MGWR model.
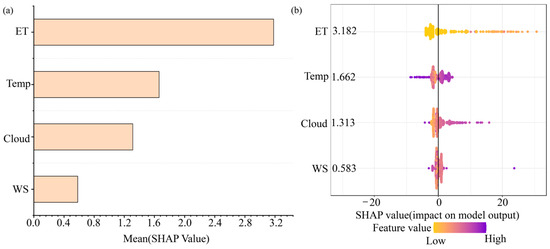
Figure 3.
(a) Mean of the absolute values of the extent to which the explanatory variables affect precipitation; (b) SHAP values of the explanatory variables.
3.2. Accuracy Verification
3.2.1. Validation of Downscaling Results Using Station Data
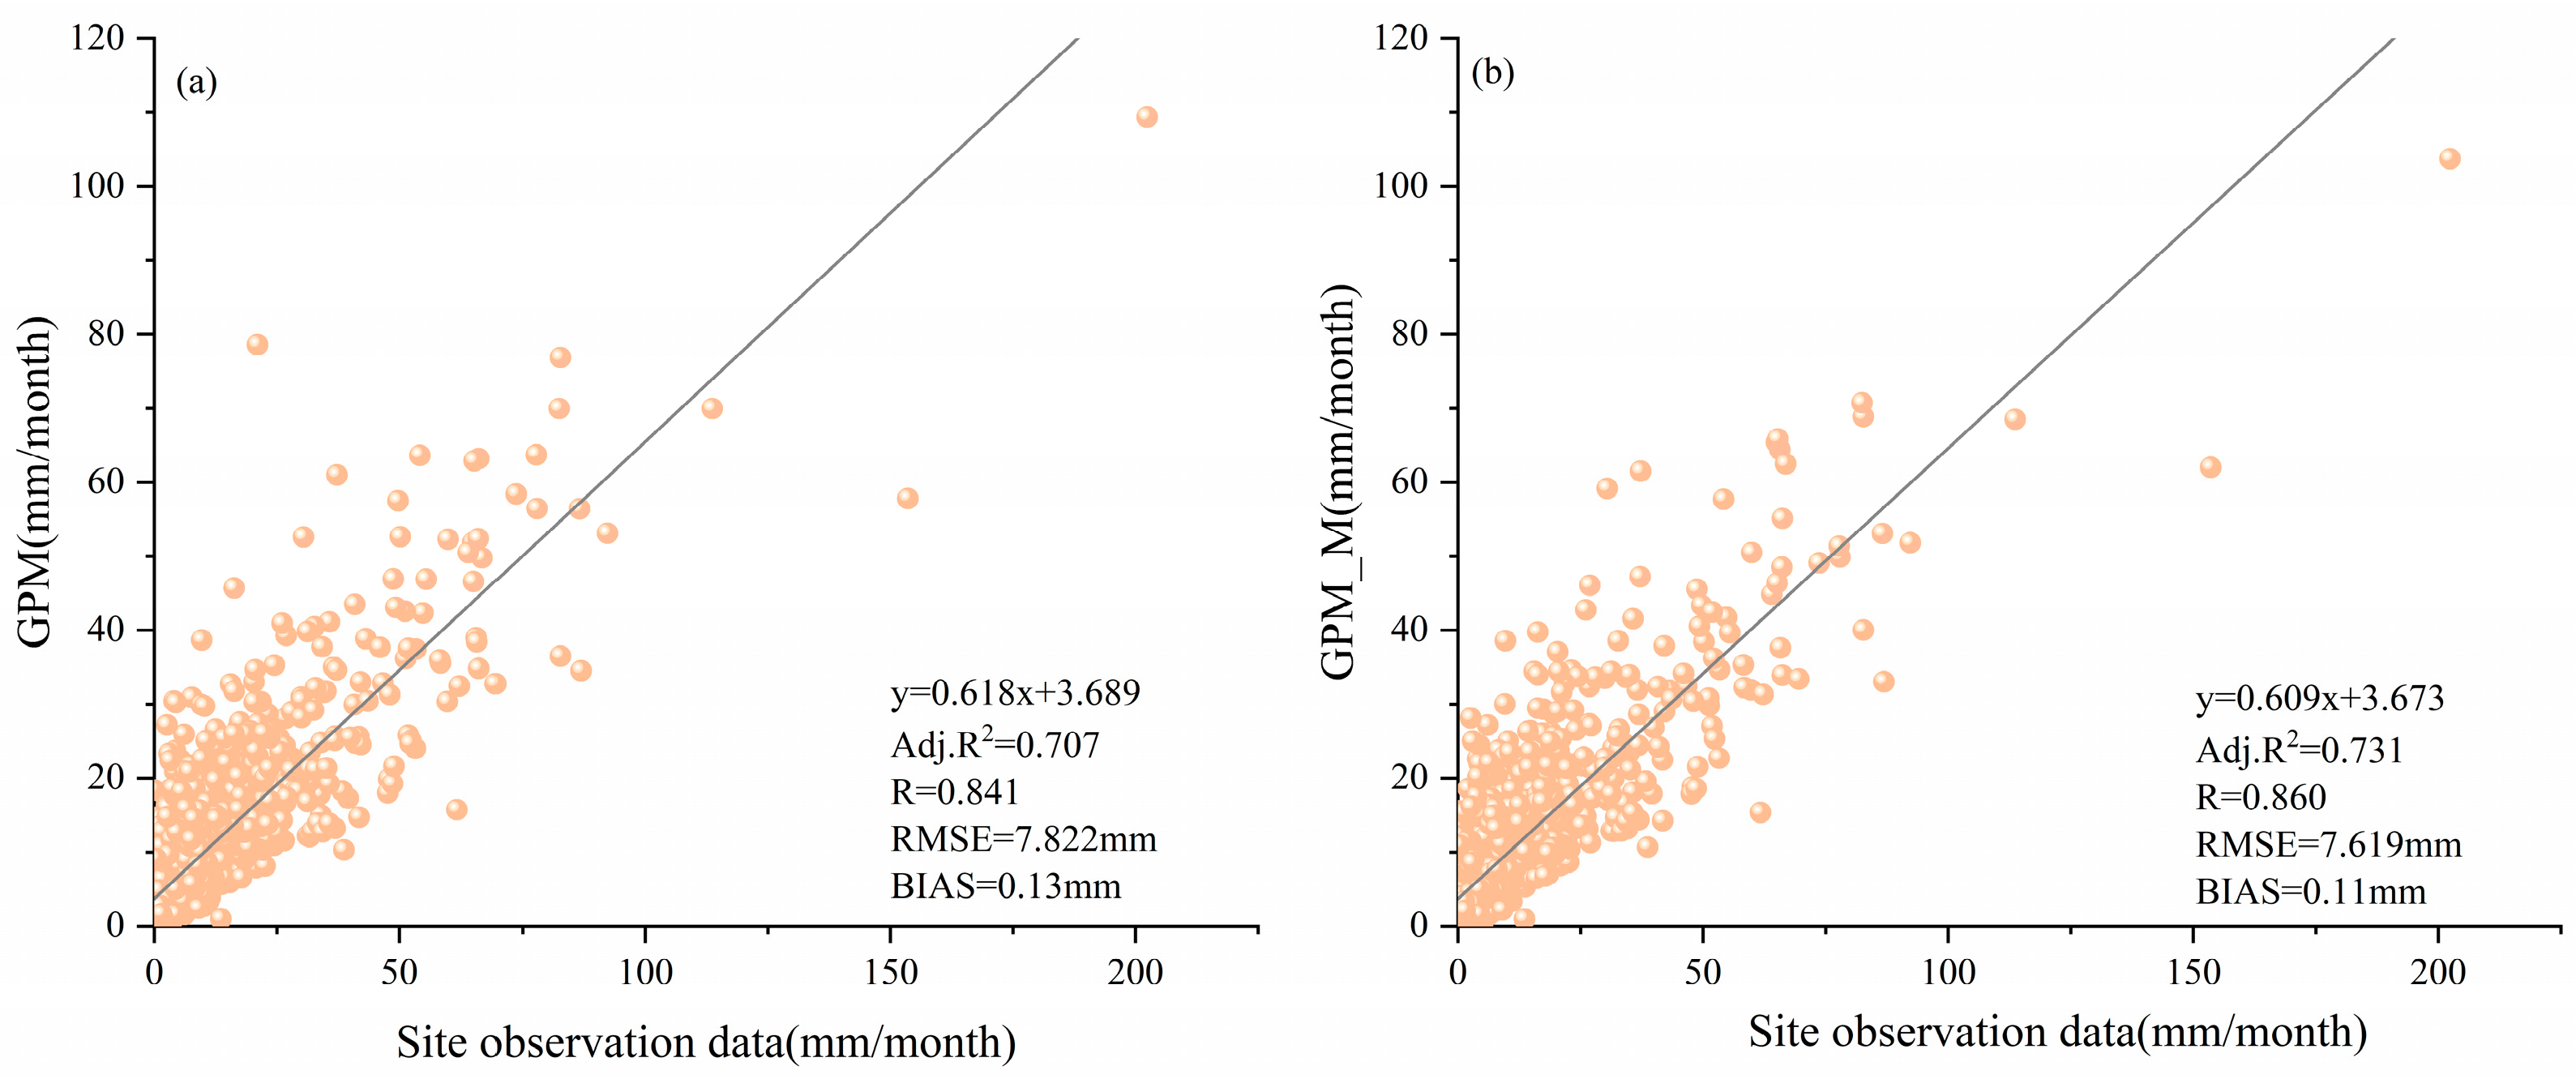
Here, we provide the validation of the results after downscaling from the monthly scale. Meteorological stations with complete data from 2001 to 2020 were selected, and the GPM (before downscaling) and GPM_M (after downscaling) precipitation data were extracted from the corresponding locations of the meteorological stations. The correlation coefficient (R), root mean square error (RMSE), and relative bias (BIAS) of the precipitation data before and after downscaling were calculated to verify the accuracy of the data before and after downscaling, using the actual precipitation data on the ground as the “real value”. The results are shown in Figure 4. The monthly precipitation data of GPM_M after downscaling fits better with the measured monthly precipitation data of the ground stations, which shows that the monthly precipitation data of GPM_M after downscaling can more accurately describe the trend and distribution of monthly precipitation in the Turpan-Hami area. In terms of correlation coefficient (R), it increased by 0.019 after downscaling. In terms of root mean square error (RMSE), after downscaling, it was reduced by 0.203 mm. In terms of relative bias (BIAS), it decreased by 0.02 mm after downscaling. By analyzing the changes in the accuracy evaluation indexes, it can be seen that the downscaling treatment effectively reduces the errors in the data, enhances the reliability of the monthly precipitation data of GPM_M after downscaling, and provides reliable data for further research on precipitation in the Turpan–Hami region.
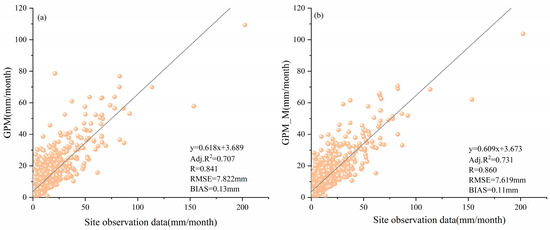
Figure 4.
(a) Evaluation of the accuracy of GPM monthly precipitation data. (b) Evaluation of the accuracy of GPM_M monthly precipitation data.
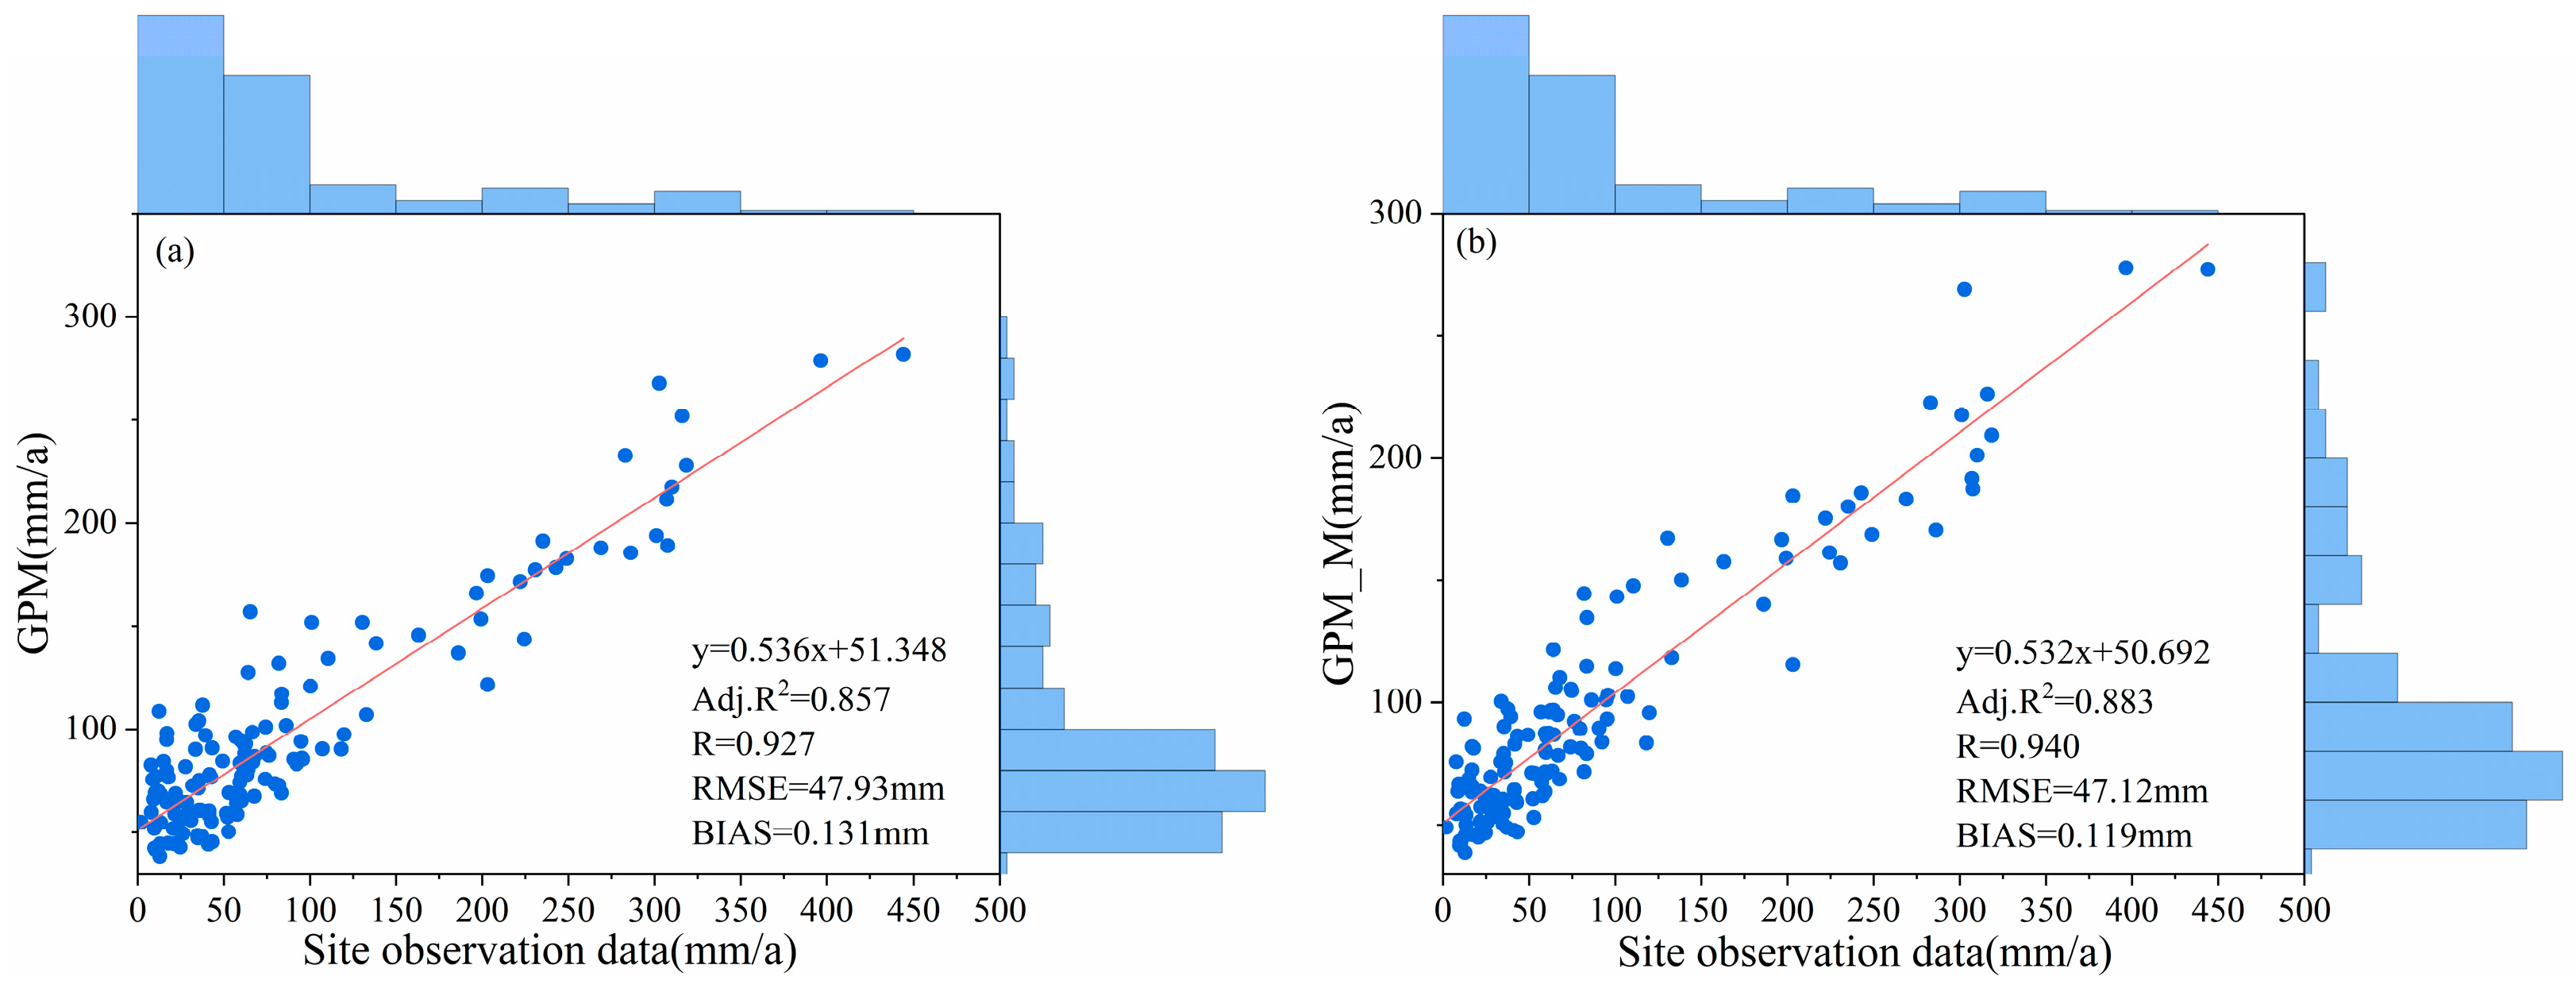
The accuracy of the downscaled results was verified using the annual scale; the results are shown in Figure 5. The R2 of the GPM and GPM_M annual precipitation data before and after downscaling to ground-truthed annual precipitation data were 0.857 and 0.883, respectively; after downscaling, the GPM_M annual precipitation data fit well with the actual precipitation data. In terms of correlation coefficient (R), it increased by 0.014 after downscaling. In terms of root mean square error (RMSE), it was reduced by 0.81 mm after downscaling. In terms of the relative deviation (BIAS), there is a reduction of 0.012 mm after downscaling. In general, the post-downscaling precipitation data GPM_M has a higher correlation with the ground-truth precipitation data, lower root mean square error, and relative bias, and it can be used to carry out the study of spatial and temporal changes of precipitation in the Turpan–Hami region.
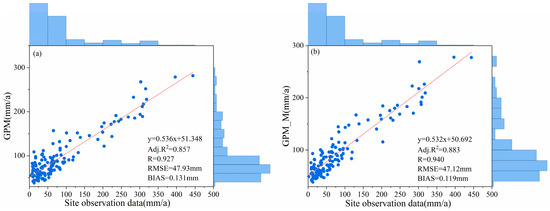
Figure 5.
(a) Evaluation of the accuracy of GPM annual precipitation data. (b) Evaluation of the accuracy of GPM_M annual precipitation data.
3.2.2. GPM Spatial Data Validation of Downscaling Results
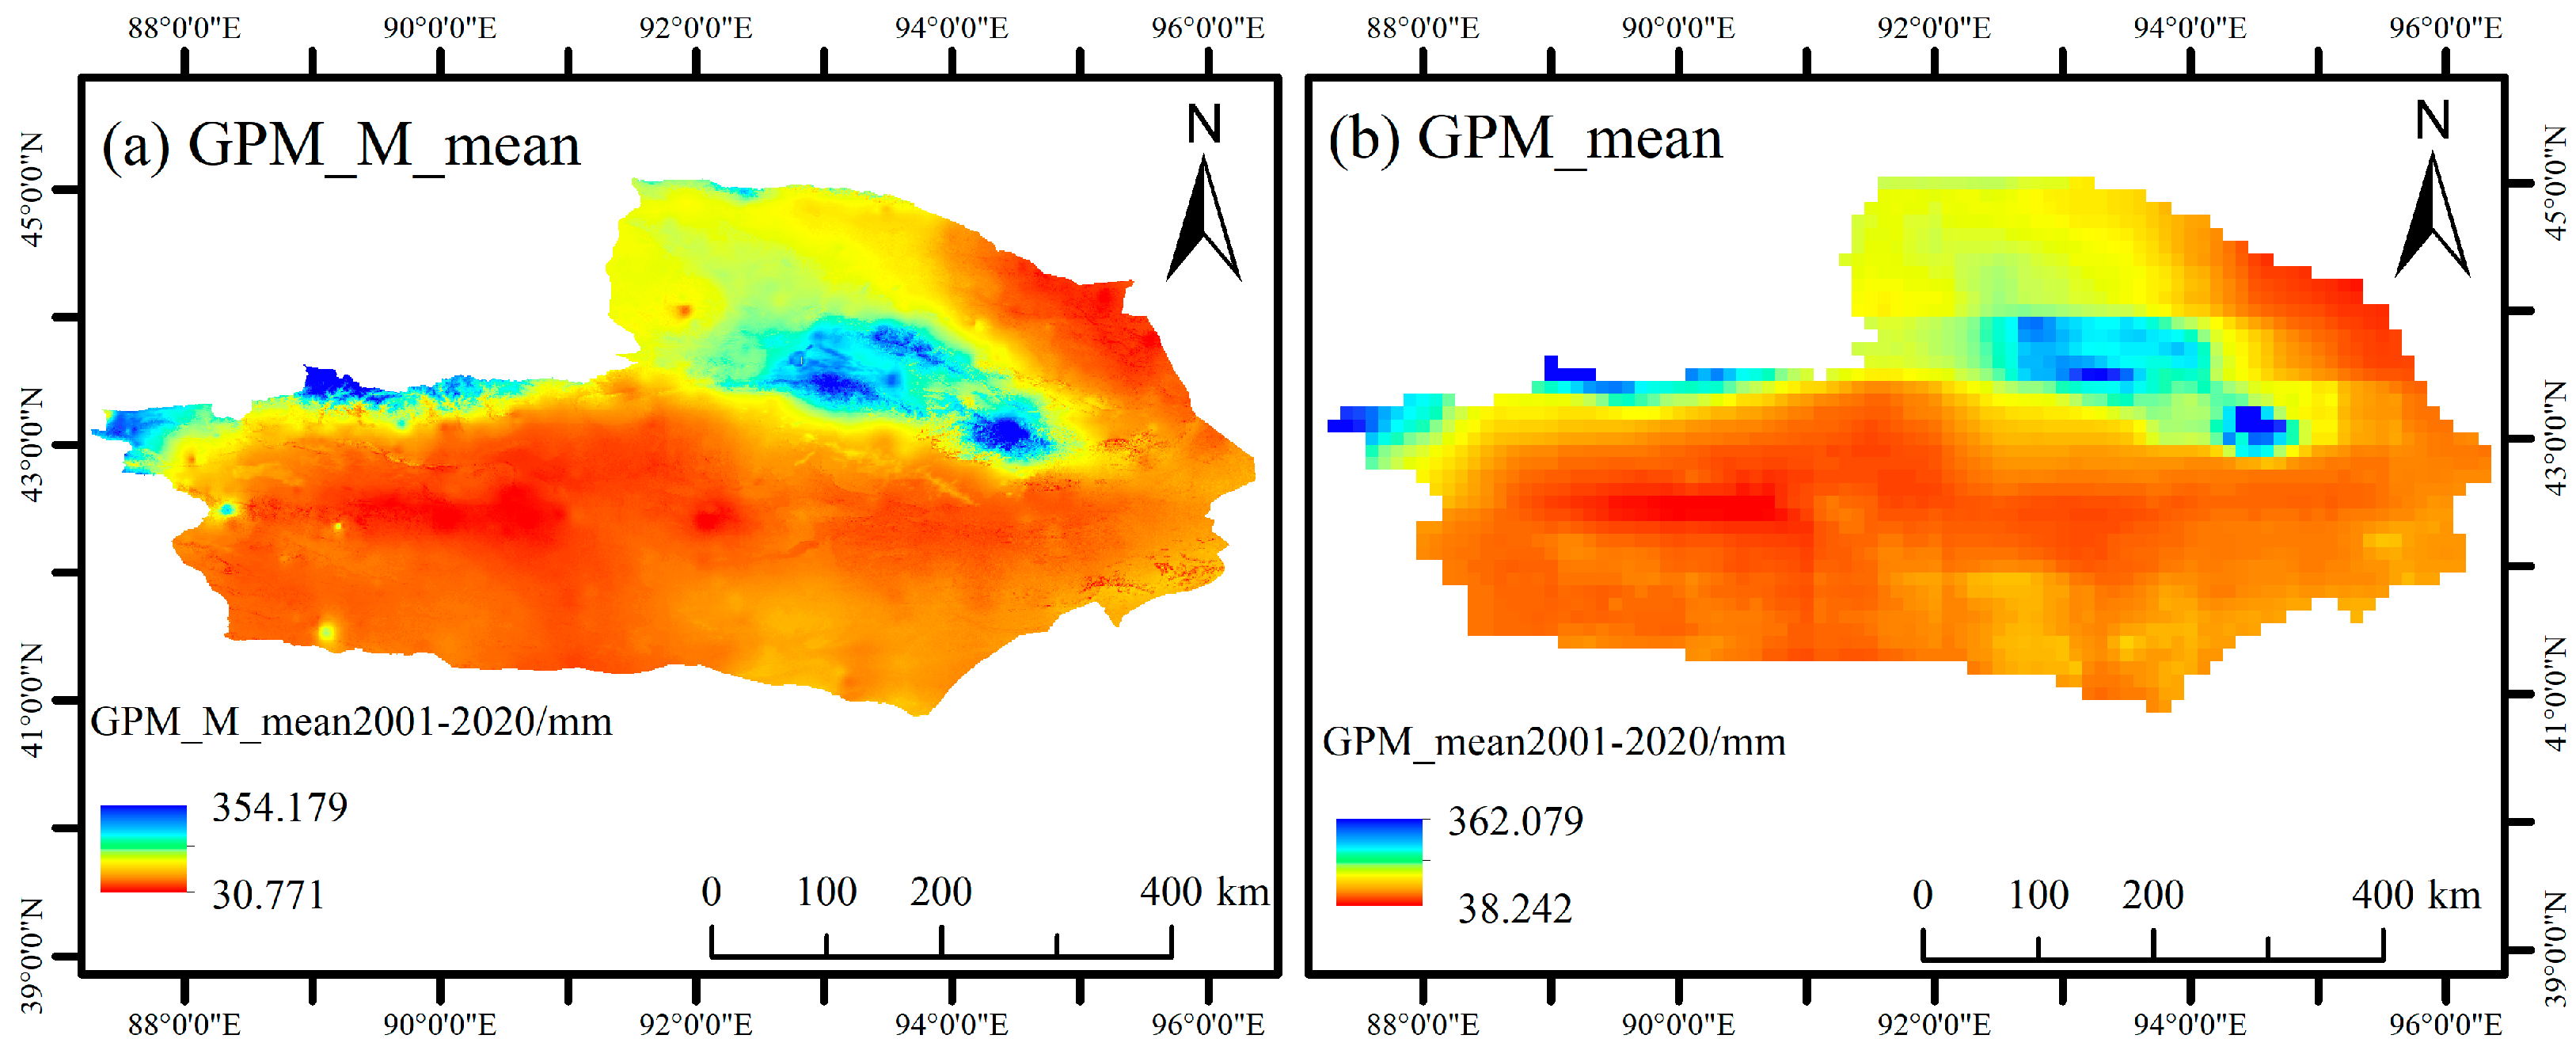
The results of the analysis in Section 3.1.1 show that the GPM precipitation data has the best applicability in the Turpan–Hami region. Therefore, the 10-km GPM precipitation data is selected to verify the 1 km precipitation data (GPM_M) obtained by downscaling from the position of spatial distribution. The distribution of multi-year mean values of the GPM precipitation data and the GPM_M precipitation data for the period of 2001–2020 is shown in Figure 6. The spatial resolution of the GPM precipitation data before downscaling is relatively low, and the area covered by a single raster is large, which makes it difficult to reflect the spatial distribution. The spatial resolution of the GPM_M precipitation data is improved after downscaling, and the coverage area of a single raster is reduced, making it more capable of portraying the spatial details of precipitation. The spatial distribution of the precipitation data before and after downscaling is basically the same, and the high values are all distributed in the junction of Balikun County, Yiwu County, and Yizhou District, as well as in the northern part of Tuokexun County and Gaochang District.

Figure 6.
(a) Multi-year mean distribution of GPM_M precipitation data, 2001–2020. (b) Multi-year average distribution of GPM precipitation data, 2001–2020.
3.3. Trend Analysis of Precipitation
3.3.1. Characteristics of Spatial and Temporal Distribution of Precipitation
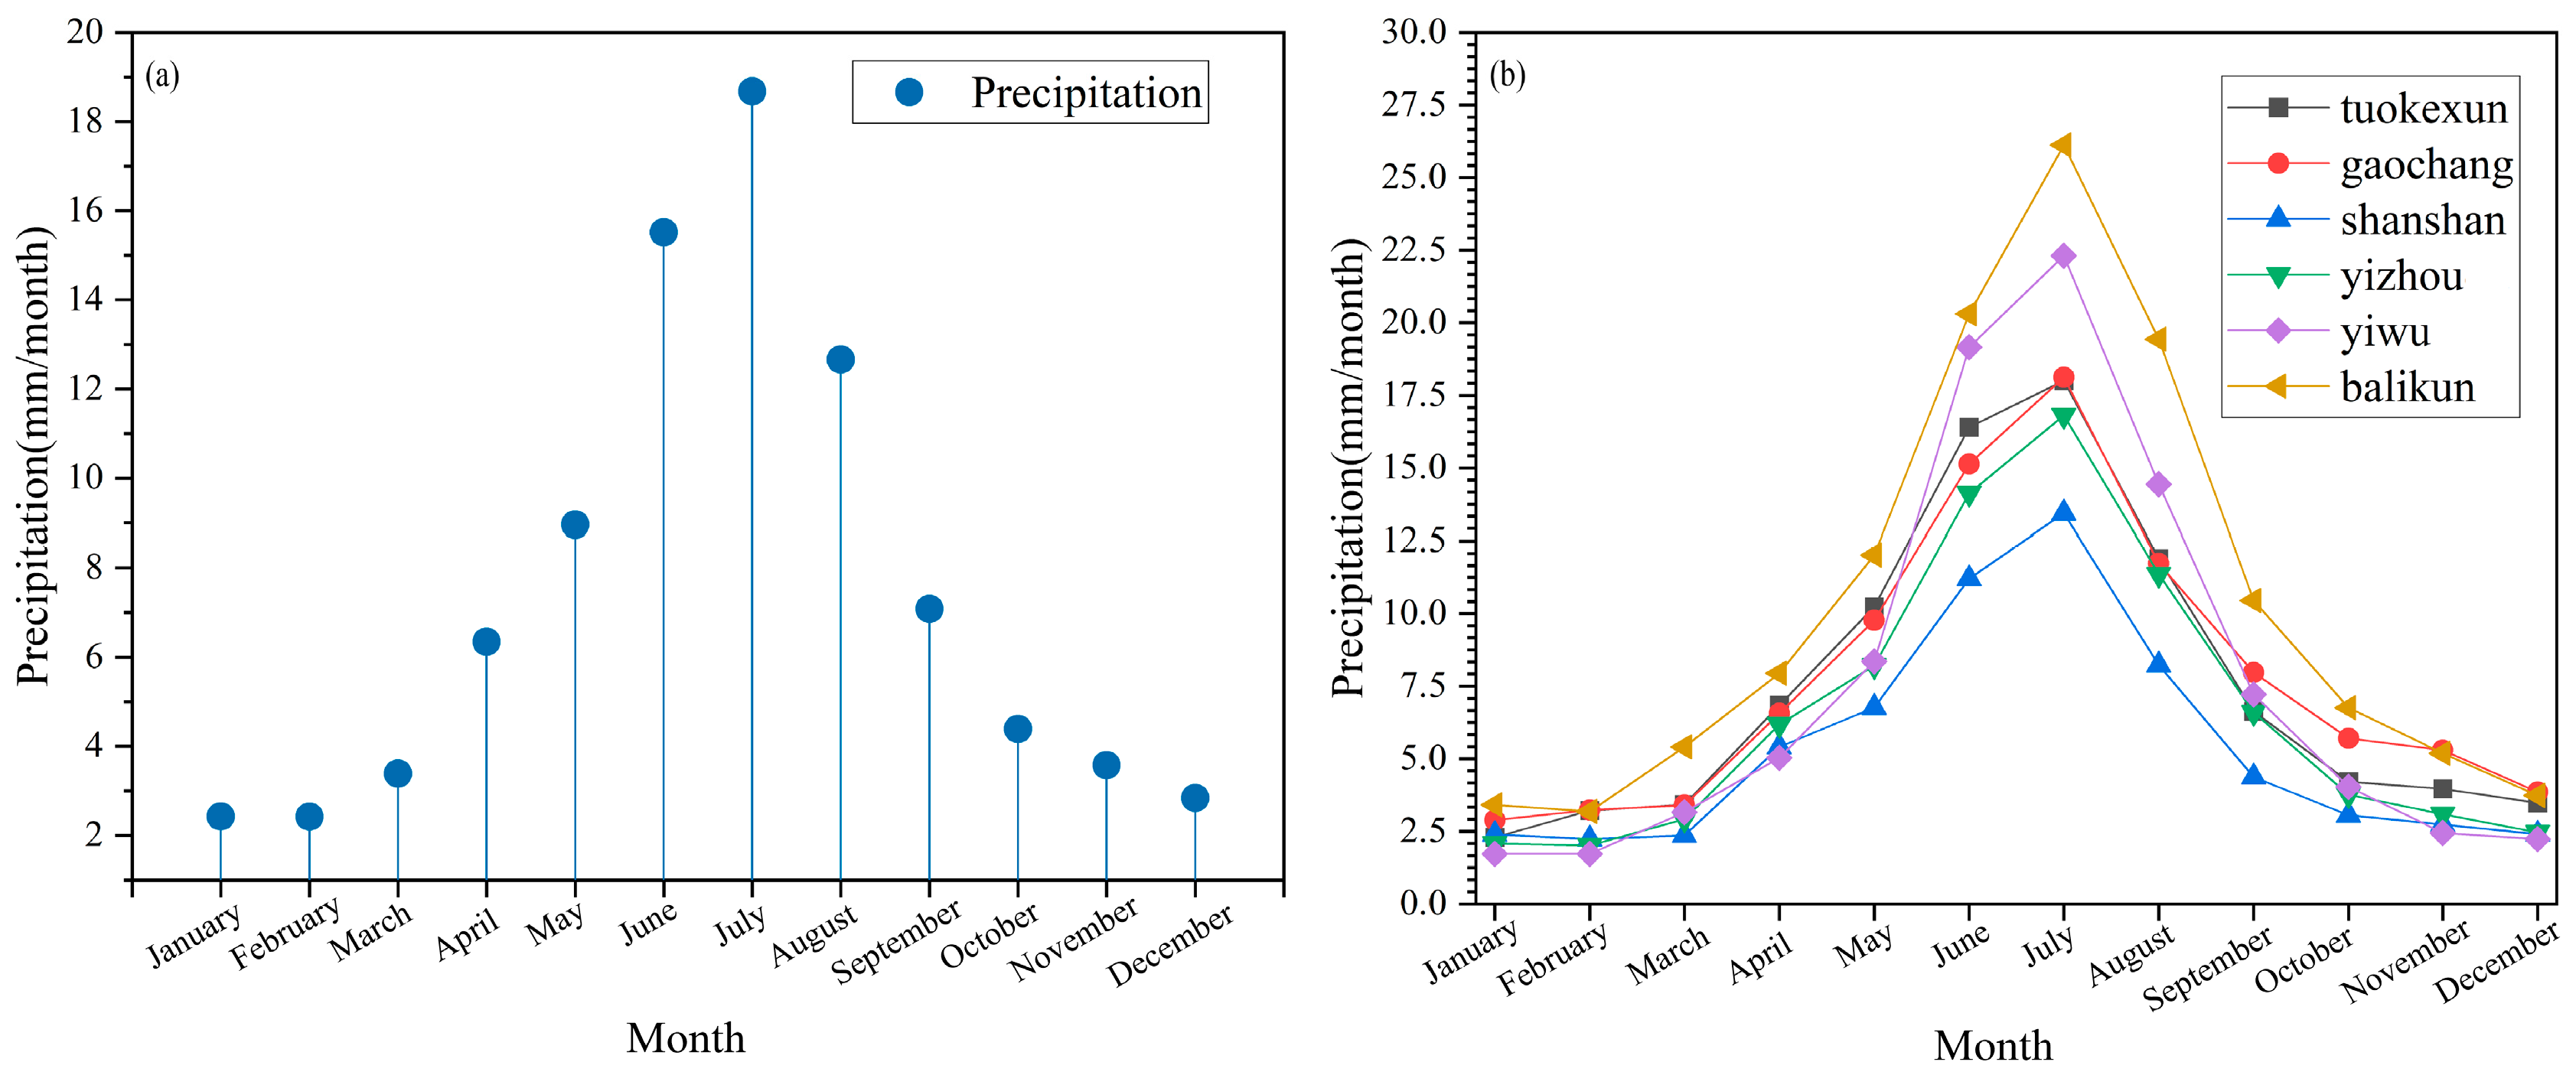
First of all, the distribution characteristics of multi-year average monthly precipitation in the Turpan–Hami region were analyzed using 1 km spatial resolution monthly precipitation data in the Turpan–Hami region from 2001 to 2020. Figure 7 shows the multi-year monthly average precipitation for the Turpan–Hami region, as a whole and for each district and county. As a whole, the multi-year monthly average precipitation in the Turpan–Hami region is bounded by July, which increases and then decreases. In other words, the precipitation in the Turpan–Hami region peaks in July, and the minimum occurs in February, with the multi-year monthly average precipitation of 18.676 mm in July and 2.423 mm in February. Analyzing the changes in multi-year average monthly precipitation in each district and county of the Turpan–Hami region, it can be seen that the maximum values of precipitation all appeared in July, and the minimum values were concentrated in January and February; the minimum value for Tuokexun County and Gaochang District occurred in January, and the minimum value for Shanshan County, Yizhou District, Yiwu County, and Balikun County was obtained in February. Among the districts and counties in the Turpan–Hami region, the multi-year average monthly precipitation in Gaochang District was the largest in February, November, and December, and the rest of the months showed the largest multi-year average monthly precipitation in Balikun County; the minimum multi-year average monthly precipitation was mainly concentrated in Shanshan and Yiwu counties, with the smallest multi-year average monthly precipitation in Shanshan County in March and May-October, and the smallest multi-year average monthly precipitation in Yiwu County for the rest of the months.
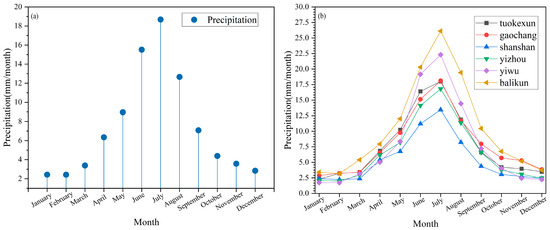
Figure 7.
(a) Multi-year average monthly precipitation in the Turpan–Hami region, 2001–2020. (b) Multi-year average monthly precipitation in various districts and counties of the Turpan–Hami region, 2001–2020.
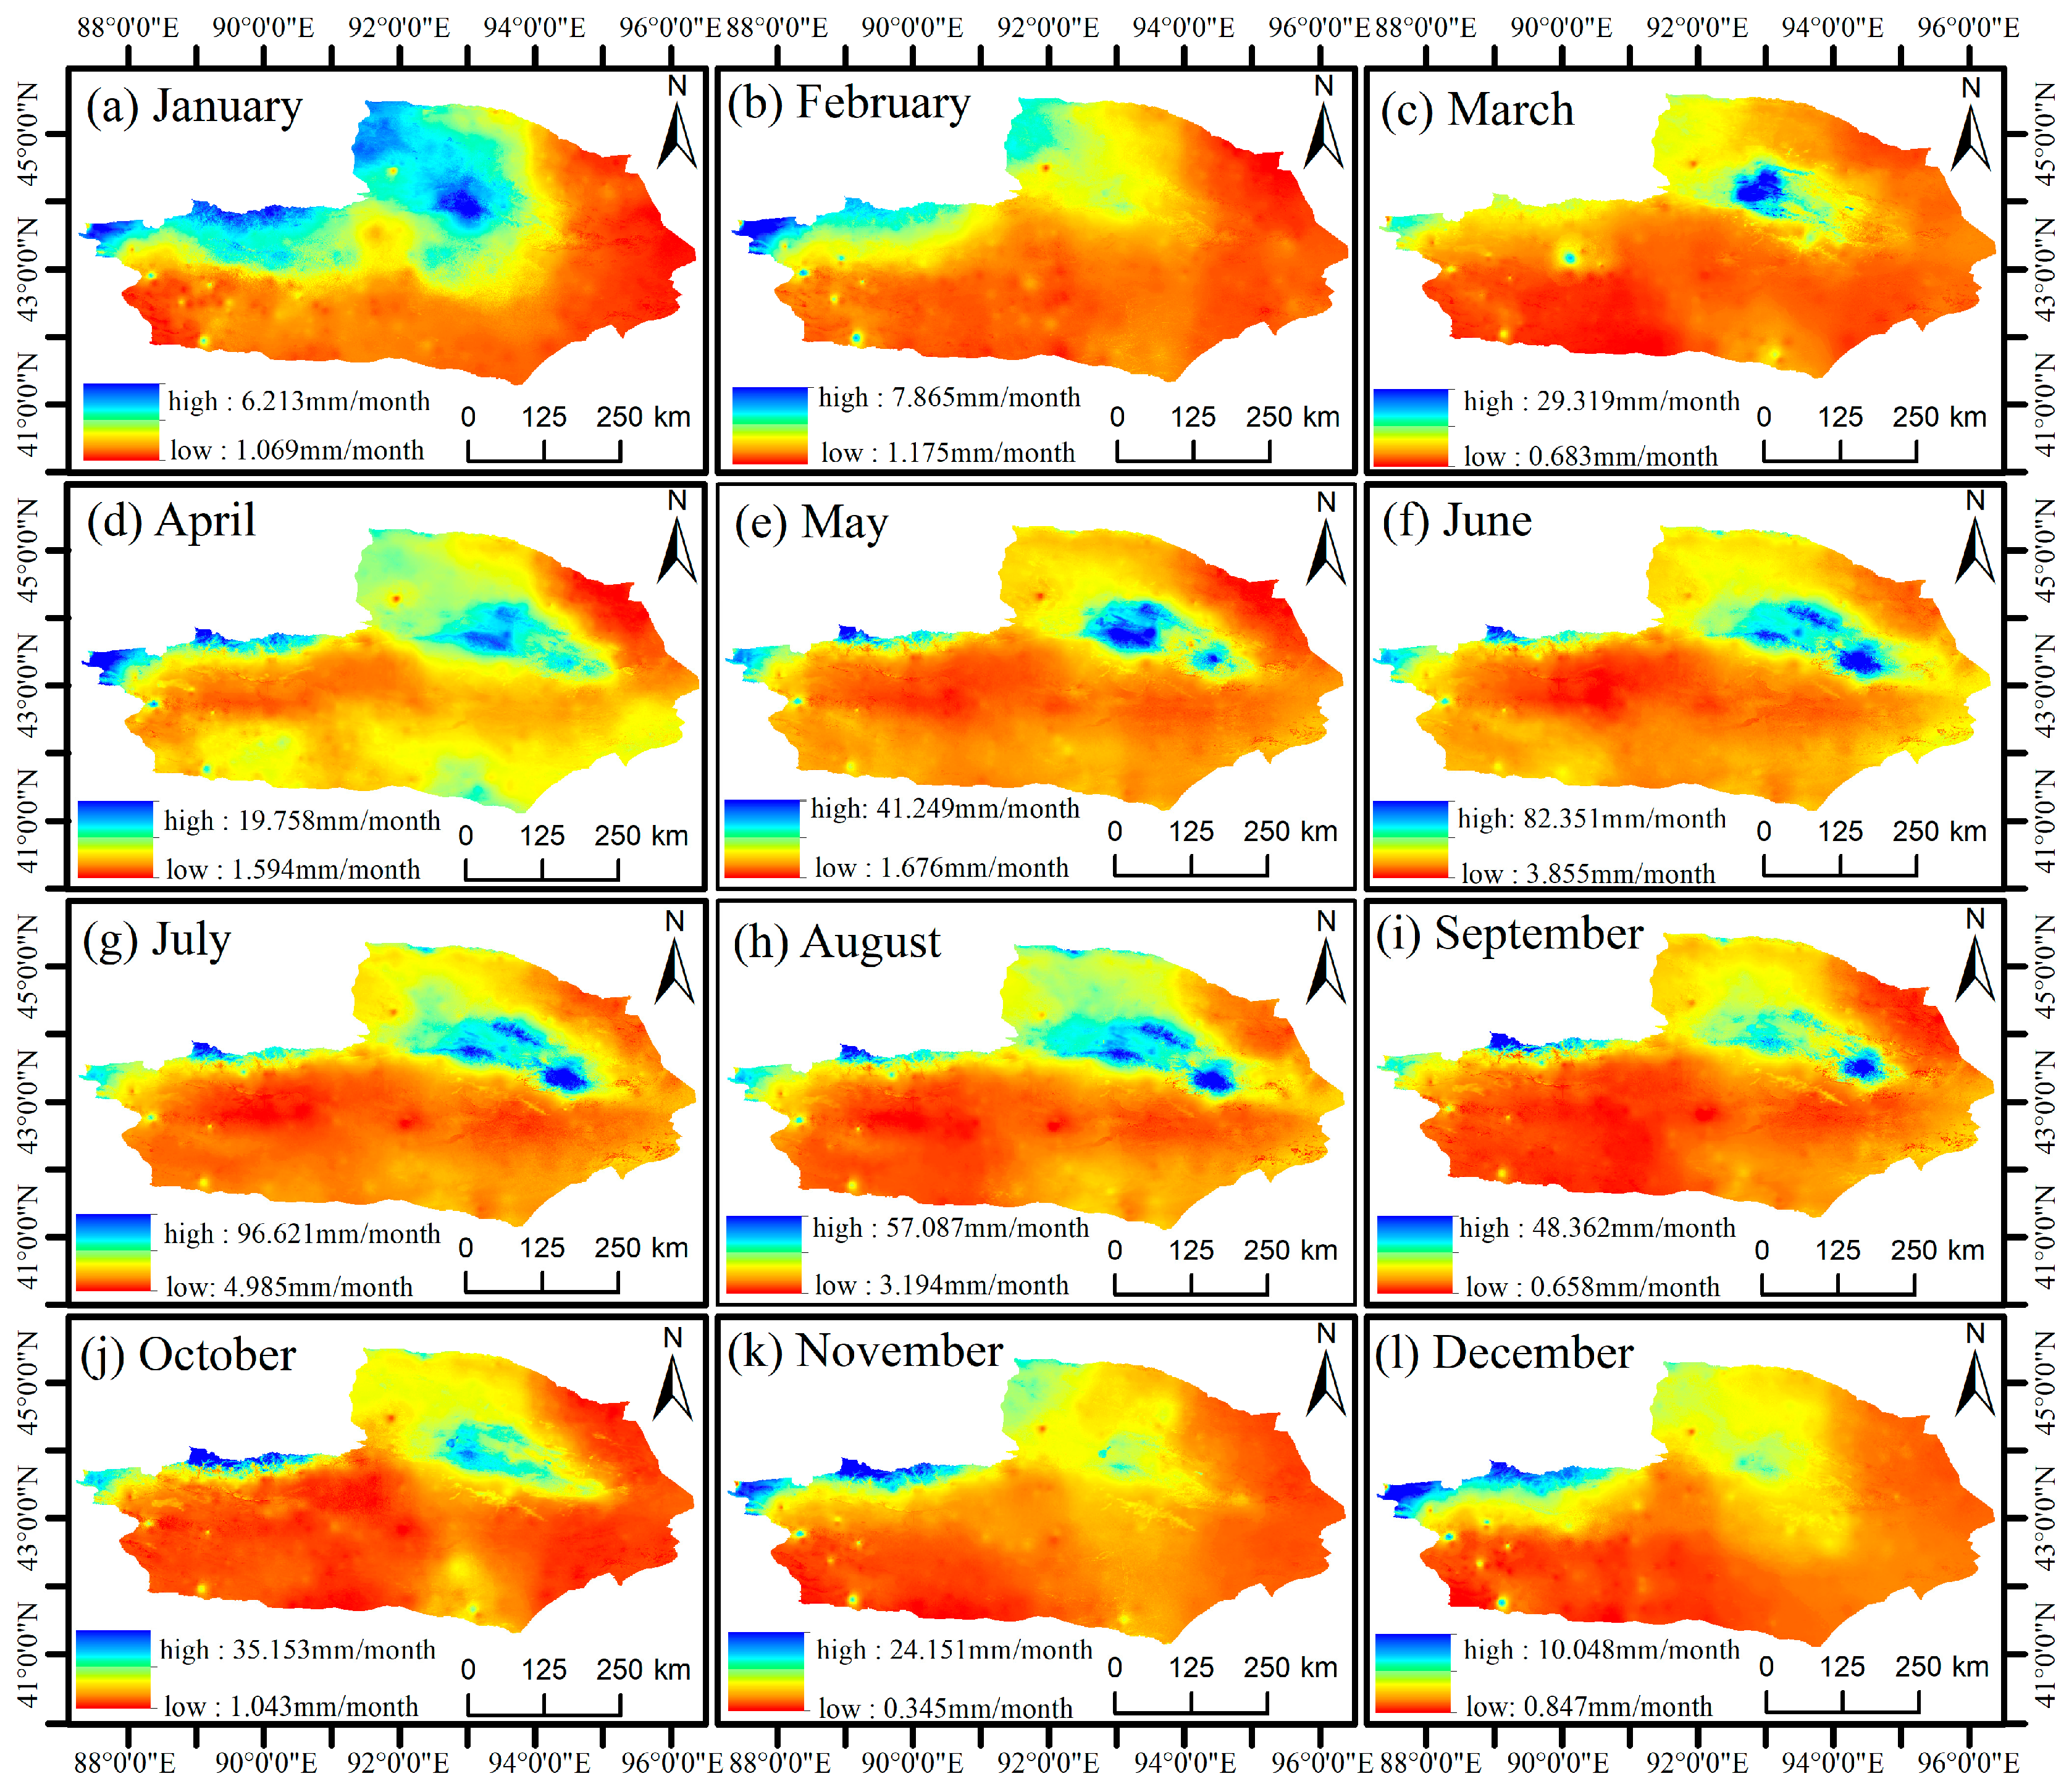
The spatial distribution of multi-year average monthly precipitation in the Turpan–Hami region is provided in Figure 8, which shows that the maximum of multi-year average monthly precipitation in the Turpan–Hami region is mainly distributed in the northern part of Tuokexun, Gaochang, and Shanshan counties, as well as the border areas of Balikun, Yizhou, and Yiwu counties. The Muziruk Mountains spread across the northwestern part of Tuokexun County, the Bogda Mountains across the northern part of Gaochang District and Shanshan County, and the East Tianshan Mountains across central Hami, causing the region to receive more precipitation. The low values of multi-year average monthly precipitation in the Turpan–Hami area are mainly distributed in the southern part of Tuokexun County, Gaochang District, Shanshan County, Yizhou District, and the eastern part of Yiwu County, which are blocked by the surrounding high mountains, and it is extremely difficult for water vapor to enter through the blockage to form precipitation. The southern part of Shanshan County contains the Kumutage Desert, which makes it difficult for the area to meet the requirements for precipitation in terms of water vapor content.
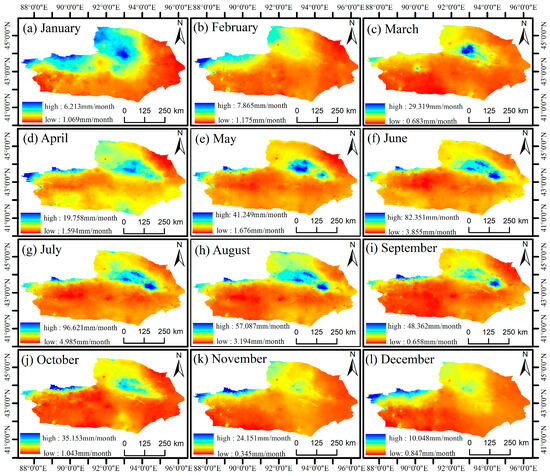
Figure 8.
Distribution of multi-year average monthly precipitation in the Turpan–Hami region, 2001–2020.
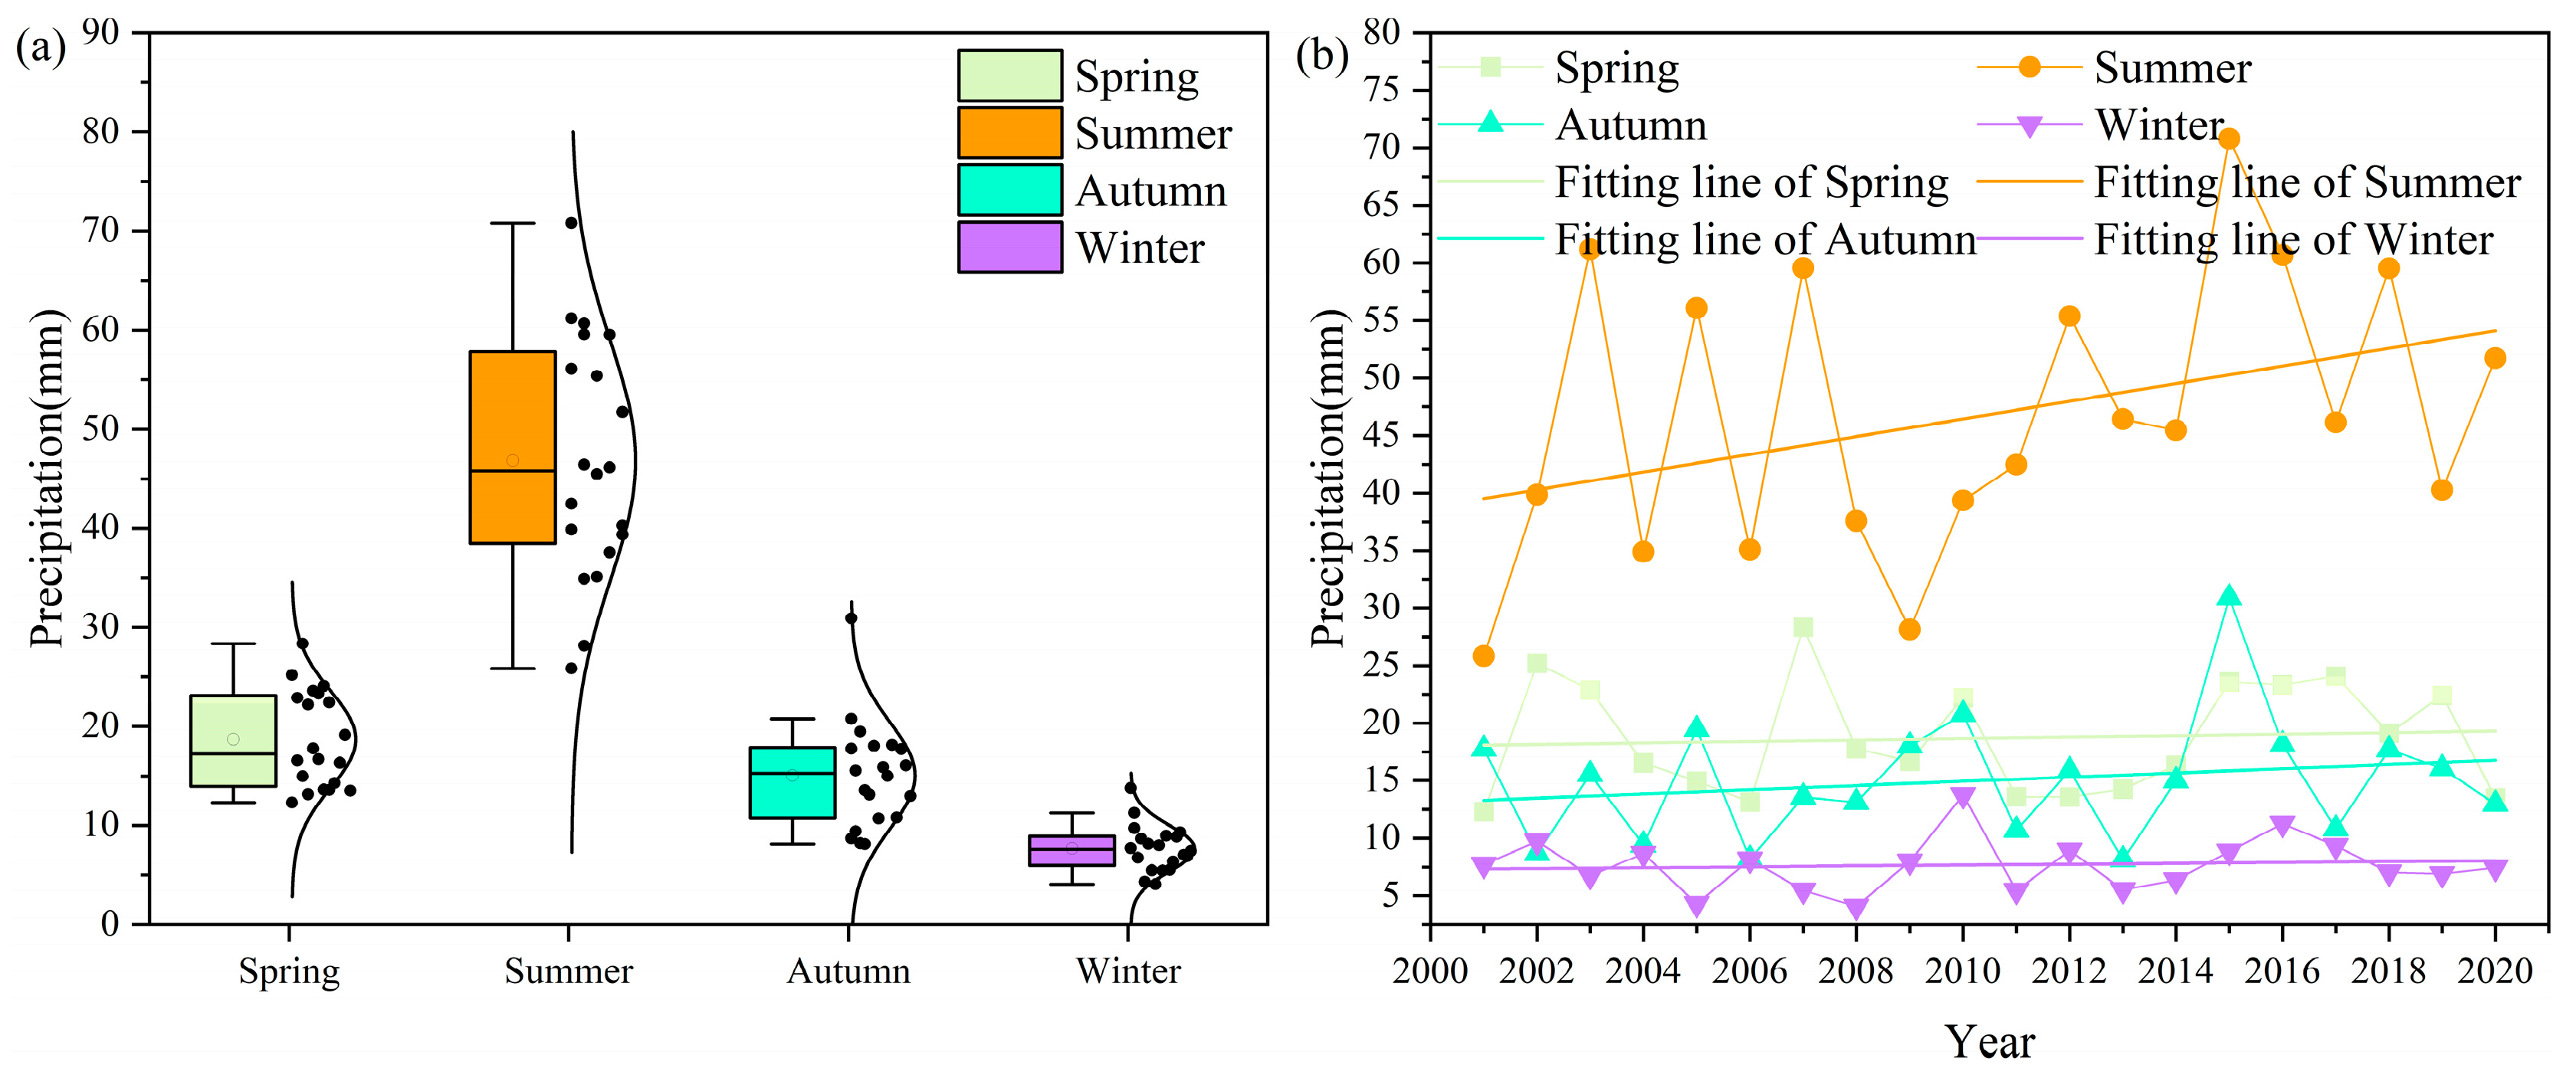
Analyzed on a seasonal scale, the precipitation data for 2001–2020 in the Turpan–Hami area were divided into March–May for spring, June–August for summer, September–November for fall, and December–February for winter. According to the seasonal precipitation in the Turpan–Hami area, it is obvious (Figure 9) that the intra-annual precipitation distribution in the Turpan–Hami region is summer > spring > fall > winter, which is similar to the results for monthly precipitation distribution. According to the spatial distribution of multi-year seasonal averages in the Turpan–Hami region from 2001 to 2020 (Figure 10), the areas of high values of precipitation in all seasons are mainly in the northern part of Tuokexun County and Gaochang District, and in the areas bounded by Balikun County, Yiwu County, and Yizhou District, where there are high mountains, and the main feature types are woodland and grassland, with a comparatively high degree of vegetation cover. The low value area of seasonal precipitation is mainly concentrated in the southern part of the Turpan–Hami district, and the main surface type is desert area.
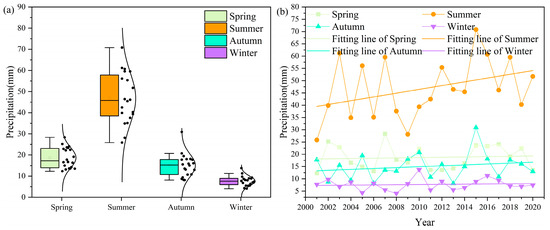
Figure 9.
(a) Seasonal precipitation in the Turpan–Hami region, 2001–2020. (b) Trends in seasonal precipitation in the Turpan–Hami region, 2001–2020.
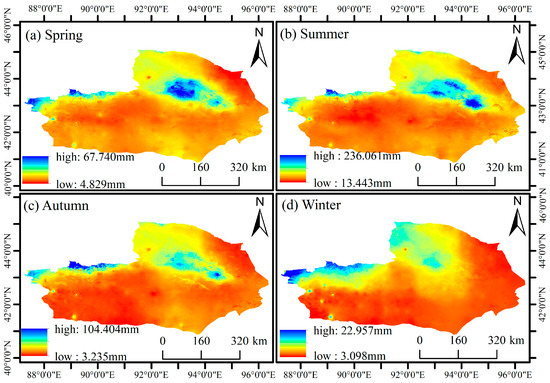
Figure 10.
Multi-year seasonal average precipitation distribution in the Turpan–Hami region, 2001–2020 (a) spring; (b) summer; (c) autumn; (d) winter.
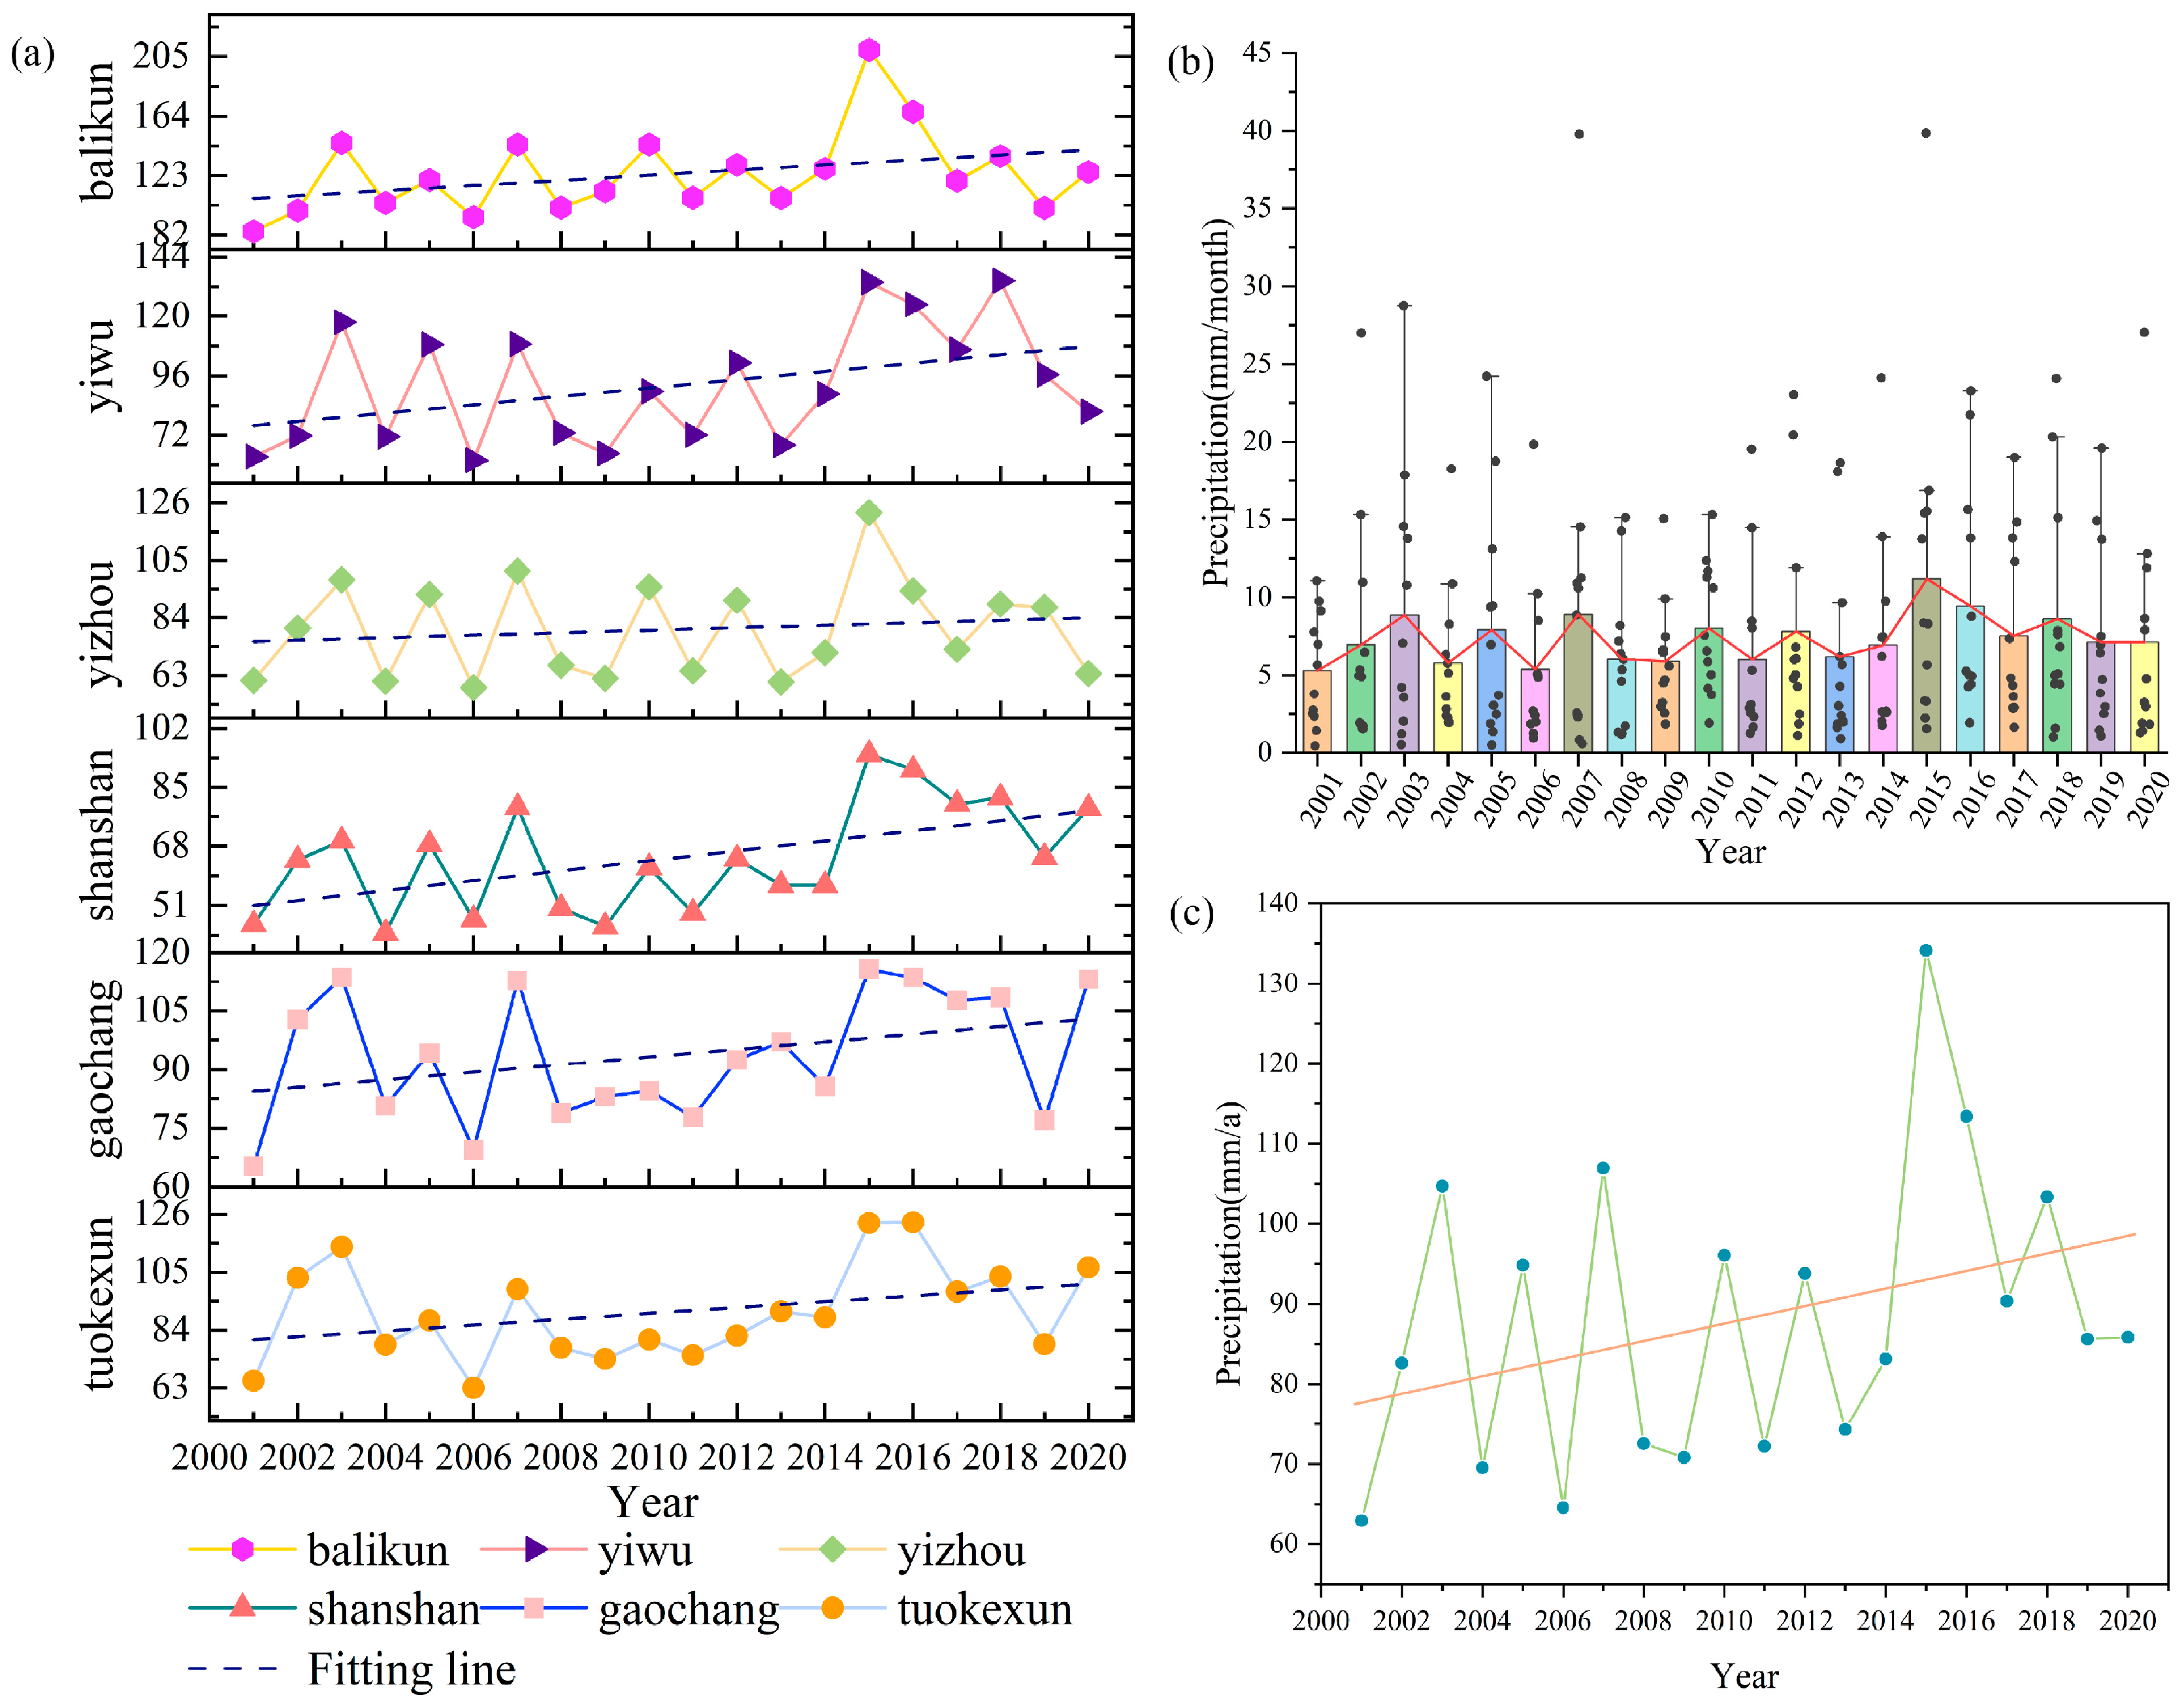
When analyzed using the annual scale (Figure 11), the annual precipitation in all districts and counties of the Turpan–Hami region showed an increasing trend from 2001 to 2020. The smallest annual precipitation in the Turpan–Hami region was only 62.96 mm in 2001, and the largest annual precipitation was 134.15 mm in 2015, with a difference of 2.13 times between the maximum and the minimum, which indicates that the annual change in precipitation is relatively drastic. The tendency rate of the annual precipitation change from 2001 to 2020 is 1.093 mm/a, which shows that the precipitation in the Turpan–Hami region has shown an increasing trend in the last 20 years. The multi-year average precipitation distribution map (Figure 6a) shows that the distribution of precipitation in the Turpan–Hami region is consistent with the distribution of monthly and seasonal precipitation, which are distributed in the mountainous areas of Tuokexun, Gaochang, and northern Shanshan counties, as well as in the zone covered by the East Tianshan Mountains in Hami.
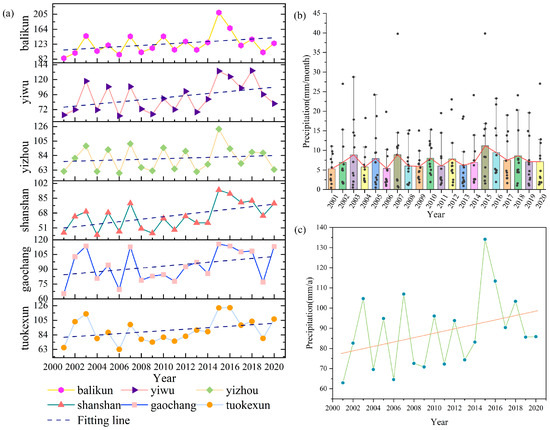
Figure 11.
(a) Trends of annual precipitation in the districts and counties of the Turpan–Hami region, 2001–2020. (b) Annual precipitation in the Turpan–Hami region, 2001–2020. (c) Trends of annual precipitation in the Turpan–Hami region, 2001–2020.
3.3.2. Characteristics of Precipitation Center of Gravity Distribution
From the monthly scale analysis, the center of gravity model was used to calculate the center of gravity migration trajectory of multi-year monthly average precipitation in the Turpan–Hami region from 2001 to 2020 (shown in Figure 12), and the direction of movement of the center of gravity of precipitation was statistically calculated (shown in Table 2). The results show that the center of gravity of monthly average precipitation in the Turpan–Hami region is concentrated in the northwest of Yizhou district, located at 91°55′–92°26′ E, 42°53′–43°6′ N. According to the distance of the center of gravity shift in each month, the center of gravity of precipitation shifted the most in March, which was shifted to the northeast by 30.39 km compared with that of February, and the smallest in January, which was shifted to the northwest by 0.72 km compared with that of December. January shows the smallest shift distance, shifting by 0.72 km to the northwest compared to December. As spring begins in March, precipitation gradually increases, with Balikun, Yiwu, and Yizhou counties receiving more precipitation than Tuokexun, Gaochang, and Shanshan counties between March and October. Therefore, from March to October, the center of gravity of precipitation mainly moves to the northeast, and from November to February, the center of gravity of precipitation mainly moves to the west. Subsequently, the standard deviation ellipse was used to create a first-order standard deviation ellipse of the 12 monthly precipitation centers of gravity, oriented at 90°12′ north by east, with the long axis located in the northwest to southeast direction and the short axis located in the southwest to northeast direction, and the ellipse’s oblateness was 2.73, indicating that the monthly precipitation centers of gravity are less dispersed in the southwest to northeast direction, and that the monthly precipitation centers of gravity are clearly directional in their distributions, which are mainly distributed in the northwest to southeast direction.
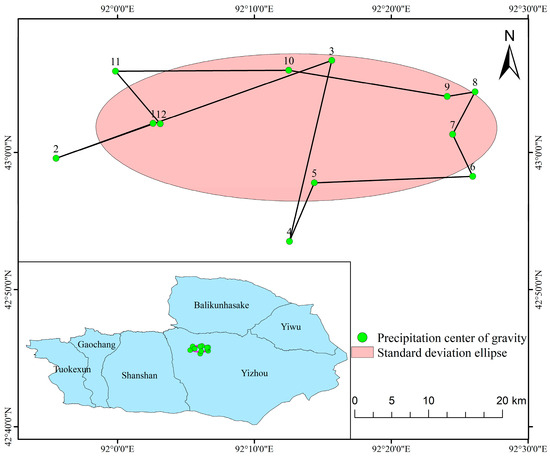
Figure 12.
Centers of gravity of multi-year monthly mean precipitation and their migration trajectories for January–December 2001–2020.
Table 2.
Location of the center of gravity of monthly precipitation and the direction and distance of its movement, Turpan–Hami region, 2001–2020.
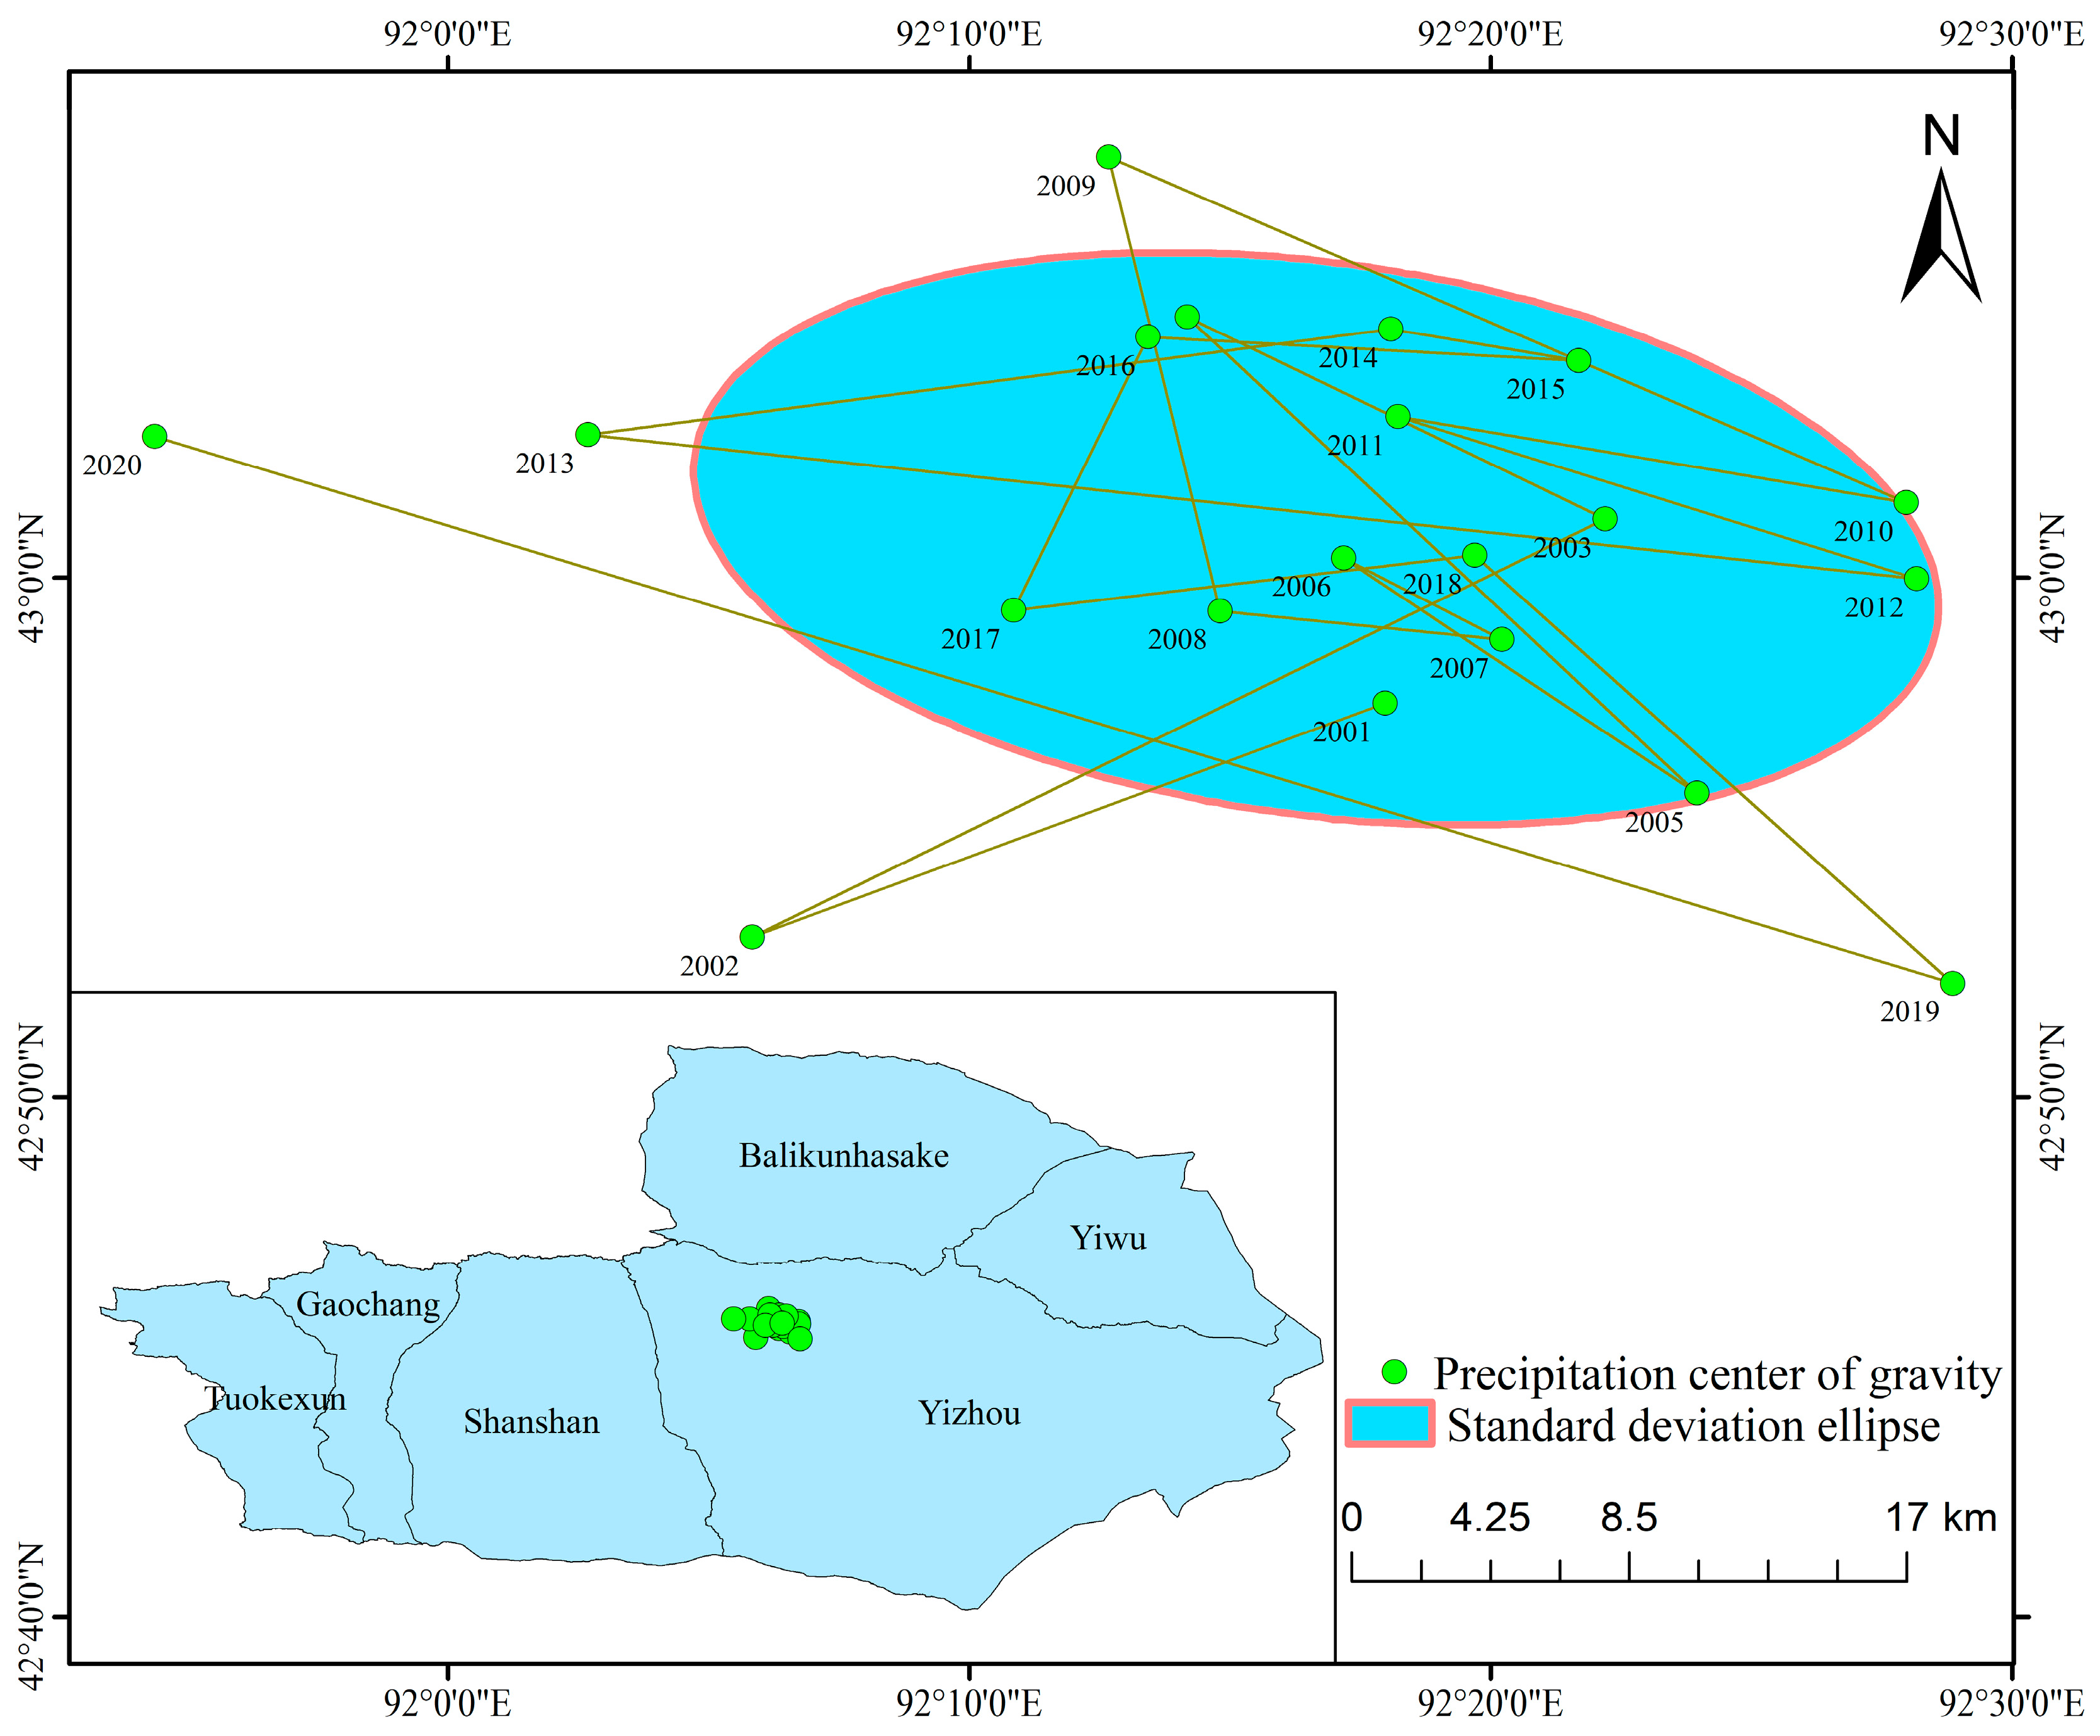
From the annual scale analysis, the distribution and migration trajectory of the center of gravity of annual precipitation in the Turpan–Hami region from 2001 to 2020 is shown in Figure 13. It can be seen that the regional precipitation center of gravity is concentrated in the northern part of Yizhou district, which is located at 91°59′–92°29′ E, 42°53′–43°7′ N. The results of the standard deviation ellipse analysis show that the migration of the precipitation center of gravity is in the direction of 97°44′ north by east, and it is mainly distributed in the direction from northwest to southeast. The long axis of the standard deviation ellipse is distributed in the northwest to southeast direction, and the short axis is distributed in the southwest to northeast direction, and the oblateness of the ellipse is 2.26, which indicates that the annual precipitation center of gravity distribution is obviously directional, and the degree of dispersion is larger in the northwest to southeast direction than in the southwest to northeast direction, mainly due to the distribution of the Bogda Mountain and the East Tianshan Mountain in the northwest to southeast direction, which are the high-value areas for the distribution of precipitation in the Turpan–Hami area. Further analysis of the changes in the longitude and latitude of the center of gravity of precipitation in the Turpan–Hami region over time from 2001 to 2020 reveals (Figure 14) that the longitude of the center of gravity of precipitation in the Turpan–Hami region is gradually decreasing over time, and the latitude of the center of gravity is gradually increasing, which suggests that the center of gravity of precipitation in the Turpan–Hami region is showing a tendency of gradual movement in a northwesterly direction.

Figure 13.
Map of the location and trajectory of the center of gravity of precipitation, 2001–2020.
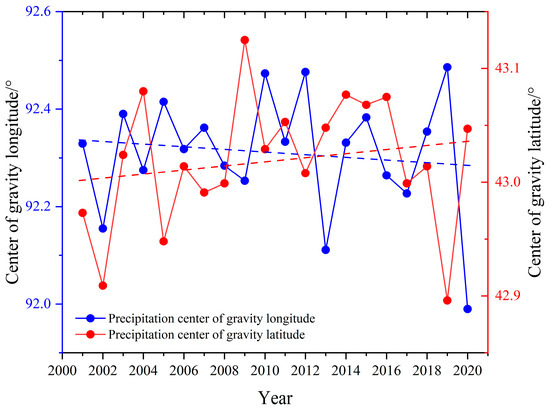
Figure 14.
Changes in latitude and longitude coordinates of the center of gravity of precipitation, 2001–2020.
3.3.3. Characterization of Precipitation Trends
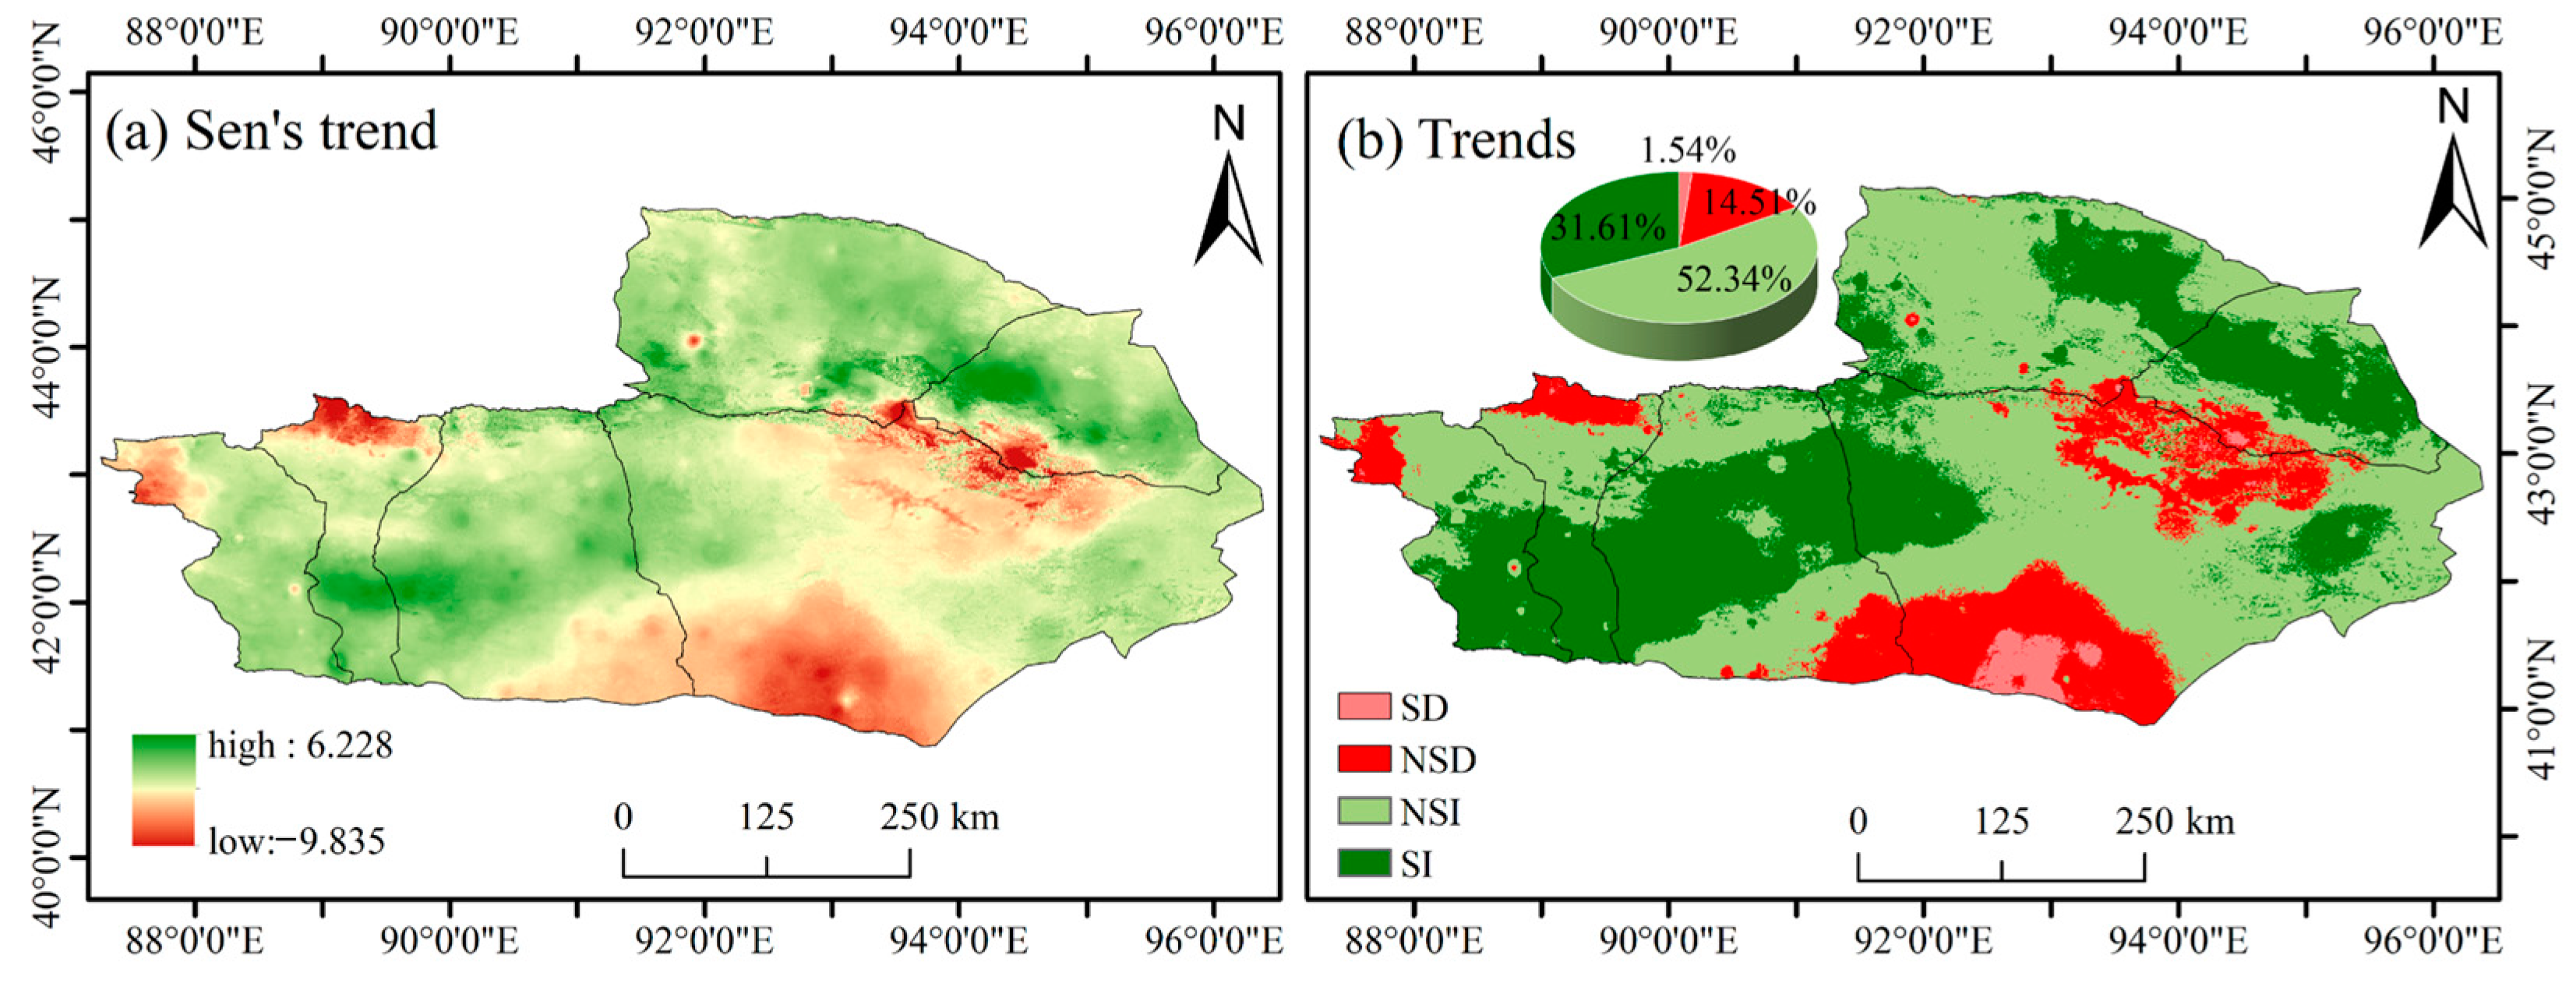
The study analyzed the trend of precipitation change in the Turpan–Hami region from 2001 to 2020 using Sen’s and Mann–Kendall trend detection. The results are presented in Figure 15, which shows that the slope of precipitation change in the Turpan–Hami region from 2001 to 2020 ranges from −9.835 to 6.228 mm/a, and the average trend rate of change is 0.990 mm/a, which shows an overall increasing trend. Among them, those showing an increasing trend were mainly distributed in the central part of Gaochang District and Shanshan County and the northwestern part of Yiwu County. The decreasing trend occurs mainly in the northern part of Gaochang District, the southern part of Yizhou District, and the junction of Balikun County, Yiwu County, and Yizhou District. Using the Mann–Kendall test of significance for the results of the Sen trend analysis, we obtained the spatial distribution of precipitation trends in the Turpan–Hami region: the areas with significant increases in precipitation accounted for 31.61% of the Turpan–Hami region and were mainly distributed in the south-central part of Tuokexun and Gaochang districts, the central part of Shanshan county, the northwestern part of Yizhou district, and the eastern part of Balikun and Yiwu counties; the areas with insignificant increases in precipitation accounted for 52.34% of the Turpan–Hami region, mainly in the northern part of Tuokexun and Gaochang districts, the northern and southern parts of Shanshan County, the central part of Yizhou District, the northern part of Balikun County, and the northeastern part of Yiwu County; the area of non-significantly decreasing precipitation accounted for 14.51% of the Turpan–Hami area, mainly in the northwestern part of Tuokexun County, the northern part of Gaochang District, the southeastern part of Shanshan County, the southwestern part of Yizhou District, and the junction of Yizhou District and Yiwu County; the area with significantly reduced precipitation accounts for 1.54% of the Turpan–Hami region, mainly distributed in a small portion of the southwestern part of Yizhou District and a small portion of the western part of Yiwu County. In general, precipitation in the Turpan–Hami region shows a non-significant increasing trend from 2001 to 2020.

Figure 15.
(a) Sen’s slope estimation results; (b) precipitation changes in the Turpan–Hami region, 2001–2020. SD: significant decrease; NSD: non-significant decrease; NSI: non-significant increase; SI: significant increase.
4. Discussion
Accurate and reliable precipitation data are important for hydrologic modeling, weather forecasting, water resource management, etc. [49].Obtaining high-resolution precipitation data is difficult in the Turpan–Hami region, where precipitation information is scarce. Spatial downscaling improves the spatial resolution of precipitation data. Most of the previous studies selected normalized difference vegetation index, elevation, slope, and aspect as variables [46,50], while elements such as actual evapotranspiration, air temperature, cloud cover, and wind speed were less frequently considered. Actual evapotranspiration, air temperature, cloud cover, and wind speed, as necessary conditions for precipitation, have an important role in the precipitation mechanism in arid zones. In this study, based on the previous construction of the precipitation scale model, the climatic factors that have an impact on precipitation were taken into account, along with the geographic characteristics of the Turpan–Hami region, and the average temperature and actual evapotranspiration were selected as having a greater impact on precipitation using the XGBoost model and the SHAP significance analysis algorithm. The traditional spatial downscaling methods do not fully consider the spatial non-stationarity between precipitation and explanatory variables. In this study, a multi-scale geographically weighted regression model is selected for spatial downscaling, which better presents the impact of explanatory variables on precipitation by setting different bandwidths for different parameters.
This study can provide ideas for improving the spatial resolution of precipitation data in arid zones. However, there are some limitations in this study, i.e., the influence of climatic factors on precipitation was considered in the selection of explanatory variables, and the influence of soil moisture on precipitation was not taken into account. In future studies, whether or not soil moisture can help to improve the spatial resolution of precipitation can be explored. This study improves the spatial resolution of monthly precipitation data in the Turpan–Hami region, and downscaling of hourly-scale and daily-scale precipitation data can be considered in future studies, which is of great significance for the future development of extreme precipitation studies and water resource management.
5. Conclusions
This study evaluates the applicability of existing precipitation data products in the Turpan–Hami region, and the GPM 3IMERGM V06 precipitation data is well suited for use as basic data for precipitation downscaling studies. Next, the XGBoost model and the SHAP significance analysis algorithm were used to select the climatic factors of mean temperature and actual evapotranspiration, which have a large impact on precipitation, and the MGWR model was constructed by combining the normalized difference vegetation index, elevation, slope, and aspect to produce a 1 km resolution monthly precipitation dataset of the Turpan–Hami region from 2001 to 2020. Finally, the spatiotemporal distribution and variation trend of precipitation were analyzed. Spatial downscaling using multi-scale geographically weighted regression models not only improves the spatial resolution of GPM precipitation data but also improves the accuracy of precipitation data. The monthly precipitation in the Turpan–Hami region is concentrated in July, and the seasonal precipitation occurs during summer > spring > autumn > winter. The annual precipitation in the Turpan–Hami region from 2001 to 2020 shows an increasing trend, which is mainly distributed in the northern part of Tuokexun County, Gaochang District, and the junction of Balikun County, Yiwu County, and Yizhou District. These findings presents a reference for the selection of satellite precipitation data in arid regions, the improvement of spatial resolution of precipitation data, and a better understanding of precipitation changes in the Turpan–Hami region, which provides a reference for ecological environment construction, water resource management, and agricultural production in the Turpan–Hami region.
Author Contributions
H.H.: data collection, methodology, software, analysis, and writing—original draft preparation; J.W.: supervision, writing—review and editing, and funding acquisition. J.D.: writing—review and editing and methodology; L.W.: data processing. All authors have read and agreed to the published version of the manuscript.
Funding
This research was supported by the Basic Resources Investigation Project of the Ministry of Science and Technology: Water Resources Investigation and Carrying Capacity Assessment of Turpan–Hami Basin (No.2021xjkk1000).
Data Availability Statement
The original contributions presented in the study are included in the article, further inquiries can be directed to the corresponding author.
Acknowledgments
We are sincerely grateful to the reviewers and editors for their constructive comments for improving the manuscript.
Conflicts of Interest
The authors declare no conflicts of interest.
References
- Kidd, C.; Huffman, G. Global precipitation measurement. Meteorol. Appl. 2011, 18, 334–353. [Google Scholar] [CrossRef]
- Zhang, L.; Gao, L.; Chen, J.; Zhao, L.; Zhao, J.; Qiao, Y.; Shi, J. Comprehensive evaluation of mainstream gridded precipitation datasets in the cold season across the Tibetan Plateau. J. Hydrol. Reg. Stud. 2022, 43, 101186. [Google Scholar] [CrossRef]
- Jia, S.; Zhu, W.; Lű, A.; Yan, T. A statistical spatial downscaling algorithm of TRMM precipitation based on NDVI and DEM in the Qaidam Basin of China. Remote Sens. Environ. 2011, 115, 3069–3079. [Google Scholar] [CrossRef]
- Ceccherini, G.; Ameztoy, I.; Hernández, C.; Moreno, C. High-Resolution Precipitation Datasets in South America and West Africa based on Satellite-Derived Rainfall, Enhanced Vegetation Index and Digital Elevation Model. Remote Sens. 2015, 7, 6454–6488. [Google Scholar] [CrossRef]
- Blacutt, L.A.; Herdies, D.L.; de Gonçalves, L.G.G.; Vila, D.A.; Andrade, M. Precipitation comparison for the CFSR, MERRA, TRMM3B42 and Combined Scheme datasets in Bolivia. Atmos. Res. 2015, 163, 117–131. [Google Scholar] [CrossRef]
- Yilmaz, K.K.; Hogue, T.S.; Hsu, K.-l.; Sorooshian, S.; Gupta, H.V.; Wagener, T. Intercomparison of Rain Gauge, Radar, and Satellite-Based Precipitation Estimates with Emphasis on Hydrologic Forecasting. J. Hydrometeorol. 2005, 6, 497–517. [Google Scholar] [CrossRef]
- Zhang, T.; Liang, Z.; Wang, H.; Wang, J.; Hu, Y.; Li, B. Merging multisatellite precipitation products using stacking method and the censored-shifted gamma ensemble model output statistics in china’s Beimiaoji basin. J. Hydrol. 2023, 618, 129263. [Google Scholar] [CrossRef]
- Tang, G.; Ma, Y.; Long, D.; Zhong, L.; Hong, Y. Evaluation of GPM Day-1 IMERG and TMPA Version-7 legacy products over Mainland China at multiple spatiotemporal scales. J. Hydrol. 2016, 533, 152–167. [Google Scholar] [CrossRef]
- Einfalt, T.; Arnbjerg-Nielsen, K.; Golz, C.; Jensen, N.-E.; Quirmbach, M.; Vaes, G.; Vieux, B. Towards a roadmap for use of radar rainfall data in urban drainage. J. Hydrol. 2004, 299, 186–202. [Google Scholar] [CrossRef]
- Nastos, P.T.; Kapsomenakis, J.; Philandras, K.M. Evaluation of the TRMM 3B43 gridded precipitation estimates over Greece. Atmos. Res. 2016, 169, 497–514. [Google Scholar] [CrossRef]
- Yu, C.; Shao, H.; Hu, D.; Liu, G.; Dai, X. Merging precipitation scheme design for improving the accuracy of regional precipitation products by machine learning and geographical deviation correction. J. Hydrol. 2023, 620, 129560. [Google Scholar] [CrossRef]
- Huffman, G.J.; Bolvin, D.T.; Nelkin, E.J.; Wolff, D.B.; Adler, R.F.; Gu, G.; Hong, Y.; Bowman, K.P.; Stocker, E.F. The TRMM Multisatellite Precipitation Analysis (TMPA): Quasi-Global, Multiyear, Combined-Sensor Precipitation Estimates at Fine Scales. J. Hydrometeorol. 2007, 8, 38–55. [Google Scholar] [CrossRef]
- Hou, A.Y.; Kakar, R.K.; Neeck, S.; Azarbarzin, A.A.; Kummerow, C.D.; Kojima, M.; Oki, R.; Nakamura, K.; Iguchi, T. The Global Precipitation Measurement Mission. Bull. Am. Meteorol. Soc. 2014, 95, 701–722. [Google Scholar] [CrossRef]
- Joyce, R.J.; Janowiak, J.E.; Arkin, P.A.; Xie, P. CMORPH: A Method that Produces Global Precipitation Estimates from Passive Microwave and Infrared Data at High Spatial and Temporal Resolution. J. Hydrometeorol. 2004, 5, 287–296. [Google Scholar] [CrossRef]
- Tang, X.; Li, H.; Qin, G.; Huang, Y.; Qi, Y. Evaluation of Satellite-Based Precipitation Products over Complex Topography in Mountainous Southwestern China. Remote Sens. 2023, 15, 473. [Google Scholar] [CrossRef]
- Yang, Y.; Luo, Y. Evaluating the performance of remote sensing precipitation products CMORPH, PERSIANN, and TMPA, in the arid region of northwest China. Theor. Appl. Climatol. 2014, 118, 429–445. [Google Scholar] [CrossRef]
- Xu, S.; Wu, C.; Wang, L.; Gonsamo, A.; Shen, Y.; Niu, Z. A new satellite-based monthly precipitation downscaling algorithm with non-stationary relationship between precipitation and land surface characteristics. Remote Sens. Environ. 2015, 162, 119–140. [Google Scholar] [CrossRef]
- Park, N.-W. Spatial Downscaling of TRMM Precipitation Using Geostatistics and Fine Scale Environmental Variables. Adv. Meteorol. 2013, 2013, 237126. [Google Scholar] [CrossRef]
- Immerzeel, W.W.; Rutten, M.M.; Droogers, P. Spatial downscaling of TRMM precipitation using vegetative response on the Iberian Peninsula. Remote Sens. Environ. 2009, 113, 362–370. [Google Scholar] [CrossRef]
- Zhan, C.; Han, J.; Hu, S.; Liu, L.; Dong, Y. Spatial Downscaling of GPM Annual and Monthly Precipitation Using Regression-Based Algorithms in a Mountainous Area. Adv. Meteorol. 2018, 2018, 1–13. [Google Scholar] [CrossRef]
- Jing, W.; Yang, Y.; Yue, X.; Zhao, X. A Comparison of Different Regression Algorithms for Downscaling Monthly Satellite-Based Precipitation over North China. Remote Sens. 2016, 8, 835. [Google Scholar] [CrossRef]
- Lu, X.; Tang, G.; Wang, X.; Liu, Y.; Jia, L.; Xie, G.; Li, S.; Zhang, Y. Correcting GPM IMERG precipitation data over the Tianshan Mountains in China. J. Hydrol. 2019, 575, 1239–1252. [Google Scholar] [CrossRef]
- Zhang, Y.; Li, Y.; Ji, X.; Luo, X.; Li, X. Fine-Resolution Precipitation Mapping in a Mountainous Watershed: Geostatistical Downscaling of TRMM Products Based on Environmental Variables. Remote Sens. 2018, 10, 119. [Google Scholar] [CrossRef]
- Chen, C.; Zhao, S.; Duan, Z.; Qin, Z. An Improved Spatial Downscaling Procedure for TRMM 3B43 Precipitation Product Using Geographically Weighted Regression. IEEE J. Sel. Top. Appl. Earth Obs. Remote Sens. 2015, 8, 4592–4604. [Google Scholar] [CrossRef]
- Wang, L.; Chen, R.; Han, C.; Yang, Y.; Liu, J.; Liu, Z.; Wang, X.; Liu, G.; Guo, S. An Improved Spatial–Temporal Downscaling Method for TRMM Precipitation Datasets in Alpine Regions: A Case Study in Northwestern China’s Qilian Mountains. Remote Sens. 2019, 11, 870. [Google Scholar] [CrossRef]
- Yang, Z.; Zhang, Q.; Hao, X. Evapotranspiration Trend and Its Relationship with Precipitation over the Loess Plateau during the Last Three Decades. Adv. Meteorol. 2016, 2016, 6809749. [Google Scholar] [CrossRef]
- Ferrari, E.; Coscarelli, R.; Sirangelo, B. Correlation Analysis of Seasonal Temperature and Precipitation in a Region of Southern Italy. Geosciences 2018, 8, 160. [Google Scholar] [CrossRef]
- Liu, Z.; Wang, J.; Ding, J.; Xie, X. Analysis of spatial–temporal evolution trends and influential factors of desert-oasis thermal environment in typical arid zone: The case of Turpan–Hami region. Ecol. Indic. 2023, 154, 110747. [Google Scholar] [CrossRef]
- Wang, L.; Wang, J.; Ding, J.; Li, X. Estimation and Spatiotemporal Evolution Analysis of Actual Evapotranspiration in Turpan and Hami Cities Based on Multi-Source Data. Remote Sens. 2023, 15, 2565. [Google Scholar] [CrossRef]
- Huffman, G.J.; Adler, R.F.; Bolvin, D.T.; Nelkin, E.J. The TRMM Multi-Satellite Precipitation Analysis (TMPA). In Satellite Rainfall Applications for Surface Hydrology; Springer: Berlin/Heidelberg, Germany, 2010; pp. 3–22. [Google Scholar]
- Lober, C.; Fayne, J.; Hashemi, H.; Smith, L.C. Bias correction of 20 years of IMERG satellite precipitation data over Canada and Alaska. J. Hydrol. Reg. Stud. 2023, 47, 101386. [Google Scholar] [CrossRef]
- Xie, P.; Joyce, R.; Wu, S.; Yoo, S.H.; Yarosh, Y.; Sun, F.; Lin, R. NOAA Climate Data Record (CDR) of CPC Morphing Technique (CMORPH) High Resolution Global Precipitation Estimates, Version 1; NOAA: Washington, DC, USA, 2020. [CrossRef]
- Shouzhang, P. 1-km Monthly Mean Temperature Dataset for China (1901–2021). Available online: https://data.tpdc.ac.cn/en/data/71ab4677-b66c-4fd1-a004-b2a541c4d5bf/ (accessed on 1 March 2024).
- Peng, S.; Gang, C.; Cao, Y.; Chen, Y. Assessment of climate change trends over the Loess Plateau in China from 1901 to 2100. Int. J. Climatol. 2018, 38, 2250–2264. [Google Scholar] [CrossRef]
- Peng, S.; Ding, Y.; Wen, Z.; Chen, Y.; Cao, Y.; Ren, J. Spatiotemporal change and trend analysis of potential evapotranspiration over the Loess Plateau of China during 2011–2100. Agric. For. Meteorol. 2017, 233, 183–194. [Google Scholar] [CrossRef]
- Peng, S.; Ding, Y.; Liu, W.; Li, Z. 1-km monthly temperature and precipitation dataset for China from 1901 to 2017. Earth Syst. Sci. Data 2019, 11, 1931–1946. [Google Scholar] [CrossRef]
- Ding, Y.; Peng, S. Spatiotemporal Trends and Attribution of Drought across China from 1901–2100. Sustainability 2020, 12, 477. [Google Scholar] [CrossRef]
- Harris, I.; Osborn, T.J.; Jones, P.; Lister, D. Version 4 of the CRU TS monthly high-resolution gridded multivariate climate dataset. Sci. Data 2020, 7, 109. [Google Scholar] [CrossRef] [PubMed]
- Abatzoglou, J.T.; Dobrowski, S.Z.; Parks, S.A.; Hegewisch, K.C. TerraClimate, a high-resolution global dataset of monthly climate and climatic water balance from 1958–2015. Sci. Data 2018, 5, 170191. [Google Scholar] [CrossRef]
- Fotheringham, A.S.; Yang, W.; Kang, W. Multiscale Geographically Weighted Regression (MGWR). Ann. Am. Assoc. Geogr. 2017, 107, 1247–1265. [Google Scholar] [CrossRef]
- Lundberg, S.M.; Lee, S.-I. A unified approach to interpreting model predictions. In Proceedings of the 31st International Conference on Neural Information Processing Systems, Long Beach, CA, USA, 4–9 December 2017; pp. 4768–4777. [Google Scholar]
- Chen, T.; Guestrin, C. XGBoost: A Scalable Tree Boosting System. In Proceedings of the 22nd ACM SIGKDD International Conference on Knowledge Discovery and Data Mining, San Francisco, CA, USA, 13–17 August 2016; pp. 785–794. [Google Scholar]
- Wang, Y.; Miao, C.; Zhao, X.; Zhang, Q.; Su, J. Evaluation of the GPM IMERG product at the hourly timescale over China. Atmos. Res. 2023, 285, 106656. [Google Scholar] [CrossRef]
- Nyikadzino, B.; Chitakira, M.; Muchuru, S. Rainfall and runoff trend analysis in the Limpopo river basin using the Mann Kendall statistic. Phys. Chem. Earth Parts A/B/C 2020, 117, 102870. [Google Scholar] [CrossRef]
- Yinjun, Z.; Qiyu, D.; Qing, L.; Chunting, C. Quantitative analysis of the impacts of terrestrial environmental factors on precipitation variation over the Beibu Gulf Economic Zone in Coastal Southwest China. Sci. Rep. 2017, 7, 44412. [Google Scholar]
- Zhang, T.; Li, B.; Yuan, Y.; Gao, X.; Sun, Q.; Xu, L.; Jiang, Y. Spatial downscaling of TRMM precipitation data considering the impacts of macro-geographical factors and local elevation in the Three-River Headwaters Region. Remote Sens. Environ. 2018, 215, 109–127. [Google Scholar] [CrossRef]
- Wang, H.; Zang, F.; Zhao, C.; Liu, C. A GWR downscaling method to reconstruct high-resolution precipitation dataset based on GSMaP-Gauge data: A case study in the Qilian Mountains, Northwest China. Sci. Total Environ. 2022, 810, 152066. [Google Scholar] [CrossRef] [PubMed]
- Kofidou, M.; Stathopoulos, S.; Gemitzi, A. Review on spatial downscaling of satellite derived precipitation estimates. Environ. Earth Sci. 2023, 82, 424. [Google Scholar] [CrossRef]
- Liu, Z. Accuracy of satellite precipitation products in data-scarce Inner Tibetan Plateau comprehensively evaluated using a novel ground observation network. J. Hydrol. Reg. Stud. 2023, 47, 101405. [Google Scholar] [CrossRef]
- Zhang, Q.; Shi, P.; Singh, V.P.; Fan, K.; Huang, J. Spatial downscaling of TRMM-based precipitation data using vegetative response in Xinjiang, China. Int. J. Climatol. 2017, 37, 3895–3909. [Google Scholar] [CrossRef]


Disclaimer/Publisher’s Note: The statements, opinions and data contained in all publications are solely those of the individual author(s) and contributor(s) and not of MDPI and/or the editor(s). MDPI and/or the editor(s) disclaim responsibility for any injury to people or property resulting from any ideas, methods, instructions or products referred to in the content. |
© 2024 by the authors. Licensee MDPI, Basel, Switzerland. This article is an open access article distributed under the terms and conditions of the Creative Commons Attribution (CC BY) license (https://creativecommons.org/licenses/by/4.0/).