Article

The Oasisization Process Promotes the Transformation of Soil Organic Carbon into Soil Inorganic Carbon

1
College of Ecology and Environment, Xinjiang University, Urumqi 830017, China
2
Xinjiang Key Laboratory of Oasis Ecological, Ministry of Education, Urumqi 830017, China
*
Author to whom correspondence should be addressed.
Land 2024, 13(3), 336; https://doi.org/10.3390/land13030336
Submission received: 31 January 2024 / Revised: 28 February 2024 / Accepted: 4 March 2024 / Published: 6 March 2024

Abstract

:
The dynamic fluctuations in the soil organic carbon (SOC) stock, a fundamental part of the terrestrial ecosystem’s carbon stock, are critical to preserving the global carbon balance. Oases in arid areas serve as critical interfaces between oasis ecosystems and deserts, with land use changes within these oases being key factors affecting soil organic carbon turnover. However, the response of the soil SOC-CO2-SIC (soil inorganic carbon) micro-carbon cycle to oasis processes and their underlying mechanisms remains unclear. Five land-use types in the Alar reclamation area—cotton field (CF), orchard (OR), forest land (FL), waste land (WL), and sandy land (SL)—were chosen as this study’s research subjects. Using stable carbon isotope technology, the transformation process of SOC in the varieties of land-use types from 0 to 100 cm was quantitatively analyzed. The results showed the following: (1) The SOC of diverse land-use types decreased with the increase in soil depth. There were also significant differences in SIC-δ13C values among the different land-use types. The PC(%) (0.73 g kg−1) of waste land was greatly higher than that of other land-use types (p < 0.05) (factor analysis of variance). (2) The CO2 fixation in cotton fields, orchards, forest lands, and waste land primarily originates from soil respiration, whereas, in sandy lands, it predominantly derives from atmospheric sources. (3) The redundancy analysis (RDA) results display that the primary influencing factors in the transfer of SOC to SIC are soil water content, pH, and microbial biomass carbon. Our research demonstrates that changes in land use patterns, as influenced by oasis processes, exert a significant impact on the conversion from SOC to SIC. This finding holds substantial significance for ecological land use management practices and carbon sequestration predictions in arid regions, particularly in the context of climate change.

1. Introduction

The soil carbon stock, distinguished as the most substantial and least dynamic in terrestrial ecosystems, plays a pivotal role in the climate and global carbon cycle modulation through its intricate processes of SOC storage, decomposition, and SIC accumulation [1]. In arid regions, the oasis SOC stock in oasis soil stands as a primary carbon reservoir. It is deeply integrated with both the internal and external material cycles of the ecosystem [2]. The transformation from desert to oasis, orchestrated by a synergy of human and natural influences, precipitates shifts in land use that restructure the ecosystem composition and functionality, consequently impacting carbon cycling processes [3]. As oasis environments become more pronounced, the interplay among diverse ecological and biogenic factors intensively drives the migration and metamorphosis of soil organic carbon stocks, establishing a dynamic interconnection and feedback loop with global environmental changes [4]. Therefore, dissecting the dynamics and driving mechanisms of soil organic carbon stocks in oasis-influenced terrains becomes crucial for accurately gauging the carbon sequestration capacity of terrestrial ecosystems and elucidating the mechanisms underpinning carbon stability in arid landscapes.
Soil carbon stock is strongly disturbed by human activities, due to the process of oasis creation, and can be adjusted in a short time scale. The change in land-use type, the input of exogenous substances, and the intervention of seasonal human activities have an impact on the soil organic carbon budget and carbon sequestration potential in arid oases [5]. Due to its special geographical location and climatic conditions, SOC is transformed into SIC [6] through the micro-carbon cycle system of “SOC → CO2 → SIC”, which is an important way to transform soil carbon stock in arid and semi-arid regions. The variations of land use mode caused by oases is an important factor affecting the storage and turnover dynamics of soil carbon stock [7]. The expansion of oasis agriculture has led to significant declines in SOC [8]. One study in India’s Wendy region found that the conversion of grassland into farmland would lead to an increase in CO2 emissions and a decrease in SOC storage [9]. Furthermore, a study in the southwestern part of Michigan, USA, found that, after forest lands, grasslands, and wetlands were transformed into farmland, the soil carbon storage showed a decreasing trend [10]. Therefore, the study on the transfer of SOC stock in oases is helpful to understand the mechanism of the soil carbon cycle in the process of oasis creation.
Apart from possessing the ability to conduct quantitative research on the origin, distribution, breakdown, and movement of soil carbon, stable carbon isotope technology can also effectively trace the transformation process of soil carbon [11] and offer compelling evidence for the study of dynamic changes in carbon stocks [12]. The process of carbon migration and transformation in soil was efficiently defined by the quantitative analysis of the soil CO2 fixed during the creation and recrystallization of secondary carbonate [13]. At present, most of the studies on δ13C only select single landscapes, such as cultivated land [14], woodland [15], and wetland [16], as the research objects. For example, using the 13C isotope tracer tagging technique, An et al. looked at how organic and inorganic carbon were distributed and the dynamic changes in different soil types [17]. In view of the coupling effect between land-use types, soil factors, and climate factors, although some studies have discussed it, there are still relatively few studies on land use changes in the process of the creation of an oasis. In addition, how the matching relationship between various environmental and soil factors affects soil δ13C needs further study.
The Taklimakan Desert’s northern border, where the Alar Oasis is situated, is a typical ecologically sensitive and environmental-crisis-ridden area. The land use changes brought about by the oasis creation process strongly affect the soil carbon stock [18]. In this study, five typical land-use types in Aral were selected by using the parameter of space instead of time, and the influence of the desert oasis creation process on SOC stock and the carbon transformation mechanism in arid areas was explored by combining with stable carbon isotope technology [19]. The scientific problems to be solved in this study are as follows: (1) How does the soil carbon stock change in the process of creating an oasis? (2) The transformation law and driving factors of SOC to SIC in diverse land-use types.

2. Materials and Methods
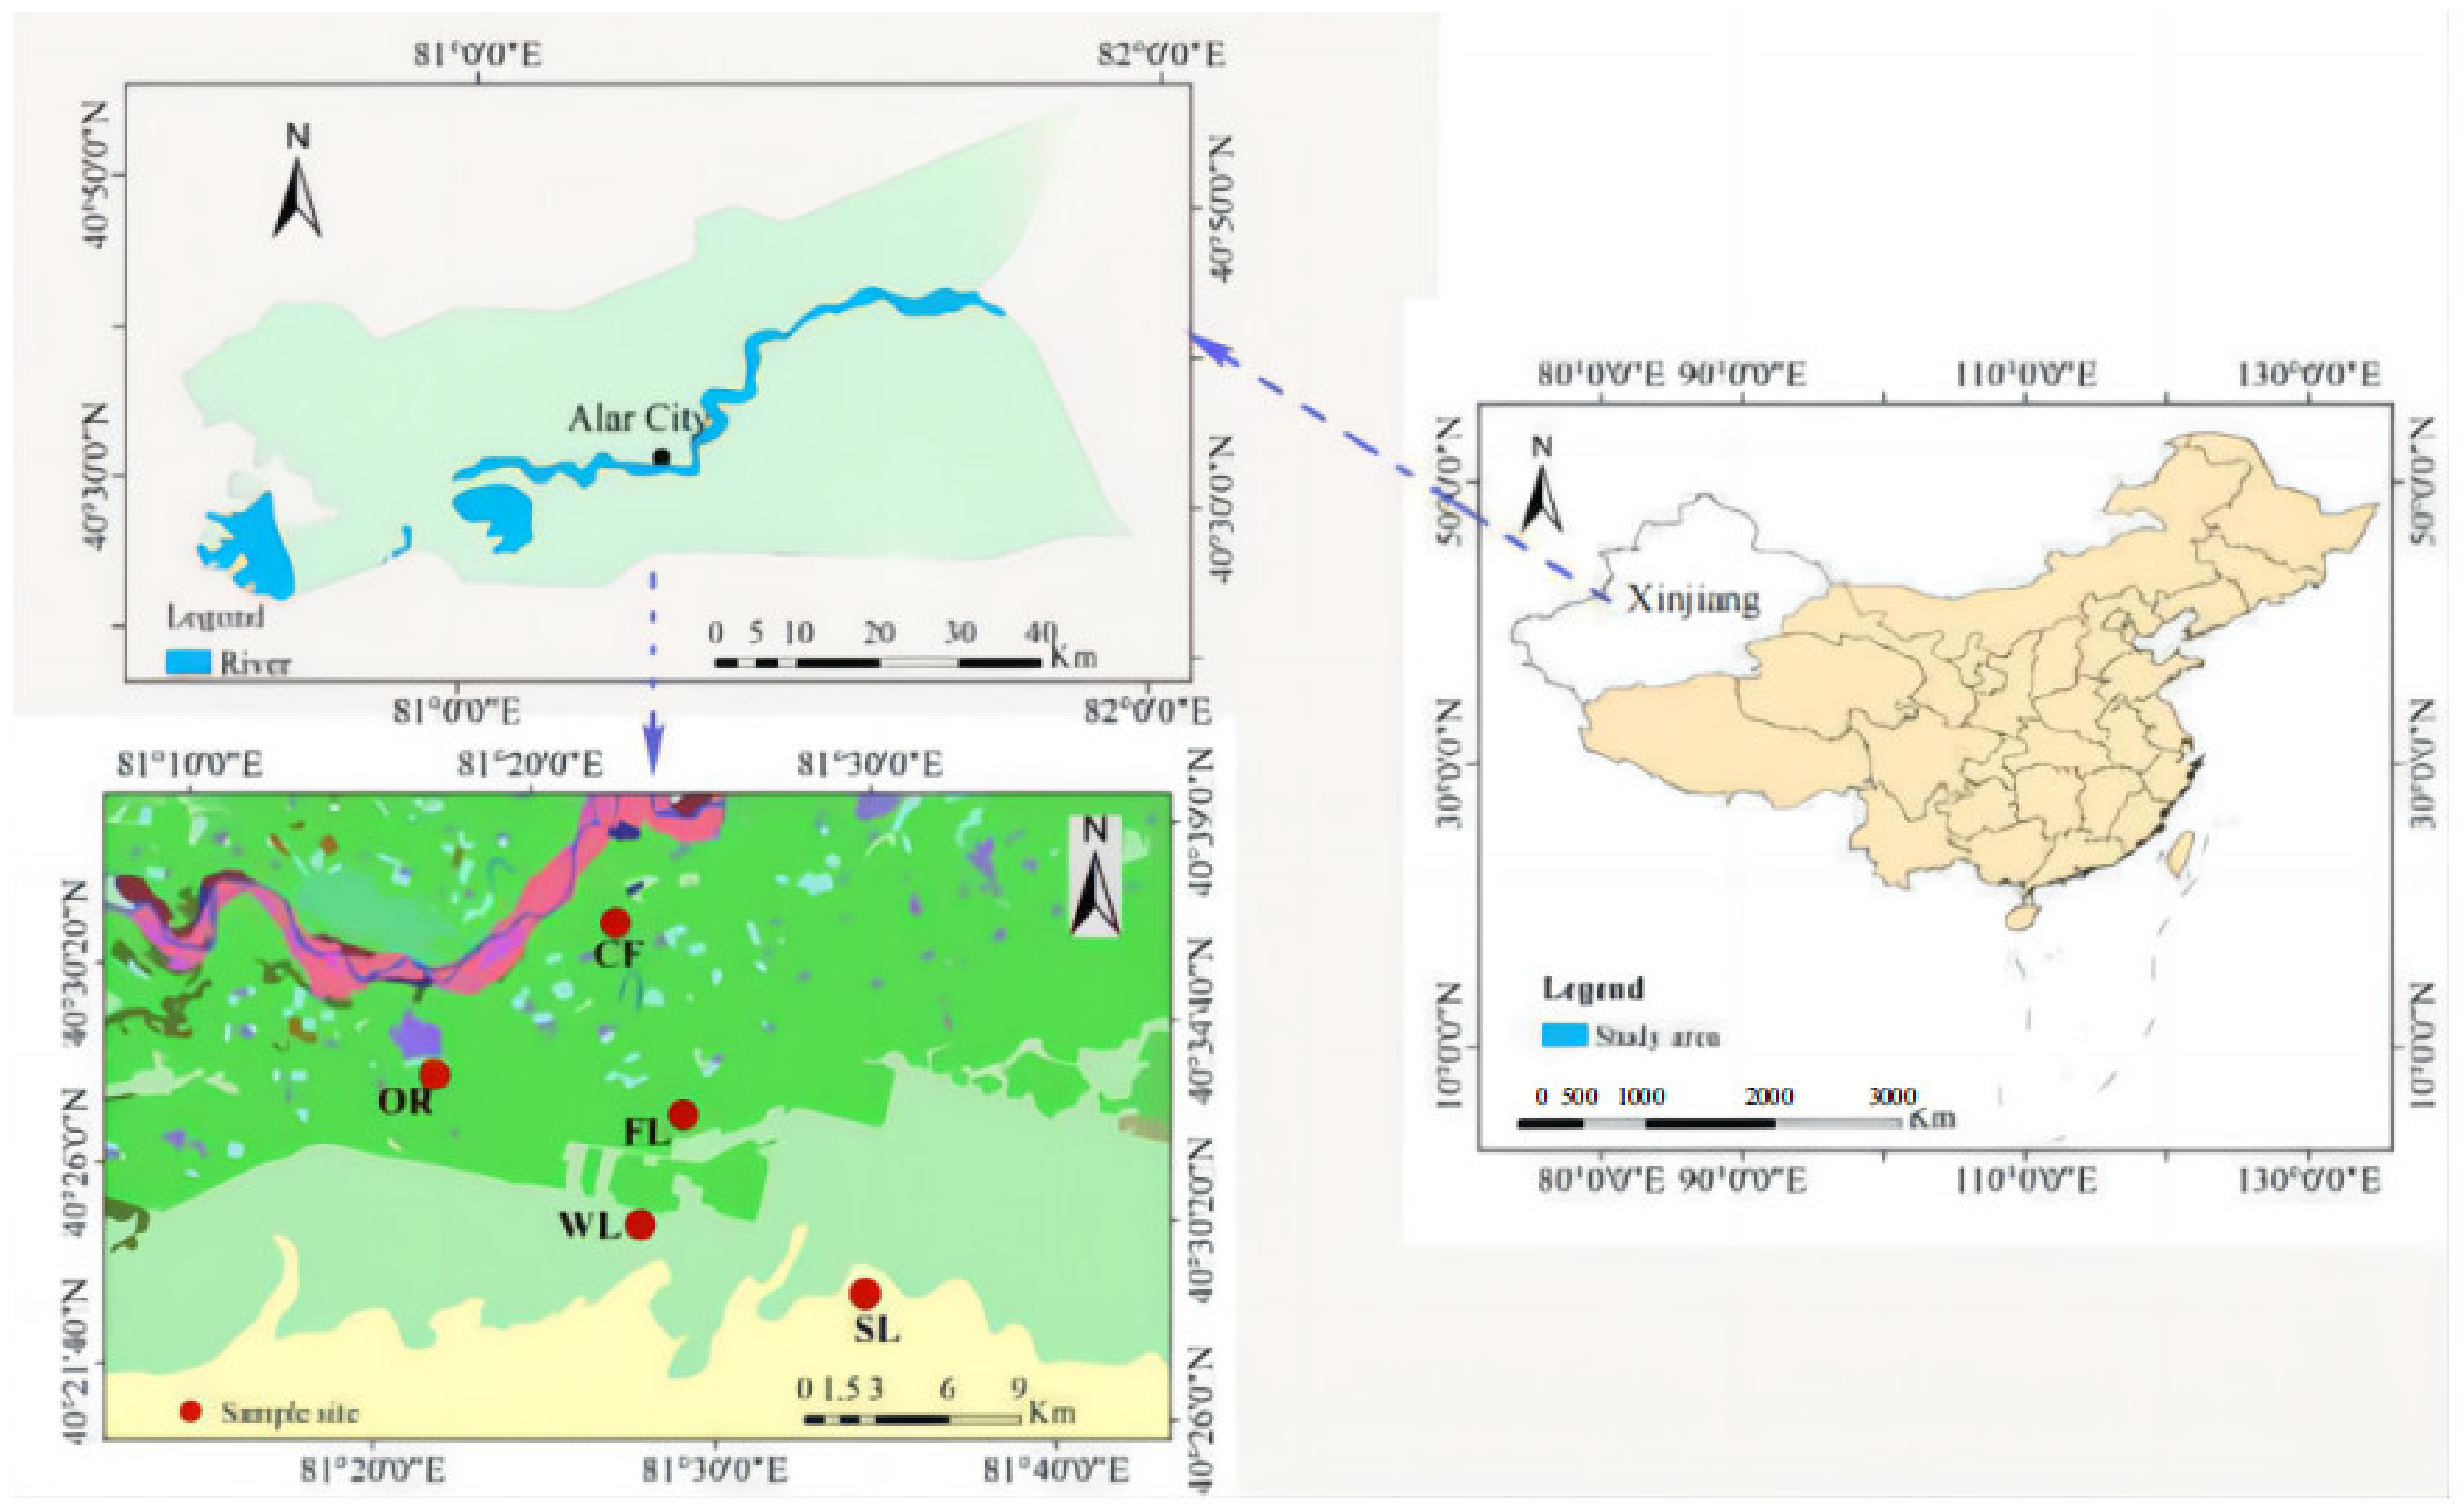
2.1. Study Site

The Alar Oasis (80.30′~81.58′ E, 40.22′~40.57′ N) is situated in the northern part of the Tarim Basin (Figure 1). This area is an alluvial plain in the upper reaches of the Tarim River, with an average elevation of 1012 m, and belongs to a continental arid desert climate in a warm temperate zone, with an average annual precipitation of 40.1~82.5 mm and an average annual evaporation of 1876.6~2558.9 mm. In the reclamation region, there is a significant temperature variation between day and night, and the yearly solar radiation is 133.7~146.3 kcal/cm2. The sunlight rate is 58~69%, with an average of 2556.3~2991.8 h per year (http://data.cma.cn/) (Accessed on 8 February 2024).

2.2. Experimental Design and Soil Sampling

In July 2021, five types of land use were selected as sample plots, as follows: cotton fields (CF) and orchards (OR) were selected in the oasis; waste land (WL) and forest land (FL) were selected in the oasis transition zone; and sandy land (SL) was selected in the desert area. These are categorized as follows: CF (mainly continuous 30a cotton fields), OR (the main vegetation type is date palm, Zizyphus jujuba), WL (the main vegetation types are reeds, Phragmites australis, camel thorn, Alhagi sparsifolia, etc., which are found in the intersection of farmland and desert), FL (the main vegetation type is poplar, Populus euphratica), and SL (the main vegetation type is camel thorn, which is found on the edge of the Taklamakan Desert). There were 3 quadrats for each land-use type, and the spacing between the quadrats was more than 500 m. There was no irrigation in the plots 20 days before sampling in the cotton fields and orchards, and there was no precipitation in the week before sampling in the other plots. Five sampling points were arranged in a “Z” shape in each plot [20], and samples were taken at intervals of 20 cm from bottom to top on the profile of 0~100 cm. We preserved a portion of the fresh soil sample and another portion to remove plant residues, stones, and other impurities, the soil samples in the same soil layer were fully mixed, and 1 kg was taken back to the laboratory according to the 4-point method. After natural air drying, the samples were ground and sieved (0.149 mm) for experimental analysis.
The soil gas in the five land-use types was collected using the gas well method. The specific method is as follows: L-shaped PVC pipes are buried at 10, 30, 50, 70, and 90 cm to collect gas. The part horizontal to the ground is a soil gas collection tube, the part vertical to the ground is an air duct, and the top end is connected with an automatic gas sampler. After 24 h, the soil gas was extracted and discharged 3 times before gas collection, and 75 gas samples were collected.

2.3. Soil Analysis

The soil organic carbon was measured using the potassium dichromate volumetric external heating method [21]. The soil inorganic carbon was determined by the gas method [21]. The SOC isotope determination method [22] was performed as follows: CO2 was generated after the sample was burned at a high temperature in an element analyzer, the ratio of 13C to 12C of CO2 was detected with a mass spectrometer, the value of δ13C of the sample was calculated after being compared with the international standard (Peedee Benin, PDB), and the accuracy was <0.1‰. The isotope determination method of SIC and its parent carbonate was as follows: the sample was purged with N2, which then reacts with phosphoric acid in a gas bench system to generate CO2, and then enters the mass spectrometer (MAT253, Thermo Fisher Scientific, Inc., Bremen, Germany). The mass spectrometer calculates the δ13C value of the sample by detecting the ratio of 13C to 12C of CO2 and comparing it with the international standard (PDB), and the accuracy was <0.1‰. The determination method of the soil CO2 isotope was as follows: the gas sample was removed by a Precon cold trap, then directly entered the mass spectrometer, and the δ13C ratio of CO2 in the sample was calculated by detecting the 13C/12C ratio of CO2 and comparing it with the international standard (PDB), with an accuracy of <0.2‰.
The soil physical and chemical factors included total nitrogen, total salt, available phosphorus, available potassium, pH, bulk density, soil water content, and microbial biomass carbon. The determination method was as follows: the total nitrogen: semi-micro kjeldahl method [21]; available phosphorus: NaHCO3 molybdenum antimony colorimetric method [21]; available potassium: flame photometry [21]; pH: potentiometry [21]; bulk density: ring knife method [21]; soil moisture content: drying method [21]; and microbial biomass carbon: chloroform fumigation-extraction method [21].
The expression methods for stable carbon isotope ratios [22,23] were as follows: The δ13C value represents the thousandth difference between the isotope ratios of two kinds of carbon (13C, 12C) in the soil and gas samples relative to a standard, and it is an index indicating the variation level of 13C natural abundance when the sample and the standard are relatively compared and the error of δ13C value is 0.2‰. The formula is as follows:
δ C 13 = [ ( C 13 / C 12 ) s a m p l e ( C 13 / C 12 ) s t a n d a r d 1 ] × 1000
In the formula, the standard sample is the international standard (PDB), and its δ13C = 0.01124 is determined.

2.4. Calculation of Soil Carbon Sequestration Capacity for Different Land-Use Types

The δ13C-SIC values were first applied to differentiate between the lithogenic carbonates (LC) and pedogenic carbonates (PC). The steps were as follows:
Temperature-dependent carbon isotope fractionation exists in open soil systems, and the amount of CO2 sequestered in PCs during their formation and recrystallization can be obtained from isotope mass balance equations and stoichiometric equilibrium relationships that exist during the “CO2(g)-CaCO3(s)” transfer of soil carbon [24], as follows:
1000 Inα = −3.63 + 1.194 × 10⁶/T2
δ13CPC = δ13CCO2 + 9.36‰
PC(%) = [δ13CSICδ13Cpm]/[δ13CPCδ13Cpm] × 100
mPC = PC(%) × mSIC
mCO2 = 0.5 × mPC/mPC × NCO2
Typeface: α represents the isotopic fractionation factor between CO2 and the CaCO3 phase and T represents the temperature in Kelvin. During the growth season in the research area, the average temperature was 30 °C at the time of sampling. The δ13C-PC value was 9.36‰ higher than that of the δ13C-CO2 value. PC(%) represents the proportion of PC in a soil layer; δ13C-SIC represents the δ13C value of SIC in the same layer; δ13C-PC represents the δ13C value of PC; and δ13Cpm represents the δ13C value of the parent carbonate. The parent material of sandy soil is wind deposits, with a δ13C value of 0.30‰; cotton fields and orchards have alluvial deposits as their parent material, with a δ13C value of 0.20‰; and the parent material of woodland and heathland is alluvial deposits, with a sandy loam texture and δ13C values of −0.363‰. mPC represents the content of soil PC (g kg−1), while mSIC represents the content of inorganic carbon in the soil profile (g kg−1). mCO2 represents the content of CO2 sequestered in the soil (g kg−1); 0.5 is the amount of carbon in HCO3 phase 1/2, of which is CO2 originating from the soil; MPC is equal to 100 and is the molar mass of the PC; and NCO2 is equal to 44, which denotes the amount of CO2 substance.
The primary factors influencing soil δ13C-CO2 levels are soil respiration and ambient mixed CO2. The percentage of CO2 in soil gases that comes from soil respiration and the atmosphere was computed using the occurrence of carbonate carbon isotope abundance technique and the two-step method of isotope, as follows [24]:
δ13CCO2 = δ13CSOC × a% + δ13Cair × b%
δ13CCO2 = fδ13Cair + (1 − f)δ13CSOC
The typeface represents the 13C-CO2: soil δ13C-CO2 value; 13C-SOC represents the pure CO2 value released by oxidative decomposition, plant root respiration, and microbial respiration in the absence of atmospheric mixing (generally taken as −23.3‰); 13Cair represents the δ13C value of modern atmospheric CO2 (generally taken as −8‰); a represents the proportion of soil respiratory CO2 to total soil CO2; b represents the proportion from atmospheric CO2; and f is the specific gravity of the soil CO2 from the atmosphere and 1 − f is from soil respiration.

2.5. Statistical Analysis

Utilizing Excel 2019 for data organization and computation, SPSS 27 was utilized for one-way ANOVA and multiple comparisons (LSD, α = 0.05), comparing SOC, SIC, δ13C-SOC, and δ13C-SIC across the various contiguous land-use categories. The CANOCO 5 program was used to examine how the soil’s various carbon concentrations related to other physicochemical elements. Software called Origin 2018 was used to create graphs [25].

3. Results

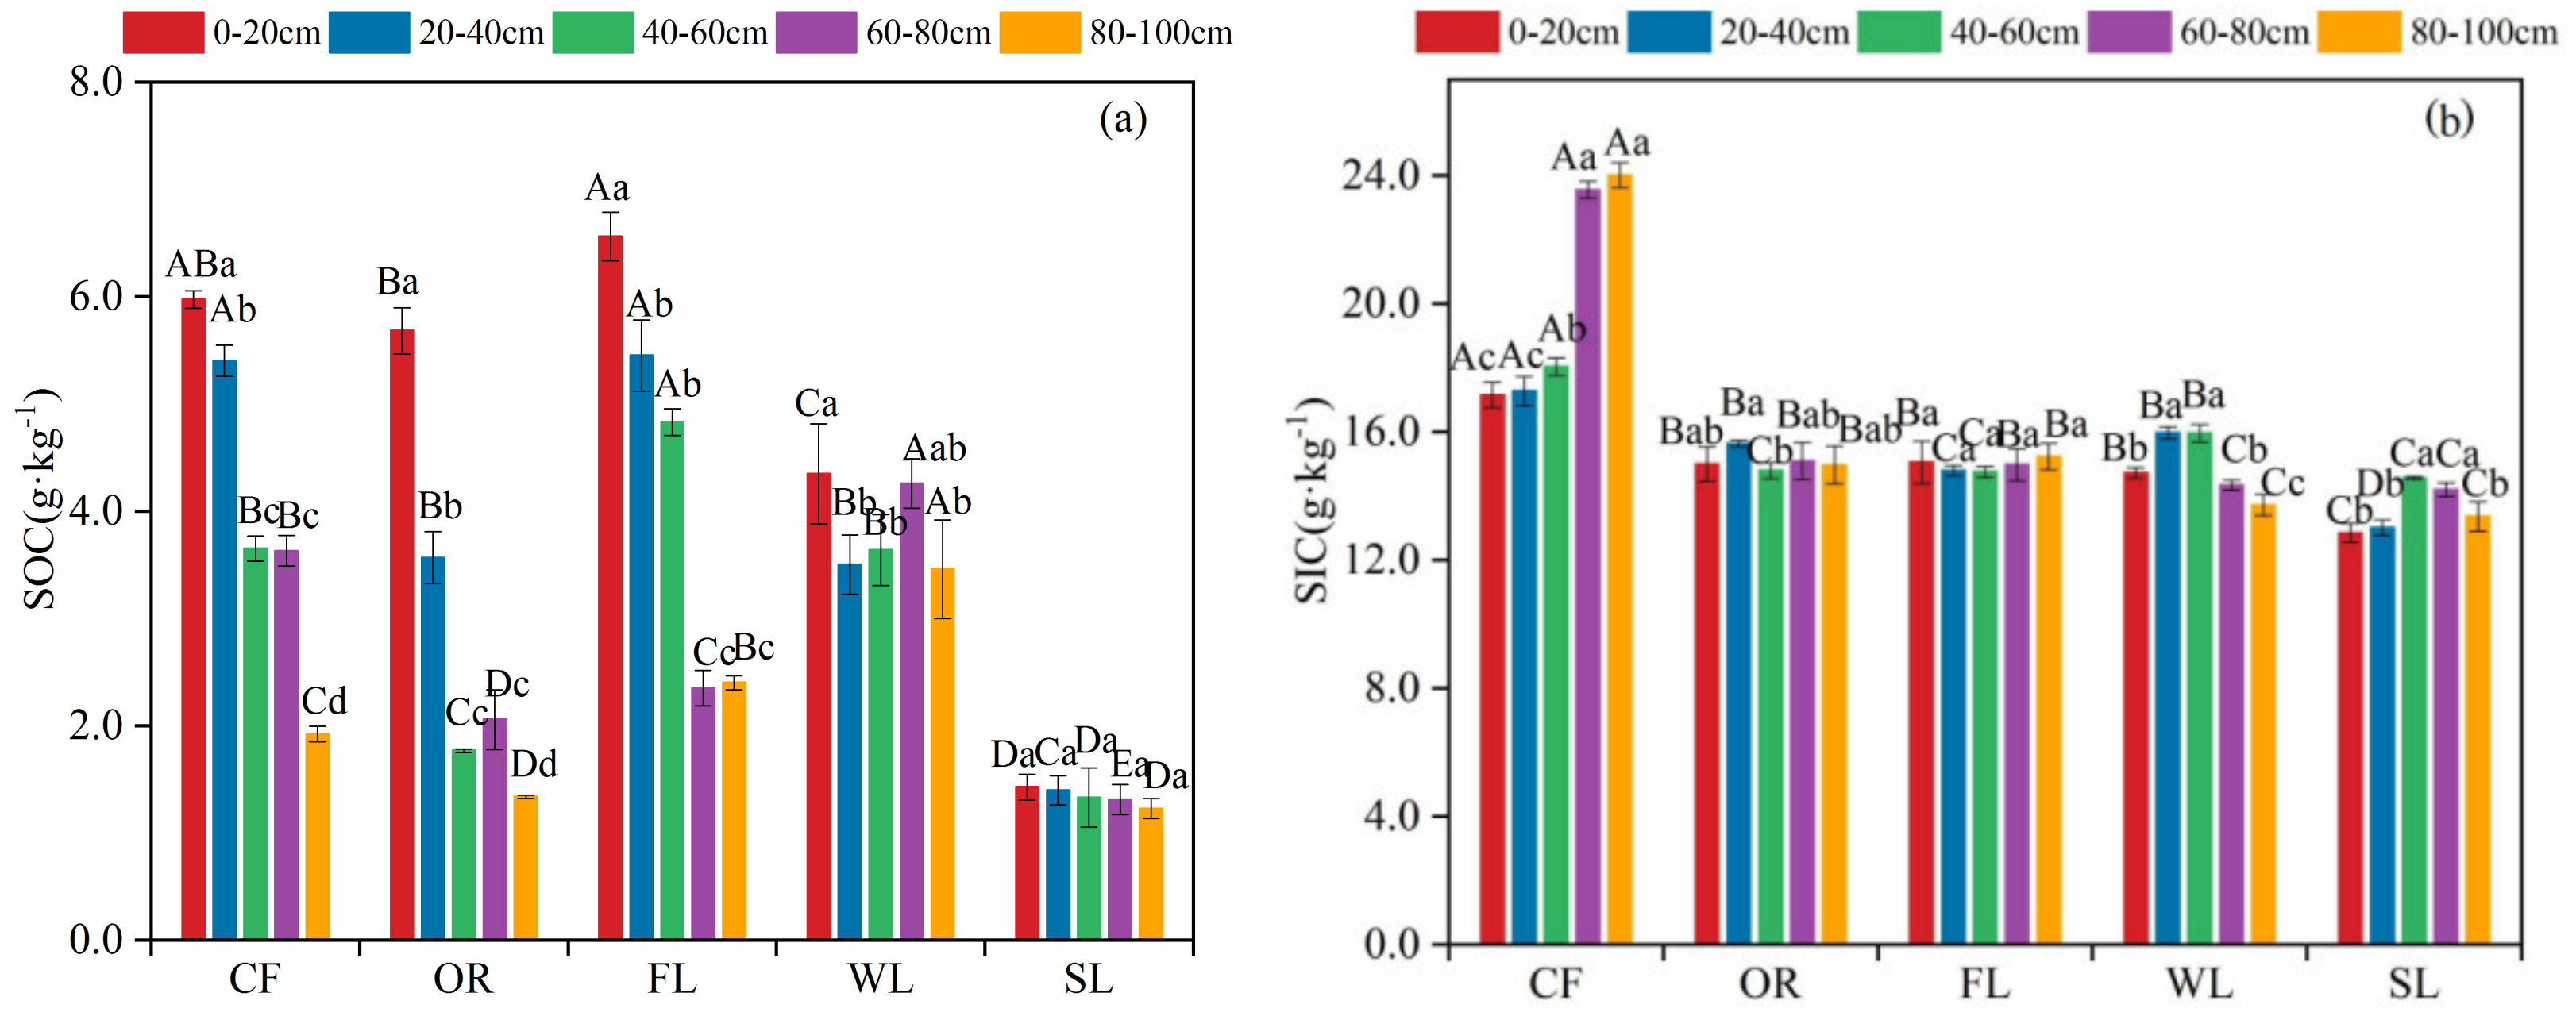
3.1. Vertical Distribution Features of SOC and SIC Content in Different Land-Use Types

The SOC of the five land-use types decreased with the increase in soil depth. Apart from the sandy land, the SOC of the other land-use types reached the maximum value in 0–20 cm soil depth, which was greatly different from the other layers of soil (p < 0.05) (Figure 2a). The SOC of the soil in the five land-use types from high to low was as follows: forest land (4.32 ± 1.37 g kg−1) > cotton field (4.11 ± 1.30 g kg−1) > waste land (3.84 ± 0.32 g kg−1) > orchard (2.88 ± 0.34 g kg−1). The SOC of the forest land was the highest in 0–20 and 40–60 cm soil layers, while that of the waste land was the highest in 60–80 and 80–100 cm soil layers, which was greatly higher than that of the other land-use types (p < 0.05).
The order of the overall SIC in the soil of the five land-use types was as follows: sandy land (4.32 ± 1.37 g kg−1) > waste land (4.11 ± 1.30 g kg−1) > cotton field (3.84 ± 0.32 g kg−1) > orchard (2.88 ± 0.34 g kg−1) > forest land (1.41 ± 0.34 g kg−1) (Figure 2b). The SIC of each layer of soil was the highest in the cotton field, which was greatly higher than that of the other land-use types (p < 0.05). The SIC in the cotton field was greatly higher than that found in the other layers of soil in the range of 60–100 cm (p < 0.05), and the SIC in the orchard, forest land, waste land, and sandy land changed little among the different soil layers.

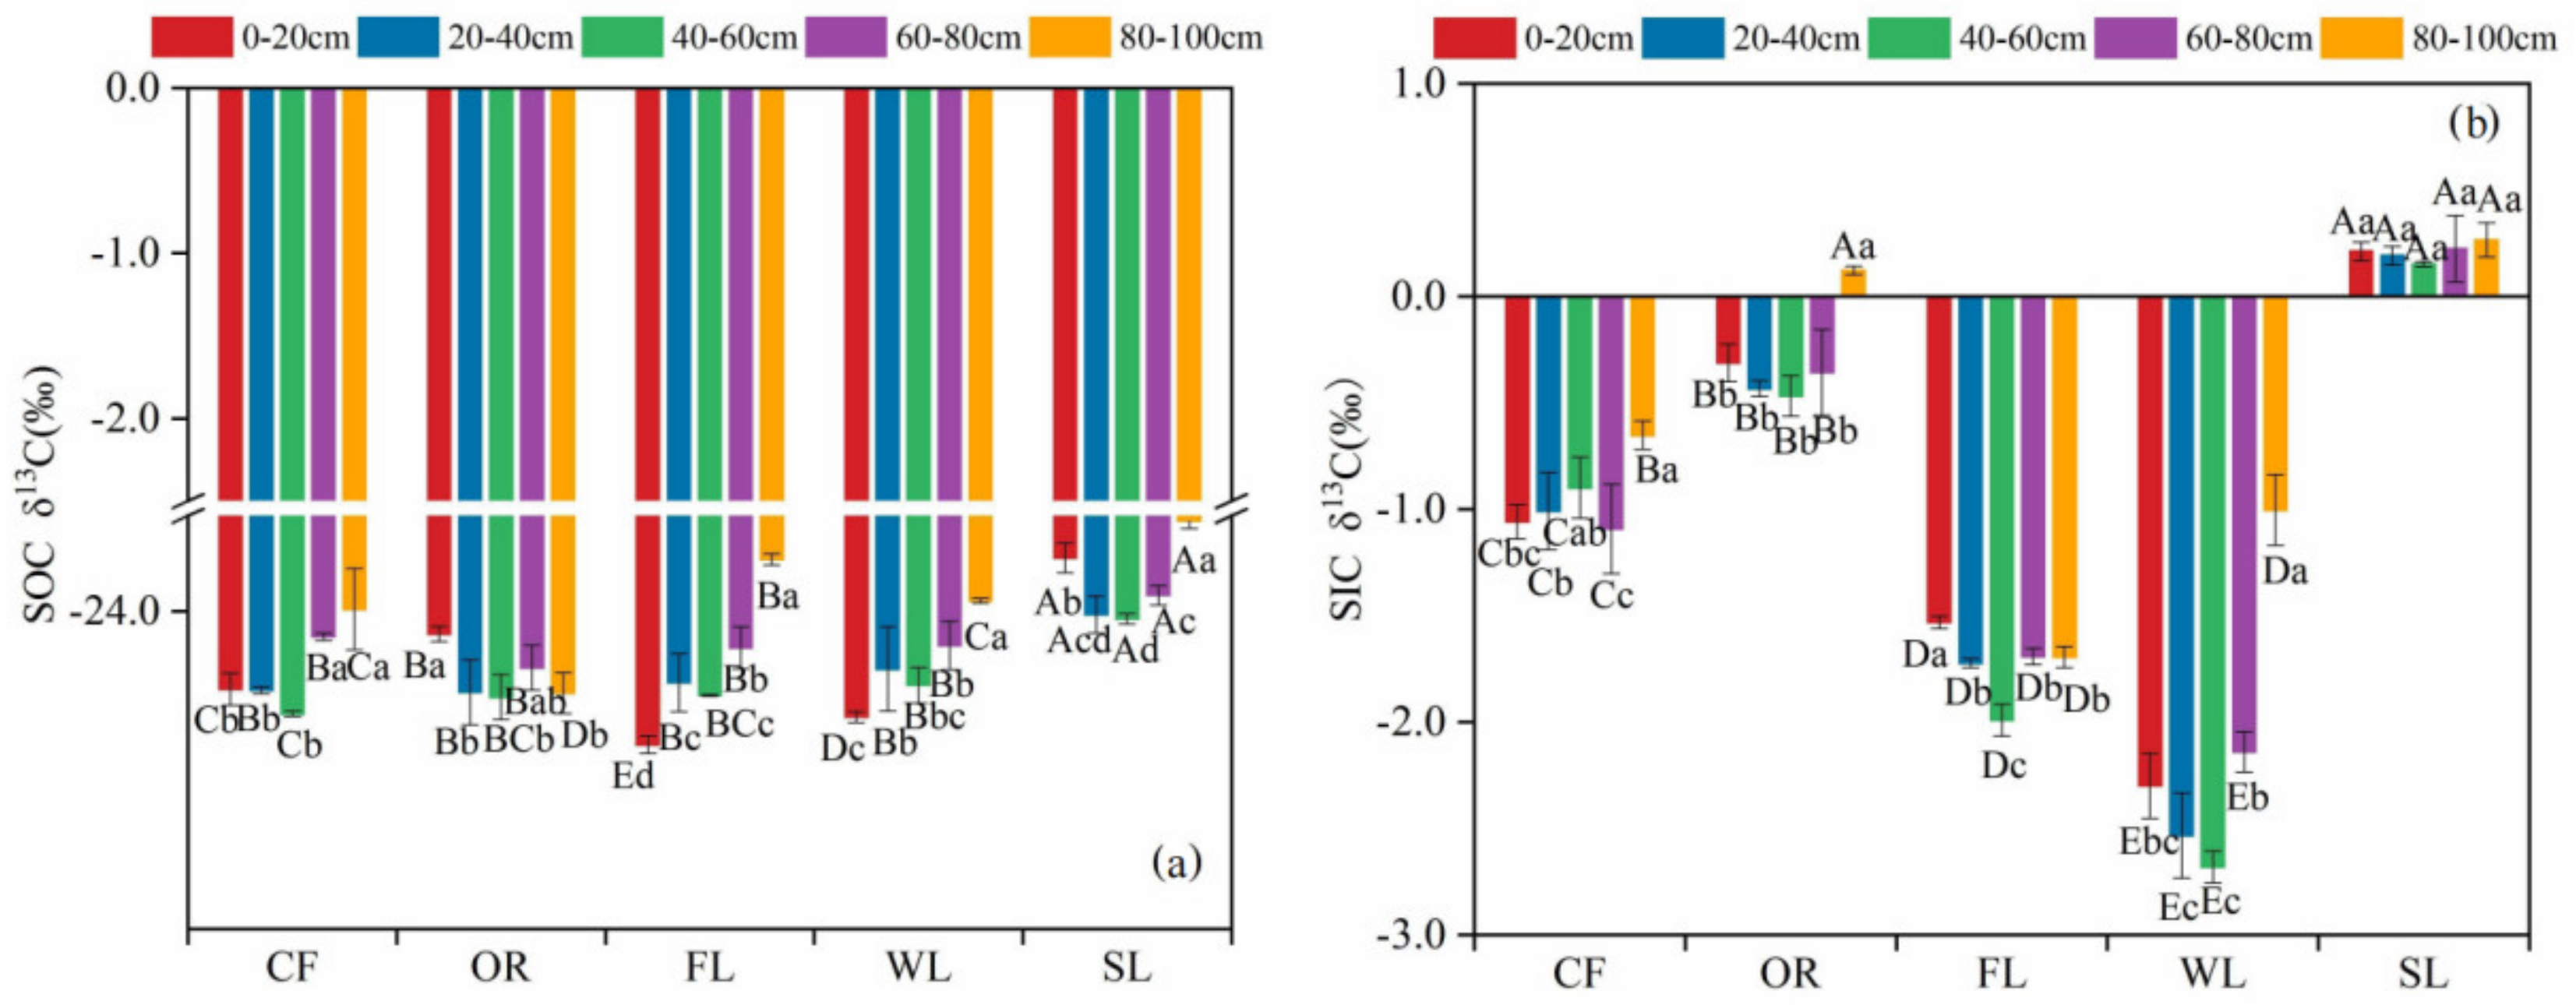
3.2. Vertical Distribution Characteristics of Stable Carbon Isotopes in Different Land-Use Types

The SOC-δ13C values of the five land-use types show certain differences along the soil profile (Figure 3a). From negative to positive, it was as follows: orchard < cotton field < forest land < waste land < sandy land, and the average SOC-δ13C was −24.89, −25.03, −24.82, −24.86, and −23.53‰, respectively (p < 0.05). The value of SIC-δ13C in the cotton fields and orchards generally decreased at first and then increased, with the minimum value at 40–60 cm. The waste land and forest land were the smallest in the 0–20 cm soil layer. The SOC-δ13C value of the sandy land was larger than that of the other land-use types.
The values of SIC-δ13C in the soil profiles of the five land-use types were significantly different (Figure 3b) (p < 0.05). From negative to positive, it was as follows: waste land (−2.13‰) < forest land (−1.73‰) < cotton field (−0.94‰) < orchard (−0.29‰) < sandy land (0.20‰), and the values of each soil layer in the sandy land were positive. The values of SIC-δ13C in the forest land and waste land first decreased and then increased with the deepening of the soil layers. The value of SIC-δ13C in the orchard soil first decreased and then increased, reaching a positive value at 80–100 cm. As the soil depth increased, the value of SIC-δ13C in the cotton field first decreased and the load increased, but it was the minimum at 60–80 cm.

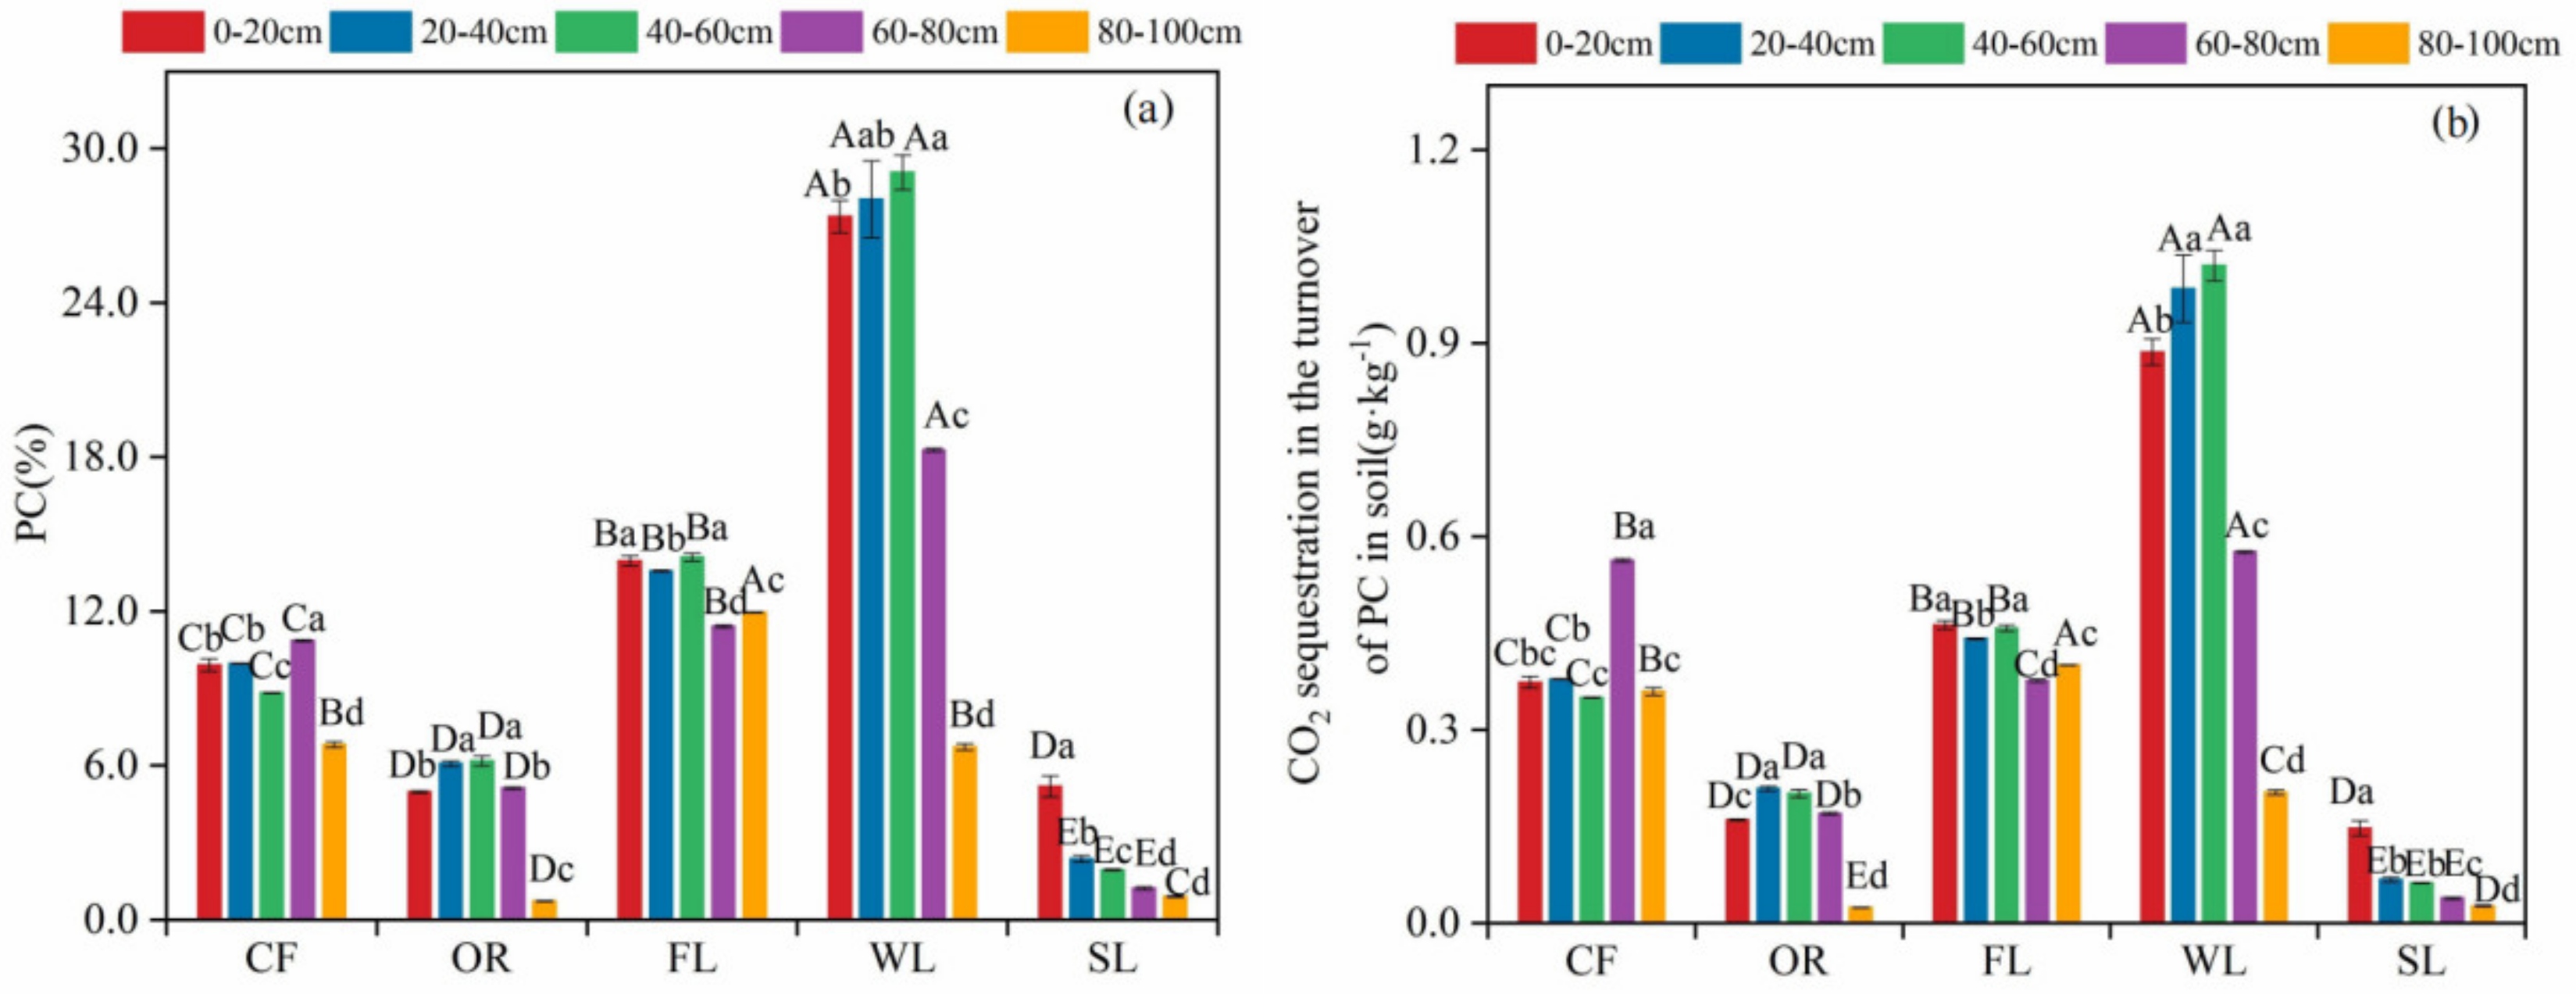
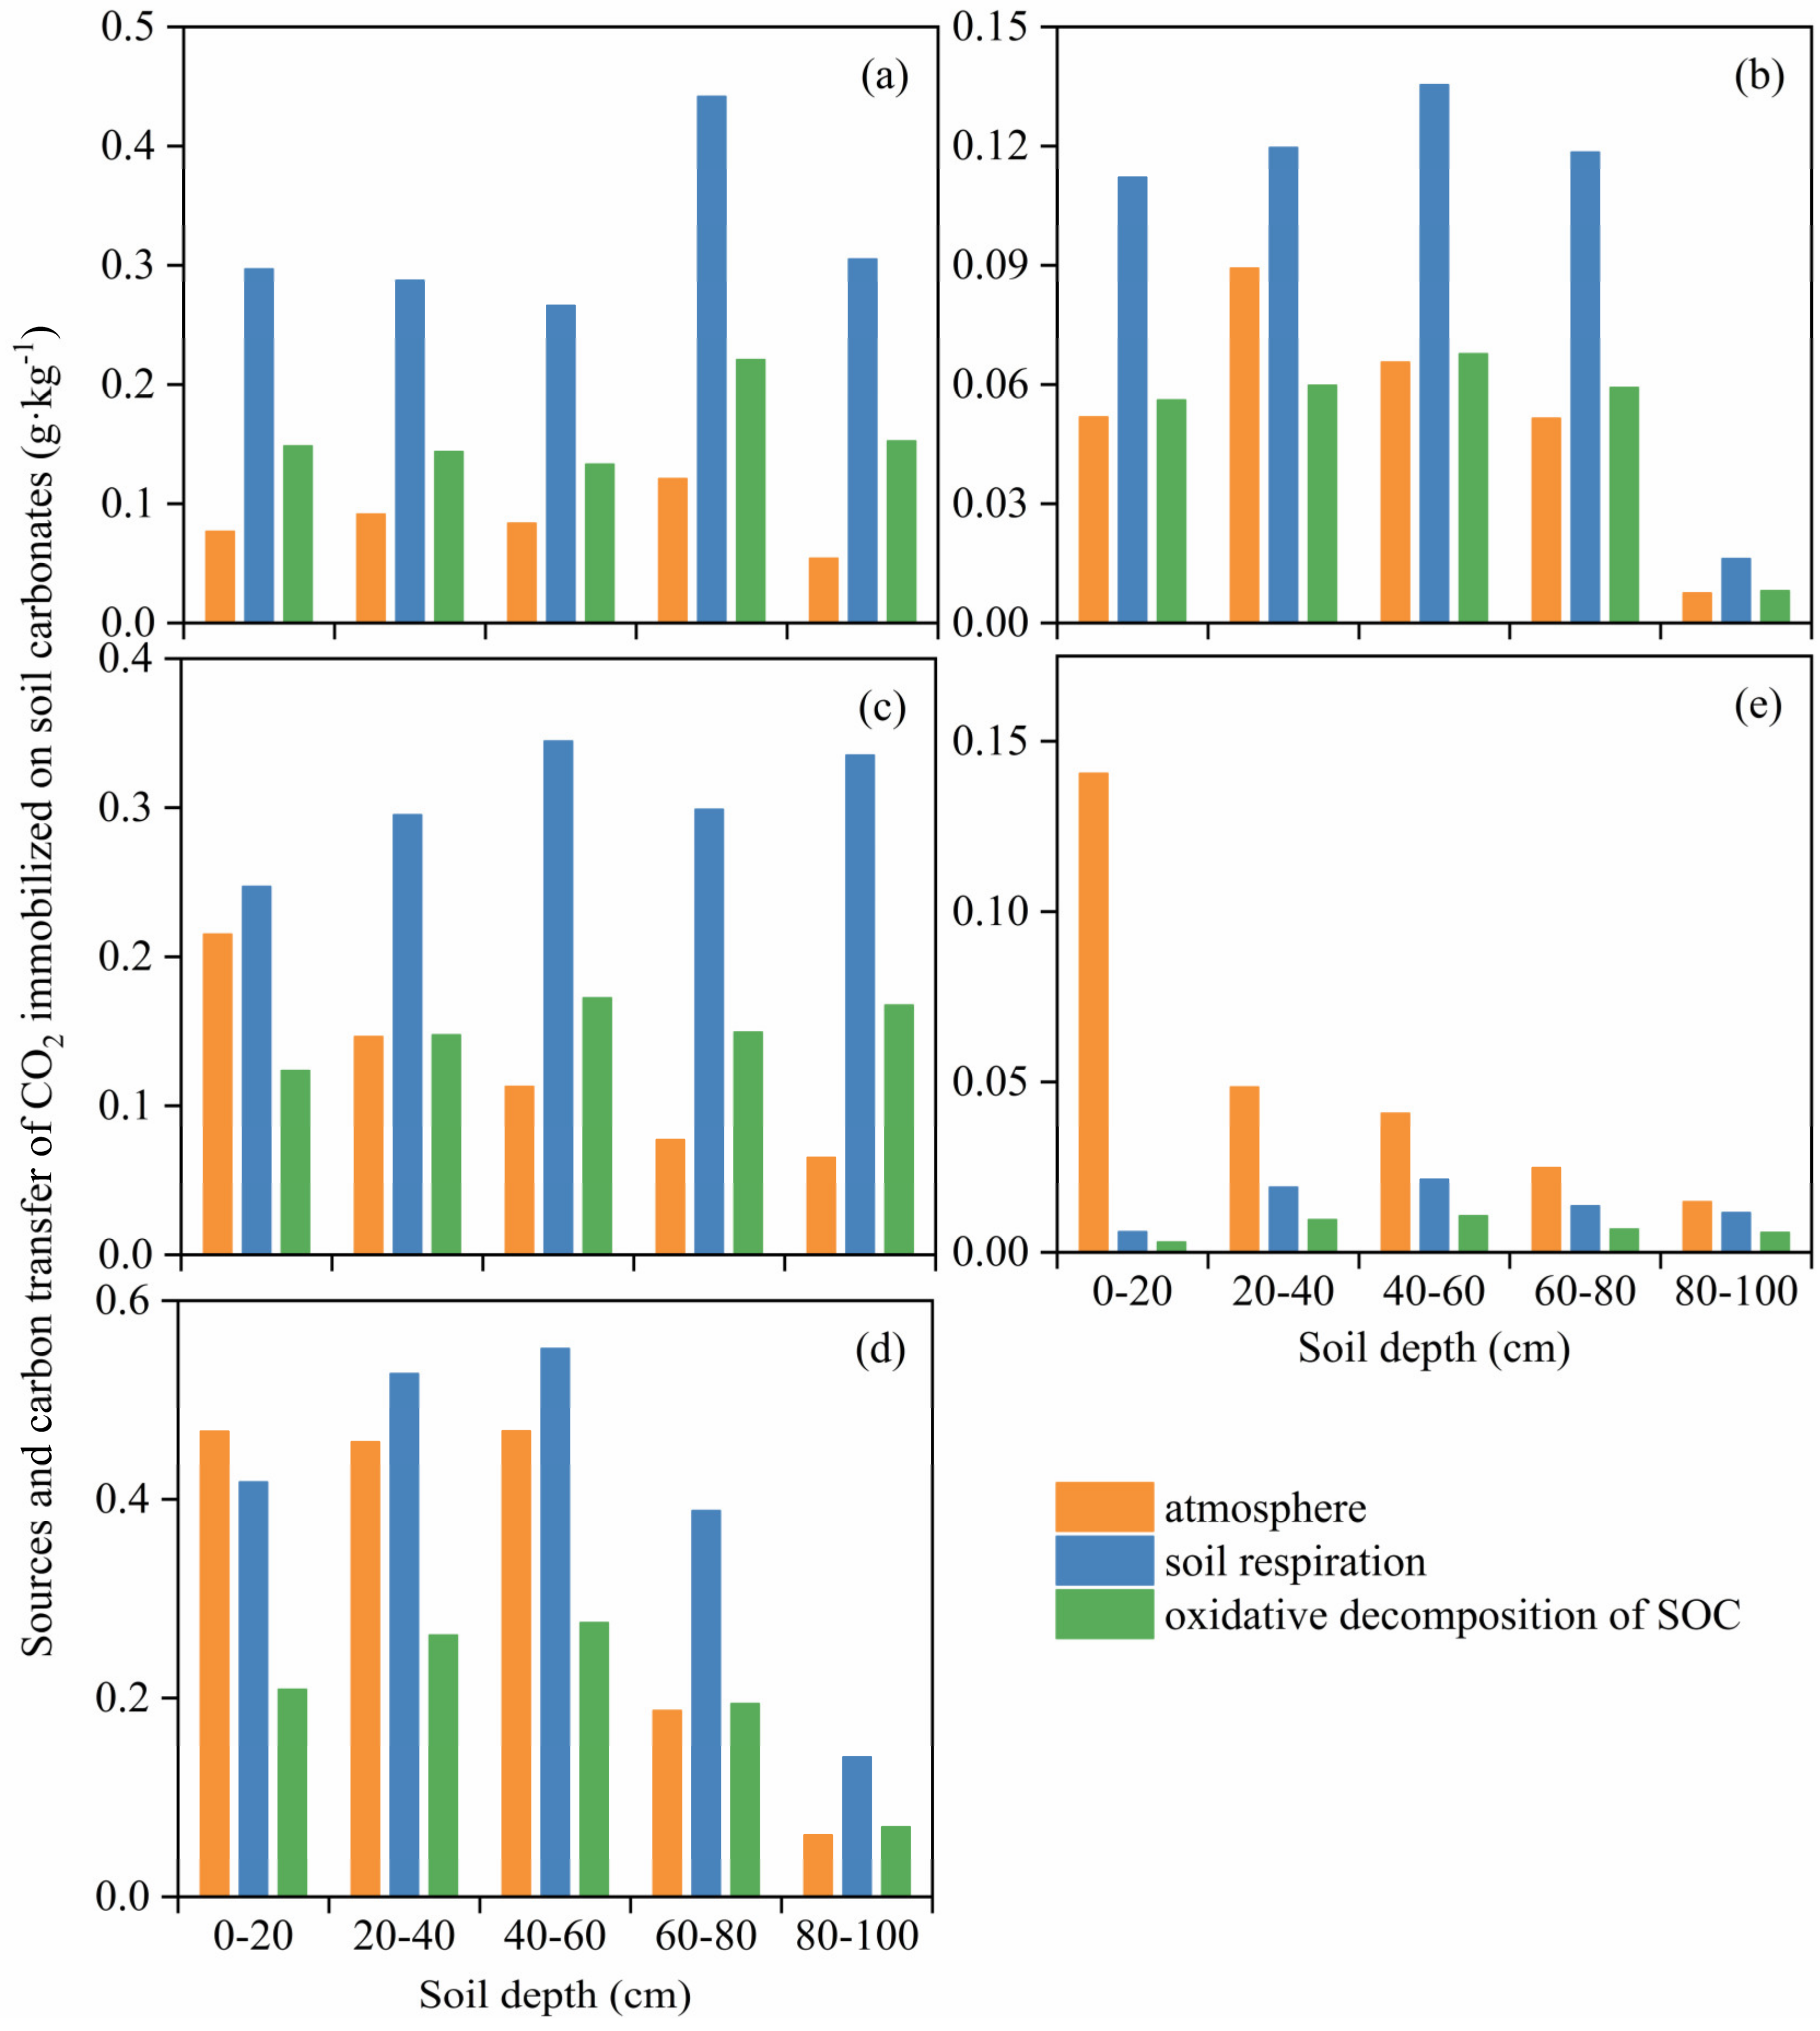
3.3. Proportion of PC to SIC in Soils of Different Land-Use Types and the Amount of CO2 Sequestered during Its Formation

According to Formulas (2)–(5), the proportion of soil PC to SIC in the process of carbon stock transformation of different land-use types was calculated. As shown in Figure 4a, the proportion of PC to SIC in the different land-use types was greatly different. Inside of the oasis, the PC% of the cotton field soil changed little in the 0–80 cm layer of soil and decreased obviously in the 80–100 cm soil layer, while the PC% of the orchard showed an increase followed by a decrease, and then decreased greatly in the 80–100 cm soil layer. The PC% of the two land-use types in the desert transitional zone was greatly higher than that of the other land-use types (p < 0.05). The PC% of the forest land showed little change, while the PC% of the 0–60 cm soil layer of the waste land was the highest, reaching 29.07%, which dropped sharply in the 60–100 cm layer of soil. The PC% of the sandy land was generally low, and it gradually decreased with soil depth.
According to Formula (6), the mass of CO2 sequestered by PC in the soils of various land-use types during its formation and recrystallization can be obtained (Figure 4b). The total amount of CO2 in the fixed soil of five land-use types was as follows: waste land > forest land > cotton field > orchard > sandy land, with average values of 0.73, 0.43, 0.40, 0.15, and 0.07 g kg−1, respectively, and the overall trend is similar to the proportion of PC in SIC.

3.4. Transfer Amount of SOC to SIC in Different Land-Use Types

We calculated the percentages of CO2 from soil respiration and atmospheric CO2 in the soil CO2 gas using Formula (7), and then determined the amounts from atmospheric and soil respiration in the fixed soil CO2 content using Formula (8). The transfer SOC to SIC ratio was 50% of soil respiration, and the sources of fixed CO2 in various land-use types are shown in Figure 5. Soil respiration was the main source of CO2 fixation in the cotton field, orchard, forest land, and waste land, accounting for 78.86%, 65.63%, 76.33%, and 61.10%, respectively, and the transfer SOC to SIC ratio was 0.16, 0.05, 0.15, and 0.21 g kg−1, respectively. Contrary to the other land-use types, the CO2 fixed in the sandy land mainly comes from the atmosphere, accounting for 64.51%, and the transfer of soil SOC to SIC was only 0.01 g kg−1.

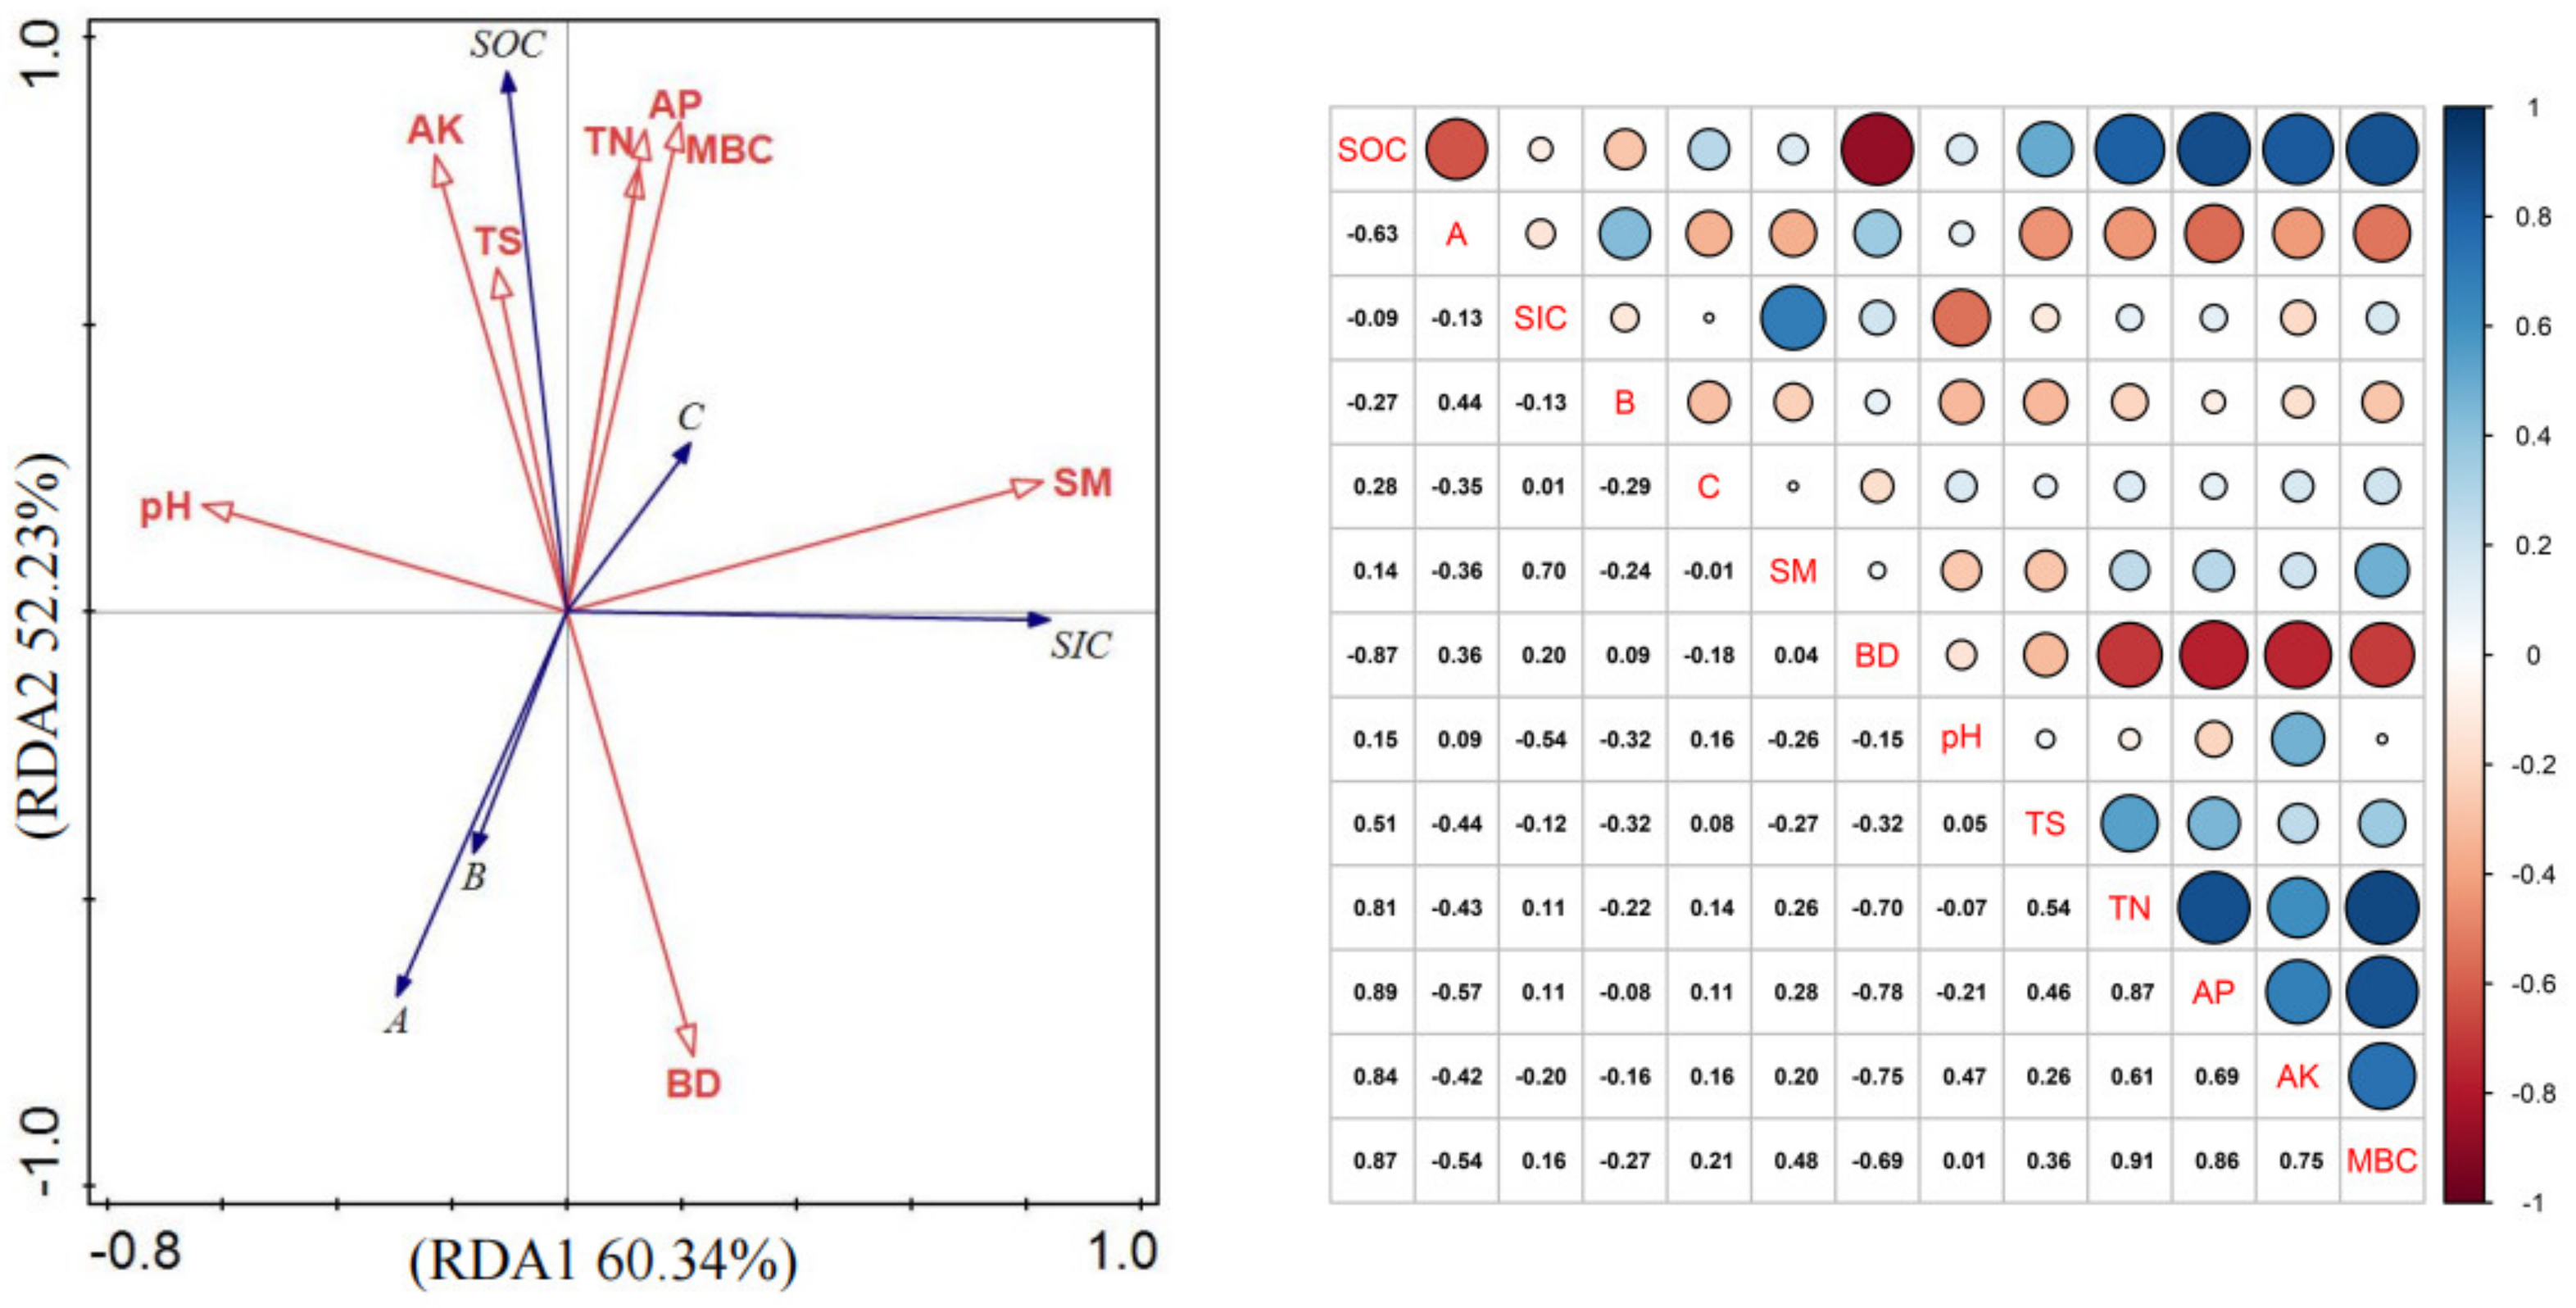
3.5. Driving Factors of Organic Carbon Transformation in the Oasis Creation Process

RDA was used to analyze the correlation between the transfer of SOC to SIC and the soil physical and chemical factors in the different land-use types, and a two-dimensional ranking chart was obtained (Figure 6). It shows that it has a significant impact on the transfer of SOC to SIC in different land-use types (Table 1). The primary physical and chemical elements influencing the conversion of SOC to SIC are the soil water content, pH, and microbial biomass carbon. The transfer amount was positively related to the pH and microbial biomass carbon and negatively related to the soil water content. Soil δ13C-SOC and δ13C-SIC are positively related to pH, but negatively related to soil water content and microbial biomass carbon.

4. Discussion

4.1. Variations of Soil Carbon Stock in the Process of Oasis Creation

The degree of disturbance of the soil and surface vegetation varies under different land use patterns, leading to notable variations in the content of inorganic and organic carbon. The SOC depends on the decomposition of the soil itself and the input of exogenous carbon, and the difference in the content of SOC between different land-use types is mainly influenced by the input of soil-forming parent materials, organic materials, agricultural management [26]. On the periphery of an oasis, the organic carbon content in sandy land is the lowest. On the one hand, due to having less litter on the surface, a loose soil structure, and an inability to retain organic matter, the input of organic carbon sharply declines. On the other hand, sandy soil hinders soil microbial development and reproduction and reduces organic carbon’s ability to accumulate, therefore, the organic carbon content of sandy land is obviously lower than that of other land-use types [27,28]. In the oasis transitional zone, the surface plant residues of forest land accumulate a lot, with obvious humification, and the rich litter and root exudates in the soil make its organic carbon content higher than that of other land-use types, which is consistent with the results found by Arid Rajasthan of India, in that the organic carbon in the surface soil is high [29]. In the oasis, the SOC in the cotton fields and orchards decreased with the increase in soil depth, and Esphorn and others also showed similar conclusions about the changes in organic carbon in different land-use types [30]. At 40~100 cm, compared with the forest land and waste land, the content of SOC in the cotton field obviously reduced, which is due to the frequent change in soil structure by tillage measures taken to plant crops regularly.
In the study of inorganic carbon, it mainly focuses on the dynamic change in generative carbonate, and the change in oasis land use mode directly affects the leaching and deposition process of soil inorganic carbon [31]. This study found that the content of inorganic carbon in sandy land is the highest, which is consistent with Wang et al.’s research results on soil carbon stock in an arid oasis [32]. Sandy land is mainly developed from aeolian sandy parent soil, which has an obvious carbonate accumulation in the process of soil formation. The soil is rich in Ca2+ and Mg2+, which helps it to form carbonate, therefore, the inorganic carbon content in sandy land is obviously higher than that of other land-use types [33]. It has been found that the content of inorganic carbon in forest land is the lowest, which is due to the fact that there are more soil surface coverings, weak soil erosion, and less leaching in forest land. This condition is not conducive to the formation of carbonate, but will promote its transformation, which is consistent with Somenahally’s research on the organic soil carbon stock of land use in arid areas [34]. Inside of the oasis, the content of inorganic carbon in the cotton field increases with the deepening of the soil layers, which is due to the rapid input and decomposition of organic carbon in the cotton field soil, and soluble carbonate (HCO3 or CO32−) is formed through chemical weathering, which is combined with soluble carbonate and transported to the deep soil profile [35]. In addition, the application of nitrogen fertilizer reduces the local soil pH, and the formed soluble carbonate will also move down to the deep soil with irrigation and be deposited [36].

4.2. Carbon Sequestration Potential of Soils with Different Land-Use Types

Under the background of global warming, the key to improving the carbon fixation capacity and potential of soil lies in promoting photosynthesis, reducing respiration, and prolonging the retention time of organic carbon in soil [37]. The accumulation process of carbonate carbon in arid soil is the main form of its participation in the soil carbon cycle, and the key to determining the leaching and deposition process of carbonate in soil is the balance of the CO2–H2O system [38]. This study found that CO2 fixed in sandy land mainly comes from the atmosphere. One of the reasons for this is that the soil gap is large, and the CO2 in the atmosphere enters the soil more easily. Second, the vegetation coverage on the surface is extremely low, and the loose soil structure leads to low soil organic carbon content and weak soil respiration [39]. In addition, the content of water and HCO3 in sandy soil is low, which makes it difficult to form carbonate, so the capacity for CO2 fixation in sandy land is low, and unstable Ca(HCO3)2 forms easily, therefore, the carbon fixation potential is not great.
In the transitional zone, the amount of CO2 fixed in the natural forest land and grassland is relatively large, especially in the forest land. As the soil deepens, the proportion of CO2 from the atmosphere widely decreases, while the amount from soil respiration gradually increases, which is closely related to the soil structure [40]. The “fat island effect” of natural forest land and grassland enriches the water and nutrients under the soil, and the intensity of this is closely related to the vegetation growth [41]. With the enhancement of soil moisture, the content of HCO3 in the soil in the transitional zone is higher. With the enhancement of leaching, Ca(HCO3)2 enters the lower soil layer, and the CO2 from the atmosphere in the lower soil layer decreases and the transpiration of plants increases. Due to the gradual enhancement of soil respiration in the transitional zone, Ca(HCO3)2 releases CO2 and transforms it into CaCO3 deposition, thus playing a role in carbon fixation.
In the oasis, the CO2 fixed in the cotton fields and orchards mainly comes from soil respiration, especially in the cotton fields. Human farming has reduced the input of soil organic matter, destroyed the physical protection of soil organic matter, and gradually enhanced soil respiration. Numerous studies have shown that, after the transitional zone is reclaimed as farmland, the SOC is greatly lost with the extension of farming years, the soil carbon balance is destroyed, and the amount of CO2 discharged into the atmosphere also sharply increases, resulting in the reduction in soil carbon sequestration [42,43].

4.3. Influence of Environmental Factors on the Transformation of Soil Organic Carbon Stock in an Oasis

Through their effects on the plant and soil structure, physical and chemical factors indirectly influence the properties of the soil carbon stock, which in turn influences the amount of SOC converted to SIC [44]. The main physical and chemical factors impacting the transformation of SOC into SIC, according to this study, are the soil water content, pH, and microbial biomass carbon. The soil water content plays a great role in controlling microbial activity and the breakdown of organic materials. Water affects the microbial activity by changing the soil oxygen conditions, and finally affects the mineralization of SOC [45]. The increase in water content is beneficial to litter decomposition, SOC mineralization, and microbial activity, and it can affect microbial activity by improving the oxygen conditions in the soil environment and promoting soil organic carbon accumulation [46]. The oasis on the northern border of the Tarim River receives comparatively little precipitation overall, and it varies from year to year. Farmland ploughed soil allows precipitation to easily seep into the deep soil, which leads to the reduction in CO2 incorporation into soil moisture, thus reducing the formation of soil inorganic carbon and further affecting the transfer of SOC to SIC. Chu et al. [47] also discovered a tight relevance between the amount of water in the soil and the change in SOC in the grasslands of Inner Mongolia. The soil pH indirectly affects the accumulation and decomposition of SOC by affecting the microbial activity and community structure [48]. Elevated pH levels and increased Ca2+ and Mg2+ concentrations in soil promote carbonate deposition, whereas the converse is true for carbonate dissolution [49]. In this study, pH is positively related to the transfer amount of SOC to SIC, that is, with the increase in soil pH, the transfer amount increases, which is different from the related research results of a natural grassland in Ningxia [50]. It may be that a certain degree of alkaline soil environment will inhibit microbial activity, which will reduce the rate of decomposition of organic matter; however, this will be beneficial to the accumulation of inorganic carbon. Microbial biomass carbon is the reservoir of plant-available nutrients in soil that enhances soil nutrient availability. It also plays a direct role in the biochemical transformation of soil. Because there are more microorganisms on surface soil than in deep soil, the distribution of microbial biomass carbon in the layer of soil varies depending on the kind of soil aggregate [51,52].

5. Conclusions

In this study, we found that the transformation of land use in arid and semi-arid oases significantly impacts the conversion from SOC to SIC. Utilizing stable carbon isotope techniques, we explored the distribution of SIC δ13C across soil depths and quantified soil CO2 fixation during pedogenic carbonate (PC) formation. This study has revealed a pronounced increase in SOC at specific soil layers in waste land, contrasting with other land types. Variations in SIC-δ13C values were notable across different land uses, with soil respiration being a primary CO2 source in most land types, except for sandy land. Additionally, the soil water content, pH, and microbial biomass carbon were identified as key factors driving the SOC to SIC transformation. This research underscores the complex interplay between land use, soil properties, and carbon dynamics in arid ecosystems.

Author Contributions

Conceptualization, J.T. and L.G.; methodology, J.T. and L.G.; software, J.T.; validation, J.T. and L.G.; formal analysis, J.T.; investigation, J.T.; resources, L.G. and J.T.; data curation, J.T.; writing—draft preparation and review, J.T., L.G. and X.M.; writing contributions, L.G., H.Z. (Haiqiang Zhu), Z.D., Y.L., H.Z. (Han Zhang) J.T. and X.M.; visualization, J.T.; supervision, L.G.; project administration, L.G.; funding acquisition, L.G. All authors have read and agreed to the published version of the manuscript.

Funding

The funding for this research was provided by the Natural Science Foundation of Xinjiang Uygur Autonomous Region of China (2020D01C035).

Data Availability Statement

The original contributions presented in this study are included in the article. Further inquiries can be directed to the corresponding author.

Conflicts of Interest

The authors declare no conflicts of interest.

References

  1. Liao, Y.; Wu, W.L.; Meng, F.Q.; Smith, P.; Lal, R. Increase in soil organic carbon by agricultural intensification in northern China. Biogeosciences 2015, 12, 1403–1413. [Google Scholar] [CrossRef]
  2. Wang, Y.L.; Zhao, C.Y.; Ma, Q.L.; Li, Y.K.; Jing, H.J.; Sun, T.; Milned, E.; Easterd, M.; Paustiand, K.; Wen, A.Y.H.; et al. Carbon benefit sof wolf berry plantation on secondary saline land in Jingtai oasis, Gansu-a case study on application of the CBP model. J. Environ. Manag. 2015, 157, 303–310. [Google Scholar] [CrossRef] [PubMed]
  3. Tong, J.; Hu, J.; Lu, Z.; Sun, H.; Yang, X. The impact of land use and cover change on soil organic carbon and total nitrogen storage in the Heihe River Basin: A meta-analysis. J. Geogr. Sci. 2019, 29, 1578–1594. [Google Scholar] [CrossRef]
  4. Cotrufo, F.; Lavallee, J.M.; Zhang, Y.; Hansen, P.M.; Paustian, K.H.; Schipanski, M.; Wallenstein, M.D. In-N-Out: A hierarchical framework to understand and predict soil carbon storage and nitrogen recycling. Glob. Chang. Biol. 2021, 27, 4465–4468. [Google Scholar] [CrossRef] [PubMed]
  5. Zhu, C.; Ding, J.L.; Zhang, Z.P.; Wang, J.J.; Chen, X.Y.; Han, L.J.; Shi, H.B.; Wang, J.Z. Soil salinity dynamics in arid oases during irrigated and non-irrigated seasons. Land Degrad. Dev. 2023, 13, 3823–3835. [Google Scholar] [CrossRef]
  6. Nyachoti, S.; Jin, L.; Tweedie, C.E.; Ma, L. Insight into factors controlling formation rates of pedogenic carbonates: A combined geochemical and isotopic approach in dry land soils of the US Southwest. Chem. Geol. 2019, 527, 118503. [Google Scholar] [CrossRef]
  7. Blackburn, K.W.; Libohova, Z.; Adhikari, K.; Kome, C.; Maness, X.; Silman, M.R. Influence of Land Use and Topographic Factors on Soil Organic Carbon Stocks and Their Spatial and Vertical Distribution. Remote Sens. 2022, 14, 2846. [Google Scholar] [CrossRef]
  8. Wang, Y.Q.; Shao, M.A.; Zhang, C.C.; Liu, Z.P.; Zou, J.L.; Xiao, J.F. Soil organic carbon in deep profiles under Chinese continental monsoon climate and its relations with land uses. Ecol. Eng. 2015, 82, 361–367. [Google Scholar] [CrossRef]
  9. Srivastava, R.; Mohapatra, M.; Latare, A. Impact of land use changes on soil quality and species diversity in the Vindhyan dry tropical region of India. J. Trop. Ecol. 2020, 36, 72–79. [Google Scholar] [CrossRef]
  10. Wang, J.P.; Wang, X.J.; Zhang, J.; Zhao, C.Y. Soil organic and inorganic carbon and stable carbon isotopes in the Yanqi Basin of northwestern China. Eur. J. Soil Sci. 2015, 66, 95–103. [Google Scholar] [CrossRef]
  11. Liu, M.; Liu, M.; Li, P.; Yang, J.; Wang, J.; Chang, Q. Variations in soil organic carbon decompositions of different land use patterns on the tableland of Loess Plateau. Environ. Sci. Pollut. Res. 2020, 27, 4337–4352. [Google Scholar] [CrossRef] [PubMed]
  12. Liu, S.Q.; Zhuang, Q.L. Leaf 13C data constrain the uncertainty of the carbon dynamics of temperate forest ecosystems. Ecosphere 2021, 12, e03741. [Google Scholar] [CrossRef]
  13. Bai, S.G.; Jiao, Y.; Yang, W.Z.; Gu, P.; Yang, J.; Liu, L.J. Review of progress in soil inorganic carbon research. IOP Conf. Ser. Earth Environ. Sci. 2017, 100, 012129. [Google Scholar] [CrossRef]
  14. Man, L.; Guilin, H. Stable nitrogen and carbon isotope compositions in plant-soil systems under different land-use types in a red soil region, Southeast China. PeerJ 2022, 10, e13558. [Google Scholar] [CrossRef]
  15. Xiao, W.; Wei, Z.; Wen, X. Evapotranspiration partitioning at the ecosystem scale using the stable isotope method—A review. Agric. For. Meteorol. 2018, 263, 346–361. [Google Scholar] [CrossRef]
  16. Gao, H.; Lan, W.; Sun, H.; Hu, Z. Annual study of hydraulic characteristics in surface flow constructed wetlands using hydrogen and oxygen stable isotope technology. Environ. Sci. Pollut. Res. Int. 2020, 27, 29502–29511. [Google Scholar] [CrossRef]
  17. An, S.; Mentler, A.; Mayer, H.; Blum, W.E. Soil aggregation, aggregate stability, organic carbon and nitrogen in different soil aggregate fractions under forest and shrub vegetation on the Loess Plateau, China. Catena 2010, 81, 226–233. [Google Scholar] [CrossRef]
  18. Li, X.; Shi, Z.; Yu, J.; Liang, J. Study on the Change in Vegetation Coverage in Desert Oasis and Its Driving Factors from 1990 to 2020 Based on Google Earth Engine. Appl. Sci. 2023, 13, 5394. [Google Scholar] [CrossRef]
  19. Chen, P.; Yuan, X.L.; Li, L.Y.; Li, J.Y.; Zhang, R.Q.; Li, Z.G.; Liu, Y. Aggregational differentiation of soil-respired CO2 and its δ13C variation across land-use types. Geoderma 2023, 432, 116384. [Google Scholar] [CrossRef]
  20. Guo, M.X. Soil Sampling and Methods of Analysis; CRC Press: Boca Raton, FL, USA, 2007. [Google Scholar] [CrossRef]
  21. Lv, Y.Z.; Li, B.G. Soil Science Experiment; China Agricultural Press: Beijing, China, 2010. [Google Scholar]
  22. Breecker, D.O.; Bergel, S.; Nadel, M.; Tremblay, M.M.; Osuna-Orozco, R.; Larson, T.E.; Sharp, Z.D. Minor stablecarbon isotope fractionation between respired carbondioxide and bulk soil organic matter during laboratoryincubation of topsoil. Biogeochemistry 2015, 123, 83–98. [Google Scholar] [CrossRef]
  23. Bughio, M.A.; Wang, P.; Meng, F.; Qing, C.; Kuzyakov, Y.; Wang, X.; Junejo, S.A. Neoformation of pedogenic carbonates by irrigation and fertilizationand their contribution to carbon sequestration in soil. Geoderma 2016, 262, 12–19. [Google Scholar] [CrossRef]
  24. Mehra, P.; Sarkar, B.; Bolan, N.; Chowdhury, S.; Desbiolles, J. Impact of carbonates on the mineralisation of surface soil organic carbon in response to shift in tillage practice. Geoderma 2019, 339, 94–105. Available online: http://eprints.whiterose.ac.uk/142195/ (accessed on 18 May 2023). [CrossRef]
  25. Ma, X.Y.; Gong, L.; Yang, Y.X.; Ding, Z.L.; Li, X.Z. Mineralization and Fixed Stable Carbon Isotopic Characteristics of Organic Carbon in Cotton Fields with Different Continuous Cropping Years. Agronomy 2023, 13, 804. [Google Scholar] [CrossRef]
  26. Zha, J.; Zhuang, Q. Microbial dormancy and its impacts on northern temperate and boreal terrestrial ecosystem carbon budget. Biogeosciences 2020, 17, 4591–4610. [Google Scholar] [CrossRef]
  27. Peng, X.; Huang, Y.; Duan, X.; Yang, H.; Liu, J. Particulate and mineral-associated organic carbon fractions reveal the roles of soil aggregates under different land-use types in a karst faulted basin of China. Catena 2023, 220, 106721. [Google Scholar] [CrossRef]
  28. Luo, X.H.; Wang, Z.F.; Lu, C.; Huang, R.; Wang, F.H.; Gao, M. Effects of Land Use Type on the Content and Stability of Organic Carbon in Soil Aggregates. Huan Jing Ke Xue 2019, 40, 3816–3824. [Google Scholar] [CrossRef] [PubMed]
  29. Moharana, P.C.; Meena, R.L.; Nogiya, M.; Jena, R.K.; Sharma, G.K.; Sahoo, S.; Jha, P.K.; Aditi, K.; Vara-Prasad, P.V. Impacts of Land Use on Pools and Indices of Soil Organic Carbon and Nitrogen in the Ghaggar Flood Plains of Arid India. Land 2022, 11, 1180. [Google Scholar] [CrossRef]
  30. Kibet, E.; Musafiri, C.M.; Kiboi, M.N.; Macharia, J.; Ng’etich, O.K.; Kosgei, D.K.; Mulianga, B.; Okoti, M.; Zeila, A.; Ngetich, F.K. Soil Organic Carbon Stocks under Different Land Utilization Types in Western Kenya. Sustainability 2022, 14, 8267. [Google Scholar] [CrossRef]
  31. Jannatul, F.; Varun, P. A review on the possible factors influencing soil inorganic carbon under elevated CO2. Catena 2021, 204, 105434. [Google Scholar] [CrossRef]
  32. Wang, Y.; Wang, S.; Zhao, Z.; Zhang, K.; Tian, C.; Mai, W. Progress of Euhalophyte Adaptation to Arid Areas to Remediate Salinized Soil. Agriculture 2023, 13, 704. [Google Scholar] [CrossRef]
  33. Zhang, Y.; Li, C.; Wang, M. Linkages of C: N: P stoichiometry between soil and leaf and their response to climatic factors along altitudinal gradients. J. Soils Sediments 2019, 19, 1820–1829. [Google Scholar] [CrossRef]
  34. Somenahally, A.C.; McLawrence, J.; Chaganti, V.N.; Ganjegunte, G.K.; Obayomi, O.; Brady, J.A. Response of soil microbial Communities, inorganic and organic soil carbon pools in arid saline soils to alternative land use practices. Ecol. Indic. 2023, 150, 110227. [Google Scholar] [CrossRef]
  35. Tan, W.F.; Zhang, R.; Cao, H.; Huang, C.Q.; Yang, Q.K.; Wang, M.K.; Koopal, L.K. Soil inorganic carbon stock under different soil types and land uses on the Loess Plateau region of China. Catena 2014, 121, 22–30. [Google Scholar] [CrossRef]
  36. Wang, C.; Li, W.; Yang, Z.; Chen, Y.; Shao, W.; Ji, J. An invisible soil acidification: Critical role of soil carbonate and its impact on heavy metal bioavailability. Sci. Rep. 2015, 5, 1273533. [Google Scholar] [CrossRef]
  37. Tong, X.; Xiao, J.; Liu, P.; Zhang, J.; Zhang, J.; Yu, P.; Meng, P.; Li, J. Carbon exchange of forest plantations: Global patterns and biophysical drivers. Agric. For. Meteorol. 2023, 336, 109379. [Google Scholar] [CrossRef]
  38. Zamanian, K.; Pustovoytov, K.; Kuzyakov, Y. Pedogenic carbonates:Forms and formation processes. Earth-Sci. Rev. 2016, 157, 1–17. [Google Scholar] [CrossRef]
  39. Mao, N.; Huang, L.; Shao, M. Vertical distribution of soil organic and inorganic carbon under different vegetation covers in two toposequences of the Liudaogou watershed on the Loess Plateau, China. J. Soil Water Conserv. 2018, 73, 479–491. [Google Scholar] [CrossRef]
  40. Zhou, X.B.; Tao, Y.; Wu, L.; Li, Y.G.; Zhang, Y.M. Soil stoichiometry in different land-use categories in desert-oasis ecotones of the southern Taklimakan Desert. Acta Ecol. Sin. 2019, 39, 969–980. [Google Scholar] [CrossRef]
  41. Tao, B.; Chen, Q.; Wang, J.; Zhang, B.; Yuan, H.; Chen, Y. “Fertile island” of Tamarix Chinensis accelerated the carbon decomposition in the coastal wetlands of the Yellow River Delta, China. Catena 2022, 211, 106034. [Google Scholar] [CrossRef]
  42. Xue, J.F.; Pu, C.; Liu, S.L.; Chen, Z.D.; Chen, F. Effects of tillage systems on soil organic carbon and total nitrogen in a double paddy cropping system in Southern China. Soil Tillage Res. 2015, 153, 161–168. [Google Scholar] [CrossRef]
  43. Virk, A.L.; Liu, W.S.; Niu, J.R.; Xu, C.T.; Liu, Q.Y.; Kan, Z.R.; Zhao, X.; Zhang, H.L. Effects of Diversified Cropping Sequences and Tillage Practices on Soil Organic Carbon, Nitrogen, and Associated Fractions in the North China Plain. J. Soil Sci. Plant Nutr. 2021, 21, 1201–1212. [Google Scholar] [CrossRef]
  44. Li, Z.; Liu, C.; Dong, Y.; Chang, X.; Nie, X.; Liu, L.; Xiao, H.B.; Lu, Y.M.; Zeng, G. Response of soil organic carbon and nitrogen stocks to soilerosion and land use types in the Loess hilly-gully region of China. Soil Tillage Res. 2017, 166, 1–9. [Google Scholar] [CrossRef]
  45. Li, J.; Liu, Y.; Hai, X.; Shangguan, Z.; Deng, L. Dynamics of soil microbial C:N:P stoichiometry and its driving mechanisms following natural vegetation restoration after farmland abandonment. Sci. Total Environ. 2019, 693, 133613. [Google Scholar] [CrossRef] [PubMed]
  46. Gritsch, C.; Egger, F.; Zehetner, F.; Zechmeister-Boltenstern, S. The effect of temperature and moisture on trace gas emissions from deciduous and coniferous leaf liter. J. Geophys. Res. Biogeosci. 2016, 121, 1339–1351. [Google Scholar] [CrossRef]
  47. Wang, C.; Li, L.; Yan, Y.; Cai, Y.; Xu, D.; Wang, X.; Chen, J.Q.; Xin, X.P. Effects of cultivation and agricultural abandonment on soil carbon, nitrogen and phosphorus in a meadow steppe in eastern Inner Mongolia. Agric. Ecosyst. Environ. 2021, 309, 107284. [Google Scholar] [CrossRef]
  48. Büchi, L.; Walder, F.; Banerjee, S.; Colombi, T.; van der Heijden, M.G.; Keller, T.; Charles, R.; Six, J. Pedoclimatic factors and management determine soil organic carbon and aggregation in farmer fields at a regional scale. Geoderma 2022, 409, 115632. [Google Scholar] [CrossRef]
  49. Liu, W.; Wei, J.; Cheng, J.; Li, W. Profile distribution of soil inorganic carbon along a chronosequence ofgrassland restoration on a 22-year scale in the Chinese Loess Plateau. Catena 2014, 121, 321–329. [Google Scholar] [CrossRef]
  50. An, H.; Li, Q.L.; Yan, X.; Wu, X.Z.; Liu, R.T.; Fang, Y. Desertification control on soil inorganic and organic carbon accumulation in the topsoil of desert grassland in Ningxia, northwest China. Ecol. Eng. 2019, 127, 348–355. [Google Scholar] [CrossRef]
  51. Basile, D.L.; Balesdent, J.; Pellerin, S. Reviews and syntheses:the mechanisms underlying carbon storage in soil. Biogeosciences 2020, 17, 5223–5242. [Google Scholar] [CrossRef]
  52. Jagadamma, S.; Mayes, M.A.; Steinweg, J.M.; Schaeffer, S.M. Substrate quality alters microbial mineralization of added substrate and soil organic carbon. Biogeosci. Discuss. 2014, 11, 4451–4482. [Google Scholar] [CrossRef]
Figure 1. Map of the study area.
Land 13 00336 g001
Figure 2. Profile characteristics of the SOC (a) and SIC (b) content of five land-use types. Note: Different lowercase letters have significant differences in the same land-use type and different soil depths, while different uppercase letters have significant differences in the same soil depth and different land-use types.
Land 13 00336 g002
Figure 3. Profile characteristics of the SOC-δ13C (a) and SIC-δ13C (b) content of five land-use types. Note: Different lowercase letters have significant differences in the same land-use and different soil depths, while different uppercase letters have significant differences in the same soil depth and different land-use types.
Land 13 00336 g003
Figure 4. Stable isotope composition, proportion, and content of soil PC in five land-use types (a,b). Note: Different lowercase letters have significant differences in the same land-use type and different soil depths, while different uppercase letters have significant differences in the same soil depth and different land-use types.
Land 13 00336 g004
Figure 5. Source of SIC-fixed CO2 and its carbon transfer amount of different land-use types (g kg−1). Note: (a) cotton field, (b) orchard, (c) forest land, (d) waste land, and (e) sandy land.
Land 13 00336 g005
Figure 6. Two-dimensional ranking plot and correlation coefficient matrix of soil SOC transfer to SIC. Note: A: δ 13C-SOC; B: δ 13C-SIC; C: Trafer (transfer volume); SM: soil moisture; BD: soil bulk density; TS: soil salt; TN: soil total nitrogen; AP: quick phosphorus; AK: quick kalium; MBC: Microbial biomass carbon.
Land 13 00336 g006
Table 1. Results of importance ranking and significance tests for interpretation of physicochemical environmental variables.
Physical and Chemical FactorsImportance of RankingInterpretation of Quantity/%Fp
SM136.513.20.002
pH222.66.70.006
MBC313.73.70.03
AP412.93.40.062
AK512.83.40.046
BD612.53.30.04
TN710.52.70.06
TS86.51.60.142
Disclaimer/Publisher’s Note: The statements, opinions and data contained in all publications are solely those of the individual author(s) and contributor(s) and not of MDPI and/or the editor(s). MDPI and/or the editor(s) disclaim responsibility for any injury to people or property resulting from any ideas, methods, instructions or products referred to in the content.

