Article

Land Use Change and Landscape Ecological Risk Assessment Based on Terrain Gradients in Yuanmou Basin

1
Faculty of Geography, Yunnan Normal University, Kunming 650500, China
2
Yunnan Key Laboratory of Plateau Geographical Processes & Environmental Changes, Kunming 650500, China
3
Tropical Eco-Agriculture Research Institute, Yunnan Academy of Agricultural Sciences, Yuanmou 651300, China
4
National Soil and Water Conservation Science and Technology Demonstration Park of Yunnan Yuanmou Jinlei, Yuanmou 651300, China
*
Author to whom correspondence should be addressed.
Land 2023, 12(9), 1759; https://doi.org/10.3390/land12091759
Submission received: 26 June 2023 / Revised: 26 August 2023 / Accepted: 7 September 2023 / Published: 10 September 2023
(This article belongs to the Special Issue 2nd Edition: Land Use Change and Its Environmental Effects)

Abstract

:
Investigating the distribution characteristics of landscape ecological risk (LER) on terrain gradients is of great significance for optimizing the landscape pattern of ecologically vulnerable areas in mountainous regions and maintaining the sustainable development of the ecological environment. The Yuanmou Basin is a typical ecologically vulnerable area in the southwestern mountainous region of China, where issues such as soil erosion are pronounced, becoming one of the main factors restricting regional economic development. This study selected the Yuanmou Basin as the study area, and, using land use data from 2000, 2010, and 2020, constructed an LER assessment model based on disturbance and vulnerability. By integrating elevation and topographic position index data, we examined the spatiotemporal evolution characteristics of LER under different terrain gradients. The LER assessment results are summarized as follows: (1) From 2000 to 2020, the land use types of the Yuanmou Basin were mainly grassland, forest land and cropland. The land use showed a sharp increase in the cropland area and a simultaneous decrease in the grassland area, indicating a main land use evolution direction from grassland to cropland. (2) Over the span of 20 years, the average landscape ecological risk in the Yuanmou Basin slightly increased, specifically manifesting as a significant reduction in low ecological risk areas, while areas of medium and slightly lower ecological risks saw an increase. (3) The spatial distribution of LER in the Yuanmou Basin presents a pattern of being low on the periphery and high in the center, with significant positive spatial correlation, obvious spatial aggregation, as well as “high-high” and “low-low” clustering. (4) Low- and lower-risk areas in the Yuanmou Basin are distributed in the non-arid thermal zone and the medium–high terrain zone, while areas of medium, higher and high risk levels are mainly distributed in the arid thermal zone and the low terrain zone. The research results provide a scientific basis for optimizing and developing the land resources of the Yuanmou Basin.

1. Introduction

In recent years, with rapid economic development and urbanization, the contradiction between land supply and demand has become increasingly prominent. Irrational land use has been adversely affecting the ecological environmental quality and sustainable socio-economic development. It has led to a series of ecological problems such as low efficiency of land resource use, soil erosion, land degradation/desertification, and biodiversity reduction. This greatly increases ecological risks and seriously threatens the stability and equilibrium of ecosystems [1,2,3,4]. With the aggravation of ecological problems, quantitative analyses of land use change and the consequent ecological risks to evaluate regional ecological security has become a research hotspot.
Ecological risk assessment can comprehensively evaluate the possibility and degree of impacts caused by natural disasters and human activities on natural environments and ecosystems. It can provide a scientific basis for regional ecological protection and management [5,6]. In recent years, ecological risk assessment has been attracting increasing attention from researchers worldwide, and it has become a research hotspot in ecology, geography, etc. [7,8]. In 1972, ecological risk assessment was first proposed with the concept of sustainable development [9]. In 1990, the United States Environmental Protection Agency (US EPA) introduced the first ecological risk assessment framework, which helped to develop basic guidance for the risk assessment [10]. Early ecological risk assessment methods usually consisted of only one or several specific risk sources, such as soil heavy metal pollution, increased impermeable surface, pesticide pollution, soil erosion and water pollution [11,12,13]. These methods had the advantages of quickly identifying risk sources that threaten regional ecosystems, precisely determining risk receptors based on the risk perspective of source sinks, and comprehensively reflecting regional ecological variability. However, they also showed drawbacks, such as a lack of comprehensive consideration of ecological risks due to the relatively unified evaluation results [14], and a limited applicability only for areas with clear sources of regional ecological security risks [15].
In recent years, LER assessment based on landscape pattern and land use change has become an important branch of ecological risk assessment research [16,17]. It can not only reveal the spatial/temporal evolution and the spatial differentiation pattern of regional ecological risks, but also provide quantitative descriptions of the degree of ecological risk in specific spatial patterns [18], which facilitates the extraction of key characteristics of spatial and temporal changes in ecosystem structure and function [19]. Therefore, this method is more suitable for areas with relatively complex sources of ecological risks. However, the focus of regional ecological risk assessment is currently mainly placed on wetlands, farmlands, oceans, watersheds, mining areas, administrative regions [20] and cities [21]. The relevant research on vulnerable areas of dry–hot river valleys, e.g., the Yuanmou Basin, are very limited. The high altitude, complex topography and arid climate of the Yuanmou Basin make the ecological environment vulnerable to human activities [22], leading to degradation of grasslands, increase in soil erosion, decline in ecosystem function, and loss of biodiversity. Therefore, intensive studies on land-use patterns and ecological risks based on topographic gradients in the Yuanmou Basin are urgently required to provide scientific guidelines for local environmental protection.
As the most basic natural environmental factor [23], terrain directly affects the migration of surface materials, as well as the transfer and redistribution of energy in the region, which in turn influences the type of land use. Therefore, terrain is an important basis for the construction of land use patterns [24], which make the spatial distribution patterns of LER under different terrain conditions more complex [25,26]. Current studies on the correlation between LER and terrain mainly focus on the simple response of ecological risk indices to topography [27] and the distribution of ecological risks on a single terrain factor described by terrain niche index (TNI) [28], while only a few works have intensively investigated the correlation of LER with integrated terrain factors. Therefore, a quantitative description of the spatial distribution of LER at different topographic gradients from an integrated perspective can reveal the characteristics of change in LER spatial features, and provide a reference for regional ecosystem management.
Dry–hot river valleys are dry thermal scrub landscape valleys located in humid climate zones of the tropics or subtropics [29]. A small number of them are found in the Alps of Europe and the Cordillera of the United States, while most of them are in the large river basins of southwest China, such as the Jinsha, Nu and Yuan River basins. The dry–hot valley of the Jinsha River is located in the Hengduan Mountains, and the Yuanmou Basin is in the core area of the dry–hot valley of Jinsha River.
Due to the unique climatic conditions and geotechnical characteristics of this area, as well as the development of the high mountain valley, a series of environmental problems have occurred in recent years, including serious imbalance in distribution of water and heat resources, severe soil erosion, and significant degradation of the ecological environmental quality. They lead to a large number of eroded poor landscapes with extremely fragile ecological environments and landscape patterns that are vulnerable to external disturbances [30,31,32]. On the other hand, due to the abundant light and heat resources, as well as the high crop replanting index derived from the special geographical location, the Yuanmou Basin is very suitable for planting high quality crops, vegetables and fruits during winter and spring. With the implementation of large-scale trenching and gardening, the landscape fragmentation and ecological risks have been increasingly aggravated, which seriously impacts the quality of regional ecological environment and the sustainable development of social economy [33]. At the current stage, it is an urgent task and also a big challenge to integrate and optimize the resources of the Yuanmou Basin to promote economic development and to simultaneously protect the ecological environment from damage. Since the end of the last century, the spatial and temporal changes in landscape ecological security of the Yuanmou Basin have been studied [34]. Additionally, the variations in ecological environment quality and driving forces have also been analyzed [35]. However, the previous research has mostly focused on Yuanmou County or typical villages/towns. There is still a lack of multi-dimensional ecological risk assessment of the Yuanmou Basin.
Therefore, considering the complex natural ecological environment of the Yuanmou Basin, analyses of the spatial and temporal evolution patterns of regional ecological risks from the perspective of terrain gradients are important. They can provide a decision basis for ecological restoration, landscape pattern optimization, improvement of ecological environment quality and formulation of environmental protection measures. It is of great significance for realizing sustainable land resource use and high-quality economic development.

2. Materials and Methods
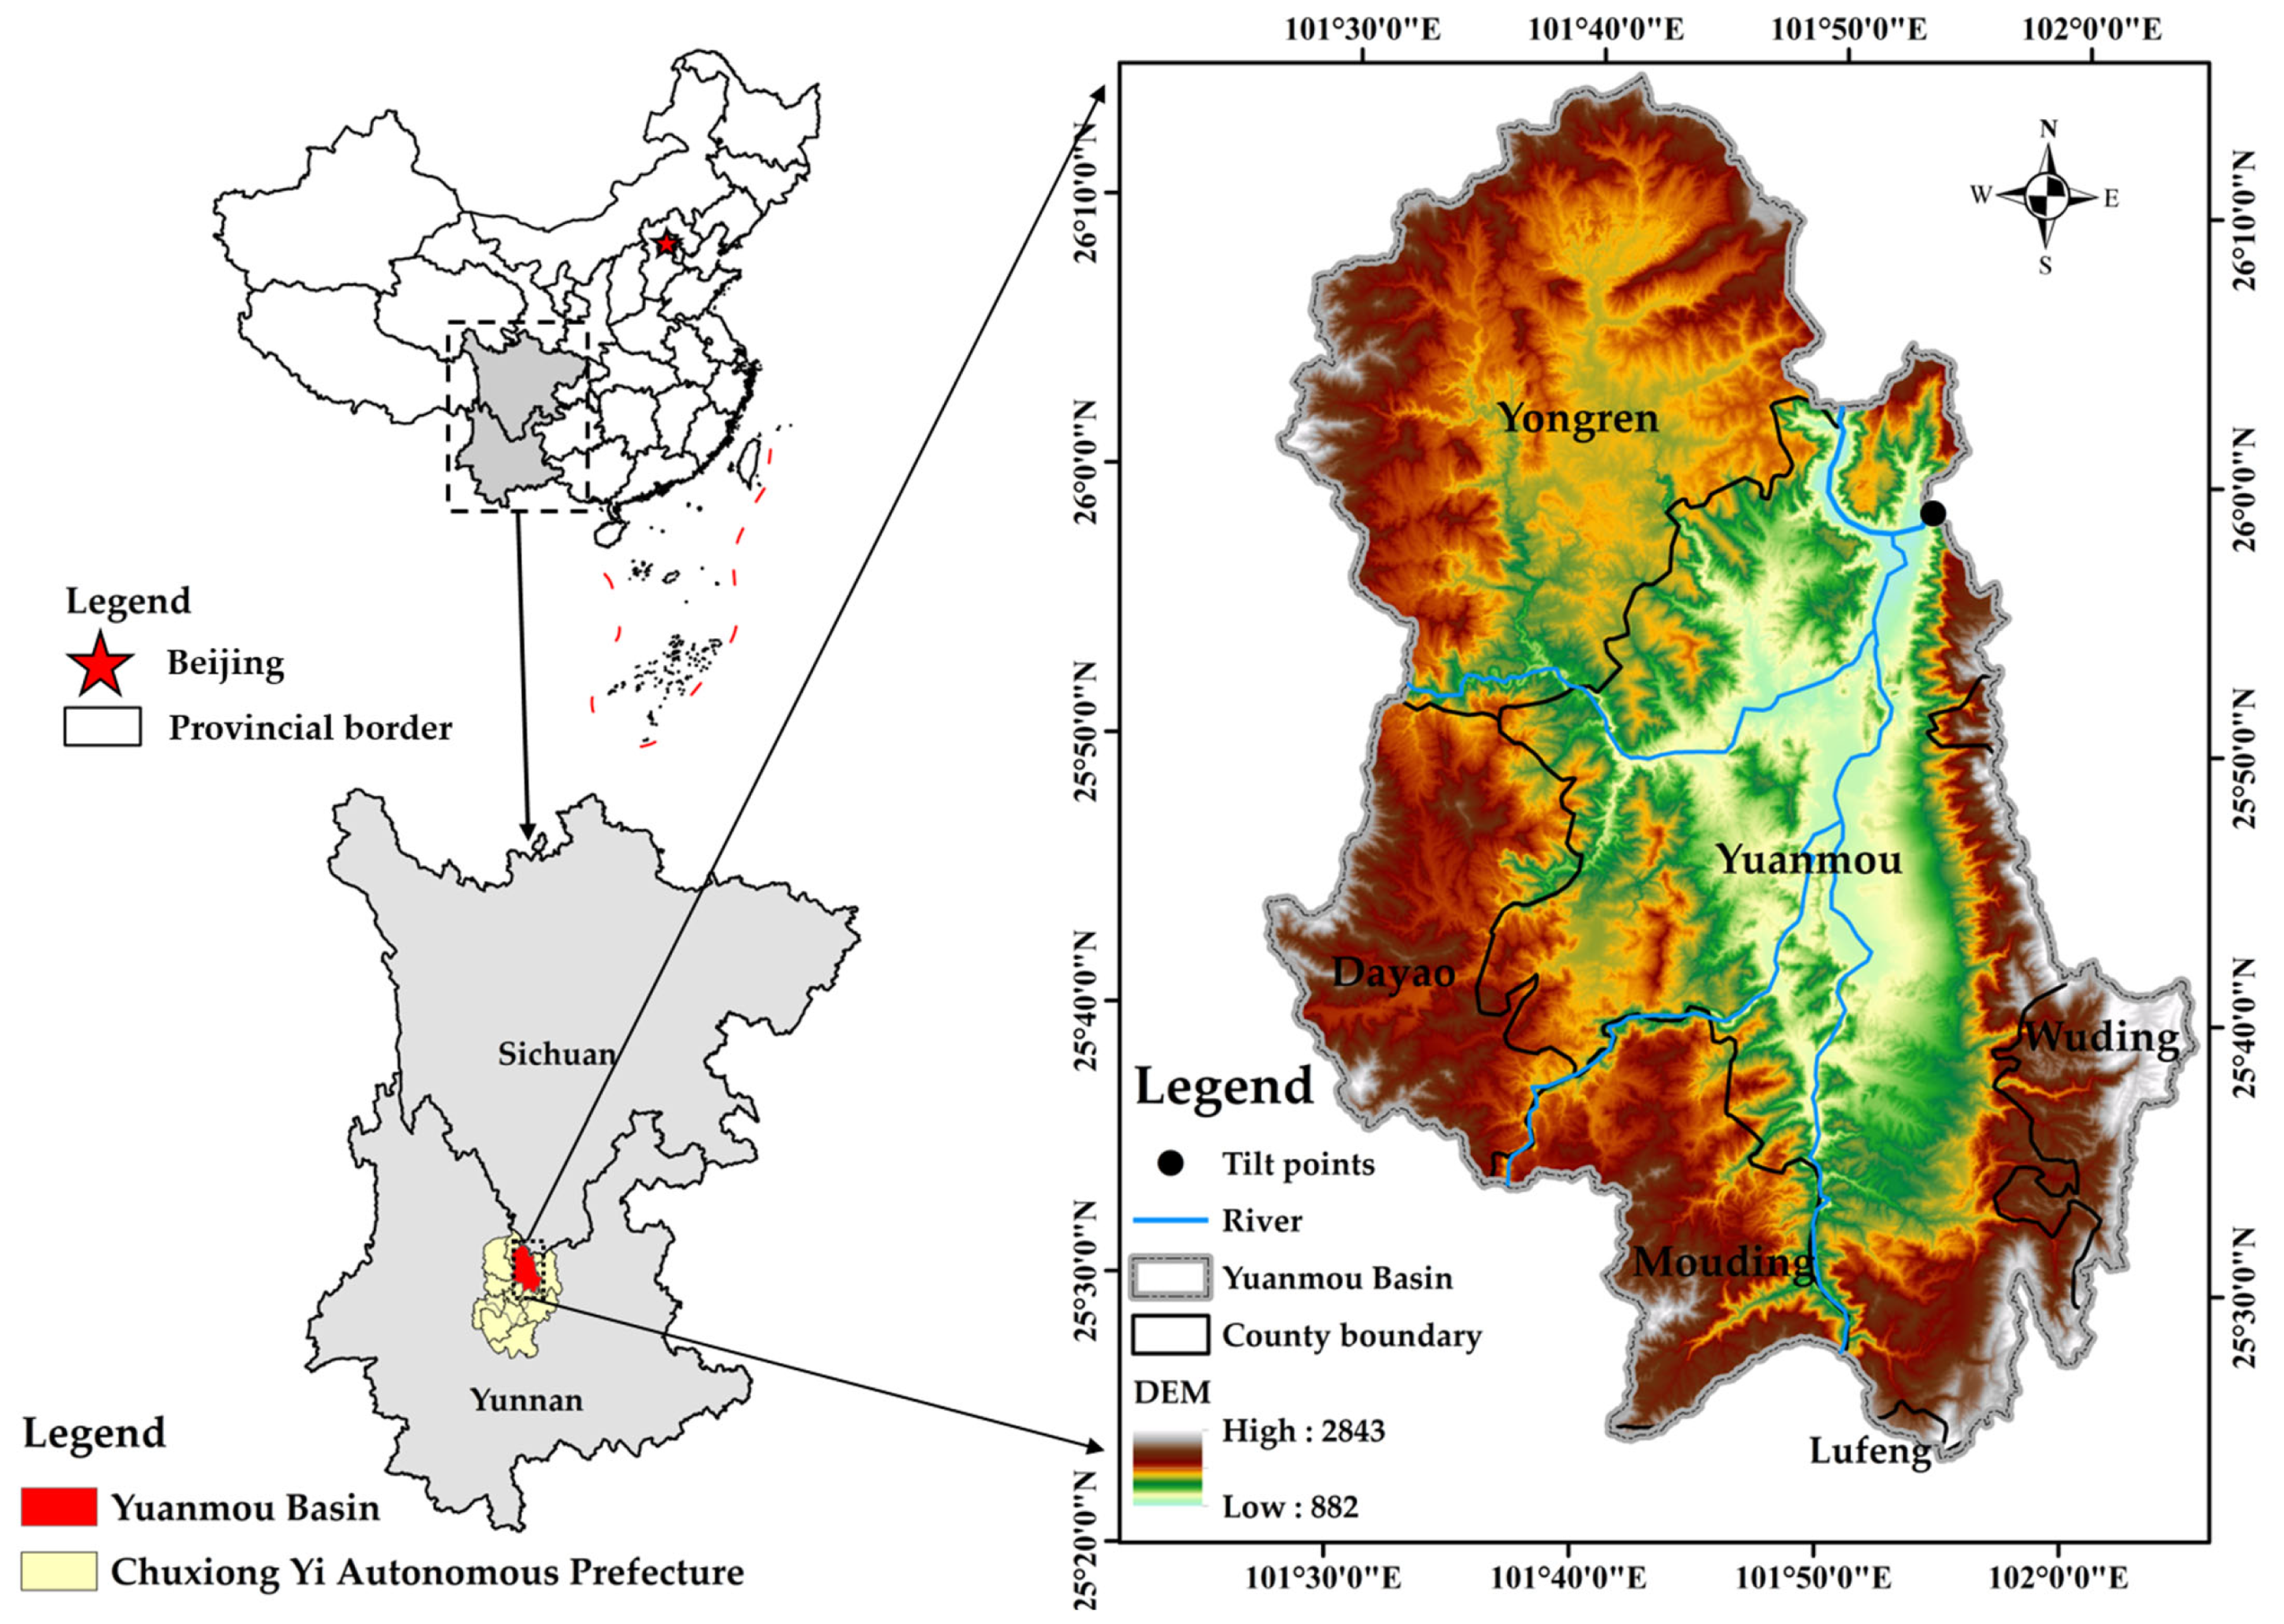
2.1. Study Area

The Yuanmou Basin is located in the northern part of the Central Yunnan Plateau, within the basin of the Longchuan River (Figure 1), which is a first-order tributary of the Jinsha River (24°–26°15′ N, 101°27′–102°06′ E). It has an area of 3515 km2, including mainly Yuanmou and most of Yongren counties in Chuxiong Prefecture, and also parts of eastern Dayao County, northeastern Mouding County, western Wuding County and northern Lufeng City (Figure 1). The study area is in the core area of the dry and hot valley of Jinsha River. It has a dry–hot climate and an obvious vertical differentiation of land cover. The Yuanmou Basin is divided into four vertical climatic zones. The dry tropics of the Pingba Valley are below 1300 m above sea level, with a dry climate and abundant heat resource. The average annual temperature, rainfall and evaporation are 21.0–22.8 °C, 615.1 mm and 3700–4300 mm, respectively. The warm and hot climate zone of the hilly low mountains is located at 1300–1700 m above sea level. Its average annual temperature, rainfall and evaporation are 18–21 °C, 660–740 mm and 2100 mm, respectively. The middle mountain warm temperate zone is located at 1700–2000 m above sea level. Its average annual temperature and rainfall are 15–18 °C and 800–850 mm, respectively. The temperate high and middle mountains are over 2000m above sea level, with an insufficient heat condition. The average annual temperature is 10–15 °C, with surplus moisture during the rainy season, and annual rainfall >850 mm. Soils in this zone are mainly dry red soil, red loam, yellow brown soil, and brown soil, with a small amount of purple and rice soils [36]. The natural vegetation is divided into three layers: trees, shrubs and grasses. The trees are mostly composed of drought-resistant species. They are sparsely scattered among the shrubs and grasses, forming a plant community that has long been adapted to the dry and hot environments. The sparse scrub and grassland are mainly distributed in areas below 1600 m above sea level. The scrub grassland and patchy forest are located in regions higher than 1600 m above sea level [37]. Agriculture is the pillar industry of the Yuanmou Basin, which is one of the most important sources of early winter vegetables in Yunnan Province and China. The agricultural products are widely supplied to more than 200 cities and regions, such as Beijing, Tianjin and Hebei, the Yangtze River Delta, the Pearl River Delta, Guangdong, Hong Kong, Macao and the Greater Bay Area, Chengdu and Chongqing, as well as East and Southeast Asia.

2.2. Data Source

The Yuanmou Basin was extracted based on DEM data using the Basin Domain Analysis module of ArcGIS10.8 software (Figure 1). The land use and land cover data of the Yuanmou Basin for 2000, 2010 and 2020 were sourced from the Google Earth Engine (https://earthengine.google.com/commercial/ (25 May 2023)). These categories included water bodies, grassland, forest land, farmland, construction land and unused land. DEM data were downloaded from the geospatial data cloud platform (http://www.gscloud.cn/ (30 May 2023)), and they were used to extract the elevation and terrain position indices. Administrative zoning data and river data were accessed from the National Geographic Information Resources Catalogue Service (www.resdc.cn/Data.aspx (10 May 2023)).

2.3. Research Methods

2.3.1. Land Use Classification Methods

The land use and land cover data were derived by constructing a random forest classification model based on the Google Earth Engine (https://earthengine.google.com/commercial/ (accessed on 25 May 2023)), where the remote sensing image data for 2000 and 2010 were collected using Landsat5-TM imagery, and the corresponding data for 2020 were obtained from Landsat8-OLI2 imagery that was taken during the dry season with a resolution of 30 m. By analyzing the regional characteristics and referring to the relevant classification criteria, the study area was divided into six land use types, including water bodies, grassland, forest land, farmland, construction land and unused land [38].

2.3.2. Land Use Transfer Matrix

The land use transfer matrix is an important method for studying the dynamic changes in land use over a specific period of time. It can be used to calculate the direction and degree of mutual transfers between different landscape types [39]. The matrix applied in this study for analyzing the interconversion between different land use types is expressed as follows:
S i j = S 11 S 1 n S n 1 S n n
where Sij represents the area transferred from the initial land use type i to the final land use type j, and i and j represent the land use types at the beginning and end of the study period, respectively; and n represents the number of land use types.

2.3.3. Landscape Ecological Risk (LER) Analysis

Division of LER

In order to spatially express the regional heterogeneity of LER of the specific characteristics of Yuanmou Basin and the accuracy of calculation, the study area was divided into a big number of small ecological risk assessment cells using the equal spacing method. According to previous studies, the area of the fishnet should be 2–5 times larger than the average patch area [7,8]. Finally, 3740 grids (each with a size of 1 km × 1 km) within the Yuanmou Basin were obtained for sampling. For each grid cell, an ecological risk index (ERI) was calculated and the result was assigned to the central point of the evaluation cell.

Landscape Ecological Risk Index Construction

The ERI is constructed based on the area share of land use types and the landscape loss index, where the landscape loss is determined through the landscape disturbance and landscape vulnerability [40]. The ERI can be calculated with the following formula:
E R I x = i = 1 n A x i A x R i
where ERIx denotes the ecological risk index of the x-th evaluation unit, Axi denotes the area (km2) of the i-th type of landscape in the x-th evaluation unit, Ax is the total area (km2) of the landscape in the x-th evaluation unit, n is the number of landscape types in the study area, and Ri is the loss index of the i-th type of landscape. By combing the results from previous research [41] with the characteristics of the study area, six types of land use were assigned and scored in this work according to their landscape vulnerability (Vi), and the values were further normalized to obtain the corresponding vulnerability indices: 0.19 for arable land, 0.095 for forest land, 0.143 for grassland, 0.238 for water bodies, 0.048 for construction land, and 0.286 for unused land. The process for construction of the ecological risk index and its calculation is shown in Table 1 [8,42,43]. This was followed by using ordinary kriging interpolation to achieve the spatial distribution of ERI in the whole study area, and applying the natural breakpoint method [44,45] to classify the ERI of the study area in 2020 into five levels: low risk (ERI < 0.0267), lower risk (0.0267 ≤ ERI < 0.0408), medium risk (0.0408 ≤ ERI < 0.0662), higher risk (0.0662 ≤ ERI < 0.1272) and high risk (0.1272 ≤ ERI). For comparative data analysis, the ERI in other years were also divided according to the same criterion.

2.3.4. Spatial Autocorrelation Analysis

In this paper, Moran’s I index and LISA index were used to characterize the spatial distribution of ecological risks in the study area, and to analyze the relationships between global and local spatial autocorrelations of ecological risks in the study area. The spatial autocorrelation Moran’s I index can verify whether the attribute values of risk assessment units in adjacent or nearby areas are correlated [46]. Its value is generally between (−1,1): Less than 0 means negative correlation, showing a discrete distribution in global space. Equal to 0 means no correlation, indicating a random distribution in global space. Greater than 0 means positive correlation, suggesting a cluster distribution in global space. The LISA indices consist of four types: Low–low clustering, high–high clustering, low-value package-high clustering, and high-value package-low clustering [47].

2.3.5. Terrain Gradient Analysis

Terrain Niche Index

The terrain index is used in this work to measure the slope of the terrain, which can reflect not only the elevation and slope characteristics in an integrated manner, but also the spatial differentiation of terrain conditions [48,49]. It can be calculated as follows:
T = l o g E E ¯ + 1 × S S ¯ + 1
where T is the terrain position index, E is the elevation of any raster in space, E ¯ is the average elevation in the study area, S is the slope of any raster in space and S ¯ is the average slope in the study area.

Terrain Distribution Index

In order to effectively eliminate the disturbance of rank between terrain gradient zones by area, a distribution index is used. It represents the frequency of distribution in ecological risk areas of the landscape between different terrain zones [44]. It can be calculated according to the formula below:
P = S i e S i / S e S
where P is the terrain distribution index, Sie is the area of the i-th ecological risk class on the e-th terrain interval, Si is the area of the i-th ecological risk class within the Yuanmou Basin, Se is the total area of the e-th terrain interval within the Yuanmou Basin and S is the total area of the whole Yuanmou Basin. If P > 1, the site type is dominantly distributed, and the larger the distribution index, the higher the dominance [50]. A flatter curve of the distribution index suggests that the distribution of a landscape type deviates less from the standard distribution, and it is more adaptable to terrain differences. Conversely, it is more susceptible to terrain [51].
In this study, elevation and terrain distribution indices were selected to analyze the effect of terrain gradients on the ecological risk pattern of the Yuanmou Basin landscape. According to Jin’s [52] method, the ranges of arid thermal (882–1600 m) and non-arid thermal zones (1600–2843 m) were extracted based on DEM data. Existing research indicates that topography has a significant impact on the structure and distribution of land use, and its compositional structure and pattern changes are highly correlated with the spatiotemporal distribution and dynamics of landscape ecological risks, therefore referring to the research results of related scholars on the impact of topographic factors on land use patterns. Considering the actual situation in the study area, the terrain positions (0.1878–1.1568) were divided into five levels with a rank interval of 0.1938 using the quantile reclassification.

3. Results

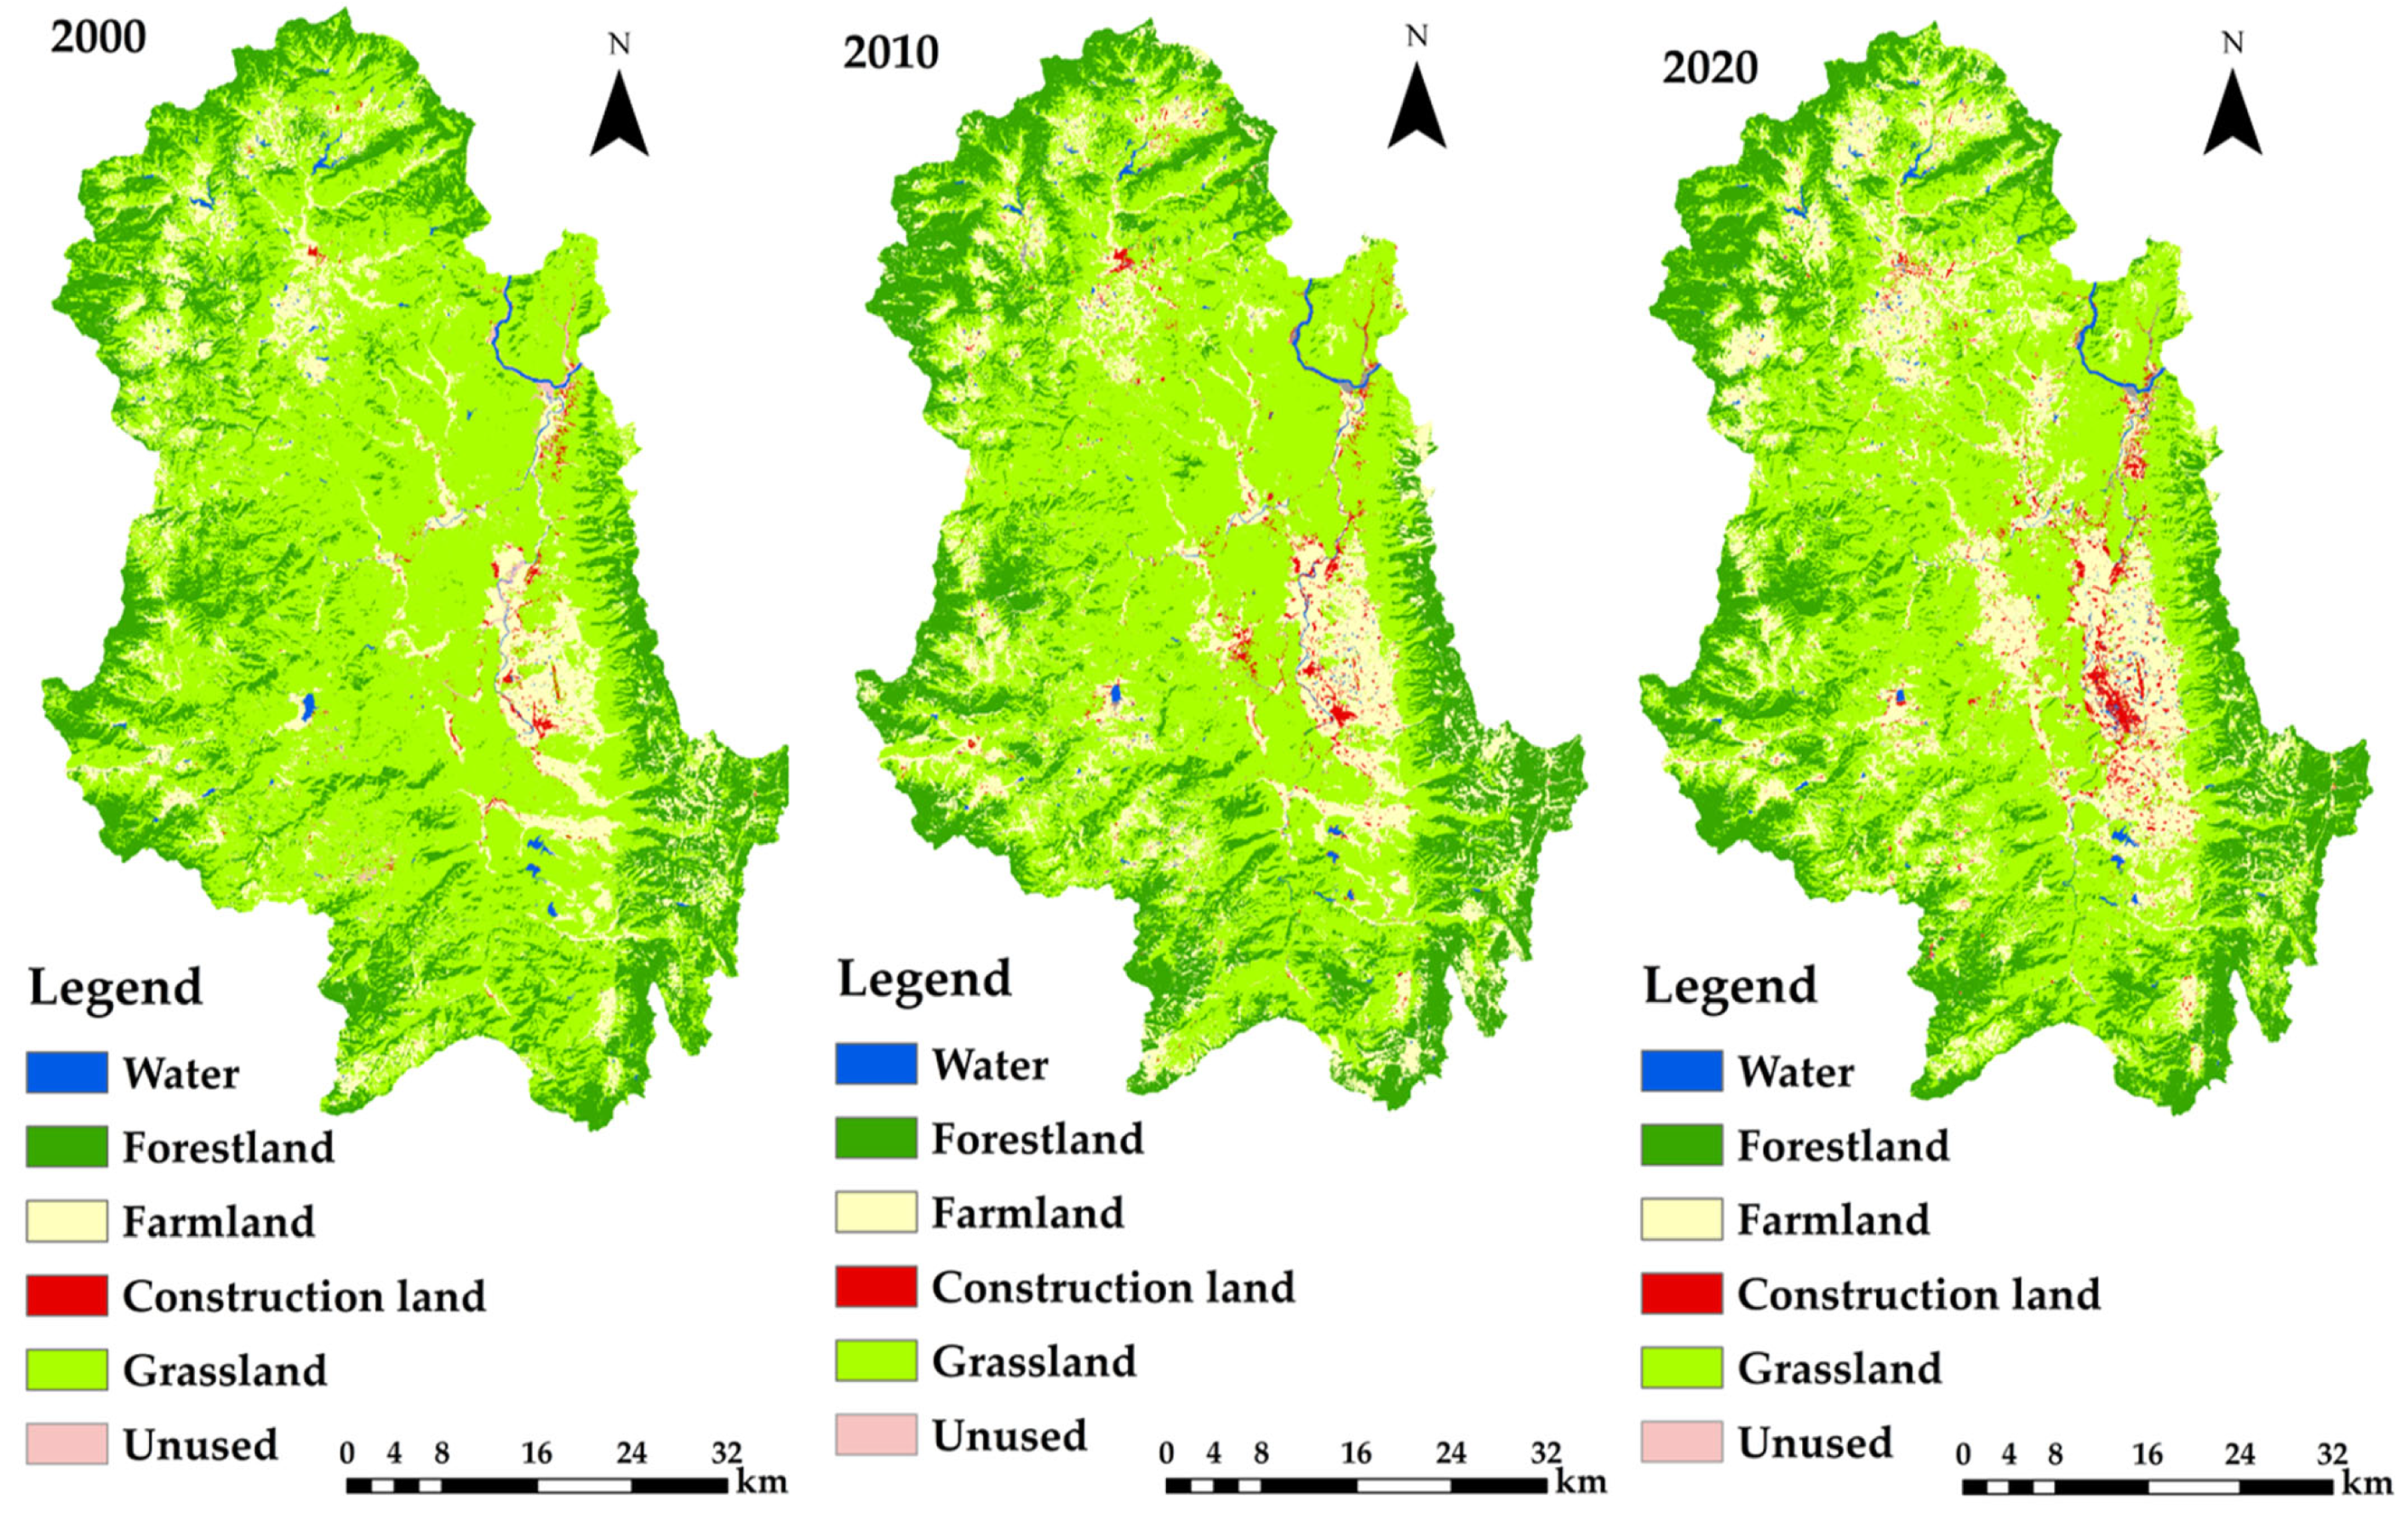
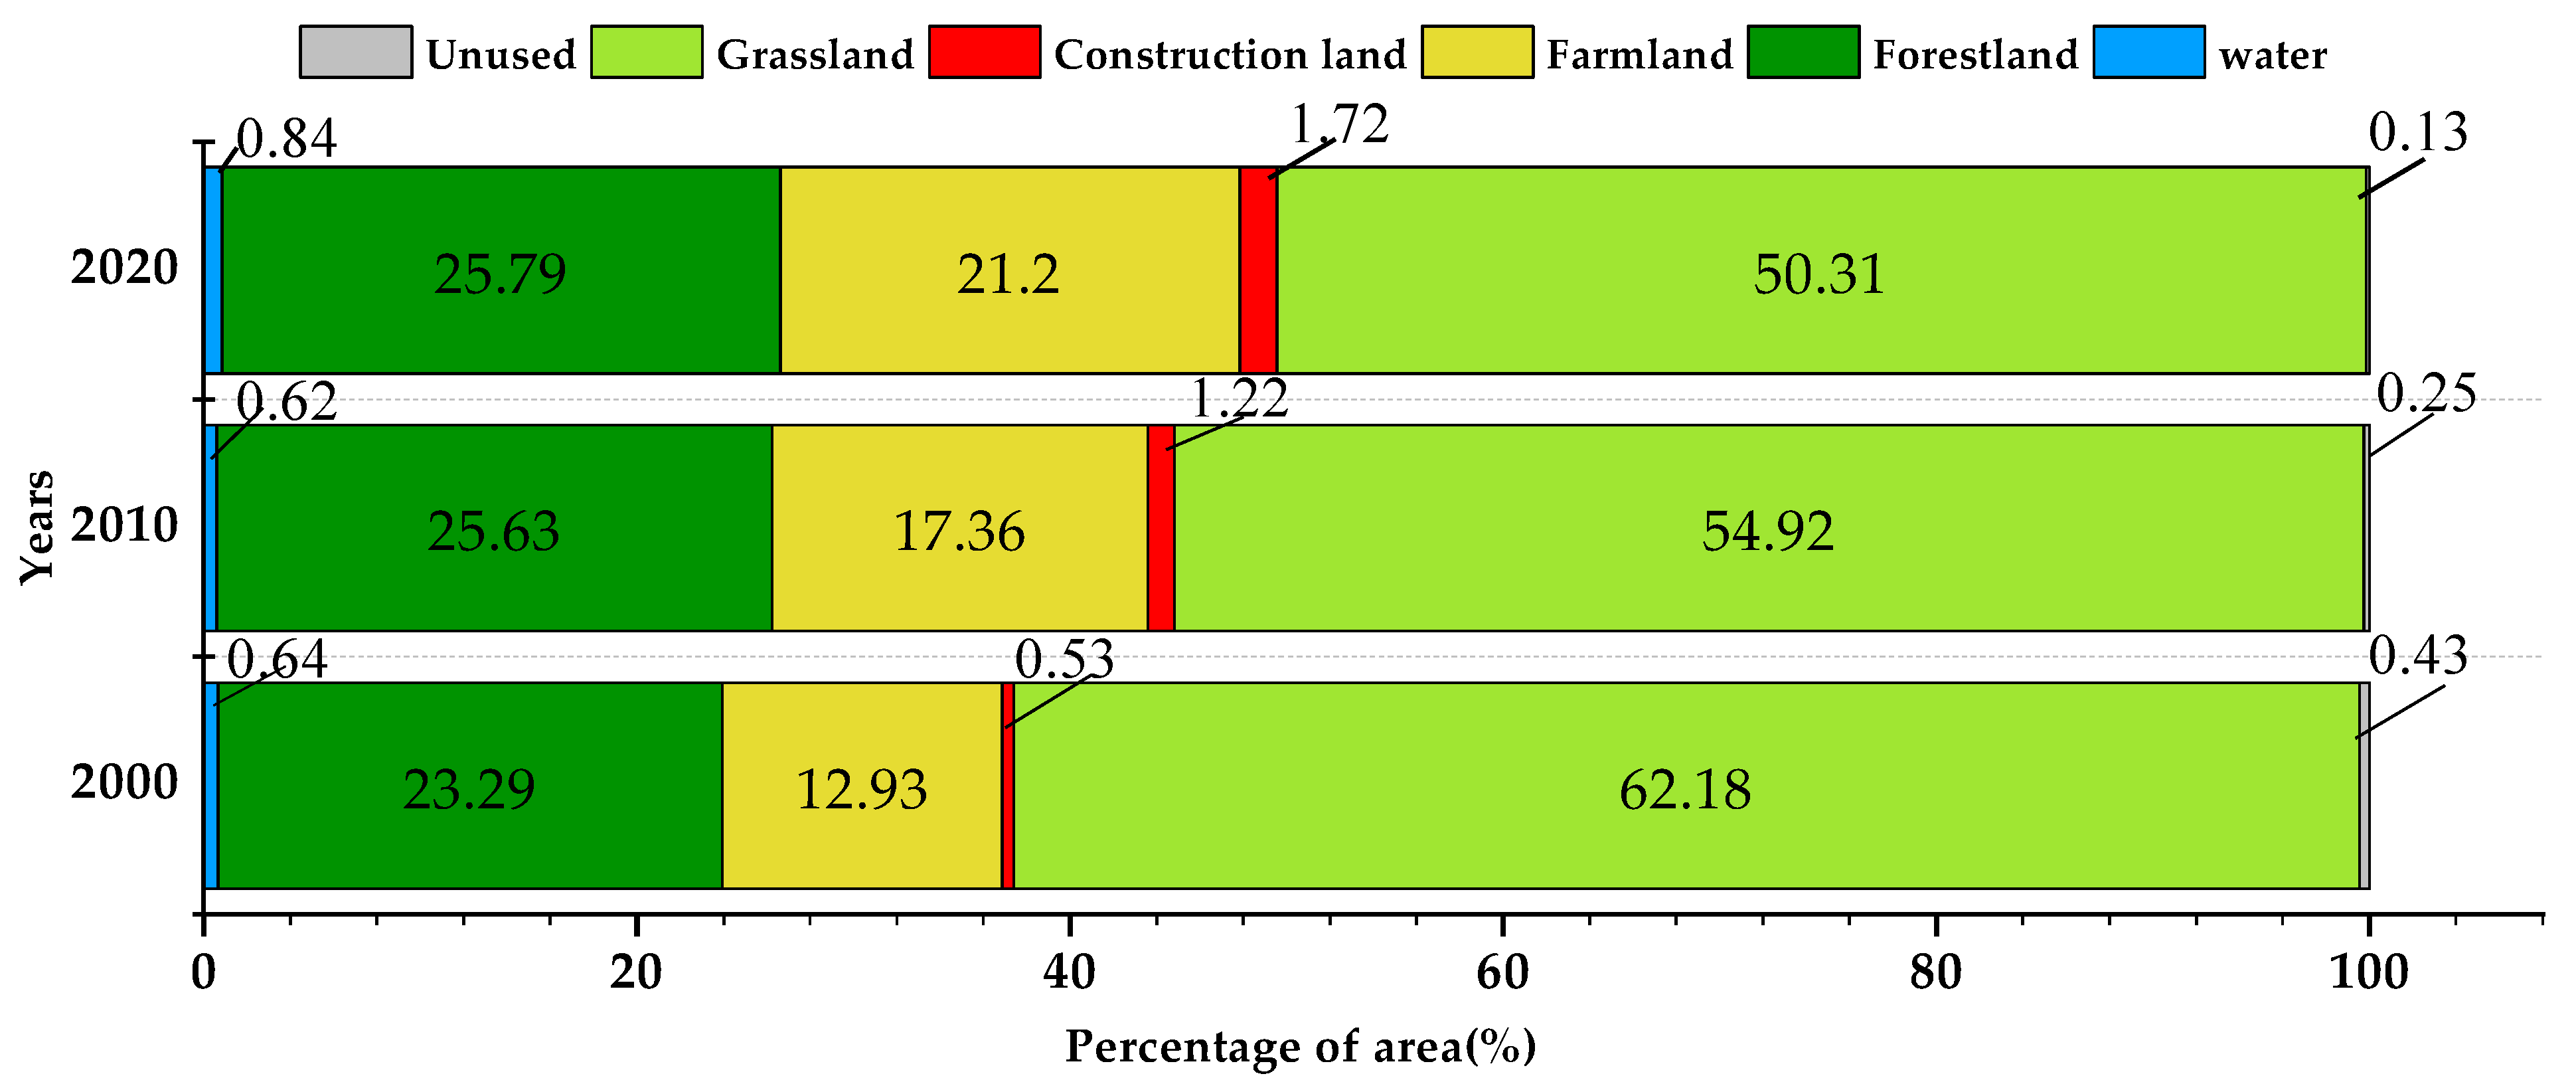
3.1. Analysis of Land Use Change

In this paper, the land use classification accuracy was validated using a confusion matrix. The overall classification accuracy was 85.65%, 87.40% and 87.59% in 2000, 2010 and 2020, respectively, and the Kappa coefficients were 80.53%, 83.33% and 84.13% in 2000, 2010 and 2020, respectively (Figure 2). As shown in Figure 3, grassland, forestland and farmland were the most widely distributed land use types in the Yuanmou Basin from 2000 to 2020, accounting for ca. 97.30% of the total area, while the area of construction land, water bodies and unused land accounts only for a small proportion of 2.69%. From 2000 to 2020, the area of farmland increased by 290.51 km2, and its proportion increased from 12.93% to 21.20%. The area of construction land expanded rapidly, from 18.46 km2 in 2000 to 60.46 km2 in 2020, with a 20-year total increase of 228.06% and an average annual growth rate of 11.40%. The rapid increase in the areas of construction land and farmland can be explained by the population expansion and accelerated urbanization, which induce industrial and agricultural development, as well as the expansion of towns and arable land in the flat topographic areas of the study area. The area of cultivated land also increased, and forestland expanded with an increase in its area proportion from 23.29% in 2000 to 25.79% in 2020, i.e., a change rate of 10.73%. However, grassland showed a rapid decrease in its proportion by 11.87% from 2000 to 2020. In terms of water bodies, its area slightly increased from 22.51 km2 in 2000 to 29.55 km2 in 2020 (relative increase of 31.27%). In addition, the area of unused land decreased slightly, with its share declining from 0.43% in 1980 to 0.13% in 2020.
The detailed statistical data are also listed in Table 2, and reveal frequent transfers between land use types in the Yuanmou Basin from 2000 to 2020. The area of grassland decreased by 655.71 km2 during the 20-year period, which transferred mainly to forestland, farmland and construction land, with the areas of 222.11, 396.20 and 31.13 km2, respectively. The largest change was the increase in the farmland area by 431.19 km2, which showed more frequent spatial interconversion with other land types. In general, the farmland transferred mainly from grassland with an area of 396.20 km2 and transferred to forestland, construction land and grassland with areas of 23.57, 18.03 and 93.21 km2, respectively. The increase in construction land was 51.72 km2, which could be attributed to the expense of farmland and grassland in the watershed. The area of forest land increased by 245.97 km2, mainly due to the transfer from farmland and grassland. Water bodies had an increased area of 13.14 km2, which was mainly from arable land and grassland. The area of unused land decreased by 12.35 km2, mainly because of the transfer to farmland and grassland. In the Yuanmou Basin, only grassland and unused land have shown decreased areas over the past 20 years, while forestland, construction land, farmland and water bodies have all expanded their ranges.

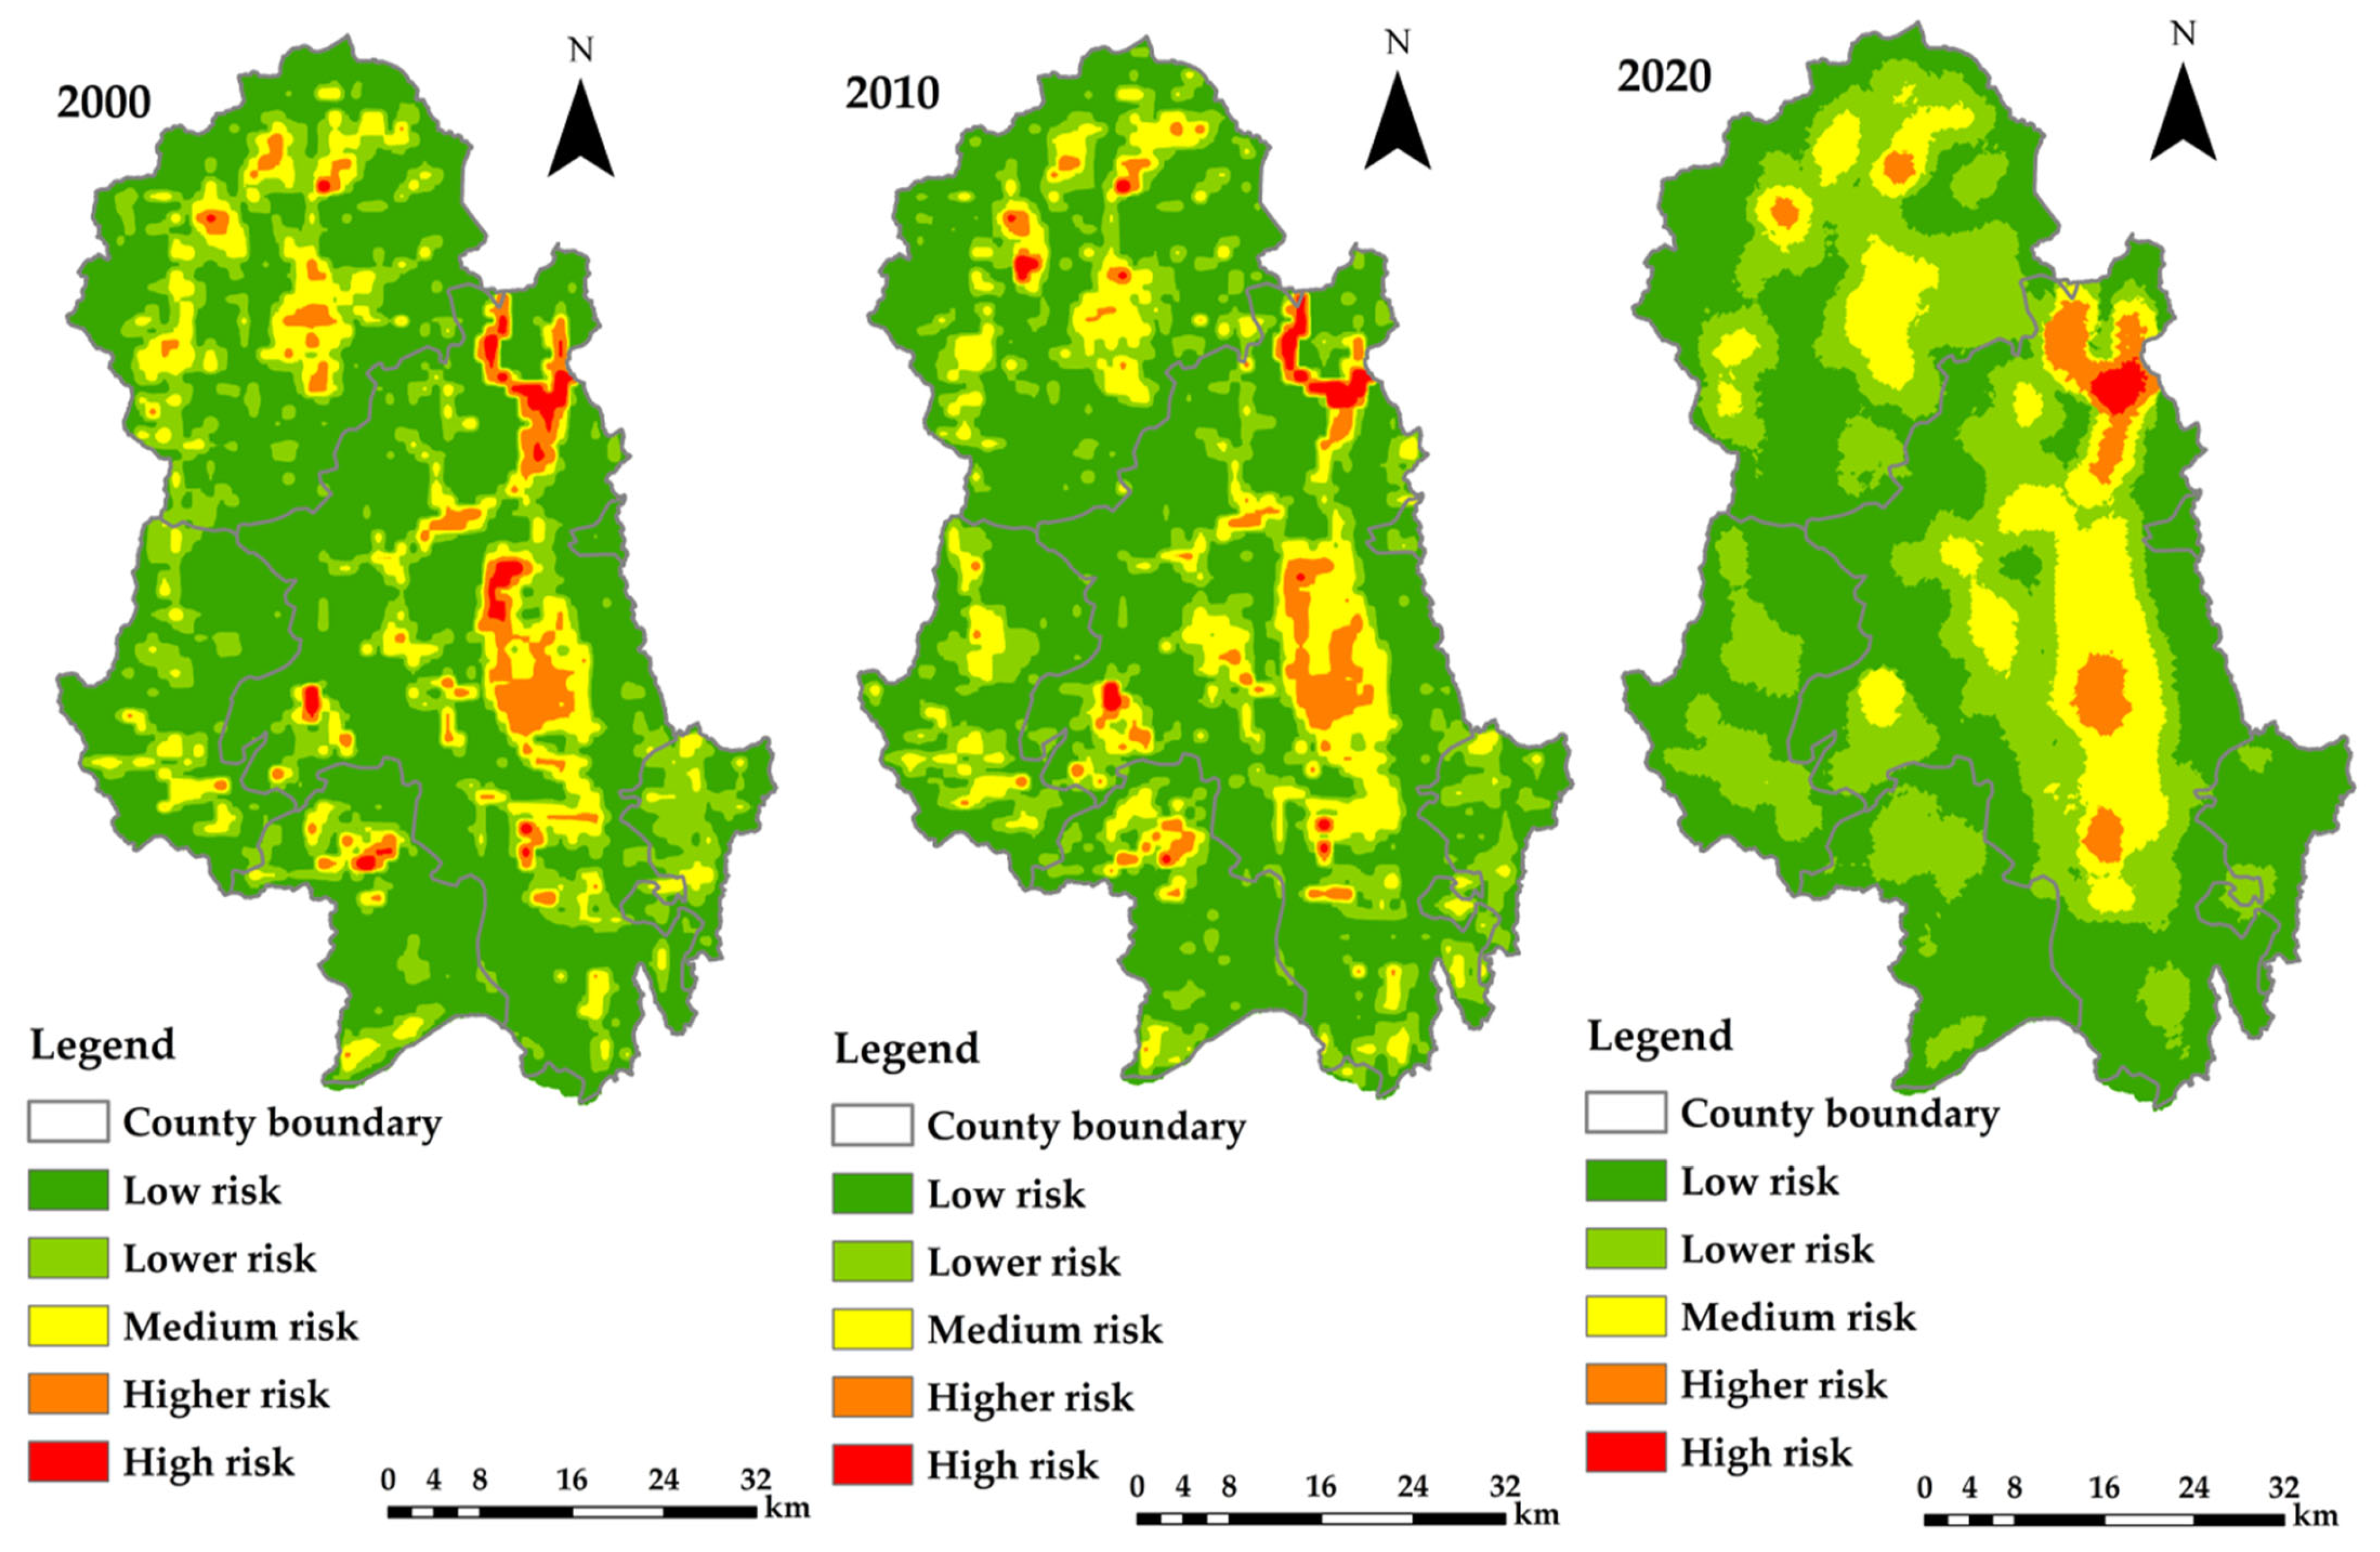
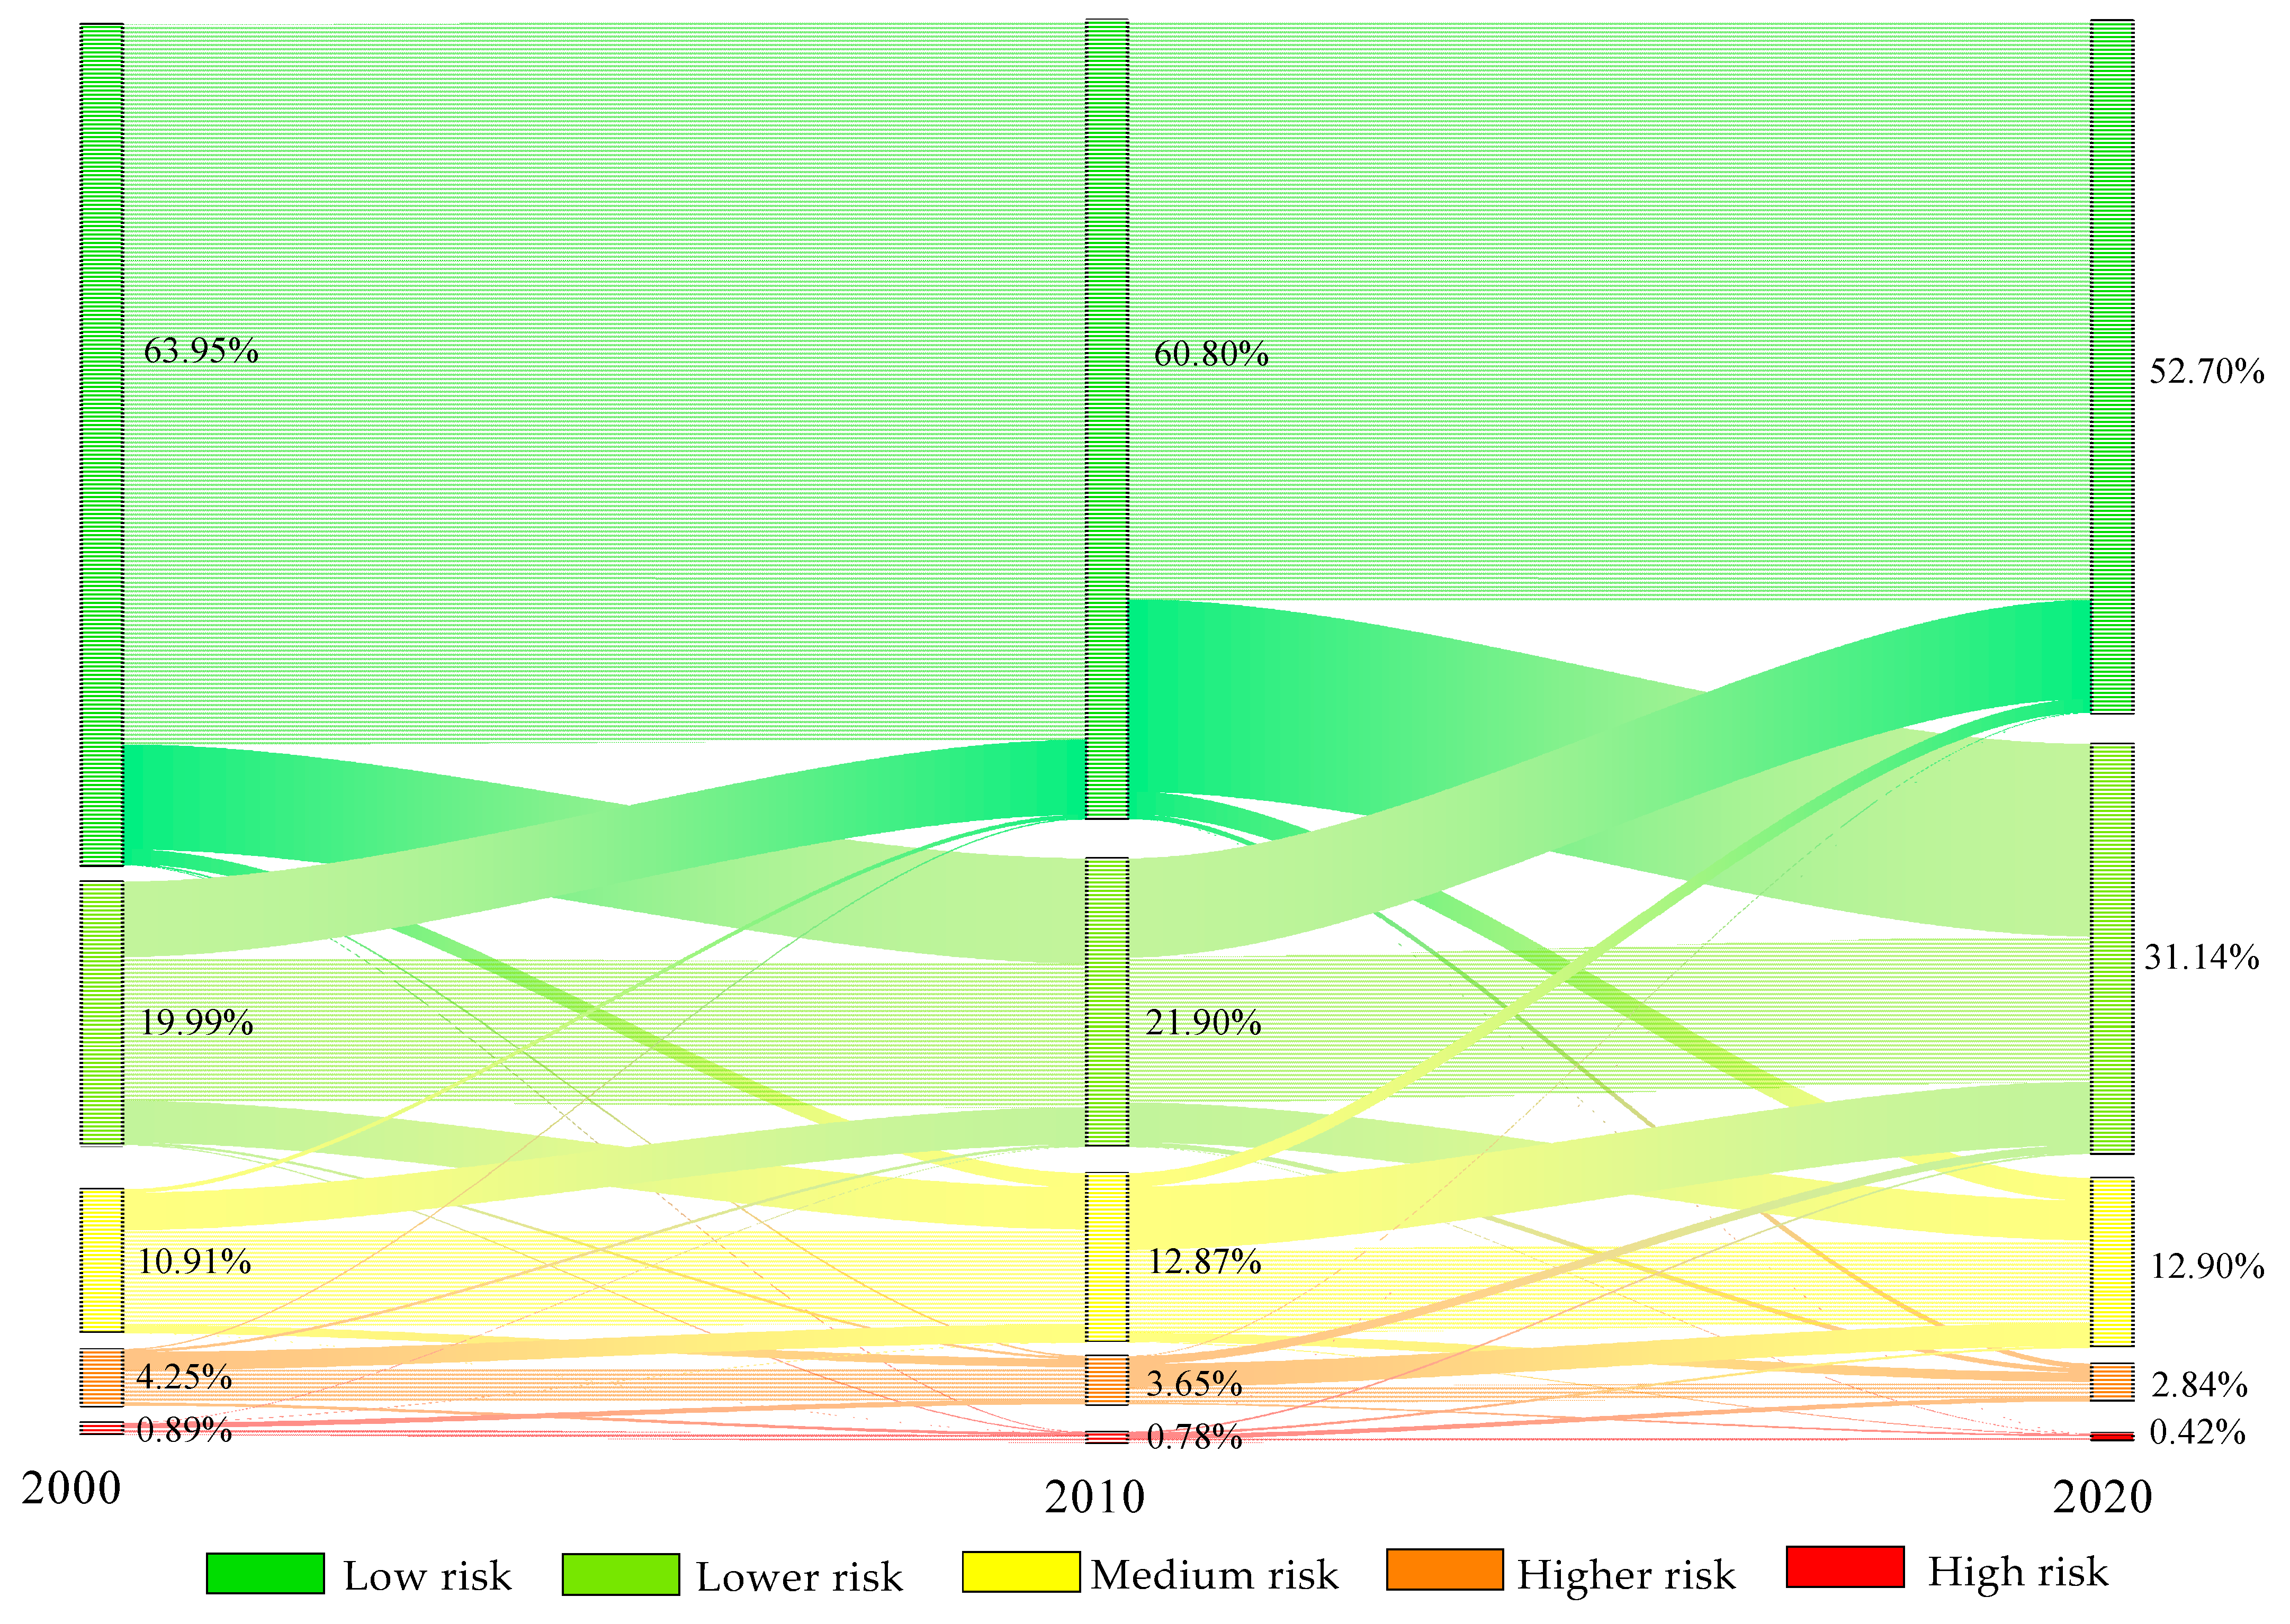
3.2. Landscape Ecological Risk Analysis

As can be seen from Figure 4 and Figure 5, the average LER level of the Yuanmou Basin increased slightly from 0.0287 in 2000 to 0.0291 in 2010 and 0.0297 in 2020. The LER values show that the Yuanmou Basin is dominated by low and lower ecological risk areas, with high-risk areas mainly in the central part of the Basin and low-risk areas in the peripheral regions of the Basin. The area of the low ecological risk zone decreased by 11.25% between 2000 and 2020, corresponding to an area decrease of 395.32 km2, mainly in the eastern and southern parts of Yuanmou County and the junction between counties in the peripheral areas of the Yuanmou Basin, which have relatively better climatic conditions due to the higher altitude and more rainfall. The area of the lower ecological risk zone increased by 11.15%, which was equivalent to an area expansion of 395.56 km2, mainly scattered in the surrounding regions of the low-risk zone in the study area. The area of the medium ecological risk zone increased by 1.99%, i.e., an area increase of 70.02 km2, concentrated in a continuous manner in the central areas of Yuanmou and Yongren counties. The higher-risk area decreased by 49.73 km2 (1.41%) mainly in the central and northern parts of Yuanmou County along the Jinsha and Longchuan rivers. The high-risk area decreased by 16.67 km2 (0.47%) mainly in the northern part of Yuanmou County at the confluence of the Jinsha and Longchuan rivers, where there is a large distribution of unused land and water bodies, and vegetation is scarce, making the landscape more fragile. This vulnerability contributes to landscape loss and ultimately leads to an increase in the LER.
The transitions between different LER levels in the Yuanmou Basin from 2000 to 2020 are shown in Figure 5, where it can be seen that the low ecological risk level mainly transferred to the lower ecological risk level, with a transfer area of 581.83 km2. The lower-risk level mainly transferred to the low- and medium-risk levels, with a transfer area of 241.88 and 109.72 km2, respectively. The above two risk level transitions indicate that the local LER of the Yuanmou Basin had been increasing. To maintain the stability of the regional ecology and to avoid further increase in the LER, special attention should be paid to the change in the landscape structure in the study area. In addition, the medium-risk level mainly transferred to the lower-risk level, with a transfer area of 151.63 km2, and the higher-risk level predominately transferred to the medium-risk level, with a transfer area of 75.47 km2. The high-risk level mainly transferred to medium- and higher-risk levels, with transfer area of 10.18 and 9.40 km2, respectively. In recent years, with the implementation of the Upper Yangtze River Protection Forest Project and the Return of Cultivated Land to Forests and Grasses Project, as well as the guidance of the Scientific Outlook on Development, the concept of sustainable and green development to maintain the virtuous cycle of the ecosystem has attracted considerable public attention. At the current stage, the monitoring of the LER transition from low to medium levels and from medium to high levels should be strengthened due to its special importance.

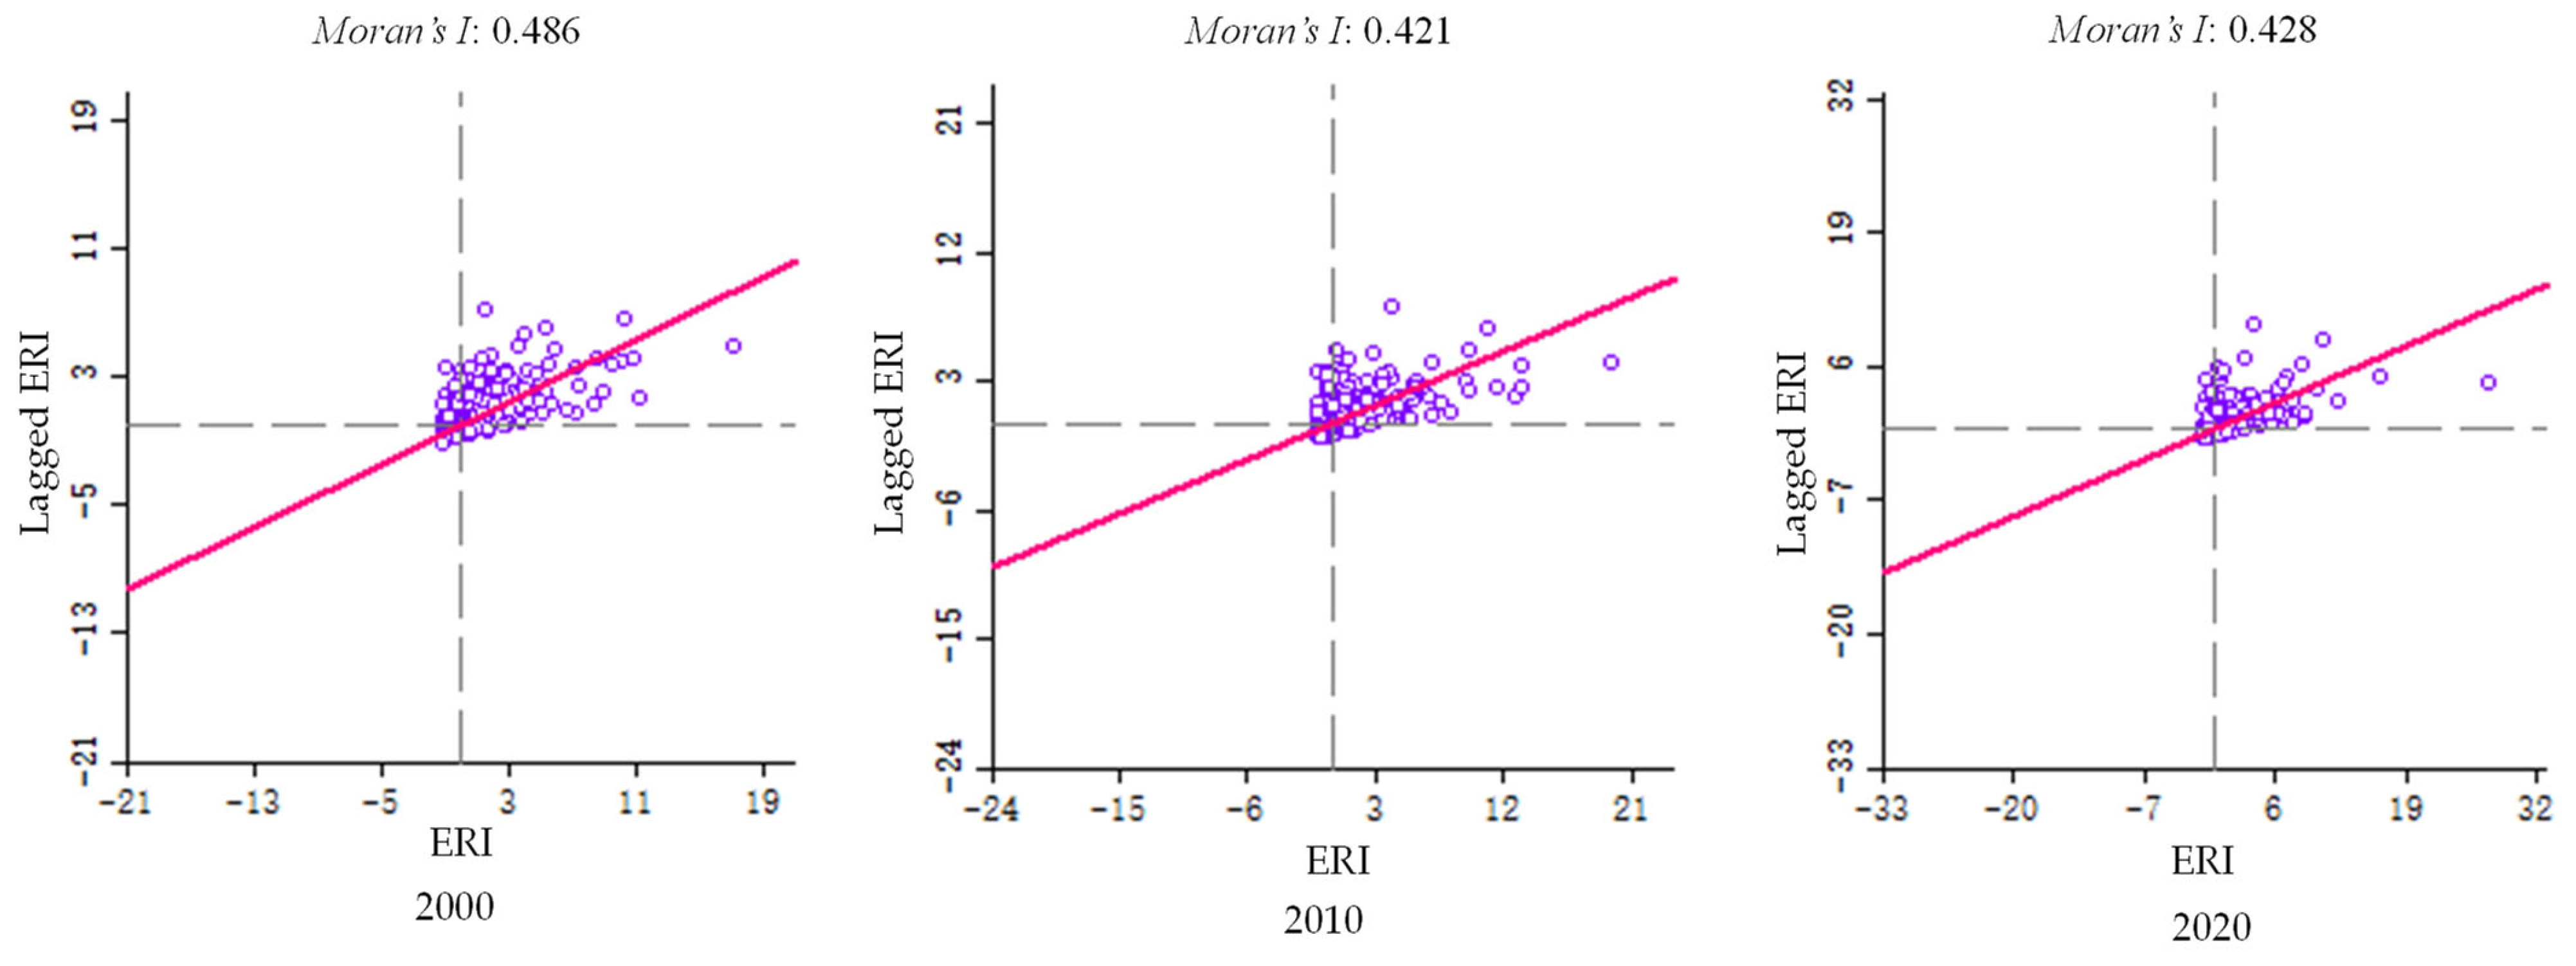
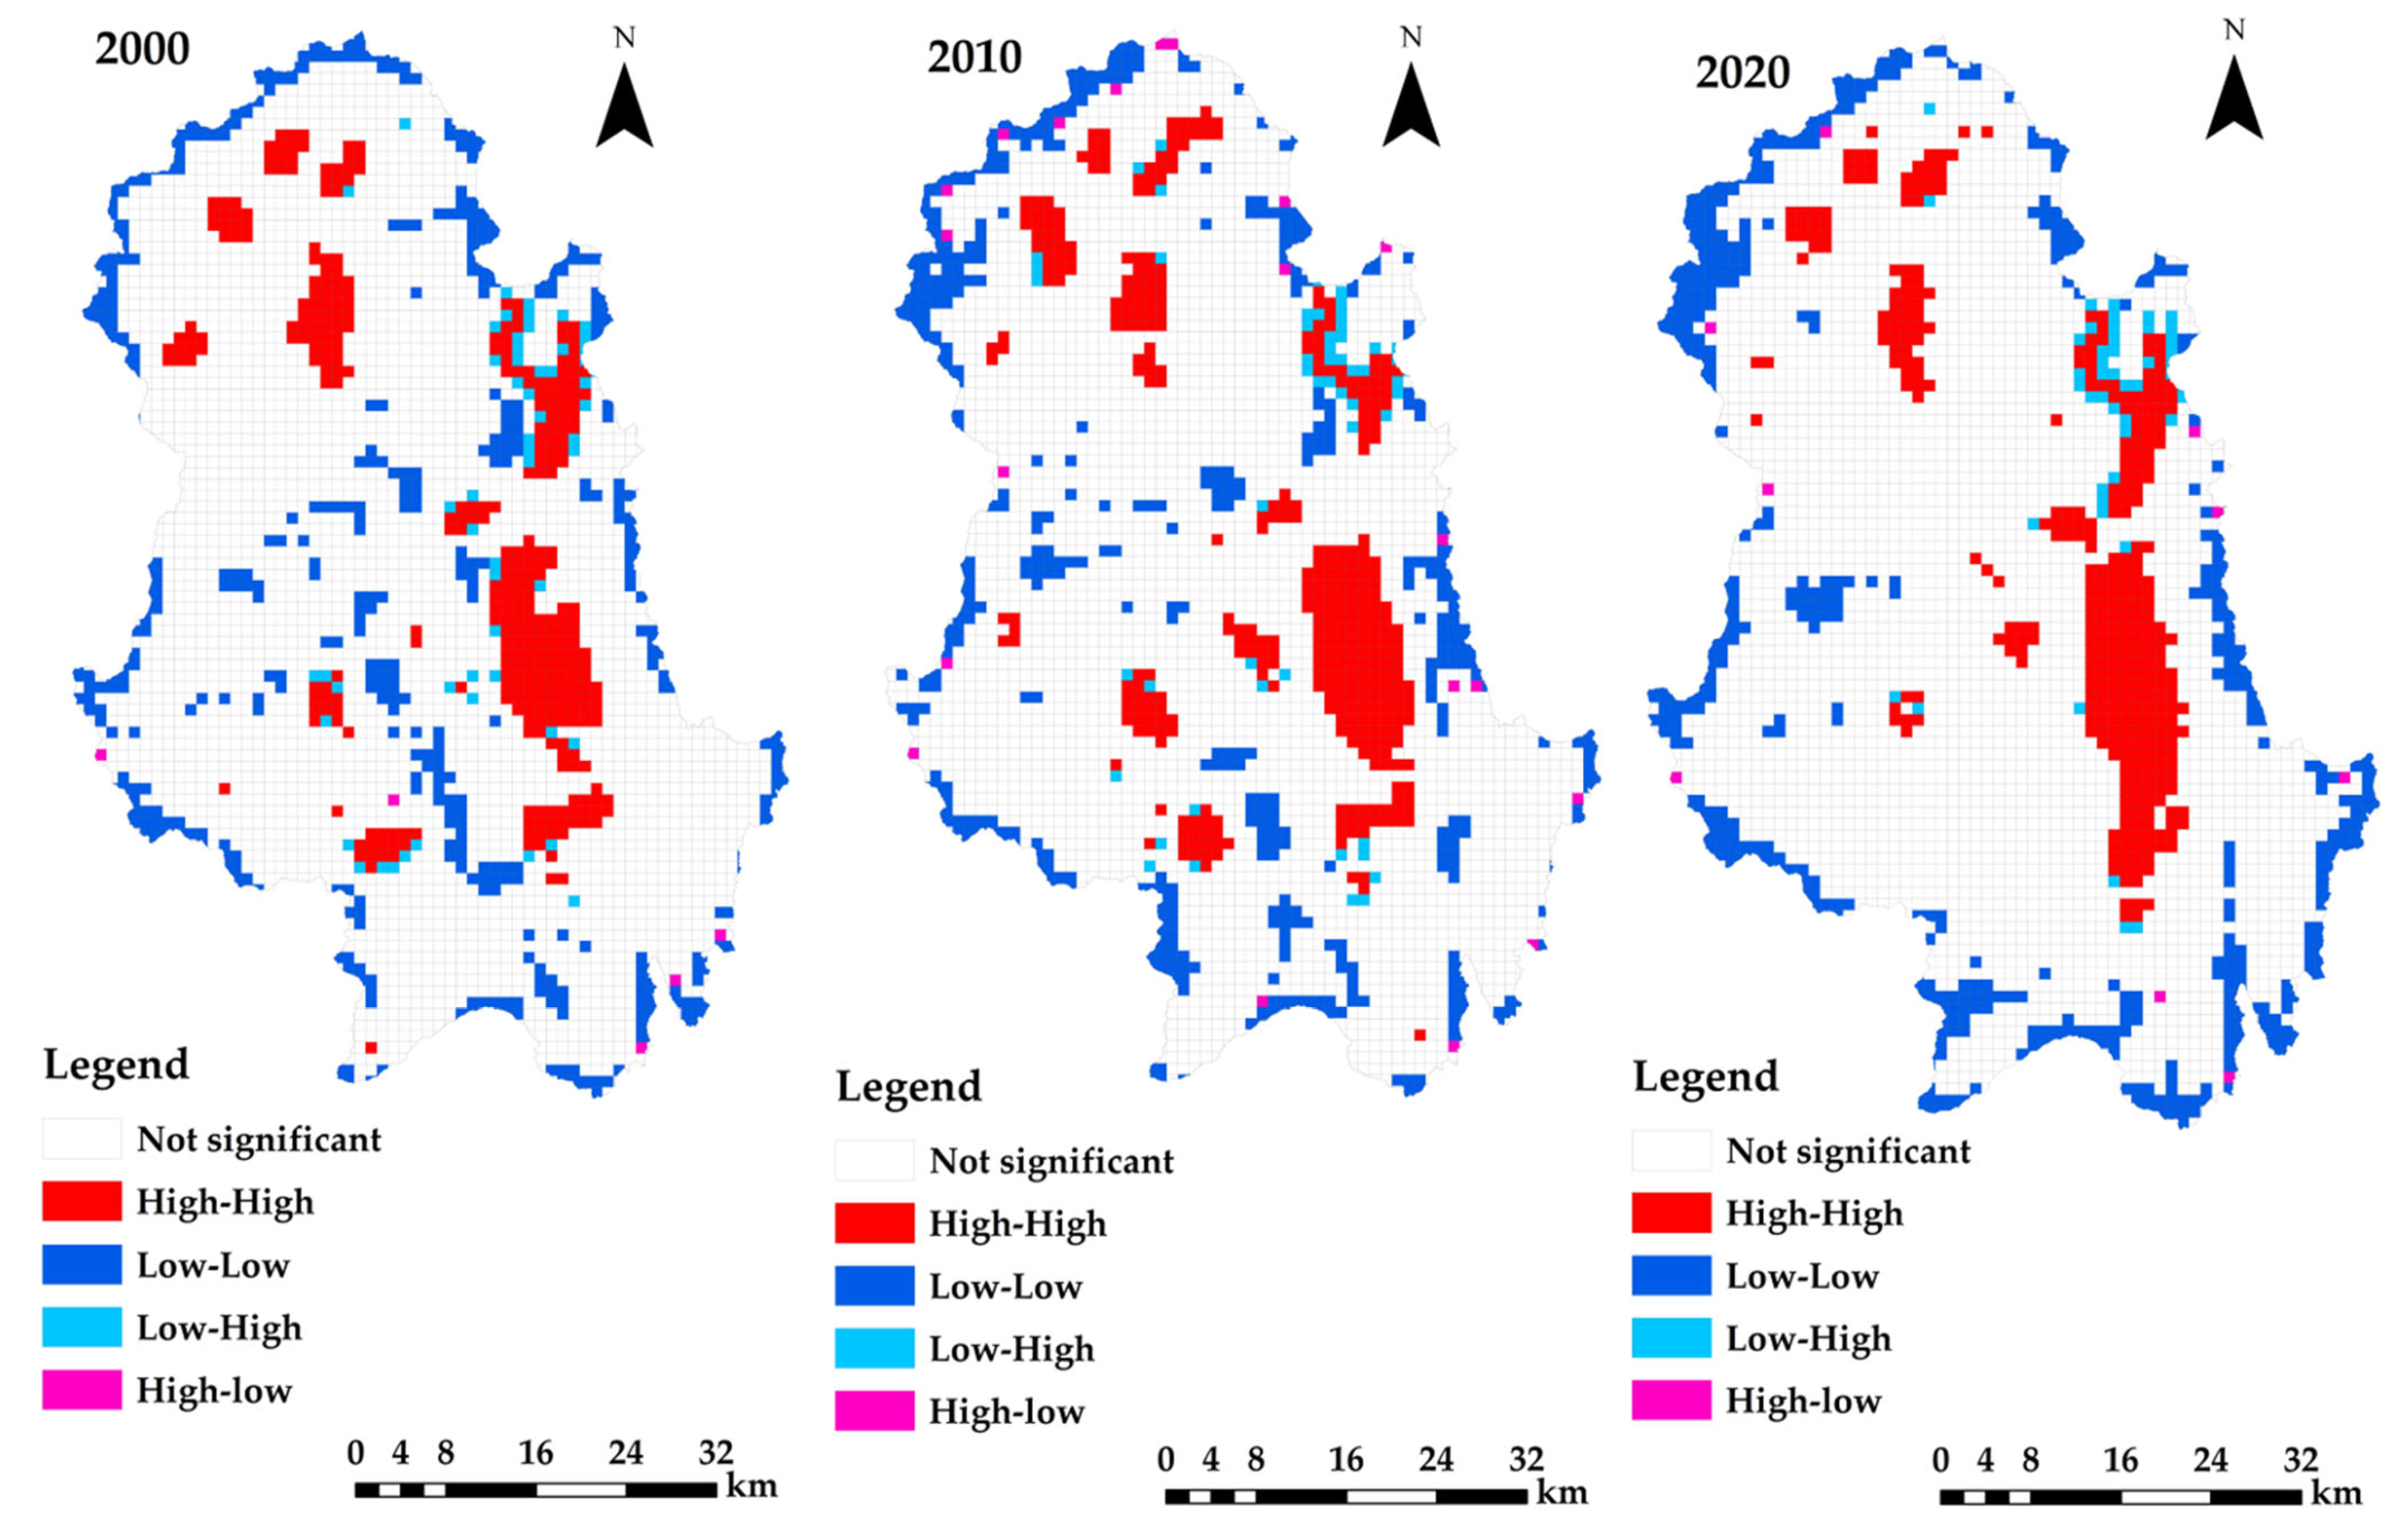
3.3. Spatial Autocorrelation Analysis of Ecological Risk in the Landscape

The GeoDa1.16.0 software was used to calculate the global Moran’s I index of LER values in each risk unit of the Yuanmou Basin. It can be seen from Figure 6 that the global Moran’s I indices in 2000, 2010 and 2020 are all greater than 0 and the p-values are all less than or equal to 0.001, indicating spatial aggregation, with similar levels of landscape ecological risk in adjacent spatial units. However, the index value decreases over time, indicating that the spatial neighboring units are weakening each other and the spatial aggregation is gradually decreasing.
LISA analysis on the ecological risk of the study area was also conducted using the GeoDa software. Figure 7 shows the results of the LISA analysis and the local spatial autocorrelation analysis. The high–high aggregation of ecological risk values in the study area is mainly distributed in the central and northern parts of Yuanmou County and the central part of Yongren County, where the ecological environment has become very fragile and the level of ecological risk has risen rapidly. The low–low aggregation is mainly distributed in the eastern and southern parts of Yuanmou County, the western parts of Dayao and Mouding Counties, and the western and northern parts of Yongren County in the marginal areas of the study area. The landscape types in this area are mainly woodland and grassland, which have high internal stability and are only weakly disturbed by human activities. Besides, the study area also has a small number of low–high and high–low aggregations, which show sporadically and irregular distribution behavior, with strong spatial heterogeneity and relatively stable changes over 20 years. With the implementation of ecological protection policies, the ecological environment in the study area has been continuously improved, and the ecological risks are stably maintained at low levels.

3.4. The Impact of Topography on Ecological Risk

3.4.1. Landscape Ecological Risk Characterization Based on Elevation Categories

The elevation of the Yuanmou Basin ranges from 882 to 2843 m (Figure 1). Dry–hot river valleys are dry thermal scrub landscape valleys located in humid climate zones of the tropics or subtropics [29]. With the increase in elevation, the temperature and dryness decrease, and the precipitation increases. This leads to a gradient change of the natural environment with elevation. The definition of the ranges of arid and non-arid thermal zones is mainly based on elevation. In this study, the influence of elevation on the distribution of LER levels was investigated in both dry–hot and non-dry–hot zones. As shown in Table 3 and Figure 8, the dry–hot zone in the Yuanmou Basin covers an area of 1514 km2 and the non-dry–hot zone has an area of 2001 km2, accounting for 43.07% and 56.93% of the total area studied in this work, respectively.
The LER of the dry–hot zone is mainly at low and lower levels. From 2000 to 2020, the proportion of lower- and medium-risk areas in the dry–hot zone increased from 18.67% to 34.67% and from 14.23% to 17.41%, respectively. It is mainly distributed in the central part of Yuanmou County. The proportion of the area with other LER levels decreased but the change was small. During the 20-year period, 56.16%, 78.67% and 86.78% of the total area of their risk zones were located within the dry heat zone for the medium risk, higher risk and high ecological risk zones. Similar to the dry–hot zone, the non-dry–hot zone is also dominated by low- and lower-risk level areas, which cover 67.49% and 28.51% of the total area, respectively. No less than 61.09% and 52.09% of the area at risk. It is mainly found in Yongren County and Dayao County. Generally, the overall composition of the areas with different LER levels in the dry–hot and non-dry–hot zones has remained relatively stable over the 20-year period, with low- and lower-risk areas as the main components in both zones. The medium-, higher- and high-risk areas of the Yuanmou Basin are mainly distributed in the dry–hot zone, while low- and lower-risk areas are mainly distributed in the non-dry–hot zone.

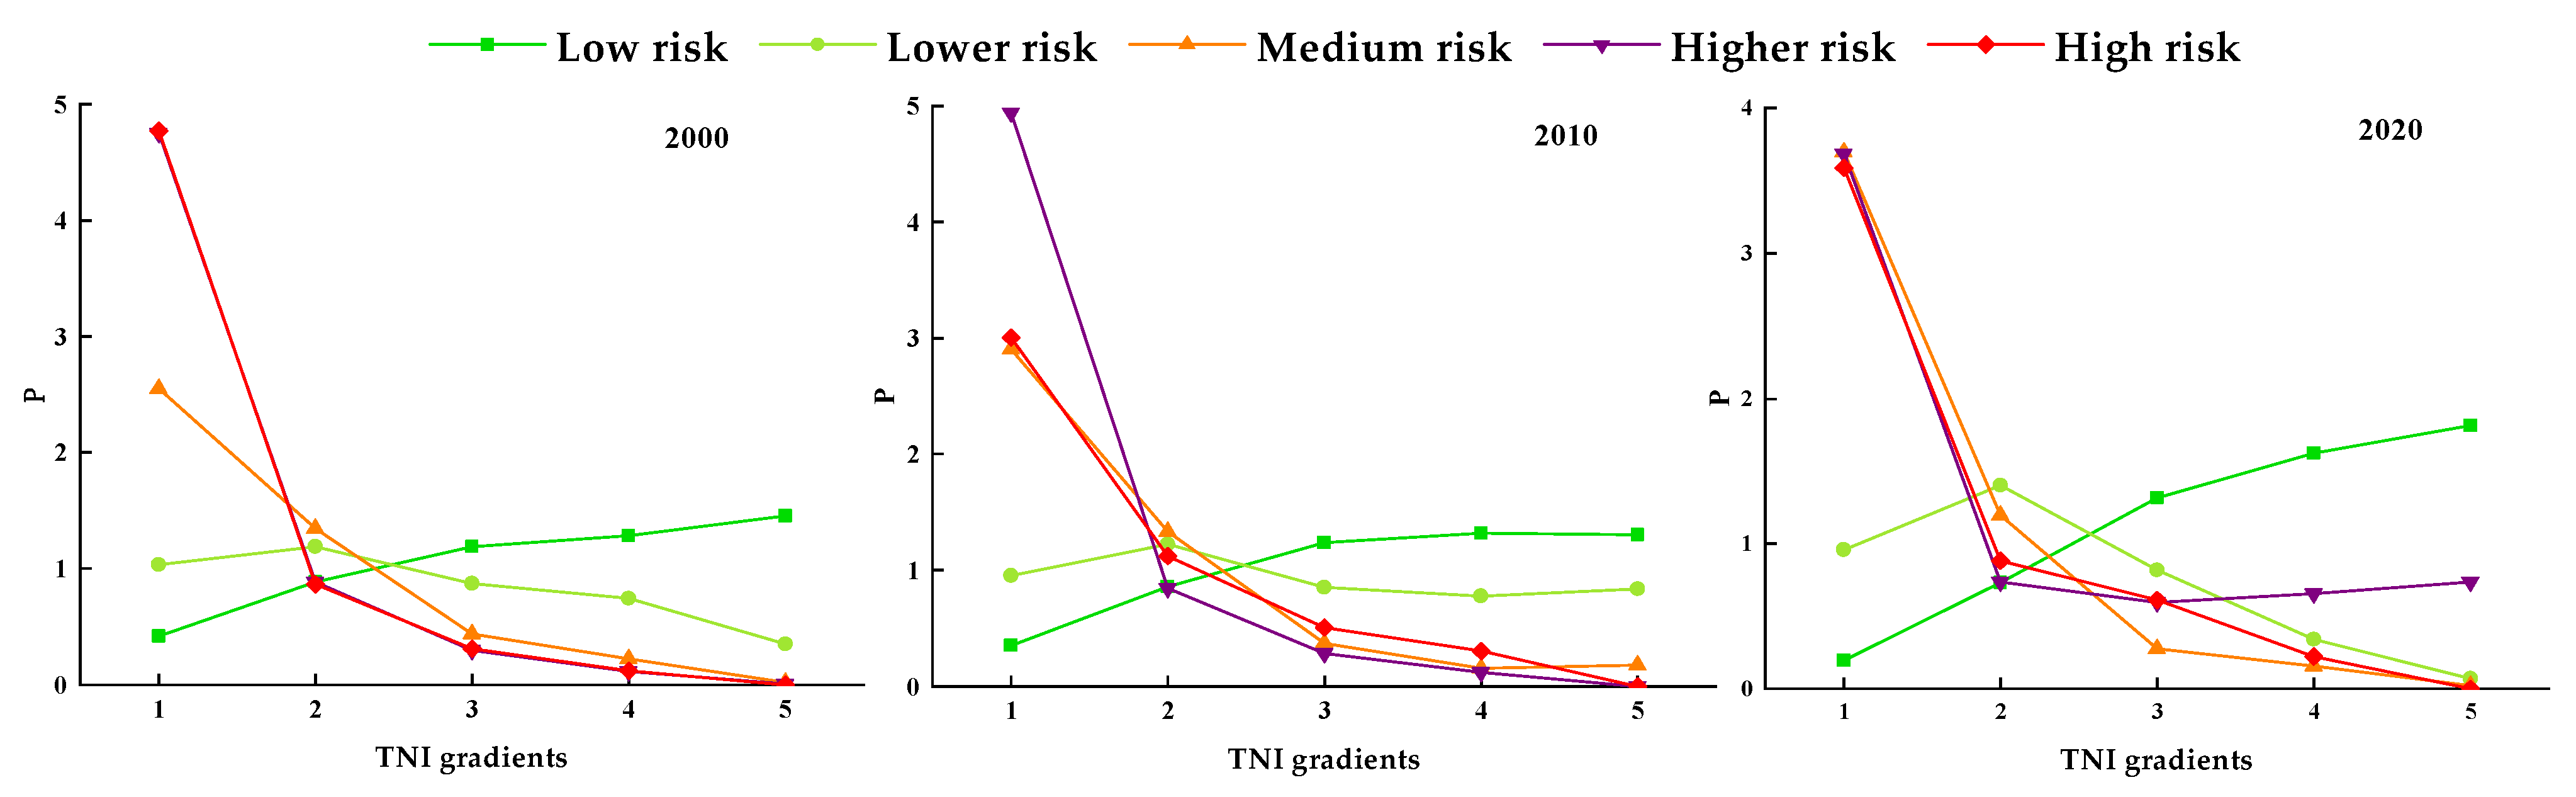
3.4.2. Distribution of Ecological Risk Levels under different Terrain Distribution Indices

It can be seen from Figure 9 that the terrain distribution index of low-risk areas increases with the terrain position index from 2000 to 2020. It is greater than 1 at the 3–5 terrain position interval, indicating that there is a higher terrain position index for low-risk areas, mainly because the higher-terrain areas are less affected by human activities. It is distributed in the high-altitude area of Yuanmou Basin. With the increase in the terrain position index, the distribution index of lower-risk areas first increases and then decreases. It is greater than 1 at the level 2 terrain position interval, suggesting that this interval is dominated by lower-risk areas. It is distributed in the central part of Yongren County. The distribution index of medium-risk areas tends to change consistently. It decreases with the increase in the topographic position index, and it is greater than 1 between the 1 and 2 level terrain position zones, indicating that these zones are dominated by medium-risk areas. It is distributed in the central part of Yuanmou County. The distribution indices of higher- and high-risk areas decrease as the terrain position index increases, and they are greater than 1 at the level 1 terrain position interval, demonstrating that this interval is dominated by higher- and high-risk areas. The medium-high and high-risk zones are mainly distributed in the central part of Yuanmou County. In general, low-risk areas are more concentrated at high terrain positions, and lower-risk areas are spread across all terrain positions. The medium-, higher- and high-risk areas are distributed at low terrain positions. This can be explained by the fact that human activities are mainly concentrated in the lower terrains of the flat dams and river valleys, impacting the ecological environment of these areas, while the higher-terrain zones are less affected by human disturbances. This makes the distribution of ecological risk areas distinctly different between low- and high-terrain areas.

4. Discussion

4.1. Landscape Ecological Risks in Response to Land Use Change

LER assessment based on land-use change is an effective method to evaluate the spatial and temporal distribution and evolution characteristics of regional landscape features [53,54]. Previous studies have shown that land use change can lead to variation in landscape patterns, impacting ecological security and health [55,56]. Therefore, we constructed an assessment model based on the landscape pattern index to investigate the correlation between land use change and landscape ecological risk, providing an efficient and convenient procedure for assessing the spatial and temporal variability characteristics of LER. The assessment model has been widely used for evaluation of LER caused by land use change [57,58]. The LER pattern in the Yuanmou Basin has obvious spatial differentiation characteristics, with an overall trend of high in the center and low in the surroundings, which can be related to the distribution of different land use types. The central part of the study area shows main land use types of arable land, construction land and unused land. Especially in the built-up areas of towns where buildings are relatively dense, the LER is significantly higher than that in other regions. In the surrounding areas, the land use types are mainly woodland and grassland, with higher habitat quality and lower ecological risk of the landscape. From 2000 to 2020, the average LER values in the study area have continued to increase slightly over time. The area of high-, higher- and low-risk levels decreased significantly, while the medium- and lower-risk area expanded dramatically. Variations in LER are significantly influenced by land use change and government policy. Since the end of the last century, in order to fundamentally prevent the rapid deterioration of the ecological environment and to mitigate the contradictions between socio-economic development and ecological protection, the Chinese government has been implementing the projects of “Protected Forests in the Middle and Upper Reach of the Yangtze River” and “Returning Farmland to Forests and Grass”. This has successfully improved the quality of the ecological environment and reduced the ecological risk of the landscape [59,60], which are reflected in the gradual increase in the proportion of forested land and the total area of low- and lower-risk levels in the Yuanmou Basin. The implementation of a series of government policies has led to land use changes, ecological improvements and effective control of ecological risks in the landscape [61]. However, it is noteworthy that, from 2010 to 2020, the medium-risk area in the central part of the Yuanmou Basin increased significantly because of the flat gullies and gardens project model that was started in 2010 by enterprises and farmers in the region, which used large machinery to develop and exploit eroded and poor land in gullies on a larger scale and planted larger areas to huge economic benefits [62,63].This development model has led to a rapid expansion of cultivated and built-up land in the region and increased fragmentation of the land landscape, resulting in increased ecological risks of the landscape.

4.2. Influence of Terrain Gradients on the Distribution of Ecological Risks

Previous studies have shown that terrain features determine land use patterns and vegetation community distribution, so terrain is one of the main drivers of spatial land use distribution [44,63], and LER is closely related to land use change. Therefore, the influence of terrain on the ecological environment cannot be ignored [64]. Due to the undulating topography and the obvious vertical climatic zonation, the Yuanmou Basin shows a complex distribution of LER with the change in terrain. The land use landscape pattern of the basin has changed dramatically with the population expansion to meet the demands of production and livelihoods. The high-, higher- and medium-risk areas in this region are dominated by the distribution index in the 1st order terrain gradient and the dry–hot zone. Since 2010, the basin has been subjected to a large-scale gully levelling project, which has greatly reduced the area of grassland and increased the areas of arable land and building land. The disruption of the original landscape pattern resulted in a staggered distribution of various land use types [65], and deteriorated landscape structure and stability. This has led to an abnormal increase in the ecological risk index in the 1st order terrain gradient and the dry heat zone. Over time, the cumulative hazard effect on ecological components becomes apparent, causing an increase in the medium-risk distribution index of this region, growth in the proportion of medium-risk areas, and a decline in the ecological stability, which can seriously impact the overall ecological risk [41]. This suggests that human activity in the Yuanmou Basin is the main external factor for the aggravation of ecological risk in the landscape. The lower-risk areas dominate the two terrain gradients and non-dry–hot zones with a distribution index greater than 1. The lower-risk areas dominate the 3–5 terrain gradients and non-dry–hot zones with a distribution index greater than 1. As this region is dominated by forests and grasslands at higher altitudes, it is less susceptible to human activities and the land use types do not change frequently, maintaining a stable landscape structure. Moreover, since the end of the last century, a series of ecological forest protection measures have been carried out in this region, which has increased the area of woodland and effectively restored the vegetation cover in the high-altitude areas. The results of the study show that the high-risk areas are mainly located in the dry–hot zone and the low terrain zone, which are heavily disturbed by human activities. The distribution of ecological risk with terrain gradients is mainly limited by climatic and topographic factors [66], while terrain conditions and disturbance from human activities are the main factors causing the increase in ecological risk. Therefore, based on the LER assessment results, effective environmental protection and improvement measures should be developed and implemented to mitigate the impact of human activities on the ecosystem [67].

4.3. Enlightenment and Limitation

The Yuanmou Basin, which ranges from low to high altitudes and changes in climate from dry and hot to humid, exhibits the specificity of synergistic evolution with the topographic gradient. In this work, the spatial heterogeneity of LER in the study area is analyzed from a multidimensional perspective [68]. The results are valuable for rationalizing and coordinating the distribution patterns of each land use type under different topographic conditions, which contribute to sustainable socio-economic and territorial spatial development of the study area. However, there are still some limitations. Firstly, the results of LER are highly dependent on the accuracy of land use classification [50], but the land use in the Yuanmou Basin changes rapidly and intensely. Therefore, improvement of the land use data accuracy is of great importance in future work to reduce the uncertainty of LER [69]. Secondly, determination of the best evaluation unit is an important basis for improving the spatial accuracy of ecological risk [46]. Finally, quantification of the value of ecosystem services should be incorporated into the system of ecological risk assessment in the future.

5. Conclusions

In this study, the Yuanmou Basin was selected as the research object, and the land use data during the three periods of 2000, 2010 and 2020 were used to construct a LER assessment model. Combined with the elevation and terrain position indices, to explore the spatial and temporal evolution of the LER under different terrain gradients. The conclusions from this study are summarized as follows:
(1) From 2000 to 2020, the land use types in the Yuanmou Basin were mainly grassland, forest land and arable land, with the area of forest land, construction land, water bodies and arable land increasing and the area of grassland and unused land decreasing. The transfer of land use types was mainly from grassland, forest land and cropland to construction land, and from grassland to forest land and cropland, with the largest area of grassland converted to cropland.
(2) During the 20-year period, the average value of LER in the study area increased slightly, specifically in the form of a decrease in low-, higher- and high-risk areas, and an increase in medium- and lower-risk areas. The transfer of medium-risk areas is more complicated.
(3) The spatial distribution pattern of LER in Yuanmou Basin was characterized to be low surrounding and high middle, with significant positive spatial correlation and obvious spatial aggregation, mostly dominated by “high-high” and “low-low” clustering. However, the spatial aggregation and spatial autocorrelation of LER decreased during the 20-year period.
(4) From 2000 to 2020, the LER levels and their changes in the study area differed significantly across the terrain gradients. Low- and lower-risk areas are distributed in the non-arid thermal zone and the medium–high terrain gradient, while medium-, higher- and high-risk areas are mainly distributed in the arid thermal zone and the low terrain gradient.
Comprehensively considering the distribution of LER levels in the Yuanmou Basin on the topographic gradient, future land policies may be tailored according to the topographic gradient. The low-altitude and low-topographic gradient areas of the Yuanmou Basin are the main distribution zones of medium-to-high-risk areas, and also the key areas for adjusting land policies. In this area, the speed at which farmland encroaches on grassland should be slowed down, and land should be planned and utilized scientifically and reasonably to suppress the spread of high-risk areas to high-altitude and high-topographic gradient areas. In the high-altitude and high-topographic gradient areas of the Yuanmou Basin, soil and water conservation work should be done well, and the construction of protective forests and the orderly implementation of the “Returning Farmland to Forest and Grass” project should be strengthened. These measures will reduce human interference in the ecological environment, focus on the development of ecological benefits and suppress the transformation of slightly low-risk areas into medium-risk areas.

Author Contributions

Collect and analyze data, L.Z.; Paper Writing, L.Z.; Methodology, L.Z. and Z.S.; Thesis conception and design, Z.S.; Validation, G.H. and Q.J.; Data curation, L.Z. and Q.J.; Data Acquisition, G.H. and Q.J.; Data Analysis, L.H.; Visualization, L.Z. and L.H.; Writing Revision, W.X. All authors have read and agreed to the published version of the manuscript.

Funding

This study was funded by the Yunnan Provincial Science and Technology Basic Research Program Project (Grant No. 202101AS070019), and the Natural Ecological Monitoring Network Monitoring Project of Yunnan Province (Grant No. 2023-YN-18), and the Yunnan Normal University Graduate Student Research Innovation Fund (Grant No. YJSJJ23-B152), and the Yunnan Normal University Graduate Student Research Innovation Fund (Grant No. YJSJJ23-A23).

Data Availability Statement

All relevant data sets in this study are described in the manuscript.

Conflicts of Interest

The authors declare no conflict of interest.

References

  1. Cheng, Y.; Song, W.; Yu, H.; Wei, X.; Sheng, S.; Liu, B.; Gao, H.; Li, J.; Cao, C.; Yang, D. Assessment and Prediction of Landscape Ecological Risk from Land Use Change in Xinjiang, China. Land 2023, 12, 895. [Google Scholar] [CrossRef]
  2. Gao, H.; Song, W. Assessing the Landscape Ecological Risks of Land-Use Change. Int. J. Environ. Res. Public Health 2022, 19, 13945. [Google Scholar] [CrossRef] [PubMed]
  3. Cao, C.; Song, W. Progress and prospect of ecological risks of land use change. Front. Environ. Sci. 2022, 10, 2392. [Google Scholar] [CrossRef]
  4. Qiu, M.; Zuo, Q.; Wu, Q.; Yang, Z.; Zhang, J. Water ecological security assessment and spatial autocorrelation analysis of prefectural regions involved in the Yellow River Basin. Sci. Rep. 2022, 12, 5105. [Google Scholar] [CrossRef] [PubMed]
  5. Wang, F.C.; Wang, D.C.; Zhang, L.H.; Liu, J.; Hu, B.; Sun, Z.; Chen, J. Spatiotemporal analysis of the dynamic changes in land use ecological risks in the urban agglomeration of Beijing-Tianjin-Hebei vegion. Acta Ecol. Sin. 2018, 38, 4307–4316. [Google Scholar]
  6. He, S.; Li, X.; He, C.; Fang, B. Landscape Ecological Risk Assessment in Guangling District of Yangzhou City Based on Land Use Change. J. Nanjing Norm. Univ. (Nat. Sci. Ed.) 2019, 42, 139–148. [Google Scholar]
  7. Lin, X.; Wang, Z. Landscape ecological risk assessment and its driving factors of multi-mountainous city. Ecol. Indic. 2023, 146, 109823. [Google Scholar] [CrossRef]
  8. Liu, H.; Hao, H.; Sun, L.; Zhou, T. Spatial–Temporal Evolution Characteristics of Landscape Ecological Risk in the Agro-Pastoral Region in Western China: A Case Study of Ningxia Hui Autonomous Region. Land 2022, 11, 1829. [Google Scholar] [CrossRef]
  9. Calow, P. Ecological risk assessment: Risk for what? How do we decide? Ecotoxicol. Environ. Saf. 1998, 40, 15–18. [Google Scholar] [CrossRef]
  10. Rodier, D.; Norton, S. Framework for Ecological Risk Assessment; Environmental Protection Agency: Washington, DC, USA, 1992. [Google Scholar]
  11. Wang, Y.; Liu, Y.; Zhao, H.; Wu, G.Y.; Yang, Y.; Zhang, F. Water Quality Assessment and Characteristics of Water Pollution of Sand Lake in Ningxia. Wetl. Sci. 2020, 18, 362–367. [Google Scholar] [CrossRef]
  12. Han, S.; Wang, C.; Liu, X.; Yu, Y.; Xu, M.; Shang, Q. On Distribution Characteristics and Pollution Evaluation of Soil Heavy in Rice Producing Areas of Lianyungang. J. Southwest China Norm. Univ. Nat. Sci. Ed. 2021, 46, 74–78. [Google Scholar] [CrossRef]
  13. Jia, J.; Liu, X.; Zhao, Y.R. Zeying. Spatial distribution characteristics and assessment of heavy metal pollution in farmland soils in the lower reaches of Fenhe river basin. J. Arid. Land Resour. Environ. 2021, 35, 132–137. [Google Scholar] [CrossRef]
  14. Gong, J.; Zhao, C.; Xie, Y.; Gao, Y. Ecological risk assessment and its management of Bailongjiang watershed, southern Gansu based on landscape pattern. Yingyong Shengtai Xuebao 2014, 25, 2041–2048. [Google Scholar] [PubMed]
  15. Wu, J.; Zhu, Q.; Qiao, N.; Wang, Z.; Sha, W.; Luo, K.; Wang, H.; Feng, Z. Ecological risk assessment of coal mine area based on “source-sink” landscape theory—A case study of Pingshuo mining area. J. Clean. Prod. 2021, 295, 126371. [Google Scholar] [CrossRef]
  16. Zhang, W.; Chang, W.J.; Zhu, Z.C.; Hui, Z. Landscape ecological risk assessment of Chinese coastal cities based on land use change. Appl. Geogr. 2020, 117, 102174. [Google Scholar] [CrossRef]
  17. Zhang, X.; Yao, L.; Luo, J.; Liang, W. Exploring Changes in Land Use and Landscape Ecological Risk in Key Regions of the Belt and Road Initiative Countries. Land 2022, 11, 940. [Google Scholar] [CrossRef]
  18. Jing, P.; Zhang, D.; Ai, Z.; Guo, B. Natural landscape ecological risk assessment based on the three-dimensional framework of pattern-process ecological adaptability cycle:a case in Loess Plateau. Acta Ecol. Sin. 2021, 41, 7026–7036. [Google Scholar]
  19. Fu, W.; Lu, Y.-H.; Fu, B.-J.; Hu, W.-Y. Landscape Ecological Risk Assessment Under the lnfluence of Typical Human Activities in Loess Plateau, Northern Shaanxi. J. Ecol. Rural. Environ. 2019, 35, 290–299. [Google Scholar] [CrossRef]
  20. Cui, L.; Zhao, Y.; Liu, J.; Han, L.; Ao, Y.; Yin, S. Landscape ecological risk assessment in Qinling Mountain. Geol. J. 2018, 53, 342–351. [Google Scholar] [CrossRef]
  21. Zhang, X.; Shi, P.; Luo, J. Landscape ecological risk assessment of the Shiyang River basin. In Proceedings of the Geo-Informatics in Resource Management and Sustainable Ecosystem: International Symposium, GRMSE 2013, Wuhan, China, 8–10 November 2013; Proceedings, Part II 1. pp. 98–106. [Google Scholar]
  22. Sui, X.; Wang, K.; Zheng, S.; An, S.; Li, L. Effects of landscape fragmentation on genetic diversity of Stipa krylovii roshev (Stipa L.) in agro-pastoral ecotone in Northern China. Afr. J. Biotechnol. 2009, 8, 3431–3439. [Google Scholar]
  23. Song, G.; Wang, P.; Wang, Y. Land-Use Types Change Characteristics and Spatial Heterogeneity in Bayan of Heilongjiang Province. Econ. Geogr. 2015, 35, 163–170. [Google Scholar] [CrossRef]
  24. Zheng, K.; Li, C.; Wu, Y.; Gao, B.; Li, C.; Wu, Y. Temporal and spatial variation of landscape ecological risk and influential factors in Yunnan border mountainous area. Acta Ecol. Sin. 2022, 42, 7458–7469. [Google Scholar]
  25. Lin, G.; Cai, H.; Kang, W.; Wu, Y.; Wang, Y. The study on dynamic change of the hillsides landscape feature in the middle and upper reaches of Chishui River. Ecol. Sci. 2019, 38, 151–159. [Google Scholar] [CrossRef]
  26. Yan, Y.; Yang, L.; Wang, W.; Fang, H.; Zhuang, Q. Analysis of spatial-temporal variation of landscape ecological risk and its terrain gradient in lli valley. Ecol. Sci. 2020, 39, 125–136. [Google Scholar] [CrossRef]
  27. Hu, J.L.; Zhou, Z.X.; Teng, M.; Luo, N. Ecological risk assessment of typical karst basin based on land use change:A case study of Lijiang River basin, Southern China. Chin. J. Appl. Ecol. 2017, 28, 2003–2012. [Google Scholar] [CrossRef]
  28. Liu, D.; Chen, H.; Zhang, M.; Shang, S.; Liang, X. Analysis of Spatial-temporal Distribution of Landscape Ecological Risk in EcologicallyVulnerable Areas and lts Terrain Gradient—A Case Study of Mizhi County of Shaanxi Province. Res. Soil Water Conserv. 2019, 26, 239–244+251. [Google Scholar] [CrossRef]
  29. Ming, Q.; Shi, Z. New Discussion on Dry Valley Formation in the Three Parallel Rivers Region. J. Desert Res. 2007, 27, 99–104. [Google Scholar]
  30. Xu, Y.-J.; Yang, S.-W.Z.; Sun, J.-M.; Yong, Y.; Yang, X.-B.; Zhao, O. Topographic effect of county-level land-use landscape pattern in the dry-hot valley of Jinsha River, Yunnan Province. Chin. J. Ecol. 2022. [Google Scholar]
  31. Liu, L.; Xiong, D.Z.; Li, W.; Yuan, Y.; Zhang, B.; Zhang, X. Benefits and ecological risks of Gully Reclamation Project in Yuanmou Dry-hot Valley region. Trans. Chin. Soc. Agric. Eng. 2020, 36, 251–258. [Google Scholar]
  32. Cheng, L.-L.; Liu, H.; Liu, Y.-X. Track the county level landscape pattern change in semiarid region: A case study in Yanchi county, Ningxia, Northwest China. J. Nat. Resour. 2019, 34, 1066–1078. [Google Scholar]
  33. Li, Z.-Y.; Shi, P.-J. Spatial Pattern Changes and Influencing Factors of Urban-Rural Construction Land Development lntensity in the Lanzhou-Xining Urban Agglomeration. J. Ecol. Rural. Environ. 2020, 36, 450–458. [Google Scholar] [CrossRef]
  34. Ou, Z.; Zhu, Q.; Sun, Y. Temporal and spatial variation of landscape ecological security in Yuanmou Dry-hot Vallley. Sci. Soil Water Conserv. 2018, 16, 131–140. [Google Scholar] [CrossRef]
  35. Liang, Q.; Shi, Z.; Chen, Y.; He, G.; Shi, L.; Li, J. Ecological Environmental Dynamic Monitoring and Driving Force Analysis of Yuanmou Dry-hot Valley Based on Remote Sensing Ecological Index. Bull. Soil Water Conserv. 2022, 42, 146–154+181. [Google Scholar] [CrossRef]
  36. Di, B.; Cui, P.; Huang, S.; Yu, Y. Sediment yields and impact factors in xerothermic valley in Jinsha River in the last 50 years: A Case study in Yuanmou County, Yunnan Province. Sci. Soil Water Conserv. 2006, 4, 20–24+34. [Google Scholar] [CrossRef]
  37. He, J.; Su, C.; Shu, L.; Yang, Z. A 3S-Based Study on Landuse and Land Cover Change in the Jinshajiang Xerothermic Valley—A Case of Yuanmou County, Yunnan Province. Mt. Res. 2009, 27, 341–348. [Google Scholar]
  38. Wang, Z.; Shi, P.; Zhang, X.; Yao, L.; Tong, H. Grid-scale-based ecological security assessment and ecological restoration:A case study of Suzhou district, Jiuquan. J. Nat. Resour. 2022, 37, 2736–2749. [Google Scholar] [CrossRef]
  39. Ji, Y.; Bai, Z.; Hui, J. Landscape Ecological Risk Assessment Based on LUCC—A Case Study of Chaoyang County, China. Forests 2021, 12, 1157. [Google Scholar] [CrossRef]
  40. Liu, X.; Li, X.; Jiang, D. Landscape pattern identification and ecological risk assessment using land-use change in the Yellow River Basin. Trans. Chin. Soc. Agric. Eng. 2021, 37, 265–274. [Google Scholar]
  41. Li, W.; Wang, Y.; Xie, S.; Sun, R.; Cheng, X. Impacts of landscape multifunctionality change on landscape ecological risk in a megacity, China: A case study of Beijing. Ecol. Indic. 2020, 117, 106681. [Google Scholar] [CrossRef]
  42. Karimian, H.; Zou, W.; Chen, Y.; Xia, J.; Wang, Z. Landscape ecological risk assessment and driving factor analysis in Dongjiang river watershed. Chemosphere 2022, 307, 135835. [Google Scholar] [CrossRef]
  43. Li, J.; Pu, R.; Gong, H.; Luo, X.; Ye, M.; Feng, B. Evolution Characteristics of Landscape Ecological Risk Patterns in Coastal Zones in Zhejiang Province, China. Sustainability 2017, 9, 584. [Google Scholar] [CrossRef]
  44. Gao, B.; Wu, Y.; Li, C.; Zheng, K.; Wu, Y.; Wang, M.; Fan, X.; Ou, S. Multi-Scenario Prediction of Landscape Ecological Risk in the Sichuan-Yunnan Ecological Barrier Based on Terrain Gradients. Land 2022, 11, 2079. [Google Scholar] [CrossRef]
  45. Wang, S.; Tan, X.; Fan, F. Landscape Ecological Risk Assessment and Impact Factor Analysis of the Qinghai–Tibetan Plateau. Remote Sens. 2022, 14, 4726. [Google Scholar] [CrossRef]
  46. Wang, J.; Bai, W.; Tian, G. Spatiotemporal characteristics of landscape ecological risks on the Tibetan Plateau. Resour. Sci. 2020, 42, 1739–1749. [Google Scholar] [CrossRef]
  47. Qiu, B.; Wang, Q.; Chen, C.; Chi, T. Spatial Autocorrelation Analysis of Multi-scale Land Use in Fujian Province. J. Nat. Resour. 2007, 22, 311–321. [Google Scholar]
  48. Gong, W.; Wang, H.; Wang, X.; Fan, W.; Stott, P. Effect of terrain on landscape patterns and ecological effects by a gradient-based RS and GIS analysis. J. For. Res. 2017, 28, 1061–1072. [Google Scholar] [CrossRef]
  49. Wang, Z.; Shi, P.; Shi, J.; Zhang, X.; Yao, L. Research on Land Use Pattern and Ecological Risk of Lanzhou–Xining Urban Agglomeration from the Perspective of Terrain Gradient. Land 2023, 12, 996. [Google Scholar] [CrossRef]
  50. Xue, L.; Zhu, B.; Wu, Y.; Wei, G.; Liao, S.; Yang, C.; Wang, J.; Zhang, H.; Ren, L.; Han, Q. Dynamic projection of ecological risk in the Manas River basin based on terrain gradients. Sci. Total Environ. 2019, 653, 283–293. [Google Scholar] [CrossRef] [PubMed]
  51. Zang, Y.; Liu, Y.; Yang, Y. Land use pattern change and its topographic gradient effect in the mountainous areas:A case study of Jinggangshan city. J. Nat. Resour. 2019, 34, 1391–1404. [Google Scholar]
  52. Jin, Z. The floristic study on seed plants in the dry-hot valleys in Yunnan and Sichuan. Guihaia 1999, 19, 1–14. [Google Scholar]
  53. Zeng, C.; He, J.; He, Q.; Mao, Y.; Yu, B. Assessment of Land Use Pattern and Landscape Ecological Risk in the Chengdu-Chongqing Economic Circle, Southwestern China. Land 2022, 11, 659. [Google Scholar] [CrossRef]
  54. Liang, T.; Yang, F.; Huang, D.; Luo, Y.; Wu, Y.; Wen, C. Land-Use Transformation and Landscape Ecological Risk Assessment in the Three Gorges Reservoir Region Based on the “Production–Living–Ecological Space” Perspective. Land 2022, 11, 1234. [Google Scholar] [CrossRef]
  55. Tian, P.; Cao, L.; Li, J.; Pu, R.; Gong, H.; Li, C. Landscape characteristics and ecological risk assessment based on multi-scenario simulations: A case study of Yancheng Coastal Wetland, China. Sustainability 2020, 13, 149. [Google Scholar] [CrossRef]
  56. Wang, Z.; Liu, Y.; Li, Y.; Su, Y. Response of ecosystem health to land use changes and landscape patterns in the karst mountainous regions of southwest China. Int. J. Environ. Res. Public Health 2022, 19, 3273. [Google Scholar] [CrossRef] [PubMed]
  57. Hou, R.; Li, H.; Gao, Y. Ecological risk assessment of land use in Jiangxia district of Wuhan based on landscape pattern. Acta Ecol. Sin. 2021, 28, 323–330. [Google Scholar]
  58. Wang, F.; Ye, C.; Hua, J.; Li, X. Coupling relationship between urban spatial expansion and landscape ecological risk in Nanchang City. Acta Ecol. Sin. 2019, 39, 1248–1262. [Google Scholar]
  59. Wang, M.; Sun, X. Potential impact of land use change on ecosystem services in China. Environ. Monit. Assess. 2016, 188, 248. [Google Scholar] [CrossRef]
  60. Ma, K.; Wei, F. Ecological civilization: A revived perspective on the relationship between humanity and nature. Natl. Sci. Rev. 2021, 8, nwab112. [Google Scholar] [CrossRef]
  61. Tan, L.; Luo, W.; Yang, B.; Huang, M.; Shuai, S.; Cheng, C.; Zhou, X.; Li, M.; Hu, C. Evaluation of landscape ecological risk in key ecological functional zone of South–to–North Water Diversion Project, China. Ecol. Indic. 2023, 147, 109934. [Google Scholar] [CrossRef]
  62. Zhang, B.; Xiong, D.; Li, X.; Liu, L.; Zhang, B.; Tang, Y.; Shi, L. Physical properties of soil moisture of gully reclamation project with different implementation year in Yuanmou Dry-hot Valley Area. Southwest China J. Agric. Sci. 2022, 35, 1870–1877. [Google Scholar] [CrossRef]
  63. Wilson, J.W.; Sexton, J.O.; Jobe, R.T.; Haddad, N.M. The relative contribution of terrain, land cover, and vegetation structure indices to species distribution models. Biol. Conserv. 2013, 164, 170–176. [Google Scholar] [CrossRef]
  64. Gong, J.; Yang, J.; Tang, W. Spatially explicit landscape-level ecological risks induced by land use and land cover change in a national ecologically representative region in China. Int. J. Environ. Res. Public Health 2015, 12, 14192–14215. [Google Scholar] [CrossRef] [PubMed]
  65. Li, J.; Lü, Z.; Shi, X.; Li, Z. Spatiotemporal variations analysis for land use in Fen River Basin based on terrain gradient. Trans. Chin. Soc. Agric. Eng. 2016, 32, 230–236. [Google Scholar]
  66. Yan, J.; Li, G.; Qi, G.; Qiao, H.; Nie, Z.; Huang, C.; Kang, Y.; Sun, D.; Zhang, M.; Kang, X. Landscape ecological risk assessment of farming-pastoral ecotone in China based on terrain gradients. Hum. Ecol. Risk Assess. Int. J. 2021, 27, 2124–2141. [Google Scholar] [CrossRef]
  67. Jiang, D.; Cao, X.; Kuang, H.; Cai, M.; Huang, Y.; Yin, C. Ecological red line planning and related key issues analysis for China. Resour. Sci. 2015, 37, 1755–1764. [Google Scholar]
  68. Yang, W.-X.; Li, S.-H.; Peng, S.-Y.; Li, Y.-X.; Zhao, S.-L.; Qiu, L.-D. Identification of important biodiversity areas by InVEST model considering opographic relief: A case study of Yunnan Province, China. Ying Yong Sheng Tai Xue Bao J. Appl. Ecol. 2021, 32, 4339–4348. [Google Scholar]
  69. Jin, X.; Jin, Y.; Mao, X. Ecological risk assessment of cities on the Tibetan Plateau based on land use/land cover changes—Case study of Delingha City. Ecol. Indic. 2019, 101, 185–191. [Google Scholar] [CrossRef]
Figure 1. Location of the study area.
Land 12 01759 g001
Figure 2. Land use status map of the Yuanmou basin from 2000 to 2020.
Land 12 01759 g002
Figure 3. Percentages of land use type area in Yuanmou basin.
Land 12 01759 g003
Figure 4. Spatial distribution of ecological risk in the Yuanmou basin from 2000 to 2020.
Land 12 01759 g004
Figure 5. Ecological risk change transfer map.
Land 12 01759 g005
Figure 6. Moran’s I scatter plot of LER in the study area from 2000 to 2020.
Land 12 01759 g006
Figure 7. The LISA maps in the study area from 2000 to 2020.
Land 12 01759 g007
Figure 8. Map of risk zones with different heights.
Land 12 01759 g008
Figure 9. Distribution index of ecological risk levels on terrain gradient from 2000 to 2020.
Land 12 01759 g009
Table 1. Calculation process of landscape loss index.
Landscape IndexCalculation FormulaNotation Definition and Meaning
Landscape fragmentation index (Ci) C i = n i A i Ci is the landscape fragmentation index; ni is the number of patches in landscape i; Ai is the total area of landscape i (km2). Ci indicates the degree of fragmentation of the landscape. The larger the value, the less stable the ecosystem.
Landscape Separateness Index (Fi) F I = A 2 A i n i A i FI is the landscape separation index; A is the total area of the landscape (km2); Ai is the total area of landscape i (km2); ni is the number of patches in landscape i. FI indicates the degree of separation between patches in landscape I. The larger the value, the more complex the spatial distribution of patches in that type of landscape.
Landscape Dominance Index (Di) D i = α L i + β M i Di is the landscape dominance index; Li is the ratio of the area of the i-th land use type to the total area of the study area; Mi is the ratio of the patch number in the i-th land use type to the total patch number. According to the expert scores, the weights α and β of Li and Mi are 0.6 and 0.4, respectively. The larger the Di value, the greater the influence of patches on the formation and change of landscape patterns, and the greater the corresponding ecological risk.
Landscape Disturbance Index (Ui) U i = a C i + b F i + c D i Ui is the landscape disturbance index; Ci is the landscape fragmentation index; Fi is the landscape separation index; Di is the landscape dominance index; a, b and c are the landscape fragmentation, separation and dominance weights, respectively. They are assigned as 0.5, 0.3 and 0.2, respectively. Ui indicates the degree of influence of human activities on the landscape pattern. The higher the value, the more significantly the ecosystem is affected by human activities and the less stable the landscape.
Landscape Loss Index (Ri) R i = U i × V i Ri is the landscape loss index; Ui is the i-th landscape disturbance index; Vi is the i-th landscape fragility index.
Table 2. Land use transfer matrix of Yuanmou Basin from 2000 to 2020 (km2).
2000Type of Land Use2020
WaterForestlandFarmlandConstruction LandGrasslandUnused LandTotal
water16.410.254.040.710.880.2122.51
forestland0.95660.3817.650.20139.110.04818.34
farmland5.6223.57313.9118.0393.210.30454.63
construction land0.340.026.448.842.490.3218.46
grassland5.34222.11396.2031.131529.610.932185.32
unused land0.890.026.861.642.952.9315.28
Total29.55906.35745.1060.561768.254.72-
Table 3. Landscape ecological risk levels at different elevations.
ZoningEcological Risk Zones200020102020
Area (km2)Percentage (%)Area (km2)Percentage (%)Area (km2)Percentage (%)
Dry-hot areaLow863.1557.01831.3454.91500.9933.09
Lower282.6718.67294.3519.44524.9334.67
Medium215.5114.23263.5417.41380.1925.11
Higher124.248.21101.006.6793.386.17
High28.351.8723.701.5714.460.96
Subtotal151410015141001514100
Non-dry-hot areaLow1383.9469.181304.9865.231350.8767.49
Lower420.4021.01475.7323.78570.7028.51
Medium168.218.41188.939.4473.553.67
Higher25.201.2627.391.376.330.32
High2.870.143.610.180.000.00
Subtotal200110020011002001100
Disclaimer/Publisher’s Note: The statements, opinions and data contained in all publications are solely those of the individual author(s) and contributor(s) and not of MDPI and/or the editor(s). MDPI and/or the editor(s) disclaim responsibility for any injury to people or property resulting from any ideas, methods, instructions or products referred to in the content.

