1. Introduction
According to data released by the Food and Agriculture Organization of the United Nations, of the 54 billion tons of global anthropogenic carbon emissions in 2019, agricultural and food system emissions represented 31% [
1], making this the second largest source of global carbon emissions. Effective control and reduction of agricultural carbon emissions is the consensus reached for global climate change action [
2]. As a largely agricultural country, agriculture accounts for more than 17% of China’s carbon emissions [
3]. With the development of urbanization, China’s rural areas are facing problems such as labor loss and arable land desertion, which adversely affect the development of agricultural production [
4], but at the same time created conditions for large-scale farmland management. To improve this situation, the No. 1 document of the Central Committee from 2013 to 2020 proposed “the development of moderate-scale operation”, pointing out that moderately expanding the scale of farmland management is needed for China’s agricultural development [
5].
With the influence of policies, the scale of China’s farmland has gradually expanded, but it is still dominated by finely fragmented farmland management. The transformation between finely fragmented farmland and large-scale farmland affects agricultural production inputs, especially agricultural chemical inputs [
6], resulting in changes in agricultural carbon emission intensity. Based on this, this paper discusses the impact of farmland management scale on agricultural carbon emissions, and finds out the farmland management scale suitable for low-carbon agricultural development, so as to provide a theoretical reference for building an agricultural power. As one of the world’s largest emitters of agricultural emissions, China has the responsibility to ease the pressure on agricultural input consumption and reduce carbon emissions.
Farmland scale management is an important mechanism to eliminate carbon dioxide (negative emissions) in the future [
7]. At present, scholars at home and abroad have studied the relationship between agricultural land management scale and agricultural carbon emissions, and produced different views. By comparing the results of the large-scale farmland policy implemented by the United States and other developed countries, some scholars believe that the development of large-scale farmland management will not only increase the social and economic benefits, but also put greater pressure on agricultural carbon emission reduction [
8]. Small-scale operations can make more effective use of resources [
9] and large-scale agricultural management has a greater negative impact on the agricultural ecological environment [
10]. Some scholars believe that expanding the scale of agricultural land management positively impacts agricultural carbon emission reduction [
11]. Empirical research has shown that expanding the scale of agricultural land management can reduce the carbon dioxide emissions of crops and improve resource utilization efficiency [
12,
13]. For example, Duan et al. [
14] used the undesirable slacks-based measurement model to calculate the moderate size of agricultural land as 1.20–1.53 hm
2 for Changwu County, Shaanxi Province. Using a literature search, Zhang and Zhu [
15] concluded that the low-carbon requirements of agricultural product inputs, the efficient utilization of agricultural mechanization, and the reuse of agricultural waste are the main reasons that large-scale farmland contributes to low-carbon agriculture. Liu and Xiao [
16] used the intermediary effect model to conclude that the change in agricultural land management scale induces a change in chemical and mechanical input intensities, and so affects agricultural carbon emissions. However, most research focuses on the macro-scale, of country and province, and less on the micro-scale of the county. In addition, most research has concentrated on the agricultural provinces in the central and eastern regions, with less attention paid to the arid areas in the northwest. Therefore, taking counties in Gansu Province as the research unit, starting from the scale of agricultural land management and taking the input factors of agricultural production as the intermediary factors, it is of great theoretical reference significance to explore the mechanisms influencing agricultural carbon emissions for further promoting agricultural emission reduction and high-quality development of agriculture.
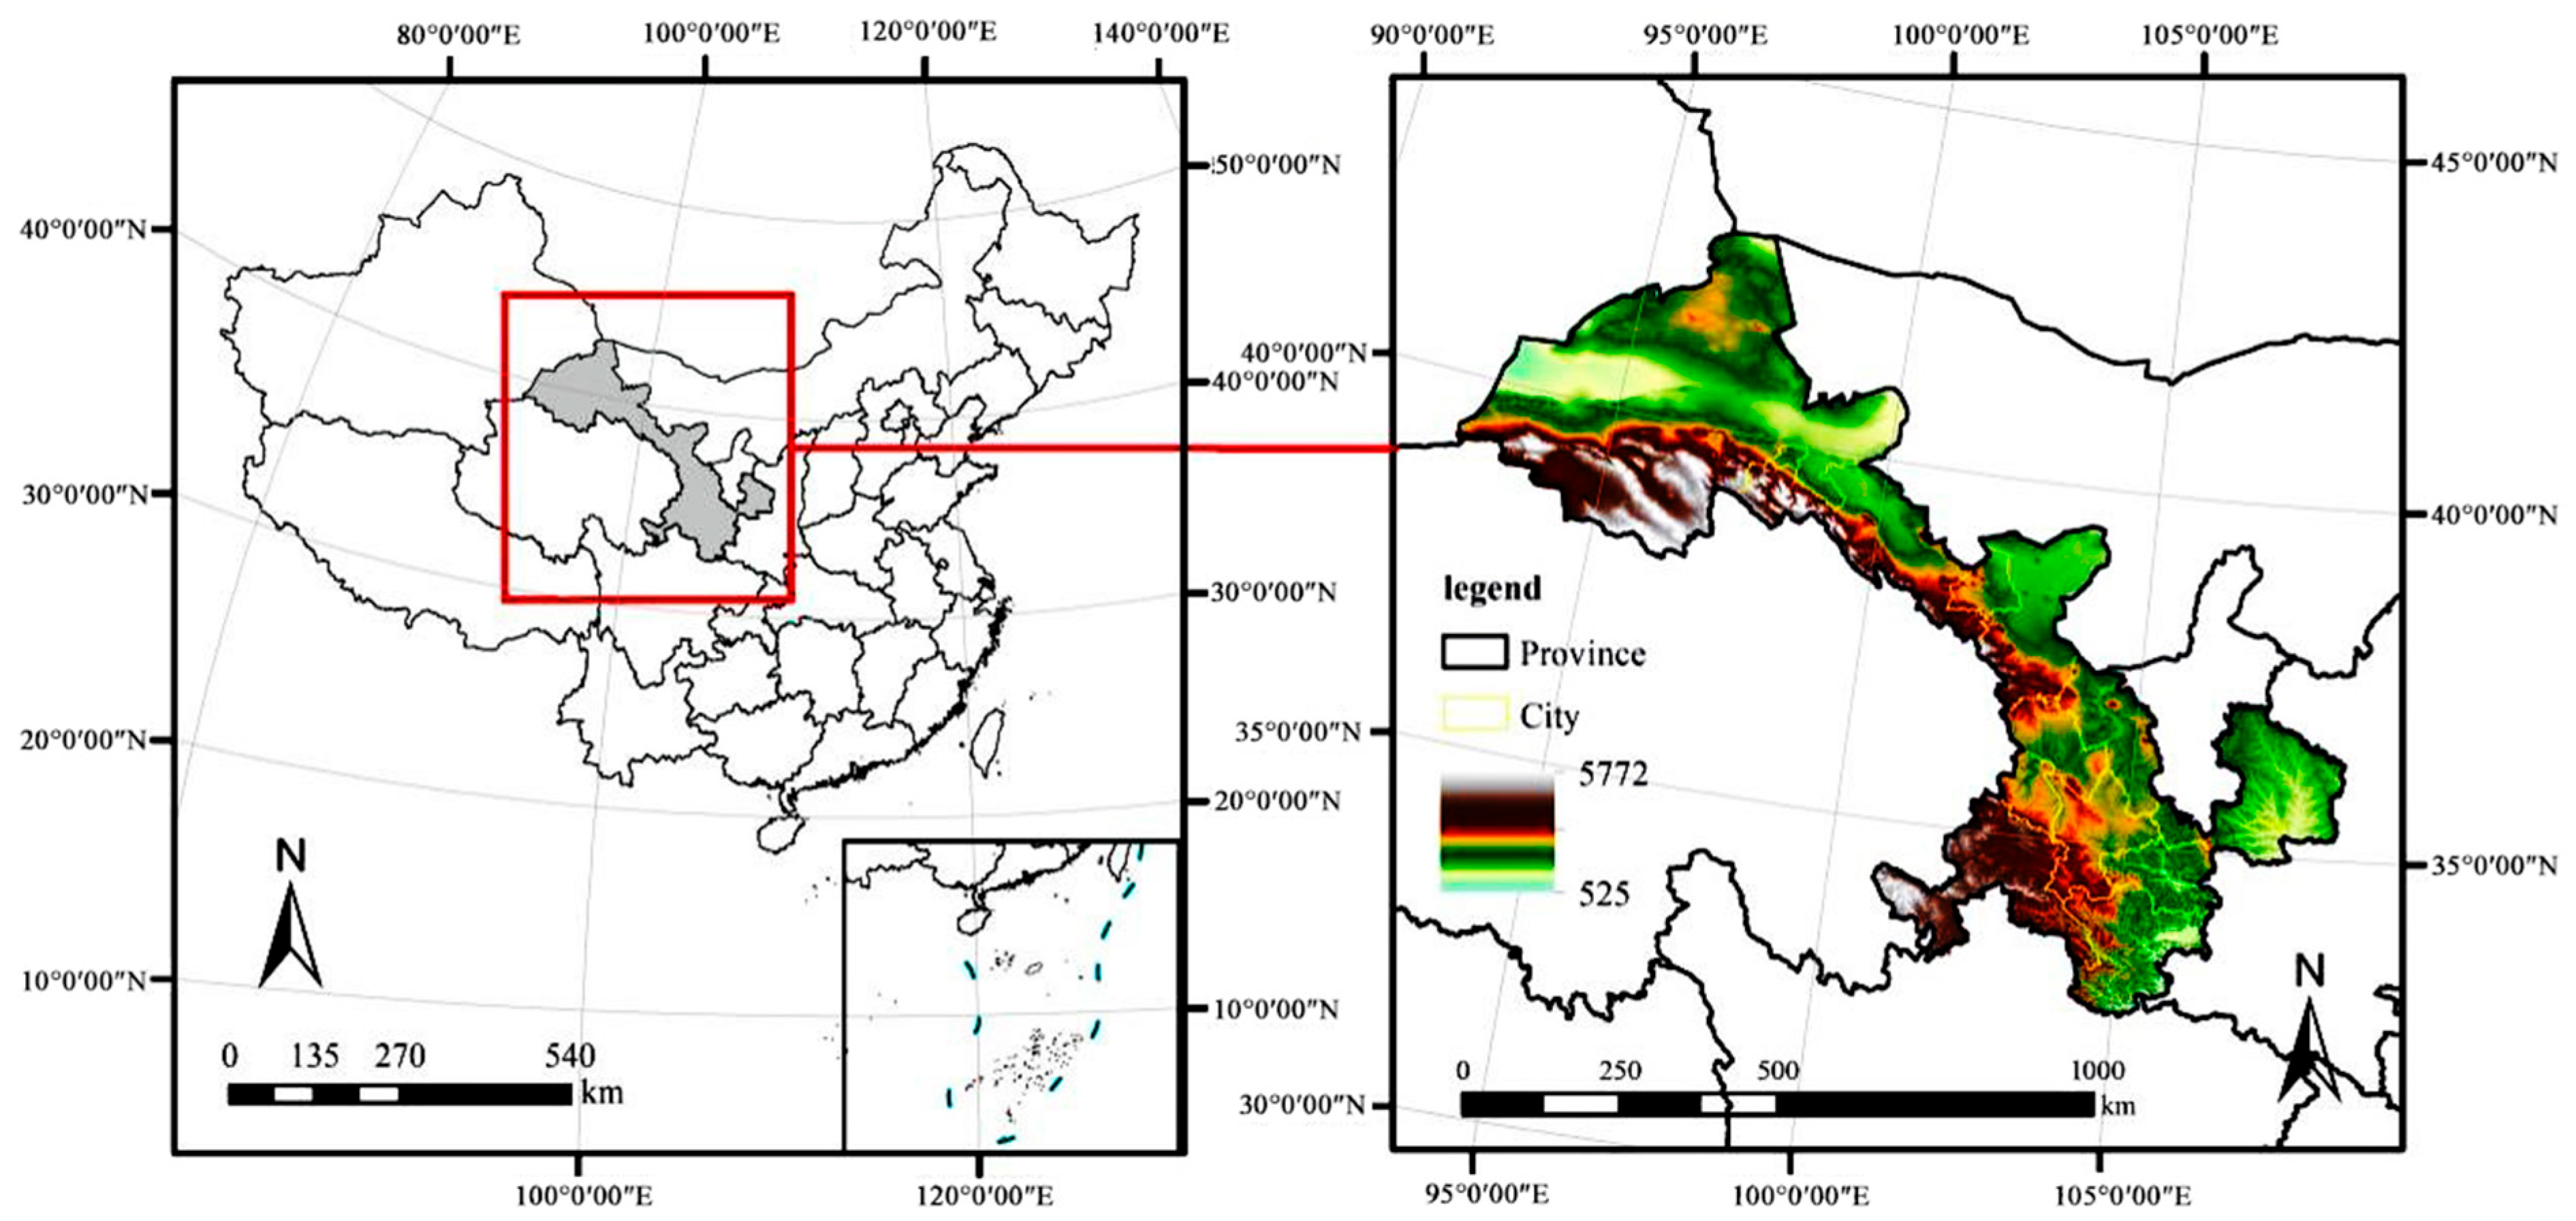
Gansu Province is in an arid area of northwest China. In order to increase the output of agricultural grain and cash crops, farmers have to strengthen the use of input factors such as chemical fertilizers, agricultural films, and pesticides [
17,
18]. Excessive use of agricultural chemicals such as fertilizers produces a lot of greenhouse gases, which will affect agricultural carbon emissions; at the same time, there are differences in the impact of farmers with different farmland scales on agricultural carbon emissions, mainly because changes in farmland scale will lead to changes in land use structure and affect agricultural carbon emissions (
Figure 1). The utilization efficiency of small-scale farmland operators on input factors such as chemical fertilizers is lower than that of large-scale operators. Appropriately increasing the scale of farmland management can strengthen the management of farmland and efficiency of resource utilization. This paper selects counties in Gansu as the research area and analyzes the influence of the change of agricultural land management scale on agricultural carbon emission intensity, with the optimal value of scale resulting in the lowest agricultural carbon emission intensity, in order to provide a decision-making reference for the development of low-carbon agriculture in Gansu.
3. Results and Analysis
3.1. Time Trend of County Carbon Emissions in Gansu
For 2000–2020, the agricultural carbon emissions in Gansu showed a trend of initial increase and then declining (
Figure 3), with an average annual growth rate of 2.60%. In 2015, the carbon emissions in Gansu reached a peak of 2.04 million tons, and a downward trend was obvious after 2016. From the perspective of annual growth rate, there was a fluctuating trend during 2000–2020. In 2016, carbon emissions began to decline, with the largest decline in 2018, and the annual growth rate reached the lowest value of −6.0%. Note that agricultural carbon emissions in Gansu began to decline significantly in 2017, mainly because the Gansu provincial government issued and implemented the Implementation Plan for Controlling Greenhouse Gas Emissions in the 13th Five-Year Plan of Gansu, and put forward the goal that “the carbon dioxide emissions in Gansu will peak around 2030 and reach the peak as soon as possible”. After agricultural carbon emissions and carbon emission intensity reached a peak in 2017, they showed a downward trend, indicating that the action plan showed initial results in agricultural carbon emission reduction.
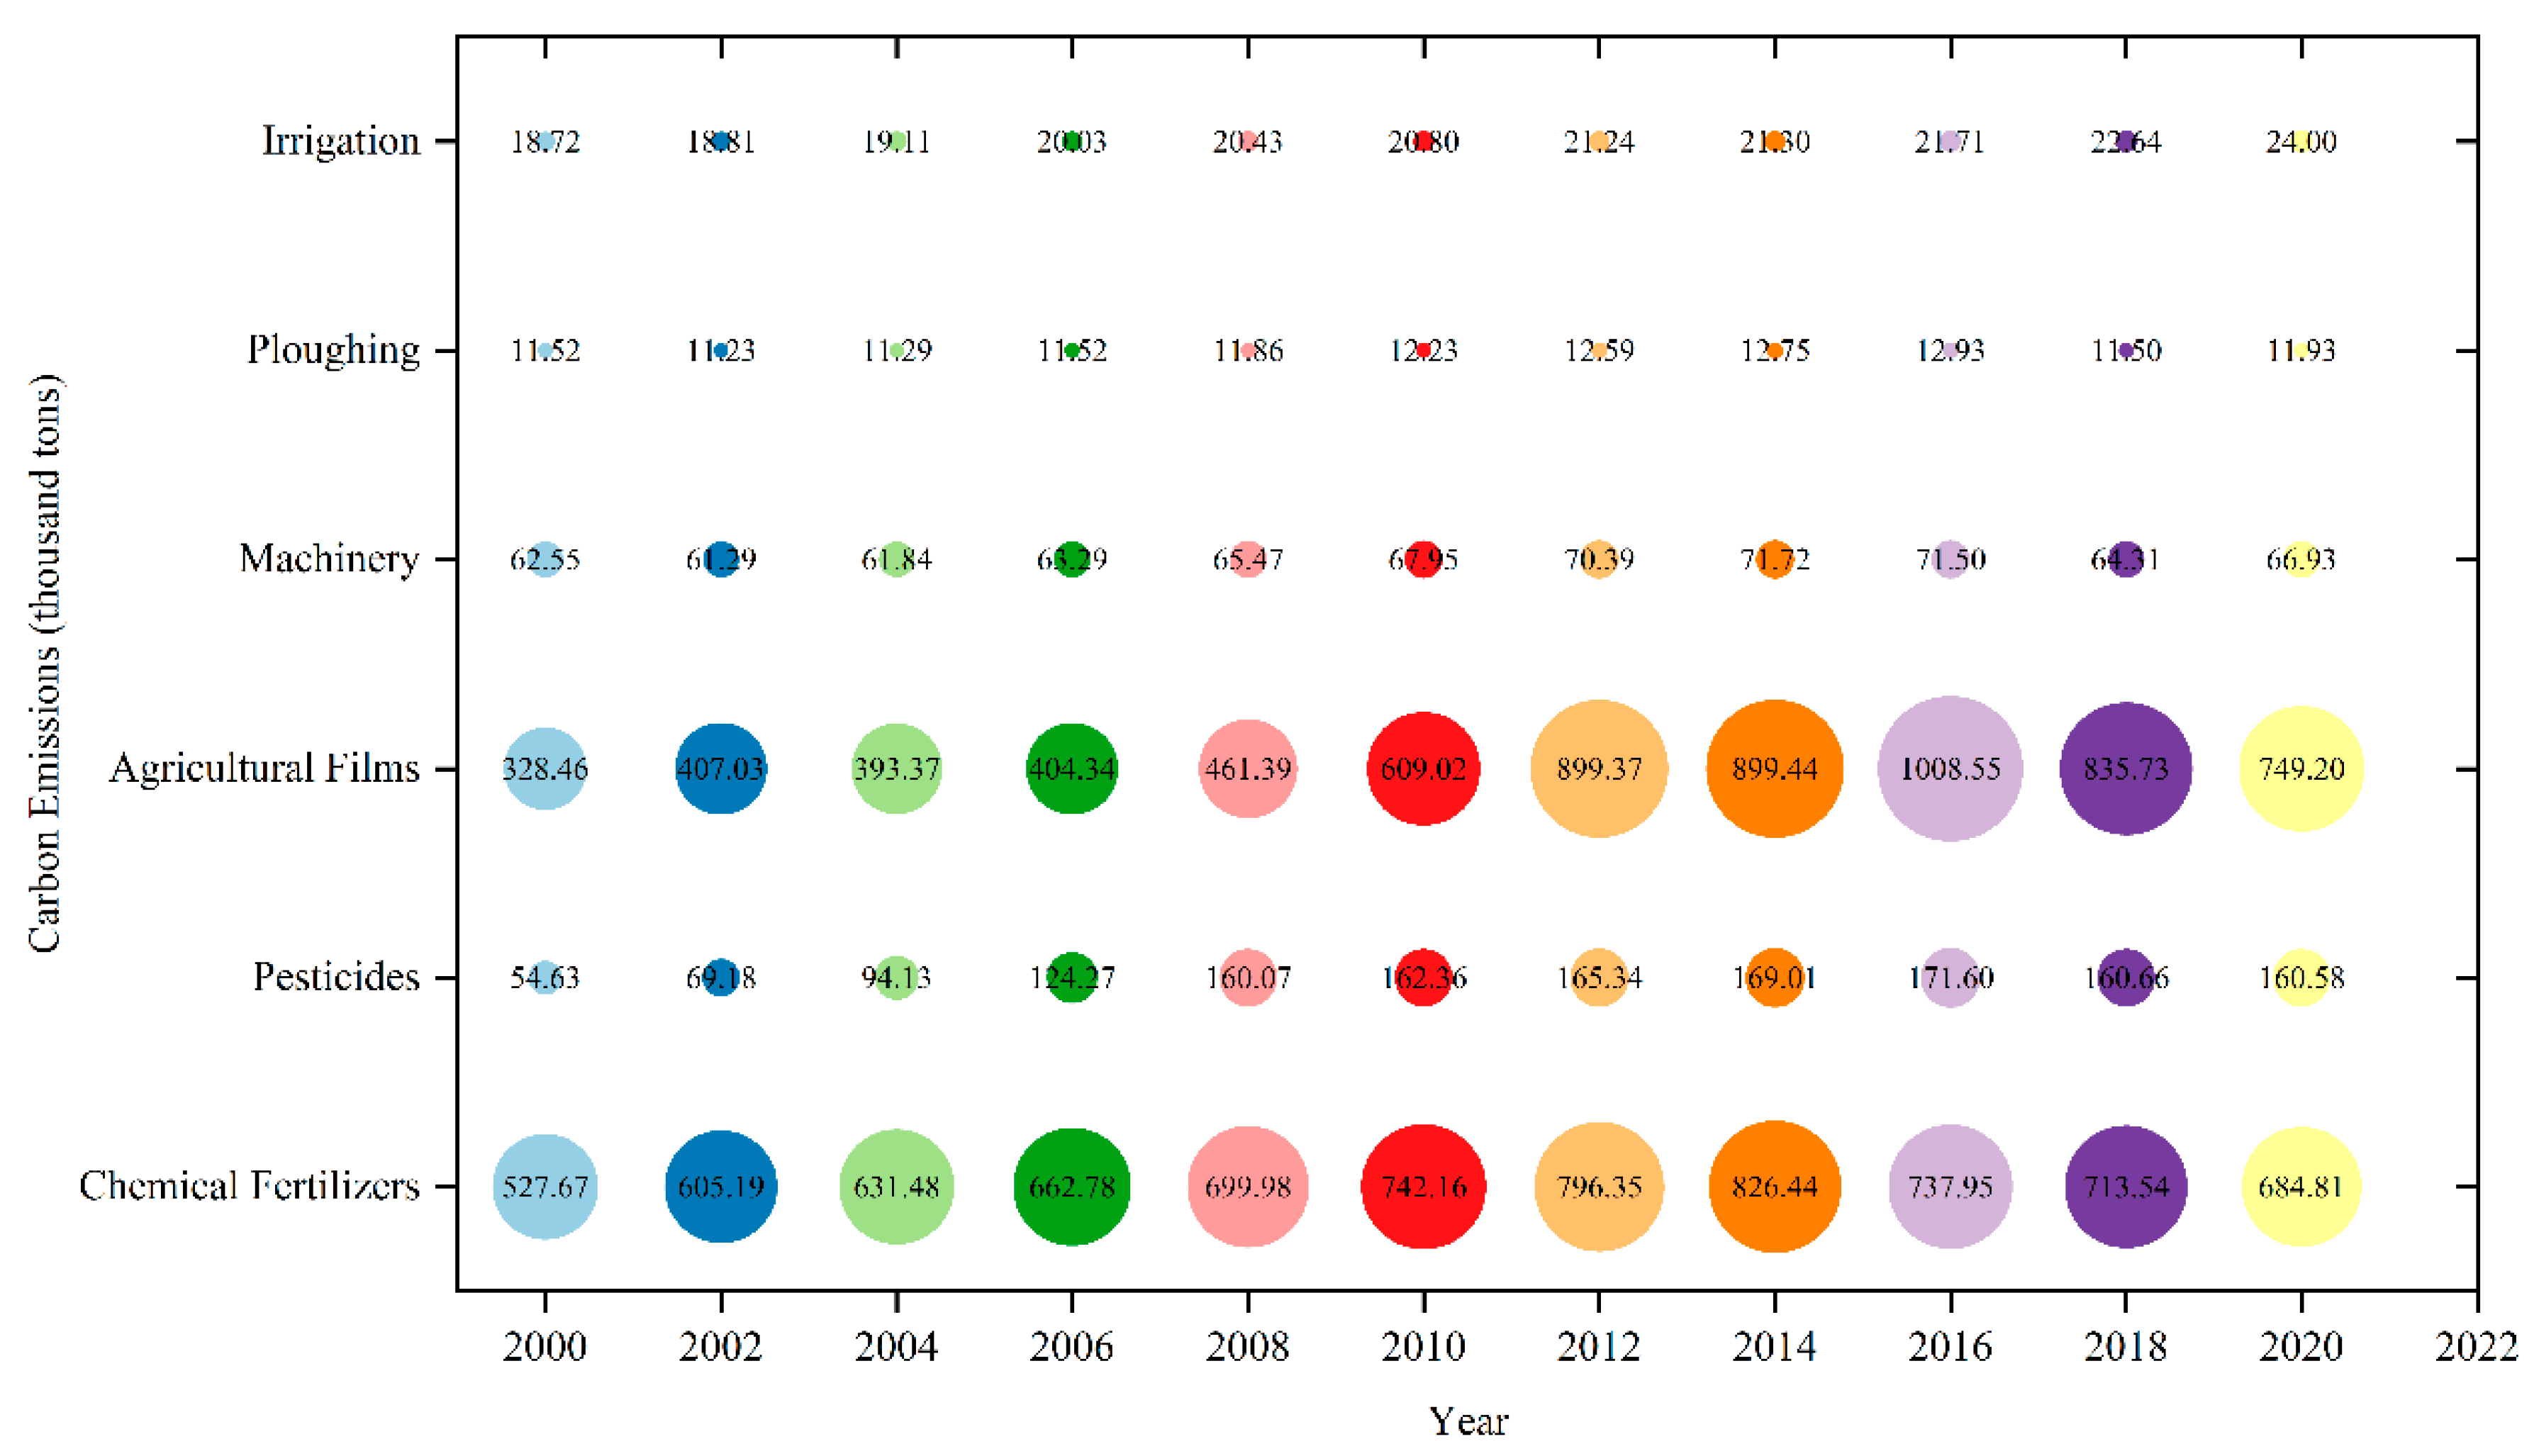
The contributions of various carbon sources to agricultural carbon emissions in Gansu differed, with the largest contribution from the use of chemical fertilizers and agricultural films (
Figure 4). Among them, the carbon emission of chemical fertilizer accounted for 34.26–52.95% of total carbon emissions, and agricultural film accounted for 31.35–53.95%, followed by pesticides, machinery production consumption, plowing, and irrigation in descending order. Overall, carbon emissions of chemical fertilizers, pesticides, and agricultural films showed a trend of initial increase and then decrease, increasing from 527.67, 328.46, and 54.63 thousand tons in 2000 to 1008.55, 737.95, and 171.60 thousand tons in 2016, respectively, and decreasing to 749.20, 684.81, and 160.58 thousand tons in 2020. Carbon emissions from machinery consumption, plowing, and irrigation increased from 62.55, 11.52, and 18.72 thousand tons in 2000, respectively, to 66.93, 11.93, and 24.00 thousand tons in 2020, showing a fluctuating growth trend. It is noteworthy that carbon emission of agricultural films in Gansu was relatively high, indicating relatively high consumption of agricultural film, mainly due to the dry climate in most parts of Gansu, and its use in agriculture can achieve the goal of “saving water and increasing production”. Fertilizers, pesticides, and plastic film are the main carbon emission sources, and all showed a downward trend after 2016. On the one hand, the cultivated land area and rural employees in Gansu have decreased compared with before and, on the other hand, agricultural carbon sources have been included in the scope of emission reduction during the Twelfth Five-Year Plan period in Gansu, and emission reduction measures have been taken, with observable results.
3.2. Spatial Differences of County Carbon Emissions in Gansu
The spatial distribution map of carbon emission intensity of counties in Gansu for 2000–2020 was obtained using Arcgis and the natural discontinuity method, and showed clear spatial concentration characteristics of agricultural carbon emission intensity (
Figure 5). Compared with 2000, the carbon emission intensity in most counties in 2020 showed an increasing trend, concentrated in Huan, Huating, and Zhuanglang Counties, with the largest growth rate in Huan County; Zhuoni, Anning District, Honggu District, Yongchang County, and other counties with negative carbon emission intensity. The regions with relatively small changes in carbon emission intensity included Xiahe County, Cheng County, and Xigu District, with the smallest change rate for Cheng County. The high-value areas with carbon emission intensity in the range of 952.51–1642.50 kg/hm
2 were concentrated in the east and north, mainly due to the large planting area of wheat, corn, and other crops in the central, east and north of Gansu, and the higher consumption of chemicals such as fertilizers and pesticides and power of agricultural machinery. At the same time, due to the expansion of cultivated land, the use of chemicals such as fertilizers and pesticides in some areas has increased, resulting in these areas becoming high-value areas of agricultural carbon emission intensity in Gansu.
Although the location of high-carbon emission regions in Gansu has not changed much, the range of middle- and high-value regions had a shrinking trend from 14 to seven counties during 2015–2020. Note that the cultivated land area in Bai Yin City is relatively small, but it is rich in water resources, and the planting area of crops and the rural population account for a large proportion. Every year, agricultural film covers about 2.2 million mu, the amount used is about 20,000 tons about 20,000 t and resulting in high agricultural carbon emissions. Therefore, in the past 20 years, the carbon emission intensity of agriculture in Bai Yin City has always been in the high-value area.
3.3. Influencing Factors of Agricultural Carbon Emissions
Before data processing, we first carried out two unit root tests, LLC (Levin-Lin-Chu Tested) and ADF (Augmented Dickey-Fuller Tested), which showed that the data were a stationary series at 1% level. In this paper, the mixed regression model was tested by F-test to determine the optimal regression model, with significance at 1% level, indicating that the original hypothesis was strongly rejected. That is, the fixed effect model (FE) was superior to the mixed regression model. In addition, this paper used the data of 86 counties in Gansu (except Lanzhou New District and Maqu County) for the most recent 20 years. In order to ensure the validity of the analysis results and avoid the problem of “pseudoregression” caused by using nonstationary data for analysis, the FE model was used for analysis.
3.3.1. Impact of Farmland Management Scale on Agricultural Carbon Emission Intensity
Firstly, we measured the total impact of agricultural land management scale on carbon emission intensity. Considering that there may be differences in farmers’ production behavior at different scales, the square term of farmland management scale was introduced into the model. According to the principle of Baron and Kenny’s stepwise regression method, Model 1 (
Table 3) showed that the coefficient of farmland management scale was significantly negative (−1.181) and the square term coefficient of farmland management scale was significantly positive (0.325). For Model 2, the regression coefficients of farmland management scale and the square term of farmland management scale were significantly negative and positive, respectively, and the total effect of the core explanatory variable farmland management scale on agricultural carbon emission intensity was significant, indicating that when farmland management scale was small, the expansion of scale had an inhibitory effect on agricultural carbon emission. When the scale of agricultural land management was large, the expansion of scale promoted agricultural carbon emission, that is, there was an “optimal management scale” between agricultural land management scale and carbon emission, resulting in the lowest agricultural carbon emission intensity. After solving, the optimal farmland management scale for Models 1, 2, and 3 (
Table 3) was 0.410, 0.520, and 0.552 hm
2/person, respectively, with an average of 0.49 hm
2/person.
Model 2 (
Table 3) had relatively strong multicollinearity in per capita disposable income and urbanization rate, so the square of per capita disposable income was added to Model 3 and the urbanization rate was removed. The regression coefficients of per capita disposable income and its square term on agricultural carbon emissions were 0.484 and 0.081, respectively, indicating that a “U-shaped” relationship between per capita disposable income and agricultural carbon emission intensity. There may be a negative correlation between the INC of rural families and CEI. When INC is low, with the accumulation of capital, farmers will maximize profits and increase external investment in agriculture, thus promoting CEI. With the rising of INC, the increase of opportunity cost of agricultural production promotes the extensive management of farmland, which leads to the decline of CEI. Planting structures, MCI, rural labor force, and UR all had significant effects on agricultural carbon emission intensity.
3.3.2. Impact of Farmland Management Scale on Intermediary Variables
For Model 4 (
Table 4), under the control of other variables, the regression coefficients of the agricultural land management scale and its square term to the intensity of chemical fertilizer use were −0.2568 and 0.1238, respectively. Thus, farmers’ investment in chemical fertilizer will decrease when agricultural land management scale expands, but will increase with expansion of scale when it exceeds the “optimal agricultural land management scale”. This shows that the scale of operation can regulate the use of agricultural production materials.
For Models 4 and 5 (
Table 4), under the control of other variables, the regression coefficients of the farmland management scale and its square term for the intensity of fertilizer use were −0.245 and 0.122, respectively, and for the intensity of agricultural film use were −9.896 and 2.406. When the scale of farmland operation was small, the scale of farmland operation had a significant negative effect on the input of chemical fertilizer and agricultural film. On the contrary, when the scale of farmland operation was large, the input of chemical fertilizer and agricultural film had a significant positive effect.
For Model 6 (
Table 4), the scale of agricultural land management had a significant positive effect on input intensity of pesticides, while the square term of agricultural land management scale had a significant negative effect on input intensity of pesticides, with regression coefficients of 0.518 and −0.262, respectively. As the scale of farmland increases, farmers will increase their input to pesticides to ensure the output of food or cash crops. However, beyond a certain scale, with the expansion of farmland scale, farmers tend to be more specialized in management of farmland, and in order to save costs, will replace the use of pesticides in other ways, thereby reducing the input of pesticides. The results of Model 6 are contrary to those of Models 4 and 5, indicating that the scale of agricultural land management has regulation and rationality on the use of agricultural production materials, will also have different effects on the input of different agricultural factors, and different regional climatic conditions will have a certain impact on input of factors.
3.3.3. Impact of Farmland Management Scale and Intermediate Variables on Agricultural Carbon Emission Intensity
When the intermediary variables were chemical fertilizer, agricultural film, and pesticides, the direct impact of agricultural land management scale on agricultural carbon emission intensity was still significant, indicating that the three intermediary variables played a partial intermediary role. Substituting the regression results of Models 7 and 8 (
Table 5) into the intermediary effect model relationship, the optimal farmland scale in Gansu was 1.24 and 0.41 hm
2/person, respectively. The farmland management scale corresponding to the carbon emission intensity value obtained by Model 9 was 0.18 hm
2/person, with an average of 0.608 hm
2/person. The regression coefficients of chemical fertilizer, agricultural film, and pesticides were 0.639, 0.155, and 0.198, respectively, which had significant positive impacts on agricultural carbon emission intensity, because the use of chemical fertilizer, agricultural film, and pesticides was the main factor promoting agricultural carbon emissions, and the input of these agrochemicals not only guaranteed crop yield, but also posed a great threat to the agricultural ecological environment.
Regarding the influence of agricultural land management scale on agricultural carbon emission, when all three intermediate variables were included in the regression model, the input intensity of chemical fertilizers, agricultural film, and pesticides all played a part in the intermediary effect, with input intensity in the following order: chemical fertilizer > pesticide > agricultural film (
Table 5). Therefore, adjusting the scale of agricultural land management can optimize the input intensity of agricultural external input factors, such as chemical fertilizers, agricultural film, pesticides, and improve the efficiency of input, to achieve the goal of agricultural carbon emission reduction under the premise of ensuring output of food or cash crops.
3.4. Regional Analysis
Because the scale of agricultural land management is influenced by mountainous terrain, the available land area in plain areas is larger than that in plateau and mountainous areas. Gansu was divided into five county-level administrative regions: Hexi, Longzhong, Longdong, Longnan, and Gannan. The five sub-samples were used for regionalization analysis.
3.4.1. Impact of Regional Agricultural Land Management Scale on Agricultural Carbon Emission Intensity
Because of the strong collinearity between per capita disposable income and urbanization rate in the control variables, two variables were excluded from the regionalization analysis. The square term of agricultural land management scale in the Hexi (Model 1) and Longdong regions (Model 3) had a significant impact on agricultural carbon emissions, with regression coefficients of −0.945 and 0.265, respectively (
Table 6); that is, the relationship between agricultural land management scale and agricultural carbon emissions in this region was “U-shaped” and “inverted U-shaped” (
Figure 6). The regression coefficients of the agricultural land management scale and its square term to agricultural carbon emission intensity in the Gannan area (Model 5) were 1.716 and −0.489, respectively, showing an “inverted U” trend (
Figure 6). The regression coefficients of the square term of agricultural land management scale in the Longnan area were 1.095 and −0.263, respectively, but the results were non-significant. In addition, there is a certain linear trend between the scale of farmland operation and carbon emission intensity in Longzhong area. Substituting the results into the regression model showed that the scale of agricultural land management in the Hexi and Gannan regions should exceed 0.137 and 0.385 hm
2/person, respectively, and the optimal scale in the Longdong region was 0.219 hm
2/person and resulted in the least impact on agricultural carbon emissions (
Figure 6). The significant difference between central and southern Gansu may be due to the influence of topography and natural conditions.
3.4.2. Impact of Agricultural Land Management Scale and Intermediary Variables on Agricultural Carbon Emission Intensity at the County Level
When three intermediary variables (chemical fertilizer, plastic film, and pesticide input intensity) were added, the influence of agricultural land management scale on agricultural carbon emission in the Longdong and Gannan areas was not significant (
Table 7), while the benchmark regression results showed a significant relationship between agricultural land management scale and carbon emission intensity (
Table 6), indicating that intermediary factors such as chemical fertilizer in the two areas play a complete intermediary role. In contrast, intermediary factors such as chemical fertilizer in Hexi, Longzhong, and Longnan areas played a partial intermediary role. The regression coefficients of the agricultural land management scale and its square term to agricultural carbon emission in the Hexi region were 0.356 and −0.083 (
Table 7), respectively, showing an “inverted U” trend (Model 6), and so management scale needed to exceed 0.143 hm
2/person to promote agricultural carbon emission reduction (
Figure 7). The regression coefficients in central Gansu were −0.120 and 0.028 (
Table 7), respectively, and those in southern Gansu were −1.221 and 0.369 (
Table 7), both of which showed a “U-shaped” trend. When the optimal farmland management scale was 0.143 and 0.348 hm
2/person, respectively, the agricultural carbon emission intensity values in both regions were the lowest.
The significant regression results for the five sub-regions were quite different from the overall results of counties in Gansu. There are three reasons: (1) there was a big difference between the number of regional samples and the total number of samples, and the estimation accuracy decreased, which affected model analysis results; (2) the landform and different natural climate characteristics between regions, that is, heterogeneity between regions, led to great differences in the scale of agricultural land management; (3) uneven regional economic development and different investment in agricultural scientific training led to different scientific management levels of agricultural land among operators, and the efficiency of investment in chemicals such as fertilizers or external factors such as machinery.
4. Discussion
4.1. Impact Mechanism of Agricultural Land Management Scale on Agricultural Carbon Emissions
4.1.1. Direct Impact of Farmland Management Scale on Agricultural Carbon Emissions
In this paper, the agricultural carbon emissions in Gansu were analyzed in terms of the structure of agricultural carbon emissions. The agricultural carbon emissions of counties in Gansu were calculated using the carbon emission coefficient method, and the mechanism of agricultural land management scale on agricultural carbon emissions at the county level was explored. The results showed that the scale of agricultural land management had both direct and indirect effects on agricultural carbon emissions. The literature review showed that the direct cause of the impact of agricultural land management scale on agricultural carbon emission was that the change of scale leads to the change of land structure [
27]. That is, the transformation between woodland, farmland, grassland, construction land, and other lands, have different abilities of “carbon source” and “carbon sink” [
28], which in turn affects agricultural carbon emissions.
4.1.2. Indirect Impact of Farmland Management Scale on Agricultural Carbon Emissions
The impact of large-scale farmland management on carbon emissions is reflected in the different choices of farmers in the use of chemical fertilizers and farmland irrigation, resulting in differences in agricultural carbon emissions, among which the production and use of chemical fertilizers, pesticides, and other chemicals had the greatest impact. Zhang et al. [
29] reached similar conclusions using empirical research. China’s agricultural production is highly dependent on chemical inputs [
30], so the average farmer may choose to change the scale of farmland operations and the input of chemicals such as fertilizers in order to increase agricultural production. Large-scale farmers are often willing to accept new technologies for efficient use of chemical fertilizers [
31], while farmers with small-scale operations tend to have less technical mastery of the scientific application of fertilizers and other chemicals [
26], so the scale of farmland management can indirectly affect carbon emissions through the input of fertilizers and other chemicals [
32].
4.2. Carbon Emission Reduction Path under the Scale of Agricultural Land Management
At present, agriculture in Gansu is characterized by high input, low output, and high pollution. Although agricultural carbon emissions in Gansu have shown a downward trend in recent years, agricultural carbon emissions are still high, among which the emissions of agricultural chemicals such as fertilizers and agricultural films account for the largest proportion, indicating that there is an overuse problem of agricultural chemicals in Gansu. This study investigated the relationship between agricultural land management scale and carbon emissions, and showed that adjusting agricultural land management scale and improving resource utilization efficiency can effectively control agricultural carbon emissions. Below we propose some suggestions on the research conclusion.
(1) Appropriately increase the scale of agricultural land management. The present farmland scale in Gansu is below optimal, so it is necessary to appropriately increase farmland scale, which will aid development of low-carbon agriculture. Therefore, on the one hand, relevant departments in Gansu should encourage farmers who have been planting for a long time to appropriately expand their scale, and concentrate finely-divided farmland into large-scale farmland to avoid the problem of agricultural intensification. Skill training institutions should be established to guide farmers to scientifically manage agricultural land, adopt improved techniques and farming methods, broaden the sales market of agricultural products, formulate and promulgate policy documents and methods for rational land transfer and increase financial subsidies for large-scale management of agricultural land, and actively introduce technical talent for agricultural land management to promote large-scale management of agricultural land. On the other hand, excessive concentration of agricultural land will also have a negative impact. If the scale of agricultural land is too large, it will increase the cost of labor and farmland utilization, require greater supervision of agricultural land management, increase management costs, withstand uncertainties such as drought and flood, and increase the input of chemicals such as fertilizers and pesticides, thus increasing the environmental load. Therefore, it is necessary to reasonably control the scale of agricultural land management and improve the input efficiency of chemical fertilizers and other factors.
(2) Standardize the use of agricultural film, and use scientific application of chemical fertilizers and pesticides. The analysis of agricultural carbon emission sources showed that chemical fertilizers, agricultural films, and pesticides were the main factors of agricultural carbon emission in Gansu. In recent years, excessive use of agricultural films in some areas of Gansu has led to an increase in carbon emissions. Therefore, relevant regulatory authorities need to vigorously control the application of chemical fertilizers and pesticides, replace the original agricultural film with energy-saving agricultural film, increase the recycling of agricultural film, and at the same time strengthen scientific research to study the number of chemicals such as fertilizers needed by different crops to avoid excessive application and improve chemical fertilizers.
4.3. Innovation and Deficiency
In terms of research results, the agricultural-related emission reduction measures in Gansu have achieved initial results and began to show an obvious downward trend in 2017. By reasonably controlling the scale of agricultural land management, the consumption of chemicals such as fertilizers can be effectively controlled and regulated, and the ideal effect of “high output and low emission” in agricultural planting can be achieved. Calculation showed that the optimal farmland management scale in Gansu was 0.494 hm
2/person without considering the intermediate variables, and the optimal scale when considering the intermediate variables was 0.608 hm
2/person. Combined with the county-level panel data of Gansu, present farmland scale is 0.481 hm
2/person, so it is necessary to reasonably expand the scale, and at the same time, it is necessary to control the input of chemical fertilizers, agricultural films, pesticides, and other chemicals to reduce carbon emissions. In terms of research area, Gansu Province belongs to the arid and semi-arid areas of northwest China, and some areas are not the main agricultural areas affected by climatic conditions, so the results have limitations, which may have certain theoretical reference significance for similar research areas, and the universality still needs to be verified in the future. Concerning the research scale, this study fills the gap in research of small areas such as counties and verifies the results of Liu et al.(2020) [
16], which has certain reference significance for the formulation of regional agricultural carbon emission reduction measures. However, in this paper, the scale of agricultural land management was expressed by per capita arable land area. Due to the lack of data on farmers, the impact of agricultural land management scale on agricultural carbon emissions was not analyzed at the level of farmers, and the impact of agricultural industrial structure, rural age structure, and education on agricultural carbon emissions was not considered, and further research should be made on these aspects.
5. Conclusions
Based on the proportion of sources of agricultural carbon emissions in Gansu Province, we selected the use intensity of chemical fertilizers, agricultural films, and pesticides as intermediary variables, built an intermediary effect model to explore the impact of agricultural land management scale on agricultural carbon emission, and systematically analyzed the transmission mechanism of agricultural land management scale on agricultural carbon emission. The main conclusions follow:
(1) Analysis of the spatiotemporal characteristics of agricultural carbon emissions in Gansu for 2000–2020 showed that, in terms of time series, agricultural carbon emissions and emission intensity in Gansu generally showed a downward trend, reaching a peak in 2015. After 2016, the agricultural carbon emission reduction effect was remarkable. In spatial sequence, the high-value areas of carbon emissions in Gansu are mainly distributed in the central, eastern, and southeastern regions, and the range of high-value areas showed a decreasing trend.
(2) The indirect effects of agricultural land management scale on agricultural carbon emissions through three intermediary channels (fertilizer, pesticides, and agricultural film use intensity) were verified at the county scale in Gansu: the management scale showed a “U-shaped” relationship with fertilizer and agricultural film input, and an “inverted U” relationship with pesticide. After adding intermediary factors, the scale of farmland operation still has a significant impact on agricultural carbon emissions.
In addition, the total effect of the agricultural land management scale on agricultural carbon emission had a significant “U-shaped” relationship, and the existence of an “optimal scale of agricultural land” resulted in agricultural carbon emission intensity having a minimum value of 0.494 hm2/person. The optimal value of the farmland scale was 0.608 hm2/person when considering the intermediate variables.
(3) The scale of agricultural land management in the Hexi region exceeded 0.137 hm2/person, which would promote reductions in agricultural carbon emission. The optimal scale of agricultural land management in the Longdong region was 0.219 hm2/person, and the scale of agricultural land management in the Longzhong regions had a linear trend. After adding intermediary variables, the scale of agricultural land management in the Hexi region was at least 0.143 hm2/person, and had a positive role in promoting development of low-carbon agriculture. The optimal scale of agricultural land management in the Longdong and Longnan regions was 0.143 and 0.348 hm2/person, respectively, and intermediary variables such as chemical fertilizers in the Longzhong region had a complete intermediary effect.


