
Exploring Land Use Management Strategies through Morphological Spatial Patterns Using a Climate–Socioeconomic-Based Land Use Simulation Modeling Framework


Abstract
:1. Introduction
2. Study Area and Materials
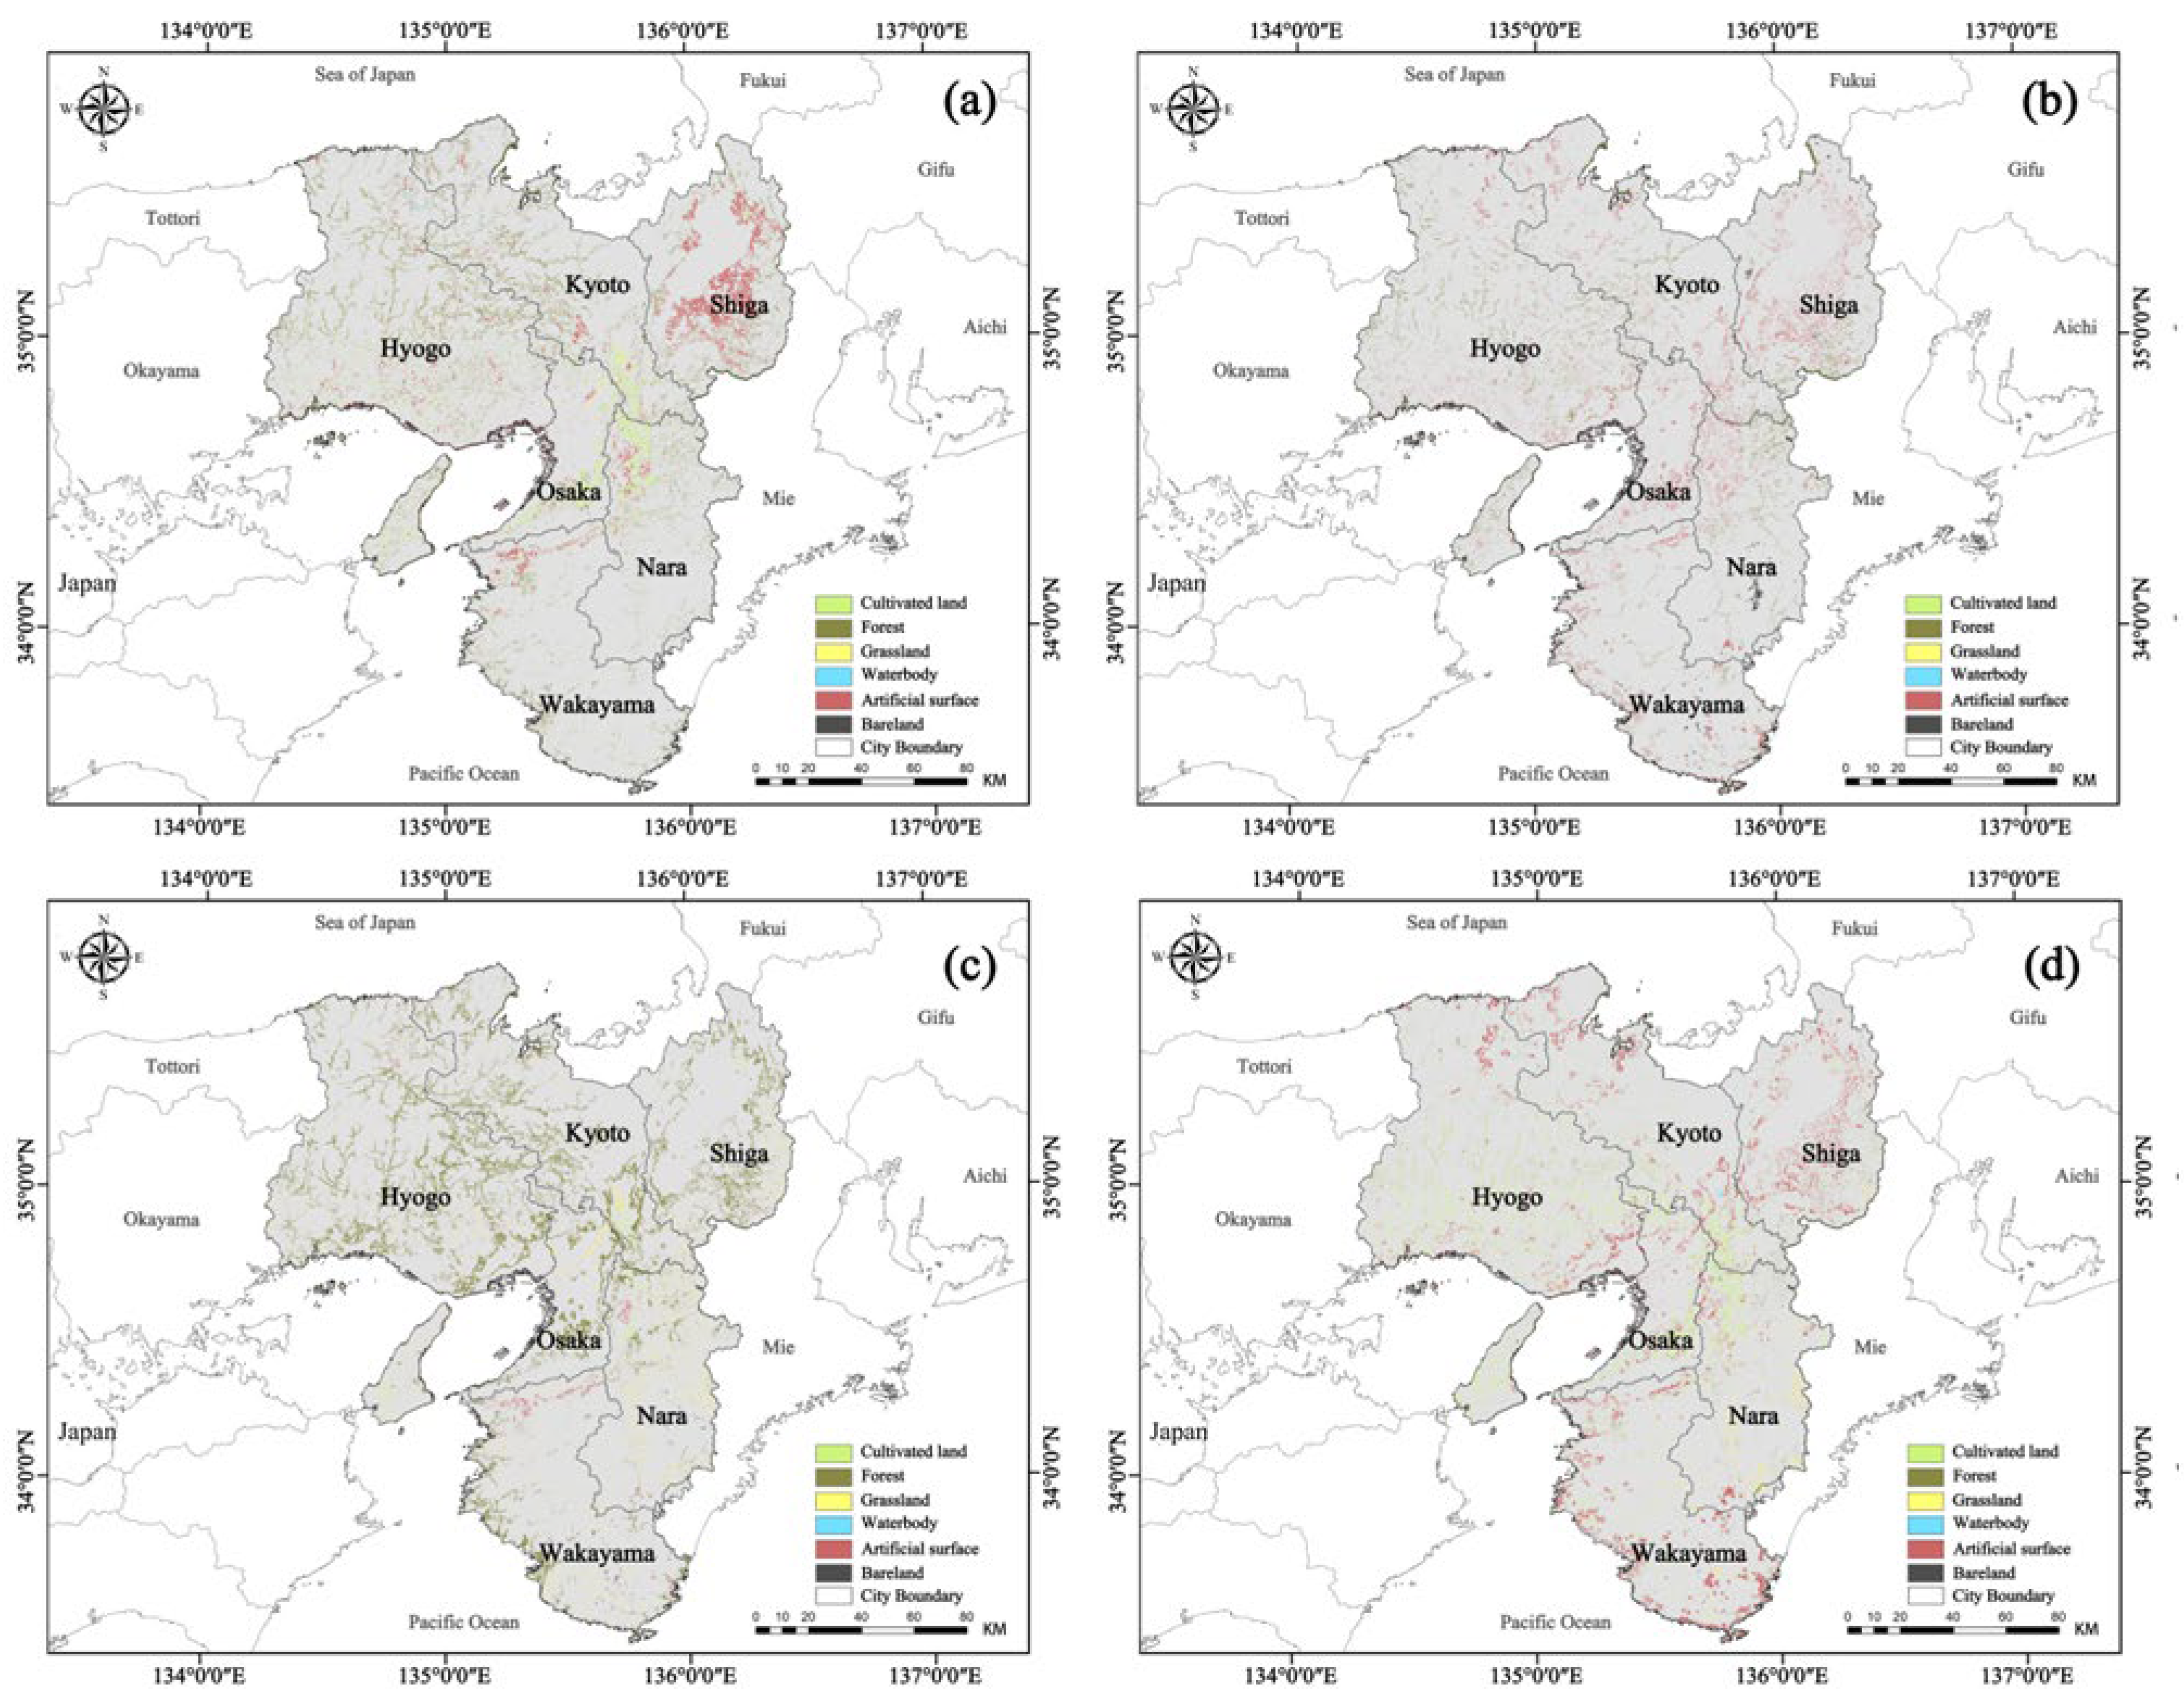
2.1. Study Area
2.2. Data Acquisition

| Category | Data | Year(s) | Original Resolution | Data Resource |
|---|---|---|---|---|
| Land dataset | Land use/cover data | 2000, 2010, 2020 | 30 m | GLOBELAND30 (http://www.globallandcover.com/, accessed on 25 September 2022) |
| Topographic factors | DEM | 2022 | 30 m | JAXA-DEM (https://www.eorc.jaxa.jp/ALOS/en/aw3d30/, accessed on 13 October 2022) |
| Slope | 30 m | |||
| Aspect | 30 m | |||
| Climate factors | Annual mean precipitation | 2000–2018 | 30 arc-sec | WorldClim 2.1 (https://www.worldclim.org/, accessed on 16 November 2022) |
| Annual mean temperature | 30 arc-sec | |||
| Soil characteristics | soil type | 2011 | 30 m | National Agriculture and Food Research Organization (https://soil-inventory.rad.naro.go.jp/offer.html, accessed on 28 November 2022) |
| Soil water capacity | 2017 | 250 m | ISRIC-World Soil Information (https://data.isric.org/, accessed on 10 December 2022) | |
| Depth to bedrock | 250 m | |||
| Cumulative probability of organic soil | 250 m | |||
| Soil organic carbon stock | 250 m | |||
| Soil PH | 250 m | |||
| Texture class | 250 m | |||
| Sand content | 250 m | |||
| Clay content | 250 m | |||
| Socioeconomic factors | GDP density | 2015 | 5 km | [37] |
| Population density | 2020 | 100 m | WorldPop (https://hub.worldpop.org/, accessed on 21 December 2022) OpenStreetMap (https://download.geofabrik.de/, accessed on 21 December 2022) | |
| Spatial accessibility | Proximity to town hall | 2022 | 30 m | |
| Proximity to residential | 30 m | |||
| Proximity to transportation node | 30 m | |||
| Proximity to railway | 30 m | |||
| Proximity to trunk/motorway | 30 m | |||
| Proximity to primary road | 30 m | |||
| Proximity to secondary road | 30 m | |||
| Proximity to tertiary road | 30 m | |||
| Proximity to open water | 30 m |
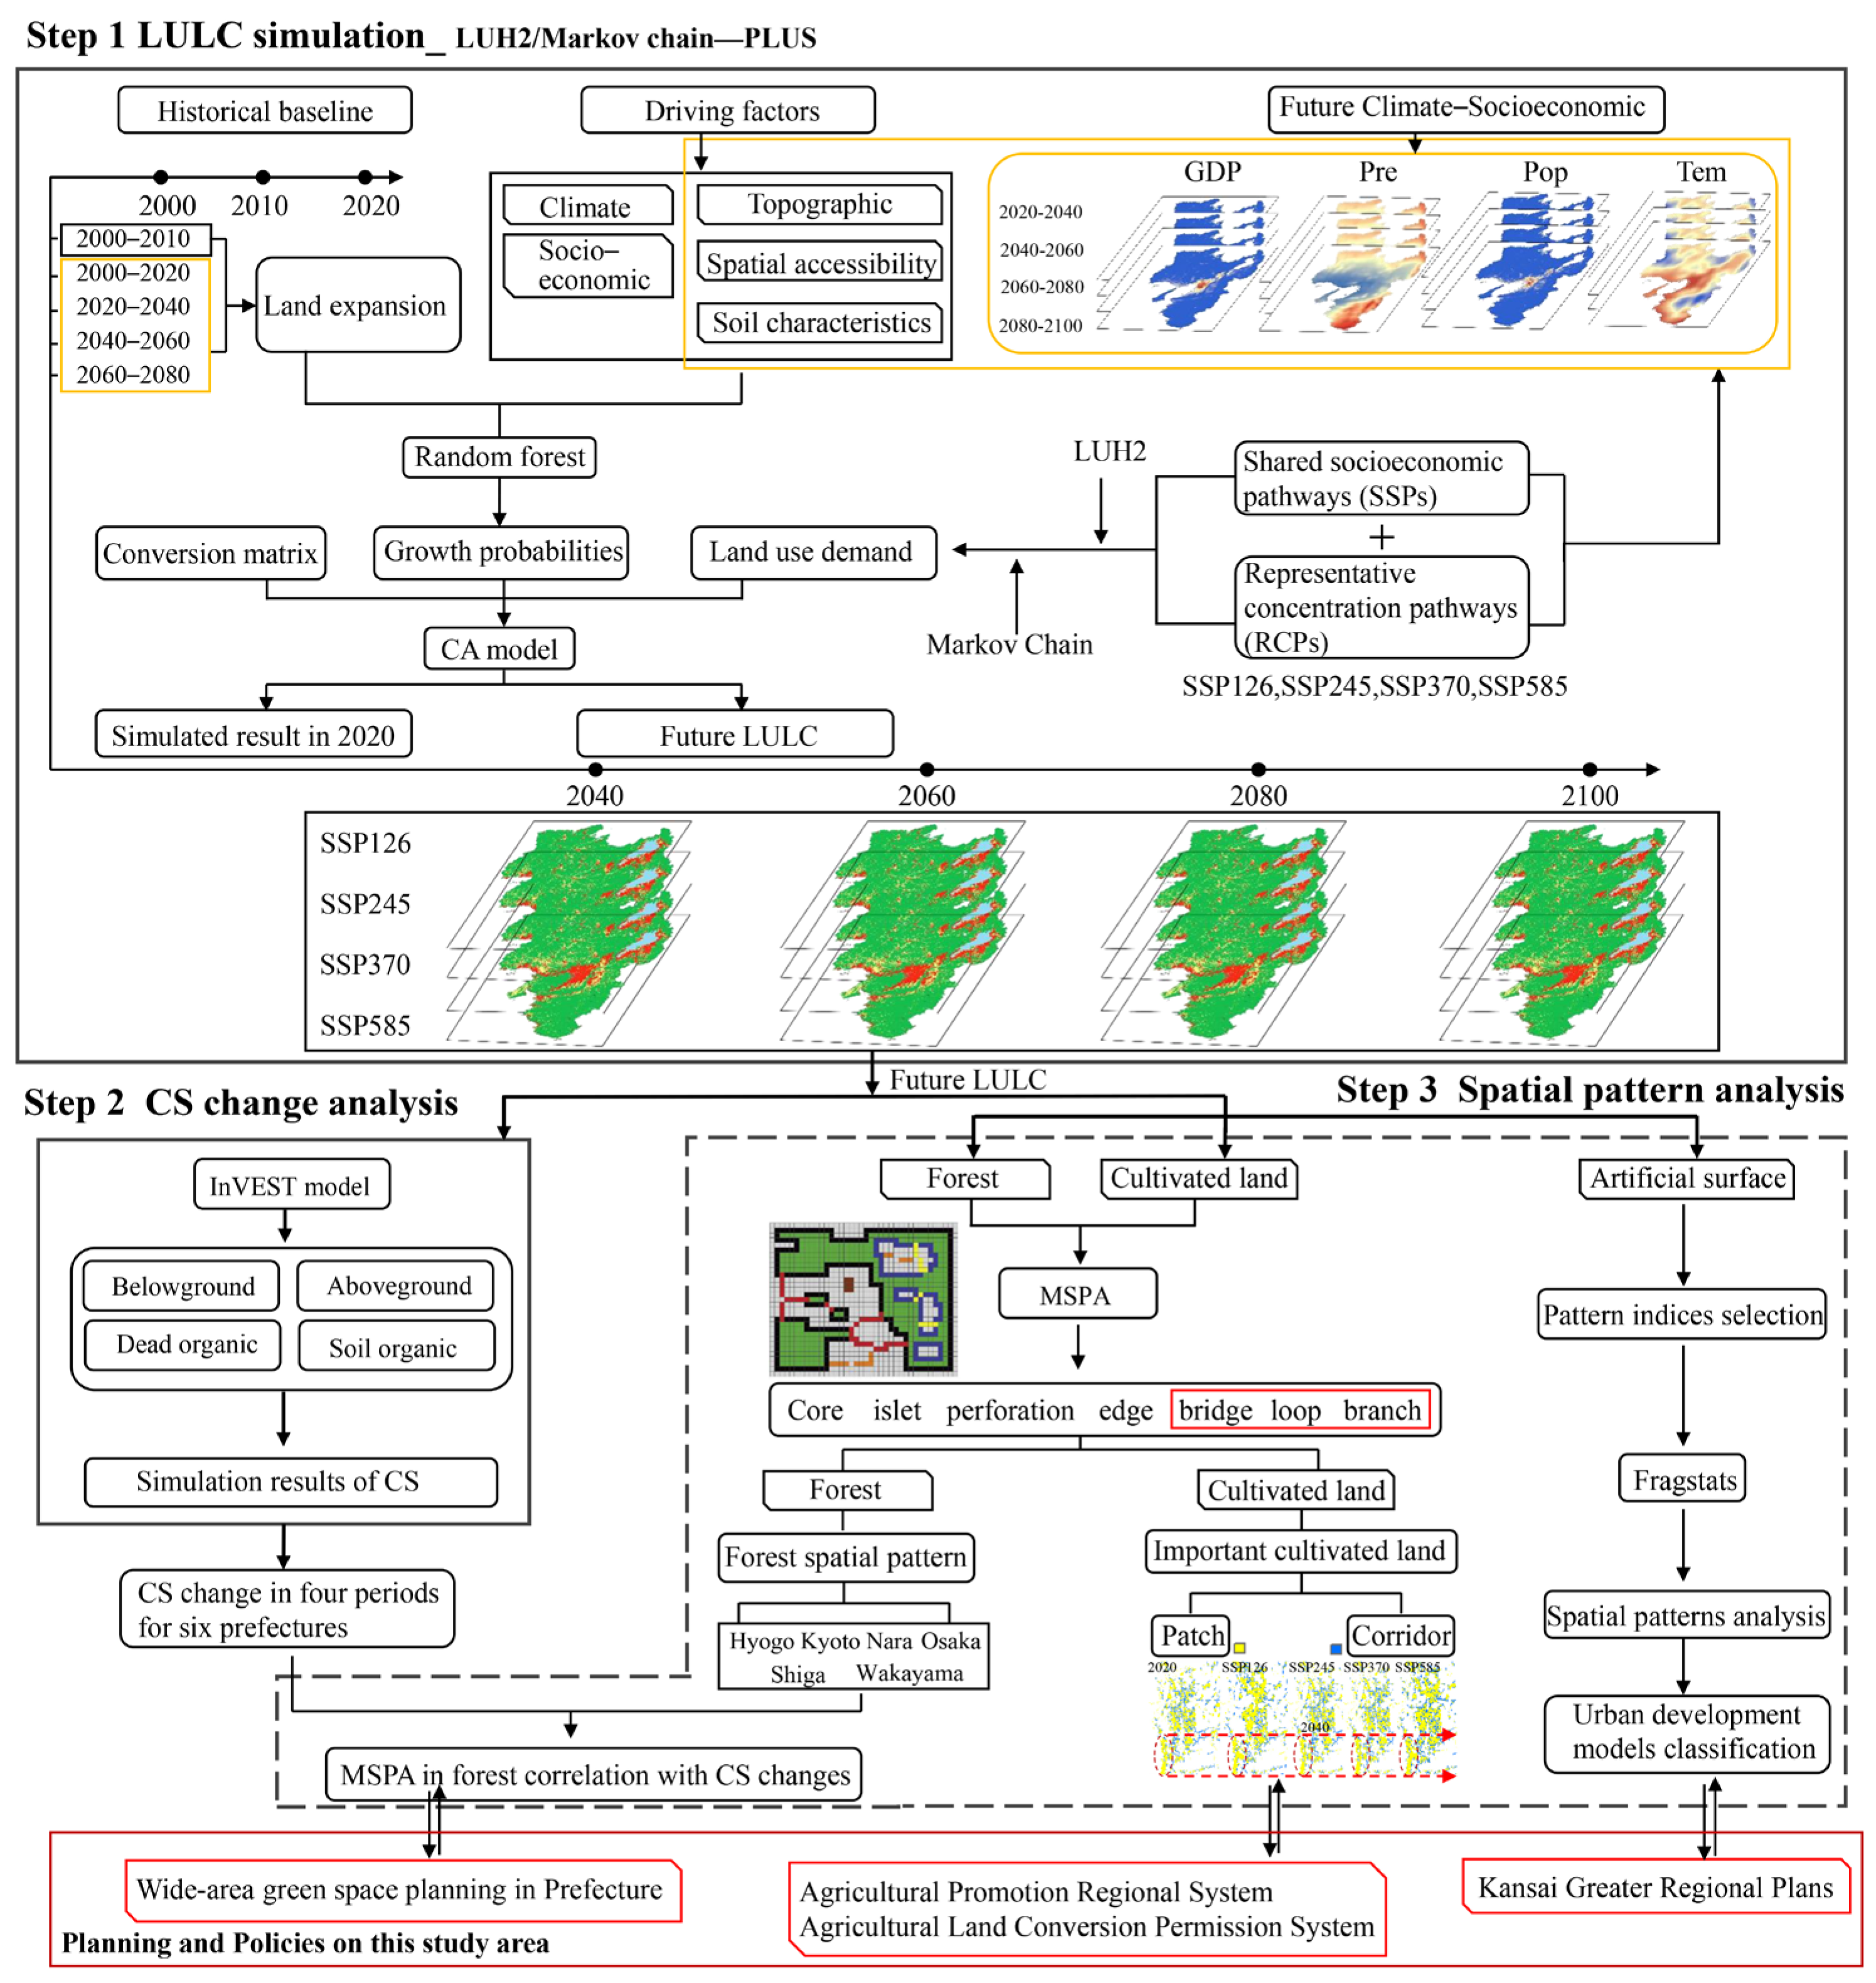
3. Methodology
3.1. Future LULC Scenarios
3.1.1. LULC Demand from LUH2-Markov Chain
3.1.2. Spatiotemporal Dynamic Simulation Based on PLUS
3.1.3. Model Evaluation
3.2. CS Estimation Based on the InVEST Model
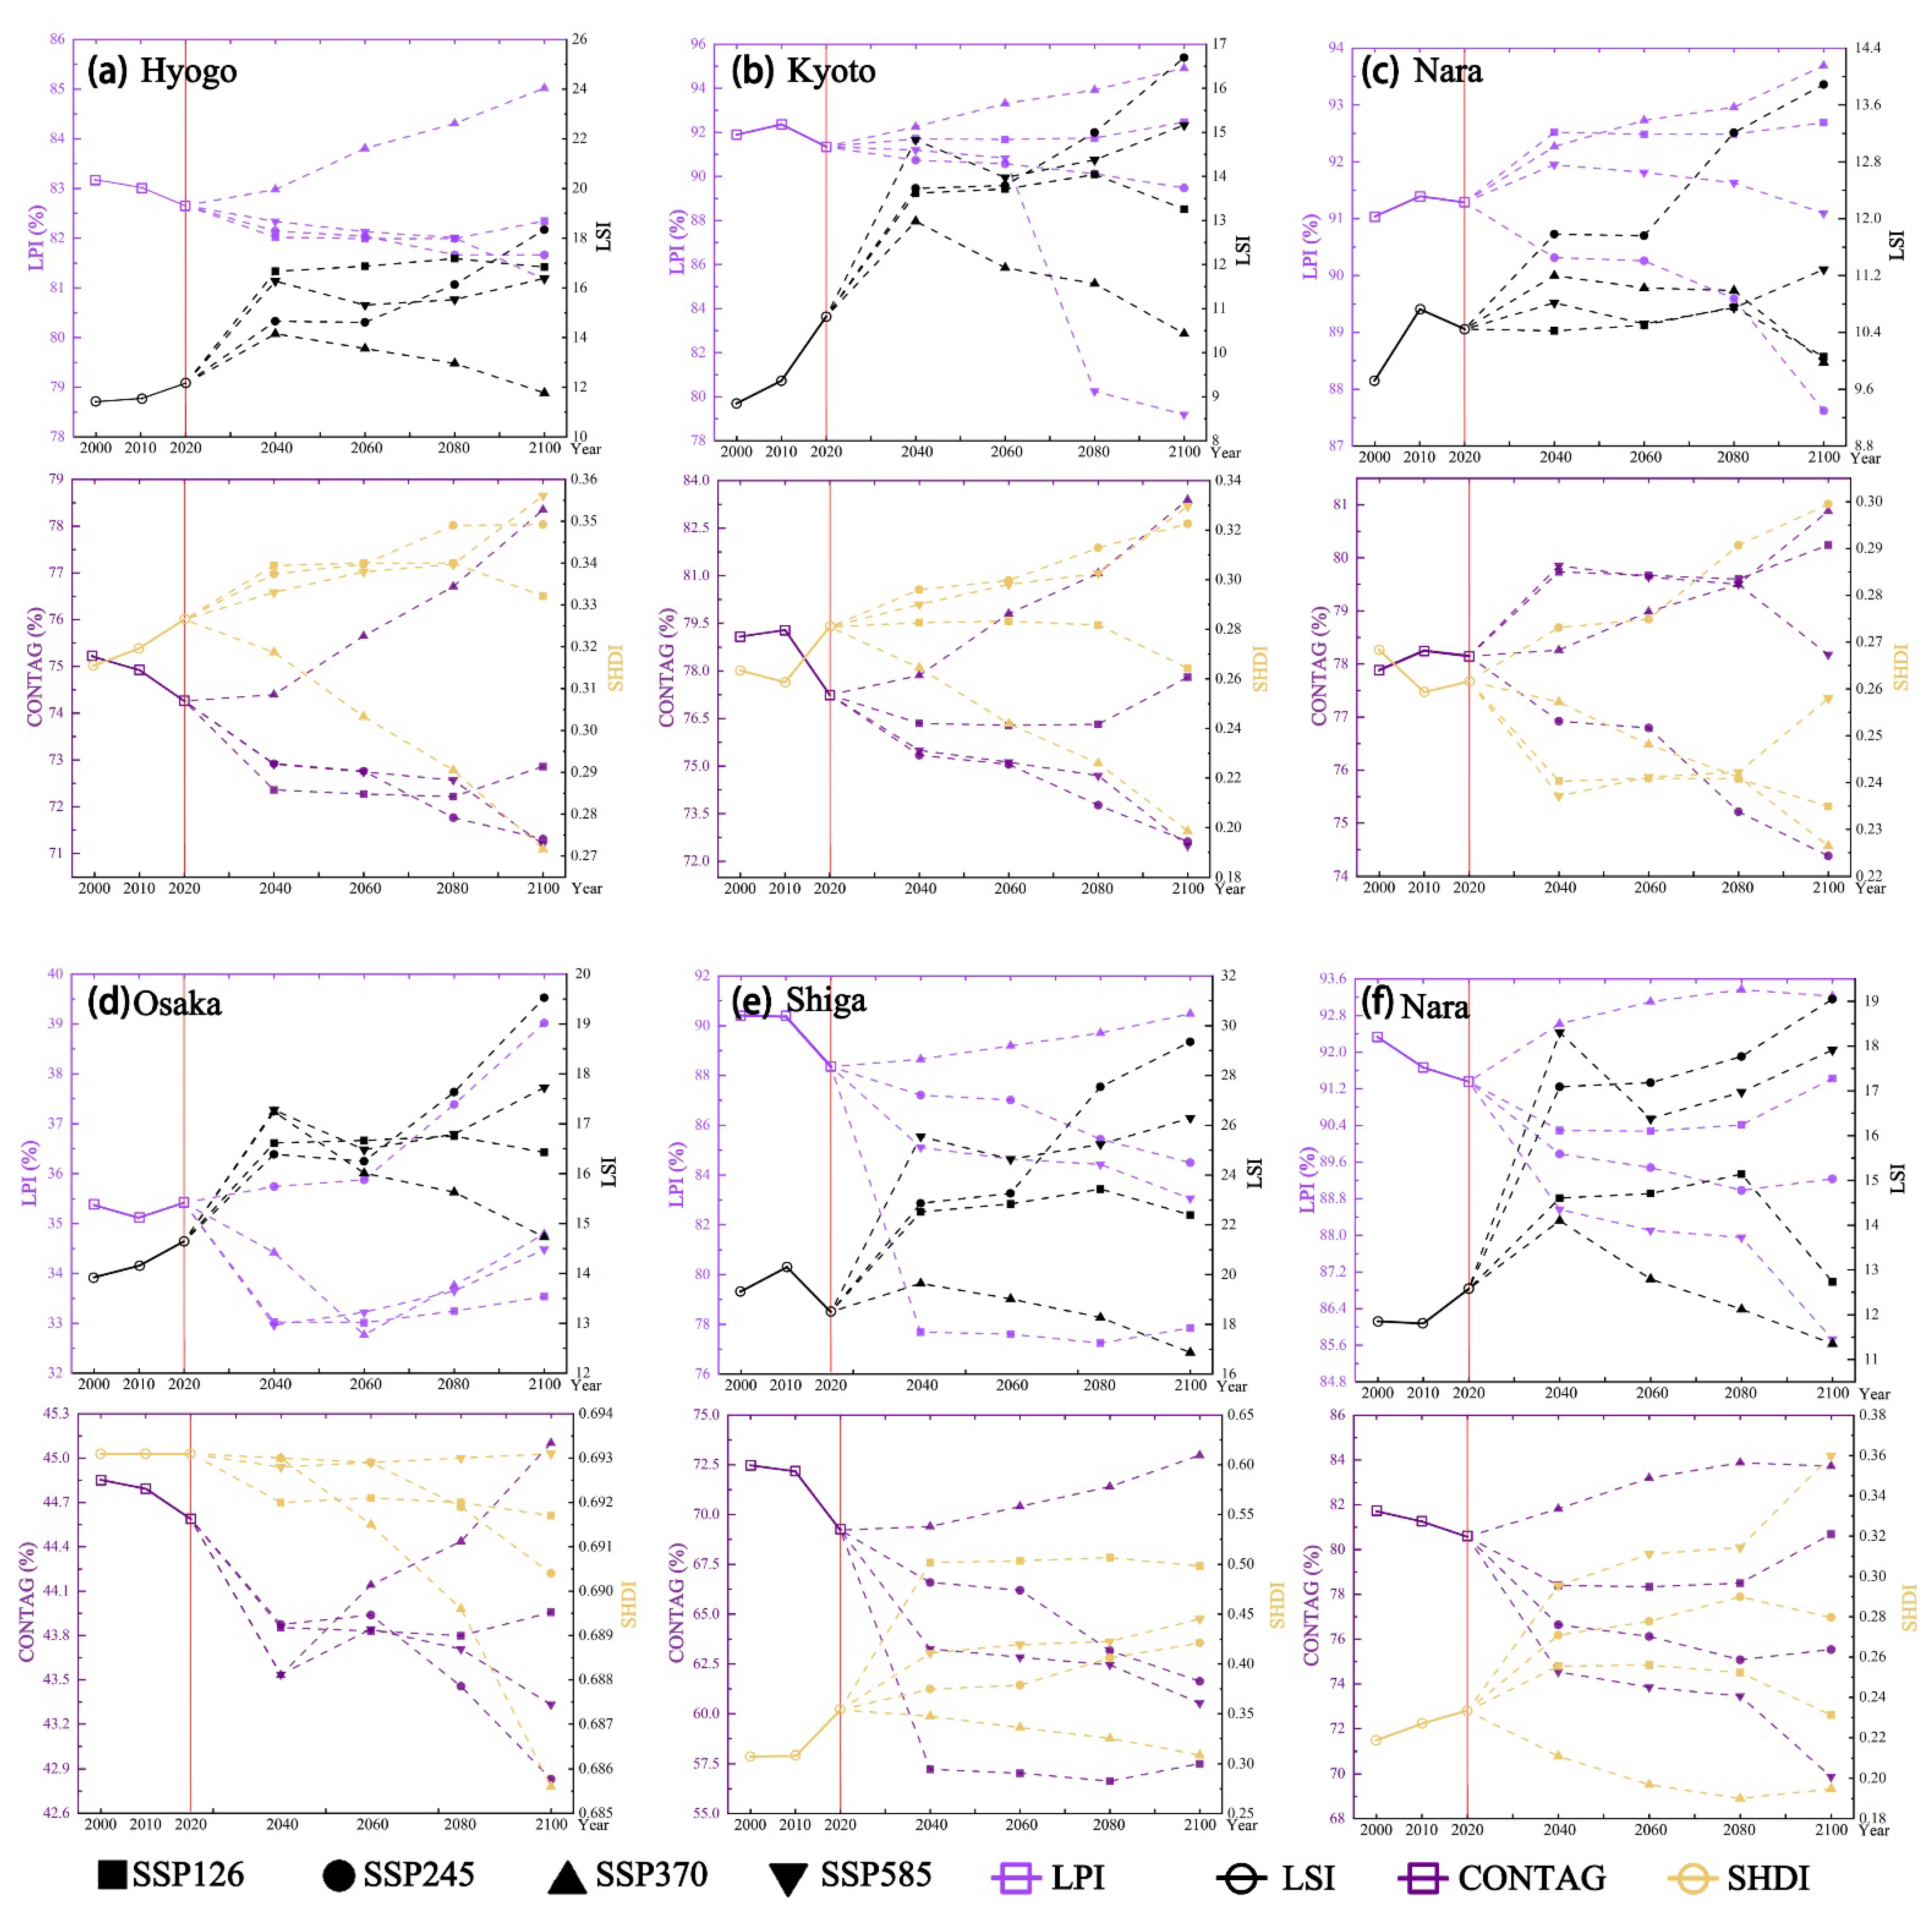
3.3. Spatial Pattern Analysis from the Perspective of LULC Types
3.3.1. Spatial Pattern Analysis of Artificial Surface
3.3.2. Changes in Morphological Patterns of Green Space
3.3.3. Identification of Important Cultivated Land Patches and Corridors
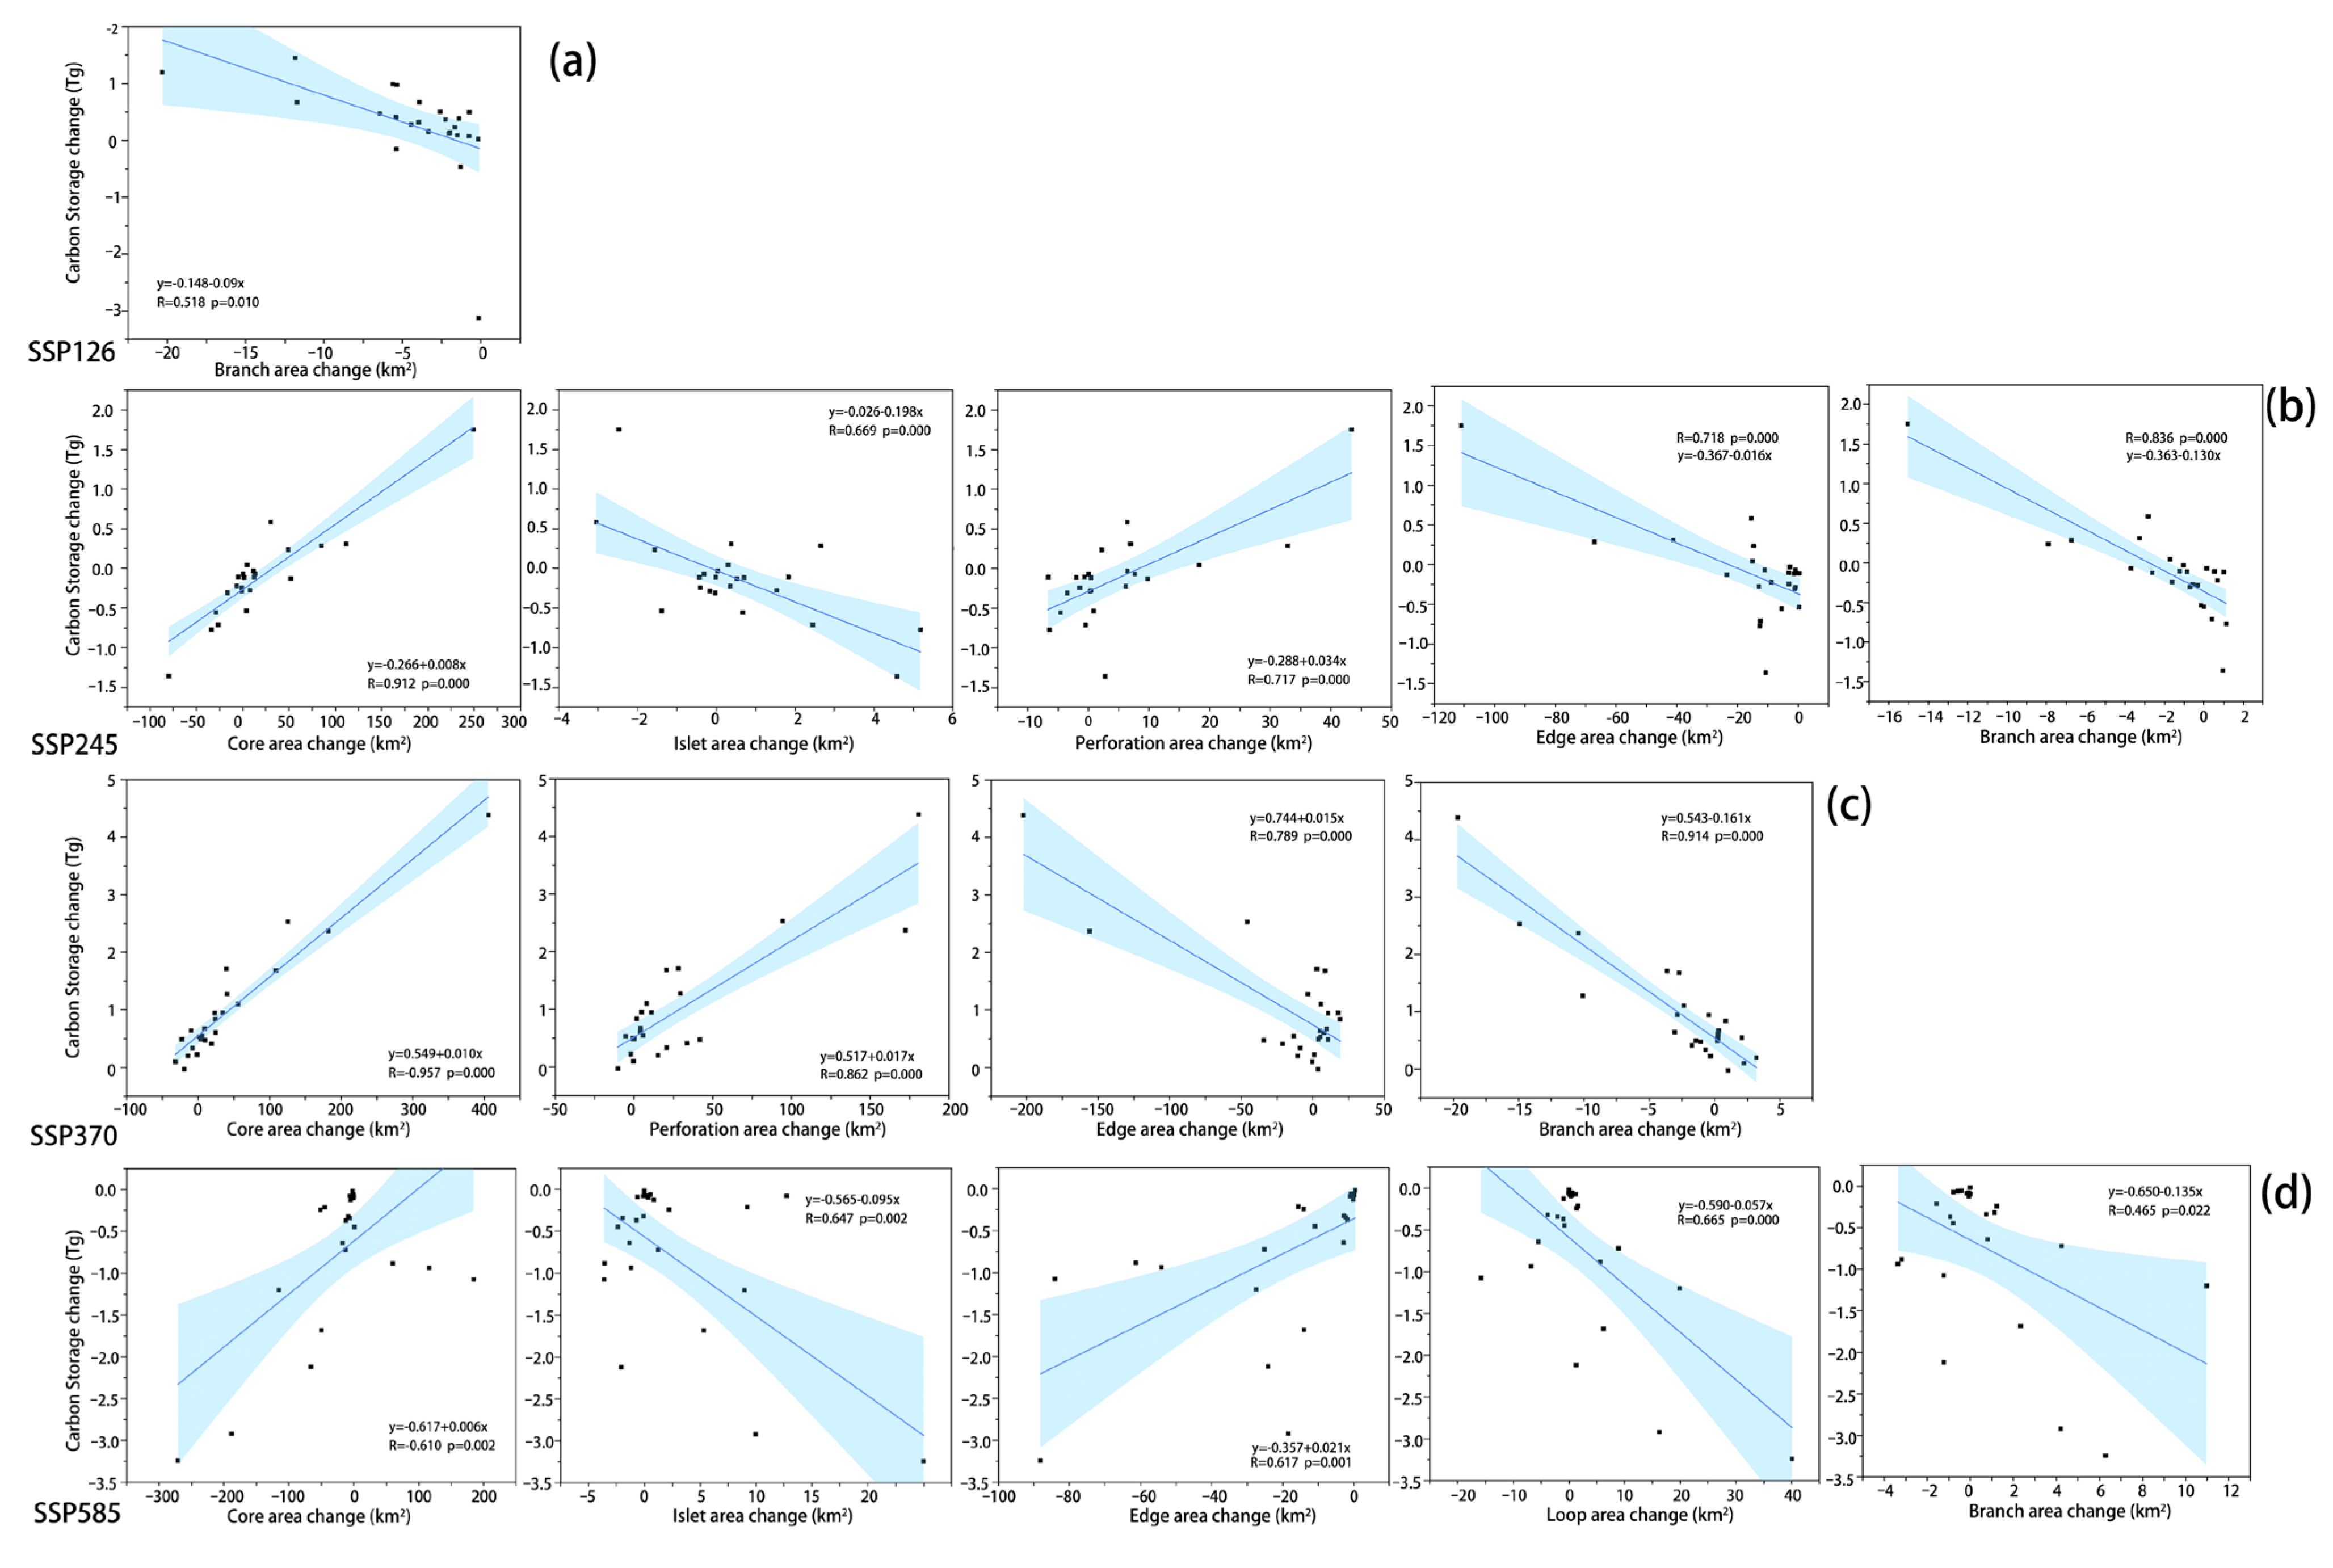
3.3.4. The Correlation between MSPA Classes in Forest and CS Changes
4. Results
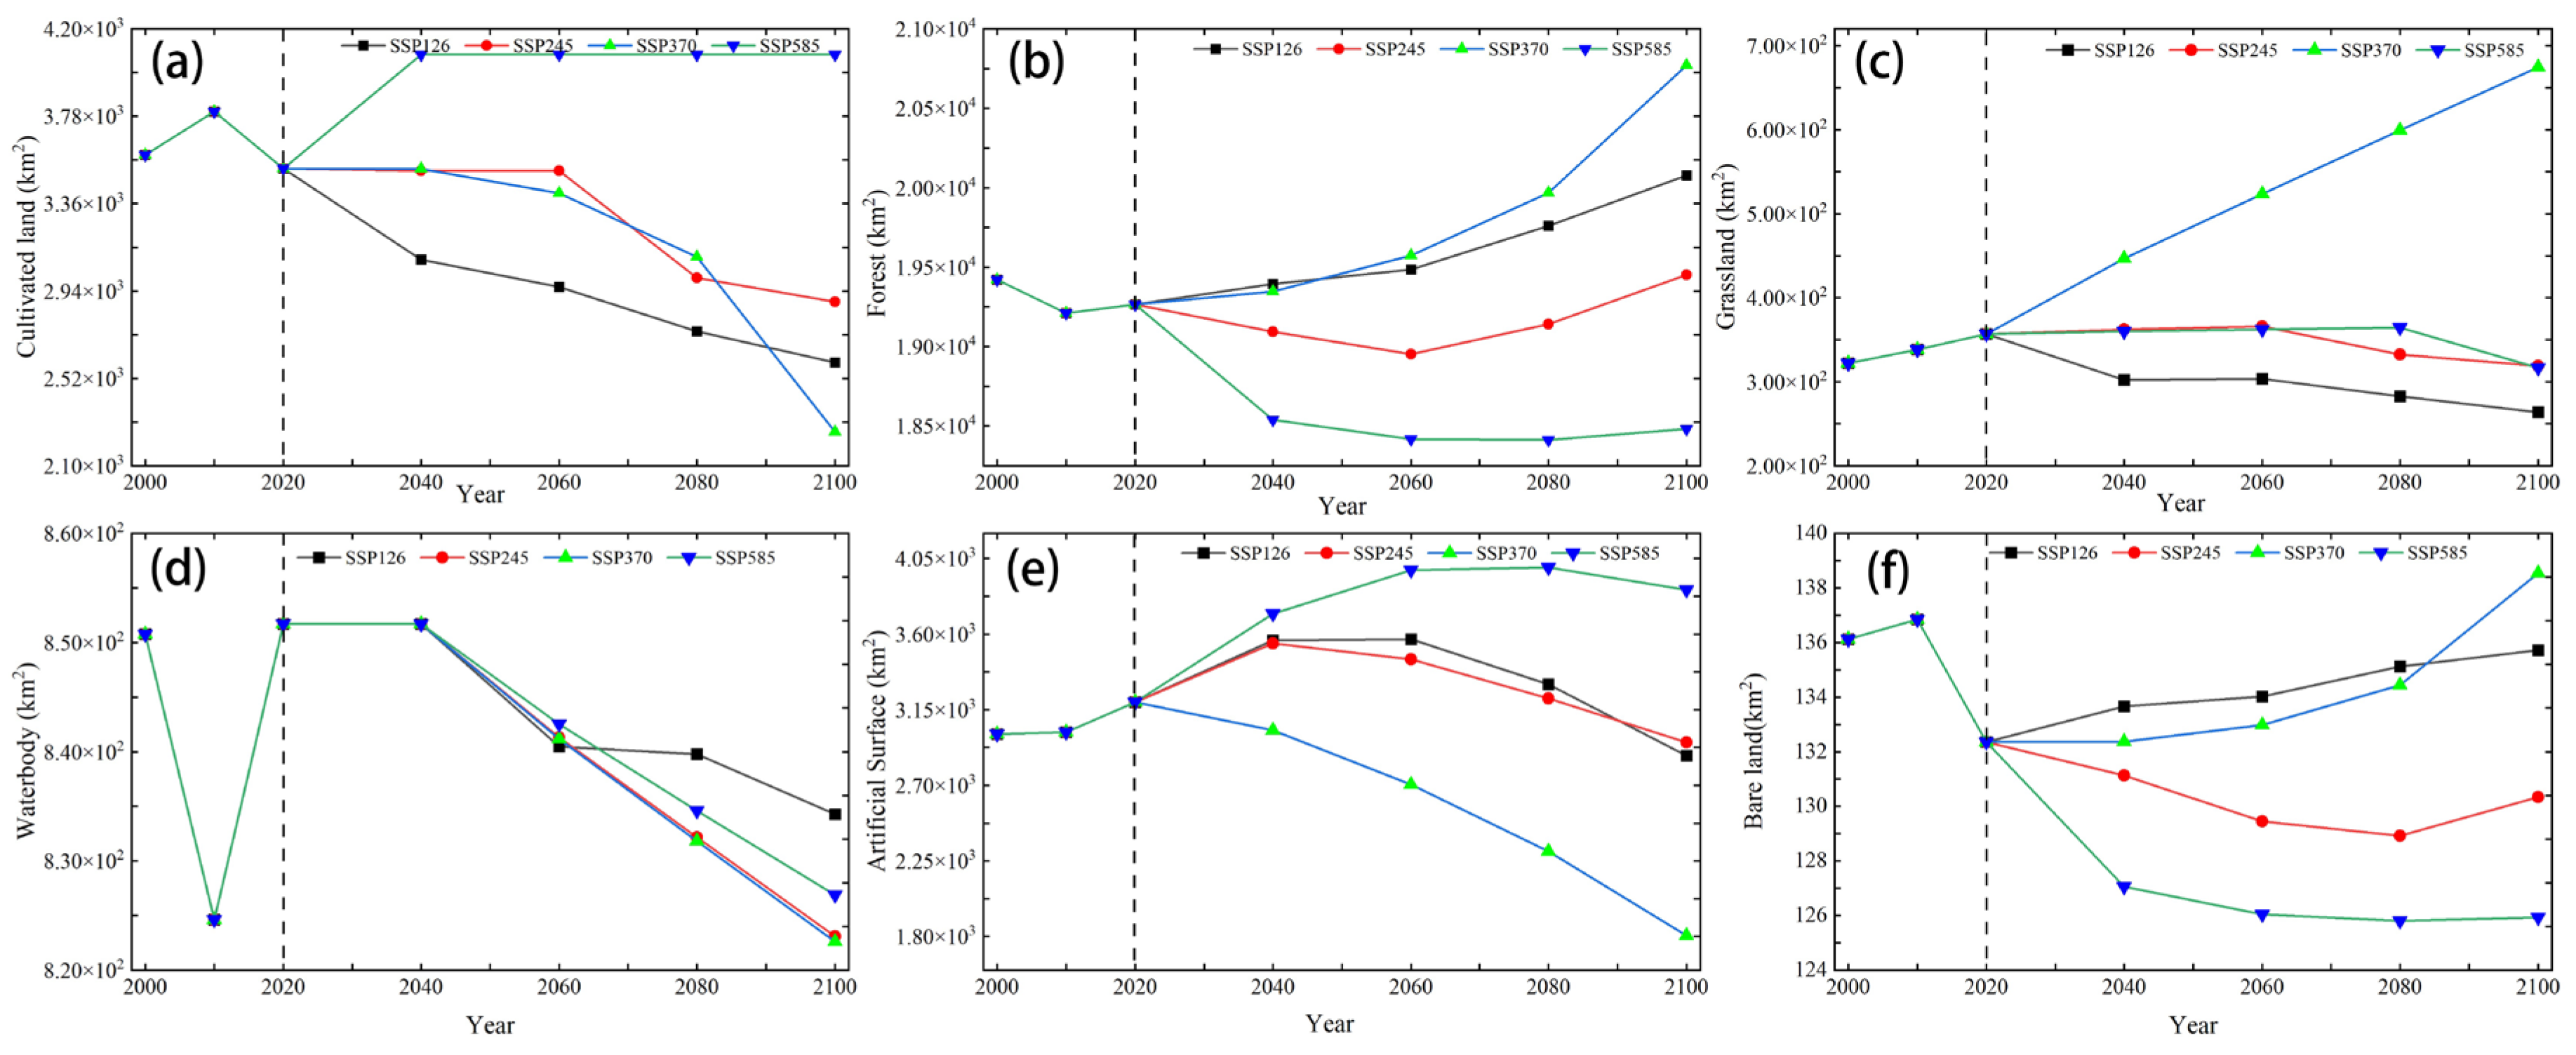
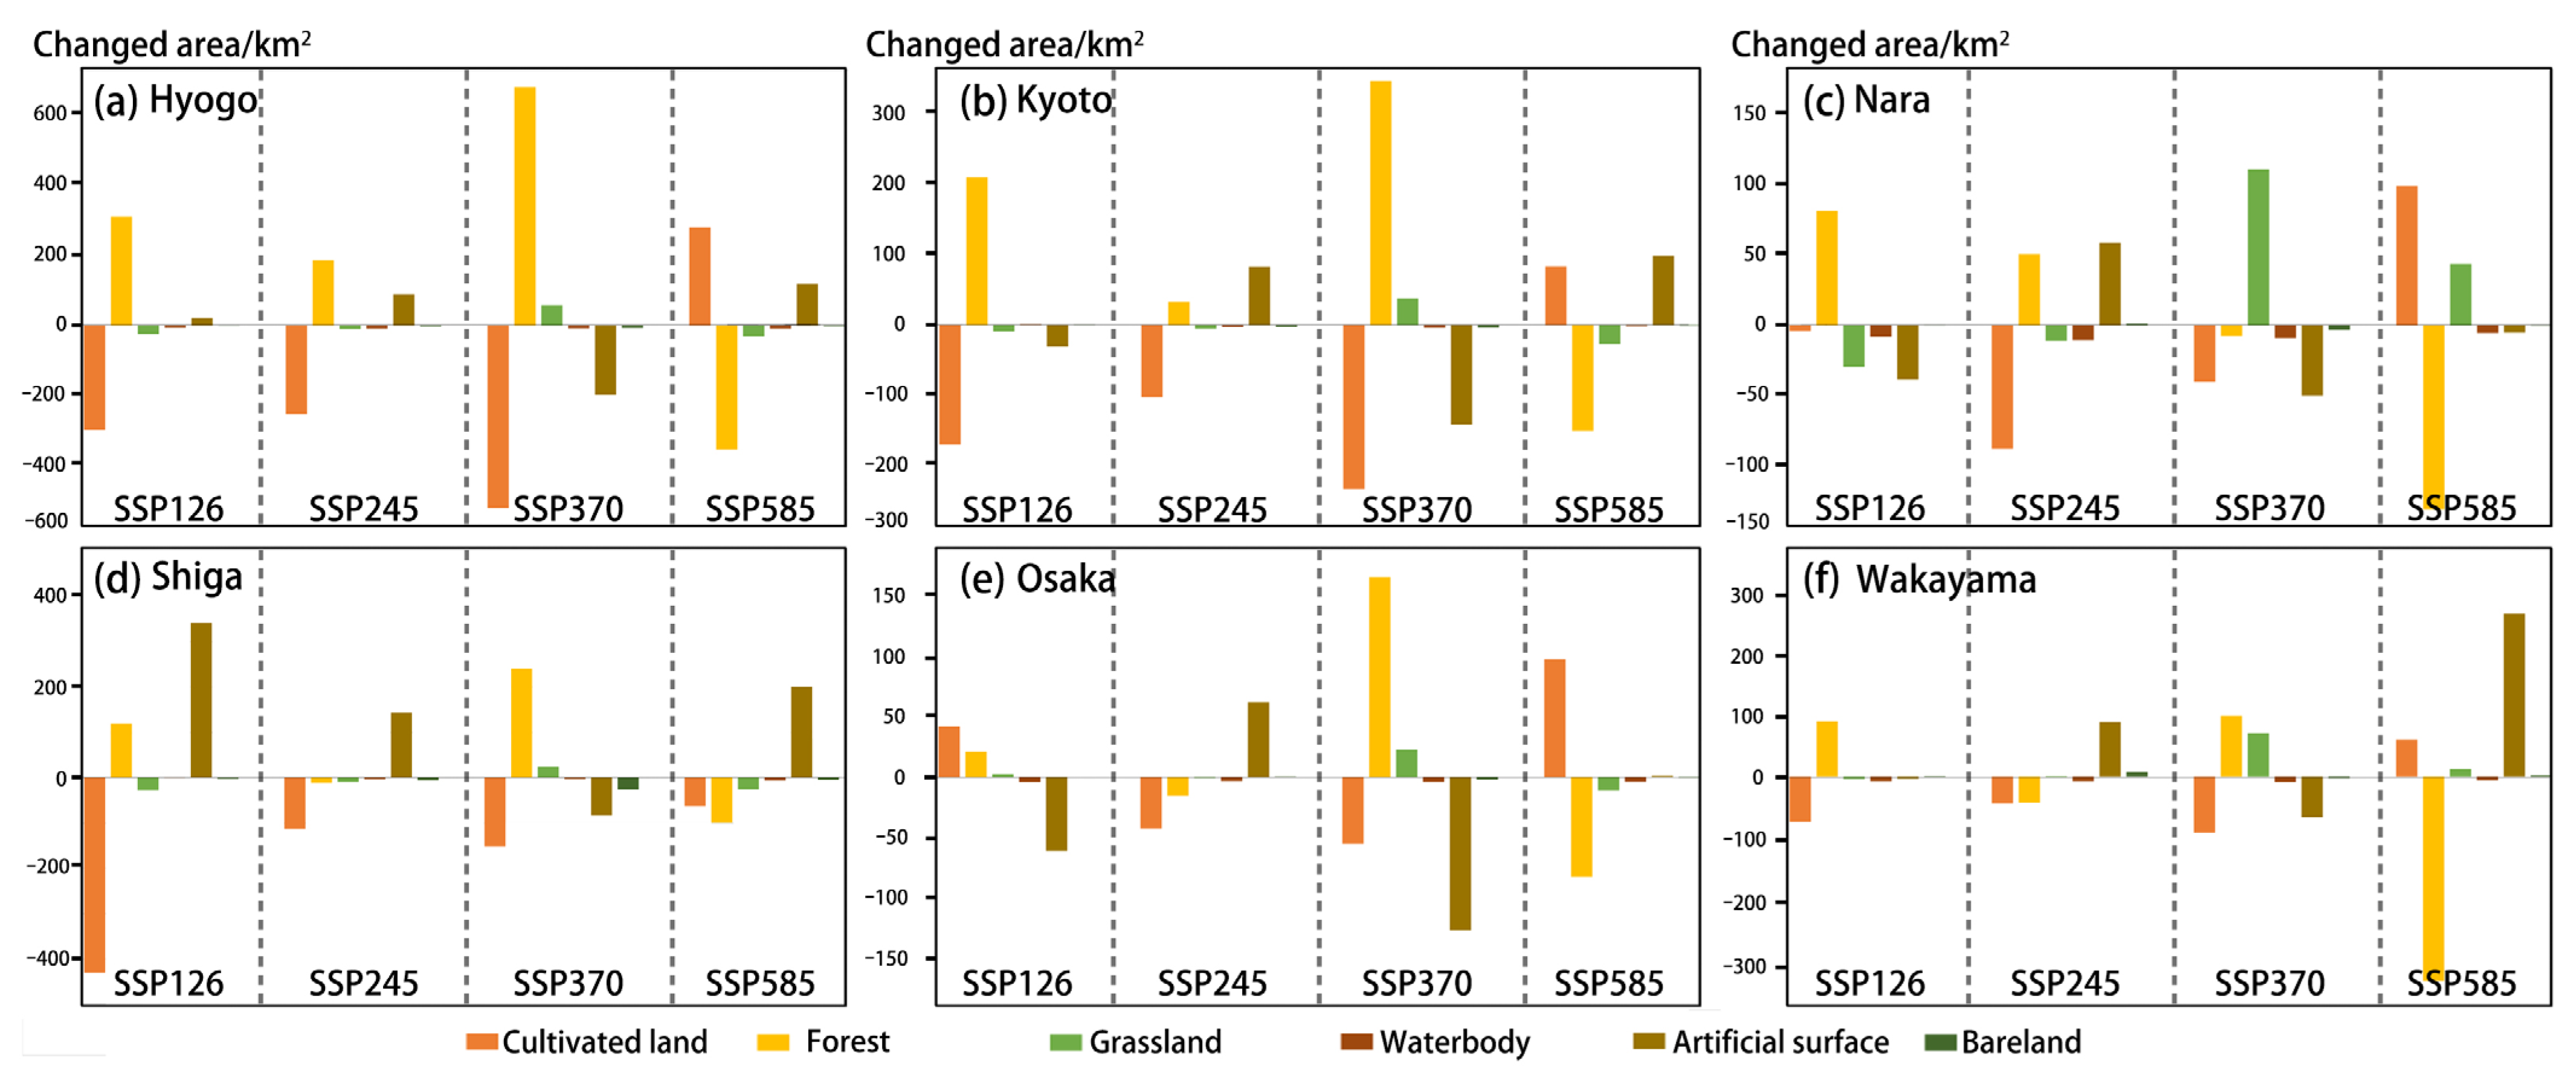
4.1. Future LULC under Different Scenarios
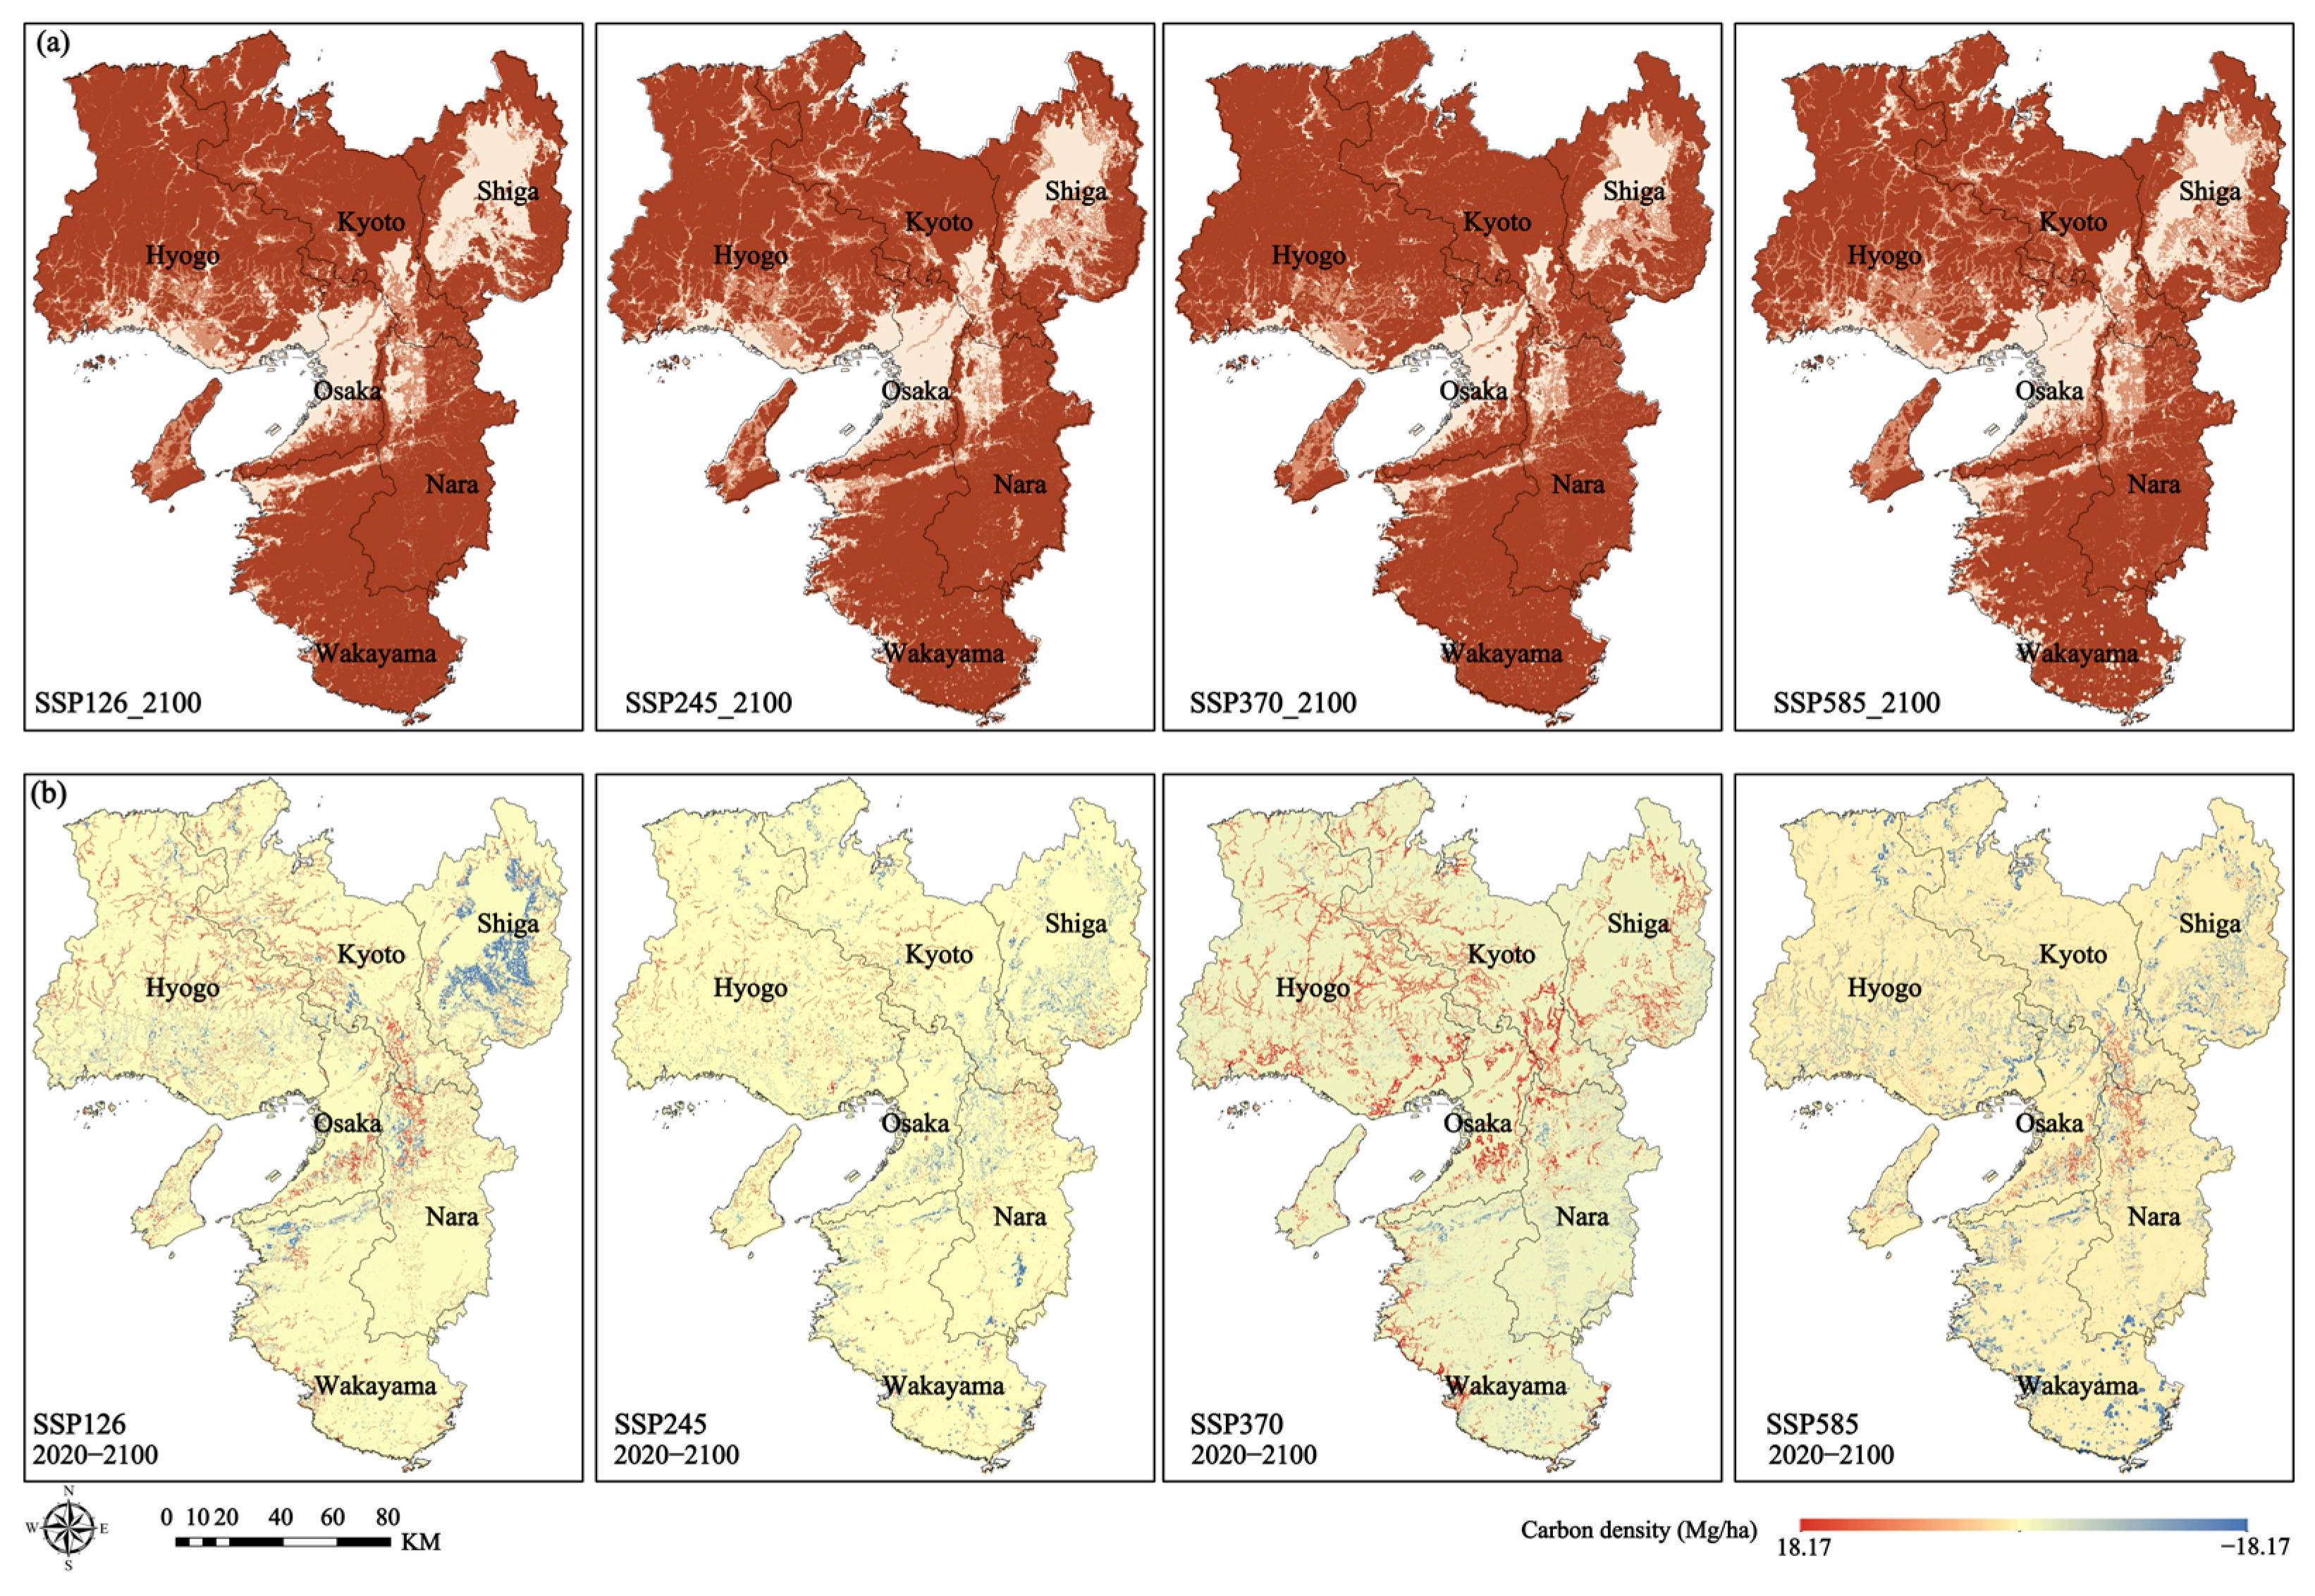
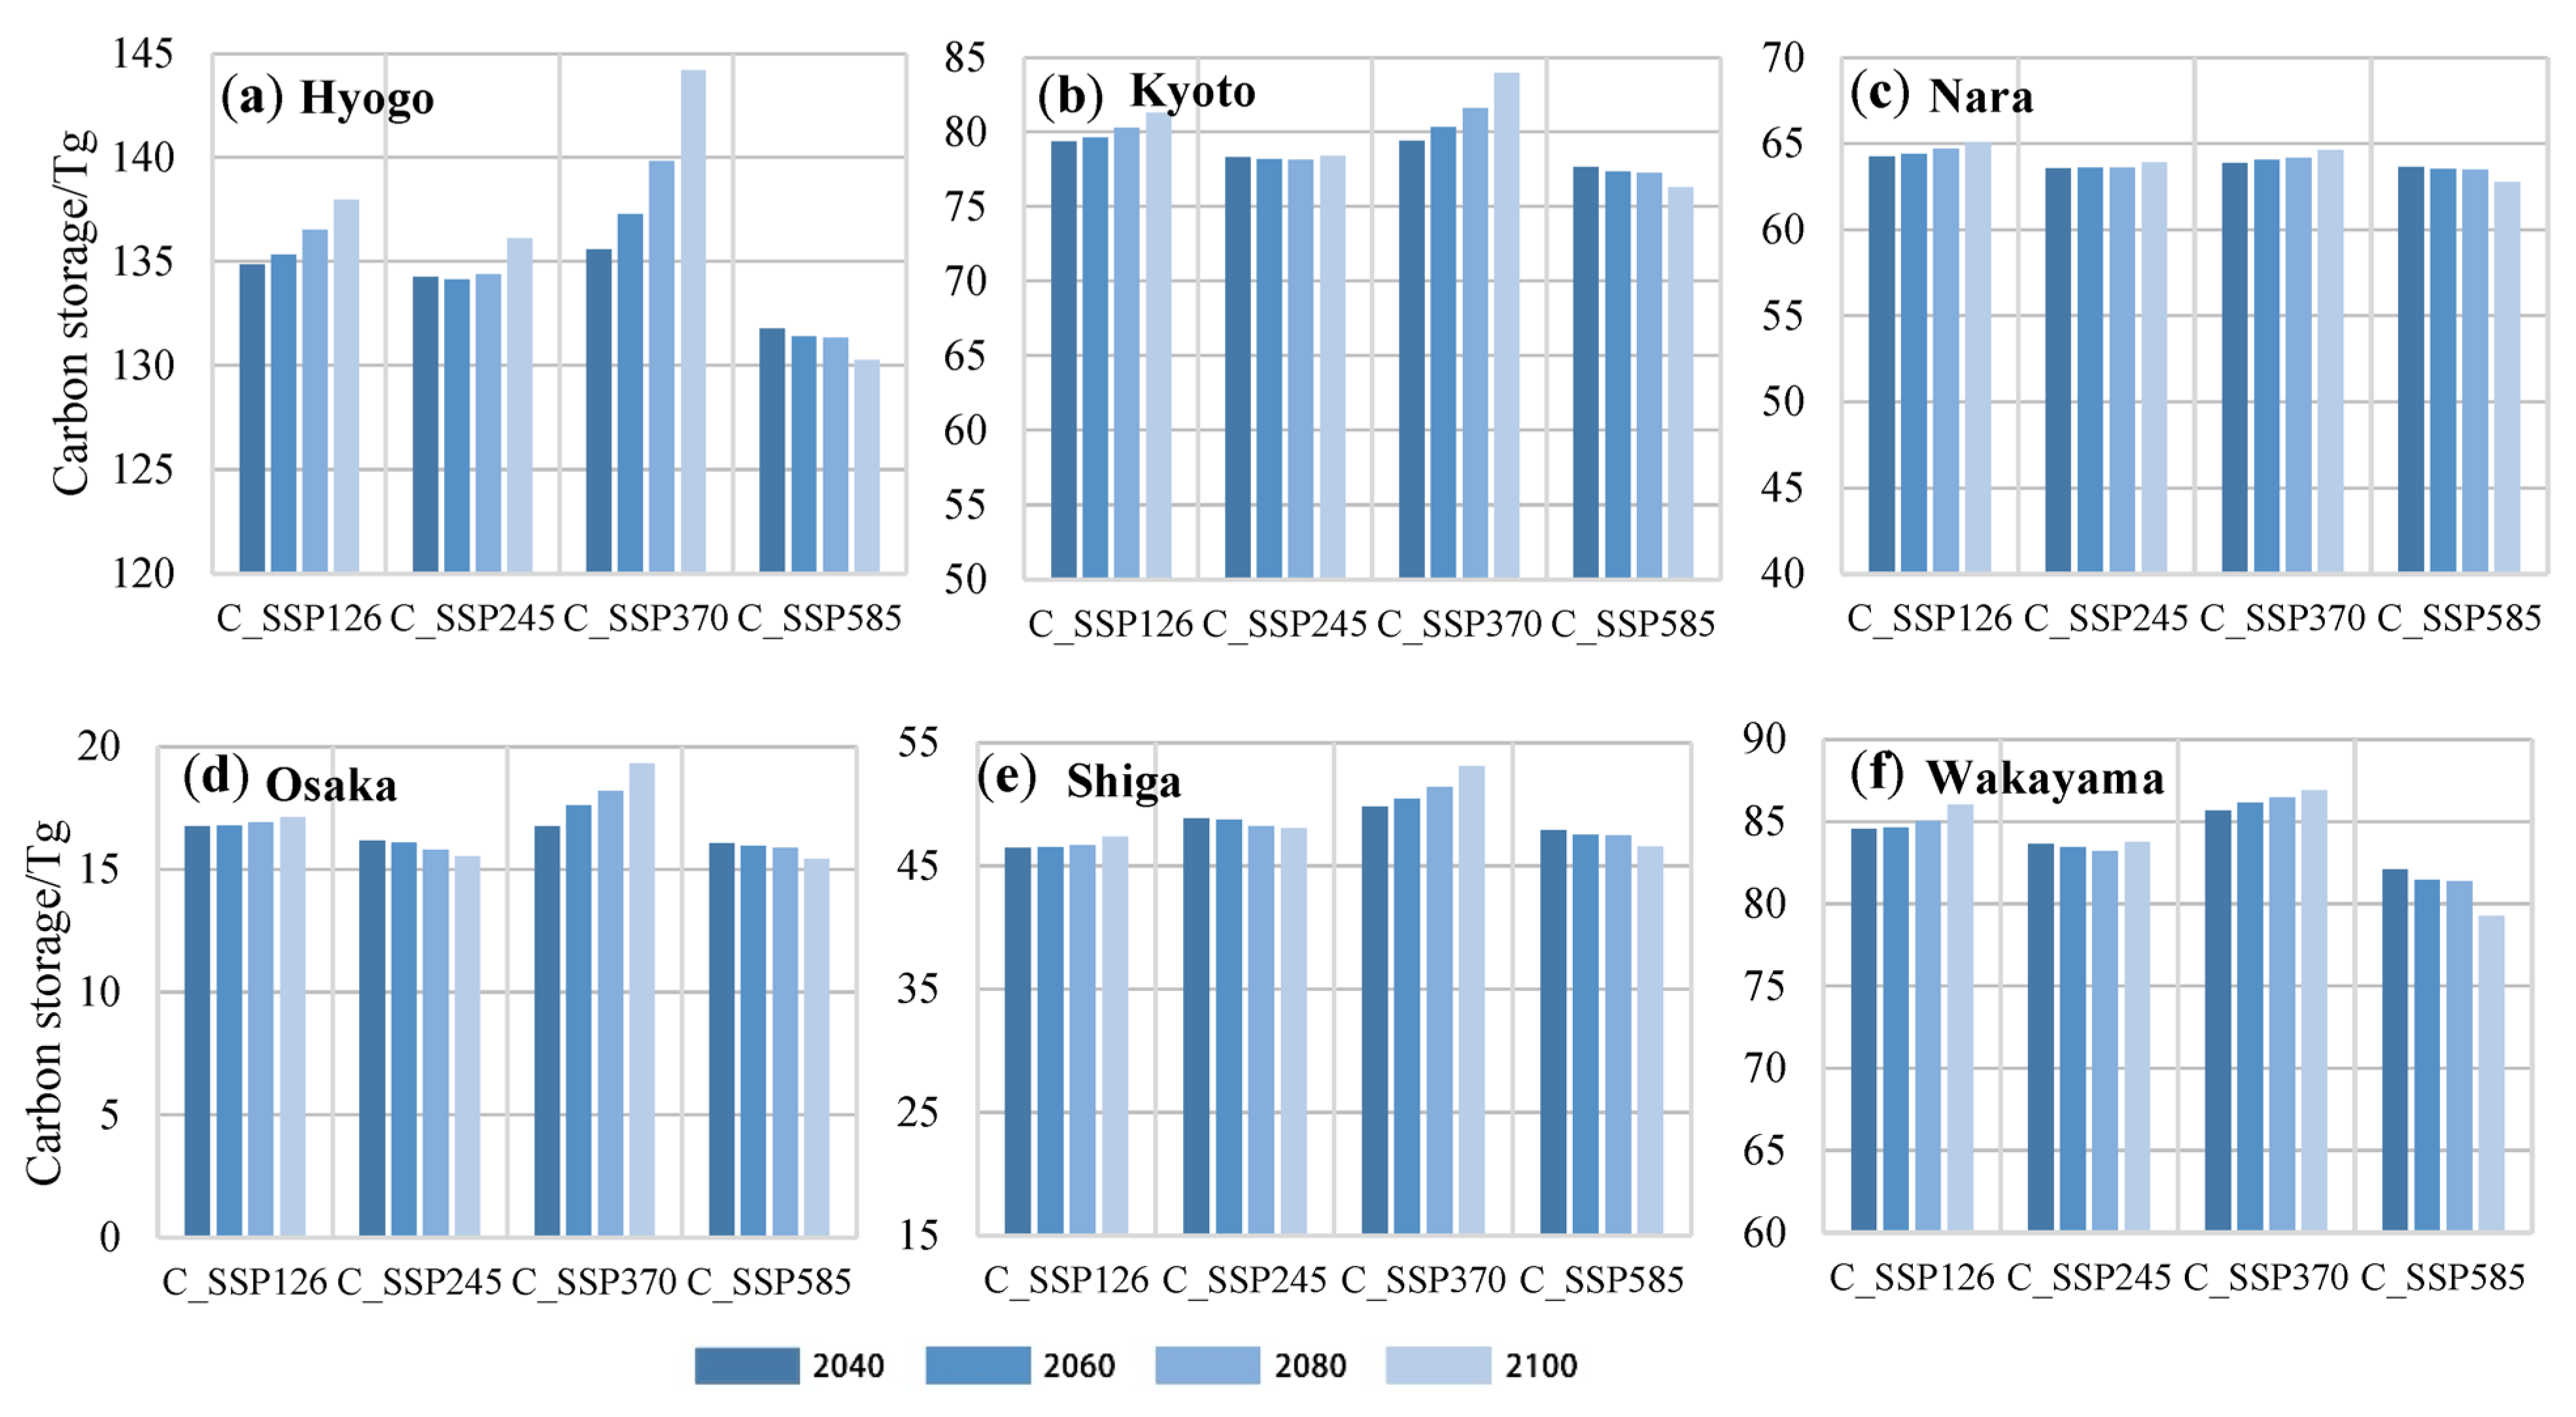
4.2. CS for LULC under CMIP6 Scenarios
4.3. The Spatial Patterns of Artificial Surface Changes
4.4. Important Cultivated Land Patches and Corridors Identification
4.5. Forest MSPA Classes Change and the Influence on CS Changes
5. Discussion
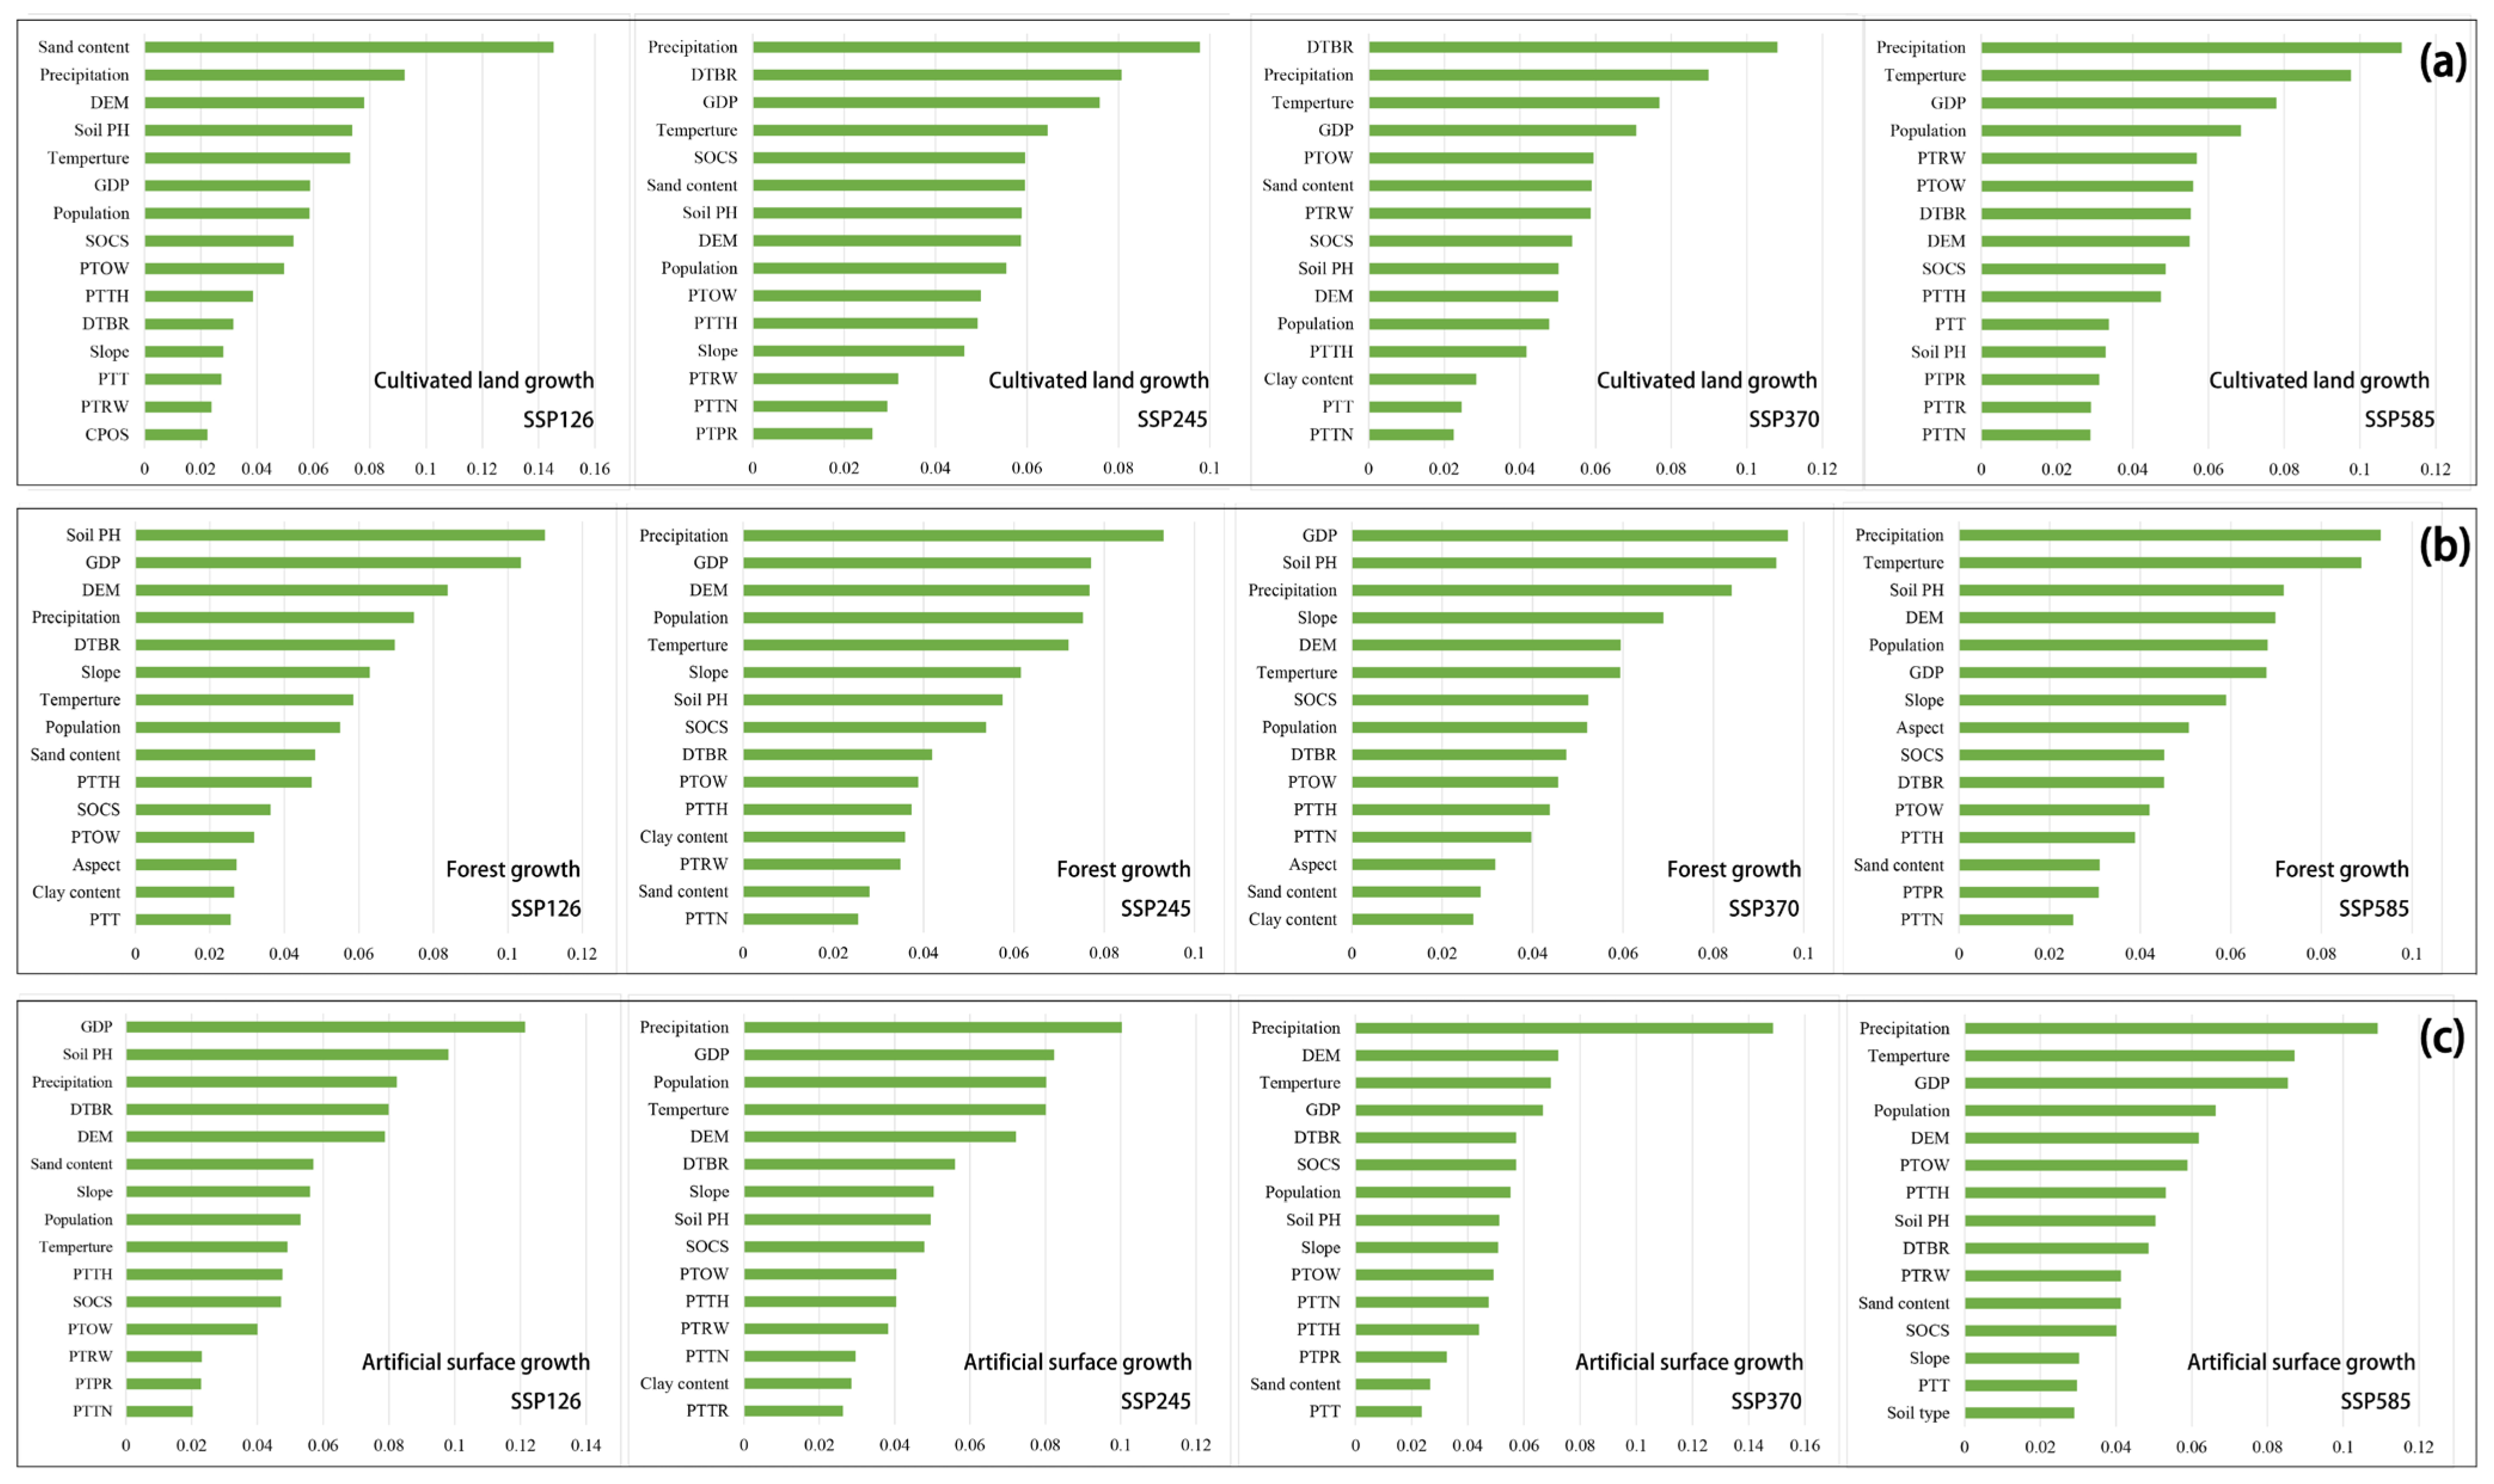
5.1. The Driving Factors Influencing LULC Change
5.2. The Application of Future LULC in Wide-Area Planning
6. Conclusions
Supplementary Materials
Author Contributions
Funding
Data Availability Statement
Conflicts of Interest
References
- IPCC. Climate Change; IPCC: Geneva, Switzerland, 2023; Available online: https://www.ipcc.ch/report/ar6/syr/downloads/report/IPCC_AR6_SYR_SPM.pdf (accessed on 2 May 2023).
- Li, C.; Wu, Y.; Gao, B.; Zheng, K.; Wu, Y.; Li, C. Multi-Scenario Simulation of Ecosystem Service Value for Optimization of Land Use in the Sichuan-Yunnan Ecological Barrier, China. Ecol. Indic. 2021, 132, 108328. [Google Scholar] [CrossRef]
- Wang, Z.; Li, X.; Mao, Y.; Li, L.; Wang, X.; Lin, Q. Dynamic Simulation of Land Use Change and Assessment of Carbon Storage Based on Climate Change Scenarios at the City Level: A Case Study of Bortala, China. Ecol. Indic. 2022, 134, 108499. [Google Scholar] [CrossRef]
- Tian, L.; Tao, Y.; Fu, W.; Li, T.; Ren, F.; Li, M. Dynamic Simulation of Land Use/Cover Change and Assessment of Forest Ecosystem Carbon Storage under Climate Change Scenarios in Guangdong Province, China. Remote Sens. 2022, 14, 2330. [Google Scholar] [CrossRef]
- Xiang, S.; Wang, Y.; Deng, H.; Yang, C.; Wang, Z.; Gao, M. Response and Multi-Scenario Prediction of Carbon Storage to Land Use/Cover Change in the Main Urban Area of Chongqing, China. Ecol. Indic. 2022, 142, 109205. [Google Scholar] [CrossRef]
- Raum, S.; Hand, K.L.; Hall, C.; Edwards, D.M.; O’Brien, L.; Doick, K.J. Achieving Impact from Ecosystem Assessment and Valuation of Urban Greenspace: The Case of i-Tree Eco in Great Britain. Landsc. Urban Plan. 2019, 190, 103590. [Google Scholar] [CrossRef]
- Ul Din, S.; Mak, H.W.L. Retrieval of Land-Use/Land Cover Change (LUCC) Maps and Urban Expansion Dynamics of Hyderabad, Pakistan via Landsat Datasets and Support Vector Machine Framework. Remote Sens. 2021, 13, 3337. [Google Scholar] [CrossRef]
- Xiong, N.; Yu, R.; Yan, F.; Wang, J.; Feng, Z. Land Use and Land Cover Changes and Prediction Based on Multi-Scenario Simulation: A Case Study of Qishan County, China. Remote Sens. 2022, 14, 4041. [Google Scholar] [CrossRef]
- Bagan, H.; Yamagata, Y. Land-Cover Change Analysis in 50 Global Cities by Using a Combination of Landsat Data and Analysis of Grid Cells. Environ. Res. Lett. 2014, 9, 064015. [Google Scholar] [CrossRef]
- Güneralp, B.; Reba, M.; Hales, B.U.; Wentz, E.A.; Seto, K.C. Trends in Urban Land Expansion, Density, and Land Transitions from 1970 to 2010: A Global Synthesis. Environ. Res. Lett. 2020, 15, 044015. [Google Scholar] [CrossRef]
- Shi, X.; Matsui, T.; Haga, C.; Machimura, T.; Hashimoto, S.; Saito, O. A Scenario- and Spatial-Downscaling-Based Land-Use Modeling Framework to Improve the Projections of Plausible Futures: A Case Study of the Guangdong–Hong Kong–Macao Greater Bay Area, China. Sustain. Sci. 2021, 16, 1977–1998. [Google Scholar] [CrossRef]
- Popp, A.; Calvin, K.; Fujimori, S.; Havlik, P.; Humpenöder, F.; Stehfest, E.; Bodirsky, B.L.; Dietrich, J.P.; Doelmann, J.C.; Gusti, M.; et al. Land-Use Futures in the Shared Socio-Economic Pathways. Glob. Environ. Chang. 2017, 42, 331–345. [Google Scholar] [CrossRef]
- Eyring, V.; Bony, S.; Meehl, G.A.; Senior, C.A.; Stevens, B.; Stouffer, R.J.; Taylor, K.E. Overview of the Coupled Model Intercomparison Project Phase 6 (CMIP6) Experimental Design and Organization. Geosci. Model Dev. 2016, 9, 1937–1958. [Google Scholar] [CrossRef]
- Tebaldi, C.; Debeire, K.; Eyring, V.; Fischer, E.; Fyfe, J.; Friedlingstein, P.; Knutti, R.; Lowe, J.; O’Neill, B.; Sanderson, B.; et al. Climate Model Projections from the Scenario Model Intercomparison Project (ScenarioMIP) of CMIP6. Earth Syst. Dyn. 2021, 12, 253–293. [Google Scholar] [CrossRef]
- O’Neill, B.C.; Tebaldi, C.; Van Vuuren, D.P.; Eyring, V.; Friedlingstein, P.; Hurtt, G.; Knutti, R.; Kriegler, E.; Lamarque, J.-F.; Lowe, J.; et al. The Scenario Model Intercomparison Project (ScenarioMIP) for CMIP6. Geosci. Model Dev. 2016, 9, 3461–3482. [Google Scholar] [CrossRef]
- Gong, L.; Zhang, X.; Pan, G.; Zhao, J.; Zhao, Y. Hydrological Responses to Co-Impacts of Climate Change and Land Use/Cover Change Based on CMIP6 in the Ganjiang River, Poyang Lake Basin. Anthropocene 2023, 41, 100368. [Google Scholar] [CrossRef]
- Hurtt, G.C.; Chini, L.; Sahajpal, R.; Frolking, S.; Bodirsky, B.L.; Calvin, K.; Doelman, J.C.; Fisk, J.; Fujimori, S.; Klein Goldewijk, K.; et al. Harmonization of Global Land Use Change and Management for the Period 850–2100 (LUH2) for CMIP6. Geosci. Model Dev. 2020, 13, 5425–5464. [Google Scholar] [CrossRef]
- Kumar, N.; Singh, V.G.; Singh, S.K.; Behera, D.K.; Gašparović, M. Modeling of Land Use Change under the Recent Climate Projections of CMIP6: A Case Study of Indian River Basin. Environ. Sci. Pollut. Res. 2023. [Google Scholar] [CrossRef] [PubMed]
- Liao, W.; Liu, X.; Xu, X.; Chen, G.; Liang, X.; Zhang, H.; Li, X. Projections of Land Use Changes under the Plant Functional Type Classification in Different SSP-RCP Scenarios in China. Sci. Bull. 2020, 65, 1935–1947. [Google Scholar] [CrossRef] [PubMed]
- Nasiakou, S.; Vrahnakis, M.; Chouvardas, D.; Mamanis, G.; Kleftoyanni, V. Land Use Changes for Investments in Silvoarable Agriculture Projected by the CLUE-S Spatio-Temporal Model. Land 2022, 11, 598. [Google Scholar] [CrossRef]
- Sobhani, P.; Esmaeilzadeh, H.; Mostafavi, H. Simulation and Impact Assessment of Future Land Use and Land Cover Changes in Two Protected Areas in Tehran, Iran. Sustain. Cities Soc. 2021, 75, 103296. [Google Scholar] [CrossRef]
- Sun, J.; Zhang, Y.; Qin, W.; Chai, G. Estimation and Simulation of Forest Carbon Stock in Northeast China Forestry Based on Future Climate Change and LUCC. Remote Sens. 2022, 14, 3653. [Google Scholar] [CrossRef]
- Liang, X.; Guan, Q.; Clarke, K.C.; Liu, S.; Wang, B.; Yao, Y. Understanding the Drivers of Sustainable Land Expansion Using a Patch-Generating Land Use Simulation (PLUS) Model: A Case Study in Wuhan, China. Comput. Environ. Urban Syst. 2021, 85, 101569. [Google Scholar] [CrossRef]
- Gomes, E.; Inácio, M.; Bogdzevič, K.; Kalinauskas, M.; Karnauskaitė, D.; Pereira, P. Future Land-Use Changes and Its Impacts on Terrestrial Ecosystem Services: A Review. Sci. Total Environ. 2021, 781, 146716. [Google Scholar] [CrossRef] [PubMed]
- Hou, Y.; Chen, Y.; Li, Z.; Li, Y.; Sun, F.; Zhang, S.; Wang, C.; Feng, M. Land Use Dynamic Changes in an Arid Inland River Basin Based on Multi-Scenario Simulation. Remote Sens. 2022, 14, 2797. [Google Scholar] [CrossRef]
- Millward, H. Urban Containment Strategies: A Case-Study Appraisal of Plans and Policies in Japanese, British, and Canadian Cities. Land Use Policy 2006, 23, 473–485. [Google Scholar] [CrossRef]
- Chen, Z.; Huang, M.; Zhu, D.; Altan, O. Integrating Remote Sensing and a Markov-FLUS Model to Simulate Future Land Use Changes in Hokkaido, Japan. Remote Sens. 2021, 13, 2621. [Google Scholar] [CrossRef]
- Ito, J.; Nishikori, M.; Toyoshi, M.; Feuer, H.N. The Contribution of Land Exchange Institutions and Markets in Countering Farmland Abandonment in Japan. Land Use Policy 2016, 57, 582–593. [Google Scholar] [CrossRef]
- Tsuchiya, S. Facts and Considerations on the “Urbanization Rate” in Japan from the Perspective of Regional Economy; Bank of Japan Working Paper Series; Bank of Japan: Tokyo, Japan, 2009; J-4; p. 37. [Google Scholar]
- Chang, Q.; Liu, X.; Wu, J.; He, P. MSPA-Based Urban Green Infrastructure Planning and Management Approach for Urban Sustainability: Case Study of Longgang in China. J. Urban Plann. Dev. 2015, 141, A5014006. [Google Scholar] [CrossRef]
- Kang, S.; Kim, J.-O. Morphological Analysis of Green Infrastructure in the Seoul Metropolitan Area, South Korea. Landsc. Ecol. Eng. 2015, 11, 259–268. [Google Scholar] [CrossRef]
- Wang, K.; Li, Z.; Zhang, J.; Wu, X.; Jia, M.; Wu, L. Built-up Land Expansion and Its Impacts on Optimizing Green Infrastructure Networks in a Resource-Dependent City. Sustain. Cities Soc. 2020, 55, 102026. [Google Scholar] [CrossRef]
- Soille, P.; Vogt, P. Morphological Segmentation of Binary Patterns. Pattern Recognit. Lett. 2009, 30, 456–459. [Google Scholar] [CrossRef]
- Chen, M.; Dai, F.; Yang, B.; Zhu, S. Effects of Urban Green Space Morphological Pattern on Variation of PM2.5 Concentration in the Neighborhoods of Five Chinese Megacities. Build. Environ. 2019, 158, 1–15. [Google Scholar] [CrossRef]
- Statistics Bureau of Japan 2020 Population Census. Available online: https://www.stat.go.jp/data/kokusei/2020/kekka/pdf/outline.pdf (accessed on 16 November 2022).
- Wang, T.; Sun, F. Global Gridded GDP Data Set Consistent with the Shared Socioeconomic Pathways. Sci. Data 2022, 9, 221. [Google Scholar] [CrossRef] [PubMed]
- Kummu, M.; Taka, M.; Guillaume, J.H.A. Gridded Global Datasets for Gross Domestic Product and Human Development Index over 1990–2015. Sci. Data 2018, 5, 180004. [Google Scholar] [CrossRef] [PubMed]
- Li, J.; Chen, X.; Kurban, A.; Van de Voorde, T.; De Maeyer, P.; Zhang, C. Coupled SSPs-RCPs Scenarios to Project the Future Dynamic Variations of Water-Soil-Carbon-Biodiversity Services in Central Asia. Ecol. Indic. 2021, 129, 107936. [Google Scholar] [CrossRef]
- Riahi, K.; van Vuuren, D.P.; Kriegler, E.; Edmonds, J.; O’Neill, B.C.; Fujimori, S.; Bauer, N.; Calvin, K.; Dellink, R.; Fricko, O.; et al. The Shared Socioeconomic Pathways and Their Energy, Land Use, and Greenhouse Gas Emissions Implications: An Overview. Glob. Environ. Change 2017, 42, 153–168. [Google Scholar] [CrossRef]
- Lin, Z.; Peng, S. Comparison of Multimodel Simulations of Land Use and Land Cover Change Considering Integrated Constraints—A Case Study of the Fuxian Lake Basin. Ecol. Indic. 2022, 142, 109254. [Google Scholar] [CrossRef]
- Sahle, M.; Saito, O.; Fürst, C.; Demissew, S.; Yeshitela, K. Future Land Use Management Effects on Ecosystem Services under Different Scenarios in the Wabe River Catchment of Gurage Mountain Chain Landscape, Ethiopia. Sustain. Sci. 2019, 14, 175–190. [Google Scholar] [CrossRef]
- Li, K.; Cao, J.; Adamowski, J.F.; Biswas, A.; Zhou, J.; Liu, Y.; Zhang, Y.; Liu, C.; Dong, X.; Qin, Y. Assessing the Effects of Ecological Engineering on Spatiotemporal Dynamics of Carbon Storage from 2000 to 2016 in the Loess Plateau Area Using the InVEST Model: A Case Study in Huining County, China. Environ. Dev. 2021, 39, 100641. [Google Scholar] [CrossRef]
- IPCC. 2006 IPCC Guidelines for National Greenhouse Gas Inventories. 2006. Available online: https://www.ipcc-nggip.iges.or.jp/public/2006gl/vol4.html (accessed on 5 April 2023).
- Koga, N.; Smith, P.; Yeluripati, J.B.; Shirato, Y.; Kimura, S.D.; Nemoto, M. Estimating Net Primary Production and Annual Plant Carbon Inputs, and Modelling Future Changes in Soil Carbon Stocks in Arable Farmlands of Northern Japan. Agric. Ecosyst. Environ. 2011, 144, 51–60. [Google Scholar] [CrossRef]
- Matsui, K.; Takata, Y.; Maejima, Y.; Kubotera, H.; Obara, H.; Shirato, Y. Soil Carbon and Nitrogen Stock of the Japanese Agricultural Land Estimated by the National Soil Monitoring Database (2015–2018). Soil Sci. Plant Nutr. 2021, 67, 633–642. [Google Scholar] [CrossRef]
- Morisada, K.; Ono, K.; Kanomata, H. Organic Carbon Stock in Forest Soils in Japan. Geoderma 2004, 119, 21–32. [Google Scholar] [CrossRef]
- Noguchi, K.; Hirai, K.; Takahashi, M.; Aizawa, S.; Itoh, Y. Effects of thinning on abovegroundcarbon and nitrogen dynamics ata sugi (Cryptomeriajaponica) plantation innorthern Kanto region, eastern Japan. Bull. FFPRI 2009, 8, 205–214. [Google Scholar]
- Takahashi, M.; Ishizuka, S.; Ugawa, S.; Sakai, Y.; Sakai, H.; Ono, K.; Hashimoto, S.; Matsuura, Y.; Morisada, K. Carbon Stock in Litter, Deadwood and Soil in Japan’s Forest Sector and Its Comparison with Carbon Stock in Agricultural Soils. Soil Sci. Plant Nutr. 2010, 56, 19–30. [Google Scholar] [CrossRef]
- Matsuura, S.; Sasaki, H.; Kohyama, K. Organic Carbon Stocks in Grassland Soils and Their Spatial Distribution in Japan: Carbon Stocks in Japan’s Grassland Soils. Grassl. Sci. 2012, 58, 79–93. [Google Scholar] [CrossRef]
- Takahashi, T.; Amano, Y.; Kuchimura, K.; Kobayashi, T. Carbon Content of Soil in Urban Parks in Tokyo, Japan. Landsc. Ecol. Eng. 2008, 4, 139–142. [Google Scholar] [CrossRef]
- McGarigal, K.; Marks, B.J. FRAGSTATS: Spatial Pattern Analysis Program for Quantifying Landscape Structure; U.S. Department of Agriculture, Forest Service, Pacific Northwest Research Station: Portland, OR, USA, 1995; p. PNW-GTR-351.
- Jiao, M.; Hu, M.; Xia, B. Spatiotemporal Dynamic Simulation of Land-Use and Landscape-Pattern in the Pearl River Delta, China. Sustain. Cities Soc. 2019, 49, 101581. [Google Scholar] [CrossRef]
- Yin, J.; Wu, X.; Shen, M.; Zhang, X.; Zhu, C.; Xiang, H.; Shi, C.; Guo, Z.; Li, C. Impact of Urban Greenspace Spatial Pattern on Land Surface Temperature: A Case Study in Beijing Metropolitan Area, China. Landsc. Ecol. 2019, 34, 2949–2961. [Google Scholar] [CrossRef]
- Vogt, P.; Riitters, K.H.; Estreguil, C.; Kozak, J.; Wade, T.G.; Wickham, J.D. Mapping Spatial Patterns with Morphological Image Processing. Landsc. Ecol. 2007, 22, 171–177. [Google Scholar] [CrossRef]
- Riitters, K.; Vogt, P.; Soille, P.; Estreguil, C. Landscape Patterns from Mathematical Morphology on Maps with Contagion. Landsc. Ecol. 2009, 24, 699–709. [Google Scholar] [CrossRef]
- Xie, Y.; Wang, Q.; Xie, M.; Shibata, S. Construction Feasibility Evaluation for Potential Ecological Corridors under Different Widths: A Case Study of Chengdu in China. Landsc. Ecol. Eng. 2023, 19, 381–399. [Google Scholar] [CrossRef]
- Dytham, C.; Forman, R.T.T. Land Mosaics: The Ecology of Landscapes and Regions. J. Ecol. 1996, 84, 787. [Google Scholar] [CrossRef]
- Oda, K.; Rupprecht, C.; Tsuchiya, K.; McGreevy, S. Urban Agriculture as a Sustainability Transition Strategy for Shrinking Cities? Land Use Change Trajectory as an Obstacle in Kyoto City, Japan. Sustainability 2018, 10, 1048. [Google Scholar] [CrossRef]
- Takata, Y.; Obara, H.; Nakai, M.; Kohyama, K. Process of the decline in the cultivated soil area with land use changes in Japan. Jpn. Soc. Soil Sci. Plant Nutr. 2011, 82, 15–24. [Google Scholar]
- Chen, G.; Li, X.; Liu, X.; Chen, Y.; Liang, X.; Leng, J.; Xu, X.; Liao, W.; Qiu, Y.; Wu, Q.; et al. Global Projections of Future Urban Land Expansion under Shared Socioeconomic Pathways. Nat. Commun. 2020, 11, 537. [Google Scholar] [CrossRef]
- Wang, R.; Murayama, Y. Geo-Simulation of Land Use/Cover Scenarios and Impacts on Land Surface Temperature in Sapporo, Japan. Sustain. Cities Soc. 2020, 63, 102432. [Google Scholar] [CrossRef]
- Fang, S.; Gertner, G.Z.; Sun, Z.; Anderson, A.A. The Impact of Interactions in Spatial Simulation of the Dynamics of Urban Sprawl. Landsc. Urban Plan. 2005, 73, 294–306. [Google Scholar] [CrossRef]
- Salem, M.; Tsurusaki, N.; Divigalpitiya, P. Analyzing the Driving Factors Causing Urban Expansion in the Peri-Urban Areas Using Logistic Regression: A Case Study of the Greater Cairo Region. Infrastructures 2019, 4, 4. [Google Scholar] [CrossRef]
- Kobayashi, Y.; Higa, M.; Higashiyama, K.; Nakamura, F. Drivers of Land-Use Changes in Societies with Decreasing Populations: A Comparison of the Factors Affecting Farmland Abandonment in a Food Production Area in Japan. PLoS ONE 2020, 15, e0235846. [Google Scholar] [CrossRef]
- Shoyama, K.; Matsui, T.; Hashimoto, S.; Kabaya, K.; Oono, A.; Saito, O. Development of Land-Use Scenarios Using Vegetation Inventories in Japan. Sustain. Sci. 2019, 14, 39–52. [Google Scholar] [CrossRef]
- Takeshi, M.; Toshikazu, A.; Bunpei, N.; Toshiya, M.; Shu, H. Study on Problem of Improvement Method for Infrastructure to Expanded Urban Area being secured only by District Plan. J. City Plan. Inst. Jpn. 2007, 42, 733–738. [Google Scholar] [CrossRef]
- Seta, F. An Empirical Study on the Geographical Specification on National and Regional Plans in Japan: A Case Study of Kinki Area Regional Plan in National Spatial Strategies. Toshi Keikaku Rombunshu 2010, 45, 47–53. [Google Scholar] [CrossRef]
- Su, G.; Okahashi, H.; Chen, L. Spatial Pattern of Farmland Abandonment in Japan: Identification and Determinants. Sustainability 2018, 10, 3676. [Google Scholar] [CrossRef]
- Van Dijk, M.; Morley, T.; Rau, M.L.; Saghai, Y. A Meta-Analysis of Projected Global Food Demand and Population at Risk of Hunger for the Period 2010–2050. Nat. Food 2021, 2, 494–501. [Google Scholar] [CrossRef]
- Hanioka, M.; Yamaura, Y.; Senzaki, M.; Yamanaka, S.; Kawamura, K.; Nakamura, F. Assessing the Landscape-Dependent Restoration Potential of Abandoned Farmland Using a Hierarchical Model of Bird Communities. Agric. Ecosyst. Environ. 2018, 265, 217–225. [Google Scholar] [CrossRef]
- Nishihara, M. Real Option Valuation of Abandoned Farmland. Rev. Financ. Econ. 2012, 21, 188–192. [Google Scholar] [CrossRef]


| Land Use Types | Aboveground Carbon Density | Belowground Carbon Density | Soil organic Carbon Density | Dead Organic Matter Density | Sources |
|---|---|---|---|---|---|
| Cultivated land | 21.00 | 2.52 | 73.20 | 2.52 | [43,44,45] |
| Forest | 84.60 | 20.30 | 90.00 | 7.01 | [43,46,47,48] |
| Grassland | 2.91 | 4.65 | 114.00 | 0.00 | [43,49] |
| Bare land | 0.20 | 0.00 | 40.10 | 0.00 | [3,50] |
| MSPA Classes | Definition |
|---|---|
| Core | Large area patches that exceed the specified edge width distance from the background |
| Islet | Patches that are smaller than the core and exist in the background as isolated and fragmented forms |
| Edge | External perimeter of core area |
| Perforation | The internal perimeter of the core area refers to the boundary within the core where one land use type is encroached upon by other land use types, creating a similar hollow feature |
| Bridge | The corridor connecting different cores |
| Loop | Internal corridor connecting the same core |
| Branch | Only one end is connected to the foreground, striped land with low connectivity |
| Time | Scenario | Cultivated Land/km2 | Forest/km2 | Grassland/km2 | Waterbody/km2 | Artificial Surface/km2 | Bare Land/km2 |
|---|---|---|---|---|---|---|---|
| 2040 | SSP126 | 3091.84 | 19,369.78 | 325.54 | 850.61 | 3558.43 | 133.49 |
| SSP245 | 3512.60 | 19,069.68 | 361.53 | 850.61 | 3404.31 | 130.96 | |
| SSP370 | 3522.68 | 19,322.06 | 445.96 | 850.61 | 3056.18 | 132.20 | |
| SSP585 | 4071.22 | 18,515.44 | 359.67 | 850.61 | 3405.86 | 126.89 | |
| 2060 | SSP126 | 2993.92 | 19,484.09 | 303.38 | 845.28 | 3569.00 | 134.01 |
| SSP245 | 3514.56 | 19,048.89 | 346.53 | 841.33 | 3448.95 | 129.45 | |
| SSP370 | 3410.46 | 19,572.82 | 523.55 | 841.17 | 2862.40 | 119.29 | |
| SSP585 | 4076.42 | 18,417.96 | 362.18 | 842.51 | 3504.59 | 126.04 | |
| 2080 | SSP126 | 2746.04 | 19,760.55 | 282.73 | 839.77 | 3567.81 | 132.80 |
| SSP245 | 3249.17 | 19,141.93 | 332.31 | 832.17 | 3645.21 | 128.91 | |
| SSP370 | 3103.17 | 19,968.86 | 599.40 | 831.83 | 2723.55 | 102.89 | |
| SSP585 | 4076.42 | 18,412.77 | 338.44 | 834.61 | 3541.65 | 125.81 | |
| 2100 | SSP126 | 2595.63 | 20,078.15 | 263.49 | 834.28 | 3427.89 | 130.25 |
| SSP245 | 2888.57 | 19,452.38 | 318.67 | 823.11 | 3716.64 | 130.33 | |
| SSP370 | 2439.17 | 20,769.84 | 674.59 | 822.59 | 2535.69 | 87.82 | |
| SSP585 | 4076.42 | 18,119.78 | 316.38 | 826.89 | 3864.29 | 125.93 |
| Scenario | Total CS (Tg) | CS Change (Tg) | |||||||
|---|---|---|---|---|---|---|---|---|---|
| 2040 | 2060 | 2080 | 2100 | 2020–2040 | 2040–2060 | 2060–2080 | 2080–2100 | 2020–2100 | |
| SSP126 | 426.30 | 427.37 | 430.24 | 434.92 | −2.36 | 1.07 | 2.87 | 4.68 | 6.26 |
| SSP245 | 424.85 | 424.26 | 423.33 | 425.86 | −3.81 | −0.59 | −0.93 | 2.53 | −2.80 |
| SSP370 | 431.08 | 435.92 | 441.72 | 452.16 | 2.41 | 4.84 | 5.80 | 10.44 | 23.50 |
| SSP585 | 419.16 | 417.27 | 416.88 | 410.69 | −9.50 | −1.89 | −0.39 | −6.18 | −17.97 |
Disclaimer/Publisher’s Note: The statements, opinions and data contained in all publications are solely those of the individual author(s) and contributor(s) and not of MDPI and/or the editor(s). MDPI and/or the editor(s) disclaim responsibility for any injury to people or property resulting from any ideas, methods, instructions or products referred to in the content. |
© 2023 by the authors. Licensee MDPI, Basel, Switzerland. This article is an open access article distributed under the terms and conditions of the Creative Commons Attribution (CC BY) license (https://creativecommons.org/licenses/by/4.0/).
Share and Cite
Xie, Y.; Fukamachi, K.; Wang, W.; Shibata, S. Exploring Land Use Management Strategies through Morphological Spatial Patterns Using a Climate–Socioeconomic-Based Land Use Simulation Modeling Framework. Land 2023, 12, 1722. https://doi.org/10.3390/land12091722
Xie Y, Fukamachi K, Wang W, Shibata S. Exploring Land Use Management Strategies through Morphological Spatial Patterns Using a Climate–Socioeconomic-Based Land Use Simulation Modeling Framework. Land. 2023; 12(9):1722. https://doi.org/10.3390/land12091722
Chicago/Turabian StyleXie, Yusong, Katsue Fukamachi, Wen Wang, and Shozo Shibata. 2023. "Exploring Land Use Management Strategies through Morphological Spatial Patterns Using a Climate–Socioeconomic-Based Land Use Simulation Modeling Framework" Land 12, no. 9: 1722. https://doi.org/10.3390/land12091722
APA StyleXie, Y., Fukamachi, K., Wang, W., & Shibata, S. (2023). Exploring Land Use Management Strategies through Morphological Spatial Patterns Using a Climate–Socioeconomic-Based Land Use Simulation Modeling Framework. Land, 12(9), 1722. https://doi.org/10.3390/land12091722