Review

Bibliometric Analysis of Land Degradation Studies in Drylands Using Remote Sensing Data: A 40-Year Review

by
Diêgo P. Costa
1,2,3,4,*,
Stefanie M. Herrmann
3,
Rodrigo N. Vasconcelos
2,4,5,
Soltan Galano Duverger
2,6,
Washinton J. S. Franca Rocha
4,
Elaine C. B. Cambuí
7,
Jocimara S. B. Lobão
4,
Ellen M. R. Santos
4,
Jefferson Ferreira-Ferreira
8,
Mariana Oliveira
8,
Leonardo da Silva Barbosa
8,
André T. Cunha Lima
1,5 and
Carlos A. D. Lentini
1,5,9,10
1
Interdisciplinary Center for Energy and Environment (CIEnAm), Federal University of Bahia UFBA, Salvador 40170-115, Bahia, Brazil
2
GEODATIN—Data Intelligence and Geoinformation, Bahia Technological Park Rua Mundo, 121—Trobogy, Salvador 41301-110, Bahia, Brazil
3
School of Natural Resources and the Environment (SNRE), The University of Arizona, 1064 E. Lowell St, Tucson, AZ 85721, USA
4
Postgraduate Program in Earth Modeling and Environmental Sciences—PPGM, State University of Feira de Santana-UEFS, Feira de Santana 44036-900, Bahia, Brazil
5
Department of Earth and Environment Physics, Physics Institute, Campus Ondina, Federal University of Bahia-UFBA, Salvador 40170-280, Bahia, Brazil
6
Multidisciplinary and Multi-Institutional Postgraduate Program in Knowledge Diffusion (DMMDC/UFBA), Federal University of Bahia—UFBA, Salvador 40110-100, Bahia, Brazil
7
Postgraduate Program in Applied Ecology (Professional Master’s), Institute of Biology, Federal University of Bahia—UFBA, Salvador 40170-115, Bahia, Brazil
8
World Resources Institute Brasil, Rua Cláudio Soares, 72 Cj. 1510, São Paulo 05422-030, São Paulo, Brazil
9
Postgraduate Program in Geochemistry: Oil and Environment (Pospetro), Geosciences Institute (IGEO/UFBA), Federal University of Bahia—UFBA, Salvador 40170-115, Bahia, Brazil
10
Postgraduate Program in Geophysics, Geosciences Institute (IGEO/UFBA), Federal University of Bahia—UFBA, Salvador 40170-115, Bahia, Brazil
*
Author to whom correspondence should be addressed.
Land 2023, 12(9), 1721; https://doi.org/10.3390/land12091721
Submission received: 4 August 2023 / Revised: 25 August 2023 / Accepted: 28 August 2023 / Published: 4 September 2023
(This article belongs to the Special Issue Land Degradation and Soil Mapping)

Abstract

:
Drylands are vast and face threats from climate change and human activities. Traditional reviews cannot capture interdisciplinary knowledge, but bibliometric analysis provides valuable insights. Our study conducted bibliometric research of scientific production on climate change and land degradation in drylands using remote sensing. We examined 1527 Scopus-indexed publications to identify geographic and thematic hotspots, extracting leading authors, journals, and institutions. China leads in publications, followed by the US, Germany, and Australia. The US has the highest citation count. Collaboration networks involve the US, China, and European countries. There has been an exponential increase in remote sensing of land degradation in drylands (RSLDD) publications since 2011. Key journals include “International Journal of Remote Sensing” and “Remote Sensing of Environment”. The analysis highlights the growing interest in the field, driven by Australia, the US, and China. Key areas of study are vegetation dynamics and land use change. Future perspectives for this scientific field involve promoting collaboration and exploring emerging technologies for comprehensive land degradation and desertification research.

1. Introduction

Drylands cover about 41% of Earth’s surface, support more than 2 billion people, and have unique characteristics in terms of native vegetation, carbon dynamics, climate properties, and land use [1,2,3,4]. Despite their considerable resilience to low and variable water availability [5], these regions have been threatened by problems resulting from human actions and climate change, such as prolonged droughts, warm temperatures, changing moisture regimes, frequent forest fires, and land use intensification and change [6,7]. These problems generate social and environmental impacts that are detrimental and potentially irreversible [8,9,10].
Environmental problems originating from the degradation of drylands have been an essential theme of scientific and political discussions since the middle of the XX century [11,12], reflected in scientific publications, academic conferences, and global committees created by the United Nations. In those discussions, remote sensing has always been emphasized and recommended as a tool for analyzing land degradation and the effects of climate change throughout time [13,14,15]. However, all the knowledge generated from the application of remote sensing for assessing and monitoring land degradation, especially the indicators used, the analysis methodologies, and the main results, is dispersed in papers and reports from different subject areas, given the vast interdisciplinarity inherent to the theme of analysis [10].
While some traditional review studies involving remote sensing of land degradation in drylands (RSLDD) have been previously published [11,15], they did not have the objective to systematically and quantitatively demonstrate, list, and map the global main conceptual and methodological tendencies. Rather, their authors aimed to detail the results of studies at different spatial scales, mainly associated with the land degradation process in a well-defined space, with the majority focusing on the African Sahel [16,17]. Another important characteristic of traditional reviews is that they are limited to qualitative analysis, which makes them prone to subjectivity errors, that is, the interpretation of the significance of research results in the reviewed publications is conditional to the reviewing of authors’ knowledge base and scientific assumptions [18].
Bibliometric analysis, on the other hand, consists of a set of methods and tools for analyzing research publications that aid in quantitatively analyzing and recognizing patterns in the literature, thus synthesizing and organizing information more systematically. Once a specialized domain of Library and Information Science [19], bibliometric analyses are increasingly carried out in all fields of science [18,20,21,22]. This systematic approach allows for the analysis of thematic, conceptual, and methodological tendencies under a spatial and temporal perspective and thus can be of substantial assistance in studies of the literature and state-of-the-art reviews [18,21,23,24].
Another advantage of bibliometric studies is that they create clearer and more concise literature analysis for a variety of readers by adding summary charts, maps, and figures to the otherwise text-heavy analysis [22]. Some examples of the use of bibliometric studies in remote sensing have been published in academic journals, with studies that involve remote sensing and human health [23], remote sensing of oil spills [22], and remote sensing for vegetation monitoring [20,25]. However, so far, none of them analyzed the scientific production of knowledge associated with remote sensing for land degradation in drylands.
To fill this gap, our study focused on conducting a bibliometric analysis of papers that deal with the problems of climate change and land degradation in drylands using remote sensing techniques, as indexed in the Scopus database. To this end, we created a structured literature review involving themes, authors, methods, and concepts by crafting organized analyses through different periods and identifying geographic and thematic hotspots of scientific knowledge. We highlighted where the publications about the addressed topic come from, extracting the leading papers, authors, journals, and institutions over a long temporal series, and tracking the most important concepts over the years, as represented by the terms most frequently occurring in the analyzed publications.

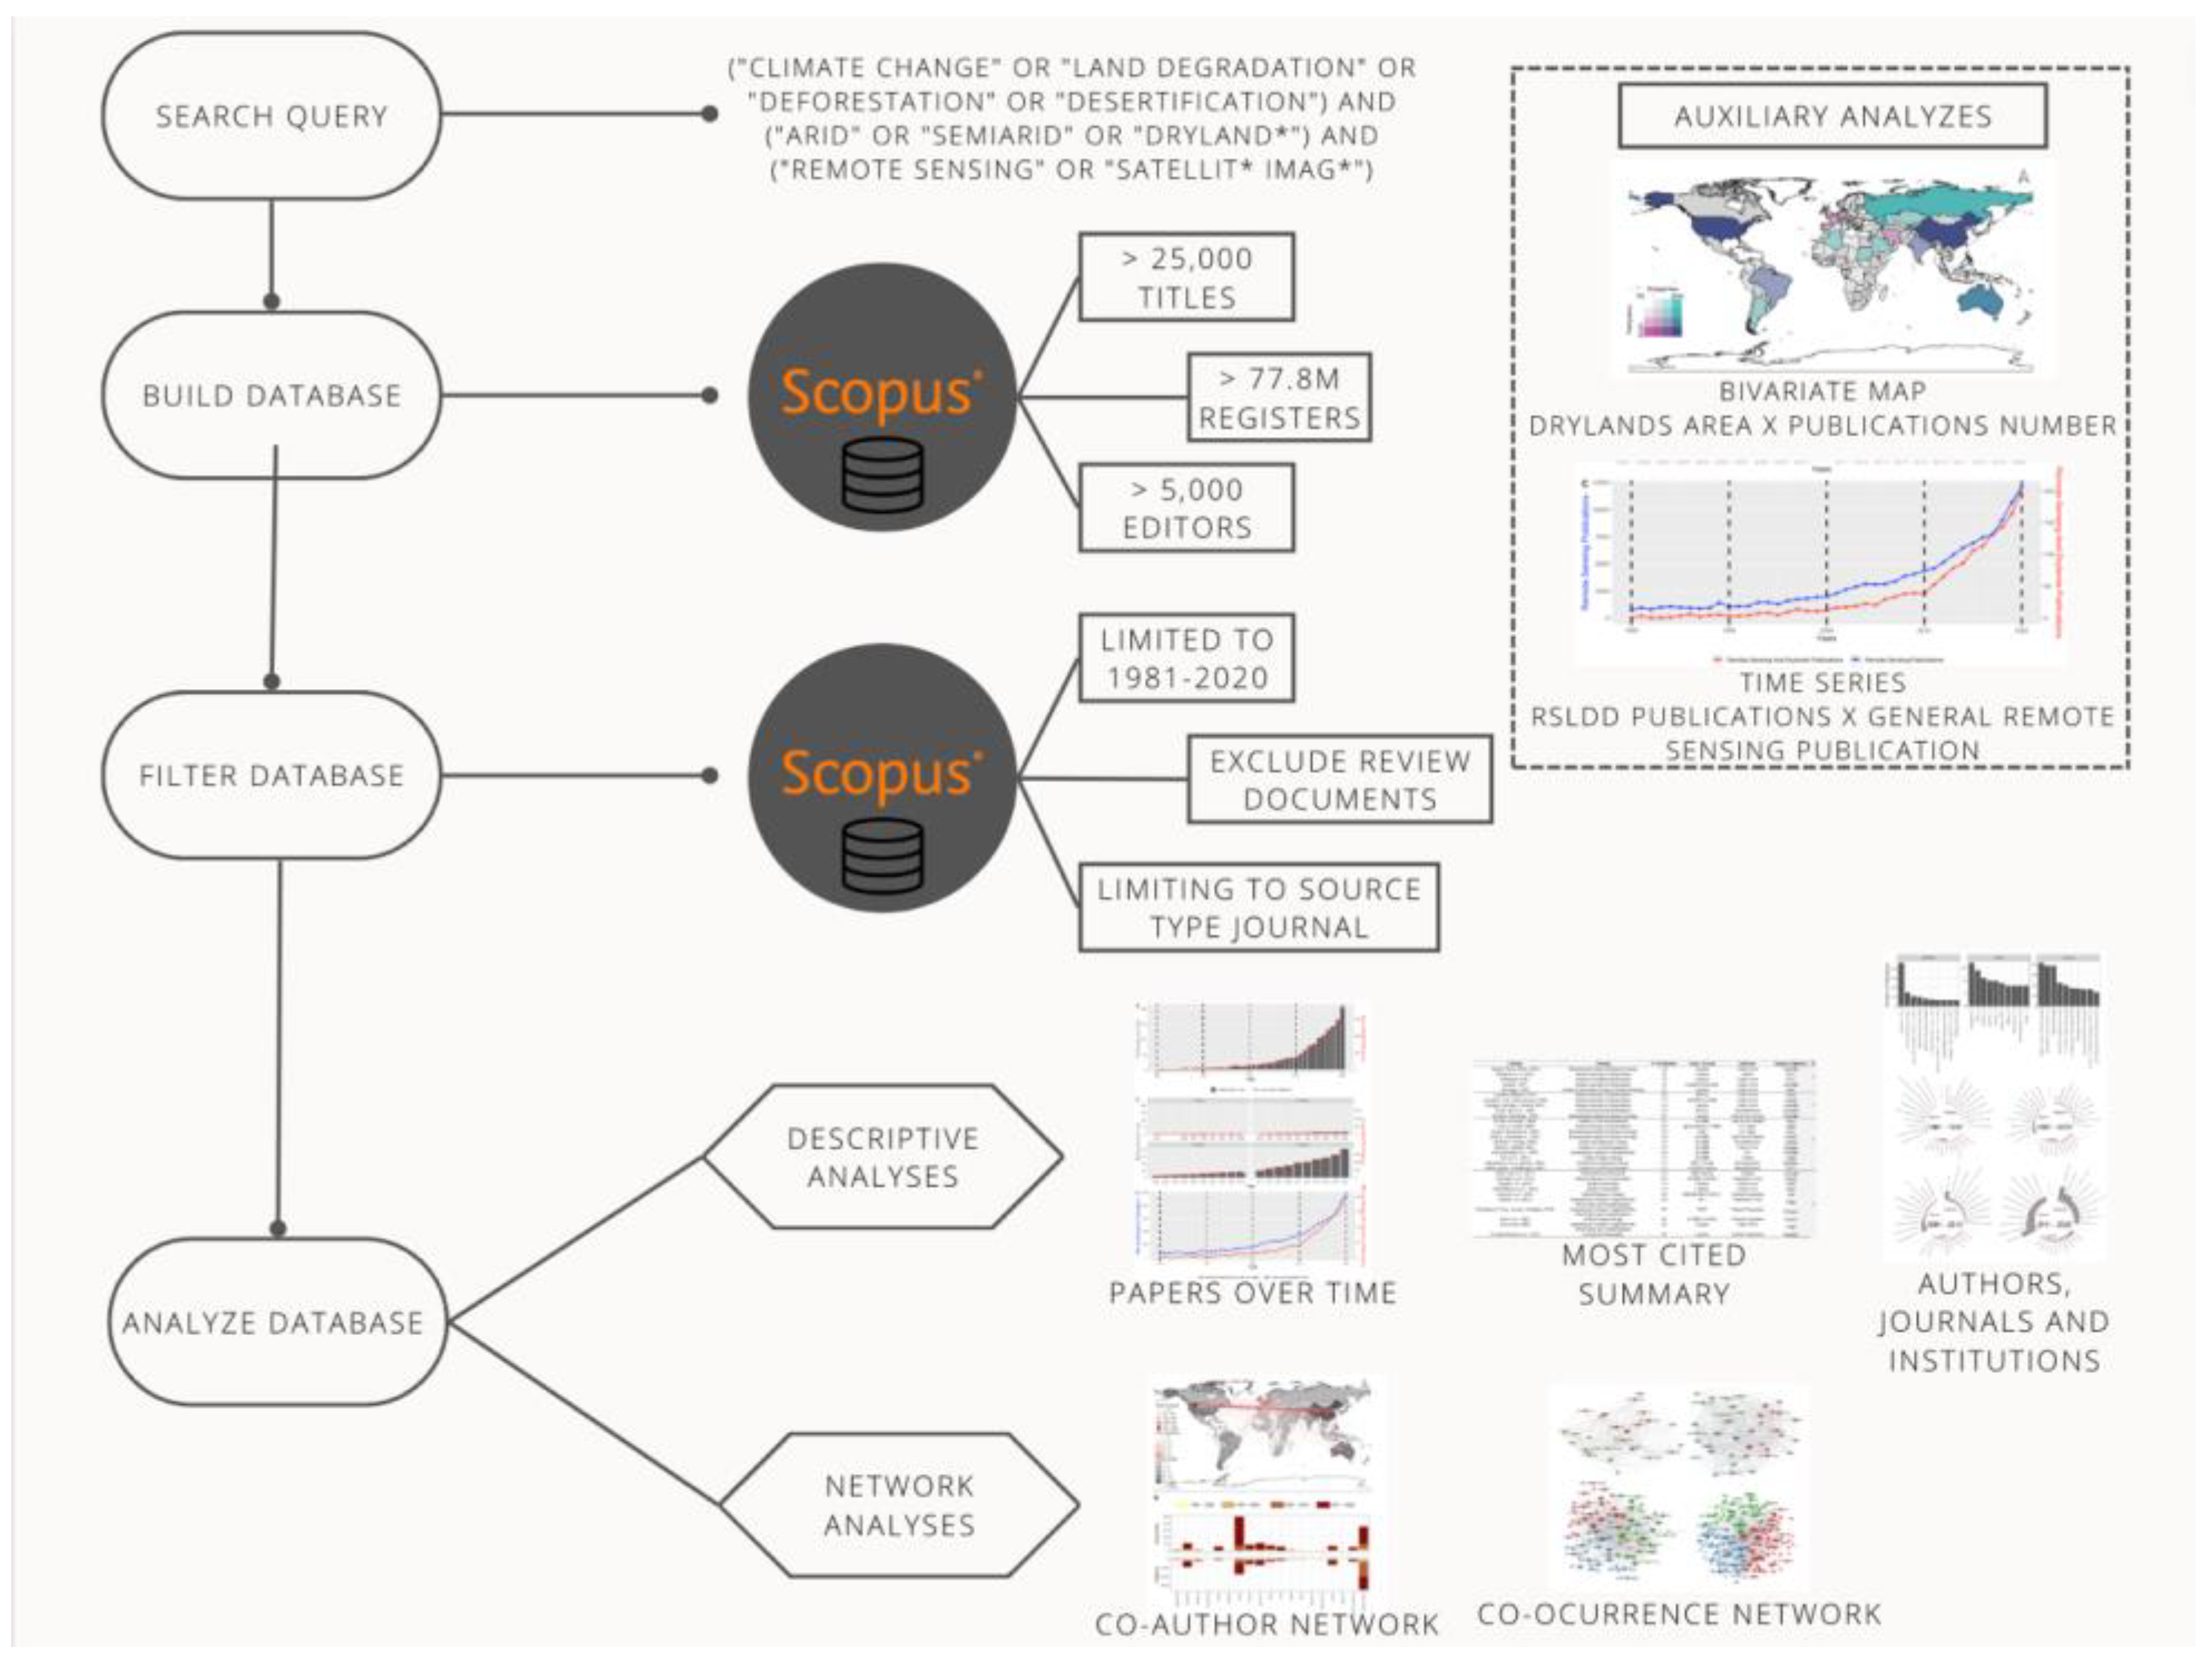
2. Materials and Methods

This study uses a classic bibliometric approach and co-occurrence network analysis to understand the patterns of the academic literature on RSLDD [22]. We intend to make an essential contribution for quantifying, understanding, and visualizing trends in this academic field. Our research questions and approach are summarized in Table 1 and Figure 1.

2.1. Database

In order to achieve the objectives proposed in this study, the construction of a database of papers is the first essential step, and for this, we used the Scopus abstract and citation database “www.scopus.com (accessed on 1 January 2023)” (www.scopus.com). With over 25,100 titles, 5000 editors, more than 77.8 million papers, and tools for information integration, data exportation, and analytics, the Scopus database is extensive and representative of the international publication scene [22,23].
To build our database of relevant publications, we selected search terms related with the proposed theme based on three major dimensions: the environmental problem, the analysis techniques used, and the geographic region of interest. Therefore, we utilized the expression (“climate change” OR “land degradation” OR “deforestation” OR “desertification”) AND (“arid” OR “semiarid” OR “dryland *”) AND (“remote sensing” OR “satellit* imag*”). The search was conducted on May 8, 2022. These search terms were required to occur in the paper’s title, abstract, or keywords for all available publications until 2020. From the shortlisted papers, we focused on primary research and excluded literature reviews and conference papers. We then filtered the resulting data by subareas of “Earth and Planetary Sciences”, “Environmental Science”, “Agricultural and Biological Sciences” and “Computer Science”. We also exported quantitative metrics of the bibliographic production from the Scopus database, such as the overall number of papers per year and the number of papers per author, journal, and country.

2.2. Bibliometric Analyses

With the data extracted from Scopus, we produced co-occurrence and co-authorship networks, in which we used information of authors, their institutional affiliations, and their respective countries. This allowed us to identify the main institutions from which the publications originated, as well as in which manner those authors collaborated, based on their countries of origin. We utilized the VOS Viewer 1.6.15 software [26], developed by Leiden University in the Netherlands, to extract the co-authorship networks, and the Gephi 0.9.2 software [27], specialized in graph networks, to spatially visualize them. For the co-occurrence networks, we limited the search to terms occurring in titles and abstracts of the papers analyzed in this study. We also created a thesaurus to replace and remove irrelevant terms. To create these networks, we used the VOS Viewer 1.6.15 software [26].
All the charts were produced in the R language [28] with the IDE RStudio [29] version 2022.07.2 Build 576 and the libraries bibliometrix 4.0.1 [30] and ggplot2 3.3.6. [31].

3. Results

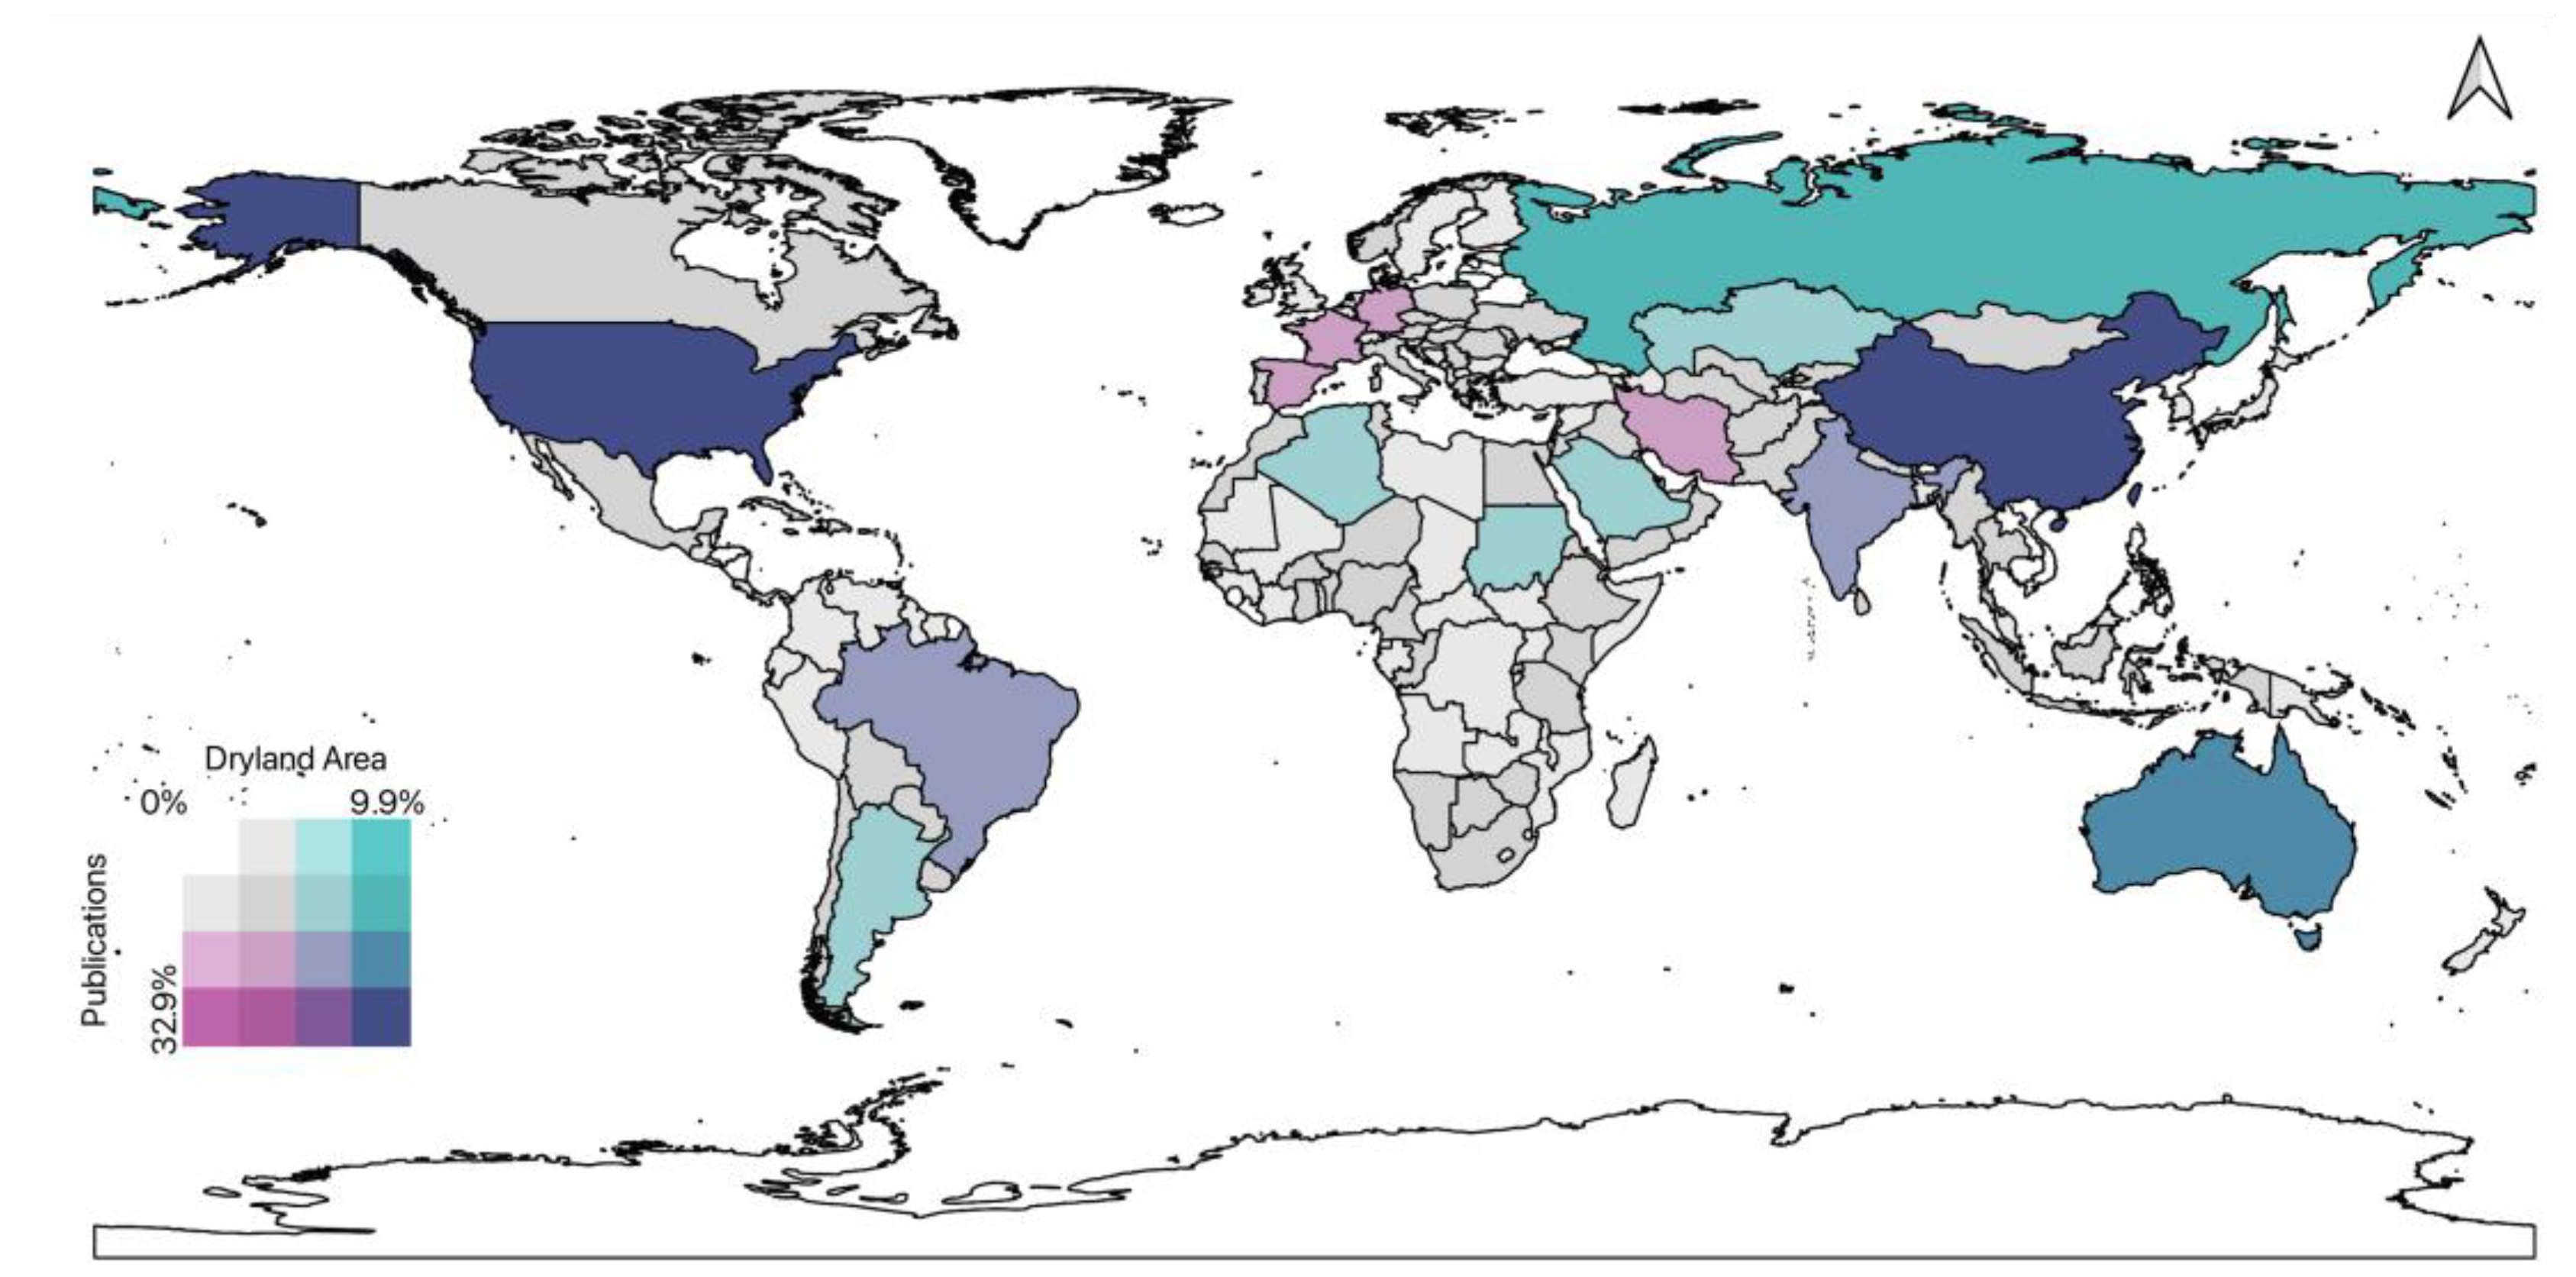
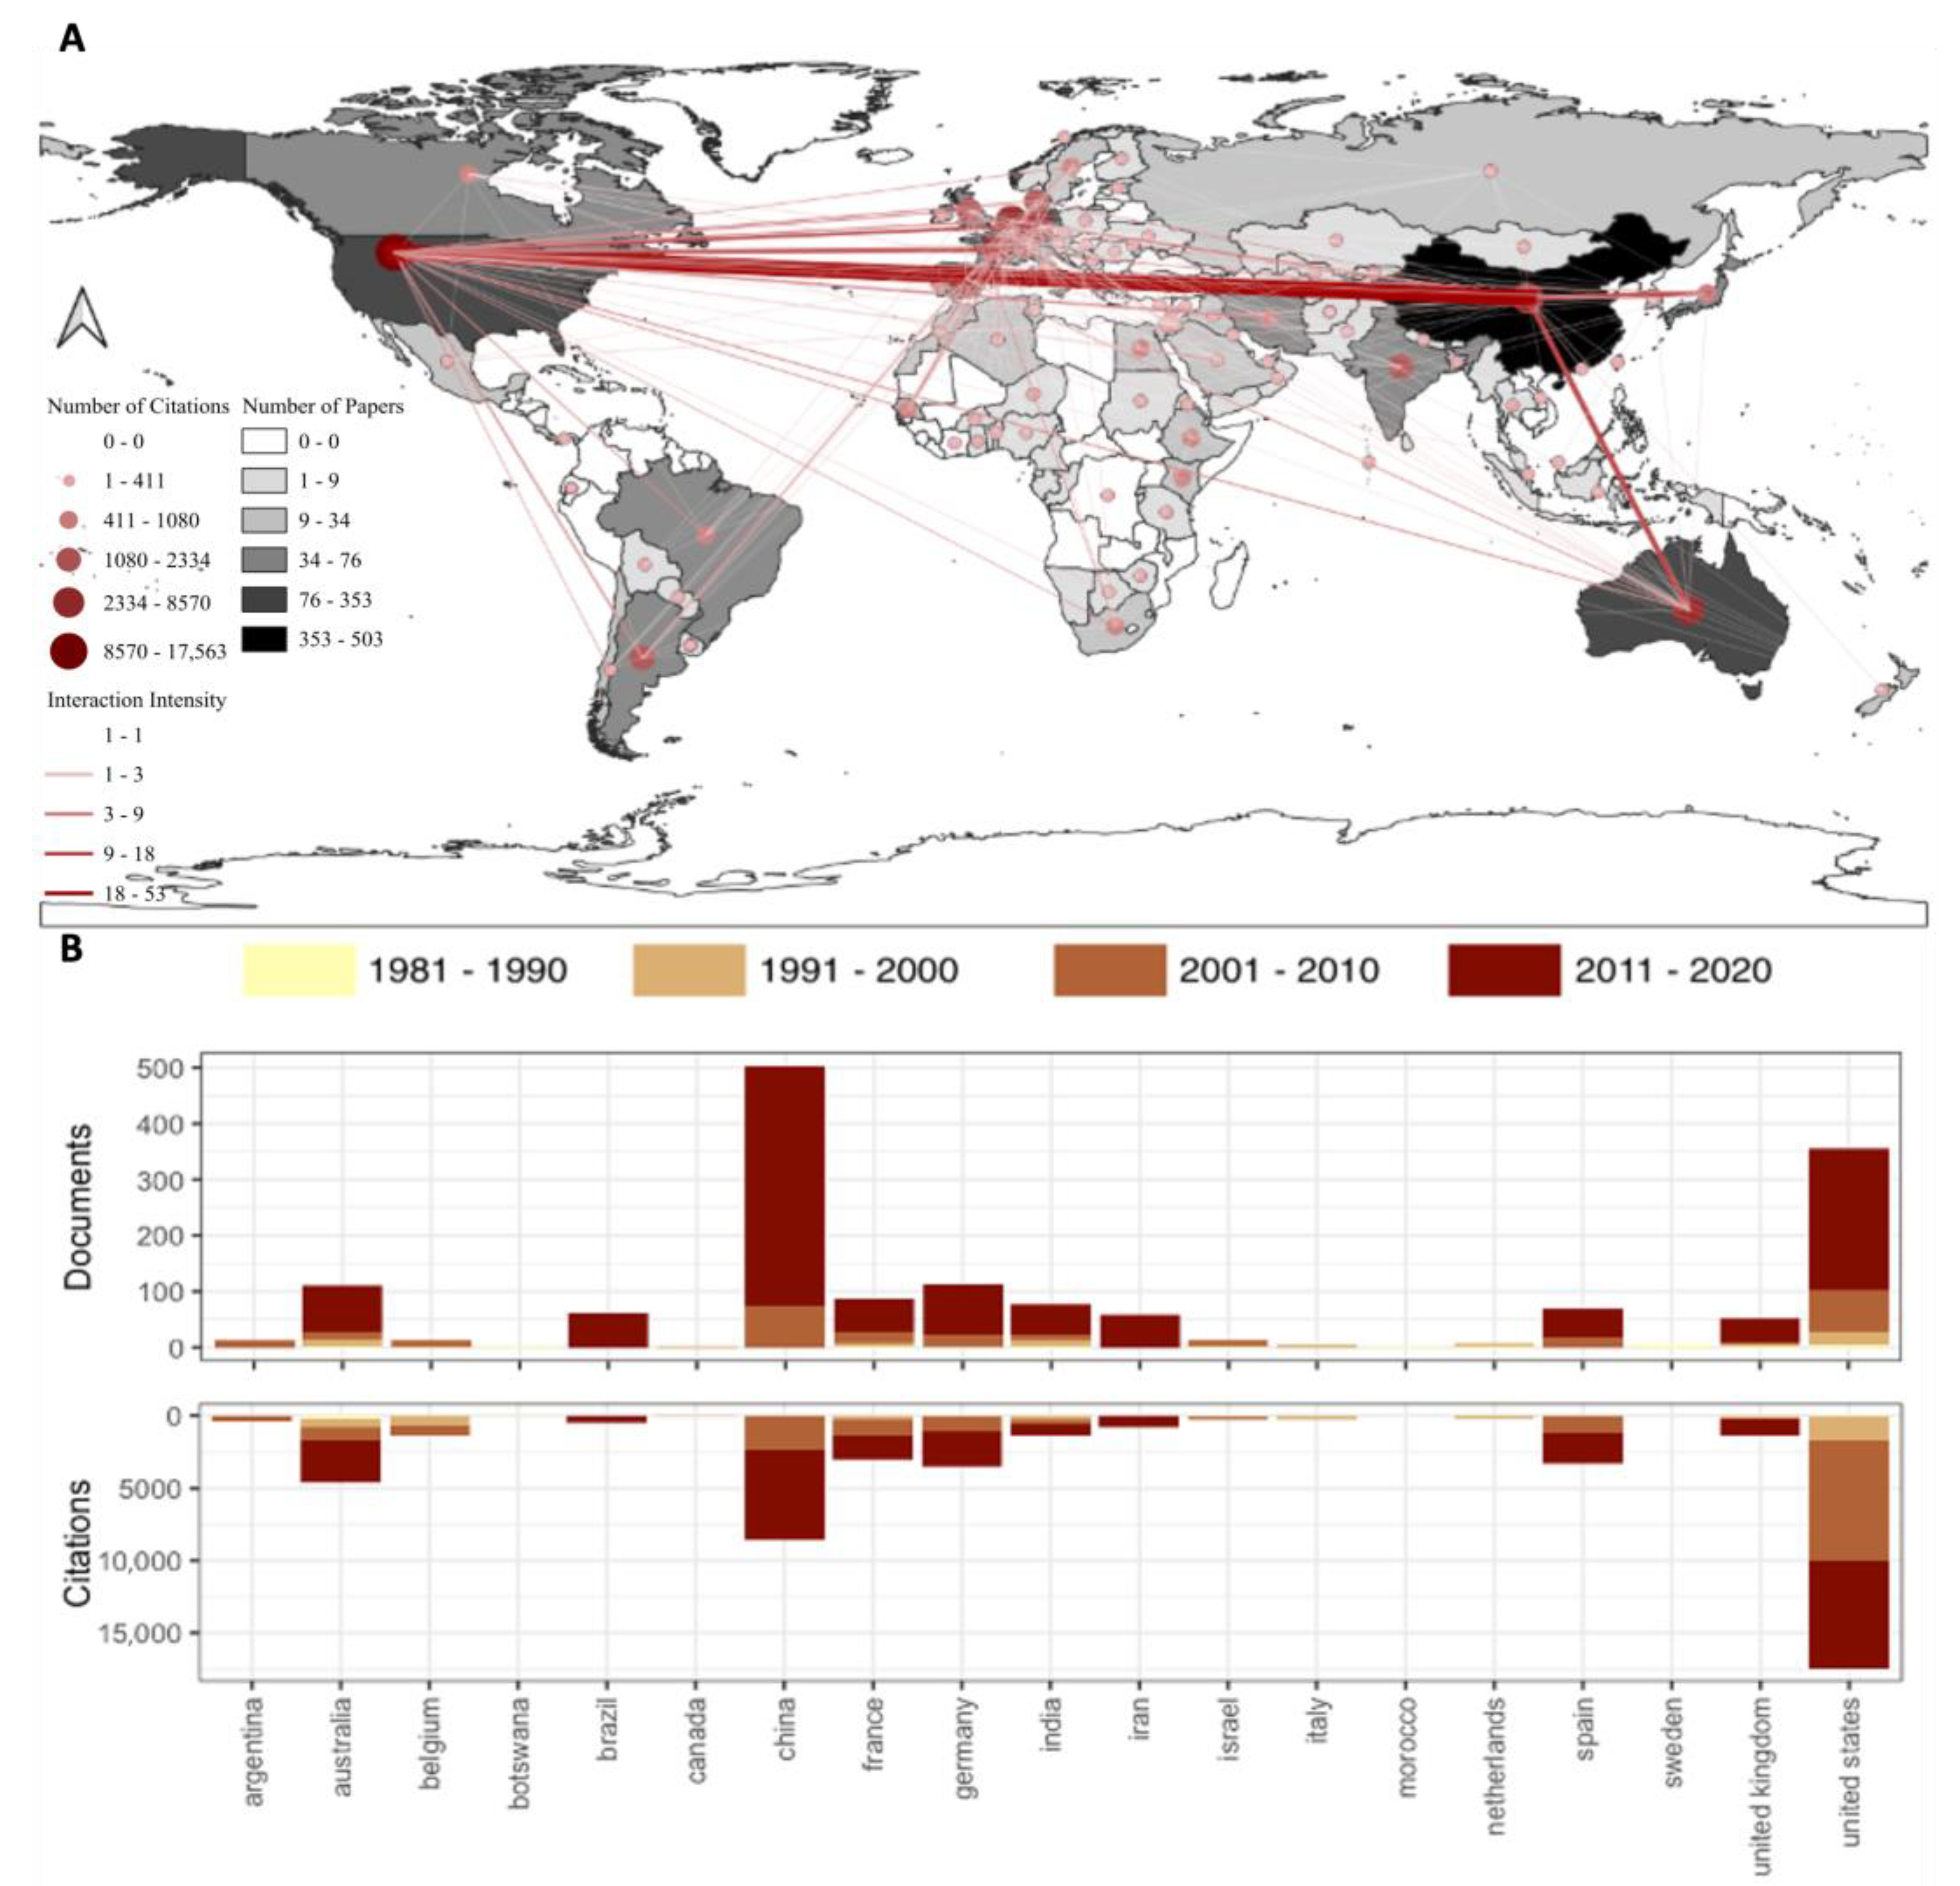
3.1. Spatial Distribution of Publications

Figure 2A shows China’s dominance concerning the number of publications, with a total of 503 papers (~32.9%), followed by the United States with a total of 353 papers (~23.1%), Germany with 112 (~7.3%), and Australia with 109 (~7.1%). To understand spatial patterns, it is also important to highlight Brazil, with 63 papers (~4.1%), because it is leading in South America. By contrast, the United States leads the number of citation count with 14,026 citations, followed by China (8041 citations), Australia (5031 citations), and Germany (3632 citations).
Argentina, with 1394 citations, leads citation count in South America. Regarding collaboration networks, the United States, China, and a few European countries stand out as involved in the most collaboration networks: the United States interacts with 40 countries, Germany with 37, China with 31, and Spain with 29. Particularly strong collaboration ties exist between United States–China, United States–France, China–Australia, and China–Japan.
Figure 2B depicts the number of publications and citations divided by decades. The graph includes the top 10 countries with the most publications in each period, a total of 19 countries. Each period represents a decade (1981–1990, 1991–2000, 2001–2010, 2011–2020). The main highlights in this figure are the following: China cemented its leadership position in the number of publications in the most recent decade (2011–2020) with 428 papers; the United States is the country with the most citations in the all but the first decade, when Australia led the count with 157 citations; Brazil and Iran appear as new hotspots for publications in the last decade, with 62 and 59 papers, respectively; and the European continent has the most countries on the list.
To understand the relation between the number of RSLDD publications and the importance of drylands by country, Figure 3 shows a bivariate map combining these two variables.
The highlights on this map are the following: Australia has ~9.9% of the total dryland area and ~7.1% of the total publications; China has ~7.4% of the total dryland area and ~32.9% of the total publications; the United States has ~6.0% of the total dryland area and ~23.1% of the total publications; Brazil has ~4.4% of the total dryland area and ~4.1% of the total publications; and India has ~2.7% of the total dryland area and ~4.9% of the total publications. While these results suggest a relationship between dryland area and publications on RSLDD, there are two types of outliers. On the one hand, some Saharan and sub-Saharan countries, Argentina, Kazakhstan, and Russia occupy a relatively large proportion of the global drylands but produced only a low number of RSLDD publications. On the other hand, some European countries and Iran generated many publications on RSLDD despite their relatively insignificant dryland areas.

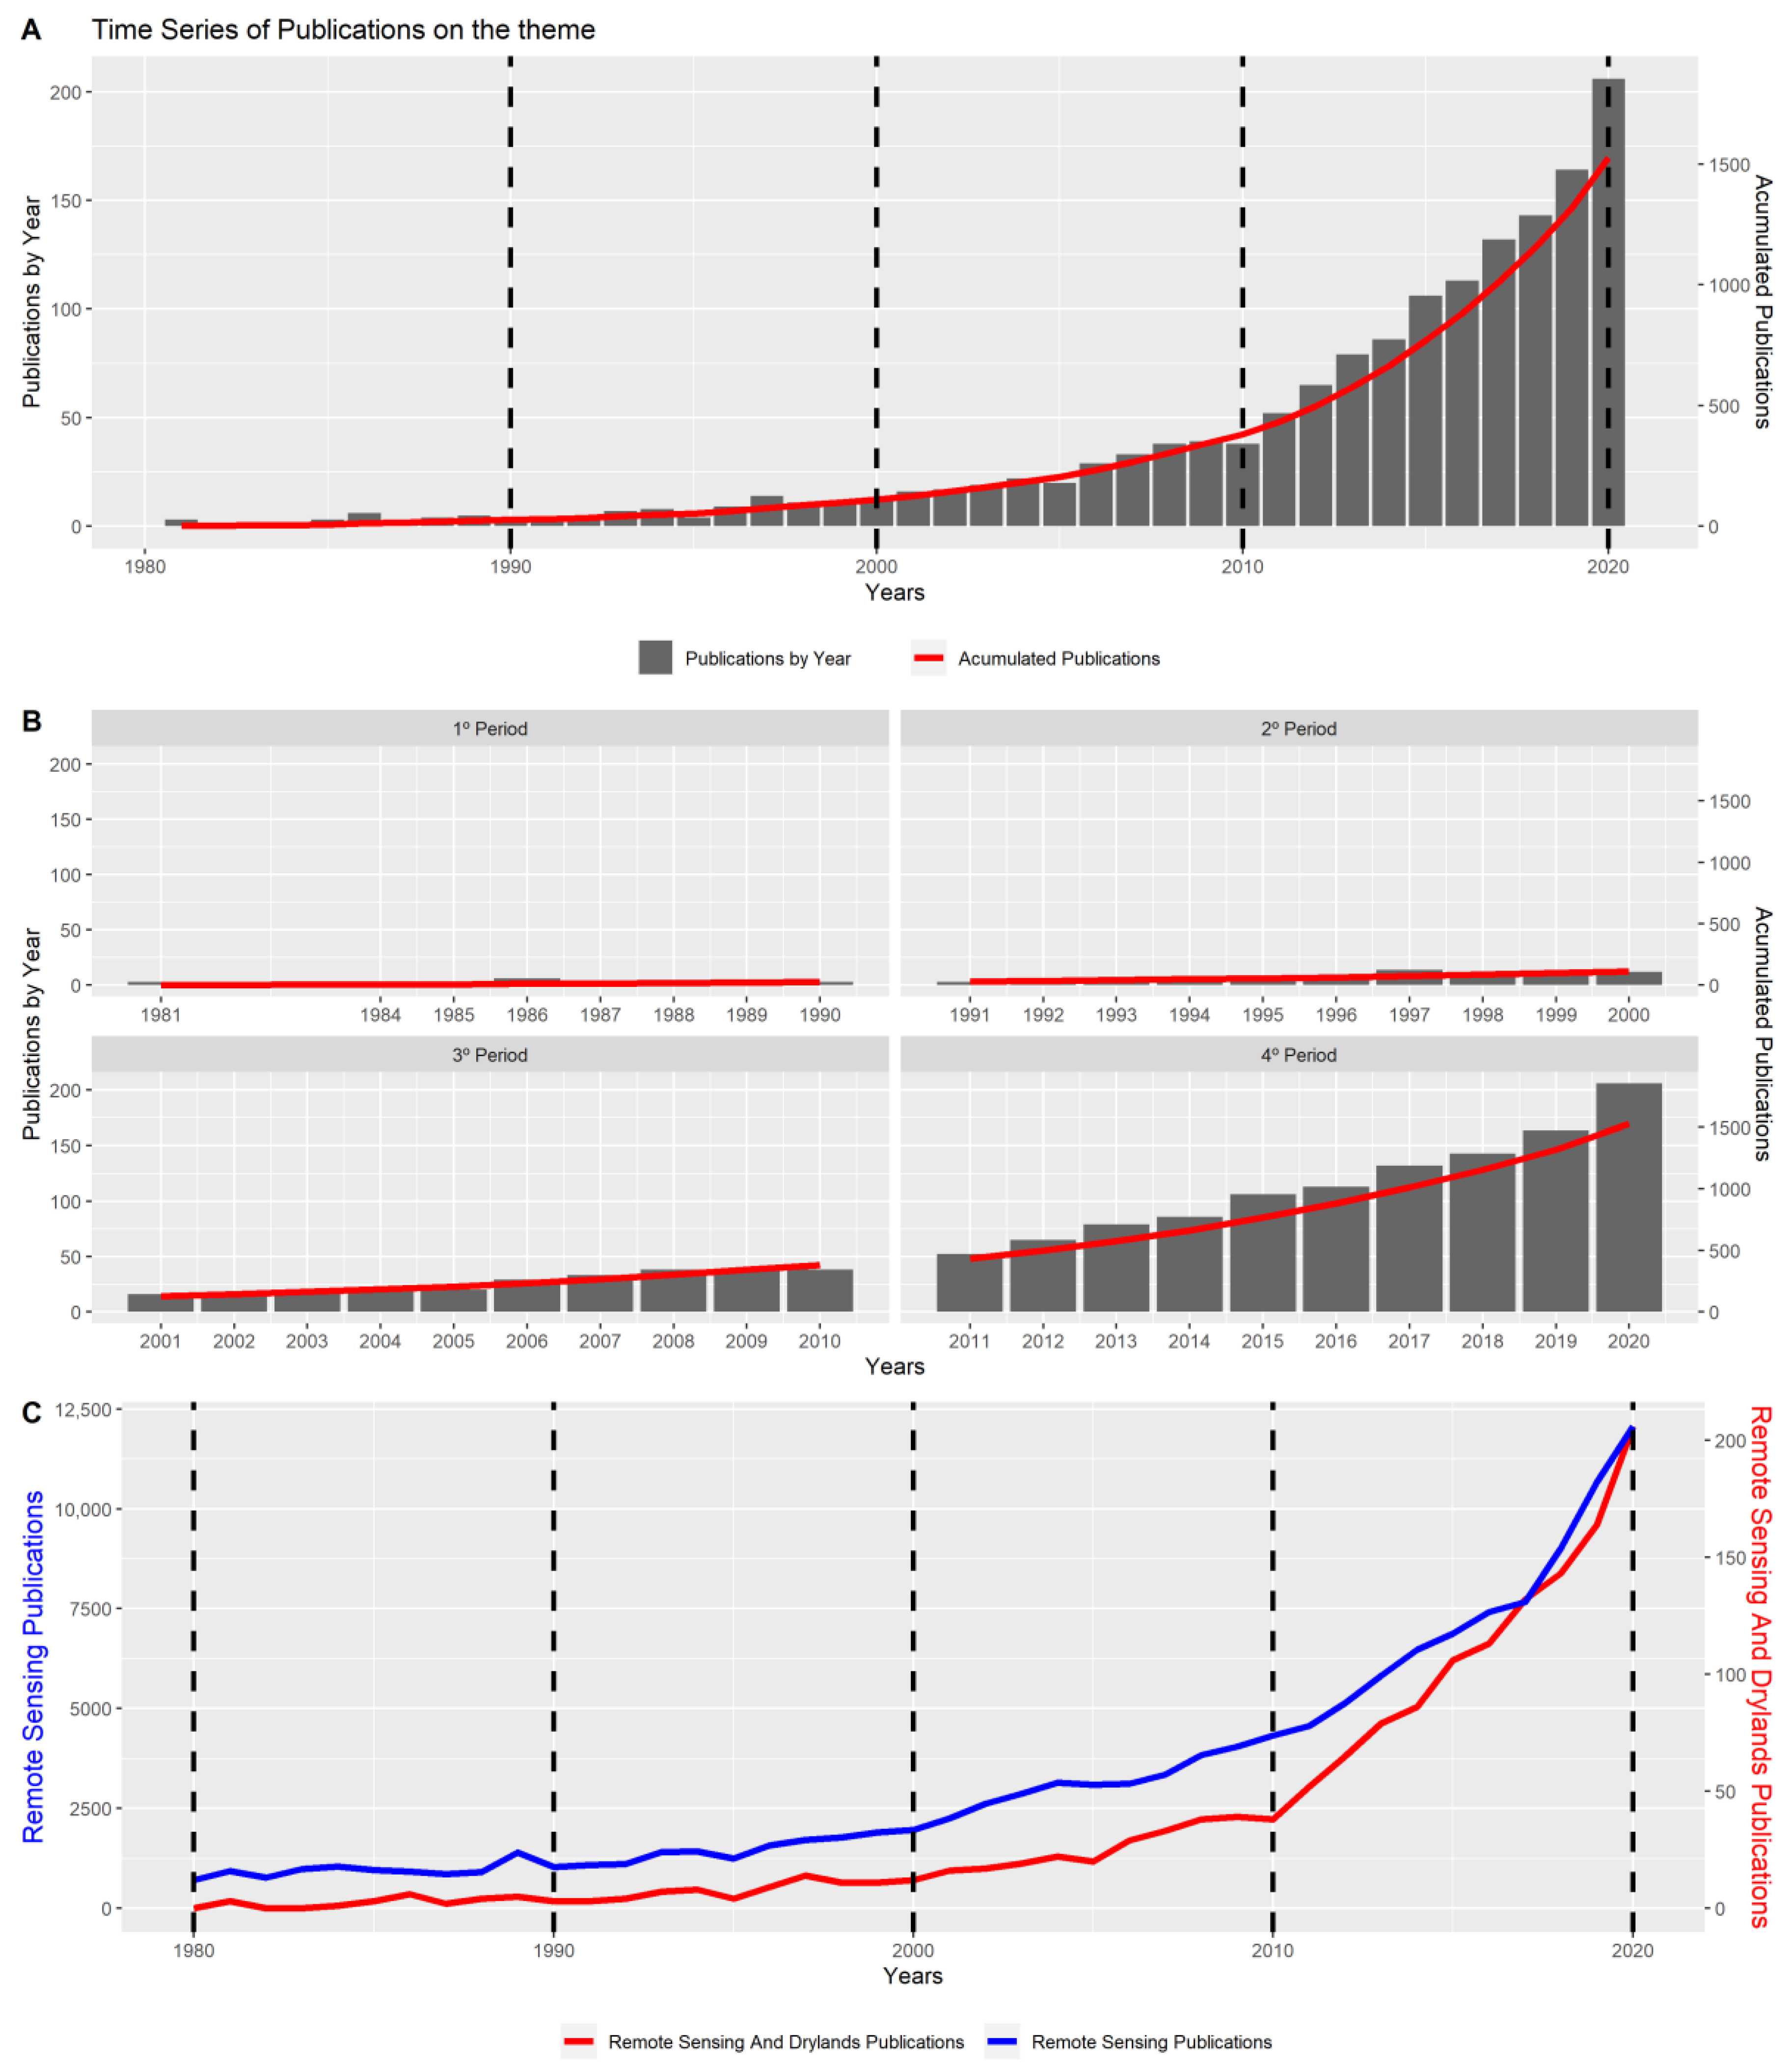
3.2. Temporal Distribution of Publications

The yearly evolution and the accumulated number of publications, total and divided by periods, are presented in Figure 4A,B. Unsurprisingly, in line with the general acceleration of knowledge production, the main characteristic observed is an exponential increase in the number of RSLDD publications over time, with an annual growth rate of 11.4%, increasing after the beginning of the XX century, especially from 2011 to 2020. In this most recent decade, we located 1147 papers, with an annual growth rate of ~16.7%, corresponding to ~75.1% of the all-time total number of publications, while the first period accumulated only 26 papers, ~1.7% of the all-time total.
Figure 4C compares the yearly evolution of RSLDD publications and of general remote sensing publications. The main difference between these time series is in the fourth period, where the increase in RSLDD publications exceeds that of general remote sensing publications with an annual growth rate of ~16.7%, compared to an annual growth rate of ~11.5%, suggesting not only a sustained but a heightened research interest in RSLDD.

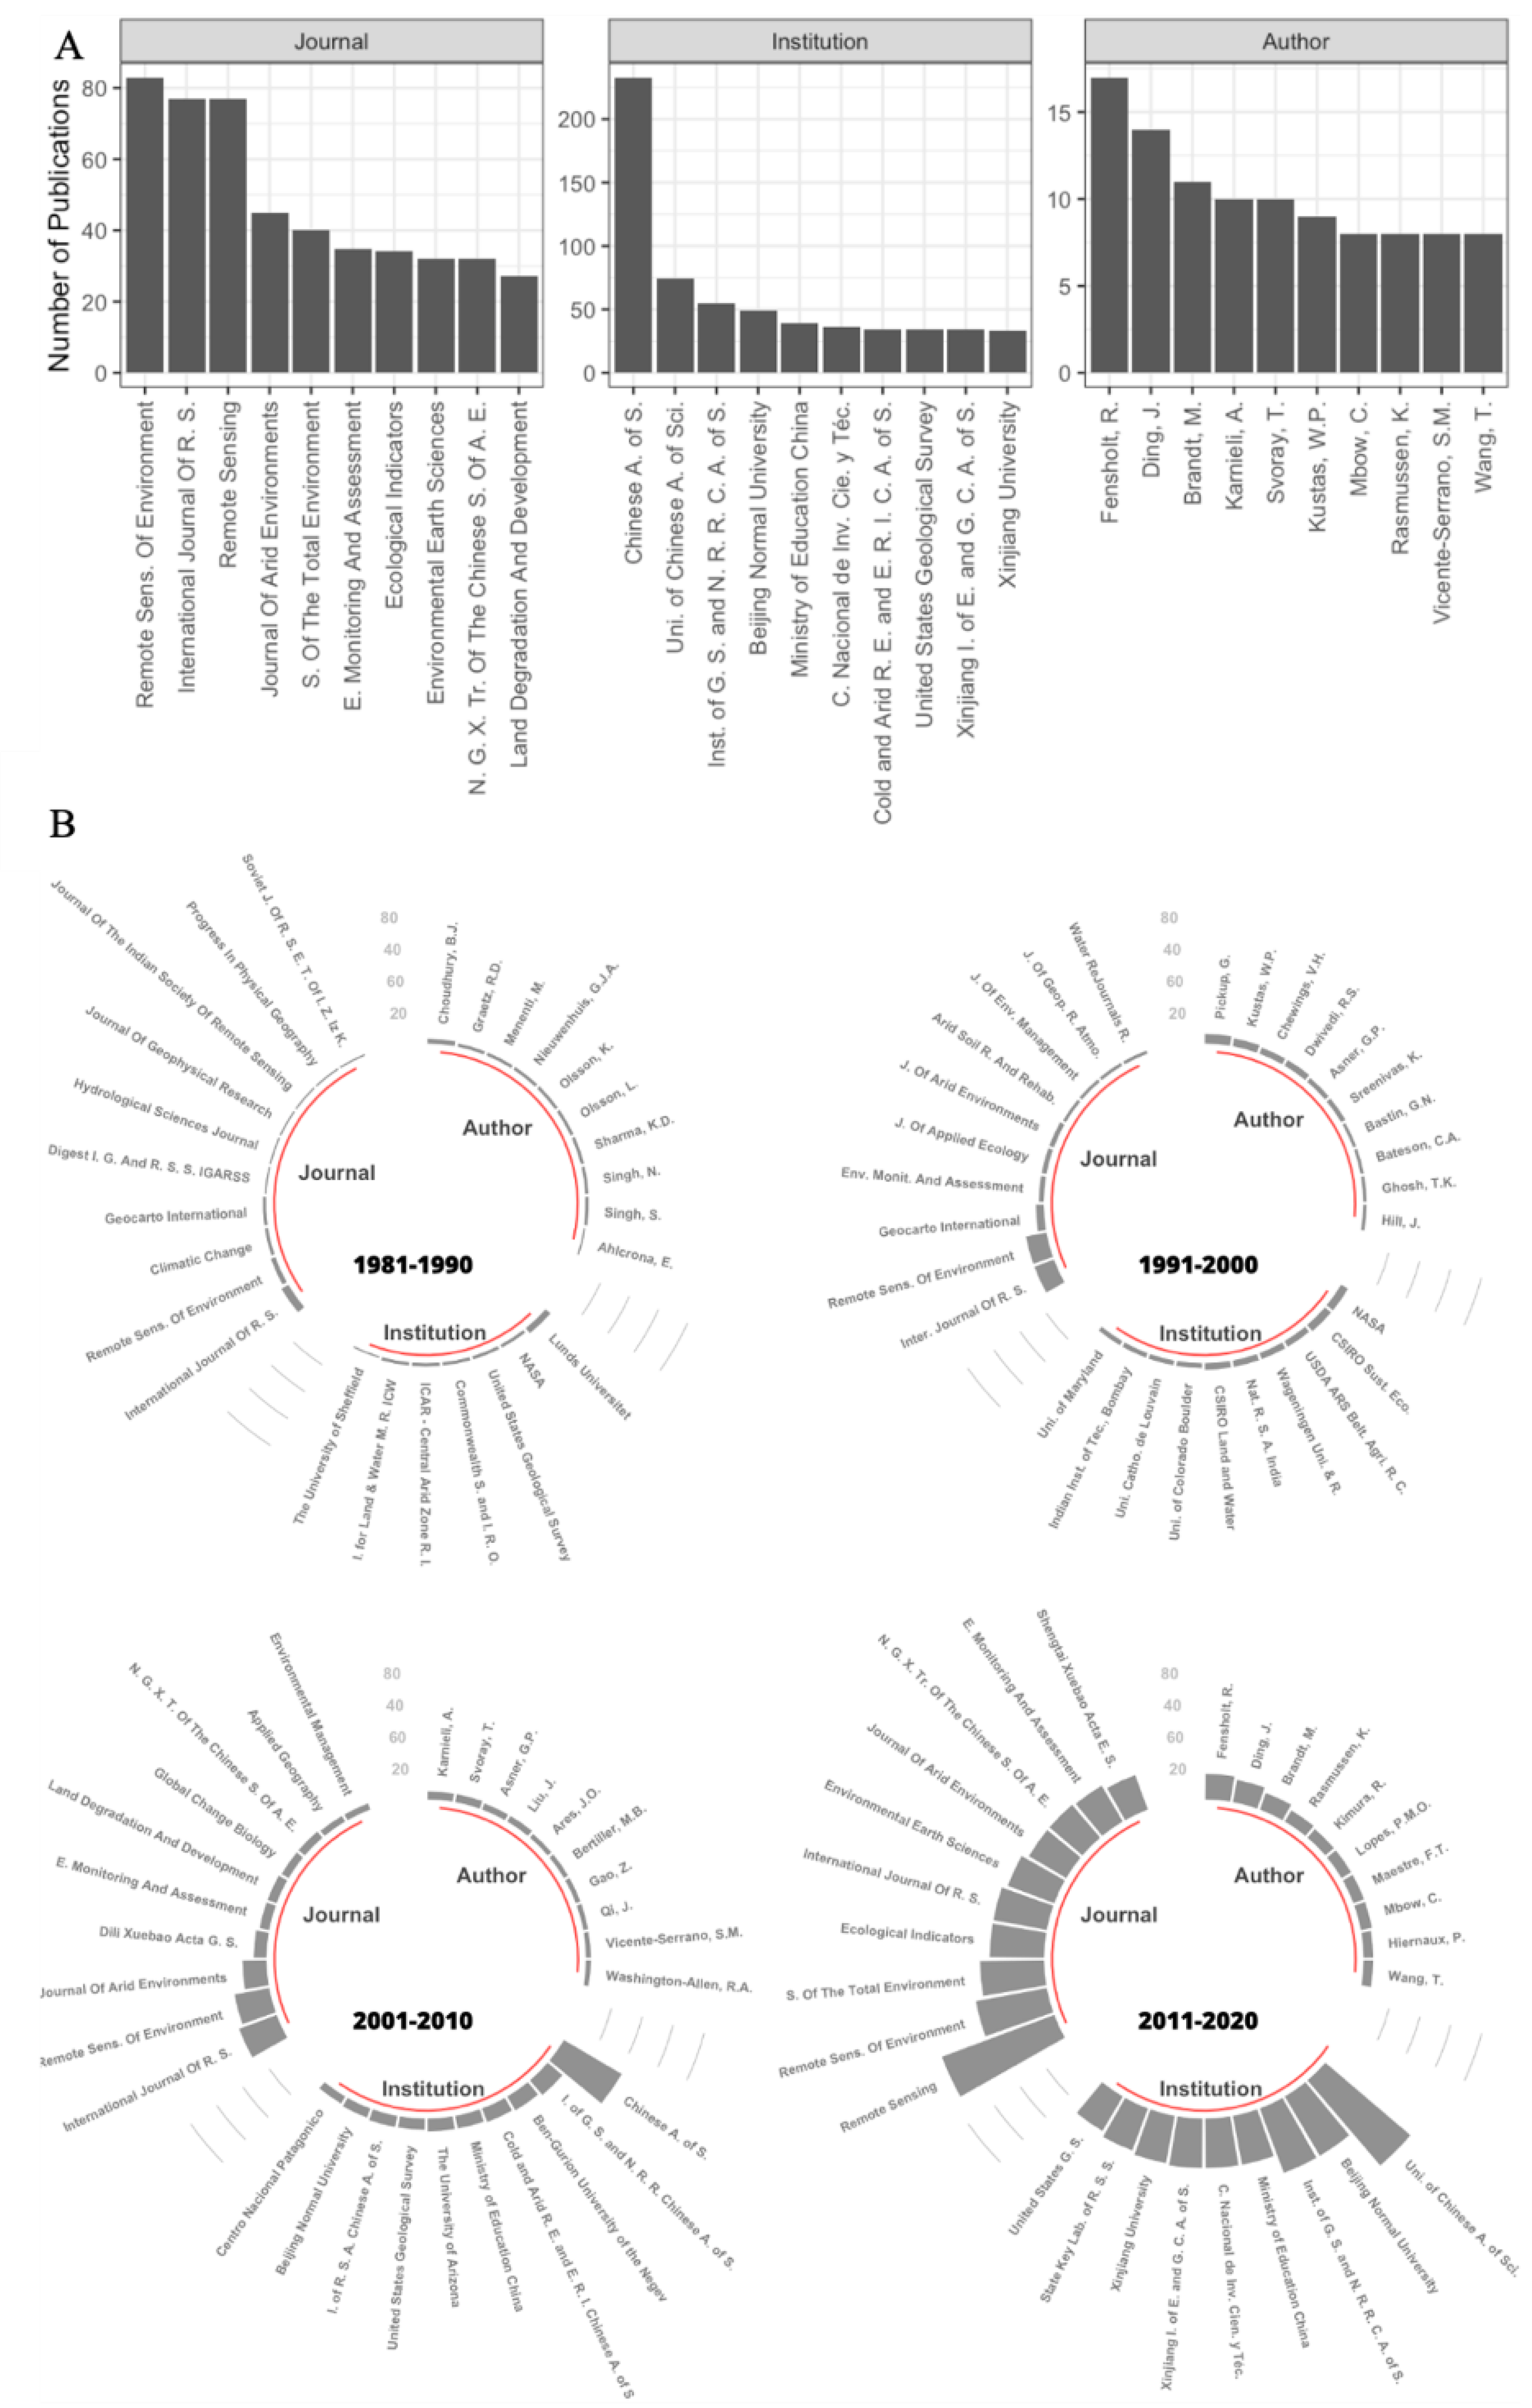
3.3. Representative Journals, Authors, and Institutions

Figure 5 shows the top 10 representative authors, institutions, and journals associated with these papers accumulated over time (Figure 5A) and per decade (Figure 5B). We highlight the “International Journal of Remote Sensing” and the “Remote Sensing of Environment” as leading journals on the subject, with 83 and 77 papers, respectively, placing them in the top 10 in all four decades. Other representative journals include “Journal of Arid Environments” (present in the top 10 in three of the analyzed periods) with 45 papers and “Remote Sensing” with 40 papers in the last period. Chinese institutions are well represented among the top producers of RSLDD publications (Figure 5A), however, only from the 2000s (Figure 5B).
In prior decades, the top 10 institutions represented more geographic diversity, including European, American, Australian, Israeli, and Indian institutions. More geographic and institutional diversity is found among the top producing authors than among the top producing institutions throughout all time periods. The ten all-time most prolific authors of RSLDD publications include several individuals from the University of Copenhagen in Denmark, even though this university is not among the top ten institutions producing RSLDD publications.

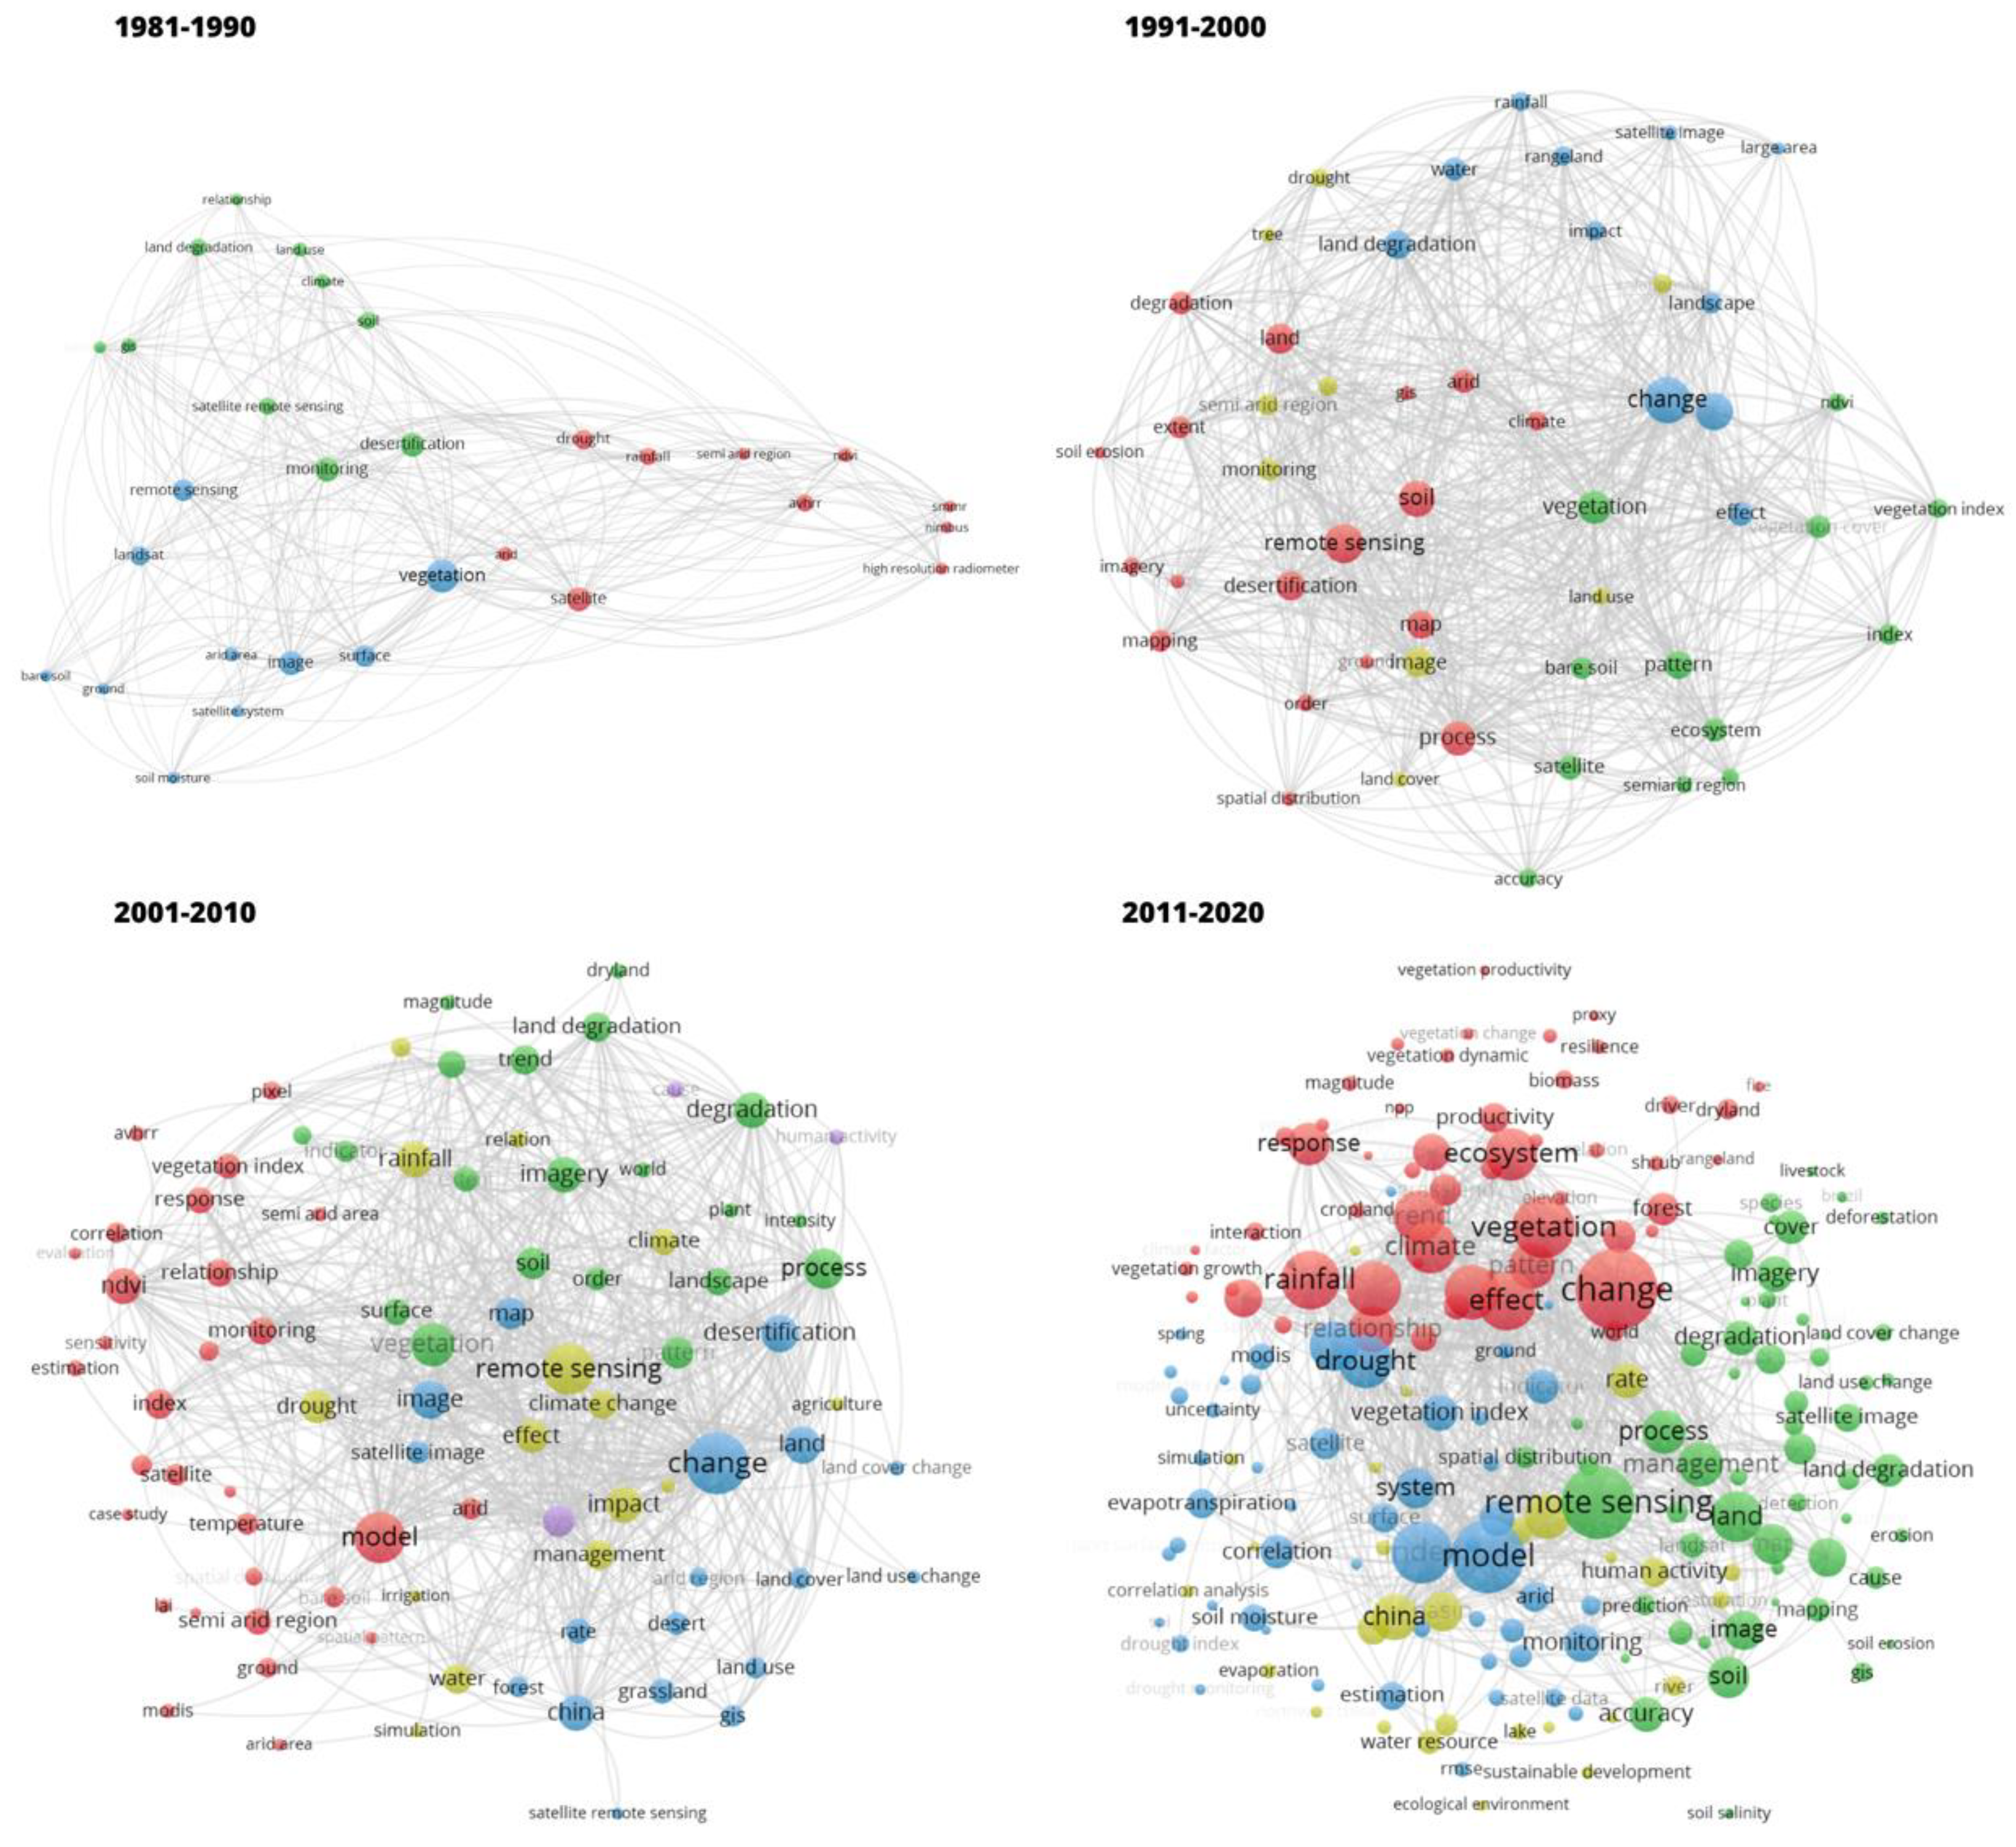
3.4. Methodologies, Concepts, and Main Papers per Decade

This section shows the results of the co-occurrence networks based on titles or abstracts of 1527 papers analyzed in this study by decade (Figure 6) and their frequencies (Table 2). In addition, we created a synthesis table of the most cited individual papers per decade (see more details in Supplementary Material Table S1).
Figure 6 illustrates a visualization of co-occurrence networks of terms, which are grouped thematically using a VOS mapping technique [26]. The algorithm extracts terms from titles and abstracts of the RSLDD publication database and cluster them thematically based on their close relation [26]. A minimum number of repetitions of the terms within the database is specified in order to avoid the inclusion of insignificant terms. The algorithm automatically determines the number of clusters based on the underlying data structure.
For the first period, we specified a minimum of three repetitions of terms between the documents. The algorithm found 30 terms and grouped them into three clusters of related terms, visualized here with different colors, such as “Landsat” and “bare soil” in blue, “desertification” in yellow, and “soil moisture” in red. For the second decade, a minimum of six repetitions between the analyzed papers was specified, resulting in 50 terms grouped into four different clusters, with the most important ones in green being “vegetation index”, “ndvi”, “vegetation cover”, and “bare soil”. In the blue cluster, “rainfall” and “water”, in the yellow cluster, “land use” and “drought”, and in the red cluster, “mapping”, “desertification”, and “soil erosion”.
For periods 3 and 4, we specified a minimum of 12 and 24 repetitions of terms, respectively. During the first decade of the XXI century, 86 terms and five clusters were identified, with blue, green, and red standing out because they synthesize concepts, methods, indicators, and regions of study. Terms like “china”, “human activity”, “lai”, “agriculture”, and “temperature” appear in this decade.
Between 2011 and 2020, with 190 terms in four distinct clusters, even more indicators and methodologies are represented by the co-occurring terms, highlighting climate and water indicators of degradation, such as “evapotranspiration”, “lst” (land surface temperature); new methods, such as “model” and “time series”; and an increase associated with vegetation analysis, such as “biomass”, “carbon”, and “npp”.
Despite the progressively more restrictive filter applied in each period, the number of relevant terms identified increased considerably, from 30 in the first, 50 in the second, 86 in the third, to 190 in the last.
This progressive increase in the number of terms does not affect the number of clusters generated in each network, which remains steady between three and five. It is also essential to highlight the frequency of the terms in these decadal networks (Table 2).
We found 33 land degradation indicators throughout the four decades, such as “bare soils”, “drought”, “land use”, and “rainfall”, analysis tools and methods, such as “gis” with frequency 4 and “ndvi”, spatial hotspots, such as “China” (frequency 2) and “Brazil” (frequency 1), and satellite sensors, such as “landsat” (frequency 2) and “modis” (frequency 1).
The most cited papers in each of the periods are listed in Supplementary Material Table S1. We selected the first 5 papers for the first two decades, and the first 10 papers for the last two decades, due to the larger volume of documents in the last two decades.
In general, it is possible to note that the “Remote Sensing of Environment”, with seven publications, followed by the “International Journal of Remote Sensing”, with four publications, the “Journal of Arid Environments”, and the “International Journal of Applied Earth Observation and Geoinformation”, with three publications each, are the journals that published the most cited papers.
Regarding the study locations, there is considerable heterogeneity, with Australia standing out. The “Landsat” and “AVHRR” sensor systems are the main sources of remote sensing data. In terms of indicators, land cover analysis dominates, followed by indicators associated to land cover and climate factors.
As the first space-borne Earth observation system, operating since the 1970s [32], the “Landsat” sensor system dominates the most cited publications list in the 1980s, especially in analyses of land use and cover in research carried out in the United States and Australia. Although “Landsat” has maintained a leading position in the 1990s and beyond, other relevant sensor systems started surging in publications, as the potential of the NOAA AVHRR sensor, originally designed for atmospheric observations, was discovered for land observations, especially the monitoring of green vegetation [33].
In terms of journals, “Remote Sensing of the Environment” prominently features among the most influential publications, with a more diverse journal base emerging in the 2000s.
A progressive diversification is also observed in the indicators for studying land degradation. Land cover dominates the indicators in the 1980s and 1990s, with more diverse and complex indicators appearing in the 2000s, such as “Fire”, “Carbon”, and “Land Cover/Rainfall”. By the 2010s, combining land cover with climate indicators became a common practice for assessing land degradation.

4. Discussion

Our analysis of 1527 papers on RSLDD over four decades and in all continents shows a growing interest in RSLDD, exceeding the increase in general remote sensing research in the last decade (2011–2020). From the spatial perspective, we identified Australia, the United States, and, more recently, China as three geographic centers of dryland research and collaboration, all of which concentrate a large portion of drylands in their territories. Furthermore, we found 33 representative RSLDD indicators and a variety of methods used to evaluate these indicators, mainly associated with vegetation dynamics and land use/land cover change.
The increase in RSLDD publications over time parallels similar observations in previous bibliometric studies on different remote sensing topics [22,23,24]. This result is mainly associated with improved data accessibility and computation processing power [22], notably the enactment of free and open access to the entire Landsat archive [32] and the rise of the cloud-based Google Earth Engine platform, which facilitates large-volume remote sensing analysis without the need for local data storage and high performance computing resources [34,35,36]. These developments had huge importance because they leveled the playing field by allowing lower-income countries to enter the research stage, and as a result increased internationalization of RSLDD research, which is shown in the publication, citations, and collaboration networks. They also enabled studies at higher spatial resolutions, which are better suited for the spatial scales at which land degradation is typically observable.
Spatial hotspots of RSLDD scientific knowledge production have changed throughout time, between Australia, the United States, and China. The United States is frequently in reviews interacting with remote sensing as a subject of analysis [20,22,23], and we can observe increased output and citation of Chinese-authored papers in the recent decade. China has been building its global competitiveness and ambition to be a global leader in science and innovation by 2050 [22].
The main indicators and methods of RSLDD research identified by the analysis of co-occurrence networks corroborate the lines of development of research outlined in traditional literature review studies on the topic [4]. Defined indicators and methods are important because they help with the complex conceptualization of land degradation in drylands. The bare soils, rainfall, droughts, and land use have been representative indicators since the 1980s [37,38]. Even more indicators have been developed mainly in the last two decades, and they have been always conditioned to land use land cover dynamics or climate patterns. Concerning the methods, we found that spectral indexes of vegetation, such as the Normalized Difference Vegetation Index (NDVI), constitute one of the most traditional methodologies for mapping [39,40,41] but with known limitations regarding soil fraction interference in highly seasonal environments with sparse trees and shrubs [42]. In this sense, some studies were directed to improve spectral unmixing, in which the pixels are decomposed into sub-pixels, and each existing fraction is quantified [43,44]. Better results were found with this technique, using different sensor systems [45,46]. Over the last few years, time series analyses have been incorporated into studies of this nature, often correlated to climate indicators such as precipitation and temperature [40,47].
Although we obtained representative results for the understanding RSLDD, it is important to acknowledge some limitations of the methodology and the results: (i) bibliometric research is viewed as objective because it is quantitative, transparent, and scalable. However, citation count indicates impact rather than quality [48], which would need to be complemented with traditional review studies that uncover the contents of individual publications in more detail; (ii) with our search terms in English, we only included English-language publications, while they can be assumed to be the majority, there might be significant knowledge production published in French, Chinese, Portuguese, and Spanish, which was left out; (iii) some relevant papers might avoid the term “desertification” because of its weak scientific [12] basis and hence have not shown up in our database of RSLDD publications; and (iv) although journal articles are the primary carrier for remote sensing knowledge, some relevant knowledge may be included in books and book chapters that are not indexed in the Scopus database and, hence, were left out of our analysis.

5. Conclusions

This bibliometric analysis confirmed remote sensing as a robust and heavily relied-upon set of tools for studying land degradation in drylands. Throughout forty years of scientific production on RSLDD, we showed the geographic hotspots, leading authors, leading journals, leading institutions, the trend of the number of publications, representative methods and indicators, and most cited papers. Therefore, we were able to answer the research questions we proposed. Besides our usage of Scopus, which is a world reference database, it is recommended to add other sources of data in further studies, such as the “Web of Science” and “Google Scholar”, in order to increase the content presented here and create an even more robust review.

Supplementary Materials

The following supporting information can be downloaded at: https://www.mdpi.com/article/10.3390/land12091721/s1, Refs. [49,50,51,52,53,54,55,56,57,58,59,60,61,62,63,64,65,66,67,68,69,70,71,72]. Table S1. The table describes the details associated with most cited papers in each of the analyzed periods. For the first and second periods, we present the top 5 most cited papers, and for the third and fourth periods, we illustrate the top 10 most cited papers. The numbers of citations refer only to citations obtained within the respective time period.

Author Contributions

Conceptualization, D.P.C., S.M.H., A.T.C.L., C.A.D.L., R.N.V., W.J.S.F.R., E.C.B.C., J.S.B.L., E.M.R.S., J.F.-F., M.O. and L.d.S.B.; methodology, D.P.C., S.M.H., A.T.C.L., C.A.D.L., R.N.V. and E.C.B.C.; software execution, D.P.C., E.M.R.S., S.M.H., R.N.V., W.J.S.F.R. and E.C.B.C.; writing—original draft preparation, D.P.C., S.M.H., A.T.C.L., C.A.D.L. and R.N.V.; writing—review and editing, S.M.H., A.T.C.L., C.A.D.L. and W.J.S.F.R.; supervision, D.P.C., S.G.D., C.A.D.L. and A.T.C.L.; funding acquisition, E.M.R.S., J.F.-F. and M.O. All authors have read and agreed to the published version of the manuscript.

Funding

D.P.C. was financially supported by the Bahia State Research Foundation (FAPESB) under grant #BOL 0457/2019 and by CAPES/CAPES/PRINT through grant no. 41/2017. W.S.F.R. was supported by a CNPQ research fellowship under Process #314954/2021-0 and the Prospecta 4.0—CNPQ research grant under Process #407907/2022-0. D.P.C, R.N.V., and W.S.F.R. were supported by the INCT IN-TREE for Technology in Interdisciplinary and Transdisciplinary Studies in Ecology and Evolution. D.P.C, R.N.V., S.G.D., and W.S.F.R. were supported by WRI subgrant to WRI Brasil no. 73054 related to the Land and Carbon Lab platform.

Data Availability Statement

No data available.

Acknowledgments

We extend our gratitude to the anonymous reviewers for their valuable comments and suggestions, which greatly contributed to enhancing the quality and presentation of this manuscript.

Conflicts of Interest

The authors declare no conflict of interest.

References

  1. Tian, F.; Brandt, M.; Liu, Y.Y.; Verger, A.; Tagesson, T.; Diouf, A.A.; Rasmussen, K.; Mbow, C.; Wang, Y.; Fensholt, R. Remote Sensing of Vegetation Dynamics in Drylands: Evaluating Vegetation Optical Depth (VOD) Using AVHRR NDVI and in Situ Green Biomass Data over West African Sahel. Remote Sens. Environ. 2016, 177, 265–276. [Google Scholar] [CrossRef]
  2. Vicente-Serrano, S.M.; Cabello, D.; Tomás-Burguera, M.; Martín-Hernández, N.; Beguería, S.; Azorin-Molina, C.; EI Kenawy, A. Drought Variability and Land Degradation in Semiarid Regions: Assessment Using Remote Sensing Data and Drought Indices (1982–2011). Remote Sens. 2015, 7, 4391–4423. [Google Scholar] [CrossRef]
  3. Wang, L.; D’Odorico, P.; Evans, J.P.; Eldridge, D.J.; McCabe, M.F.; Caylor, K.K.; King, E.G. Dryland Ecohydrology and Climate Change: Critical Issues and Technical Advances. Hydrol. Earth Syst. Sci. 2012, 16, 2585–2603. [Google Scholar] [CrossRef]
  4. Smith, W.K.; Dannenberg, M.P.; Yan, D.; Herrmann, S.; Barnes, M.L.; Barron-Gafford, G.A.; Biederman, J.A.; Ferrenberg, S.; Fox, A.M.; Hudson, A.; et al. Remote Sensing of Dryland Ecosystem Structure and Function: Progress, Challenges, and Opportunities. Remote Sens. Environ. 2019, 233, 111401. [Google Scholar] [CrossRef]
  5. Bradford, J.B.; Schlaepfer, D.R.; Lauenroth, W.K.; Palmquist, K.A.; Chambers, J.C.; Maestas, J.D.; Campbell, S.B. Climate-Driven Shifts in Soil Temperature and Moisture Regimes Suggest Opportunities to Enhance Assessments of Dryland Resilience and Resistance. Front. Ecol. Evol. 2019, 7, 358. [Google Scholar] [CrossRef]
  6. Herrmann, S.M.; Brandt, M.; Rasmussen, K.; Fensholt, R. Accelerating Land Cover Change in West Africa over Four Decades as Population Pressure Increased. Commun. Earth Environ. 2020, 1, 53. [Google Scholar] [CrossRef]
  7. Sun, D. Detection of Dryland Degradation Using Landsat Spectral Unmixing Remote Sensing with Syndrome Concept in Minqin County, China. Int. J. Appl. Earth Obs. Geoinf. 2015, 41, 34–45. [Google Scholar] [CrossRef]
  8. Brandt, M.; Wigneron, J.P.; Chave, J.; Tagesson, T.; Penuelas, J.; Ciais, P.; Rasmussen, K.; Tian, F.; Mbow, C.; Al-Yaari, A.; et al. Satellite Passive Microwaves Reveal Recent Climate-Induced Carbon Losses in African Drylands. Nat. Ecol. Evol. 2018, 2, 827–835. [Google Scholar] [CrossRef]
  9. Fensholt, R.; Proud, S.R. Evaluation of Earth Observation Based Global Long Term Vegetation Trends—Comparing GIMMS and MODIS Global NDVI Time Series. Remote Sens. Environ. 2012, 119, 131–147. [Google Scholar] [CrossRef]
  10. Symeonakis, E.; Karathanasis, N.; Koukoulas, S.; Panagopoulos, G. Monitoring Sensitivity to Land Degradation and Desertification with the Environmentally Sensitive Area Index: The Case of Lesvos Island. Land Degrad. Dev. 2016, 27, 1562–1573. [Google Scholar] [CrossRef]
  11. Lambin, E.F. Modelling and Monitoring Land-Cover Change Processes in Tropical Regions. Prog. Phys. Geogr. 1997, 21, 375–393. [Google Scholar] [CrossRef]
  12. Herrmann, S.M.; Hutchinson, C.F. The Changing Contexts of the Desertification Debate. J. Arid. Environ. 2005, 63, 538–555. [Google Scholar] [CrossRef]
  13. Herrmann, S.M.; Anyamba, A.; Tucker, C.J. Recent Trends in Vegetation Dynamics in the African Sahel and Their Relationship to Climate. 2005, 15, 394–404. Glob. Environ. Chang. 2005, 15, 394–404. [Google Scholar] [CrossRef]
  14. Mariano, D.A.; dos Santos, C.A.C.; Wardlow, B.D.; Anderson, M.C.; Schiltmeyer, A.V.; Tadesse, T.; Svoboda, M.D. Use of Remote Sensing Indicators to Assess Effects of Drought and Human-Induced Land Degradation on Ecosystem Health in Northeastern Brazil. Remote Sens. Environ. 2018, 213, 129–143. [Google Scholar] [CrossRef]
  15. Yang, X.; Zhang, K.; Jia, B.; Ci, L. Desertification Assessment in China: An Overview. J. Arid. Environ. 2005, 63, 517–531. [Google Scholar] [CrossRef]
  16. Diouf, A.; Lambin, E.F. Monitoring Land-Cover Changes in Semi-Arid Regions: Remote Sensing Data and Field Observations in the Ferlo, Senegal. J. Arid. Environ. 2001, 48, 129–148. [Google Scholar] [CrossRef]
  17. Mbow, C.; Brandt, M.; Ouedraogo, I.; de Leeuw, J.; Marshall, M. What Four Decades of Earth Observation Tell Us about Land Degradation in the Sahel? Remote Sens. 2015, 7, 4048–4067. [Google Scholar] [CrossRef]
  18. Wang, L.; Zhang, G.; Wang, Z.; Liu, J.; Shang, J.; Liang, L. Bibliometric Analysis of Remote Sensing Research Trend in Crop Growth Monitoring: A Case Study in China. Remote Sens. 2019, 11, 809. [Google Scholar] [CrossRef]
  19. Ellegaard, O. The Application of Bibliometric Analysis: Disciplinary and User Aspects. Scientometrics 2018, 116, 181–202. [Google Scholar] [CrossRef]
  20. Duan, P.; Wang, Y.; Yin, P. Remote Sensing Applications in Monitoring of Protected Areas: A Bibliometric Analysis. Remote Sens. 2020, 12, 772. [Google Scholar] [CrossRef]
  21. Zhang, H.; Huang, M.; Qing, X.; Li, G.; Tian, C. Bibliometric Analysis of Global Remote Sensing Research during 2010–2015. ISPRS Int. J. Geo-Inf. 2017, 6, 332. [Google Scholar] [CrossRef]
  22. Vasconcelos, R.N.; Lima, A.T.C.; Lentini, C.A.D.; Miranda, G.V.; Mendonça, L.F.; Silva, M.A.; Cambuí, E.C.B.; Lopes, J.M.; Porsani, M.J. Oil Spill Detection and Mapping: A 50-Year Bibliometric Analysis. Remote Sens. 2020, 12, 3647. [Google Scholar] [CrossRef]
  23. Viana, J.; Santos, J.V.; Neiva, R.M.; Souza, J.; Duarte, L.; Teodoro, A.C.; Freitas, A. Remote Sensing in Human Health: A 10-Year Bibliometric Analysis. Remote Sens. 2017, 9, 1225. [Google Scholar] [CrossRef]
  24. Viana-Lora, A.; Nel-lo-Andreu, M.G. Bibliometric Analysis of Trends in COVID-19 and Tourism. Humanit. Soc. Sci. Commun. 2022, 9, 173. [Google Scholar] [CrossRef]
  25. Xu, Y.; Yang, Y.; Chen, X.; Liu, Y. Bibliometric Analysis of Global NDVI Research Trends from 1985 to 2021. Remote Sens. 2022, 14, 3967. [Google Scholar] [CrossRef]
  26. van Eck, N.J.; Waltman, L. Software Survey: VOSviewer, a Computer Program for Bibliometric Mapping. Scientometrics 2010, 84, 523–538. [Google Scholar] [CrossRef]
  27. Bastian, M.; Heymann, S.; Jacomy, M. Gephi: An Open Source Software for Exploring and Manipulating Networks. In Proceedings of the International AAAI Conference on Web and Social Media, San Jose, CA, USA, 17–20 May 2009; Volume 3, pp. 361–362. [Google Scholar] [CrossRef]
  28. Team, R.C. The R Project for Statistical Computing. 2023, pp. 1–12. Available online: http://www.R-Project.Org/ (accessed on 1 May 2023).
  29. RStudio RStudio|Open Source & Professional Software for Data Science Teams—RStudio. Available online: https://rstudio.com/ (accessed on 26 September 2020).
  30. Aria, M.; Cuccurullo, C. Bibliometrix: An R-Tool for Comprehensive Science Mapping Analysis. J. Informetr. 2017, 11, 959–975. [Google Scholar] [CrossRef]
  31. Wickham, H. Ggplot2: Create Elegant Data Visualisations Using the Grammar of Graphics. R Package Version 3.6.1. 2018. Available online: https://ggplot2.tidyverse.org/reference/ggplot2-package.html (accessed on 27 August 2023). [CrossRef]
  32. Wulder, M.A.; Roy, D.P.; Radeloff, V.C.; Loveland, T.R.; Anderson, M.C.; Johnson, D.M.; Healey, S.; Zhu, Z.; Scambos, T.A.; Pahlevan, N.; et al. Fifty Years of Landsat Science and Impacts. Remote Sens. Environ. 2022, 280, 113195. [Google Scholar] [CrossRef]
  33. Tucker, C.J. History of the Use of AVHRR Data for Land Applications. In Advances in the Use of NOAA AVHRR Data for Land Applications; D’Souza, G., Belward, A.S., Malingreau, J.-P., Eds.; Springer: Dordrecht, The Netherlands, 1996; pp. 1–19. ISBN 978-94-009-0203-9. [Google Scholar]
  34. Gorelick, N.; Hancher, M.; Dixon, M.; Ilyushchenko, S.; Thau, D.; Moore, R. Google Earth Engine: Planetary-Scale Geospatial Analysis for Everyone. Remote Sens. Environ. 2017, 202, 18–27. [Google Scholar] [CrossRef]
  35. Sidhu, N.; Pebesma, E.; Câmara, G. Using Google Earth Engine to Detect Land Cover Change: Singapore as a Use Case Using Google Earth Engine to Detect Land Cover Change: Singapore as a Use. Eur. J. Remote Sens. 2018, 51, 486–500. [Google Scholar] [CrossRef]
  36. Souza, C.M.; Shimbo, J.Z.; Rosa, M.R.; Parente, L.L.; Alencar, A.A.; Rudorff, B.F.T.; Hasenack, H.; Matsumoto, M.; Ferreira, L.G.; Souza-Filho, P.W.M.; et al. Reconstructing Three Decades of Land Use and Land Cover Changes in Brazilian Biomes with Landsat Archive and Earth Engine. Remote Sens. 2020, 12, 2735. [Google Scholar] [CrossRef]
  37. Graetz, R.D.; Pech, R.P.; Davis, A.W. The Assessment and Monitoring of Sparsely Vegetated Rangelands Using Calibrated Landsat Data. Int. J. Remote Sens. 1988, 9, 1201–1222. [Google Scholar] [CrossRef]
  38. Symeonakis, E.; Drake, N. Monitoring Desertification and Land Degradation over Sub-Saharan Africa. Int. J. Remote Sens. 2004, 25, 573–592. [Google Scholar] [CrossRef]
  39. Sternberg, T.; Tsolmon, R.; Middleton, N.; Thomas, D. Tracking Desertification on the Mongolian Steppe through NDVI and Field-Survey Data. Int. J. Digit. Earth 2011, 4, 50–64. [Google Scholar] [CrossRef]
  40. Tian, F.; Fensholt, R.; Verbesselt, J.; Grogan, K.; Horion, S.; Wang, Y. Evaluating Temporal Consistency of Long-Term Global NDVI Datasets for Trend Analysis. Remote Sens. Environ. 2015, 163, 326–340. [Google Scholar] [CrossRef]
  41. Fu, B.; Burgher, I. Riparian Vegetation NDVI Dynamics and Its Relationship with Climate, Surface Water and Groundwater. J. Arid. Environ. 2015, 113, 59–68. [Google Scholar] [CrossRef]
  42. Graetz, R.D. Satellite Remote Sensing of Australian Rangelands. Remote Sens. Environ. 1987, 23, 313–331. [Google Scholar] [CrossRef]
  43. Bullock, E.L.; Woodcock, C.E.; Olofsson, P. Monitoring Tropical Forest Degradation Using Spectral Unmixing and Landsat Time Series Analysis. Remote Sens. Environ. 2018, 238, 110968. [Google Scholar] [CrossRef]
  44. Souza, C.M.; Roberts, D.A.; Cochrane, M.A. Combining Spectral and Spatial Information to Map Canopy Damage from Selective Logging and Forest Fires. Remote Sens. Environ. 2005, 98, 329–343. [Google Scholar] [CrossRef]
  45. Asner, G.P.; Heidebrecht, K.B. Spectral Unmixing of Vegetation, Soil and Dry Carbon Cover in Arid Regions: Comparing Multispectral and Hyperspectral Observations. Int. J. Remote Sens. 2002, 23, 3939–3958. [Google Scholar] [CrossRef]
  46. Asner, G.P.; Lobell, D.B. A Biogeophysical Approach for Automated SWIR Unmixing of Soils and Vegetation. Remote Sens. Environ. 2000, 74, 99–112. [Google Scholar] [CrossRef]
  47. van Dijk, A.I.J.M.; Beck, H.E.; Crosbie, R.S.; de Jeu, R.A.M.; Liu, Y.Y.; Podger, G.M.; Timbal, B.; Viney, N.R. The Millennium Drought in Southeast Australia (2001–2009): Natural and Human Causes and Implications for Water Resources, Ecosystems, Economy, and Society. Water Resour. Res. 2013, 49, 1040–1057. [Google Scholar] [CrossRef]
  48. Wallin, J.A. Bibliometric Methods: Pitfalls and Possibilities. Basic. Clin. Pharmacol. Toxicol. 2005, 97, 261–275. [Google Scholar] [CrossRef] [PubMed]
  49. Robinove, C.J.; Chavez, P.S.; Gehring, D.; Serwces, G.; Falls, S.; Holmgren, R. Arid Land Monitoring Using Landsat Albedo Difference Images. Remote Sens. Environ. 1981, 11, 133–156. [Google Scholar] [CrossRef]
  50. Otterman, J. Plane with Protrusions as an Atmospheric Boundary. J. Geophys. Res. 1981, 86, 6627–6630. [Google Scholar] [CrossRef]
  51. Sharma, K.D.; Singh, S.; Singh, N.; Bohra, D.N. Satellite remote sensing for detecting the temporal CHANGES in the grazing lands. Remote Sens. Environ. 1989, 17, 55–59. [Google Scholar] [CrossRef]
  52. Lambin, E.F.; Ehrlich, D. Land-Cover Changes in Sub-Saharan Africa (1982–1991): Application of a Change Index Based on Remotely Sensed Surface Temperature and Vegetation Indices at a Continental Scale. Remote Sens. Environ. 1997, 61, 181–200. [Google Scholar] [CrossRef]
  53. van Leeuwen, W.J.D.; Huete, A.R.; Laing, T.W. MODIS Vegetation Index Compositing Approach. Remote Sens. Environ. 1999, 69, 264–280. [Google Scholar] [CrossRef]
  54. Pickup, G.; Chewings, V.; Nelson, D. Estimating Changes in Vegetation Cover over Time in Arid Rangelands Using Landsat MSS Data. Remote Sens. Environ. 1993, 43, 243–263. [Google Scholar] [CrossRef]
  55. Del Valle, H.F.; Elissalde, N.O.; Gagliardini, D.A.; Milovich, J. Status of Desertification in the Patagonian Region: Assessment and Mapping from Satellite Imagery. Arid Soil Res. Rehabil. 1998, 12, 95–121. [Google Scholar] [CrossRef]
  56. Pickup, G.; Chewings, V.H. A Grazing Gradient Approach to Land Degradation Assessment in Arid Areas from Remotely-Sensed Data. Int. J. Remote Sens. 1994, 15, 517–520. [Google Scholar] [CrossRef]
  57. Evans, J.; Geerken, R. Discrimination between Climate and Human-Induced Dryland Degradation. J. Arid. Environ. 2004, 57, 535–554. [Google Scholar] [CrossRef]
  58. Ichii, K.; Kawabata, A.; Yamaguchi, Y. Global Correlation Analysis for NDVI and Climatic Variables and NDVI Trends: 1982–1990. Int. J. Remote Sens. 2002, 23, 3873–3878. [Google Scholar] [CrossRef]
  59. Helldén, U.; Tottrup, C. Regional Desertification: A Global Synthesis. Glob. Planet Chang. 2008, 64, 169–176. [Google Scholar] [CrossRef]
  60. Russell-Smith, J.; Yates, C.P.; Whitehead, P.J.; Smith, R.; Craig, R.; Allan, G.E.; Thackway, R.; Frakes, I.; Cridland, S.; Meyer, M.C.P.; et al. Bushfires “down under”: Patterns and Implications of Contemporary Australian Landscape Burning. Int. J. Wildland Fire 2007, 16, 361–377. [Google Scholar] [CrossRef]
  61. CAO, M.; PRINCE, S.D.; LI, K.; TAO, B.; SMALL, J.; SHAO, X. Response of Terrestrial Carbon Uptake to Climate Interannual Variability in China. Glob. Chang. Biol. 2003, 9, 536–546. [Google Scholar] [CrossRef]
  62. Rasmussen, K.; Fog, B.; Madsen, J.E. Desertification in Reverse? Observations from Northern Burkina Faso. Glob. Environ. Chang. 2001, 11, 271–282. [Google Scholar] [CrossRef]
  63. Okin, G.S.; Murray, B.; Schlesinger, W.H. Degradation of Sandy Arid Shrubland Environments: Observations, Process Modelling, and Management Implications. J. Arid. Environ. 2001, 47, 123–144. [Google Scholar] [CrossRef]
  64. Fensholt, R.; Langanke, T.; Rasmussen, K.; Reenberg, A.; Prince, S.D.; Tucker, C.; Scholes, R.J.; Le, Q.B.; Bondeau, A.; Eastman, R.; et al. Greenness in Semi-Arid Areas across the Globe 1981–2007—An Earth Observing Satellite Based Analysis of Trends and Drivers. Remote Sens. Environ. 2012, 121, 144–158. [Google Scholar] [CrossRef]
  65. Schulz, J.J.; Cayuela, L.; Echeverria, C.; Salas, J.; Rey Benayas, J.M. Monitoring Land Cover Change of the Dryland Forest Landscape of Central Chile (1975–2008). Appl. Geogr. 2010, 30, 436–447. [Google Scholar] [CrossRef]
  66. Abd El-Kawy, O.R.; Rød, J.K.; Ismail, H.A.; Suliman, A.S. Land Use and Land Cover Change Detection in the Western Nile Delta of Egypt Using Remote Sensing Data. Appl. Geogr. 2011, 31, 483–494. [Google Scholar] [CrossRef]
  67. Gessner, U.; Naeimi, V.; Klein, I.; Kuenzer, C.; Klein, D.; Dech, S. The Relationship between Precipitation Anomalies and Satellite-Derived Vegetation Activity in Central Asia. Glob. Planet Chang. 2013, 110, 74–87. [Google Scholar] [CrossRef]
  68. Zhang, X.; Liao, C.; Li, J.; Sun, Q. Fractional Vegetation Cover Estimation in Arid and Semi-Arid Environments Using: HJ-1 Satellite Hyperspectral Data. Int. J. Appl. Earth Obs. Geoinf. 2013, 21, 506–512. [Google Scholar] [CrossRef]
  69. Gebrehiwot, T.; van der Veen, A.; Maathuis, B. Spatial and Temporal Assessment of Drought in the Northern Highlands of Ethiopia. Int. J. Appl. Earth Obs. Geoinf. 2011, 13, 309–321. [Google Scholar] [CrossRef]
  70. Guo, Q.; Hu, Z.; Li, S.; Li, X.; Sun, X.; Yu, G. Spatial Variations in Aboveground Net Primary Productivity along a Climate Gradient in Eurasian Temperate Grassland: Effects of Mean Annual Precipitation and Its Seasonal Distribution. Glob. Chang. Biol. 2012, 18, 3624–3631. [Google Scholar] [CrossRef]
  71. Gao, J.; Liu, Y. Determination of Land Degradation Causes in Tongyu County, Northeast China via Land Cover Change Detection. Int. J. Appl. Earth Obs. Geoinf. 2010, 12, 9–16. [Google Scholar] [CrossRef]
  72. Vicente-Serrano, S.M.; Zouber, A.; Lasanta, T.; Pueyo, Y. Dryness Is Accelerating Degradation of Vulnerable Shrublands in Semiarid Mediterranean Environments. Ecol. Monogr. 2012, 82, 407–428. [Google Scholar] [CrossRef]
Figure 1. Methodological roadmap and data analysis of the bibliometric research.
Land 12 01721 g001
Figure 2. Spatial distribution of the publications. (A) Map shows papers’ origin country. The size and colors of the circles vary according to the number of citations. In shades of grey, the number of publications in each country and the lines represent the degree of collaboration. (B) Charts include the top 10 countries of each period regarding publications.
Land 12 01721 g002
Figure 3. Bivariate map shows the variables Number of Publications and Percent Dryland Area. Magenta colors represent the number of Publications. Cyan colors represent the Dryland Area. The upper left—lower right diagonal shows a positive relationship between the two variables: the more significant the dryland area, the higher the number of publications on RSLDD. The lower left—upper right diagonal shows deviation from this relationship.
Land 12 01721 g003
Figure 4. Evolution of the number of publications over time. (A) Complete time series of the publications; (B) time series by period; (C) time series of general remote sensing publications and RSLDD publications.
Land 12 01721 g004
Figure 5. The top 10 representative authors, institutions, and journals associated with the analyzed papers: (A) of the entire RSLDD database and (B) per decade.
Land 12 01721 g005
Figure 6. Co-occurrence networks of terms found in each period. The size of the circles is proportional to the number of times that terms appear. The lines represent the link between the terms. The colors indicate clusters, which are grouped based on the relation of the terms.
Land 12 01721 g006
Table 1. Analysis methods and source data to answer the main research questions.
QuestionsAnalysis MethodSource Data
How do RSLDD study publication trends behave?General statistics/Word Co-occurrence network/Country collaboration spatial networkAll papers
Which countries stand out in terms of RSLDD knowledge production?General statistics/Word Co-occurrence network/Country collaboration spatial networkAll papers
What are the most influential papers in the RSLDD field?General description tablesMost cited papers
Which journals are most prominent in terms of the number of articles published in the RSLDD field?General statistics/General description and citation tablesAll papers
What is the overall picture of collaboration between countries and institutions regarding the RSLDD field?General statistics/General description and citation tables/Country collaboration spatial networkAll papers
What are the central themes and approaches most used in research in the RSLDD field?Word co-occurrence network/General descriptionAll and Most cited
Table 2. Frequency of terms in the decadal networks.
TopicFrequency 4Frequency 3Frequency 2Frequency 1
Area of Interest ChinaAustralia; Brazil; Central Asia; India; Inner Mongolia; Iran
Methodsgisindex; model; ndvisoil moisture; land cover change; land use change; lai; time series; trendalgorithm; classification; correlation analysis; drought index; evi; npp; spi; drought monitoring
Sensors avhrr; landsat; modishigh resolution radiometer; smmr; moderate resolution imaging spectroradiometer; sentinel
Indicatorsbare soil; drought; land use; rainfalllandcoversoil erosion; agriculture; desert; human activity; irrigationair temperature; biodiversity; biomass; carbon; climate variability; deforestation; evaporation; evapotranspiration; fire; groundwater; land surface temperature; population; severe drought; soil salinity; species; surface temperature; topography; vegetation change; vegetation dynamic; vegetation productivity; water availability; water resource
Disclaimer/Publisher’s Note: The statements, opinions and data contained in all publications are solely those of the individual author(s) and contributor(s) and not of MDPI and/or the editor(s). MDPI and/or the editor(s) disclaim responsibility for any injury to people or property resulting from any ideas, methods, instructions or products referred to in the content.

