Article

Mapping and Analyses of Land Subsidence in Hengshui, China, Based on InSAR Observations

China Aero Geophysical Survey and Remote Sensing Center for Natural Resources, Beijing 100083, China
*
Author to whom correspondence should be addressed.
Land 2023, 12(9), 1684; https://doi.org/10.3390/land12091684
Submission received: 19 July 2023 / Revised: 7 August 2023 / Accepted: 11 August 2023 / Published: 28 August 2023
(This article belongs to the Special Issue Digital Mapping for Ecological Land)

Abstract

:
In this paper, we use interferometric synthetic aperture radar (InSAR) annual and time-series analysis of RADARSAT-2 SAR data, spanning from September 2011 to October 2022, to study the temporal–spatial characteristics of land subsidence in Hengshui, North China Plain. The data reveal two large-scale subsidence areas in Hengshui, individually located to the north of Hengshui city around the Hutuo River and to the east or south along the Fuyang, Suolu and Qingliang Rivers. The fastest subsidence arises after 2017, with the maximum rate exceeding 11 cm/year. We correlate the observed subsidence with the central table variation of groundwater depression, groundwater table variation of three confined aquifers, hydraulic head declines of three confined aquifers and the time-dependent total hydraulic head variation. We find a spatial consistency between land subsidence and groundwater depression or hydraulic head declines of three confined aquifers, and subsidence displacement and total hydraulic heads both manifest clear seasonal variability. This suggests that the subsidence is primarily caused by groundwater extraction for agricultural use. We also observe that the subsidence rates in Hengshui did not decrease but rather increased when the groundwater table significantly rose after September 2019. It is very likely that as a result of the occurrence of thick and widespread continuity of clay layers with high compressibility in the Quaternary deposit of Hengshui, a new preconsolidation head could be generated due to groundwater table drop, leading to the effective hydraulic head still existing in the aquitards even if the groundwater table rises in the aquifer systems.

1. Introduction

Hengshui, located in the Middle East of North China Plain (Figure 1), is a high-yield agricultural area where there are three rivers, the Hutuo River, Fuyang River and Zhangwei River (including secondary rivers Suolu River and Qingliang River). The Hutuo River gathers runoff production over the northern portion of the area and flows eastwards, whereas the Fuyang River and Zhangwei River flow northeastward [1,2]. Consequently, the subsurface of Hengshui frequently contains thick, compressible bedded clay, and these bedded clay layers are particularly vulnerable to subsidence caused by natural compaction or anthropogenic activities, which could provide the geological condition for the development of a large-scale land subsidence zone [3,4,5].
Like many other plains around the world, Hengshui is undergoing severe subsidence. Groundwater overextraction as a result of drought and water resource shortage [6] is the primary driver, resulting in not only the formation of large-scale groundwater depression cones, which could disrupt the normal periodic groundwater balance held in the subsurface, but also land subsidence zones which have been caused due to the rearrangement of soil grains or soil skeleton destruction in aquifer systems [1,5,7]. Large amounts of data from literature illustrate that about 89% of the total water consumption in Hengshui depends upon groundwater drafting due to low and nonuniform precipitation and insufficient reserves of rivers to agricultural irrigation [1,8]. Water consumption for industrial and drinking purposes accounts for about 20% of the total amount of groundwater exploitation, whereas agricultural irrigation occupies about 80%, which is mainly affected by climate variation and crop types [9]. In the decades since the area was drained for irrigating agriculture and its population, starting around the 1970s, the water tables in confined aquifers had fallen from 1.9 m in 1958 to 86.55 m in 2021, and subsidence had lowered the land elevation up to 1.4 m by 2009 [1,5,9,10]. After 2010, the water tables in confined aquifers of Hengshui have still decreased and subsidence continues to develop, and even has become more severe. But spatial distribution characteristics of land subsidence and spatiotemporal regression models of groundwater drawdown and subsidence are not well understood [11,12], and there is a need for time-series of observations, preferably for a long period [13,14], to achieve an accurate assessment of the causes and potential impacts of land subsidence [12] and, hence, predict the consequences [1,9,15,16].
Studies have shown that land subsidence monitoring operations include precision leveling survey, Global Positioning System (GPS) and spaceborne Synthetic Aperture Radar Interferometry (InSAR) technique. Precision levelling measurement takes several months to acquire a set of monitoring data with a high cost. GPS measurement is cheap and exhibits a high observing point density, whereas its vertical deformation measurement precision is low [17,18,19,20]. The distinctive advantages of InSAR include being all-weather, large-scale, high-precision, low-cost, high-point density, and time-effective. The InSAR technique is being used more economically and with great time savings in recent years to map subsidence with large spatial coverage and high temporal–spatial resolution [21,22,23], compared with in situ mapping of subsidence (leveling or global positioning system). Moreover advanced time-series InSAR techniques, efficiently reducing the impact of decorrelation and averaging random atmospheric noise over time, is suitable for a changing environment such as agricultural fields [24,25,26,27]. By utilizing RADARSAT-2 C-band (5.6 cm wavelength) data with wide or extra-fine mode acquired during 2012–2022, an engineering application by Ge et al. [25,28] has been implemented successfully to monitor the annual subsidence of the Beijing–Tianjin–Hebei Plain in China based on the combination of Permanent Scatterer InSAR (PSInSAR) [29] and Small Baseline Subset (SBAS) [24].
For our study, we used data from the MacDonald Dettwiler and Associates Ltd. (MDA) RADARSAT-2 satellite with a wide or extra-fine mode to provide land deformation maps of Hengshui using space-borne differential interferometric synthetic aperture radar [17,18,30,31] and, accordingly, mapped groundwater table or hydraulic head declines maps of the aquifer systems by pumping wells, which can be derived from China’s Geological Environment Monitoring Institute. In this respect, we attempted to estimate their spatially correlated characteristics between land subsidence and groundwater tables of different depths, land subsidence and hydraulic head variation of different depths, and subsidence displacement time series and total hydraulic head fluctuation [32]. On the one hand, combined with Quaternary stratum, our study comes down to improving our understanding of land subsidence and its future evolution by discussing subsidence characteristics and mechanisms.

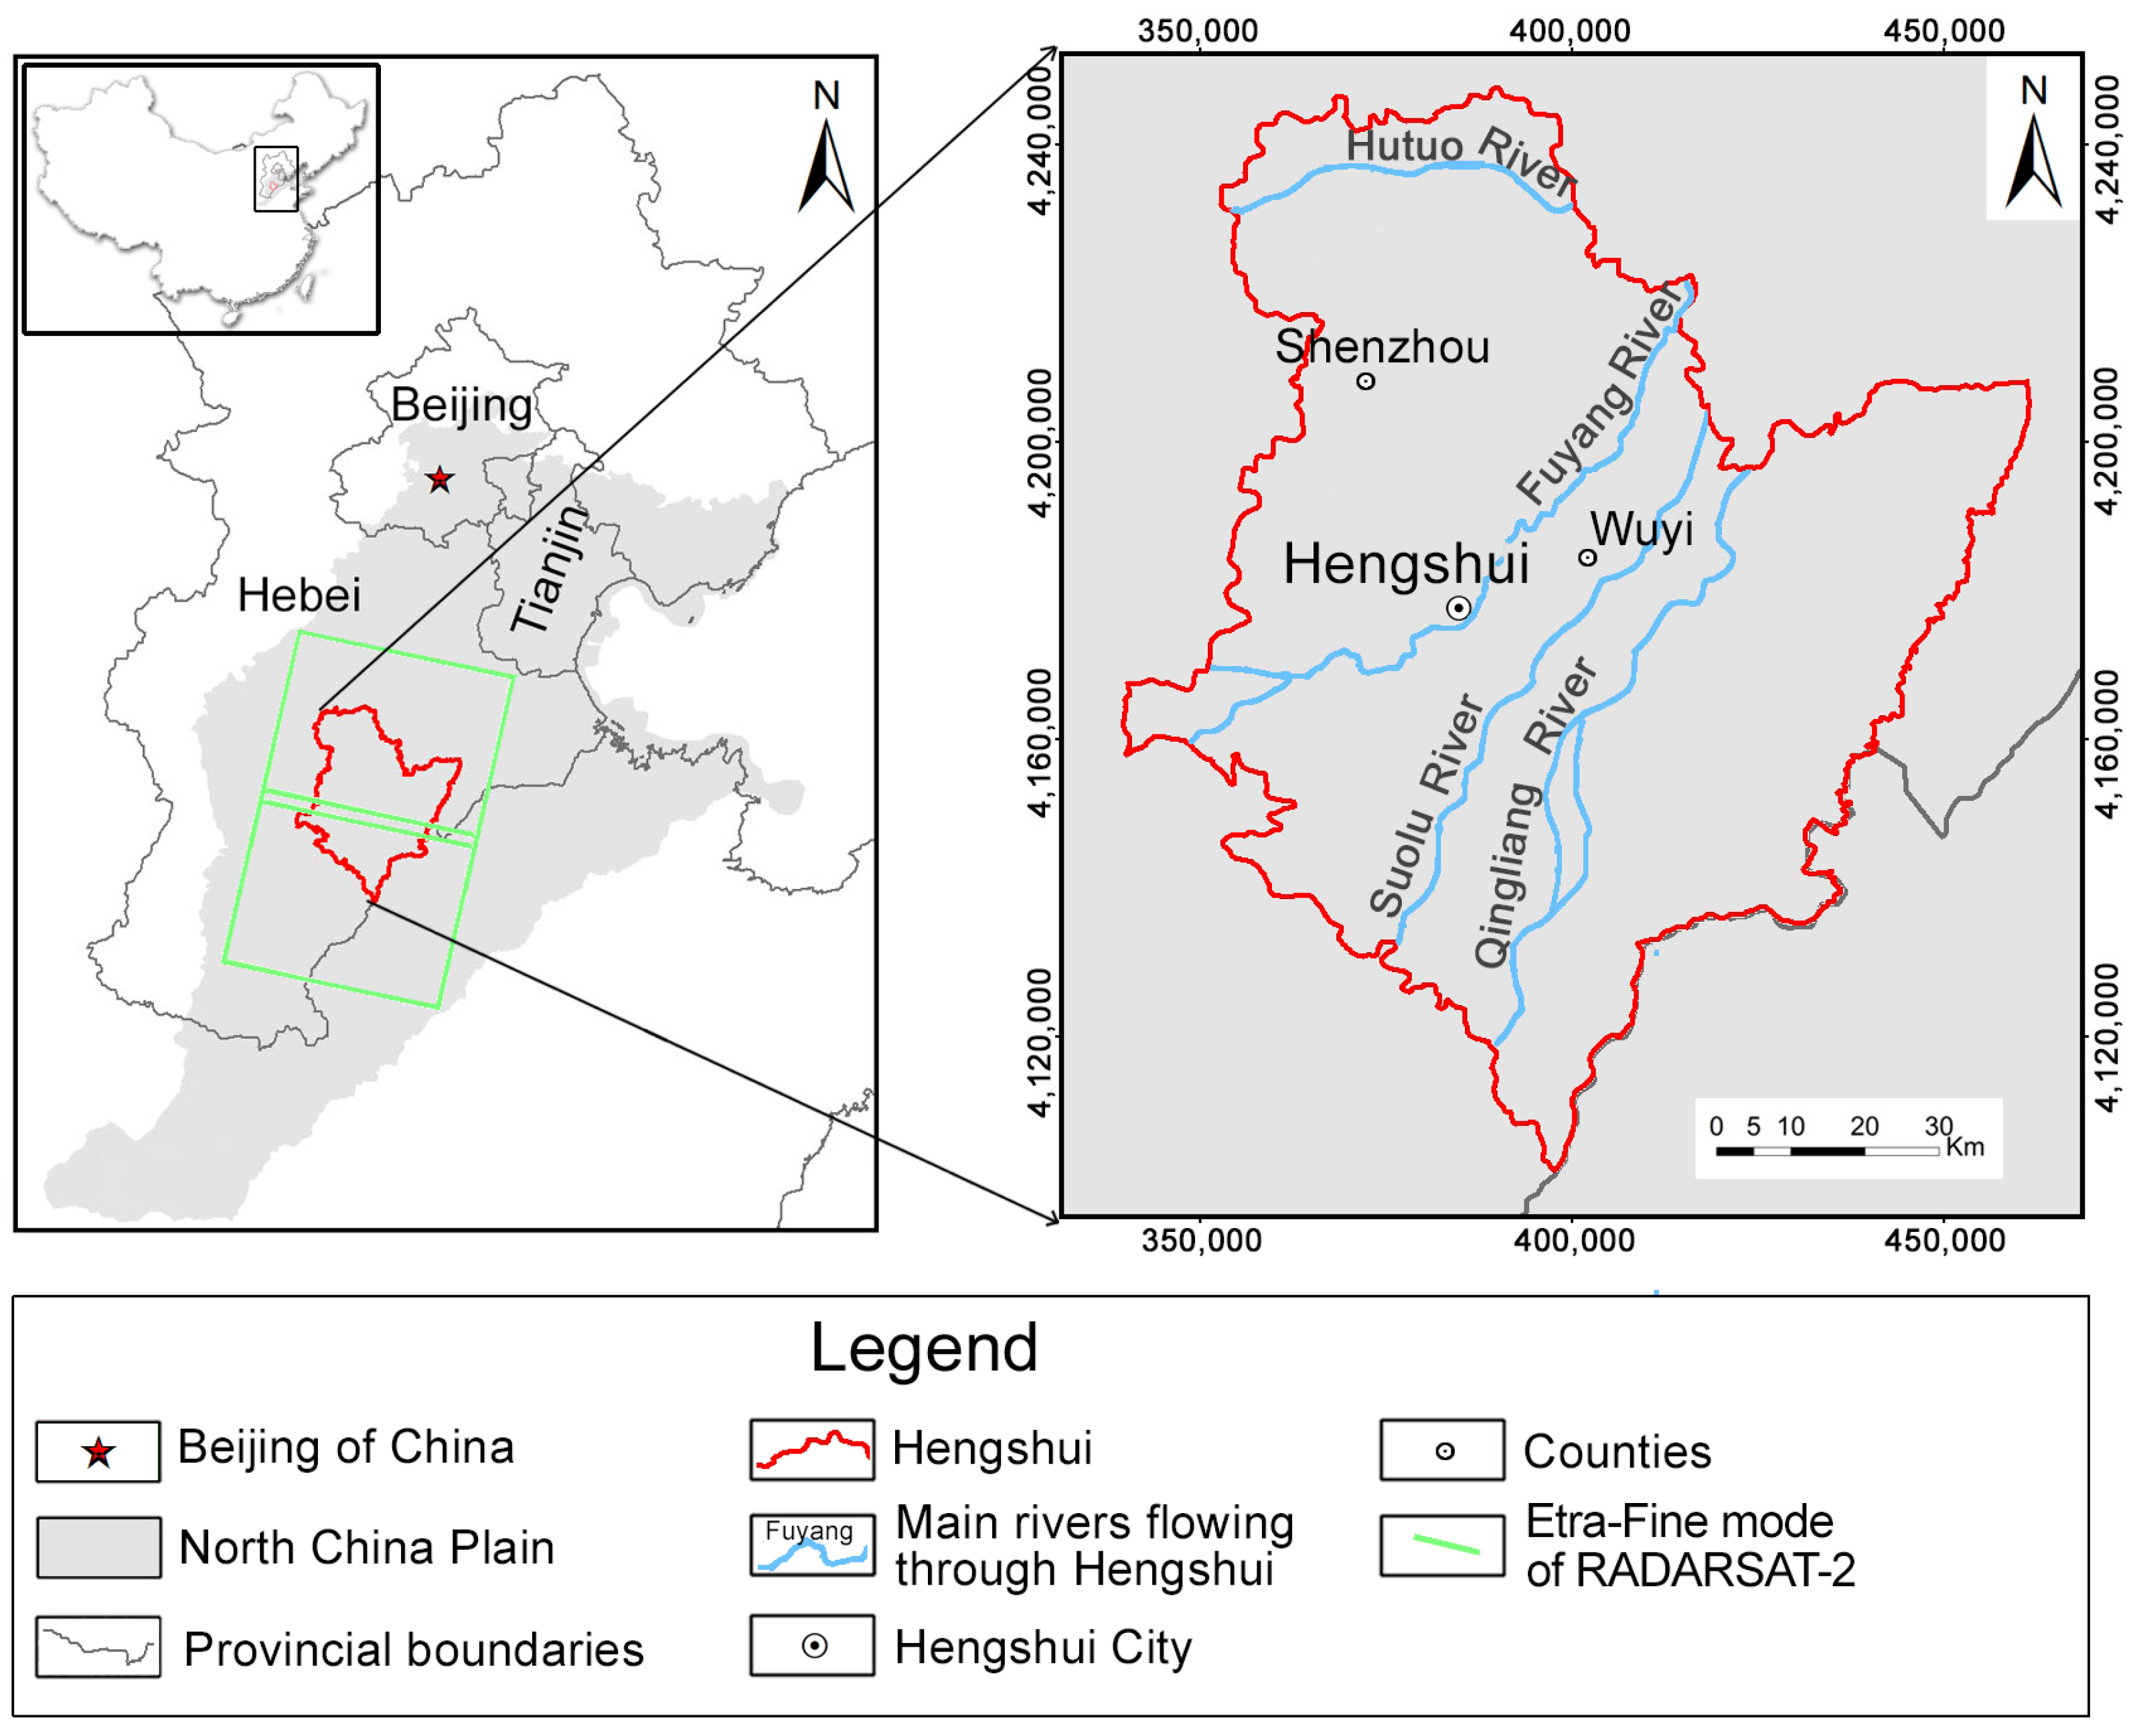
2. Geological Settings and Data Acquisition

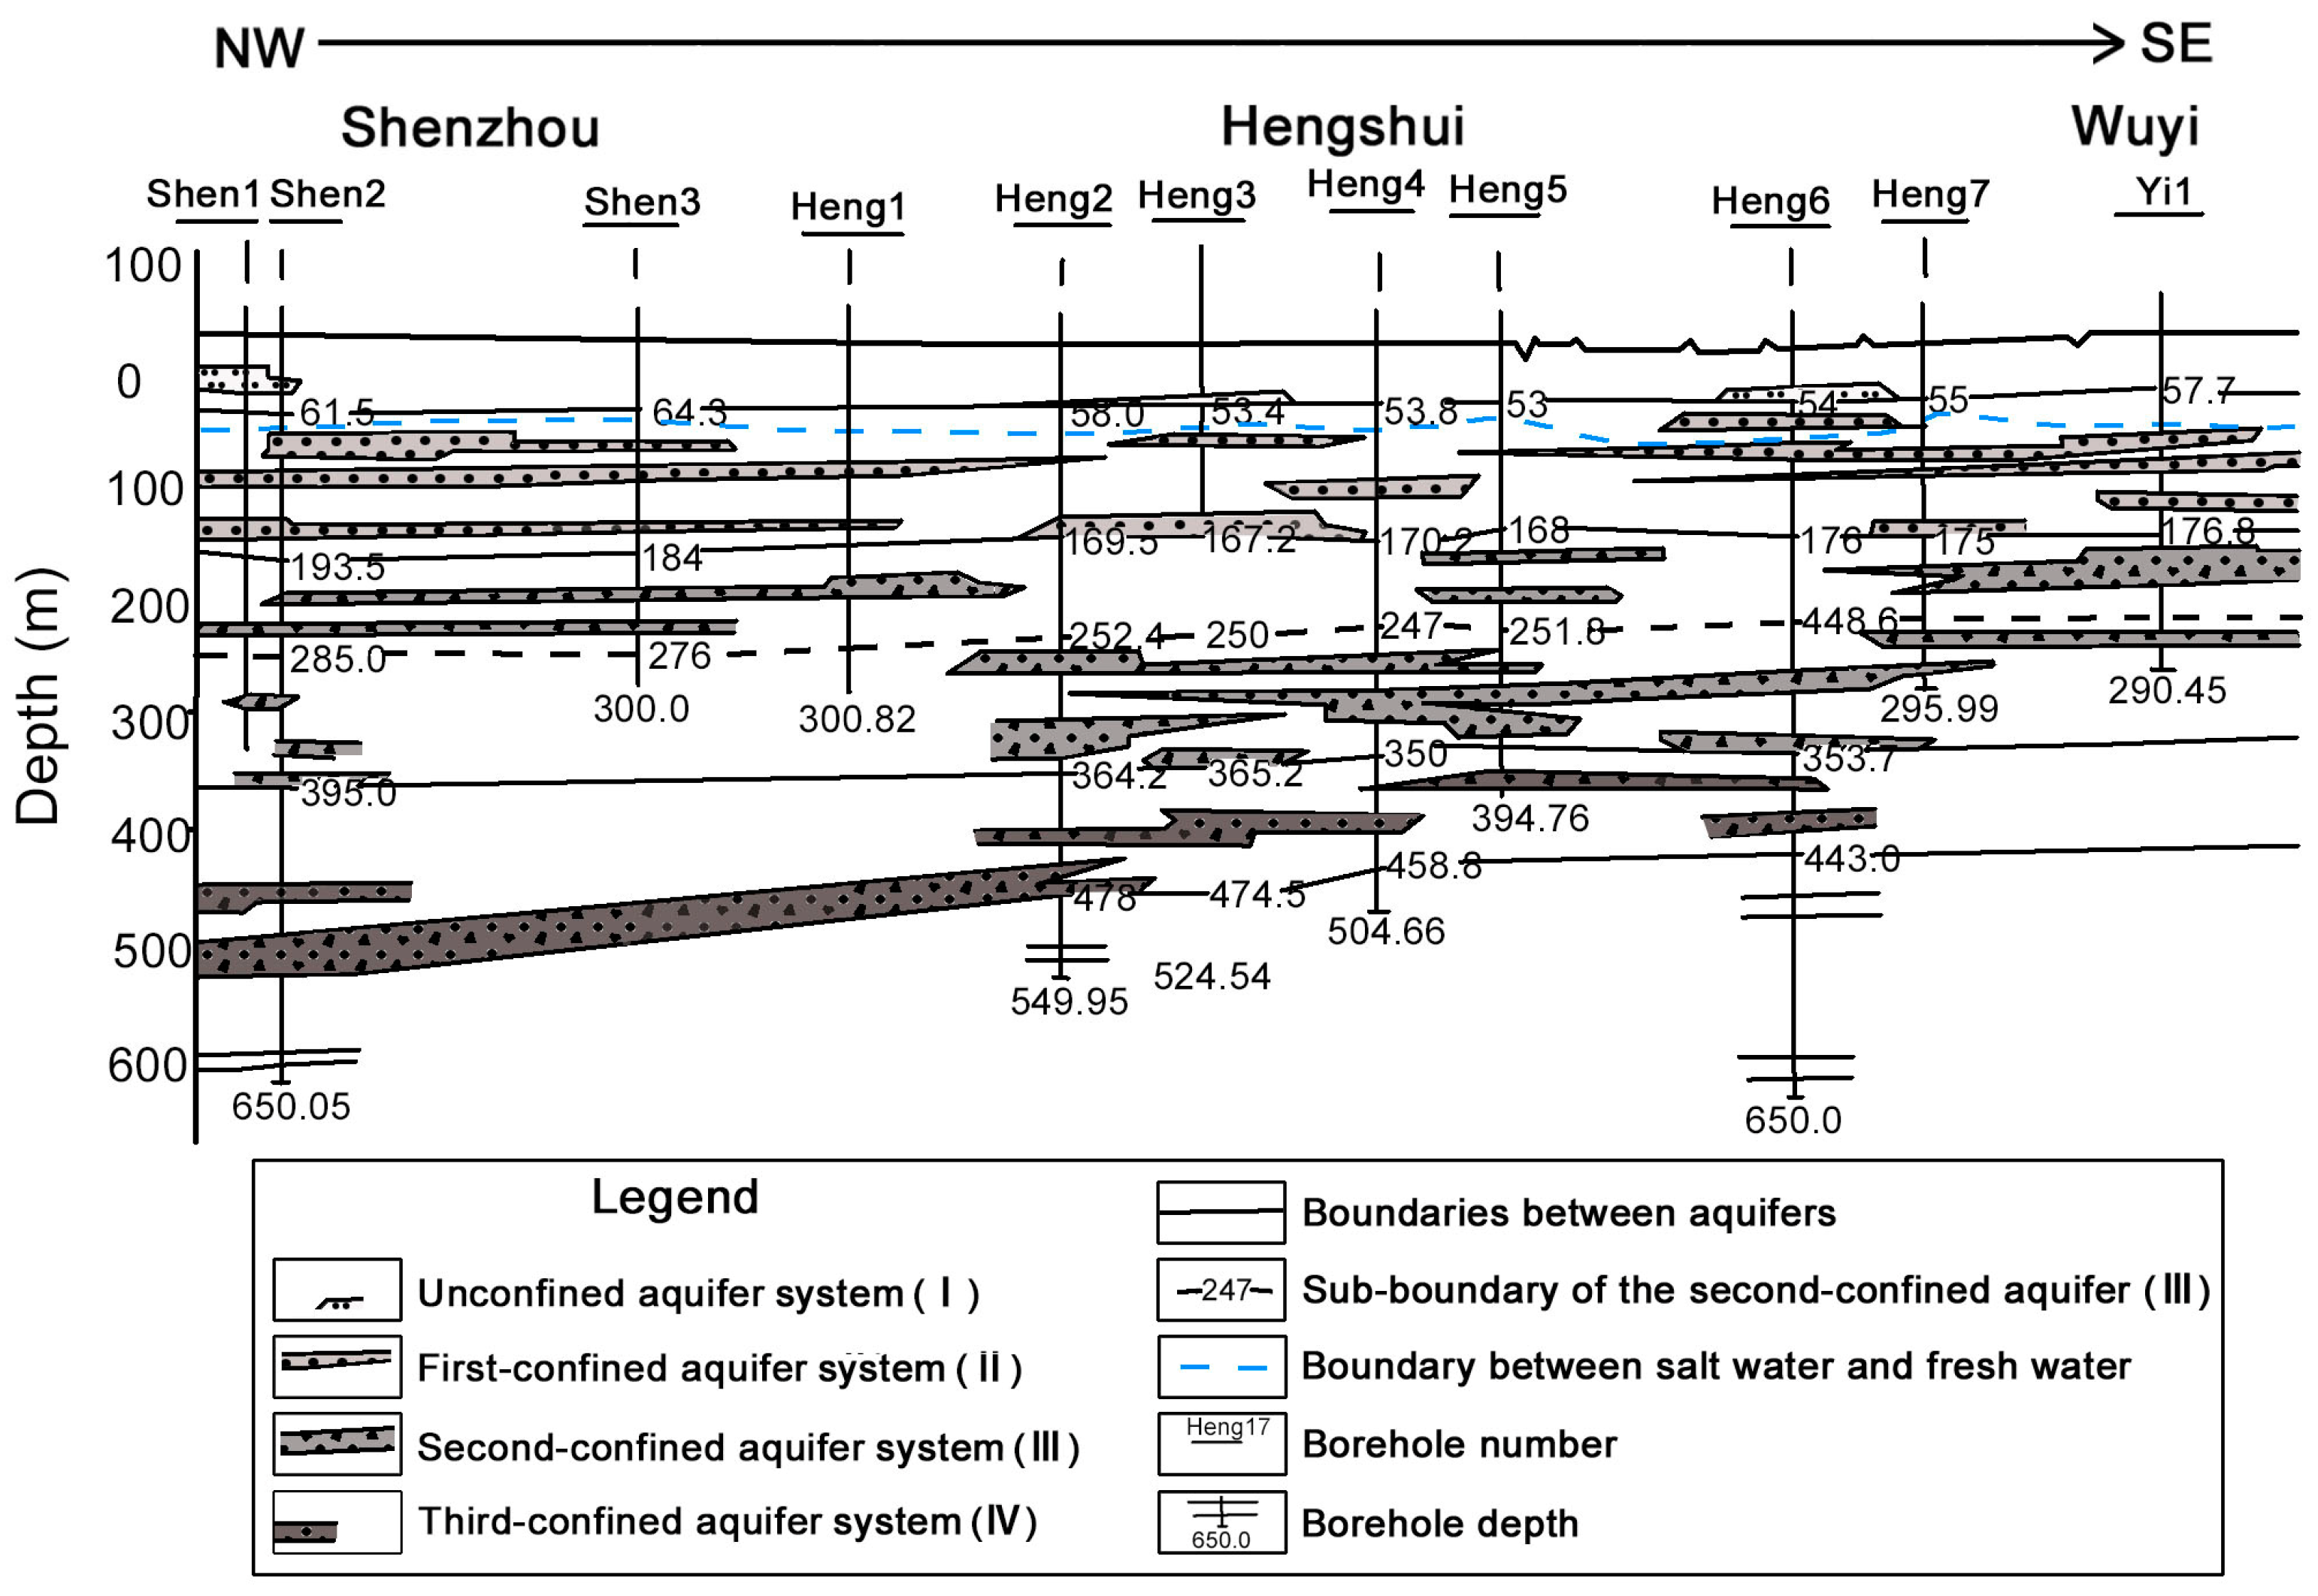
2.1. Quaternary Stratum and Aquifers

Geologically, Hengshui forms a part of the North China Plain and is underlain by Quaternary sediments of alluvial–proluvial origin consisting of a succession of silty clay, clay, silt–sand, silt–soil and medium sand, whose thickness averages 350~550 m (which increases to 600 m at places) [33], which can be partitioned into four different aquifer systems, including one layer-unconfined aquifer system (I) and three layer-confined aquifer systems (II, III and IV) as outlined in Figure 2 [1,8,9]. The total thickness of the unconfined aquifer system (I) overlaid with the confined aquifer systems generally becomes thicker southeastward and goes up to 40~50 m at places [6,34]. In the Hutuo River Alluvial Proluvial Subarea, the II confined aquifer and its above-unconfined aquifer system (I) are separated by thin and intermittent clay units, leading to their good hydraulic connection. However, in the Fuyang River Alluvial Proluvial Subarea and the Zhangwei River Alluvial Proluvial Subarea (further including Suolu River and Qingliang River), a remarkable lithological characteristic is the occurrence of thick and widespread continuity of clay layers with high compressibility between I and II aquifers, as well as between II and III aquifer systems, which provide sedimentation environment for a long-lasting and irreversible process of subsidence development after over-pumping of groundwater. Meanwhile, the presence of silt–soil, silt–sand, and medium-sand layers with high permeability in II and III confined aquifer systems, as principal water-bearing horizons, could individually provide a groundwater discharge of 6~12 m3/h·m and 10~20 m3/h·m based on single-well tests. The III confined aquifer is a mega-thick aquifer system with a bottom depth of 250~350 m, with a trend of low permeability/conductivity (fine-sand sediments) in the middle and high permeability/conductivity (coarse-grained sediments) on both sides, which could be further divided into two subconfined aquifer systems (III1, III2). Lithology logs and the hydrogeology profile map [5,6,9] clearly show that the I unconfined aquifer and II and III confined aquifer systems are primarily groundwater exploitation horizons in Hengshui, while the IV confined aquifer, as a water-bearing horizon with a buried depth of 450~600 m, has been underexploited or not yet exploited.

2.2. Groundwater Tables

Monthly groundwater level measurement data from groundwater piezometers were retrieved from China Geological Environment Monitoring Institute, whose data monitoring procedure records the maximum and minimum values of groundwater level within one month. The data sets span the common period of 2018 to 2020 with less than 1% of error data and aim at monitoring groundwater fluctuation at different aquifers. The maximum and minimum values of groundwater level within one month were averaged into monthly mean data. For consistency with land subsidence data, we selected 48 groundwater piezometers data from 27 monitoring wells for the unconfined and confined aquifers of Hengshui during the period from January 2018 to December 2020.
Of these 48 piezometers, 21 from 19 monitoring wells only reflect the groundwater table or its variation of the unconfined aquifer (I) (down to the depth of ~75.1 m) and 27 from 18 monitoring wells represent the groundwater table changes of three confined aquifer systems (69–330 m depth) [1,8] (II, III1 and III2) (Figure 2). It is notable that the groundwater table (maximum hydraulic head decline less than 5 m from 2018 to 2020) [10] in an unconfined aquifer, due to a low amount of groundwater exploitation and in-time recharge from rainfall or the external reservoir, is generally lifting or lowering less than 5 m/year [10], which basically does not contribute to the opportunity for surface subsiding; thus, we assume that the groundwater table declines in confined aquifers predominantly have led to subsidence. In addition, on account of 27 groundwater piezometers with different depths in three confined aquifers, we divided these groundwater data into three groups (69–197 m depth, 150–270 m depth and 248–330 m depth), corresponding to the II, III1 and III2 confined aquifer systems [1,8], respectively, with annual groundwater table characteristic depicted in each confined aquifer.

2.3. SAR Data Acquisitions

We used RADARSAT-2 Synthetic Aperture Radar (SAR) data acquired by MacDonald Dettwiler and Associates Ltd. (MDA), to estimate land subsidence temporal–spatial variations of Hengshui during the period from September 2011 to October 2022. During the period between 2012 and 2016, we collected wide mode images with a pixel spacing of 11.8 m in range direction and 5.1 m in azimuth direction, and from 2017 to 2022 we acquired extra-fine mode data with a corresponding pixel spacing of 2.66 m by 3.03 m. As a result of the two-mode images of RADARSAT-2 having an equivalent coverage swath (150 km of wide and 125 km of extra-fine mode) [17,18,34], we used two adjacent scenes along one descending orbit and it amounted to 26 RADARSAT-2 SAR images by an average of 13 acquisitions per scene each year, to completely cover Hengshui (Table 1). In addition, precise orbits from MDA for RADARSAT-2 data and 1 arc second (~30 m) DEM data from the United States Geological Survey were employed to calculate perpendicular baseline values of interferograms and topographic phase as the topographic reference during the process of retrieving the surface deformation [18]. In addition, these DEM data were also applied for geocoding the resultant InSAR products from Range-Doppler coordinates into map geometry corresponding to the Universal Transverse Mercator (UTM) coordinate system [18,35].

3. InSAR Method and Data Processing
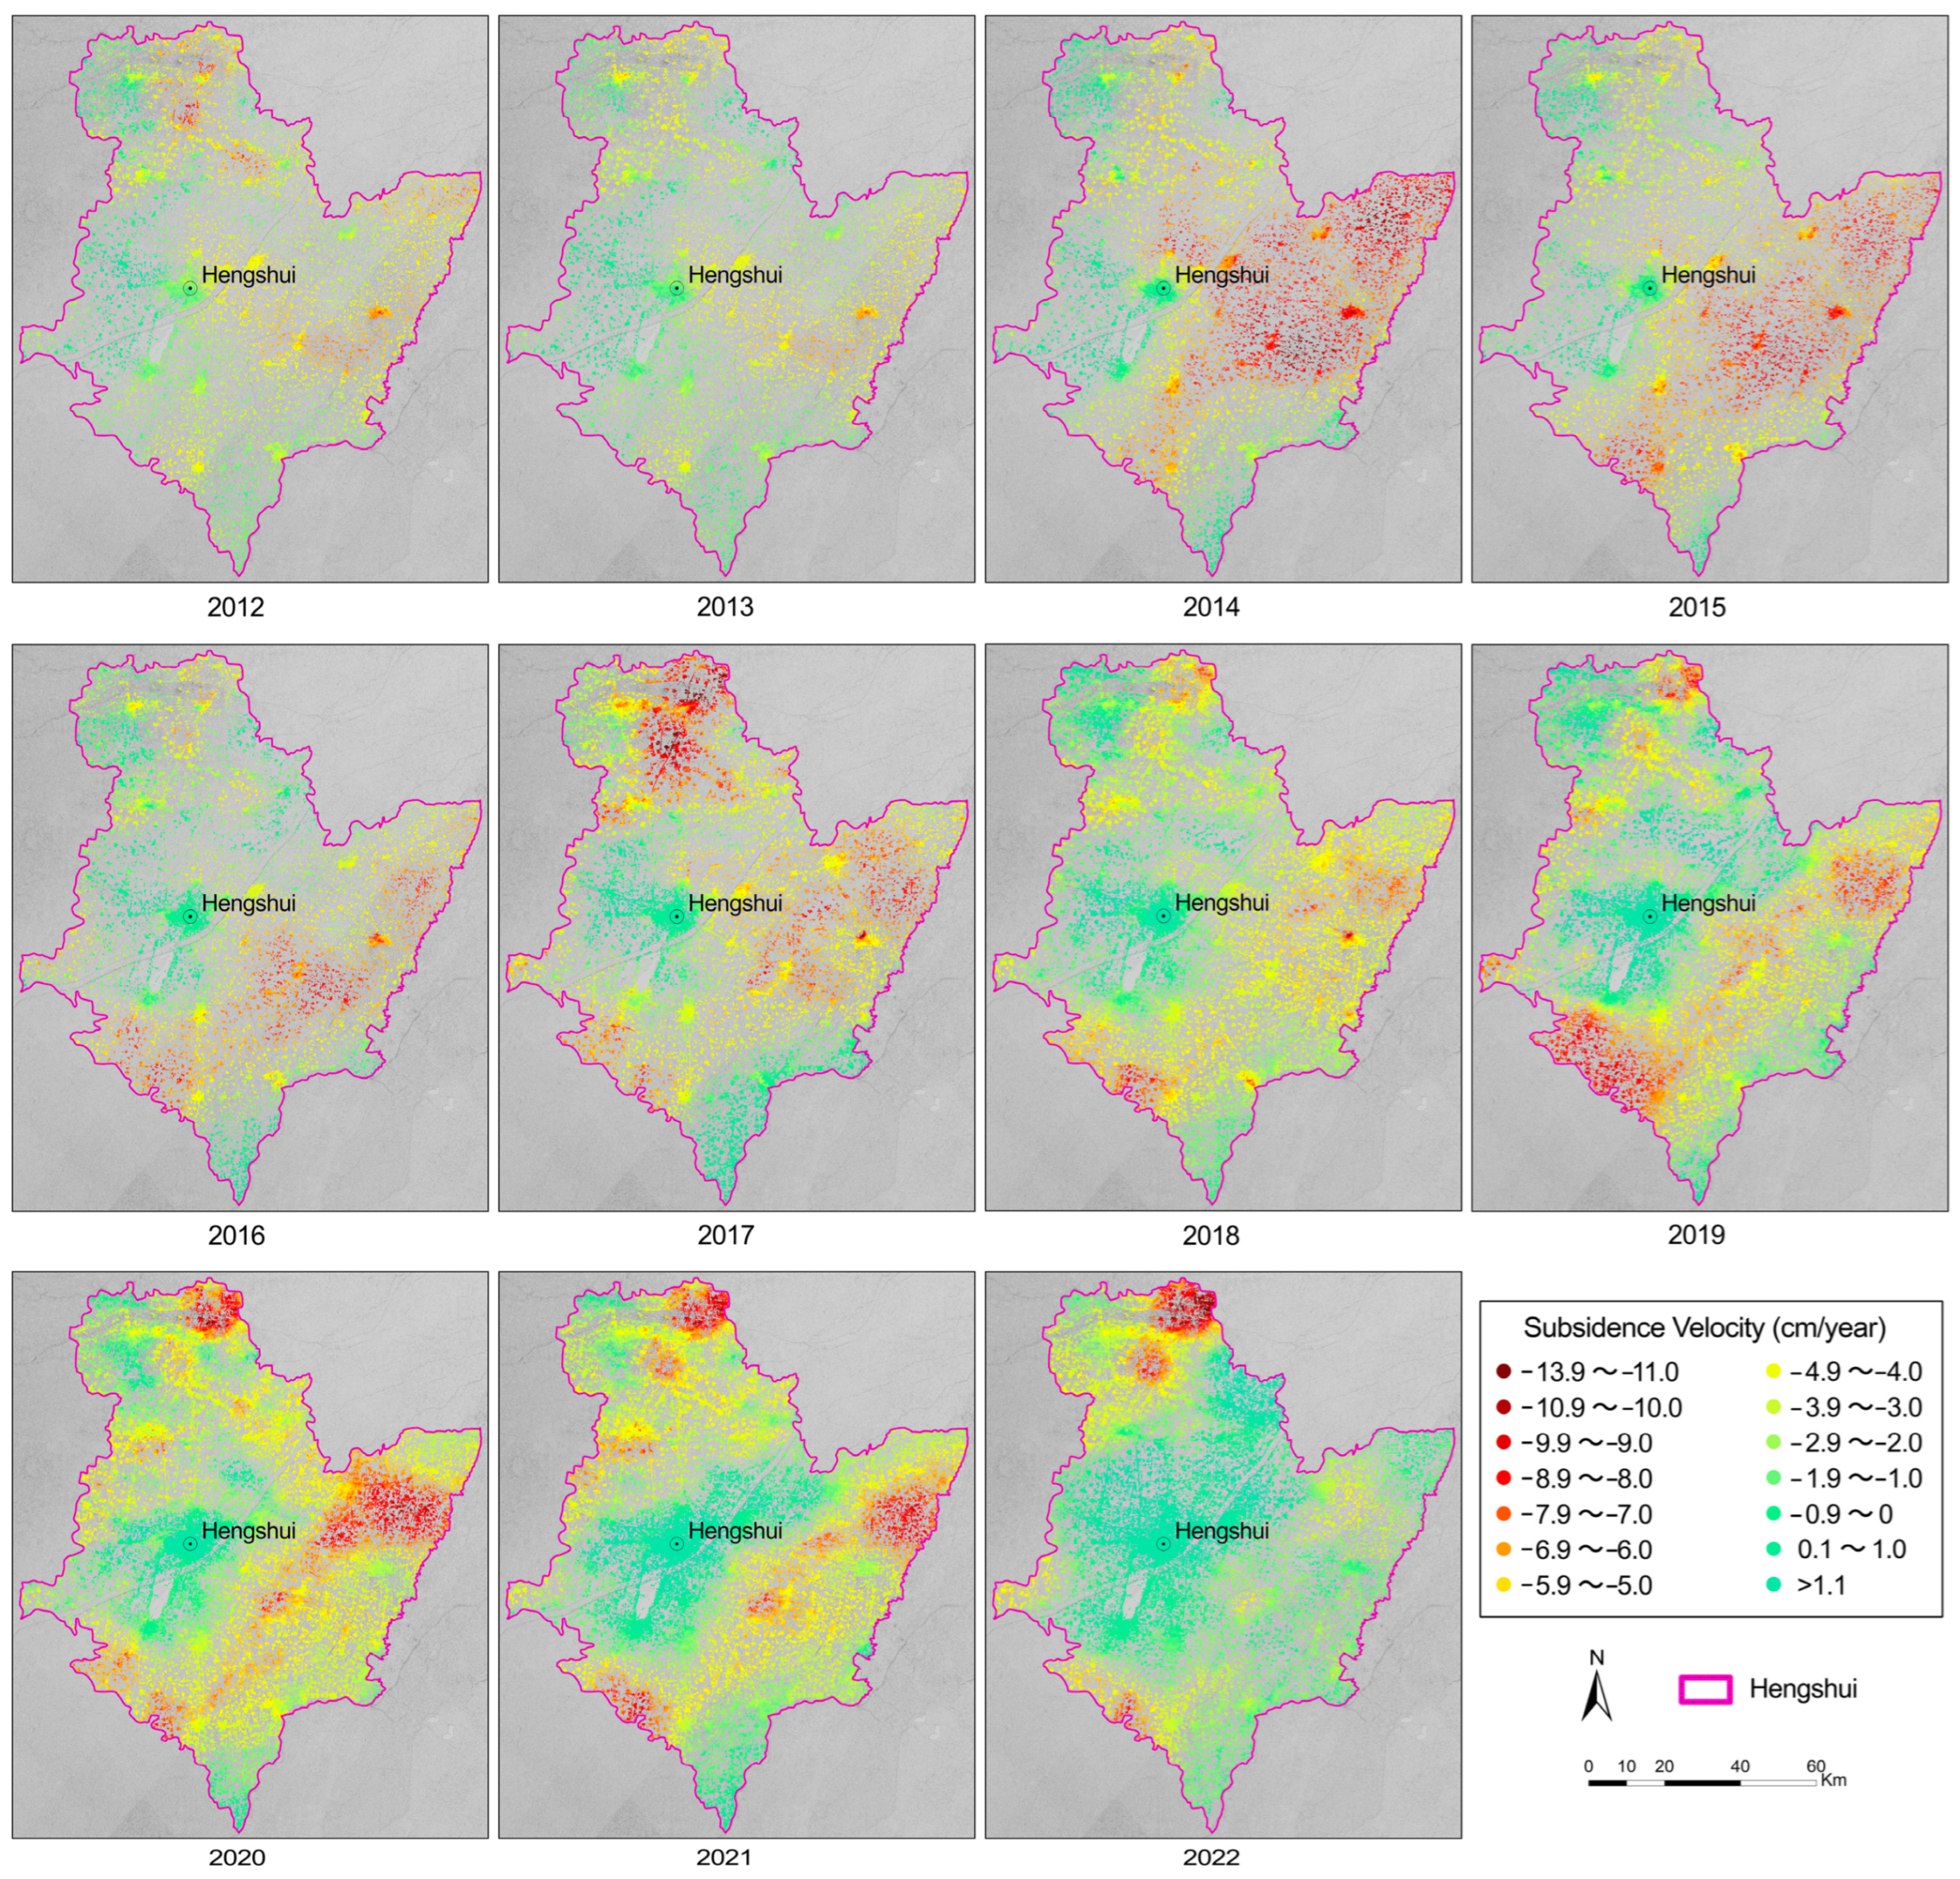
We used an annual average of 14 SAR images per scene and performed a differential InSAR (D-InSAR) survey of Hengshui by generating over 70 interferograms having spatial baseline smaller than 300 m and temporal baseline shorter than 360 days based on Gamma software of Switzerland Gamma Remote Sensing. By limiting these baselines, those interferograms with low coherence or incoherence were rejected and these selected interferograms were considered as the most accurate to reflect the annual subsidence rate of the study domain. After removing the topographic phase contribution based on external DEM from the selected interferograms, as well as to prevent a low correlation in suburbs or large-scale farmland, the InSAR linear time-series analysis based on high Coherence Targets (CTs) (corresponding to stable natural or manmade reflectors [29] or distributed phase-stable targets [36]) was carried out to obtain linear deformation rates, height corrections, atmospheric delay, nonlinear deformation and noise for each CT.
As a result of only available descending SAR acquisitions, vertical and horizontal components of the deformation could not be retrieved independently [19,37]. However, long-term groundwater overpumping in Hengshui indicated that ground displacement was occurring principally vertically [1,5,6,8,9]. Thus, under the condition of assuming the horizontal displacement is negligible, the linear deformation rates along a line of sight (LOS) of RADARSAT-2 satellite relative to the selected reference point coincident with no deformation, should be converted into vertical rates v v = v L O S / c o s θ ; where v v and v L O S are the vertical and LOS deformation rate, respectively, and θ is the satellite incidence angle. It should be noted that this assumption may be appropriate near the edges of the scenes owing to a slight change of the incidence angle along the range direction of scenes [19]. In order to elaborate a clear correlation between subsidence history and groundwater level, the vertical displacement temporal series from January 2018 to December 2020 were also computed relative to the same reference point as the above deformation rates for each CT. Finally, by comparing the vertical deformation of overlapping area of two adjacent scenes, we further corrected their whole deviation based on distance weighted method in order to accomplish land subsidence mapping of Hengshui in the simultaneous period [18,28], and made the annual vertical velocity maps of Hengshui in UTM WGS 84 coordinate system based on the coordinate transformation table between the external DEM and SAR coordinate system.
For the joint application of PSInSAR and SBAS method, the above processing steps, by removing atmospheric delay and noise, were elaborated to obtain high-precision linear deformation rate and displacement temporal series suitable for large-scale subsidence area that is characterized by low coherence point density, large subsidence rate and few SAR scenes. Previous studies have compared available ground control measurements with the obtained IPTA results [38,39], and we also conducted the same work in Xi’an and Beijing in China, where the accuracy of the averaged deformation rate acquired from the InSAR linear time-series analysis is lower than 5 mm [17,18]. However, the accuracy evaluation of the InSAR results is only statistically significant and depends on a number of scenes, baseline combinations, processing strategies, deformation characteristics, etc. [18,25].

4. Results

A map of annual averaged subsidence velocities of Hengshui during the period between 2012 and 2022 identifies two large-scale subsidence areas with maximum vertical rates of subsidence beyond 6 cm/year, individually located to the north of Hengshui city around the Hutuo River and to the east or south along the Fuyang, Suolu and Qingliang Rivers (Figure 3).
Around the Hutuo River, we observe the area with small subsidence of a subsidence rate of 3.0~7.5 cm/year (yellow to grass-green colors) and no subsidence bowl during the period from 2013 to 2016. In 2017, two subsidence bowls appeared. We observe that the area with subsidence rates >5.0 cm/year was at large scales of 1012 km2. Nevertheless, in 2018, the maximum subsidence rate and affected area of subsidence fell once again and then the annual subsidence has shown an increasing trend year by year and their maximum subsidence values generally exceed 8 cm/year (light red or red colors) (Table 2). Along both banks of the Hutuo River, average rates of subsidence of >5 cm/year are observed at large scales of 193, 201 and 241 km2 in 2020–2022, respectively, and their maximum vertical rates of subsidence observed are 11.8, 11.3 and 12.3 cm/year, respectively. In the southern part of the Hutuo River the smaller subsidence area with average rates of subsidence beyond 5 cm/year cover 32, 105, and 130 km2, respectively, during the period between 2020 and 2022 and their maximum vertical rates of subsidence are 8.9, 8.4 and 9.1 cm/year, respectively. We observe that the transition with subsidence rate of 4.0~5.0 cm/year (yellow color) between the two subsidence bowls occurs in a narrow zone (<2 km) in 2021 and 2022.
Compared with the Hutuo River basin, there has been a wider range of land subsidence in the east and south of Hengshui along the Fuyang, Suolu and Qingliang Rivers. In 2012 and 2013, the maximum vertical rates of subsidence observed are 8.1 and 7.7 cm/year, respectively, and average rates of subsidence of >5.0 cm/year are observed at large scales of 589.7 and 339.8 km2, respectively. From 2014 to 2021, the scope of the subsiding area and its maximum subsidence rates increased gradually, and we also observe in the location that there are normally two or three subsidence bowls. Meanwhile, we also observe that the maximum vertical rates of subsidence are over 10 cm/year (Table 2) and the annual scale with average rates of subsidence of >8.0 cm/year changed significantly, from 1 to 971 km2 in the location (Table 2). Until 2022, only to the southwest of Hengshui City along the Suolu River, the subsiding bowl still existed with a maximum subsidence rate of 9.5 cm/year; however, in the other area, the subsidence rates widely fell below 5.0 cm/year (Figure 3).

5. Discussions

In Hengshui, subsidence takes place at average rates of >5 cm/year over large scales (orange to dark red colors), and groundwater extraction for agricultural irrigation is the main cause of the rapid, large-scale subsidence according to field investigations and many studies in the literature [1,5,6,8,9]. Our investigation found that subsidence correlates with groundwater tables and we discuss the temporal variation characteristics of subsidence displacement with total hydraulic heads in confined aquifers to better understand the subsidence processes. It would require detailed information on the Quaternary sediment properties (thickness and permeability) and groundwater tables or hydraulic heads of confined aquifers, all of which are readily available from the relevant literature [1,8], Water Resources Bulletin of Hebei Province between 2012 and 2022 [40] and the National Groundwater Monitoring Project of China Geological Environment Monitoring Institute.
Monthly hydraulic head measurements during the period from January 2018 to December 2020 for the unconfined and confined aquifers of Hengshui are accessible from the China Geological Environment Monitoring Institute. The shallow (down to the depth of ~74.5 m) and deep (69–197 m depth, 150–270 m depth and 248–330 m depth) piezometers are used to monitor the unconfined and confined aquifers of Hengshui, respectively [1,8]. Therefore, the water table measured at a given piezometer represents the role of each aquifer unit so we considered the subsidence displacement at a given location responses to the integration of water table changes in all aquifer units. It is noteworthy that due to a low level of groundwater exploitation and external reservoir or precipitation in-time recharge, the water tables in the unconfined aquifers were generally lifting or lowering less than 5 m/year [10], which basically dose not contribute to the opportunity for surface subsiding. In this paper, we just present a review of the relationship between subsidence and water tables or hydraulic head variation in confined aquifers.

5.1. Relationship between Land Subsidence and Aquifer Properties

We find spatial dissimilarities between subsidence sites, as it reflects local geological and hydrological conditions. Under the surface of the Fuyang, Suolu and Qingliang basin, the first and second-confined aquifers (Ⅱ and Ⅲ) are mainly exploited, and there is a thick and continuous clay layer with a local thickness of up to 10 m, leading to no or weak hydraulic connections between the first- and second-confined aquifers [1,8]. Hence, groundwater recharge could be not in-time from seasonal rainfall or an adjacent aquifer. Its spatial extents with annual average rates of subsidence of >4 cm/year during the period between 2012 and 2021 are observed at large scales of greater than 1000 km2. In the Hutuo River basin, this location subsidence manifested a smaller spatial scale, with large scales of 50~250 km2 (average rates of subsidence >5.0 cm/year) except for 2017. This possibly correlated with hydraulic connections between aquifers. Between the unconfined (Ⅰ) and first-confined aquifer (Ⅱ), there is an unstable thin clay soil with good horizontal recharge conditions and good hydraulic connections, and the second-confined aquifer (Ⅲ) is discontinuous and has weak groundwater bearing with a good local hydraulic connection with the first-confined aquifer [1,8]. Even if there is a continuous and thick clay layer, its spatial extent is smaller than subsidence in the Fuyang, Suolu and Qingliang basin because of prompt groundwater recharge.

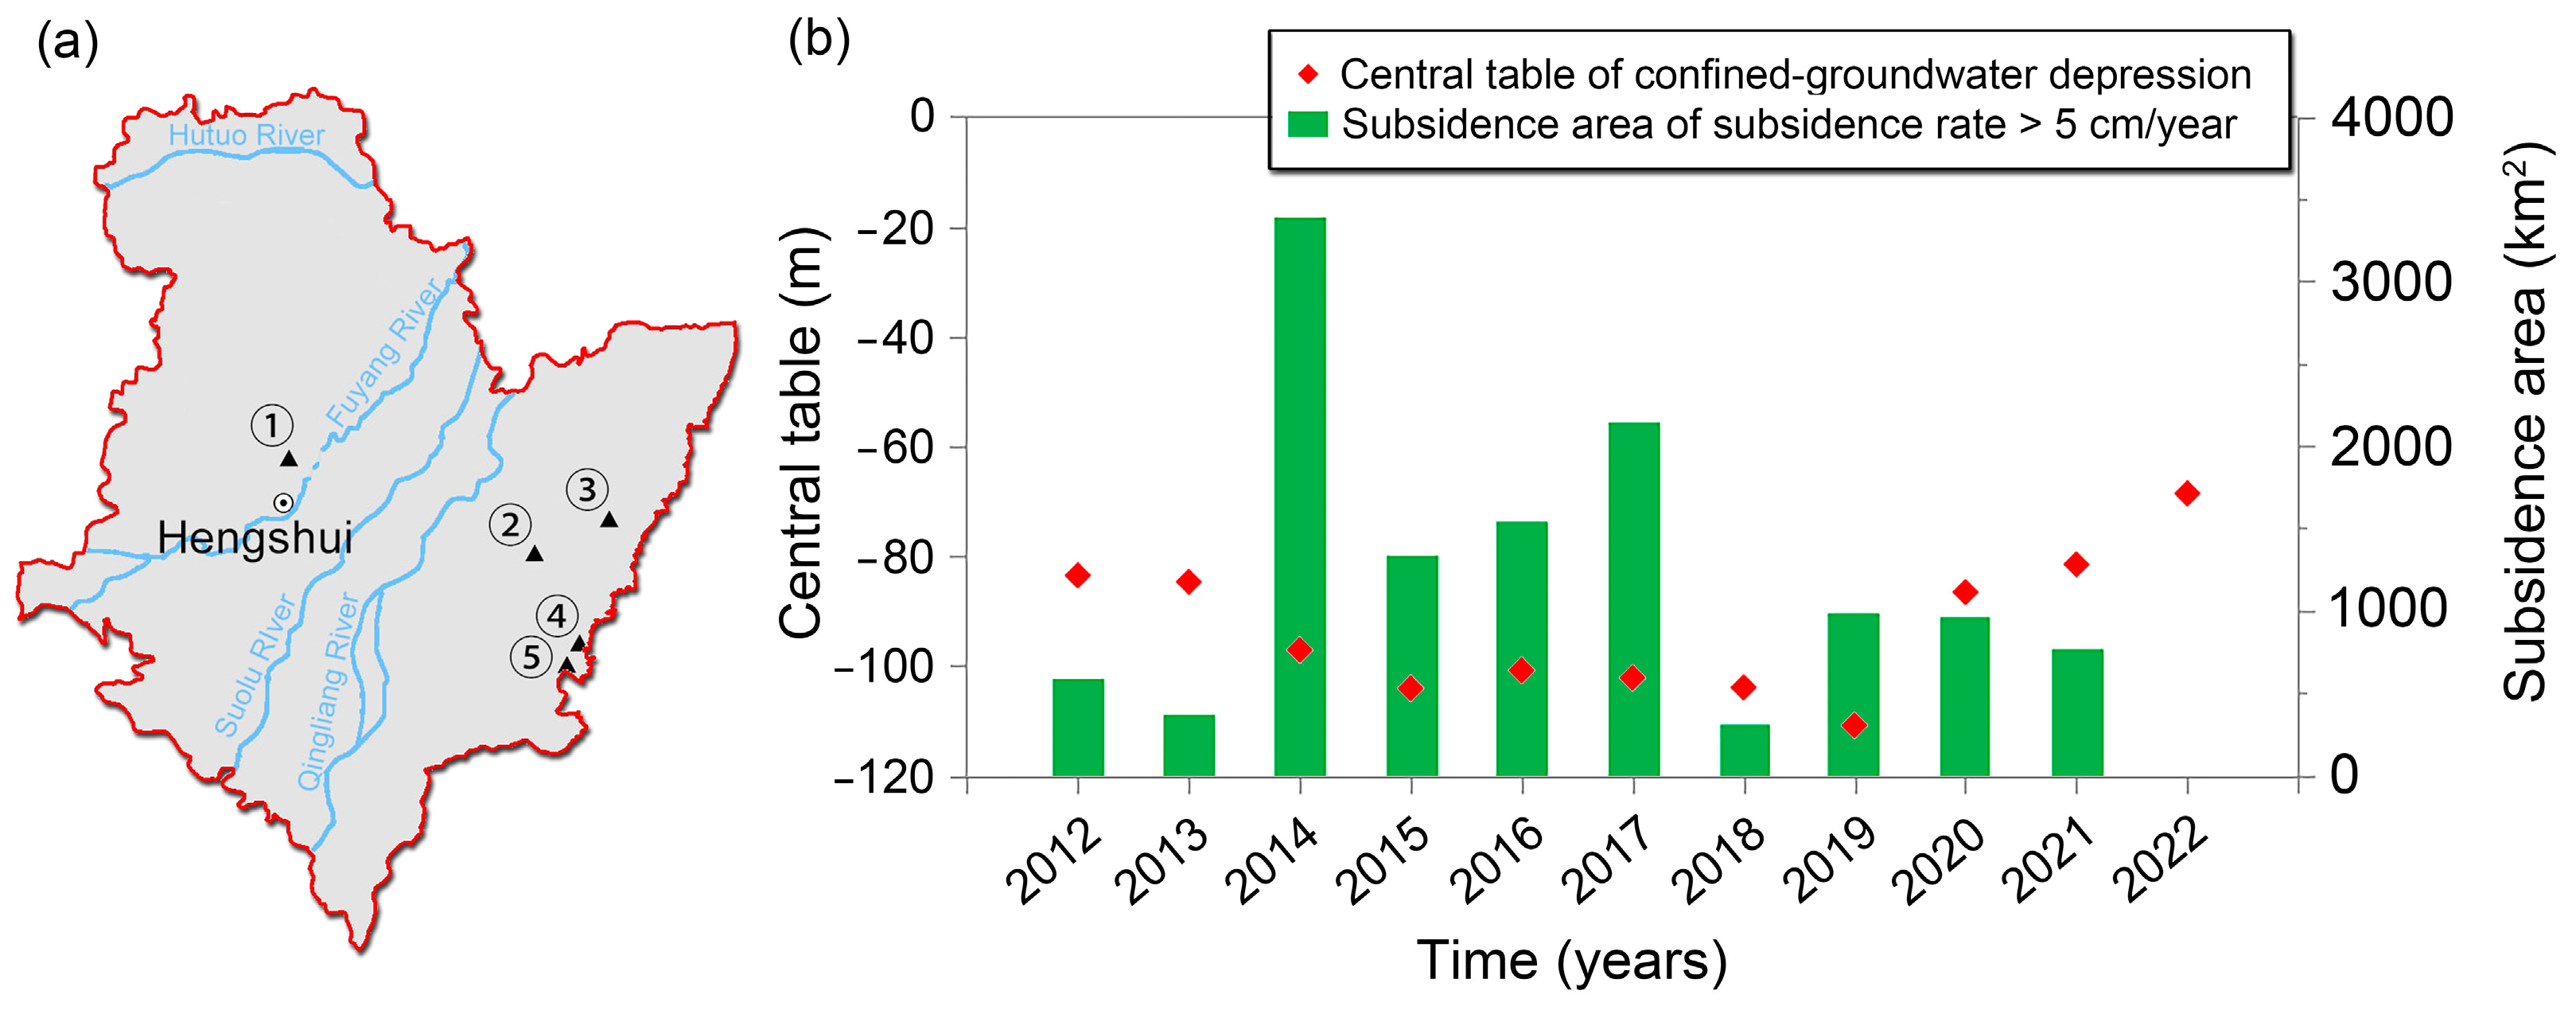
5.2. Relationship between Land Subsidence and Central Table of Groundwater Depression

The central table refers to the lowest water table in the groundwater depression cone. The location of the lowest water table changes due to differences in groundwater extraction rates every year. In 2012 and 2013, the confined groundwater depression center was located to the north of Hengshui City (① in Figure 4a), and from 2014 to 2021, the location shifted to the southeast, illustrated in ②, ③, ④ and ⑤ of Figure 4a [40], whereas these central tables were constantly located at the subsurface of the subsidence bowl along the Fuyang, Suolu and Qingliang Rivers. These observations suggest that groundwater extraction for agricultural use was possibly more intense than other use after 2014 and local farmers extracted groundwater resulting in the subsidence bowl along the Fuyang, Suolu and Qingliang Rivers.
Comparing central tables with the subsidence area (Figure 4b), we note that there were two significant water table drops in the center of the confined groundwater depression in 2014 and 2019, respectively. Accordingly, the subsidence areas with rates >5 cm/year sharply increased from 375 km2 in 2013 to 3395 km2 in 2014 and from 319 km2 in 2018 to 990 km2 in 2019. Moreover, when the central table is basically stable or significantly rising, subsidence still needs to continue for some time before it begins to decrease. During the period between 2014 and 2018, the central table took on slight fluctuations, the subsidence area (rates of >5 cm/year) ranged from 3395 to 1338 km2 and decreased to 319 km2 in 2018. During the period between 2019 and 2022, the central table was rose significantly, the subsidence area (rate of >5 cm/year) ranged from 990 to 777 km2 and even decreased to 0 in 2022. A possible explanation for this is that a new preconsolidation head was generated [41,42] when the groundwater table dropped to 110.8 m in 2019. In the aquitard, the pore water pressure gradually transforms into effective stress and the clay layer gradually consolidates, both of which are functions of time [43,44,45]. The larger the groundwater table drop, the longer the consolidation time of the clay soil.

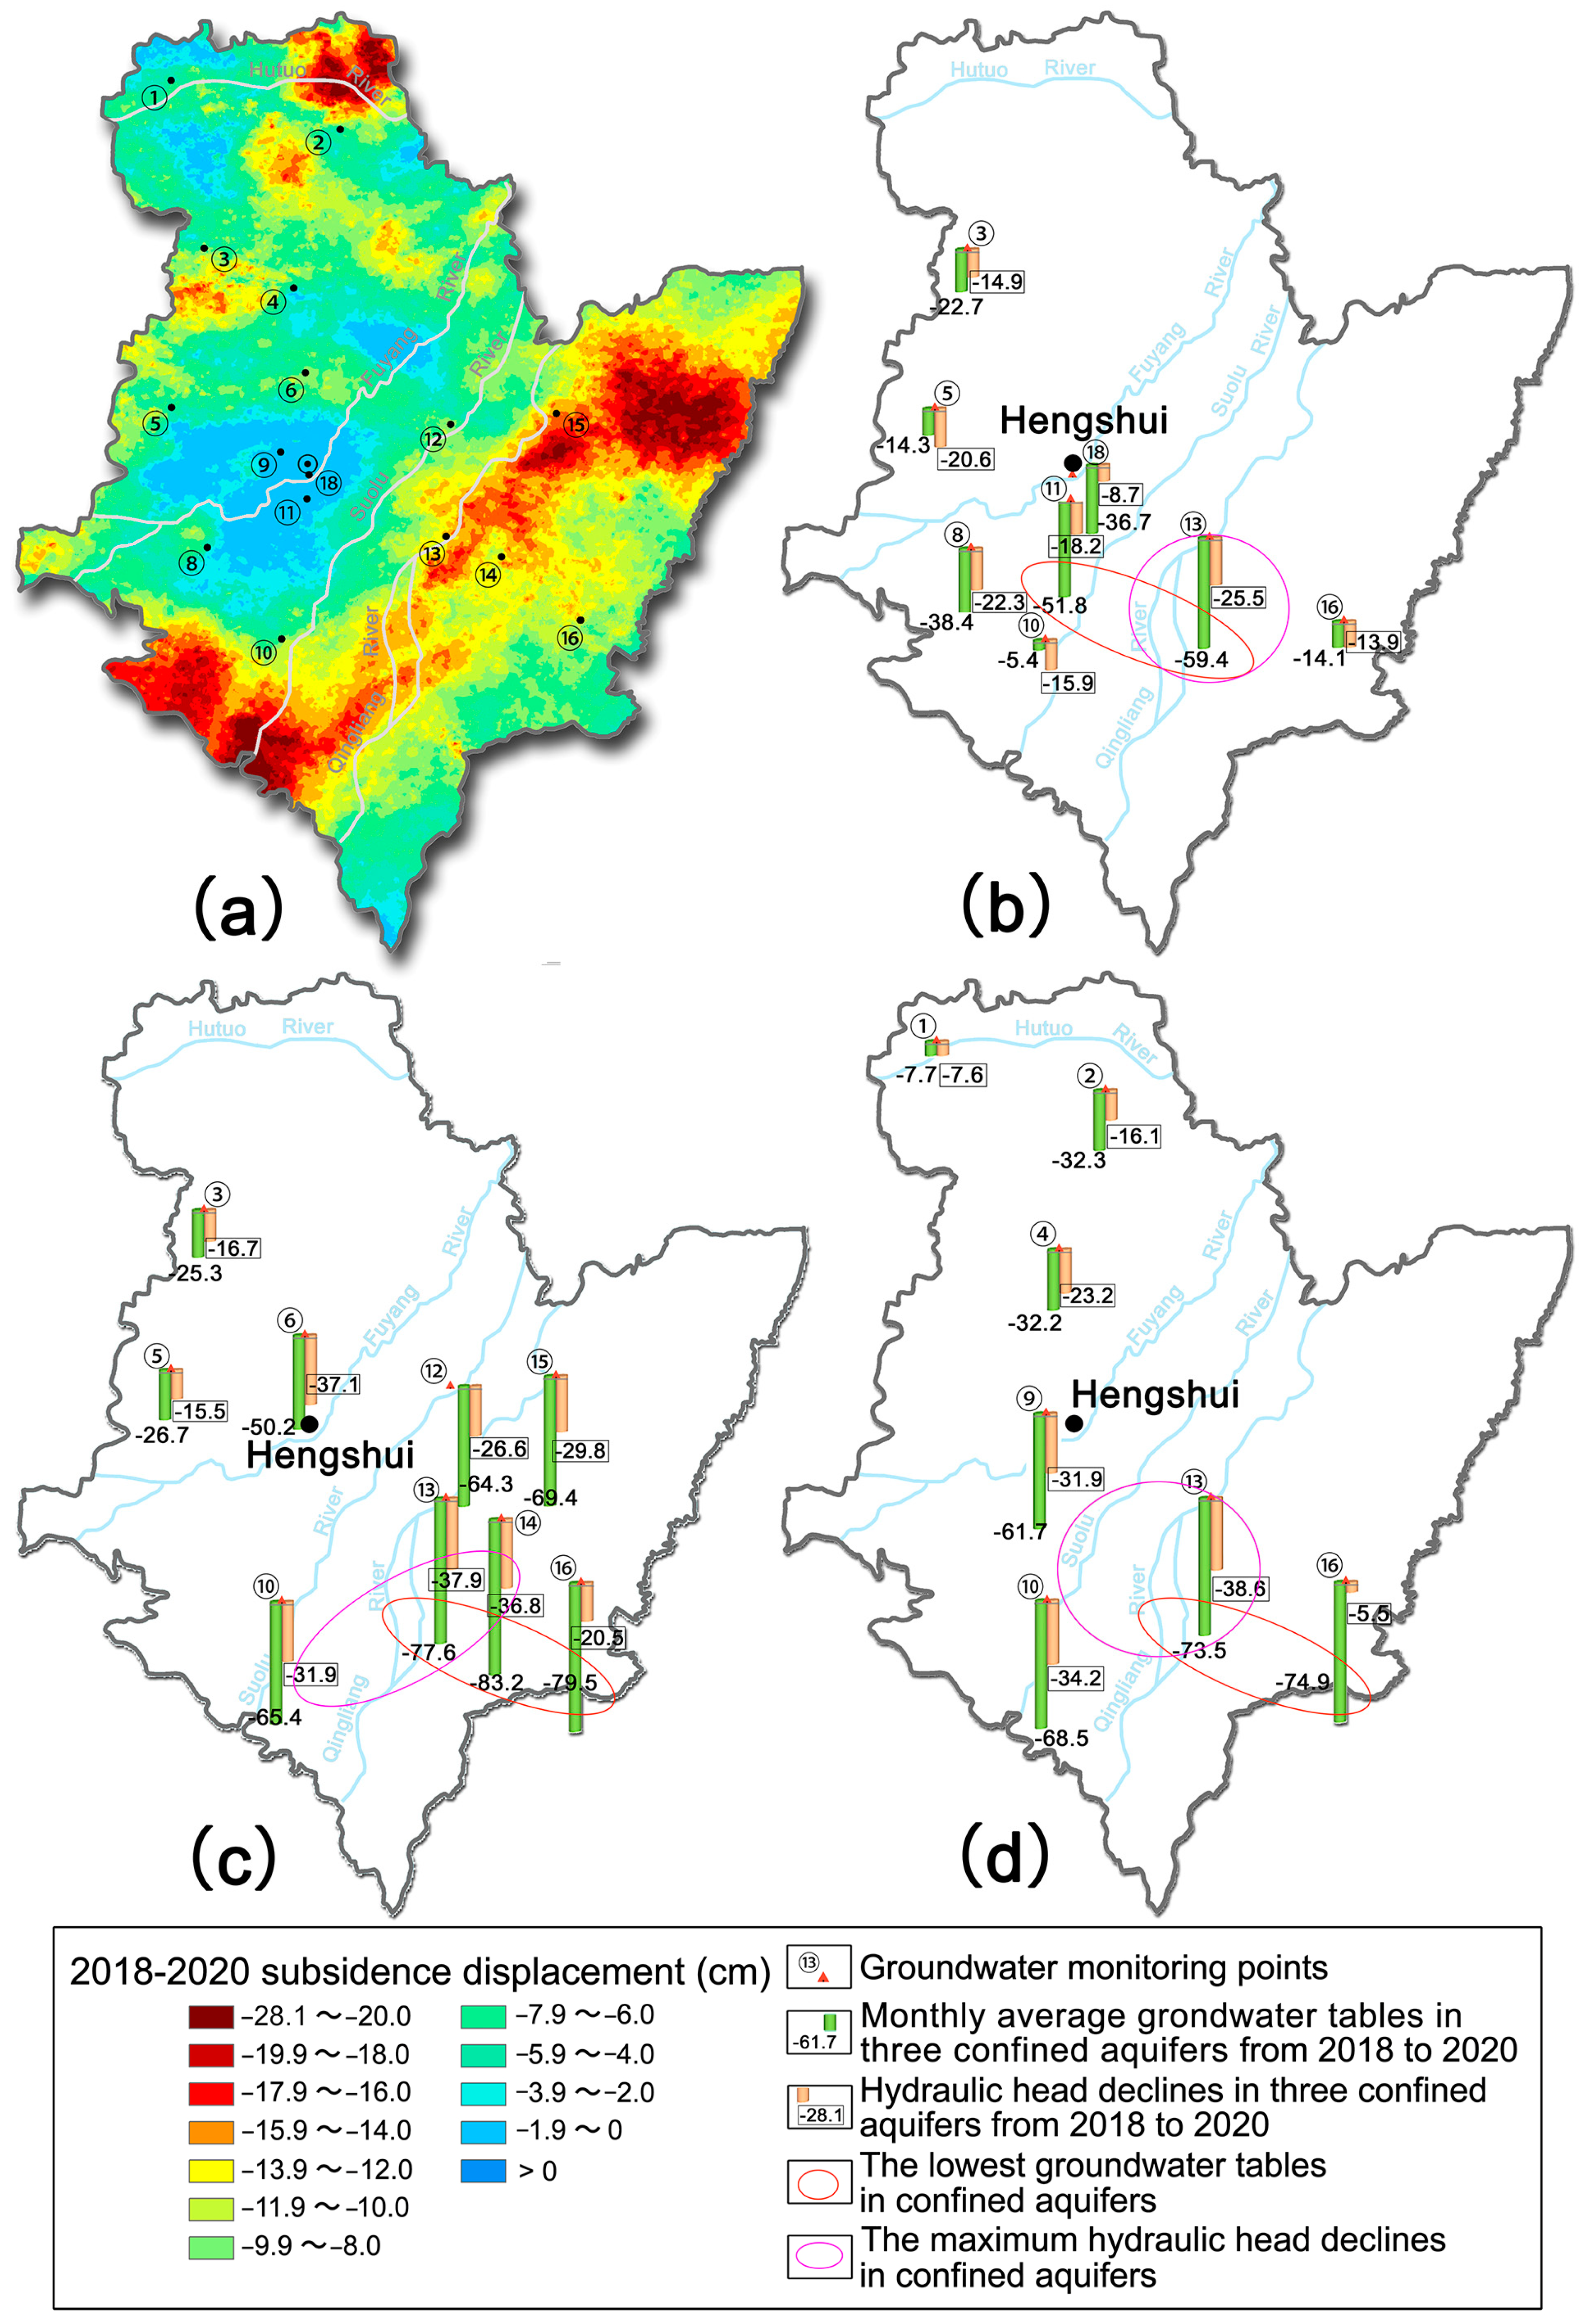
5.3. Relationship between Land Subsidence and Groundwater Tables, Hydraulic Head Declines of Confined Aquifers

Twenty-four groundwater piezometers from 16 monitoring wells, representing three confined aquifers, are irregularly scattered across Hengshui, as illustrated in Figure 5. Of these 24 piezometers, 20 are located in a subsidence zone along the Fuyang, Suolu and Qingliang Rivers in the east or south of Hengshui. We use monthly average measurements and the maximum hydraulic head declines of three confined aquifers to compare the subsidence displacement and range from January 2018 to December 2020.
We observe that groundwater depression centers of three confined aquifers are substantially located to the southeast of Hengshui City: (1) six of 24 piezometers are monitoring the first-confined aquifer (Ⅱ), the groundwater tables of No. ⑪ and ⑬ in Figure 5b were below −50 m (−51.8 m and −59.4 m, respectively) (Table 3) and the others were between −5.4 m and −38.4 m; (2) in the upper portion of the second-confined aquifer (Ⅲ1), there are eight groundwater piezometers and the lowest water table located at No. ⑭, was up to −83.2 m (Table 3), around which those water tables (No. ⑫, ⑬, ⑮ and ⑯) were among −64.3~−79.5 m, and water tables at further locations (No. ⑥ and ⑩) varied from −50.2 to 65.4 m (Figure 5c); and (3) in the lower portion of second-confined aquifer (Ⅲ2), its groundwater depression center appeared at No. ⑬ and ⑯, where their water tables still were −73.5 m and −74.9 m (Table 3), sequentially, and were lower than their surrounding water tables (−61.7 m at ⑨ and −68.5 m at No. ⑩) (Figure 5d). Meanwhile, we also investigate the maximum hydraulic head declines of three confined aquifers: the maximum hydraulic head decline center occurred at No. ⑧, ⑪ and ⑬ in the first-confined aquifer (Figure 5b), and in the upper portion (Ⅲ1) and the lower portion of second-confined aquifer (Ⅲ2), the maximum hydraulic head decline centers were located in No. ⑥, ⑬, and ⑭ and ⑨, ⑩, and ⑬, respectively (Figure 5c,d).
It is clear that in each confined aquifer hydraulic head, the decline centers almost coincided with groundwater depression centers and they were basically located at or near monitoring well No. ⑬, where there were high subsidence displacements of >12.0 cm/year during the period between 2018 and 2020. But the center of the subsidence bowl (subsidence displacements >18.0 cm/year) happened at the southwest of monitoring well No. ⑩, and east of monitoring well No. ⑮ (Figure 5a). There are two possible explanations for this. First, it is very likely that the lack of groundwater piezometers reflects water extraction from confined aquifers in the above-mentioned locations. Second, water extraction could occur at higher rates before 2018, generating a new preconsolidation head in those huge clay soils [41,42]. Since multilayer huge clay soils are unconsolidated due to their low permeability, the deformation of the clay soil will last for a long time after the groundwater has been extracted [43,44,45].

5.4. Relationship between Total Hydraulic Head Variation and Time-Series Subsidence

Two representative groundwater monitoring locations have been prepared for a detailed explanation of the relationship between the total hydraulic head variation and time-series vertical subsidence retrieved from InSAR at the locations of No. ⑩ and ⑬ (Figure 6a). At No. ⑩ and ⑬, we note subsidence displacement and total hydraulic heads with clear seasonal variability, and their seasonal dynamics were basically consistent except for subsidence displacement having a delay of two to four months. However, at No. ⑬, there was still a larger variance of the time-dependent groundwater table and subsidence displacement than at No. ⑩. At No. ⑩ (Figure 6b), we notice the annual variation of groundwater table was significant in the same year but the water table difference was small in the same month of different years. Its constant subsidence rates of ~1 cm/year had clear seasonal variability and the accumulated subsidence ran to 4.1 cm from January 2018 to December 2020. On the contrary, at No. ⑬ (Figure 6b), we observe that groundwater table continuously descended from −17.8 m in March 2018 to −83.8 m in September 2019 and then the groundwater table showed significant seasonal variability, rising to −52.8 m in March 2020 and −51.5 m in October 2020, yet decreasing to −97 in May or June 2020. During the period between January 2018 and December 2020, rapid subsidence was taking place at average rates of 2–5 cm/year but when the groundwater table rose, subsidence slowed down or disappeared. The InSAR time-series result revealed that accumulated subsidence reached 15.1 cm as of December 2020. In Hengshui, the new preconsolidation head generated by the groundwater drawdown in 2019 causes nonelastic subsidence displacement to continue to increase even if the groundwater table is stable or rising. When the new preconsolidation head disappears [41,42], the nonelastic subsidence reaches its maximum value, and then groundwater fluctuation just brings about surface elastic deformation, which will contribute to estimate and administer the annual groundwater exploitation amount of the confined aquifer systems.

6. Conclusions

In this paper, we jointly applied PSInSAR and SBAS methods to over two thousand RADARSAT-2 interferograms in combination spanning eleven years, from September 2011 until October 2022, to present 2012–2022 annual vertical subsidence rate maps for Hengshui. These vertical subsidence rates maps revealed two large-scale subsidence areas, individually located to the north of Hengshui City around the Hutuo River and to the east or south along the Fuyang, Suolu and Qingliang Rivers. Their rates of subsidence and their spatial and temporal distribution are identified and mapped. In areas around the Hutuo River, there have appeared two subsidence bowls with a maximum rate of 9~12 cm/year since 2017. But in the east and south of Hengshui along Fuyang, Suolu and Qingliang River, InSAR revealed widespread subsidence took place between 2014 and 2021, among which the average subsidence rates of >8.0 cm/year covered areas of over 100 km2 in 2014, 2017, 2019, 2020 and 2021, respectively.
We demonstrate land subsidence with central table variation of groundwater depression, groundwater table variation of three confined aquifers, hydraulic head declines of three confined aquifers and the time-dependent total hydraulic head variation. Our results show that large-scale subsidence area along Fuyang, Suolu and Qingliang River is highly in agreement with groundwater over-extraction area, and subsidence displacement and total hydraulic heads with clear seasonal variability except for subsidence displacement having a delay of two to four months compared with total hydraulic heads. So groundwater over-extraction for agricultural use is responsible for subsidence in Hengshui owing to drought and water resource shortage.
Our study also demonstrated that the subsidence rates in Hengshui did not decrease but rather increased when groundwater table significantly rose after September 2019. One possible explanation for this is that a new preconsolidation head generated [41,42] due to groundwater table dropping in 2019 leads to the effective hydraulic head still existing in the aquitards even if the groundwater table rises in the aquifers, and therefore nonelastic subsidence is still occurring in the aquitards and elastic upraising probably occurs in the sand of confined aquifer systems. At this period it is difficult to decomposition the elastic and nonelastic displacement component of InSAR measurement [7,46]. The disappearing of the new preconsolidation head could illustrate the end of nonelastic subsidence of the aquitards. If the groundwater tables are not lower than the above lowest water table in Hengshui, seasonal elastic deformation, in phase with head fluctuations, is observed over the confined aquifer systems [46] further used to inverse elastic skeletal storage coefficients of these confined aquifer systems [7,47,48], which will contribute to estimate and administrate the annual groundwater exploitation amount of confined aquifer systems in Hengshui.
Further studies for this region are also required, including improvement to this InSAR methodology (e.g., atmospheric and stochastic signal), inverse deduction of the physical or mechanical parameters of clay soil including coefficient of compressibility, permeability coefficient and effective porosity and accurate assessment of the new preconsolidation head and its dissipation time, to precisely estimate the duration of nonelastic subsidence after groundwater begins to rise.

Author Contributions

Conceptualization, M.L., D.G. and X.G.; methodology, M.L. and X.G., Y.W. (Yan Wang); validation, M.L., L.Z. and B.L.; formal analysis, M.L., Q.W., Y.W. (Yan Wang) and D.G.; investigation, X.W. and M.L.; resources, X.G. and D.G.; data curation, Y.W. (Yu Wang), M.L. and L.Z.; writing—original draft preparation, M.L. and B.L.; writing—review and editing, M.L., Y.W. (Yan Wang) and D.G.; visualization, B.L., L.Z. and X.W.; supervision, Q.W. and Y.W. (Yu Wang).; project administration, M.L. All authors have read and agreed to the published version of the manuscript.

Funding

This research has been funded by the Ministry of Science and Technology of the People’s Republic of China (No. 2021YFC3000400).

Data Availability Statement

RADARSAT-2 SAR images supporting the reported results can be acquire from MacDonald Dettwiler and Associates Ltd. (MDA) and Digital Elevation Model (DEM) can be downloaded from the website (http://srtm.csi.cgiar.org/SELECTION/inputCoord.asp) (accessed on 16 January 2020). In addition, groundwater datasets are needed to apply for China Geological Environment Monitoring Institute.

Acknowledgments

We would like to appreciate Yong Zhou from the China Geological Environment Monitoring Institute for providing groundwater tables data sets. We also truly appreciate anonymous reviewers for their useful and constructive suggestions and comments for our manuscript improvement, RADARSAT-2 SAR data provider (MacDonald Dettwiler and Associates Ltd.) and processing software supplier (Switzerland Gamma Remote Sensing) in providing Gamma software (V20201211) to extract subsidence information.

Conflicts of Interest

The authors declare no conflict of interest.

References

  1. Wang, M.-Y. Research on Land Subsidence Mechanism and Prediction of Settlement in Hengshui Area. Master’s Thesis, China University of Geosciences, Beijing, China, 2016; pp. 7–26. [Google Scholar]
  2. Wang, S. Characteristics of Groundwater Chemistry and Hydrogeochemical Process on Shijiazhuang-Hengshui Profile. Ph.D. Dissertation, China University of Geosciences, Beijing, China, 2017; pp. 10–35. [Google Scholar]
  3. Zhu, J.-Y.; Guo, H.-P.; Li, W.-P.; Tian, X.-W. Relationship between land subsidence and deep groundwater yield in the North China Plain. South North Water Transf. Water Sci. Technol. 2014, 12, 165–169. [Google Scholar]
  4. Guo, H.-P.; Bai, J.-B.; Zhang, Y.-Q.; Wang, L.-Y.; Shi, J.-S.; Li, W.-P.; Zhang, Z.-C.; Wang, Y.-L.; Zhu, J.-Y.; Wang, H.-G. The evolution characteristics and mechanism of the land subsidence in typical areas of the North China Plain. Geol. China 2017, 44, 1115–1127. [Google Scholar]
  5. He, Q.-C.; Liu, W.-B.; Li, Z.-M. Land subsidence survey and monitoring in the North China Plain. Geol. J. China Univ. 2006, 12, 195–209. [Google Scholar]
  6. He, X. Study on Dynamic Response of Groundwater under Heavy Rainfall. Master’s Thesis, China University of Geosciences, Beijing, China, 2016; pp. 5–12. [Google Scholar]
  7. Peng, M.-M.; Lu, Z.; Zhao, C.-Y.; Motagh, M.; Bai, L.; Conway, B.-D.; Chen, H.-Y. Mapping land subsidence and aquifer system properties of the Willcox Basin, Arizona, from InSAR observations and independent component analysis. Remote Sens. Environ. 2022, 271, 112894. [Google Scholar] [CrossRef]
  8. Li, Z.-M. Characteristics and Mechanism of Land Subsidence in Hebei Plain. Ph.D. Dissertation, China University of Geosciences, Beijing, China, 2012; pp. 8–44. [Google Scholar]
  9. Zhang, X.-Z. Dynamic characteristics of deep groundwater in Hengshui City. Shaanxi Water Resour. 2018, 2, 23–25. [Google Scholar]
  10. Hebei Water Resources Bulletin. 2012–2021. Available online: http://slt.hebei.gov.cn/a/zfxxgk/zc/ (accessed on 1 August 2023).
  11. Ali, M.-Z.; Chu, H.-J.; Burbey, T.-J. Mapping and predicting subsidence from spatio-temporal regression models of groundwater-drawdown and subsidence observations. Hydrogeol. J. 2020, 28, 2865–2876. [Google Scholar] [CrossRef]
  12. Jia, C.; Di, S.-T.; Sun, X.-X.; Zhang, S.-P.; Ding, P.-P.; Liu, Z.-T. Spatiotemporal evolution characteristics and Transfer law of land subsidence in sand-clay interbed caused by exploiting the groundwater. Arab. J. Sci. Eng. 2021, 46, 5733–5753. [Google Scholar] [CrossRef]
  13. Ma, D.-M.; Zhao, R.; Li, Y.-S.; Li, Z.-G. Land subsidence assessment of an Archipelago based on the InSAR time series analysis method. Water 2023, 15, 465. [Google Scholar] [CrossRef]
  14. Yousefi, R.; Talebbeydokhti, N. Subsidence monitoring by integration of time series analysis from different SAR images and impact assessment of stress and aquitard thickness on subsidence in Tehran, Iran. Environ. Earth Sci. 2021, 80, 418. [Google Scholar] [CrossRef]
  15. Ng, A.-H.; Ge, L.-L.; Li, X.-J. Assessments of land subsidence in the Gippsland Basin of Australis using ALSO PALSAR data. Remote Sens. Environ. 2015, 159, 86–101. [Google Scholar] [CrossRef]
  16. Candela, T.; Koster, K. The many faces of anthropogenic subsidence. Science 2022, 376, 1381–1382. [Google Scholar] [CrossRef] [PubMed]
  17. Li, M.; Ge, D.-Q.; Liu, B.; Zhang, L.; Wang, Y.; Guo, X.-F.; Wang, Y.; Zhang, D.-D. Research on development characteristics and failure mechanism of land subsidence and ground fissure in Xi’an, monitoring by using time-series SAR interferometry. Geomat. Nat. Hazards Risk 2019, 10, 699–718. [Google Scholar] [CrossRef]
  18. Li, M.; Ge, D.-Q.; Zhang, L.; Guo, X.-F.; Liu, B.; Wang, Y.; Wu, Q. Assessment of the temporal-spatial evolution of subsidence and its driving mechanism in the Beijing Plain (China) by using SAR interferometry and geological data. Geomat. Nat. Hazards Risk 2021, 12, 2708–2735. [Google Scholar] [CrossRef]
  19. Chaussard, E.; Amelung, F.; Abidin, H.; Hong, S.-H. Sinking cities in Indonesia: ALSO PALSAR detects rapid subsidence due to groundwater and gas extraction. Remote Sens. Environ. 2013, 128, 150–161. [Google Scholar] [CrossRef]
  20. Zhao, Z.-H. Analysis of the neotectonic activity and the bad geological phenomenon caused by it in Beijing Plain areas. J. Geol. Hazards Environ. Preserv. 2009, 20, 66–70. [Google Scholar]
  21. Bekaert, D.; Walters, R.; Wright, T.; Hooper, A.; Parker, D. Statistical comparison of InSAR tropospheric correction techniques. Remote Sens. Environ. 2015, 170, 40–47. [Google Scholar] [CrossRef]
  22. Sneed, M.; Brandt, J. Detection and Messurement of Land Subsidence Using Global Positioning System Surveying and Interferometric Synthetic Aperture Radar; Scientific Investigations Report 2007–5251; US Department of the Interior, US Geological Survey: Washington, DC, USA, 2013; pp. 1–30. [Google Scholar] [CrossRef]
  23. Ferretti, A. Satellite InSAR Data Reservoir Monitoring from Space; EAGE Publications BV: Scheveningen, The Netherlands, 2014; pp. 8–101. [Google Scholar]
  24. Berardino, P.; Fornaro, G.; Lanari, R.; Sansosti, E. A new algorithm for surface deformation monitoring based on small baseline differential SAR interferograms. IEEE Trans. Geosci. Remote Sens. 2002, 40, 2375–2383. [Google Scholar] [CrossRef]
  25. Ge, D.-Q.; Wang, Y.; Guo, X.-F.; Liu, S.-W.; Fan, J.-H. Surface deformation monitoring with multi-baseline D-InSAR based on coherent point target. J. Remote Sens. 2007, 11, 574–580. [Google Scholar]
  26. Tizzani, P.; Berardino, P.; Casu, F.; Euillades, P.; Manzo, M.; Ricciardi, G.-P.; Zeni, G.; Lanari, R. Surface deformation of Long Valley caldera and Mono Basin, California, investigated with the SBAS-InSAR approach. Remote Sens. Environ. 2007, 108, 277–289. [Google Scholar] [CrossRef]
  27. Hooper, A.; Bekaert, D.; Spaans, K.; Arikan, M. Recent advances in SAR interferometry time series analysis for measuring crustal deformation. Tectonophysics 2012, 514–517, 1–13. [Google Scholar] [CrossRef]
  28. Ge, D.-Q.; Zhang, L.; Wang, Y.; Guo, X.-F.; Wang, Y. A Monitoring Method with Integrating Multi-Orbit and Long-Strip CTInSAR about Regional Land Subsidence. National Invention Patent of the People’s Republic of China No: ZL 2014 1 0353927.3, 2017. Available online: https://www.zhangqiaokeyan.com/patent-detail/061202322554.html (accessed on 3 August 2022).
  29. Ferretti, A.; Prati, A.; Rocca, F. Permanent scatterers in SAR Interferometry. IEEE Trans. Geosci. Remote Sens. 2001, 39, 8–20. [Google Scholar] [CrossRef]
  30. Li, G.-R.; Zhao, C.-Y.; Wang, B.-H.; Peng, M.-M.; Bai, L. Evolution of spatiotemporal ground deformation over 30 years in Xi’an, China, with multi-sensor SAR interferometry. J. Hydrol. 2023, 616, 128764. [Google Scholar] [CrossRef]
  31. Dong, J.; Guo, S.-K.; Wang, N.; Zhang, L.; Ge, D.-Q.; Liao, M.-S.; Gong, J.-Y. Tri-decadal evolution of land subsidence in the Beijing Plain revealed by multi-epoch satellite InSAR observations. Remote Sens. Environ. 2023, 286, 113446. [Google Scholar] [CrossRef]
  32. Raucoules, D.; Cartannaz, C.; Mathieu, F.; Midot, D. Combined use of space-borne SAR interferometric techniques and ground-based measurements on a 0.3 km2 subsidence phenomenon. Remote Sens. Environ. 2013, 139, 331–339. [Google Scholar] [CrossRef]
  33. Chatterjee, R.-S.; Fruneau, B.; Rudant, J.-P.; Roy, P.-S.; Frison, P.-L.; Lakhera, R.-C.; Dadhwal, V.-K.; Saha, R. Subsidence of Kolkata (Calcutta) City, India during the 1990s as observed from space by Differential Synthetic Aperture Radar Interferometry (D-InSAR) techique. Remote Sens. Environ. 2006, 102, 176–185. [Google Scholar] [CrossRef]
  34. RADARSAT-2 Satellite Characteristics. 2015. Available online: http://www.asc-csa.gc.ca/eng/satellites/radarsat/radarsat-tableau.asp (accessed on 1 August 2023).
  35. Jiang, L.-M.; Lin, H.; Ma, J.-W.; Kong, B.; Wang, Y. Potential of small-baseline SAR interferometry for monitoring land subsidence related to underground coal fires:Wuda (Northern China) case study. Remote Sens. Environ. 2011, 115, 257–268. [Google Scholar] [CrossRef]
  36. Hooper, A.; Zebker, H.; Segall, P.; Kampes, B. A new method for measuring deformation on volcanoes and other natural terrains using InSAR persistent scatterers. Geophys. Res. Lett. 2004, 31, L23611. [Google Scholar] [CrossRef]
  37. Wright, T.-J.; Parsons, B.-E.; Lu, Z. Toward mapping surface deformation in three dimensions using InSAR. Geophys. Res. Lett. 2004, 31, L01607. [Google Scholar] [CrossRef]
  38. Teatini, P.; Strozzi, T.; Tosi, L.; Wegmüller, U.; Werner, C.; Carbognin, L. Assessing short- and long-time displacements in the Venice coastland by synthetic aperture radar interferometric point target analysis. J. Geophys. Res. 2007, 112, F01012. [Google Scholar] [CrossRef]
  39. Stramondo, S.; Bozzano, F.; Marra, F.; Wegmuller, U.; Cinti, F.-R.; Moro, M.; Saroli, M. Subsidence induced by urbanisation in the city of Rome detected by advanced InSAR technique and geotechnical investigations. Remote Sens. Environ. 2008, 112, 3160–3172. [Google Scholar] [CrossRef]
  40. Water Resources Bulletin of Hebei Province. 2012–2022. Available online: https://slt.hebei.gov.cn/ (accessed on 1 August 2023).
  41. Zeitoun, D.-G.; Wakshal, E. Fundamentals of the Consolidation Theory for Soils. In Land Subsidence Analysis in Urban Areas; Springer: Berlin/Heidelberg, Germany, 2013; pp. 75–117. [Google Scholar] [CrossRef]
  42. Selvadurai, A.-P.-S. Irreversibility of soil skeletal deformations: The Pedagogical Limitations of Terzaghi’s celebrated model for soil consolidation. Comput. Geotech. 2021, 135, 104137. [Google Scholar] [CrossRef]
  43. Shen, X.-Y.; Ch, Z.-H. Primary Consolidation Theory of Saturated Soft Clay (Continuation): The Relationship between Clay’s Water Content and Time during Primary Consolidation. Earth Sci. 2009, 34, 861–869. [Google Scholar]
  44. Unconsolidated Soil. Available online: https://baike.baidu.com/item/%E6%AC%A0%E5%9B%BA%E7%BB%93%E5%9C%9F/4753061?fromModule=search-result_lemma-recommend (accessed on 1 August 2023).
  45. Terzaghi, K. Principles of soil mechanics: IV. Settlement and consolidation of clay. Eng. News Rec. 1925, 95, 874–878. [Google Scholar]
  46. Chaussard, E.; Bürgmann, R.; Shirzaei, M.; Fielding, E.-J.; Baker, B. Predictability of hydraulic head changes and characterization of aquifer-system and fault properties from InSAR-derived ground deformation. J. Geophys. Res. Solid Earth 2014, 119, 6572–6590. [Google Scholar] [CrossRef]
  47. Hoffmann, J.; Galloway, D.-L.; Zebker, H.-A. Inverse modeling of interbed storage parameters using land subsidence observations, Antelope Valley, California. Water Resour. Res. 2003, 39, 1031. [Google Scholar] [CrossRef]
  48. Jiang, L.; Bai, L.; Zhao, Y.; Cao, G.; Wang, H.; Sun, Q. Combining InSAR and hydraulic head measurements to estimate aquifer parameters and storage variations of confined aquifer system in Cangzhou, North China Plain. Water Resour. Res. 2018, 54, 8234–8252. [Google Scholar] [CrossRef]
Figure 1. Map of our study area, its surroundings and the coverage of two SAR images from RADARSAT-2 satellite. The light gray area is the North China Plain (China). The red line represents the location of Hengshui, and the blue lines are the main rivers across Hengshui. The top left insert shows where Hengshui is located the in the North China Plain of China.
Land 12 01684 g001
Figure 2. Hydrogeology profile map, including four aquifer systems, borehole depth, borehole number and the boundaries among between aquifers, from the northwest to southeast portion in Hengshui. The unconfined aquifer system (I) is composed of loose sandy and muddy materials belonging to alluvial sediment of river and swamp facies. The first-confined aquifer system (II) is deposited by alluvial sediment of river facies, and water-bearing layer is mainly composed of fine sand. The second-confined and third-confined aquifer systems (III and IV) are deposited by alluvial and proluvial sediments of river facies and sediments of river and lake facies, respectively, whereas their water-bearing layers are mainly medium-fine sand and intermittent medium-coarse sand. Among the water-bearing layers in four aquifer systems, the white parts represent aquitards consisting of a succession of silty clay and clay [5,6,9].
Land 12 01684 g002
Figure 3. Annual subsidence velocity maps of Hengshui during the period from 2012 to 2022 are color-coded from dark green (representing shortening distance between ground surface and satellite, or land uplift) to dark red (representing increasing distance between ground surface and satellite, or surface subsidence).
Land 12 01684 g003
Figure 4. (a) The locations of lowest groundwater table in three confined aquifer systems along Fuyang, Suolu and Qingliang Rivers in different years, spatially correlate with the land subsidence area along Fuyang, Suolu and Qingliang Rivers; (b) The correlation between subsidence area (subsidence rate >5 cm/year) and the lowest groundwater table in three confined aquifer systems along Fuyang, Suolu and Qingliang Rivers to the east or south of Hengshui city from 2012 to 2022.
Land 12 01684 g004
Figure 5. Vertical InSAR accumulated subsidence in comparison with aquifer hydraulic head decline centers and groundwater depression centers during the period from 2018 to 2020 in three confined aquifer systems. (a) Vertical InSAR accumulated subsidence displacement from 2018 to 2020; (b) average groundwater tables and hydraulic head declines at 69–197 m depth below surface (II); (c) average groundwater tables and hydraulic head declines at 150–270 m depth below surface (III1); (d) average groundwater tables and hydraulic head declines at 248–330 m depth below surface (III2).
Land 12 01684 g005
Figure 6. (a) Vertical InSAR accumulated subsidence displacement from 2018 to 2020 around ⑩ and ⑬; (b) The total hydraulic head variation, the sum of hydraulic heads in four aquifer systems (I, II, III1 and III2), and time-series vertical subsidence retrieved from InSAR at the locations of No. ⑩ and ⑬ for the period from January 2018 to December 2020.
Land 12 01684 g006
Table 1. RADARSAT-2 data of Hengshui acquired between 2012 and 2022 and their parameters.
No.Image ModeObite TypeSwath of Scene (km)Scene
Number
Number of Each SceneTotal Number of ScenesTime Span
1.WideDescending150 × 15021428Sep.2011–Oct.2012
Sep.2012–Oct.2013
Sep.2013–Oct.2014
Sep.2014–Oct.2015
Sep.2015–Oct.2016
2.Etra-
Fine
Descending125 × 12521428Sep.2016–Oct.2017
Sep.2017–Oct.2018
Sep.2018–Oct.2019
Sep.2019–Oct.2020
Sep.2020–Oct.2021
Sep.2021–Oct.2022
Table 2. Annual maximum vertical rates of subsidence and coverage areas with average rates of subsidence of >5.0 or 8.0 cm/year in two large-scale subsidence areas.
Hutuo River BasinFuyang, Suolu and Qingliang Basin
Annual maximum vertical rates of subsidence (cm/year)The coverage areas with average rates of subsidence of
>5.0 cm/year (km2)
Annual maximum vertical rates of subsidence (cm/year)The coverage areas with average rates of subsidence of >8.0 cm/year (km2)
201210.2528.10
20136.6557.70
20147.58913.0971
20156.45110.61
20167.07610.344
201713.8101213.9119
20188.211911.67
20199.514110.4178
202011.819310.8191
202111.320110.8124
202212.32419.50
Table 3. The lowest groundwater tables and maximum hydraulic head declines in confined aquifers (II, III1 and III2).
The Lowest Groundwater TablesThe Maximum Hydraulic Head Declines
LocationValue (m)LocationValue (m)
The first-confined aquifer (II)−51.8−18.2
−59.4−25.5
The upper portion of second-confined aquifer (III1)−77.6−31.9
−83.2−37.9
−79.5−36.8
The lower portion of second-confined aquifer (III2)−73.5−31.9
−74.9−34.2
−38.6
Disclaimer/Publisher’s Note: The statements, opinions and data contained in all publications are solely those of the individual author(s) and contributor(s) and not of MDPI and/or the editor(s). MDPI and/or the editor(s) disclaim responsibility for any injury to people or property resulting from any ideas, methods, instructions or products referred to in the content.

