Article

Changes in the Patterns of Population Distribution and Built-Up Areas of the Rural–Urban Fringe in Post-Socialist Context—A Central European Case Study

1
Department of Social Geography and Regional Development Planning, University of Debrecen, Egyetem tér 1, 4032 Debrecen, Hungary
2
Doctoral School of Earth Sciences, University of Debrecen, Egyetem tér 1, 4032 Debrecen, Hungary
3
Department of Physical Geography and Geoinformatics, University of Debrecen, Egyetem tér 1, 4032 Debrecen, Hungary
*
Author to whom correspondence should be addressed.
Land 2023, 12(9), 1682; https://doi.org/10.3390/land12091682
Submission received: 5 August 2023 / Revised: 24 August 2023 / Accepted: 25 August 2023 / Published: 28 August 2023

Abstract

:
The rapid and significant expansion of urban areas is observed worldwide; however, considerable differences are detected within the characteristics of the process. The rural–urban fringe is changing most dynamically from the aspect of land use and this tends to be relevant in the case of post-socialist cities in Central Europe even with a stagnating or decreasing population. Debrecen (Hungary) and its hinterland adequately represent the migration trends of Hungarian cities and the great administrative area provided wide intra-urban suburbanization processes. The current study put the emphasis on the analysis of the spatial pattern of built-up areas and the distribution of residents. In order to discover the processes of the post-socialist transition period, detailed point layers were created to illustrate every built-up parcel in the rural–urban fringe of Debrecen (for the years 1980, 2000, and 2020). The most important characteristics were discovered with the help of GIS methods—Kernel-density, grid pattern analysis of the object density, and analysis of land cover/land use changes using Corine Land Cover Change (CLCC) databases. The dynamic and extended expansion of built-up areas was seen until 2000, in which the outskirts (including hobby gardens) densified spectacularly. The urban sprawl has been less intensive since the millennium and the increase in built-up areas has become more concentrated. As a consequence of the transition period, extended territories—primarily the least dense parts of the rural–urban fringe—are faced with the disappearance of buildings due to agricultural cultivation reasons.

1. Introduction

The global phenomenon of the ongoing urbanization is one of the most significant factors impacting the rapidly transforming land use of the world [1]. Those countries and urban areas may also face the urban growth the population number of which stagnates or even decreases [2] and the post-socialist territories represent a different path regarding the trends of urbanization [3,4]. The most significant and spectacular changes have been detected in the case of post-socialist capital cities; this is the reason why numerous studies discovered the processes of these metropolitan areas inter alia [4,5,6,7,8,9,10,11]. However, an increasing number of analyses have focused on smaller agglomerations or urban hinterlands in the post-socialist Eastern Central European countries inter alia [12,13,14,15,16]. Intra-urban suburbanization also received greater attention during recent decades [17,18].
The most important objectives of the current research were to detect the characteristics of the urban fringe and the intra-urban suburbanization and their temporal changes in the case of a city during and after the post-socialist transition. In order to discover these spatial characteristics in the distribution of population and built-up areas, fine resolution of data analysis was applied with the help of GIS-based techniques. The aim of the research was to provide a precise contribution to the existing literature about the heterogenous spatial features of the post-socialist transformation of the rural–urban fringe.

2. Theoretical Background

2.1. Suburbanization and Urban Sprawl

Intense urbanization causes rapid and significant changes in the adjacent and distant environment of cities worldwide [1]; however, there are major disparities in the tendencies and consequences between and within the continents [19]. The rapid expansion of urban areas often called urban spawl which is ‘bad urban growth’ with gluttonous and inefficient use of land for various purposes and uninterrupted monotonous, but sometimes discontinuous development [20]. Expanding urban functions to adjacent territories—residential areas, retail and service functions, industrial and infrastructural sites—regularly do not correlate with population growth [12,21,22]. These processes have caused significant spatial restructuring—relative deconcentration—of the population living in the city and have resulted in widespread and comprehensive consequences [10,23]. Urban sprawl and suburbanization correlate with each other and can be separated by many approaches, from which the most traditional one refers to suburbanization as a migration process coinciding with urban growth and with the urban sprawl as a land use change [24]. According to the approach of the current study, suburbanization and urban sprawl overlap each other, because the locally increasing population number is often accompanied with changes in land use.
One of the explanations for suburbanization roots in the neoclassical economic theory, assuming goals of profit maximization or satisfaction (former one for businessman, latter one for residents). Important attracting ideas in relation to the suburbs are environmental advantages (clean air, less noise, and traffic jams), the aesthetics of urban environment, and a family-centric life-style [25]. At the same time, the mass migration to suburbs even triggered massive environmental and infrastructural problems that are expected to be one of greatest challenges in the near future in the light of climate change and sustainable development [8,14,26,27,28,29].
At the same time, in addition to the process of suburbanization (partly in relation with that), a large number of shrinking cities are observed worldwide both in physical and in discursive terms [30]. The shrinking of cities is caused both by demographical, economic coefficients [31]; however, environmental issues are also essential. Not only are central cities faced with shrinking but also suburbs, which are often not equipped to respond to the complex problems effectively [32]. The intra-urban suburbanization (see further below) partly mitigates the impacts of the shrinking city center, because the city’s residents do not leave the administrative area.
Suburbanization does not only mean the relative deconcentration of population but it is often accompanied by the spatial economic processes as well. On the one hand, the increasing size of communities and the growing local purchasing power demand more and higher-level services. On the other hand, different economic actors seek to find appropriate locations on the fringes of cities to exploit the lower level of property prices and good access to agglomeration advantages. Functional clusters of economic activities tend to be formed, due to the different characteristics and of the cities’ environment. Transport corridors have a major role in the location of processing industries or logistical activities; for this reason, motorways and railways form zones for these kinds of companies as well as for residential areas [33,34].
The rural–urban fringe is the transition zone between the densely populated built-up urban area and the agriculture-dominated countryside, which is impacted by the natural expansion (or, in other approach, the unplanned growth) of the city [35] and characterized by rapid changes in the land use forms [36] with the appearance of chaotic structures as well [37].

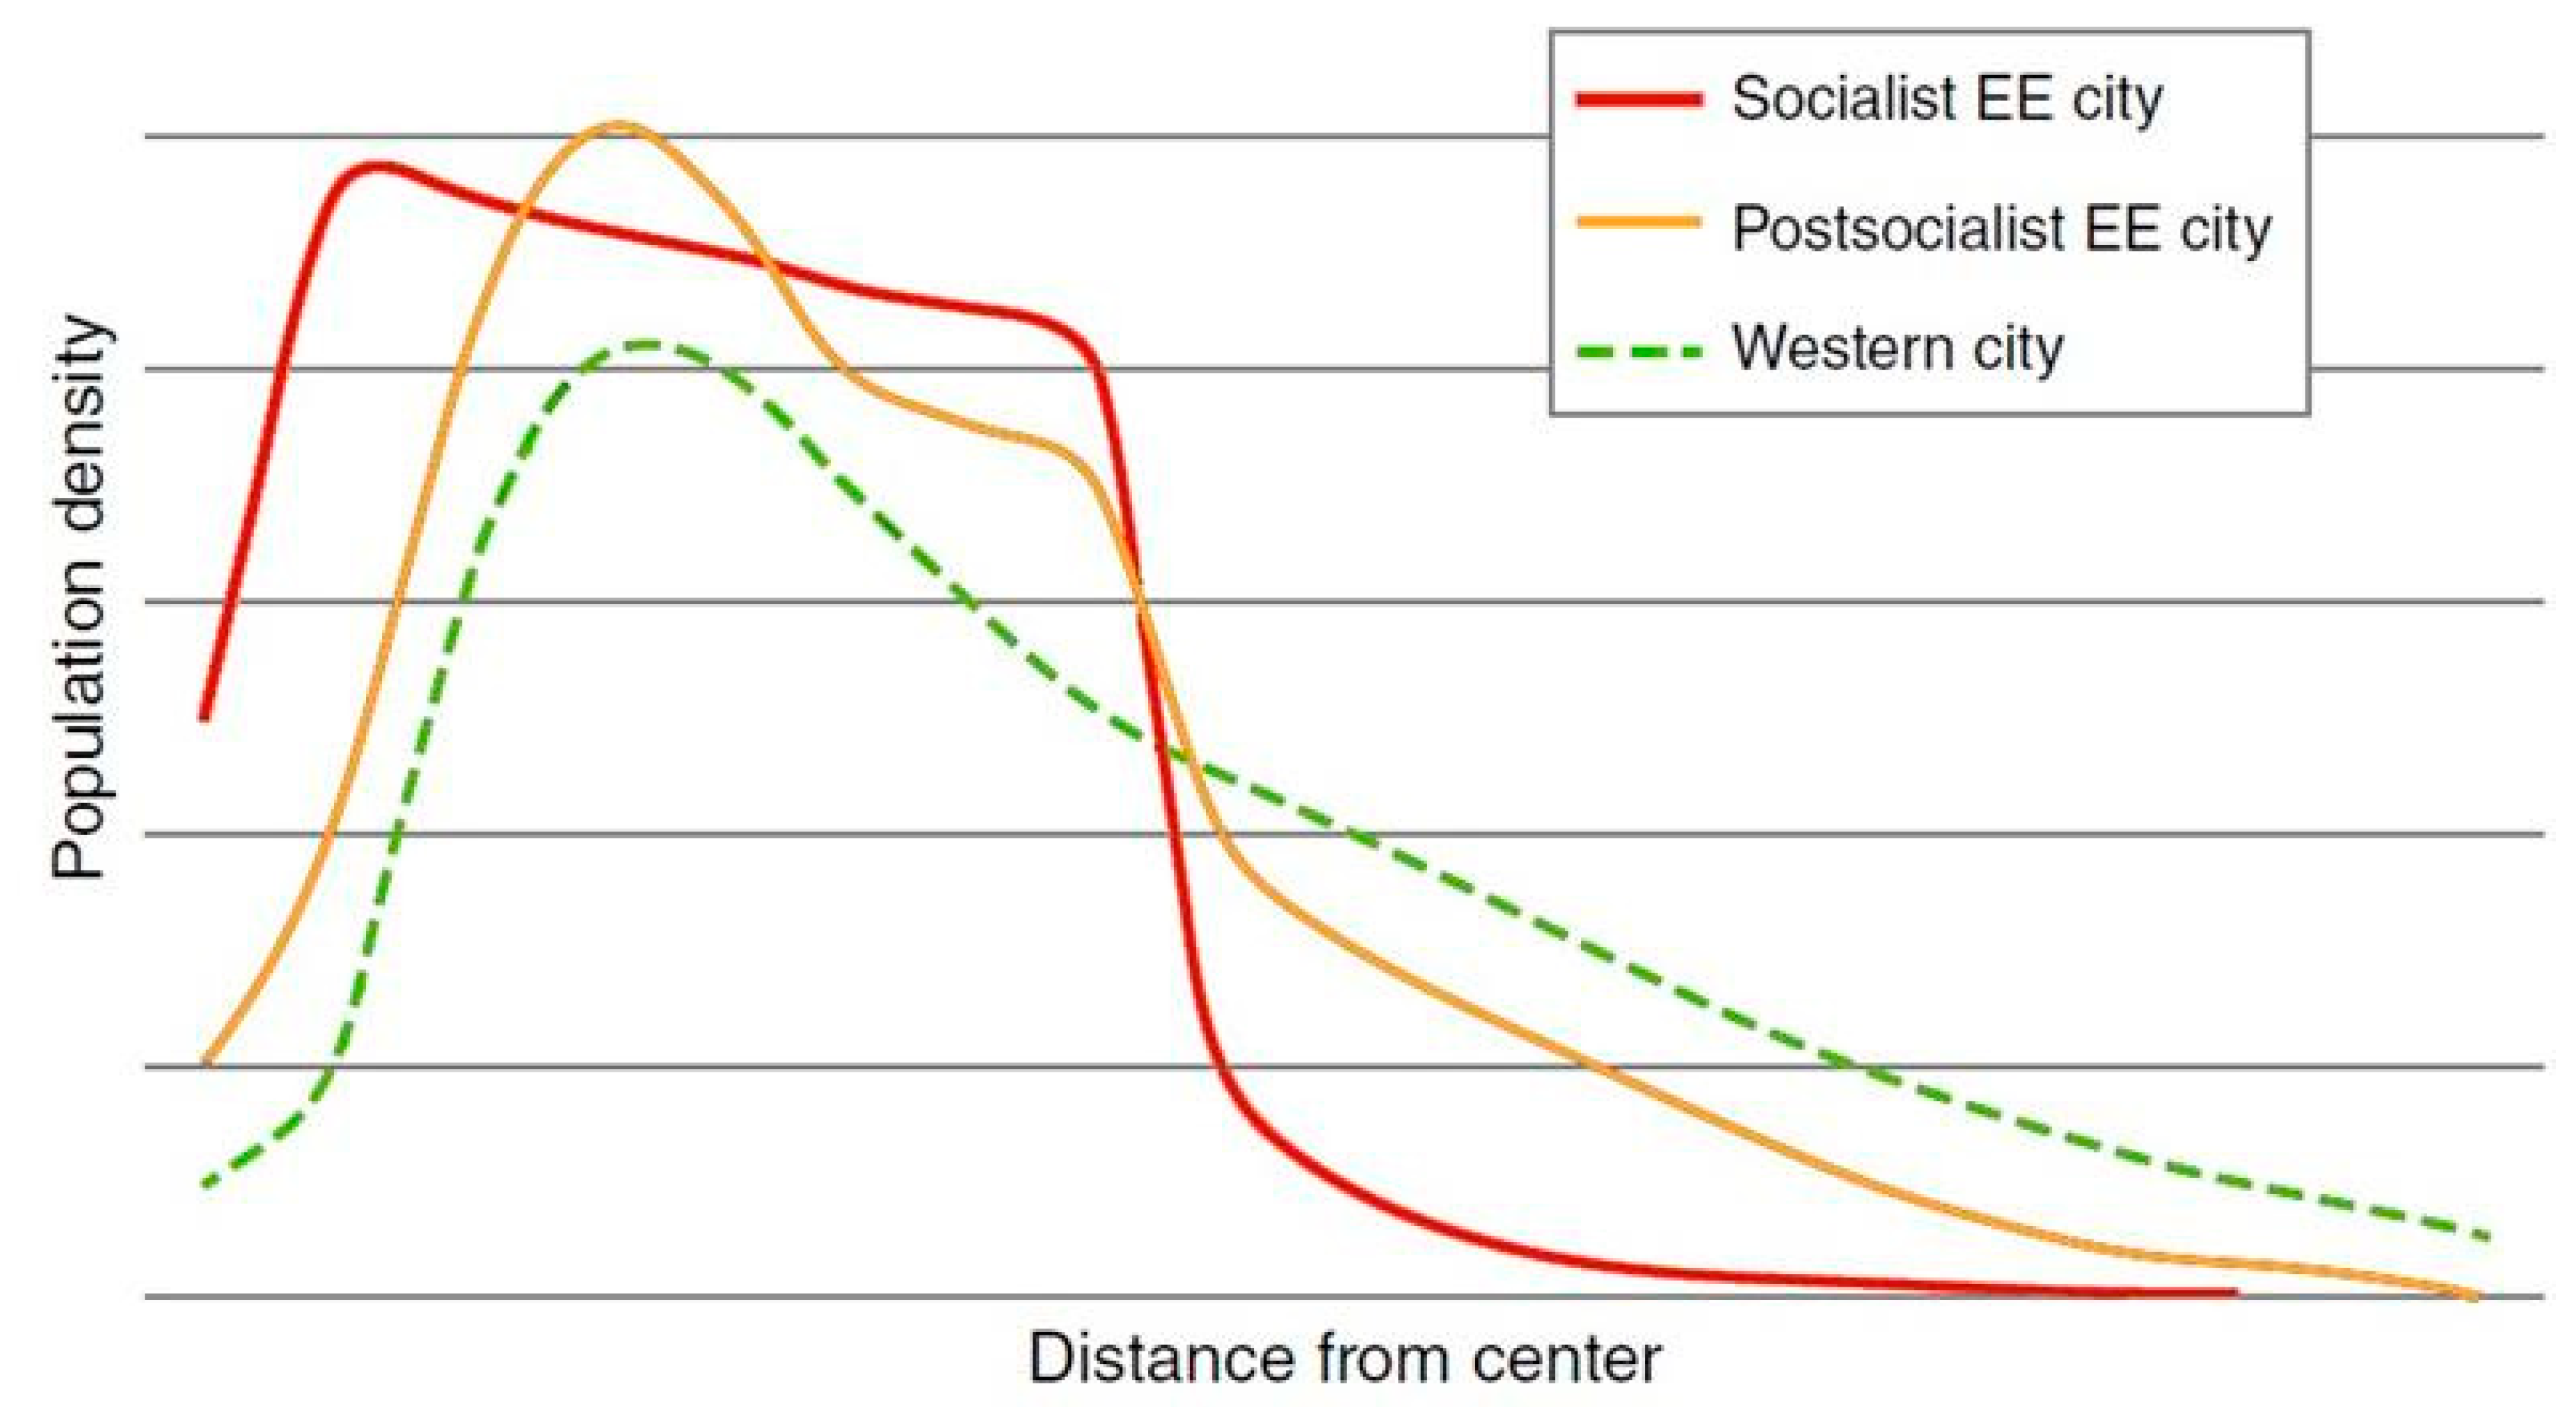
2.2. Inner Suburbanization in Post-Socialist Context

Following the political and economic transitions from centrally controlled planning to a free market economy, suburbanization became one of the most significant territorial processes including its social and economic consequences in the post-socialist countries of Central and Eastern Europe [4,17]. The major transformation of the rural–urban fringe only started with the political and economic transition [36], after the collapse of the strongly state-controlled housing and construction sector [3]. The rapid and uncontrolled suburbanization in the case of the post-socialist urban areas was described as urban sprawl [37]. The obstacles—low levels of car ownership, underdeveloped public services, and rare infrastructural networks in the peri-urban zone—prevented sprawling effects before the political transition, but the phenomena of suburbanization and urban sprawl were already identified at a lower level during the years of communism [8].
As the result of these processes, the formerly compact shape and the well-defined boundaries of post-socialist cities faded gradually caused by the dispersion of built-up areas [2,8,38,39], where fragmented and less regular structures (even chaotic land use) developed [36]. At the same time, the post-socialist suburban territories are characterized by denser and less sprawling patterns compared to capitalist cities—because of the limited financial resources to develop infrastructure and lower level of personal incomes [13,14].
A significant modification of population distribution became visible as the consequence of the processes within the cities and in the peri-urban areas. The functional transformation of city centers caused the erosion of their residential profile; however, the socialist housing estates and the newly constructed post-socialist real estates preserved the importance for the inhabitants living there. Suburbanization (partly intra-urban suburbanization) resulted in an outstanding increase in the population density of the peri-urban zone, causing the formation of a gentle slope in the population distribution compared to the socialist period [4] (Figure 1).
The inner or intra-urban suburbanization is in correlation with the process called ‘hidden suburbanization’ in which former second homes or summer homes became the destination for citizens to reside there [40,41]. The process is frequently out of sight concerning public administration and gained less attention within the relating urban studies. Due to the lack of territorially detailed statistical datasets, most of the investigations primarily focused on settlement level tendencies [16]. However, census data indicated a significant increase in population number in the case of almost every territorial category within the outskirts of towns, whereas the central inner areas were faced with population decline [42].
The post-socialist suburbanization partially differs from that in capitalist countries regarding its motivations too because the social stratification of attached population is more heterogenous. Some of the outskirts—mostly the small garden zones—were the illegal living area of poor people, and after the political transition, it was allowed to move into the small gardens legally [43]. The new residents moving to these parts of the cities represented a large variety of people regarding their age structure, social status, family situation, or even ethnicity [5,43,44,45,46]. Some of the residents must have moved out of the city because of financial constraints or exclusion and some of them were motivated by traditional agricultural purpose. Finally, some of the citizens had the possibility to create an exclusive living environment [5,25,36,46]. However, the poor (or missing) infrastructure and the weak (especially public transport) accessibility resulted in a low level of housing prices in some parts of the urban fringe, which accelerated the immigration of the lower classes of society.
The traditional villages In the surroundings of the cities (those also within the administrative areas) have often been targets for the population moving out of the center and some of them have become prospering, increasingly becoming a destination for the middle and upper classes of the society, and have been characterized by improving social and economic conditions.
The different groups of society shaped their living environments in distinctive ways and, as a result of some local and national policies influencing suburbanization in Hungary, they not only became prospering areas for the middle and upper class of the society but social tensions, segregation, and exclusion, as well in the case of different intra-urban suburban areas [24,36,46,47,48].

2.3. Patterns and Measurement

During the last few decades, various methods were introduced in order to discover and explain the changes caused by the urban sprawl. Most of them were GIS methods, because of the size of the territories analyzed and the up-to-date character of resources. Sentinel [49], Landsat [7], other medium or high spatial resolution satellite imagery [50], orthophotos, hyperspectral imagery [51], Corine Land Cover (CLC) and Corine Land Cover Change (CLCC) databases [52,53,54], and Urban Atlas (UA) status and Urban Atlas Change layer [55] are frequently applied resources.
The multidimensional and complex phenomenon of urban sprawl is measured by various indicators including, e.g., centrality, fragmentation, polycentricity, accessibility, entropy [56], dispersion index [57], or density indicators [11].
Focusing on the types and trends of spatial patterns of urban sprawl, different approaches are found in the related literature, depending on the initial sources of data and on the methods used. Three types of territorial units simplify the categorization of the patterns in which existing built-up land is surrounded by the attached built-up land (with new constructions) and the separated leapfrog developments [57].
Urban growth classes are listed as defined by Wilson et al. [58] in addition to the already-existing urban territories:
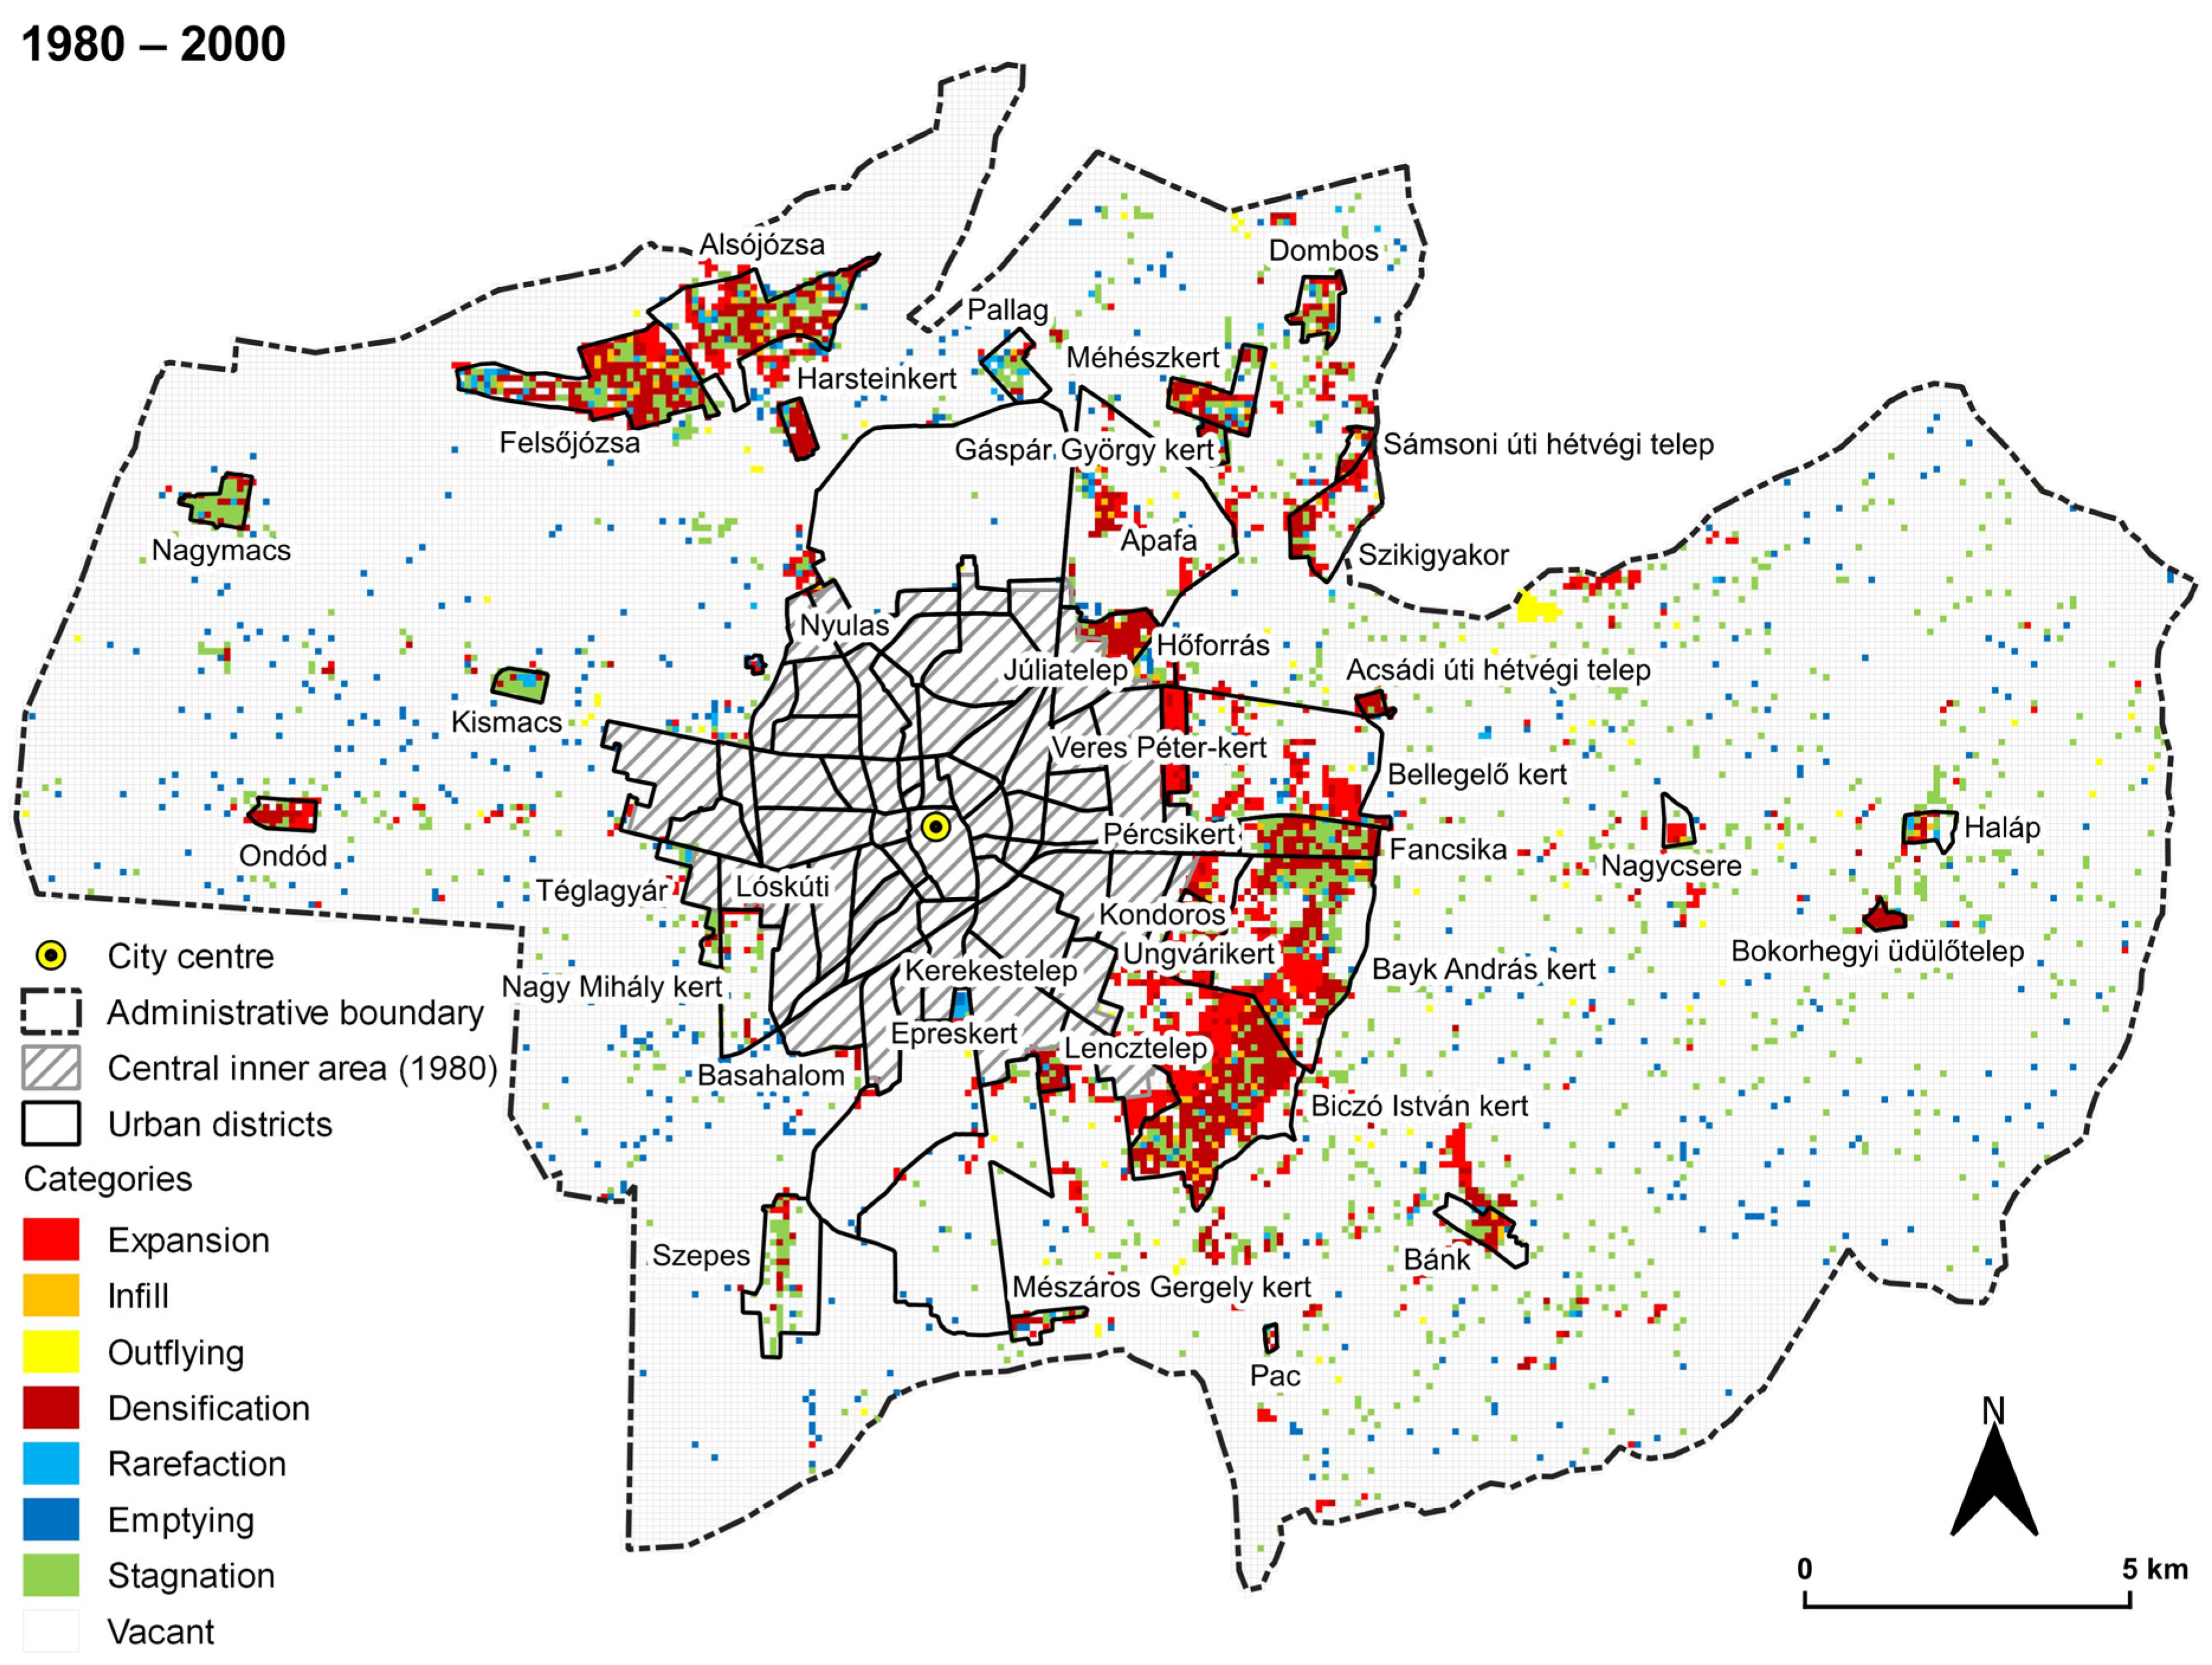
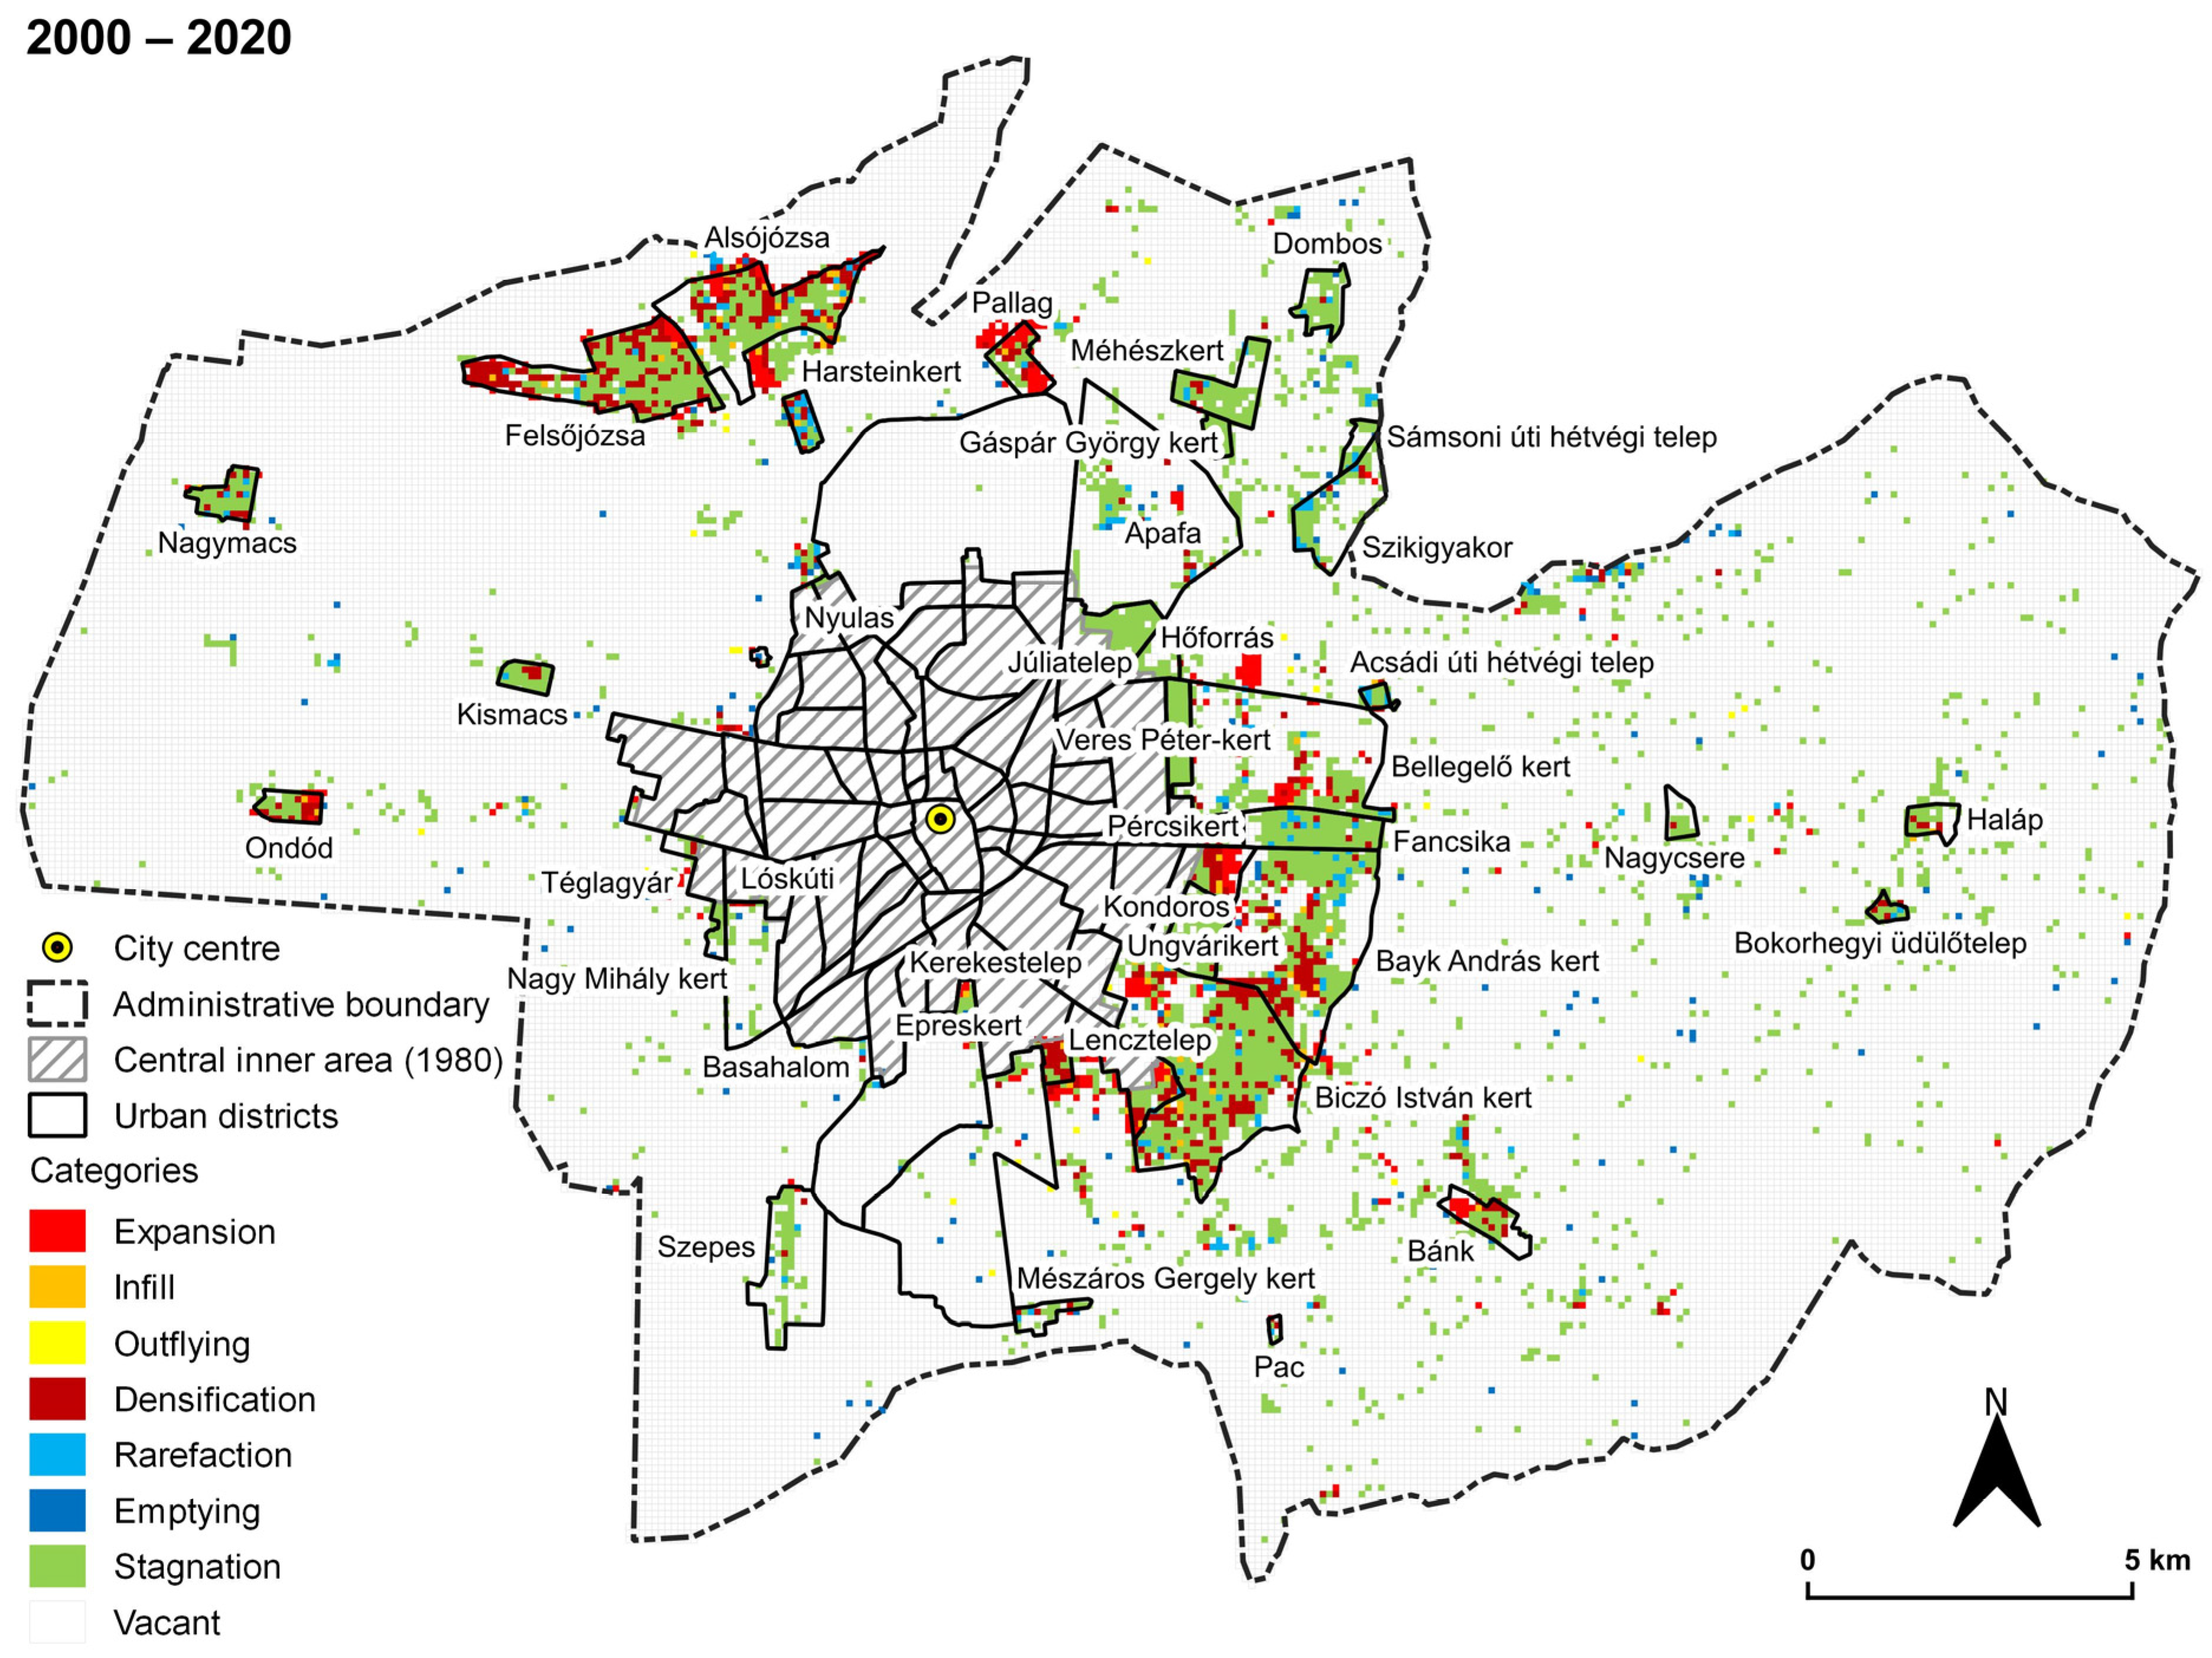
  • Infill is described as the development of a piece of land mostly surrounded by urban land cover;
  • Expansion growth which has been known as urban fringe development. It is the expansion of the existing urban territory towards areas surrounded by no more than 40 percent of urban zones.
  • Outlying growth is also called development beyond the urban fringe and three classes are separated within that:
    • Isolated growth means formatting of urban parcels some distance from the existing developed parts—sometimes it means the construction of one building;
    • Linear branch appears in the form of a new linear-like development (e.g., road, corridor) that does not attach directly to the existing urban territories;
    • Clustered branch means an island-like and large development (not only isolated constructions). This type of growth is also called leapfrog or scattered development [58].
Urban sprawl characteristically manifests in the patterns of large expanses, and ribbon (or strip) and leapfrog development [20]. These growth characteristics of urban areas are in relation to the landscape transformation processes representing controversial tendencies in the forms of fragmentation and reduction in non-developed (meaning not urban) land cover types [59,60]. Different types of urban built-up land sprawl tend to associate with characteristic spatial patterns—newly constructed residential areas represented radial sprawl, commercial areas formed ribbon sprawl (linear branch or strip development), and industrial zones reflected leapfrog character [61]. However, urban sprawl cannot be labelled as a continuous and unidirectional increase in built-up areas, because post-socialist cities are characterized by different tendences in this respect [7] and the rural–urban fringe might represent divergent trends in their development [36].

3. Materials and Methods
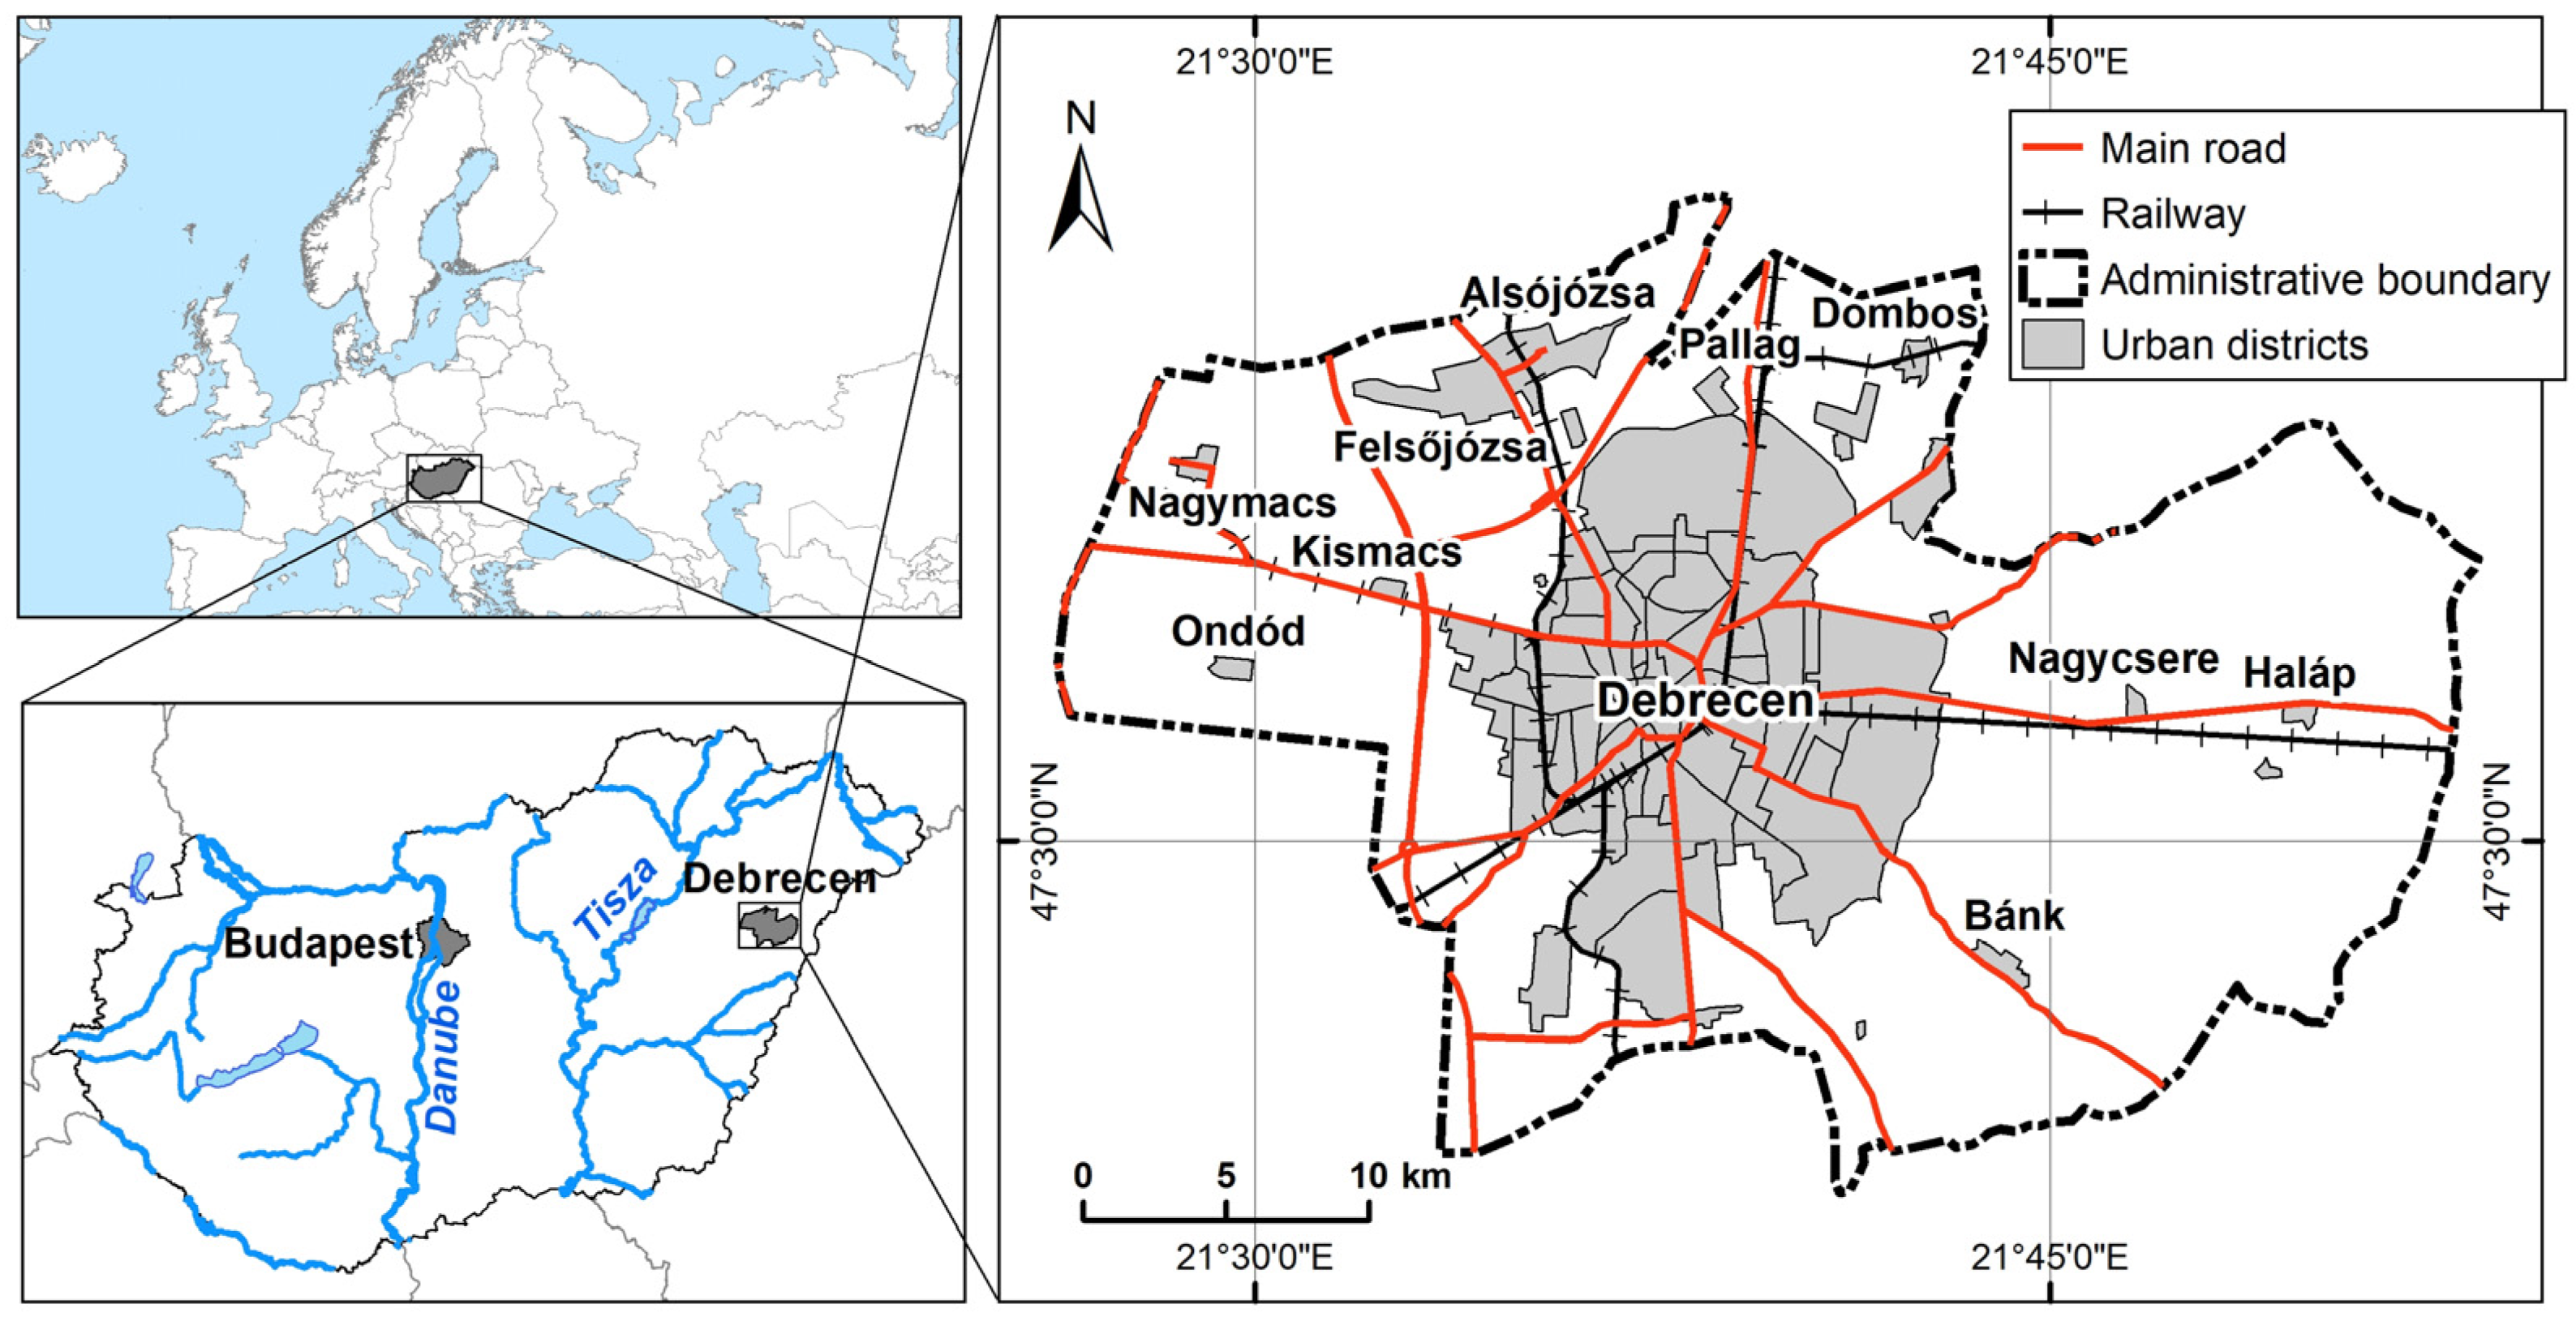
3.1. Study Area

Debrecen is the second largest city in Hungary regarding its population (199.520 inhabitants in 2022) and the third largest concerning the administrative area (461.7 km2) located in the Great Hungarian Plain. In addition to its central inner area, there are 10 other inner areas and 22 named outskirts (Figure 2). The large administrative area and the outskirts ensured enough space for suburbanization within the boundaries of Debrecen as well, in addition to the surrounding settlements [62]. The city itself has a relatively stable number with regard to population, and major industrial investments have taken place in the last few years, e.g., BMW, Krones, ThyssenKrupp, Continental, Semcorp, CATL, Eve Power [63]. The impact of the ongoing grandiose constructions of industrial sites and the related infrastructural elements was not included in the current study.
Debrecen and its hinterland typically represent the average migration tendencies in relation to suburbanization during the post-socialist period [64]. Significant migration surplus and population growth was detected in the hinterland of Debrecen during the 1990s that slowed down after the millennium and turned back as the consequence of the financial and economic crisis in 2008–2009. However, a rapid increase was detected in the number of residents again from 2019 due to the governmental family and housing policy (that was accelerated by the COVID-19 pandemic through the rising demand for detached houses).
Debrecen, due to its extended administrative area, has significant intra-urban processes regarding the changes in the distribution of residents and in built-up areas. The restructuring of the population within Debrecen clearly demonstrates the intra-urban suburbanization process [65]; some of the other inner areas (Józsa) and outskirts (Biczó István-kert and Bayk András-kert) faced the most intensive population growth among these groups of territories in Hungary after 1990 [18]. Population tendencies of the central or central inner area and other inner areas with the outskirts are characterized by opposite changes (Table 1). These facts confirm the importance of the research focusing on the intra-urban suburbanization within Debrecen.
The spatial structure of the city is determined by the border of two landscapes. Hajdúság to the west represents a loess plateau landscape, and Nyírség to the north and east is a lowland covered with sandy soils [68,69,70]. The former has typically fertile Chernozem soils ideal for arable farming, croplands, whereas the latter is less fertile where forest cover exceeds 40 percent. Nyírség is more fragmented and characterized by a large number of farms (the typical Hungarian ‘tanya’) [42]. These land-use characteristics are also important regarding the processes of the rural–urban fringe in the surroundings of Debrecen.
During this work, we focused on the administrative area of Debrecen excluding the central inner area (according to its boundaries in 1980, because the administrative extension of the central inner area has covered some spatial changes since then). Due to this extended area encircling the former inner area, the rural–urban fringe was assumed to be covered completely (with these modifications, the study area covers 45.53 km2).

3.2. Data Sources

As part of our analysis, several datasets and sources were applied. The most detailed resident population dataset based on a grid cell of 100 × 100 m (1 hectare) was provided by GeoX Ltd. (Budapest, Hungary) (for 2010 and 2020) [67] (this dataset was involved in some recent studies, e.g., [71]). Only those cells were included in our analysis where at least one resident was registered. Due to the limited timeframe, this dataset was not appropriate to cover the period of post-socialist transition.
In order to analyze the processes since the years of socialism, a specific dataset was developed. The authors vectorised 34 sheets of geo-referred .jpeg format topographic maps (scale 1:10,000) covering the study area [72]. The originally paper format sheets were created between 1978 and 1987 and maintained by Lechner Knowledge Centre (Kovács et al. [8] also used topographic maps in the case of the Budapest Metropolitan Region, but on a larger aggregation level). Paper format cadastral maps [36] (scale 1:4000) were used to validate the objects on the level of parcels (these were recorded during several years in the early 1980s—in order to simplify, we hereafter refer to this period as 1980). One single point was vectorised in every individual parcel with at least one visible/detectable building not regarding its function or size (these attributes could not be identified from the maps). This approach resulted in the creation of point layers appropriate to conduct further analyses—including point density or transport accessibility measurements. During this work, we focused on the administrative area of Debrecen excluding the central inner area (according to its boundaries in 1980, because the administrative extension of the central inner area has covered some spatial changes since then).
The second observed year was 2000, to which colour orthophotos of FÖMI [73] (Institute of Geodesy, Cartography and Remote Sensing—nowadays, it is maintained by the Lechner Knowledge Centre) were used with the help of the Quantum GIS’ Quick Map Services plugin.
Point layer for the recent situation was created on the basis of Google Satellite Hybrid layers (for 2019–2020) [74] and OpenStreetMap (OSM) [75] layers and we validated the points by the digital building plan of the Local Government of Debrecen (maintained by the ERDA Kft. company) [76]. The analysis of the point layers (from 1980, 2000, and 2020) provided the possibility to detect the changes in the built-up areas in the rural–urban fringe by the location of points (we refer to these points as objects).
Grid network is appropriate to transform different spatial datasets into a common territorial structure with aggregation or disaggregation [77,78,79,80,81]. In order to create a comprehensive and common basis for the calculations, the point layers were aggregated into the 100 × 100 m grid network which contained the population data; however, in the case of the objects, the whole administrative area was converted into grid cells. The aggregated points within the cells are, in fact, object density values. Altogether, 42,588 cells were constructed and the objects for three periods were aggregated into these. On the basis of these layers, the changes between 1980 and 2000, and also between 2000 and 2020, became detectable.
Vector layers of the Corine Land Cover Change (CLCC) databases (1990–2000, 2000–2006, 2006–2012, 2012–2018) [82,83,84,85] were applied to analyze urban growth. It is important to note that we could only use those data of land cover/land use gained from the Change databases to analyze the changes between the periods [86,87], because the Corine Land Cover status layers contain only those patches larger than 25 hectares or those lines broader than 100 m. It is approximately equal with the scale 1:100,000 [86,87]. The smallest included unit in the CLCC databases was 5 hectares; furthermore, it also contained those spatial relocations of the patches’ outlines exceeding 100 m during the mapping of changes (a scale of about 1:50,000) [86,87]. These databases about land cover and its changes are made of vectoring and visual interpretation of medium and high-resolution satellite images [88], but computer-assisted image interpretation has also been used to create and validate the databases since 2000 [87].

3.3. Methods

The most detailed resident population dataset based on a 100 × 100 m grid cell was applied to model population distribution in Debrecen (de Smet and Teller [78] obtained convincing results even with 200 × 200 m resolution). We calculated the Euclidian distance (in meters) between the cell centroids and the center of Debrecen (Kossuth square), in order to detect the change of the population distribution and density in relation to the distance from the center. Population-density calculations were accomplished in the case of those cells with a minimum of 1 resident. Similarly, the number of objects within the cells was also summarized according to the distance.
More GIS-based methods were used to detect the most important characteristics of the transformation of the urban fringe in the surroundings of Debrecen. Kernel density estimation is one the most promising tools to analyze point patterns and their temporal changes [61,89,90,91] or even their modelled future trends [92]. In the current analysis, Kernel density estimations were run to process the point layers from the three investigated years (1980, 2000, 2020), in order to detect the growth and patterns of territories with residential function at the expense of the primarily agricultural areas. Kernel density layers were made with a resolution of 1 m due to the availability of large-scale topographic maps and to the fine resolution of orthophotos and satellite images, which were the basis of vectorizing the point layers. Kernel density change maps were edited to analyze the spatial and longitudinal transformation of the object density and the built-up areas.
After taking the preliminary experience into consideration, specific categorization was implemented instead of the described ones [20,57,58] to typify the grid cells according to the changes in the density of objects. A remarkable increase was seen in the number of objects during the period; however, the number of cells representing decreasing built-up areas was not negligible. The initial value and the location of the cells were also important factors regarding the typifying. For this reason, the following categorization was applied in the case of the grid cells:
  • Expansion—newly built-up cells having a maximum of 50 percent of built-up neighboring cells (using Queen-contiguity in the definition of direct neighborhood);
  • Infill—newly built-up cells having more than 50 percent of built-up neighboring cells;
  • Outflying—newly built-up cells without built-up neighboring cells (leapfrog development);
  • Densification—increasing object-density in the already built-up cells;
  • Stagnation—stagnating object-density in the already built-up cells;
  • Rarefaction—decreasing object-density in the already built-up cells;
  • Emptying—disappearance of objects from previously built-up cells;
  • Vacant—empty cells without objects.
More than 42,000 cells of the delimited urban fringe of Debrecen were included into the listed categories on the basis of the layers for the year of 2000 (to detect the post-socialist processes between 1980 and 2000) and for 2020 (to discover the changes after the millennium). On the basis of the categorization of cells, the different types of built-up areas were separated and the most important spatial tendencies became interpreted.
A circle with one kilometer radius covered the city center and a buffer between 1 and 3 km included the most important urban parts of the city. The edge of the central inner area (according to the state in 1980) was between 3 and 5 km from the center, which is regarded as “rural–urban fringe zone I”. The second zone called “rural–urban fringe zone II” between 5 and 7 km was characterized by mostly small gardens within Debrecen (at the Eastern part of the city). “Rural–urban fringe zone III” contained some of the traditional villages of Debrecen (e.g., Pallag, Alsójózsa, Felsőjózsa) and “rural–urban fringe zone IV” included sporadic settlement structures.
The growth of the residential areas and the functional changes were described in the current study by the changes of land cover/land use categories at the edge of Debrecen’s central inner area, in relation to the other inner areas and outskirts. In order to achieve these objectives, we filtered the polygons of the administrative area of Debrecen and the Corine Land Cover Change databases. On the basis of these, the types of land cover/land use were detected within the study area, the patches of which transformed during the urban growth and dissolved into the newly formed mosaics of residential and recreational classes of land cover/land use. The matrix of land cover/land use classes were created for this purpose (Table 2). The territorial extent and types of the changes in the land cover/land use were quantified for the following periods: 1990–2000, 2000–2006, 2006–2012, and 2012–2018.
Quantum GIS 3.22.16 (Białowieża), ArcGIS Desktop 10.8.1 software, and MS Excel were used during the analyses.

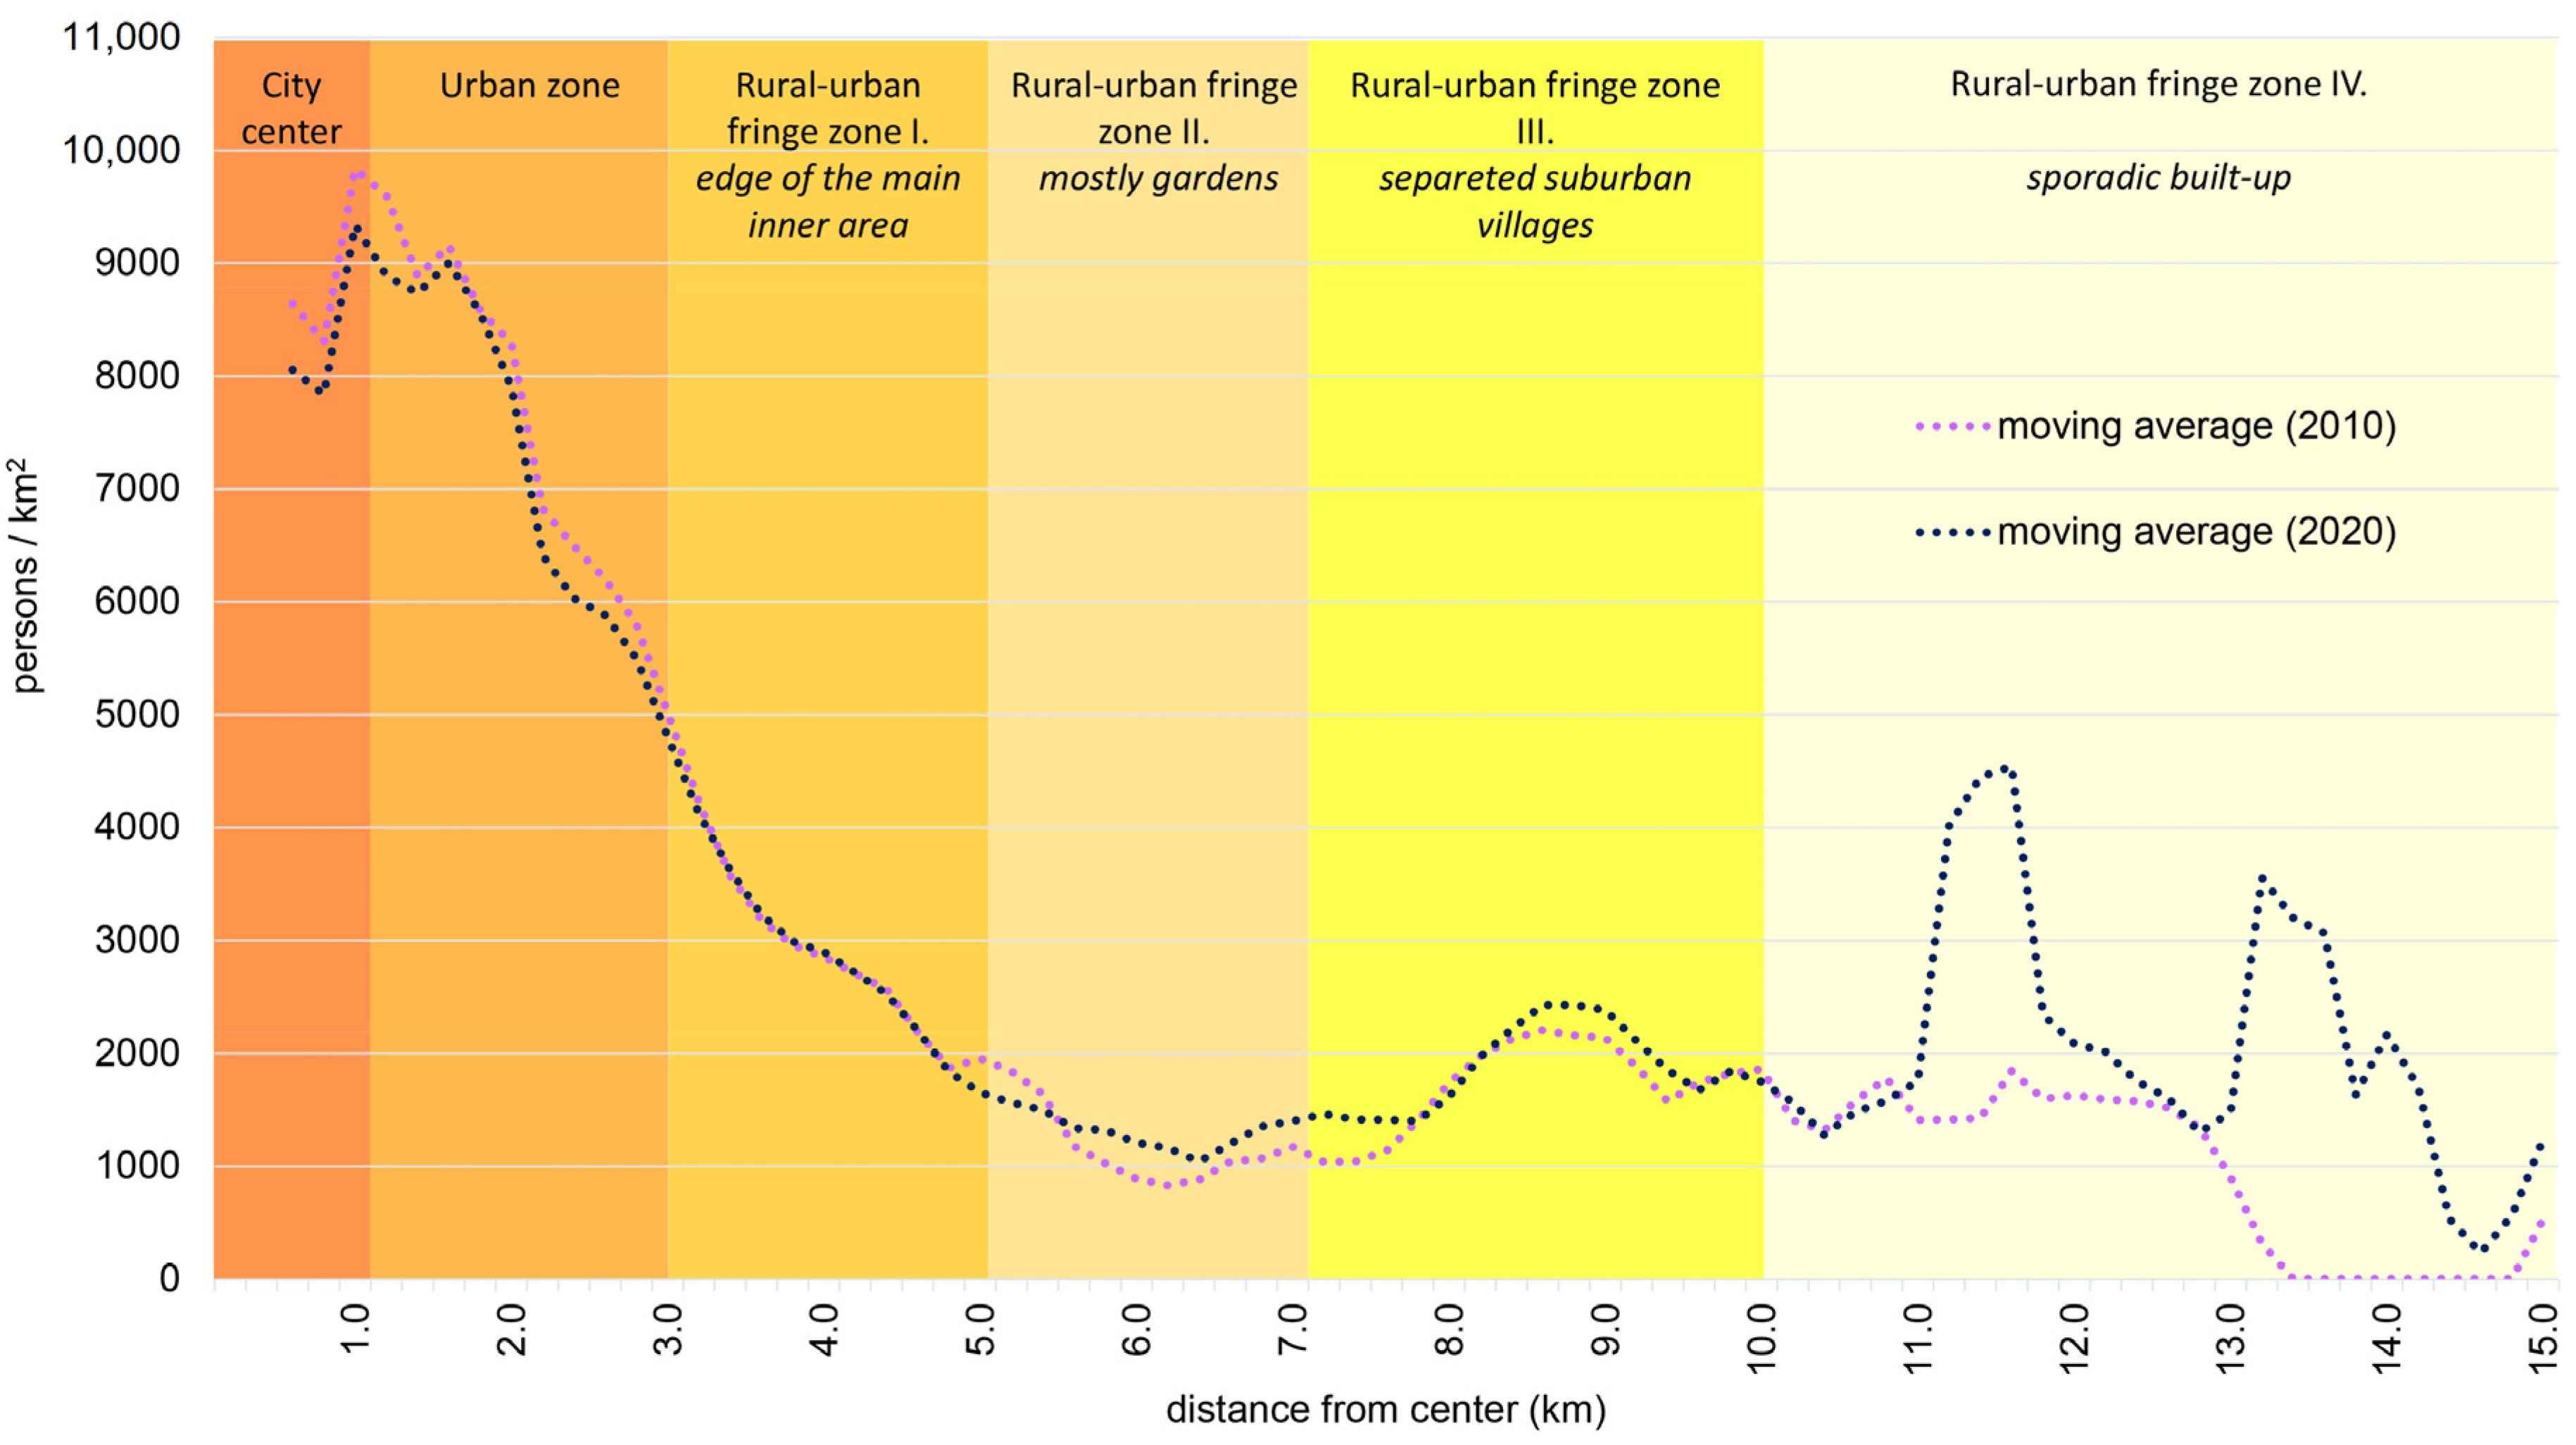
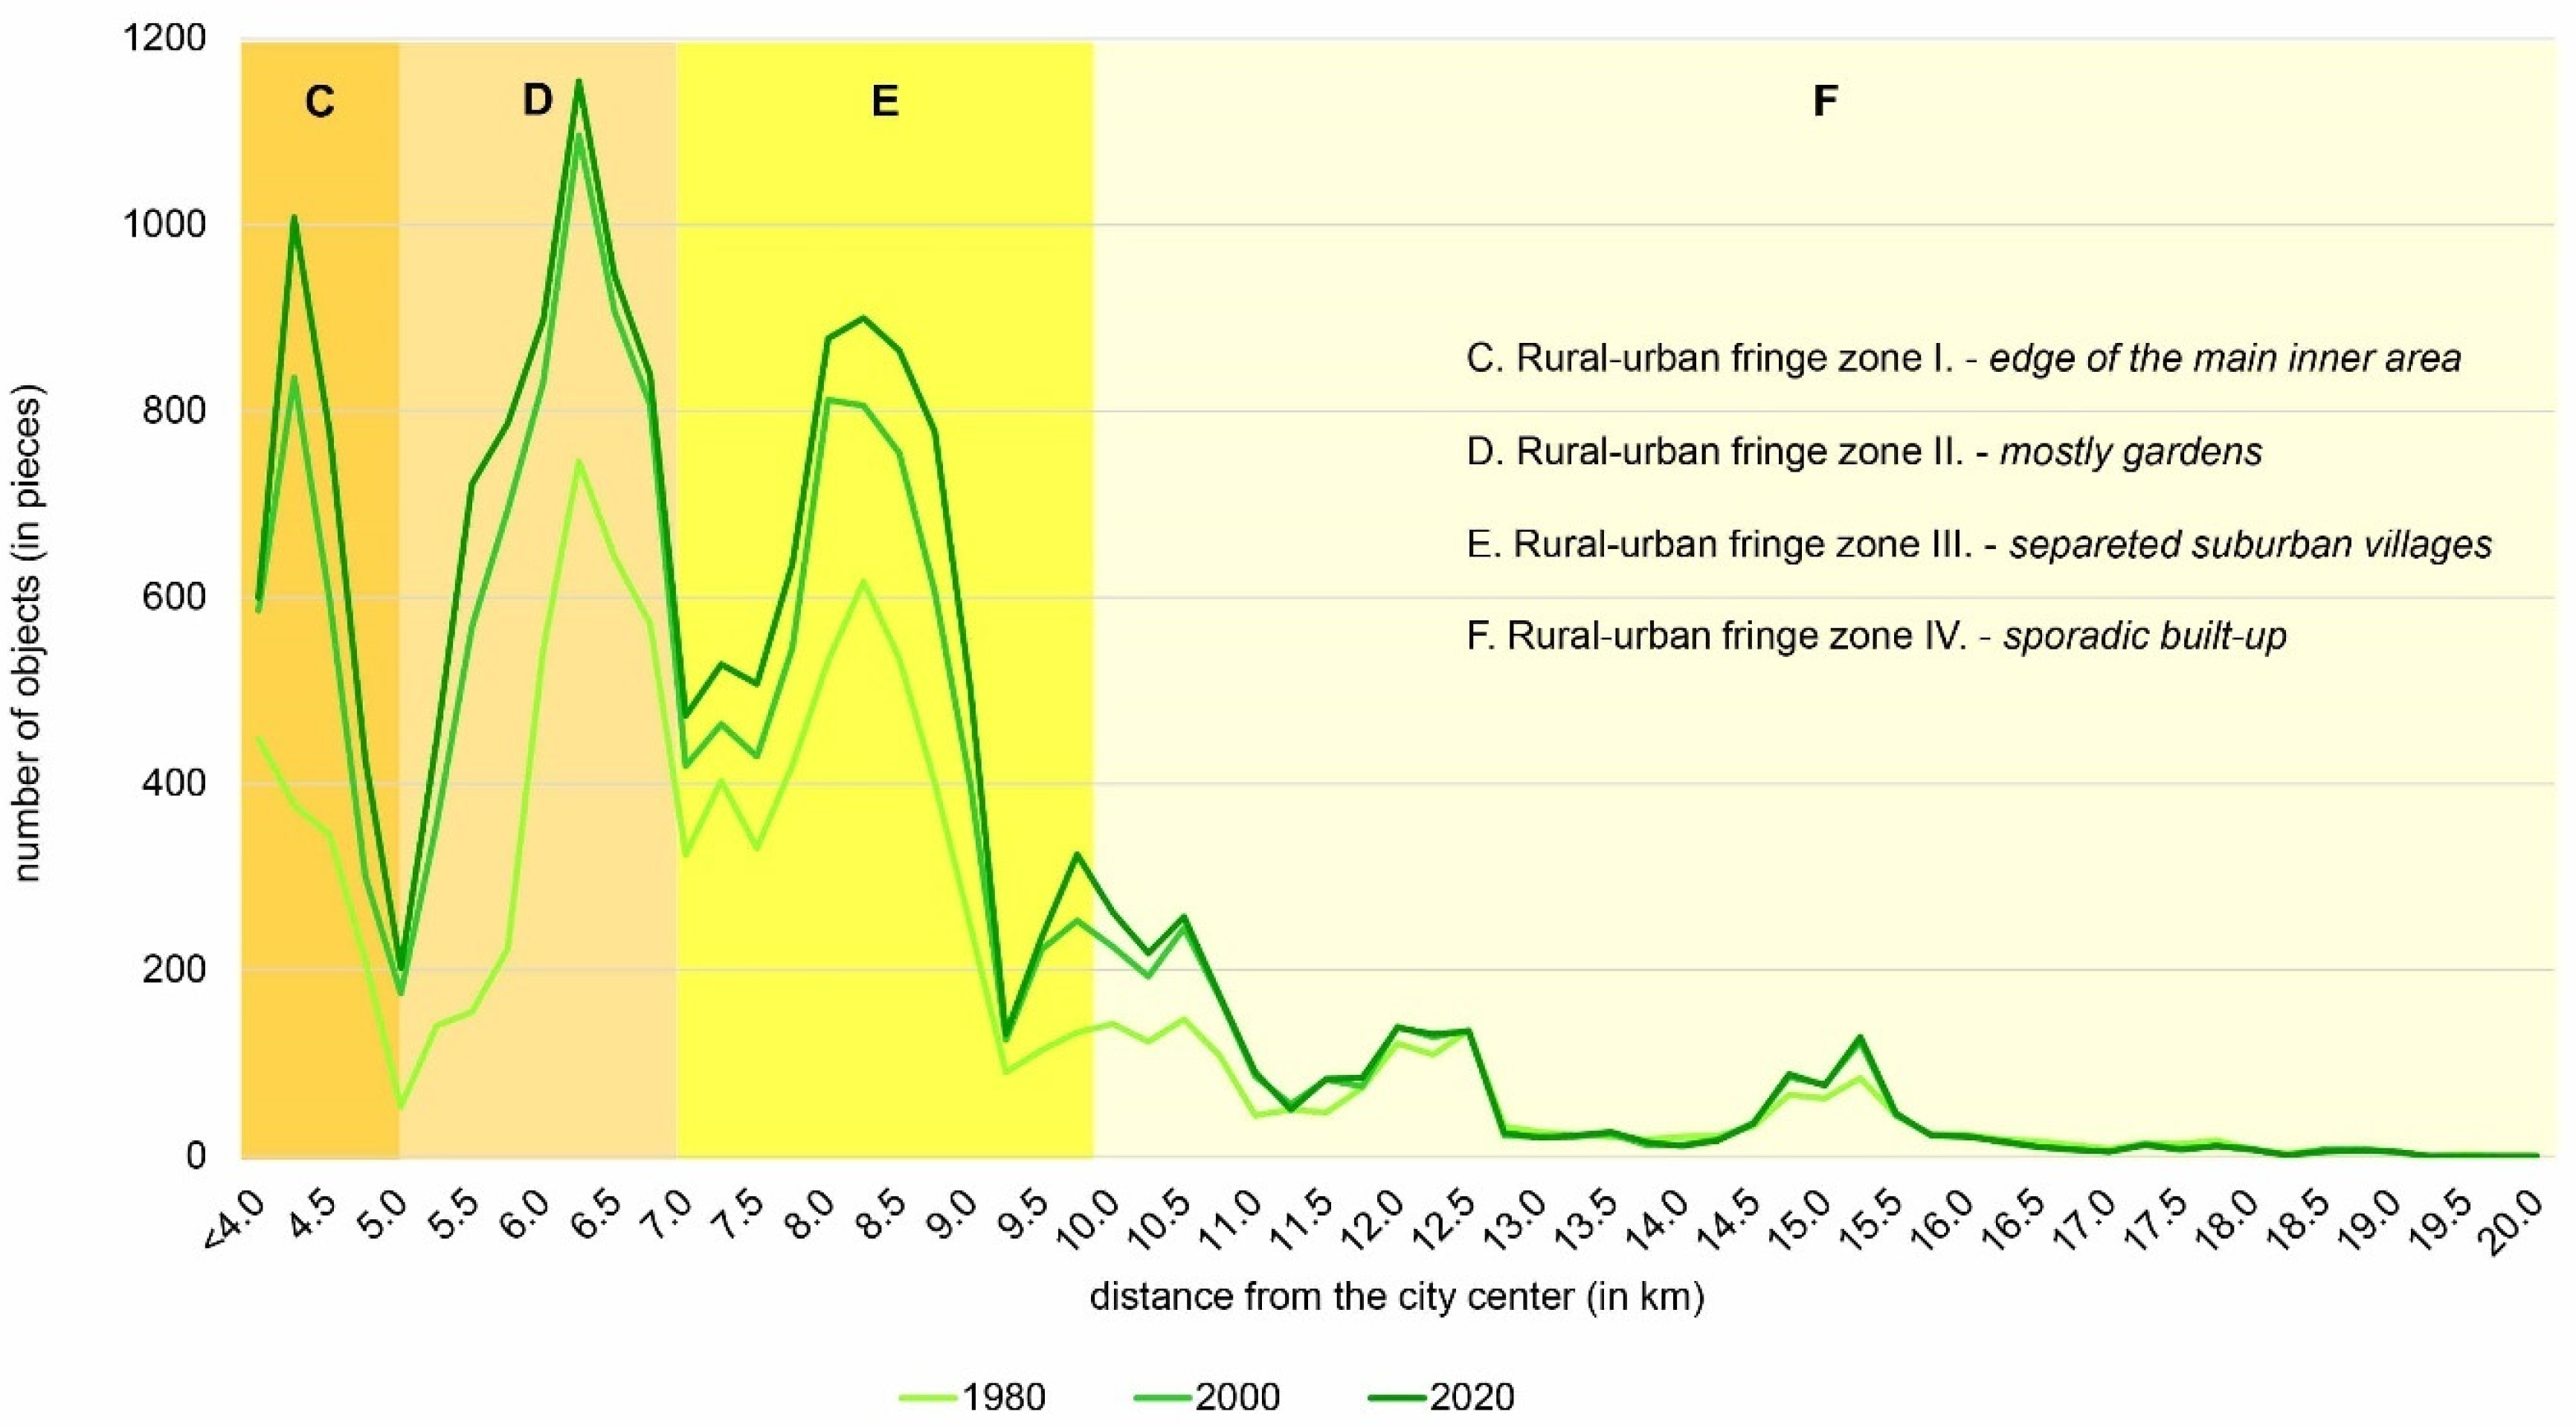
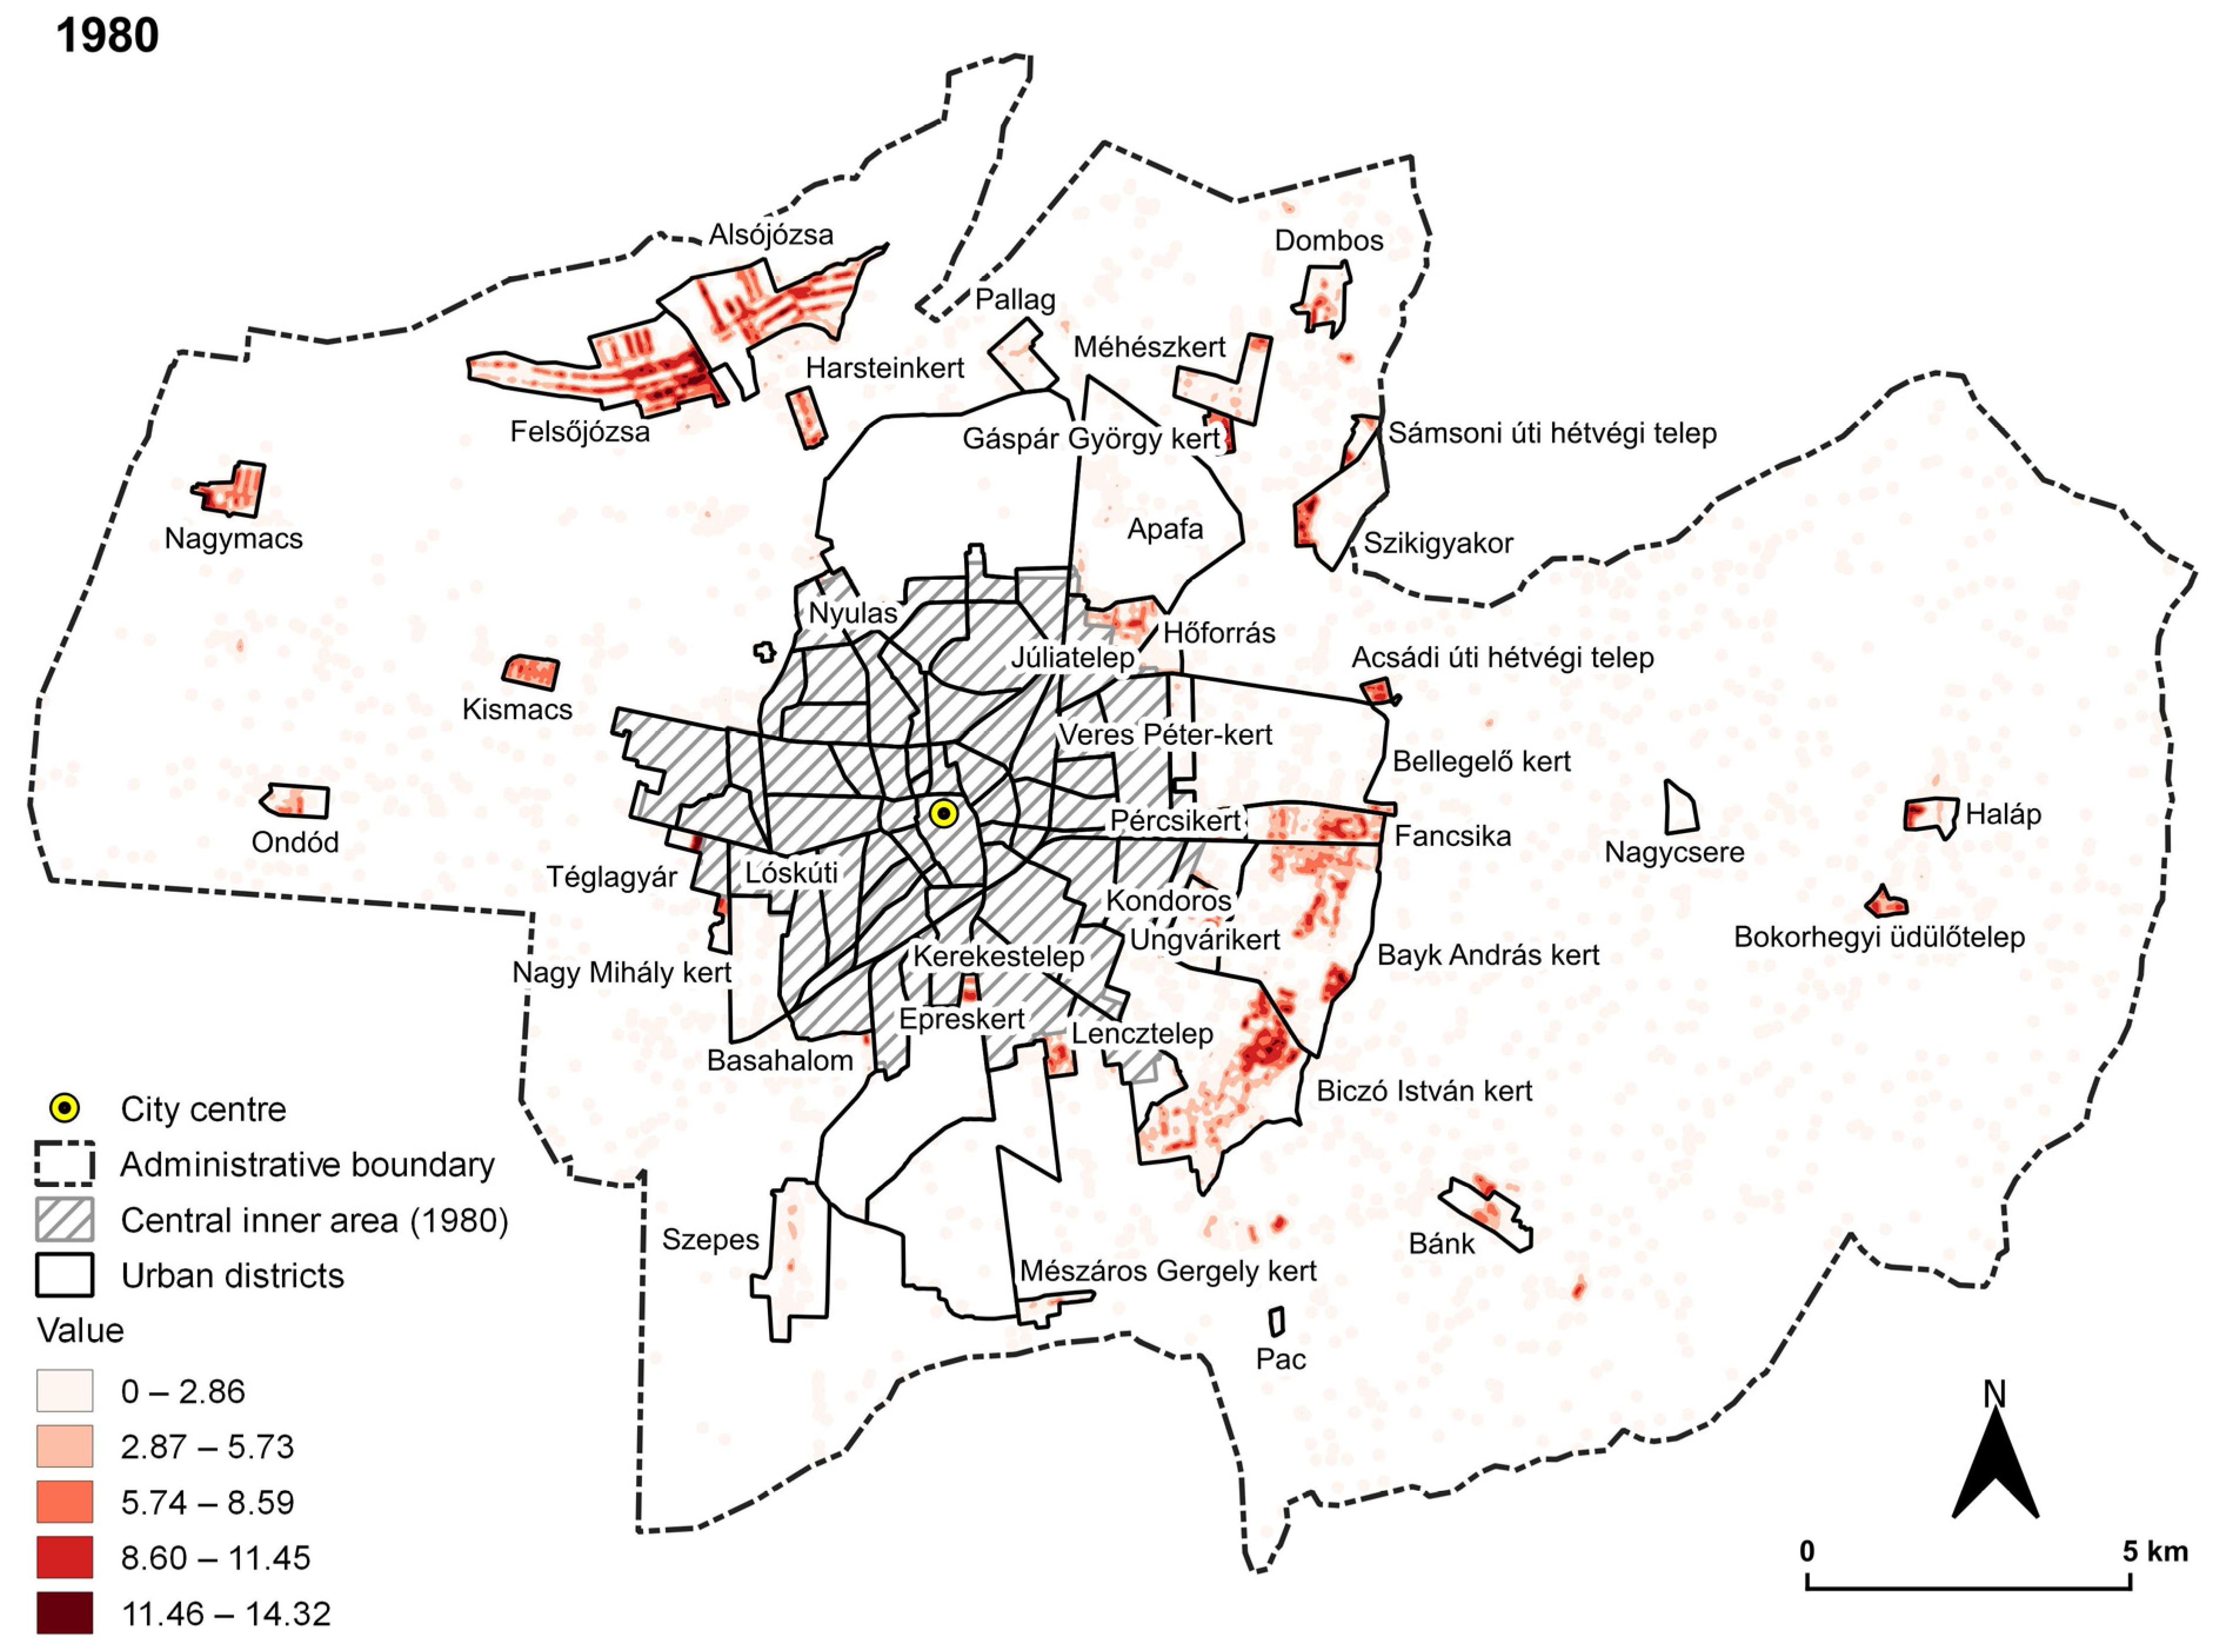
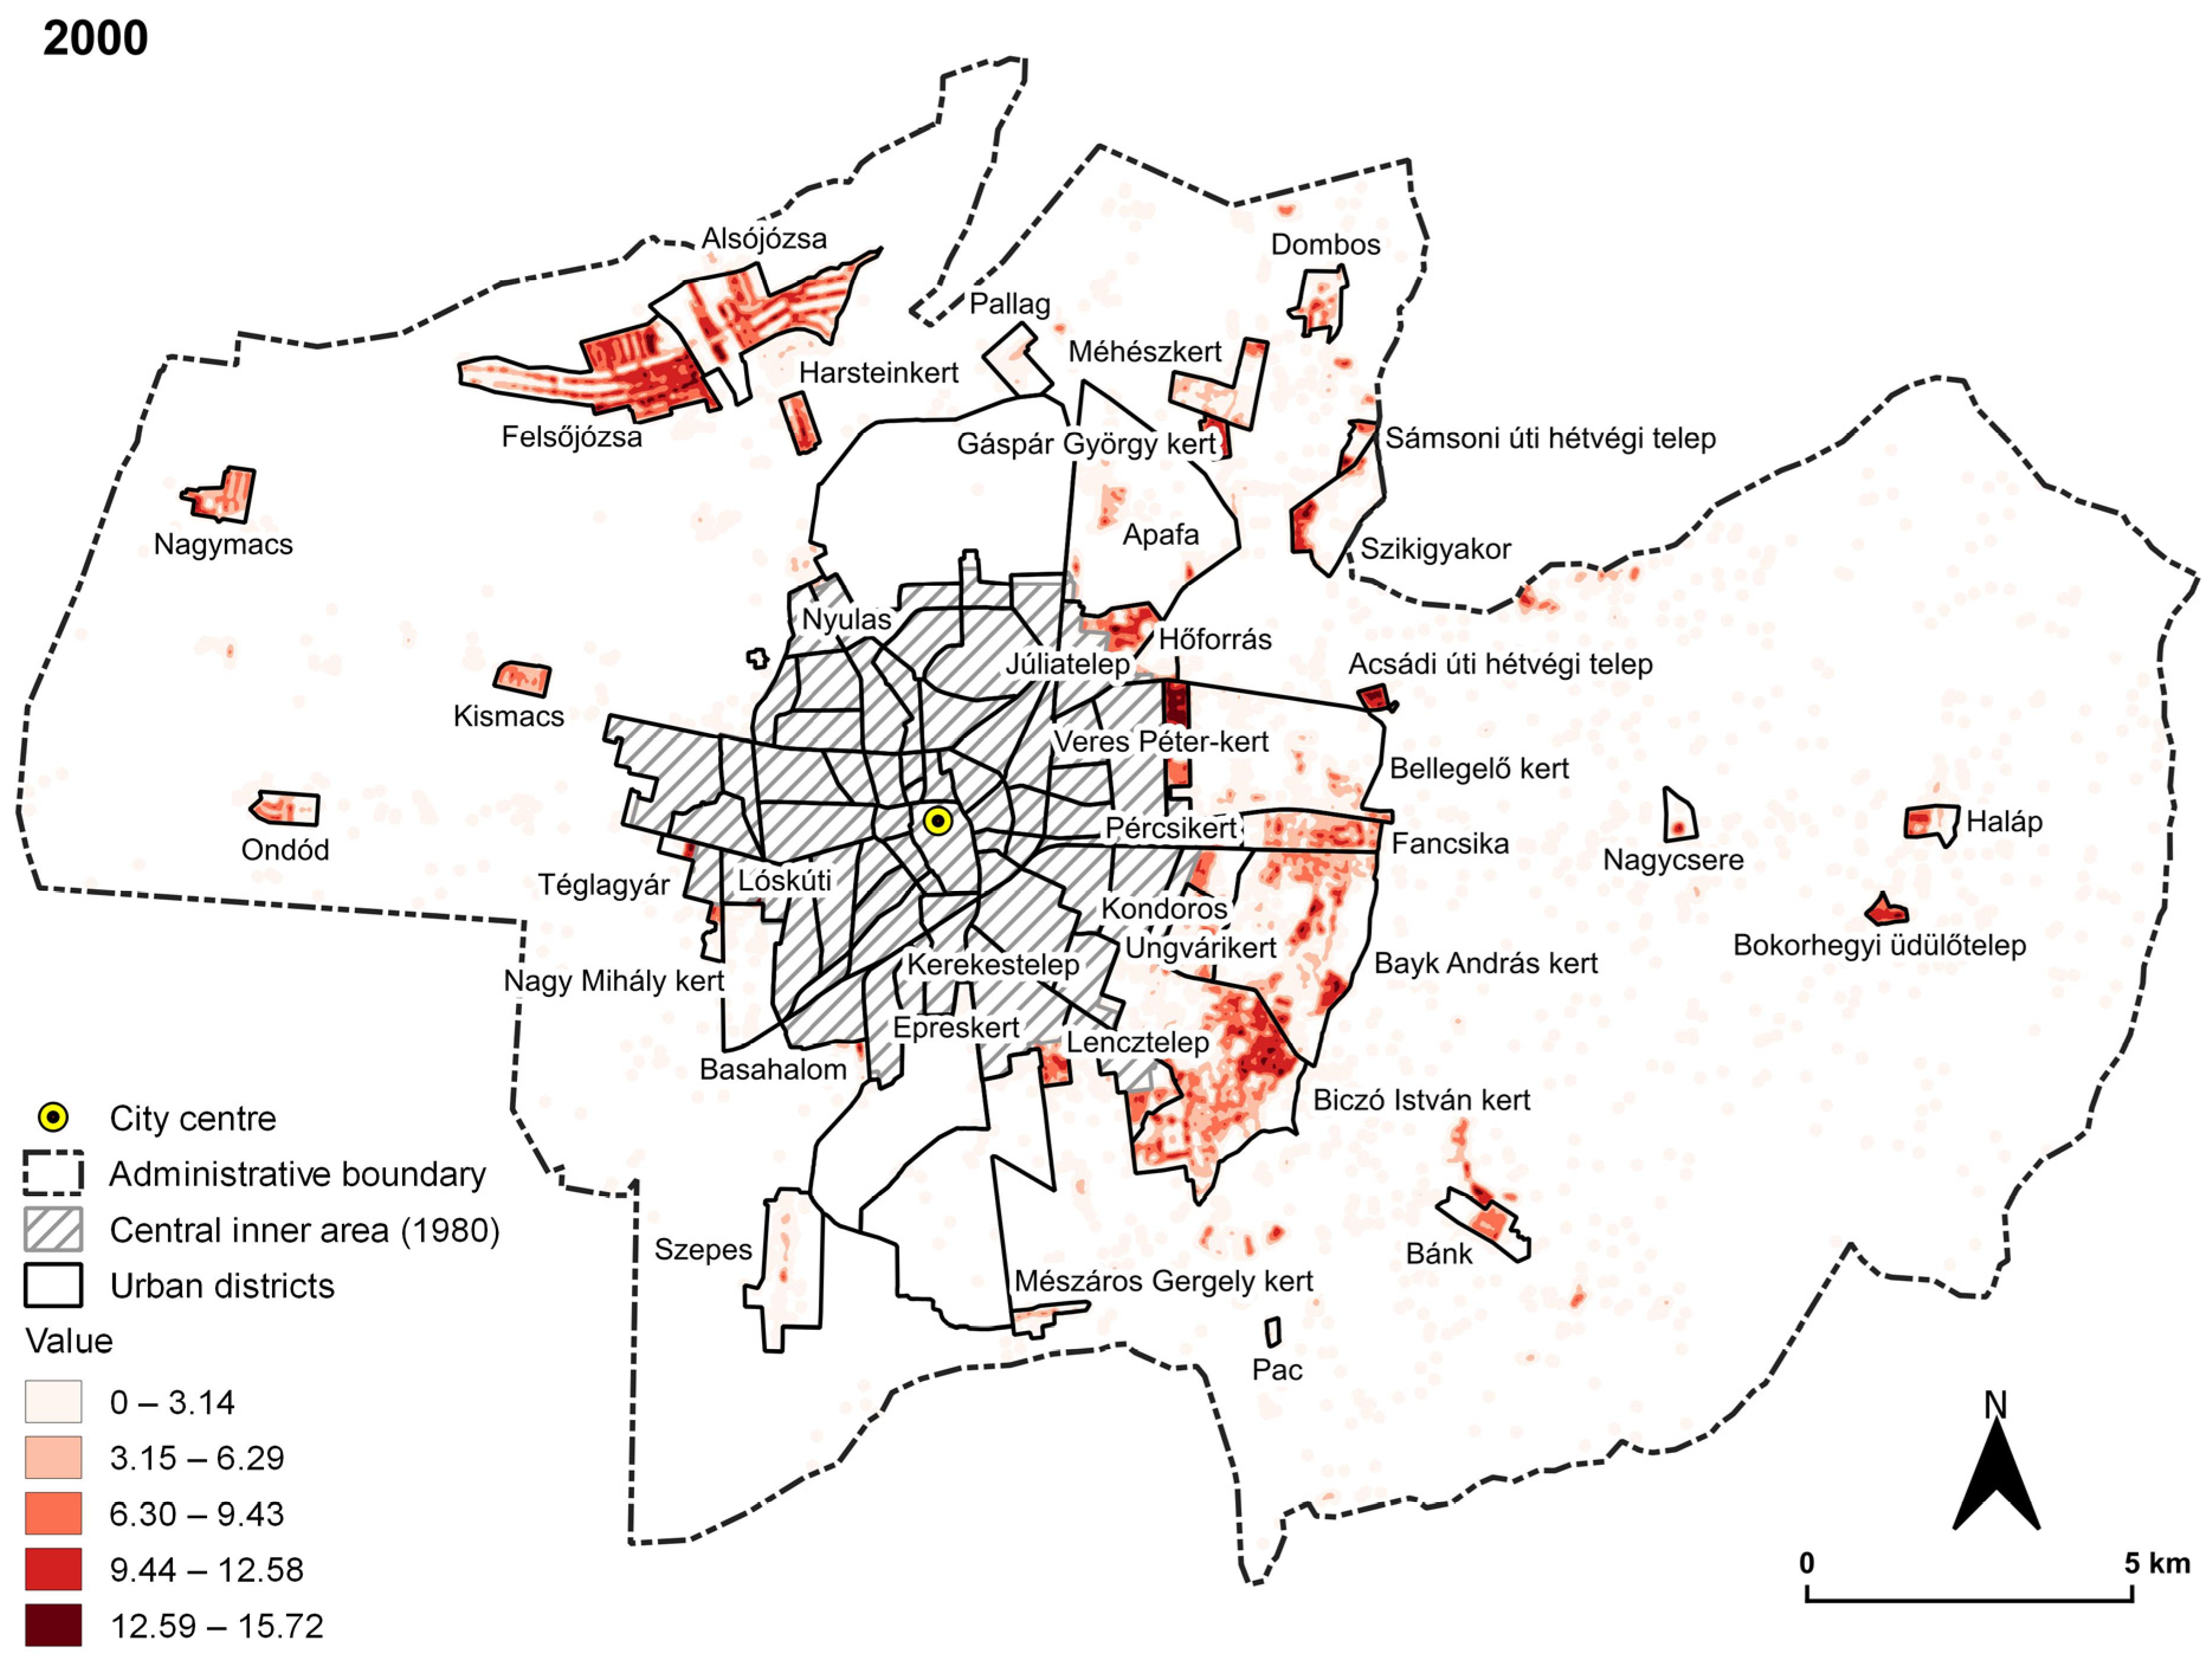
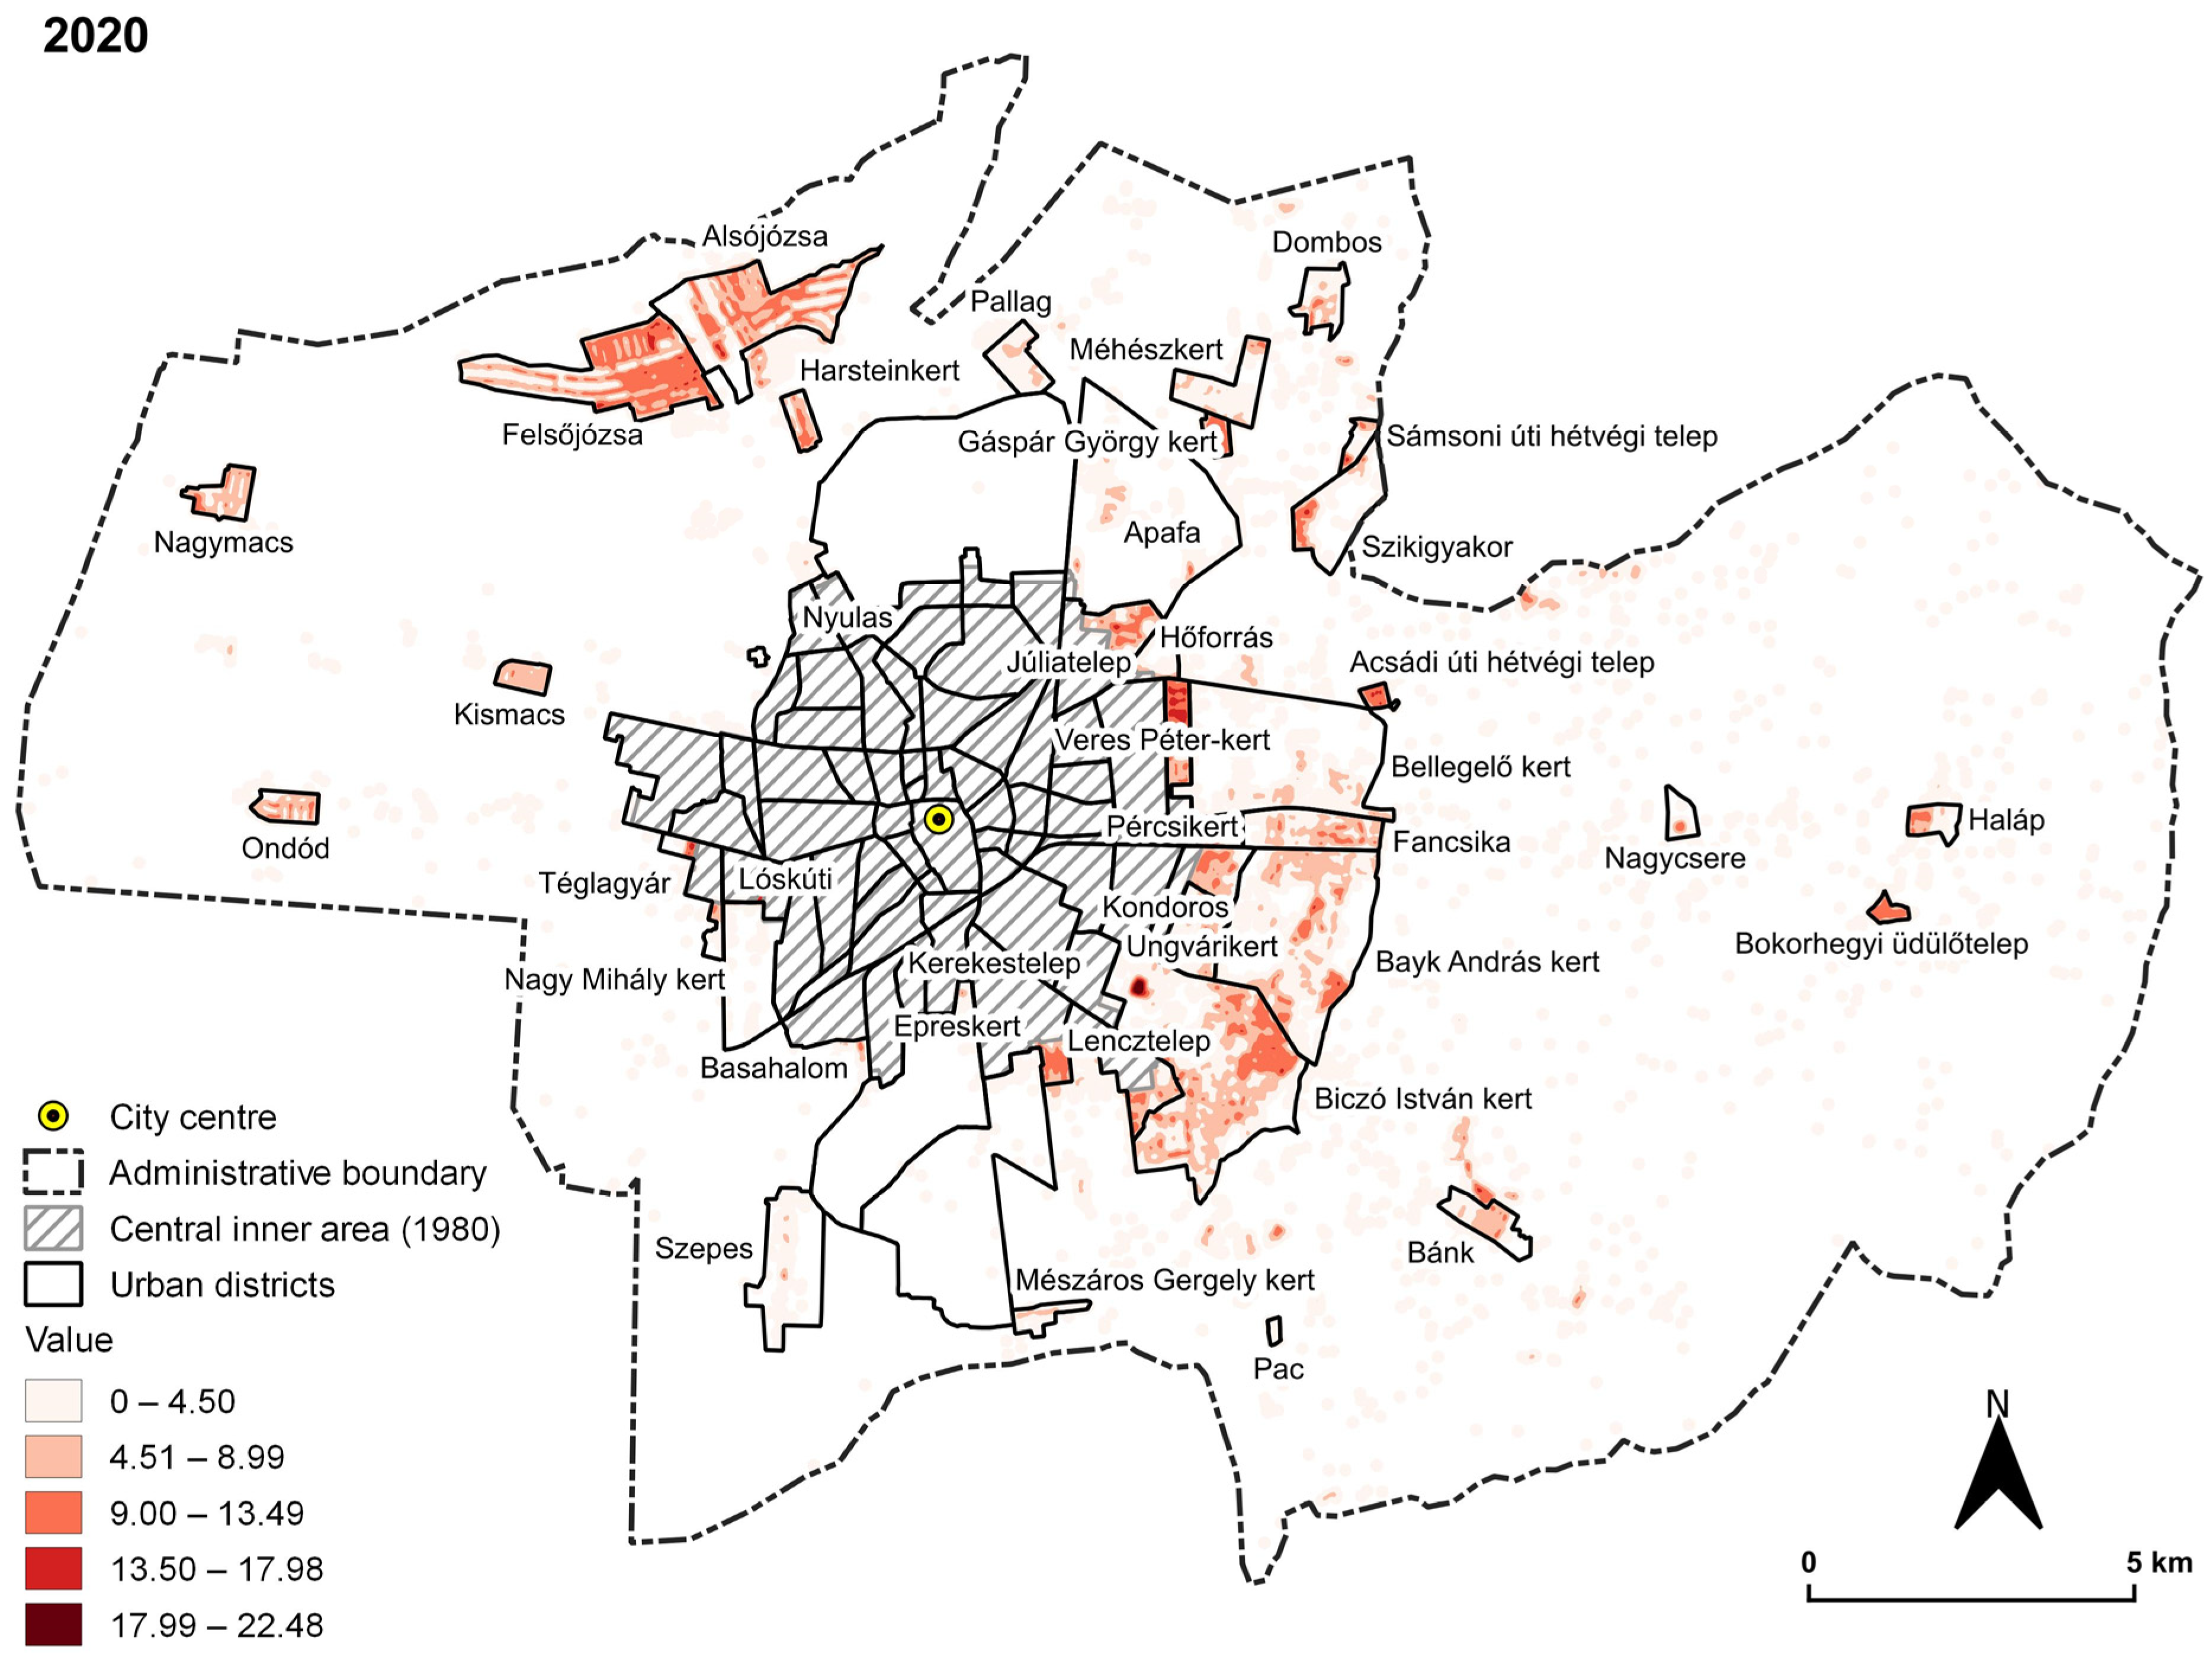
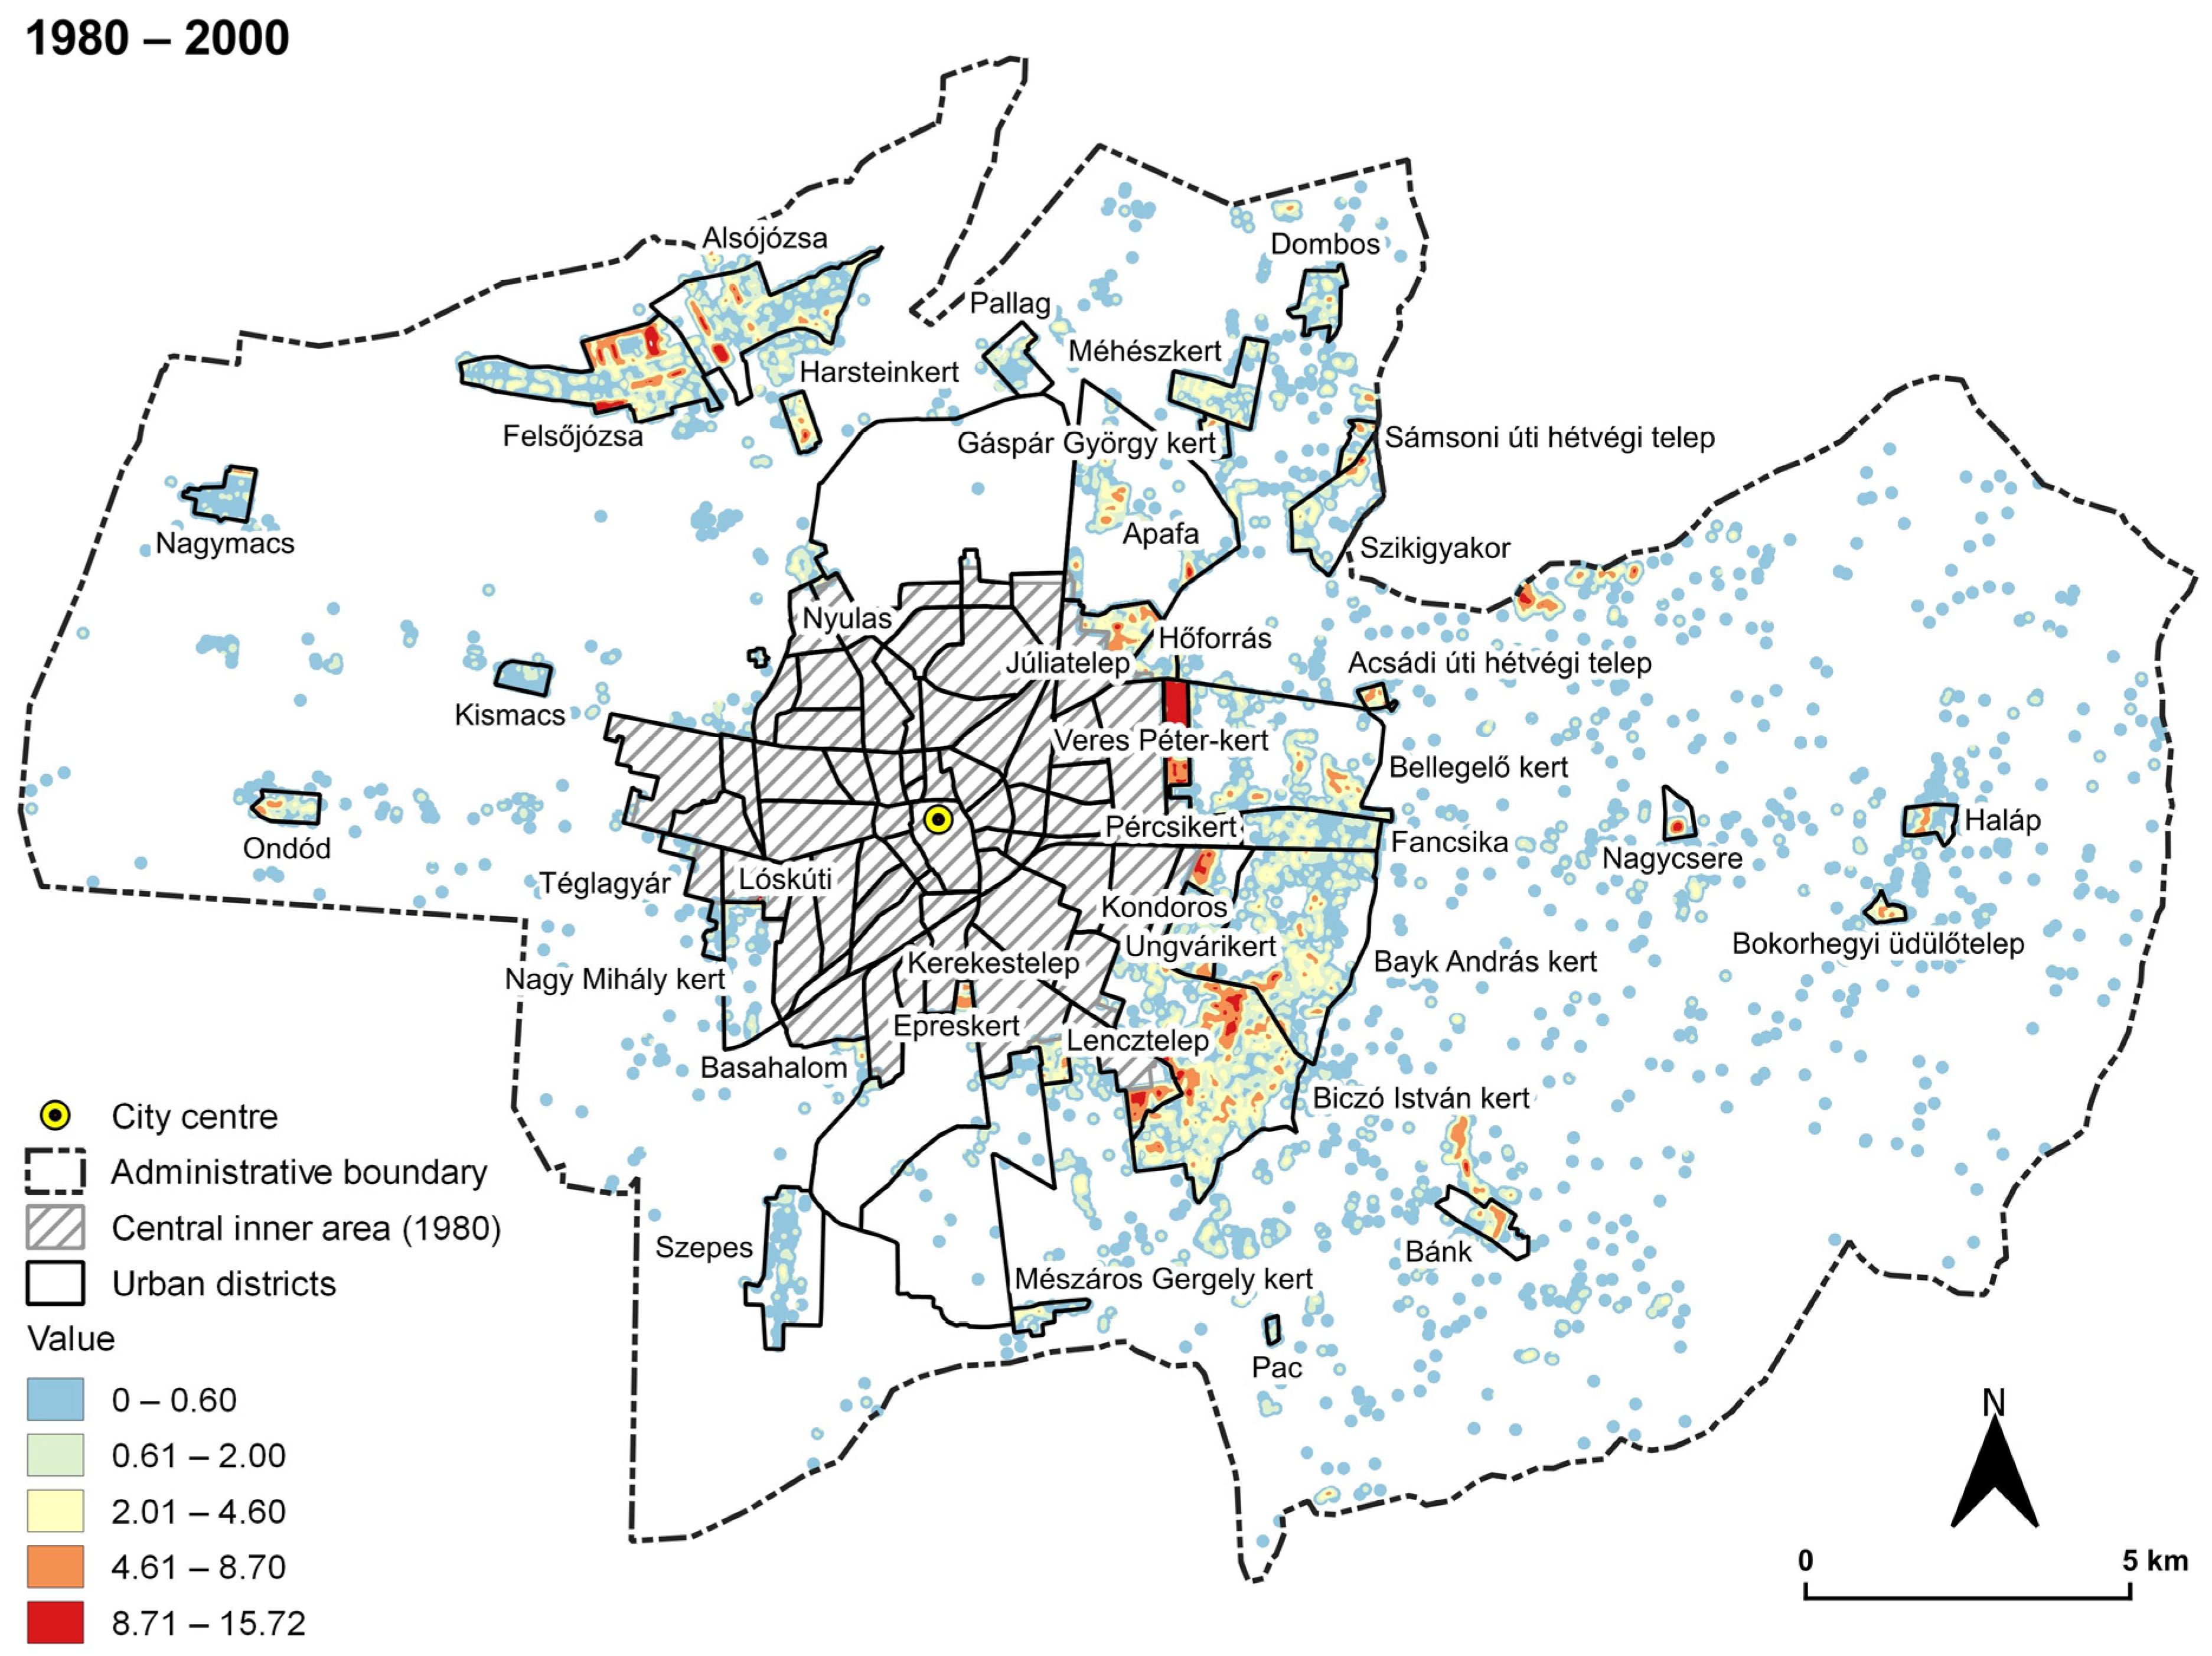
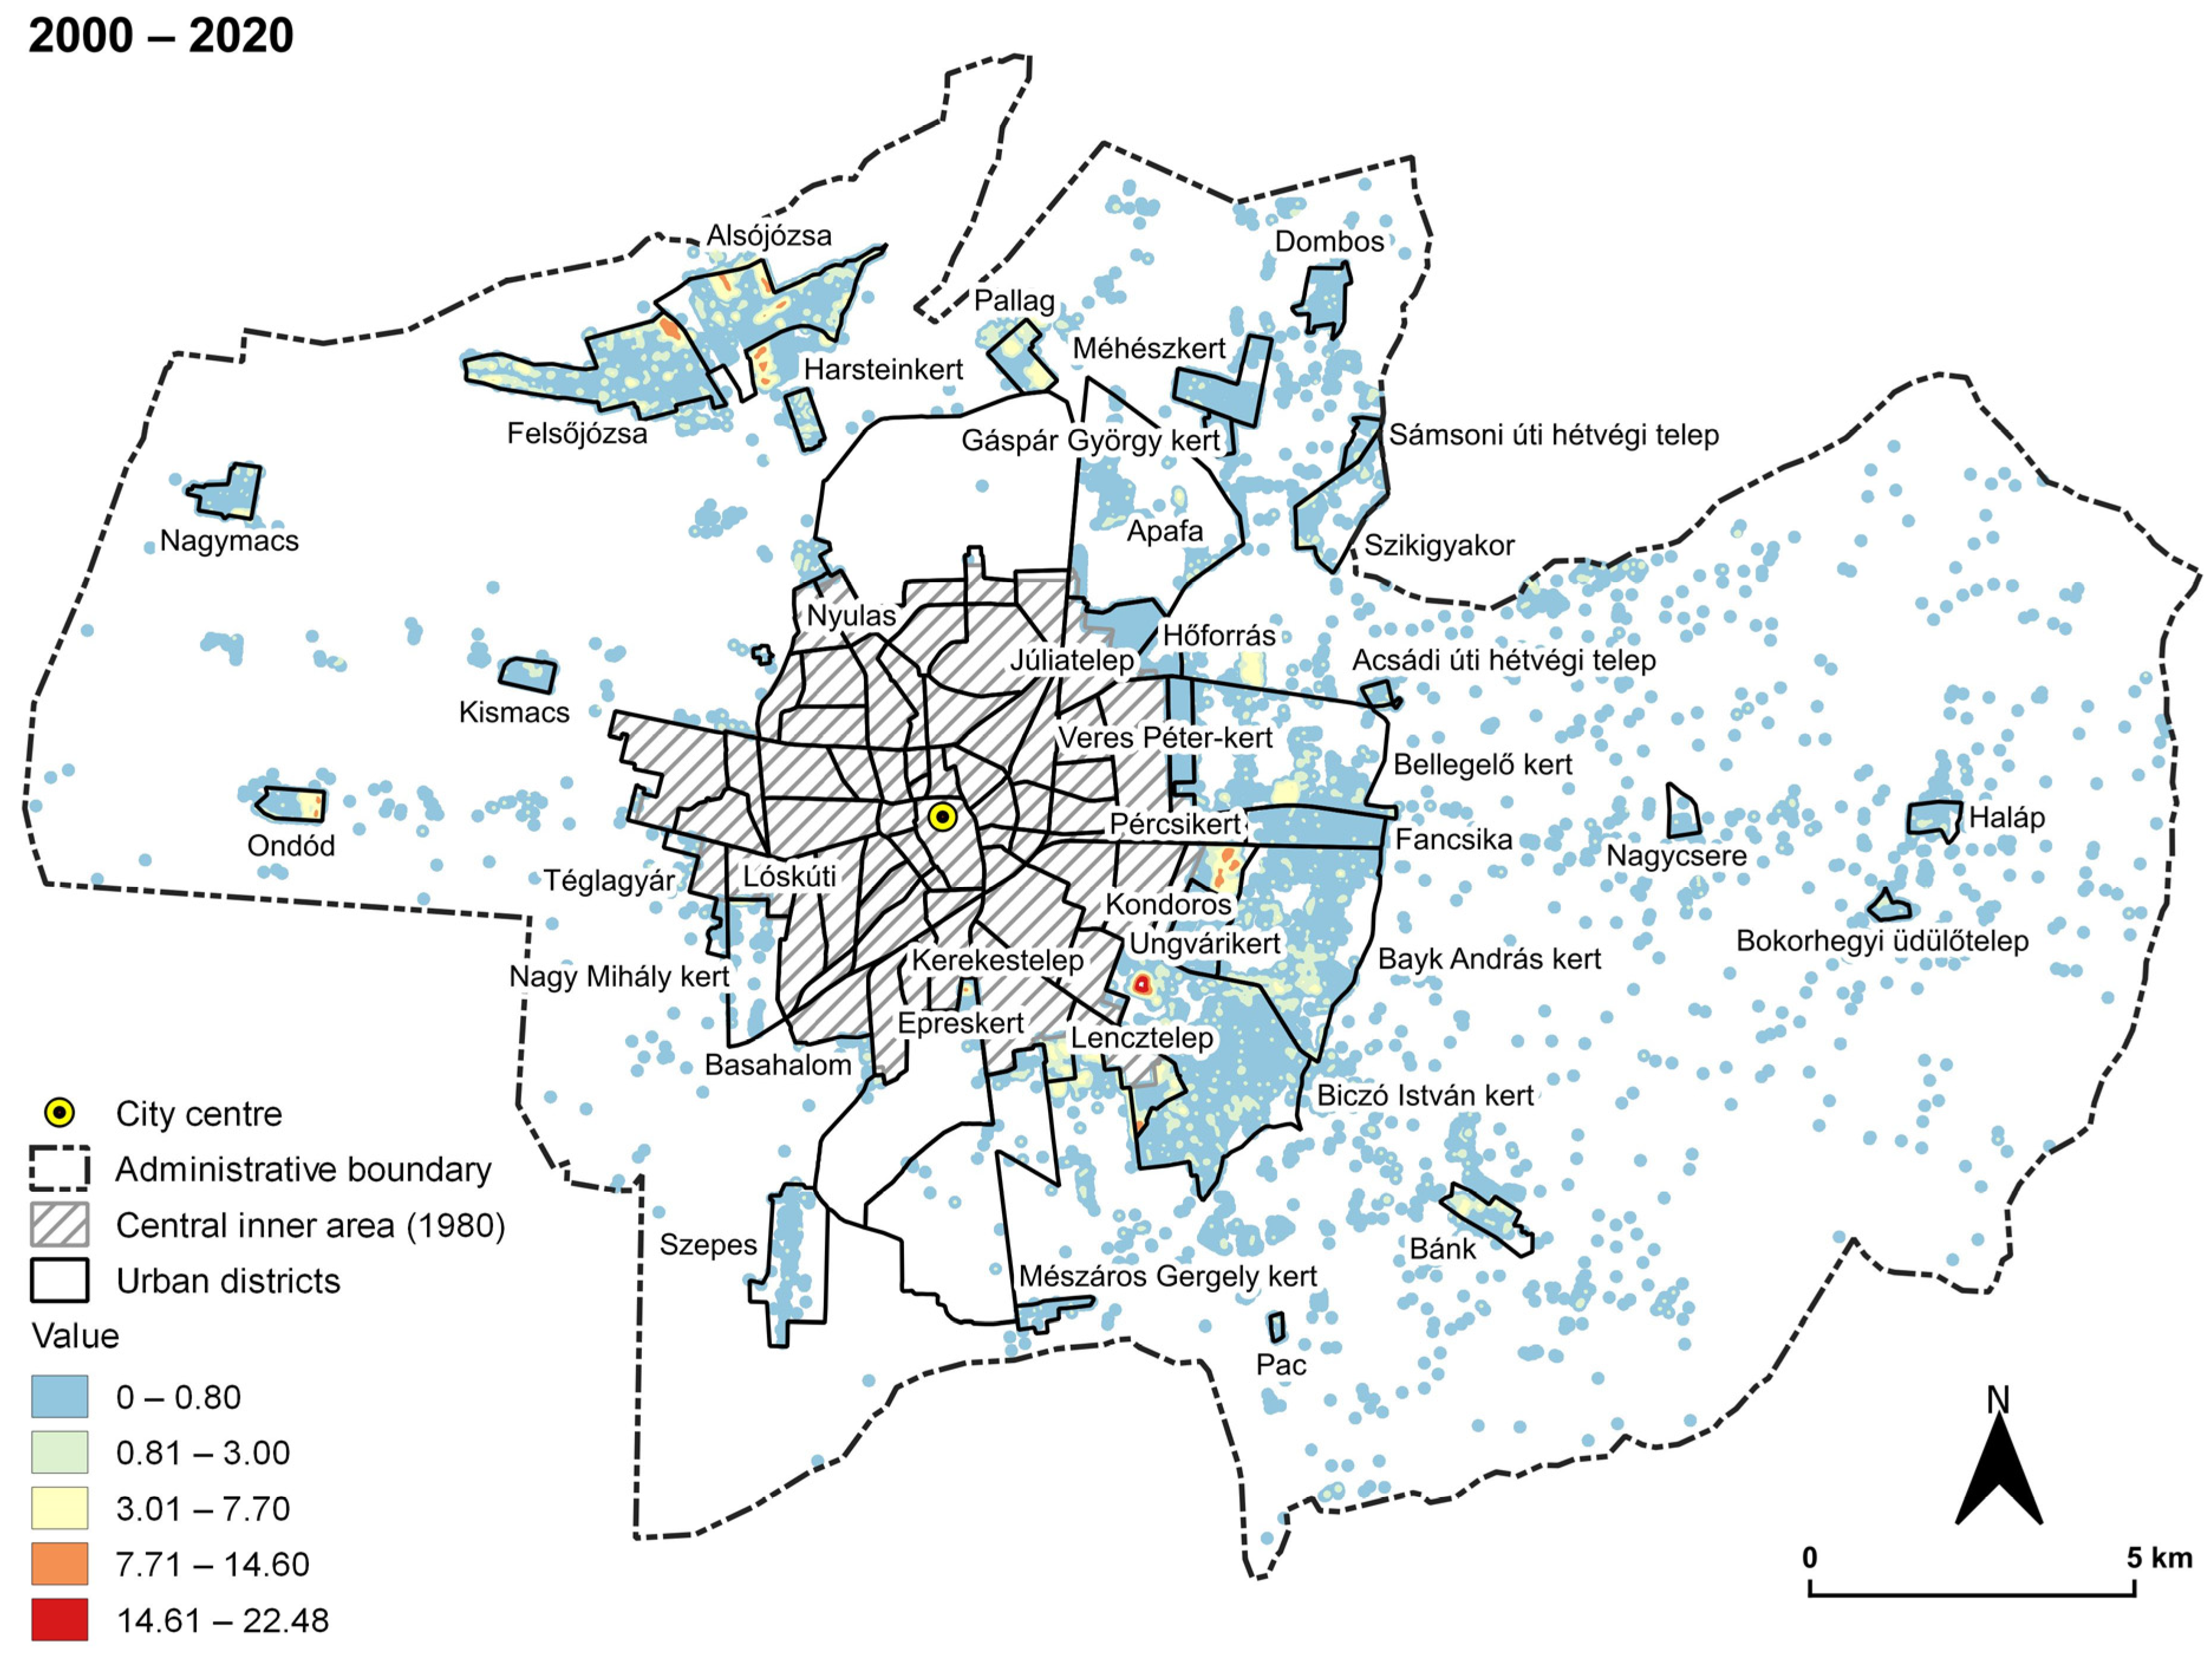
4. Results and Discussion

Population and building (or object) density are only narrow aspects of the numerous dimensions of urban sprawl [11], but with a detailed and longitudinal analysis, they might broadcast about the most significant spatial characteristics of the processes during and after the post-socialist transition period. In the current study, the objects also represent agricultural buildings, commercial sites, single-family houses, or apartments; hence, the population density is not coincident with object density, which is the number of objects per hectare [11,78]. However, the distribution of the values and their changes broadcast essential information about the processes of intra-urban suburbanization.
Spatial distribution (calculated on the basis of grid population data including those cells with a minimum of resident) of the population in Debrecen represents a similar tendency as Stanilov and Sýkora [4] modelled in the case of post-socialist cities; however, the population density of the city center was not as low as they calculated (zone “A” in Figure 3). There are large housing estates in the near proximity of the city center causing a significant population density close to Kossuth square. They were found to be monotonic, but a decrease in population density was not even seen until reaching the second part of the rural–urban fringe zone (between 5 and 7 km from the center—zone “D”). Fluctuating but higher values in the third zone and in half of the fourth zone in 2010 (zone “E” and “F”) were seen. The unambiguous trend of decreasing population density was detected by 2020 in the case of the urban zones of Debrecen (zone “A” and “B”) and a restructuring was visible in the light of increasing values in the rural–urban fringe zones—mostly in the case of the traditional villages, with their concentrated growth after 2010 (zone “E”). The extreme increase in the last rural–urban fringe zone (zone “F”) is caused by the distortion of the development of only a few cells.
The results highlighted the ongoing restructuring of population distribution with decreasing or stagnating population density of the inner city and the urban zone, whilst increasing values in the rural–urban fringe zones (in the districts with gardens and traditional villages) [36,43,46].
The number of objects—the number of parcels with at least one building—within the rural–urban fringe of Debrecen showed a significant increase during the investigated period (1980: 10,300; 2000: 16,000; 2020: 18,200). This growth in the number of objects reflects important changes in the intensity of constructions and the urban sprawl itself. According to the findings of this study and the literature, the 1990s was the most intensive period in the urban sprawl of Debrecen. The number of 100 × 100 m cells with at least one object increased from 3775 to 4342 by 2000 and reached 4617 by 2020. The proportion of built-up cells grew from 8.86 to 10.84 percent during the investigated period within the rural–urban fringe zone of Debrecen. The increasing concentration was also confirmed by the fact that correlation (Pearson coefficient) was R = 0.825 between 1980 and 2000 regarding object density within the cells; this value increased to R = 0.949, demonstrating the densification of the cells.
In order to detect the spatial characteristics of built-up areas and their changes, in the first step, every object was aggregated into the distance categories measured from the center of Debrecen. Due to the excluded central inner area, a limited number of objects were accounted in the first zone—rural–urban fringe I (zone “C” in Figure 4). A sharp decline was seen 5 km from the center, where boundaries of several urban districts ran parallel to a brook at the eastern part of the city (with a lower level of object and population density). The most impressive fact is the gradually declining levels of the number of objects with increasing distance from the center. The curves from different years generally form layers lying on the previous one; however, there are obvious disparities within this. It is important to note that the growth is not dispersed homogenously but it primarily concentrates in the zones of formerly built-up areas.
The number of objects dynamically increased in almost every zone between 1980 and 2000, while the intensity of growth tended to decrease according to growing distance from the city center. The character of the growth significantly differed from this after the turn of the millennium, because the increase slowed down closer to the central inner area (in zones “C” and “D”), whilst unambiguous growth was detected in the third rural–urban fringe zone (zone “E”). In some cases, a steady decrease appeared in the number of objects in the sparsely built-up areas (zone “F”).
The detailed territorial pattern of the objects for the investigated years were analyzed and illustrated by the Kernel density estimations (Figure 5, Figure 6 and Figure 7). The series of maps clearly demonstrates the most intense object densities and their changes (Figure 8 and Figure 9), which drew the attention to the hotspots of the increasing number of constructions. The first decades of our analyses were characterized by a dynamic growth in object density in the case of the eastern edge of the central inner areas and the small garden zones. In addition to this, a major growth was located in some parts of the traditional villages (Alsójózsa and Felsőjózsa) within the administrative boundary of Debrecen (Figure 8). These results support the previous findings about the population changes of the city [18,64].
The growth in the number of objects slowed down after the turn of the millennium and became more concentrated (an additional increase was seen in object density within and in the close surroundings of the traditional villages Alsójózsa, Felsőjózsa, and Pallag). The growth almost stopped after the turn of the millennium in the previously dynamically densifying garden zones; however, the increase was detected near the eastern edge of the city (Figure 9).
The categories of cells regarding the change in object density indicate the different tendencies between the two periods (excluding the vacant cells) (Figure 10 and Figure 11, Table 3). The most important spatial types of urban development in the post-socialist period—e.g., expansion and outlying growth—appeared within the administrative area of Debrecen [15], but their ratio decreased significantly. The urban sprawl in Debrecen became moderate, because one fifth of the cells was characterized by expansion and approximately two percent of them by outlying before 2000 and these categories hardly exceeded eight percent after 2000. The infill and mostly the densification proved to be important [11,58]—before and after the turn of the millennium, the latter one was the most frequent category following the stagnating cells. Stagnation was the most dominant category exceeding one third of the cells before 2000 and two thirds of them after 2000. The changes between the two periods obviously demonstrate the decreasing momentum of urban sprawl and its increasing concentration to the traditional villages (Alsójózsa, Felsőjózsa, and Pallag) in the case of Debrecen (Figure 10 and Figure 11). Our findings confirm the observed growing footprint of low-density areas causing rapid expansion of urban fabric into the previously peri-urban territories in the case of the first period [56].
In addition to these, rarefaction and emptying were also important despite some theories about urban growth, e.g., [20,59]—before the turn of the millennium, almost 13 percent of the cells became empty (most of them contained only one object in 1980). This fact draws attention to the transforming land use of Debrecen (Figure 10). As was identified in the case of another Hungarian city (Kecskemét), the transition period caused the formation of a two-faced agriculture—on the one hand, agricultural landscape characterized by monocultures, highly profit-oriented agribusinesses with a large-scale production and, on the other hand, disturbed and deteriorating farming landscape with halted urban sprawl and decreasing agricultural production [36]. In the case of Debrecen, emptying was the result of the spread of large-scale agricultural production (mostly in the Western and Southern part of the city). The increasing impact of the infrastructural constructions and rapidly growing industrial sites includes the reduction in the number of cells with a low number of objects after the turn of the millennium.
Changes in the land use/land cover related to the urban sprawl were identified as formerly agricultural areas transformed into built-up zones or urban green surfaces on the basis of the thematic filtering of CLCC databases. This covered altogether an area of 232.43 hectares during the investigated period (Table 4). New built-up areas with garden city character appeared in concentrated form at the eastern edge of the central inner area of Debrecen (Veres Péter-kert, Kondoros, József Attila-telep, Lencztelep) and at the northern part of Alsójózsa and Felsőjózsa (these are other inner areas of Debrecen as traditional villages) during the last few decades. Significant changes could be detected in the number of patches and in the territorial extent during the periods 1990–2006 and 2012–2018. These changes are primarily explained by the creation of new garden city areas and by the newly constructed residential parks (e.g., Liget and Fészek residential parks). However, these changes were not adequately observable by the different databases in every case, because of their limited spatial and temporal resolution and the resulting discrepancies between the static CLC databases [82,83,84,85] and the change maps [86,87]. More alterations were detected during our comparative analyses. This fact draws attention to the importance of the usage of diversified databases and a deliberate approach during the investigations.

5. Conclusions

Urban sprawl and the dynamic change of rural–urban areas are characteristic territorial processes in Eastern Central European countries as well. However, in the case of these post-socialist countries, the spatial restructuring of the population became significant not only in the close neighborhood of the cities but even within their administrative areas at stagnating or decreasing population number too.
The rapid, and sometimes uncontrolled, growth of urban areas was belated and characterized by heterogenous spatial social processes in the post-socialist countries compared to the Western countries. According to our results of the current analysis, the formerly compact shape and the well-defined boundaries of post-socialist cities faded gradually due to the dispersion of built-up areas and population following the political transition. The ongoing process of spatial restructuring of the population can be also observed after 2010 in Debrecen, in which the number of population is decreasing in the city center and in the urban area, while population increase was detected in the rural–urban zones. This trend resulted in a gradually decreasing level of population density with the growing distance from the city center, but this curve is not even, there are some waves in this due to the concentrating population (partly in the small garden districts and in the traditional villages). This fact refines the previous models in the literature.
Changes in the object-density patterns drew attention to the character of the urban sprawl and intra-urban suburbanization during the transition period differing from that observed after 2000. The initial dynamical increase and extensive spreading of built-up areas slowed down and became more concentrated. Primarily, the traditional villages (8–9 km far from the city center) and some parts of the eastern peri-urban areas increased significantly after the millennium and densification became more important in their case, but stagnation was the most widespread category in the case of object density in recent decades. The determining phenomenon was the type of rarefaction and emptying mostly in the case of the period between 1980 and 2000, showing a quite ambiguous character. This unusual tendency confirmed by our analyses is regarded as a post-socialist feature in line with the symptoms of urban sprawl. Objects disappeared mostly at the western part of the rural–urban zones due to the agricultural landscape characterized by monocultures with large-scale production, which differs from the features in the eastern part of the peri-urban zones.
During the validation of the Corine Land Cover Change layers with satellite images, some major differences were discovered, because changes in the land cover/land use caused by turning formerly agricultural areas into built-up areas were not completely included into the CLCC databases. Some changes in the land cover/land use observed based on the static images within an interval were not registered on the change maps. This fact confirms the necessity of the usage of primarily large-scale topographic maps, and orthophotos and satellite images with high and very high spatial resolution to detect the longitudinal changes adequately. This approach and methodology might provide the possibility for typifying the areas affected by urban sprawl and a ‘space for time substitution’-like analysis to detect the changes in the urban land cover/land use.
The results drew attention to the frontiers of urban development in the rural–urban fringe. The changing spatial distribution of the population generates transforming transportation, infrastructural and institutional demands, which local decision makers should reflect on. The (possible) environmental conflicts can also be predictable in light of the detailed results.
The current research focused primarily on residential areas and other functions were subordinated; the rapidly growing industrial sites were not involved. More precisely segmented longitudinal analyses could produce more detailed results in this research topic. The spatially detailed social and economic patterns also provide important research topics in the future.

Author Contributions

Conceptualization, J.P. and Z.T.; methodology, J.P. and Z.T.; software, J.P. and Z.T.; validation, L.D.H., J.P. and Z.T.; formal analysis, J.P. and Z.T.; investigation, L.D.H., J.P. and Z.T.; resources, L.D.H., J.P. and Z.T.; data curation, J.P. and Z.T.; writing—original draft preparation, J.P. and Z.T.; writing—review and editing, J.P., K.M. and Z.T.; visualization, J.P. and Z.T.; supervision, J.P. and Z.T. All authors have read and agreed to the published version of the manuscript.

Funding

The project was supported by the K 138079 NKFI project. János Pénzes’ research was supported by the Bolyai János Research Scholarship of the Hungarian Academy of Sciences (BO/104/22).

Data Availability Statement

Lechner Knowledge Center Non-Profit Limited Company. Topographic maps in scale 1:10,000 (Map sheet numbers: 69–121, 69–122, 69–123, 69–124, 69–141, 69–142, 69–144, 69–211, 69–212, 69–213, 69–214, 69–221, 69–222, 69–223, 69–224, 69–231, 69–232, 69–233, 69–234, 69–241, 69–242, 69–243, 69–244, 69–322, 69–324, 69–411, 69–412, 69–413, 69–414, 69–421, 69–422, 69–423, 79–433, 79–434) 1978–1987. Available online: https://geoshop.hu (accessed on 19 February 2023). Copernicus Land Monitoring Service Corine Land Cover Change 1990–2000 (accessed on 10 May 2023): https://land.copernicus.eu/pan-european/corine-land-cover/lcc-1990-2000. Copernicus Land Monitoring Service Corine Land Cover Change 2000–2006 (accessed on 10 May 2023): https://land.copernicus.eu/pan-european/corine-land-cover/lcc-2000-2006. Copernicus Land Monitoring Service Corine Land Cover Change 2006–2012 (accessed on 10 May 2023): https://land.copernicus.eu/pan-european/corine-land-cover/lcc-2006-2012. Copernicus Land Monitoring Service Corine Land Cover Change 2012–2018 (accessed on 10 May 2023): https://land.copernicus.eu/pan-european/corine-land-cover/lcc-2012-2018.

Conflicts of Interest

The authors declare no conflict of interest.

References

  1. Knox, P. Urbanization. In International Encyclopedia of Human Geography; Kitchin, R., Thrift, N., Eds.; Elsevier Science: Oxford, UK, 2009. [Google Scholar]
  2. Hirt, S. Whatever happened to the (post)socialist city? Cities 2013, 32, 29–38. [Google Scholar] [CrossRef]
  3. Sailer-Fliege, U. Characteristics of post-socialist urban transformation in East Central Europe. GeoJournal 1999, 49, 7–16. [Google Scholar] [CrossRef]
  4. Stanilov, K.; Sýkora, L. Confronting Suburbanization: Urban Decentralization in Postsocialist Central and Eastern Europe; John Wiley & Sons: New York, NY, USA, 2014. [Google Scholar]
  5. Hirt, S. Suburbanizing Sofia: Characteristics of post-socialist peri-Urban change. Urban Geogr. 2007, 28, 755–780. [Google Scholar] [CrossRef]
  6. Matlovičová, K.; Kormaníková, J. City Brand-Image Associations Detection. Case Study of Prague. In SGEM International Multidisciplinary Scientific Conferences on Social Sciences and Arts, Proceedings of the SGEM 2014, Psychology & Psychiatry, Sociology & Healthcare, Education, Albena, Bulgaria, 2–7 September 2014; Conference Proceedings, Sociology and Healthcare; Bulgarian Academy of Sciences: Albena, Bulgaria, 2014; Volume II, pp. 139–146. [Google Scholar]
  7. Ianos, I.; Sîrodoev, I.; Pascariu, G.; Henebry, G. Divergent patterns of built-up urban space growth following post-socialist changes. Urban Stud. 2016, 53, 3172–3188. [Google Scholar] [CrossRef]
  8. Kovács, Z.; Farkas, J.Z.; Egedy, T.; Kondor, A.C.; Szabó, B.; Lennert, J.; Baka, D.; Kohán, B. Urban sprawl and land conversion in post-socialist cities: The case of metropolitan Budapest. Cities 2019, 92, 71–81. [Google Scholar] [CrossRef]
  9. Slaev, A.D.; Nedović-Budić, Z.; Krunić, N.; Petrić, J.; Daskalova, D. Suburbanisation and sprawl in post-socialist Belgrade and Sofia. Eur. Plan. Stud. 2018, 26, 1389–1412. [Google Scholar] [CrossRef]
  10. Havryliuk, O.; Gnatiuk, O.; Mezentsev, K. Suburbanization, but centralization? Migration patterns in the post-Soviet functional urban region—Evidence from Kyiv. Folia Geogr. 2021, 63, 64–84. [Google Scholar]
  11. Zévl, J.-J.; Ouředníček, M. Measuring the morphology of suburban settlements: Scale-dependent ambiguities of residential density development in the Prague urban region. Morav. Geogr. Rep. 2021, 29, 27–38. [Google Scholar] [CrossRef]
  12. Matlovič, R.; Sedláková, A. The impact of suburbanisation in the hinterland of Prešov. Morav. Geogr. Rep. 2007, 15, 22–31. [Google Scholar]
  13. Dinić Branković, M.; Bogdanović Protić, I.; Djekić, J.; Mitković, P. Post-socialist suburbanization and sprawl development patterns—Niš, case study. Facta Univ.—Ser. Archit. Civ. Eng. 2016, 14, 355–366. [Google Scholar] [CrossRef]
  14. Hardi, T.; Repaská, G.; Veselovský, J.; Vilinová, K. Environmental consequences of the urban sprawl in the suburban zone of Nitra: An analysis based on landcover data. Geogr. Pannonica 2020, 24, 205–220. [Google Scholar] [CrossRef]
  15. Spórna, T.; Krzysztofik, R. ‘Inner’ suburbanization. Background of the phenomenon in a polycentric, post-socialist and post-industrial region. Example from the Katowice conurbation, Poland. Cities 2020, 104, 102789. [Google Scholar] [CrossRef]
  16. Szmytkie, R. Suburbanisation processes within and outside the city: The development of intra-urban suburbs in Wrocław, Poland. Morav. Geogr. Rep. 2021, 29, 149–165. [Google Scholar] [CrossRef]
  17. Kubeš, J. European post-socialist cities and their near hinterland in intra-urban geography literature. Bull. Geogr. Socio-Econ. Ser. 2013, 19, 19–43. [Google Scholar] [CrossRef]
  18. Bajmócy, P. A szuburbanizáció két évtizede Magyarországon (Two decades of the suburbanization in Hungary). Észak-Magyarországi Strat. Füzetek 2014, 11, 6–17. [Google Scholar]
  19. Taubenböck, H.; Rusche, K.; Siedentop, S.; Wurm, M. Patterns of Eastern European urbanisation in the mirror of Western trends—Convergent, unique or hybrid? Environ. Plan. B Urban Anal. City Sci. 2019, 46, 1206–1225. [Google Scholar] [CrossRef]
  20. Peiser, R. Decomposing urban sprawl. Town Plan. Rev. 2001, 72, 275–298. [Google Scholar] [CrossRef]
  21. Bujdosó, Z.; Gyurkó, Á.; Hágen, I. Socio-economic aspects of the urbanisation in Northern Hungary in the 21st century. Folia Geogr. 2016, 58, 35–53. [Google Scholar]
  22. Miljanović, D.; Vuksanović-Macura, Z.; Doljak, D. Rethinking the spatial transformation of postsocialist cities: Shrinking, sprawling or densifying. Cities 2023, 140, 104443. [Google Scholar] [CrossRef]
  23. Enyedi, G. The stages of urban growth. In Urban Sprawl in Europe: Similarities or Differences? Szirmai, V., Ed.; Aula Publisher: Budapest, Hungary, 2011; pp. 45–63. [Google Scholar]
  24. Nagy, G.; Hegedűs, T. Urban sprawl or/and suburbanisation? The case of Zalaegerszeg. Belvedere Meridionale 2016, 28, 106–119. [Google Scholar] [CrossRef]
  25. Timár, J. The main features of suburbanization in the Great Hungarian Plain. Landsc. Urban Plan. 1993, 22, 177–187. [Google Scholar] [CrossRef]
  26. Unger, J.; Gál, T.M.; Rakonczai, J.; Mucsi, L.; Szatmári, J.; Tobak, Z.; van Leeuwen, B.; Fiala, K. Modeling of the urban heat island pattern based on the relationship between surface and air temperatures. Időjárás Q. J. Hung. Meteorol. Serv. 2010, 114, 287–302. [Google Scholar]
  27. Kovács, Z.; Farkas, J.Z.; Szigeti, C.; Harangozó, G. Assessing the sustainability of urbanization at the sub-national level: The ecological footprint and biocapacity accounts of the Budapest metropolitan region, Hungary. Sustain. Cities Soc. 2022, 84, 104022. [Google Scholar] [CrossRef]
  28. Csorba, P.; Bánóczki, K.; Túri, Z. Land use changes in peri-urban open spaces of small towns in Eastern Hungary. Sustainability 2022, 14, 10680. [Google Scholar] [CrossRef]
  29. Mocák, P.; Matlovičová, K.; Matlovič, R.; Pénzes, J.; Pachura, P.; Mishra, K.P.; Kostilníková, K.; Demková, M. 15-minute city concept as a sustainable urban development alternative: A brief outline of conceptual frameworks and Slovak cities as a case. Folia Geogr. 2022, 64, 69–89. [Google Scholar]
  30. Audirac, I. Shrinking cities: An unfit term for American urban policy? Cities 2018, 75, 12–19. [Google Scholar] [CrossRef]
  31. Trócsányi, A.; Pirisi, G.; Máté, É. An interpretation attempt of Hungarian small towns’ shrinking in a post-socialist transformation context. Chasopys Soc.-Econ. Heohr. J. Hum. Geogr. 2018, 24, 5–20. [Google Scholar] [CrossRef]
  32. Sarzynski, A.; Vicina, T.J. Shrinking Suburbs: Analyzing the Decline of American Suburban Spaces. Sustainability 2019, 11, 5230. [Google Scholar] [CrossRef]
  33. Burdack, J.; Dövényi, Z.; Kovács, Z. Am Rand von Budapest—Die Metropolitane Peripherie zwischen nachholender Entwicklung und eigenem Weg. Petermanns Geogr. Mitteilungen 2004, 148, 30–39. [Google Scholar]
  34. Brezdeń, P.; Szmytkie, R. Current Changes in the Location of Industry in the Suburban Zone of a Post-Socialist City: Case Study of Wrocław (Poland). Tijdschr. Voor Econ. En Soc. Geogr. 2018, 110, 102–122. [Google Scholar] [CrossRef]
  35. Feng, C.; Zhang, H.; Xiao, L.; Guo, Y. Land use change and its driving factors in the rural–urban fringe of Beijing: A production–living–ecological perspective. Land 2022, 11, 314. [Google Scholar] [CrossRef]
  36. Csatári, B.; Farkas, J.Z.; Lennert, J. Land use changes in the rural-urban fringe of Kecskemét after the economic transition. J. Settl. Spat. Plan. 2013, 4, 153–159. [Google Scholar]
  37. Lityński, P. The intensity of urban sprawl in Poland. ISPRS Int. J. Geo-Inf. 2021, 10, 95. [Google Scholar] [CrossRef]
  38. Sýkora, L.; Bouzarovski, S. Multiple transformations: Conceptualising the post-communist urban transition. Urban Stud. 2012, 49, 43–60. [Google Scholar] [CrossRef]
  39. Kubeš, J.; Nováček, A. Suburbs around the Czech provincial city of České Budějovice—Territorial arrangement and problems. Hung. Geogr. Bull. 2019, 68, 65–78. [Google Scholar] [CrossRef]
  40. Leetmaa, K.; Brade, I.; Anniste, K.; Nuga, M. Socialist summer-home settlements in post-socialist suburbanisation. Urban Stud. 2012, 49, 3–21. [Google Scholar] [CrossRef]
  41. Vasárus, G.L.; Lennert, J. Suburbanization within City Limits in Hungary—A Challenge for Environmental and Social Sustainability. Sustainability 2022, 14, 8855. [Google Scholar] [CrossRef]
  42. Vasárus, G.; Bajmócy, P.; Lennert, J. In the shadow of the city: Demographic processes and emerging conflicts in the rural-urban fringe of the Hungarian agglomerations. Geogr. Pannonica 2018, 22, 14–29. [Google Scholar] [CrossRef]
  43. Pócsi, G. Land use change of the ‘Small Hobby Gardens’ in the peri-urban area of Szeged, Hungary. Forum Geogr. 2011, 10, 312–321. [Google Scholar] [CrossRef]
  44. Beluszky, P.; Timár, J. The changing political system and urban restructuring in Hungary. Tijdschr. Voor Econ. En Soc. Geogr. 1992, 83, 380–389. [Google Scholar] [CrossRef]
  45. Brunn, S.D.; Matlovičová, K.; Mušinka, A.; Matlovič, R. Policy implications of the vagaries in population estimates on the accuracy of sociographical mapping of contemporary Slovak Roma communities. GeoJournal 2018, 83, 853–869. [Google Scholar] [CrossRef]
  46. Vasárus, G.L. Városhatáron belüli szuburbanizáció Magyarországon—Egy paradoxon feltárása (Suburbanisation within the city in Hungary—Exploring a paradox). Területi Stat. 2022, 62, 379–404. [Google Scholar] [CrossRef]
  47. Timár, J.; Váradi, M.M. The uneven development of suburbanization during transition in Hungary. Eur. Urban Reg. Stud. 2001, 8, 349–360. [Google Scholar] [CrossRef]
  48. Kristóf, A. The Impact of Suburbanization on Social Differentiation in Hungary: A case study of the Miskolc agglomeration. Geogr. Pannonica 2018, 22, 176–188. [Google Scholar] [CrossRef]
  49. Oşlobanu, C.; Alexe, M. Built-up area analysis using sentinel data in metropolitan areas of Transylvania, Romania. Hung. Geogr. Bull. 2021, 70, 3–18. [Google Scholar] [CrossRef]
  50. Szabó, L.; Abriha, D.; Phinzi, K.; Szabó, S. Urban vegetation classification with high-resolution PlanetScope and SkySat multispectral imagery. Acta Geogr. Debrecina Landsc. Environ. Ser. 2021, 15, 66–75. [Google Scholar] [CrossRef]
  51. Mucsi, L.; Liska, C.M.; Henits, L.; Tobak, Z.; Csendes, B.; Nagy, L. The evaluation and application of an urban land cover map with image data fusion and laboratory measurements. Hung. Geogr. Bull. 2017, 66, 145–156. [Google Scholar] [CrossRef]
  52. Diaz-Pacheco, J.; Gutiérrez, J. Exploring the limitations of CORINE Land Cover for monitoring urban land-use dynamics in metropolitan areas. J. Land Use Sci. 2014, 9, 243–259. [Google Scholar] [CrossRef]
  53. Cieślak, I.; Biłozor, A.; Szuniewicz, K. The Use of the CORINE Land Cover (CLC) Database for Analyzing Urban Sprawl. Remote Sens. 2020, 12, 282. [Google Scholar] [CrossRef]
  54. Izakovičová, Z.; Petrovič, F.; Pauditšová, E. The Impacts of Urbanisation on Landscape and Environment: The Case of Slovakia. Sustainability 2021, 14, 60. [Google Scholar] [CrossRef]
  55. Kolcsár, R.A.; Csikós, N.; Szilassi, P. Testing the limitations of buffer zones and Urban atlas population data in urban green space provision analyses through the case study of Szeged, Hungary. Urban For. Urban Green. 2021, 57, 126942. [Google Scholar] [CrossRef]
  56. Tikoudis, I.; Farrow, K.; Mebiame, R.M.; Oueslati, W. Beyond average population density: Measuring sprawl with density-allocation indicators. Land Use Policy 2022, 112, 105832. [Google Scholar] [CrossRef]
  57. Gerten, C.; Boyko, D.; Fina, S. Patterns of post-socialist urban development in Russia and Germany. Front. Sustain. Cities 2022, 4, 846956. [Google Scholar] [CrossRef]
  58. Wilson, E.H.; Hurd, J.D.; Civco, D.L.; Prisloe, M.P.; Arnold, C. Development of a geospatial model to quantify, describe and map urban growth. Remote Sens. Environ. 2003, 86, 275–285. [Google Scholar] [CrossRef]
  59. Forman, R.T.T. Land Mosaics: The Ecology of Landsapces and Regions; Cambridge University Press: Cambridge, UK, 1995. [Google Scholar]
  60. Gyenizse, P.; Bognár, Z.; Czigány, S.; Elekes, T. Landscape shape index, as a potential indicator of urban development in Hungary. Acta Geogr. Debrecina Landsc. Environ. 2014, 8, 78–88. [Google Scholar]
  61. Jiang, G.; Ma, W.; Qu, Y.; Zhang, R.; Zhou, D. How does sprawl differ across urban built-up land types in China? A spatial-temporal analysis of the Beijing metropolitan area using granted land parcel data. Cities 2016, 58, 1–9. [Google Scholar] [CrossRef]
  62. Süli-Zakar, I. Debrecen gazdaságának és településszerkezetének történeti-földrajza (Historical geography of the economy and settlement structure of Debrecen). In Tanulmányok Debrecen Városföldrajzából II; Süli-Zakar, I., Ed.; Kossuth Lajos Tudományegyetem Társadalomföldrajzi Tanszék: Debrecen, Hungary, 1996; pp. 149–267. [Google Scholar]
  63. Molnár, E.; Dézsi, G.; Lengyel, I.M.; Kozma, G. Vidéki nagyvárosaink gazdaságának összehasonlító elemzése (A comparative analysis of the Hungarian minor cities). Területi Stat. 2018, 58, 610–637. [Google Scholar] [CrossRef]
  64. Hegedűs, L.D.; Túri, Z.; Apáti, N.; Pénzes, J. Analysis of the intra-urban suburbanization with GIS methods—The case of Debrecen since the 1980s. Folia Geogr. 2023, 65, 23–39. [Google Scholar]
  65. Kozma, G. A Debreceni Lakóterületek II. Világháború Utáni Fejlődésének Társadalomföldrajzi Vizsgálata (Social Geographical Analysis of the Development of Residential Areas in Debrecen after WWII); Didakt Kiadó: Debrecen, Hungary, 2016. [Google Scholar]
  66. Hungarian Central Statistical Office (HCSO). Helységnévtár (Detailed Gazetteer). Available online: https://www.ksh.hu/apps/hntr.telepules?p_lang=HU&p_id=15130 (accessed on 21 August 2021).
  67. GeoX Ltd. (Budapest, Hungary). Available online: https://geox.hu/terinformatikai-uzleti-megoldasok/uzleti-adatbazisok/100x100-geo-demografiai-terkep/ (accessed on 17 August 2021).
  68. Sándor, G.; Szabó, G.; Charzyński, P.; Szynkowska, E.; Novák, T.J.; Świtoniak, M. Technogenic soils in Debrecen. In Technogenic Soil Atlas; Charzyński, P., Markiewicz, M., Świtoniak, M., Eds.; Polish Society of Soil Science: Torun, Poland, 2013; pp. 35–74. [Google Scholar]
  69. Balogh, S.; Novák, T.J. Trends and hotspots in landscape transformation based on anthropogenic impacts on soil in Hungary, 1990–2018. Hung. Geogr. Bull. 2020, 69, 349–361. [Google Scholar] [CrossRef]
  70. Csorba, P.; Ádám, S.; Bartos-Elekes, Z.; Bata, T.; Bede-Fazekas, Á.; Czúcz, B.; Csima, P.; Csüllög, G.; Fodor, N.; Frisnyák, S.; et al. Landscapes. In National Atlas of Hungary—Natural Environment, 1st ed.; Kocsis, K., Gercsák, G., Horváth, G., Keresztesi, Z., Nemerkényi, Z., Eds.; MTA CSFK Geographical Institute: Budapest, Hungary, 2018; pp. 112–129. [Google Scholar]
  71. Csomós, G.; Farkas, J.Z.; Kovács, Z. Access to urban green spaces and environmental inequality in post-socialist cities. Hung. Geogr. Bull. 2020, 69, 191–207. [Google Scholar] [CrossRef]
  72. Lechner Knowledge Center Non-Profit Limited Company. Topographic Maps in Scale 1:10,000 (Map Sheet Numbers: 69–121, 69–122, 69–123, 69–124, 69–141, 69–142, 69–144, 69–211, 69–212, 69–213, 69–214, 69–221, 69–222, 69–223, 69–224, 69–231, 69–232, 69–233, 69–234, 69–241, 69–242, 69–243, 69–244, 69–322, 69–324, 69–411, 69–412, 69–413, 69–414, 69–421, 69–422, 69–423, 79–433, 79–434). 1978–1987. Available online: https://geoshop.hu (accessed on 19 February 2023).
  73. Hungarian Institute of Geodesy, Cartography and Remote Sensing. Colour Orthophotos of Hungary. 2000. Available online: https://qms.nextgis.com/geoservices/900/ (accessed on 13 March 2023).
  74. Google Satellite Hybrid WMS. Satellite Imagery Covering Debrecen from September 2019 and May–June 2020. Available online: https://mt1.google.com/vt/lyrs=y&x={x}&y={y}&z={z} (accessed on 13 March 2023).
  75. OpenStreetMap (OSM). Available online: https://www.openstreetmap.org (accessed on 22 February 2023).
  76. Local Authority of Debrecen (Maintained by the ERDA Kft. Company). Available online: https://debrecen.erda.hu/ (accessed on 27 August 2021).
  77. Jakobi, Á. A grid: Aggregált és dezaggregált rácsmodellek a területi egyenlőtlenségek vizsgálatában (Aggregated and disaggregated grid models in the investigation of spatial inequalities). Területi Stat. 2015, 55, 322–338. [Google Scholar]
  78. de Smet, F.; Teller, J. Characterising the morphology of suburban settlements: A method based on a semi-automatic classification of building clusters. Landsc. Res. 2016, 41, 113–136. [Google Scholar] [CrossRef]
  79. Netrdová, P.; Nosek, V.; Hurbánek, P. Using areal interpolation to deal with differing regional structures in international research. ISPRS Int. J. GeoInf. 2020, 9, 126. [Google Scholar] [CrossRef]
  80. Papp, I.; Pénzes, J.; Demeter, G. A közlekedési hálózatok és a komplex területi fejlettség időbeli összehasonlító vizsgálata a történelmi Magyarország példáján (Comparative temporal analysis of transportation networks and complex territorial development through the example of historical Hungary). Területi Stat. 2021, 61, 445–465. [Google Scholar] [CrossRef]
  81. Demeter, G.; Papp, I.; Romhányi, B.F.; Pénzes, J. A területi egyenlőtlenségek településszintű vizsgálata a történeti Magyarország és utódállamai területén, 1330–2010 (I.) (Long-term study of territorial inequalities at settlement level in the territory of the historical Hungary and its successor states, 1330–2010 (I.)). Területi Stat. 2023, 63, 271–299. [Google Scholar] [CrossRef]
  82. Copernicus Land Monitoring Service. Corine Land Cover Change 1990–2000. Available online: https://land.copernicus.eu/pan-european/corine-land-cover/lcc-1990-2000 (accessed on 10 May 2023).
  83. Copernicus Land Monitoring Service. Corine Land Cover Change 2000–2006. Available online: https://land.copernicus.eu/pan-european/corine-land-cover/lcc-2000-2006 (accessed on 10 May 2023).
  84. Copernicus Land Monitoring Service. Corine Land Cover Change 2006–2012. Available online: https://land.copernicus.eu/pan-european/corine-land-cover/lcc-2006-2012 (accessed on 10 May 2023).
  85. Copernicus Land Monitoring Service. Corine Land Cover Change 2012–2018. Available online: https://land.copernicus.eu/pan-european/corine-land-cover/lcc-2012-2018 (accessed on 10 May 2023).
  86. Copernicus Land Monitoring Service. Corine Land Cover. Available online: https://land.copernicus.eu/pan-european/corine-land-cover (accessed on 10 May 2023).
  87. Büttner, G.; Kosztra, B.; Maucha, G.; Pataki, R.; Kleeschulte, S.; Hazeu, G.W.; Vittek, M.; Schroder, C.; Littkopf, A. Copernicus Land Monitoring Service—CORINE Land Cover. User Manual. European Environment Agency (p. 128). 2021. Available online: https://land.copernicus.eu/user-corner/technical-library/clc-product-user-manual (accessed on 10 May 2023).
  88. Mari, L.; Mattányi, Z. Egységes európai felszínborítási adatbázis a CORINE Land Cover program (A Uniform European Land Cover Database and and the CORINE Land Cover Program). Földrajzi Közlemények 2002, 126, 31–38. [Google Scholar]
  89. Anderson, T.K. Kernel density estimation and K-means clustering to profile road accident hotspots. Accid. Anal. Prev. 2009, 41, 359–364. [Google Scholar] [CrossRef]
  90. Caine, I.; Walter, R.; Foote, N. San Antonio 360: The rise and decline of the concentric city 1890–2010. Sustainability 2017, 9, 649. [Google Scholar] [CrossRef]
  91. Zhu, H.; Ou, X.; Yang, Z.; Yang, Y.; Ren, H.; Tang, L. Spatiotemporal dynamics and driving forces of land urbanization in the Yangtze river delta urban agglomeration. Land 2022, 11, 1365. [Google Scholar] [CrossRef]
  92. Zhang, J.; We, D.; Zhu, A.-X.; Zhu, Y. Modelling urban expansion with cellular automata supported by urban growth intensity over time. Ann. GIS 2023, 29, 337–353. [Google Scholar] [CrossRef]
Figure 1. Diagram of population density gradients in socialist, post-socialist Eastern-European and Western cities. Source: by [4] (p. 271).
Land 12 01682 g001
Figure 2. Debrecen and its other inner areas (edited by the authors).
Land 12 01682 g002
Figure 3. Changes in population density (persons per km2) according to the distance from the city center (in kilometer) in 2010 and 2020. Edited by the authors on the basis of the datasets from [67].
Land 12 01682 g003
Figure 4. Number of objects (in pieces) according to the distance from the city center (in kilometer) in 1980, in 2000, and in 2020. Edited by the authors on the basis of the point layers.
Land 12 01682 g004
Figure 5. Kernel density estimation for the objects in 1980 in the case of the rural–urban fringe zone of Debrecen. Source: edited by the authors.
Land 12 01682 g005
Figure 6. Kernel density estimation for the objects in 2000 in the case of the rural–urban fringe zone of Debrecen. Source: edited by the authors.
Land 12 01682 g006
Figure 7. Kernel density estimation for the objects in 2020 in the case of the rural–urban fringe zone of Debrecen. Source: edited by the authors.
Land 12 01682 g007
Figure 8. Change in the values of Kernel density estimation for the objects between 1980 and 2000 in the case of the rural–urban fringe zone of Debrecen. Source: edited by the authors.
Land 12 01682 g008
Figure 9. Change in the values of Kernel density estimation for the objects between 2000 and 2020 in the case of the rural–urban fringe zone of Debrecen. Source: edited by the authors.
Land 12 01682 g009
Figure 10. Categorization of grid cells according to changes in the characteristics of built-up areas between 1980 and 2000 in the rural–urban fringe of Debrecen. Source: edited by the authors.
Land 12 01682 g010
Figure 11. Categorization of grid cells according to changes in the characteristics of built-up areas between 2000 and 2020 in the rural–urban fringe of Debrecen. Source: edited by the authors.
Land 12 01682 g011
Table 1. Population of Debrecen and its areas between 1980 and 2020 [64,66,67].
Number of Residents, CapitaChange, Percentage
Areas19801990200120112020 *1980–19901990–20012001–20112011–2020
Central inner area180,372195,414188,924181,859166,2898.3−3.3−3.7−8.6
Other inner areas960610,36213,74515,13717,3477.932.610.114.6
from which Józsa **67017293954110,94411,8868.830.814.78.6
Outskirts82176459768614,12715,651−21.419.083.810.8
Debrecen together198,195212,235210,355211,123199,2877.1−0.90.4−5.6
* Estimated numbers ** Alsójózsa and Felsőjózsa together.
Table 2. Matrix of land cover/land use to detect urban sprawl [82,83,84,85]. LC: land cover; LU: land use.
Corine LC/LU before ChangeCorine LC/LU after Change
133 Construction sites
141 Green urban areas
211 Non-irrigated arable land
231 Pastures
242 Complex cultivation patterns
111 Continuous urban fabric
112 Discontinuous urban fabric 141 Green urban areas
142 Sport and leisure facilities
Table 3. The distribution of the categories of urban growth (except for vacant cells), in percentage. Source: calculated by the authors.
Categories1980–20002000–2020
expansion20.557.51
infill2.111.54
outlying2.230.69
densification24.8914.10
stagnating34.2467.98
rarefaction3.064.18
emptying12.934.01
Table 4. Transition matrix of the area and number of patches (NP) of land-use types in the other inner areas and outskirts of Debrecen between 1990 and 2018 [82,83,84,85]. Land-use types according to the Corine Land Cover nomenclature: 112 discontinuous urban fabric; 133 construction sites; 141 green urban areas; 142 sport and leisure facilities; 211 non-irrigated arable land; 231 pastures; 242 complex cultivation patterns.
YearLand-Use Types112141142
NPArea (ha)NPArea (ha)NPArea (ha)
1990–2000141114.5200.0000.00
211586.4500.0000.00
24200.00111.5100.00
2000–2006211329.7200.0000.00
242114.3300.0000.00
2006–201221119.9000.0000.00
2012–2018133323.8900.0000.00
13300.0000.00121.81
21100.0000.00113.60
23100.0000.0016.70
Disclaimer/Publisher’s Note: The statements, opinions and data contained in all publications are solely those of the individual author(s) and contributor(s) and not of MDPI and/or the editor(s). MDPI and/or the editor(s) disclaim responsibility for any injury to people or property resulting from any ideas, methods, instructions or products referred to in the content.

