Article

Geographical Detector-Based Research of Spatiotemporal Evolution and Driving Factors of Oasification and Desertification in Manas River Basin, China

1
College of Economics & Management, Shihezi University, Shihezi 832029, China
2
College of Information Science & Technology, Shihezi University, Shihezi 832029, China
*
Author to whom correspondence should be addressed.
Land 2023, 12(8), 1487; https://doi.org/10.3390/land12081487
Submission received: 16 July 2023 / Revised: 23 July 2023 / Accepted: 24 July 2023 / Published: 27 July 2023

Abstract

:
Oasification and desertification are two essential processes of land use and cover (LULC) change in arid regions. Compared to desertification, which is widely regarded as the most severe global ecological issue, the importance of oasification has not received universal recognition. However, neglecting oasification can lead to detrimental outcomes to the effectiveness of ecological governance by affecting the comprehensiveness of environmental policies proposed only based on desertification. Therefore, this study incorporates oasification into the examination of desertification by analyzing land use data for five representative periods spanning from 1980 to 2020, as well as socioeconomic and environmental data from 2000 to 2010. The aim is to evaluate the spatial and temporal dynamics of oasification and desertification in the Manas River Basin and identify the underlying factors driving these processes. The findings indicated that (1) the general trend of oasification and desertification exhibited the expansion of oases and the retreat of deserts. Specifically, the oasification area showed a “decrease-increase-decrease” pattern over time, while the desertification area consistently decreased. (2) In terms of spatial distribution, oasification and desertification displayed a transition from scattered and disordered patterns to an overall more organized pattern, with the hotspot area of desertification shifting from Shawan County to Manas County over time. (3) Population density, average land GDP, soil type and annual precipitation significantly influenced the degree of oasification, with driving force q-values above 0.4, which were the key factors driving oasification. Population density and average land GDP significantly affected the degree of desertification, with driving force q-values above 0.35, which were the key factors driving desertification. The driving force of all factors increased significantly after the interaction, and socioeconomic factors influenced oasification and desertification more than other factors. The study’s findings aim to provide a scientific basis for land resource use, ecological governance and sustainable development in the Manas River basin.

1. Introduction

The arid region is the most fragile ecological environment due to water shortage, dry climate and high wind and sand [1,2,3]. According to the United Nations Convention to Combat Desertification, desertification commonly occurs in arid and semi-arid regions [4,5]. Desertification control has been carried out in the early 20th century [1]. A series of significant research programs, such as the “National Action Plan for Desertification Control (NPCD)” and the “European Experimental Research Program for Desertification Threatened Areas (EFEDA),” have been implemented one after another [6]. Under such guidance, many researchers and scholars have conducted a large number of field surveys [7,8], remote sensing dynamic monitoring [9,10,11] and systematic studies [12,13,14,15] on desertification. However, global desertification is still expanding at a rate of 50,000 to 70,000 square kilometers per year [16]. More than 100 countries and more than 1.4 billion people worldwide have been affected by desertification [17,18]. This may be due to neglecting another process that is the opposite of the desertification process—oasification. While desertification is widely recognized as the world’s most serious ecological environmental problem, the significance of oasification has not received universal recognition. [19]. Neglecting oasification will inevitably have adverse consequences on the effectiveness of ecological governance as it undermines the comprehensiveness of environmental policies that solely focus on desertification. Meanwhile, the United Nations included desertification control in the 2030 Agenda for Sustainable Development in 2015, proposing “to achieve the goal of zero growth in global land degradation by 2030” [20,21]. In order to ensure the effectiveness of ecological governance and the achievement of the desertification control target by 2030, it is necessary to introduce oasification in desertification research. Oasification is the process of transformation of desert into oasis by the combined effect of human and natural factors. Existing research on oasification is still in the early stages of building a scientific framework for oasification research [19,22]. Wang et al. believe it is essential to reveal further the characteristics of oasification and its spatial and temporal pattern evolution, processes and driving mechanisms to provide a scientific basis for comprehensive evaluation of environmental change trends, ecological effects and policy establishment [23]. Therefore, this study attempts to introduce oasification into the study of desertification, and further examine the evolution of oasification and desertification over a long time and in space, discover the interaction mechanisms between them and explore the driving factors of oasification and desertification.
The study area is located in China, which is because of the fact that China is one of the countries in the world with the largest desertification area, the largest population affected and the most severe wind and sand hazards [24,25]. By the end of 2014, China’s total area of desertified land was 2,611,600 square kilometers, accounting for 27.2% of the country’s land area [26,27]. China’s desertification control is of great significance to the green development of the world. The Manas River basin was chosen as an example because of its typicality in terms of ecology and economy. In terms of ecology, there are two major river basins in Xinjiang. One is the Manas River and the other is the Tarim River. Compared with the Tarim River, the Manas River is located in the northern part of Xinjiang, which has been more significantly affected by human activities in recent decades, and it is the ecological intersection area in Xinjiang where the alternating evolution of oasification and desertification is the most frequent and intense, which is of typical significance. In terms of socio-economic aspects, Manas River is the core area of the economic belt on the north slope of Tianshan Mountain, the largest oasis farming area in Xinjiang and the fourth largest irrigated agriculture area in China, with relatively developed secondary and tertiary industries and agriculture, which is listed as a typical demonstration area of oasis agriculture [28,29]. The study of oasification and desertification in the Manas River Basin is strategically significant for China’s socio-economic development and ecological civilization. Considering the above factors, the Manas River Basin was selected as the main study area. The objectives of this study are (1) to obtain the spatiotemporal evolution patterns of oasification and desertification in the Manas River basin over the past 40 years. Specifically, ArcGIS was used to obtain the desert and oasis localities in the typical period from 1980 to 2020, and based on this, the structural characteristics and change rates of the oasis and desert were analyzed by the single dynamic degree model and the comprehensive dynamic degree model. The evolution process of desertification and oasification in time and space was analyzed by land transfer matrix model, to generalize and obtain their evolutionary patterns. (2) To identify the influencing factors driving oasification and desertification in the Manas River Basin. Specifically, the driving factors of the watershed are explored through the geographical detector, combined with existing literature, from four aspects: geology, topography, social economy and climate. The study’s findings provide new pathways for identifying the driving factors inherent in the spatiotemporal evolution of oasification and desertification in this watershed and provide theoretical support for ecological management and sustainable development of the watershed.
The main contributions of this study may be (1) the introduction of oasification in the study of desertification. Desertification has been widely studied because of the severe harm it poses to human well-being. However, compared to desertification, oasification has only been underappreciated as an antonym of desertification. Neglecting oasification will inevitably affect the comprehensiveness of environmental policies and bring adverse results to the effectiveness of ecological governance. Therefore, this study argues that both desertification and oasification should be addressed in the study of desertification governance. (2) The study of oasification and desertification used the geographic detector model. Existing studies on drivers mainly use qualitative and quantitative methods [30,31,32,33], among which the qualitative methods cannot specifically derive the extent to which drivers influence spatial and temporal evolution. In contrast, quantitative methods such as gray correlation and correlation analysis are less objective [34,35]. Wang et al. [36] proposed a geographic detector as a novel statistical model for detecting spatial differentiation and revealing its driving forces. Among them is the geographic detector q-statistic, which can measure spatial differentiation, detect driving factors and analyze the interaction between variables. This method makes it possible to analyze the drivers behind oasification and desertification quantitatively and can fill the gaps mentioned in the above quantitative research methods. However, few studies exist on the use of geographic detectors to examine the drivers of spatial and temporal evolution of oasification and desertification in the Manas River. This study introduces a geographic detector to study the drivers of spatiotemporal evolution, thus providing a new research approach to the existing literature. The rest of this paper is presented in the following order: Section 2 shows the study area, related methods and data; Section 3 presents the results of spatiotemporal evolution and driving factors; Section 4 discusses the findings; conclusions and future research directions are obtained in Section 5.

2. Materials and Methods

2.1. Study Area

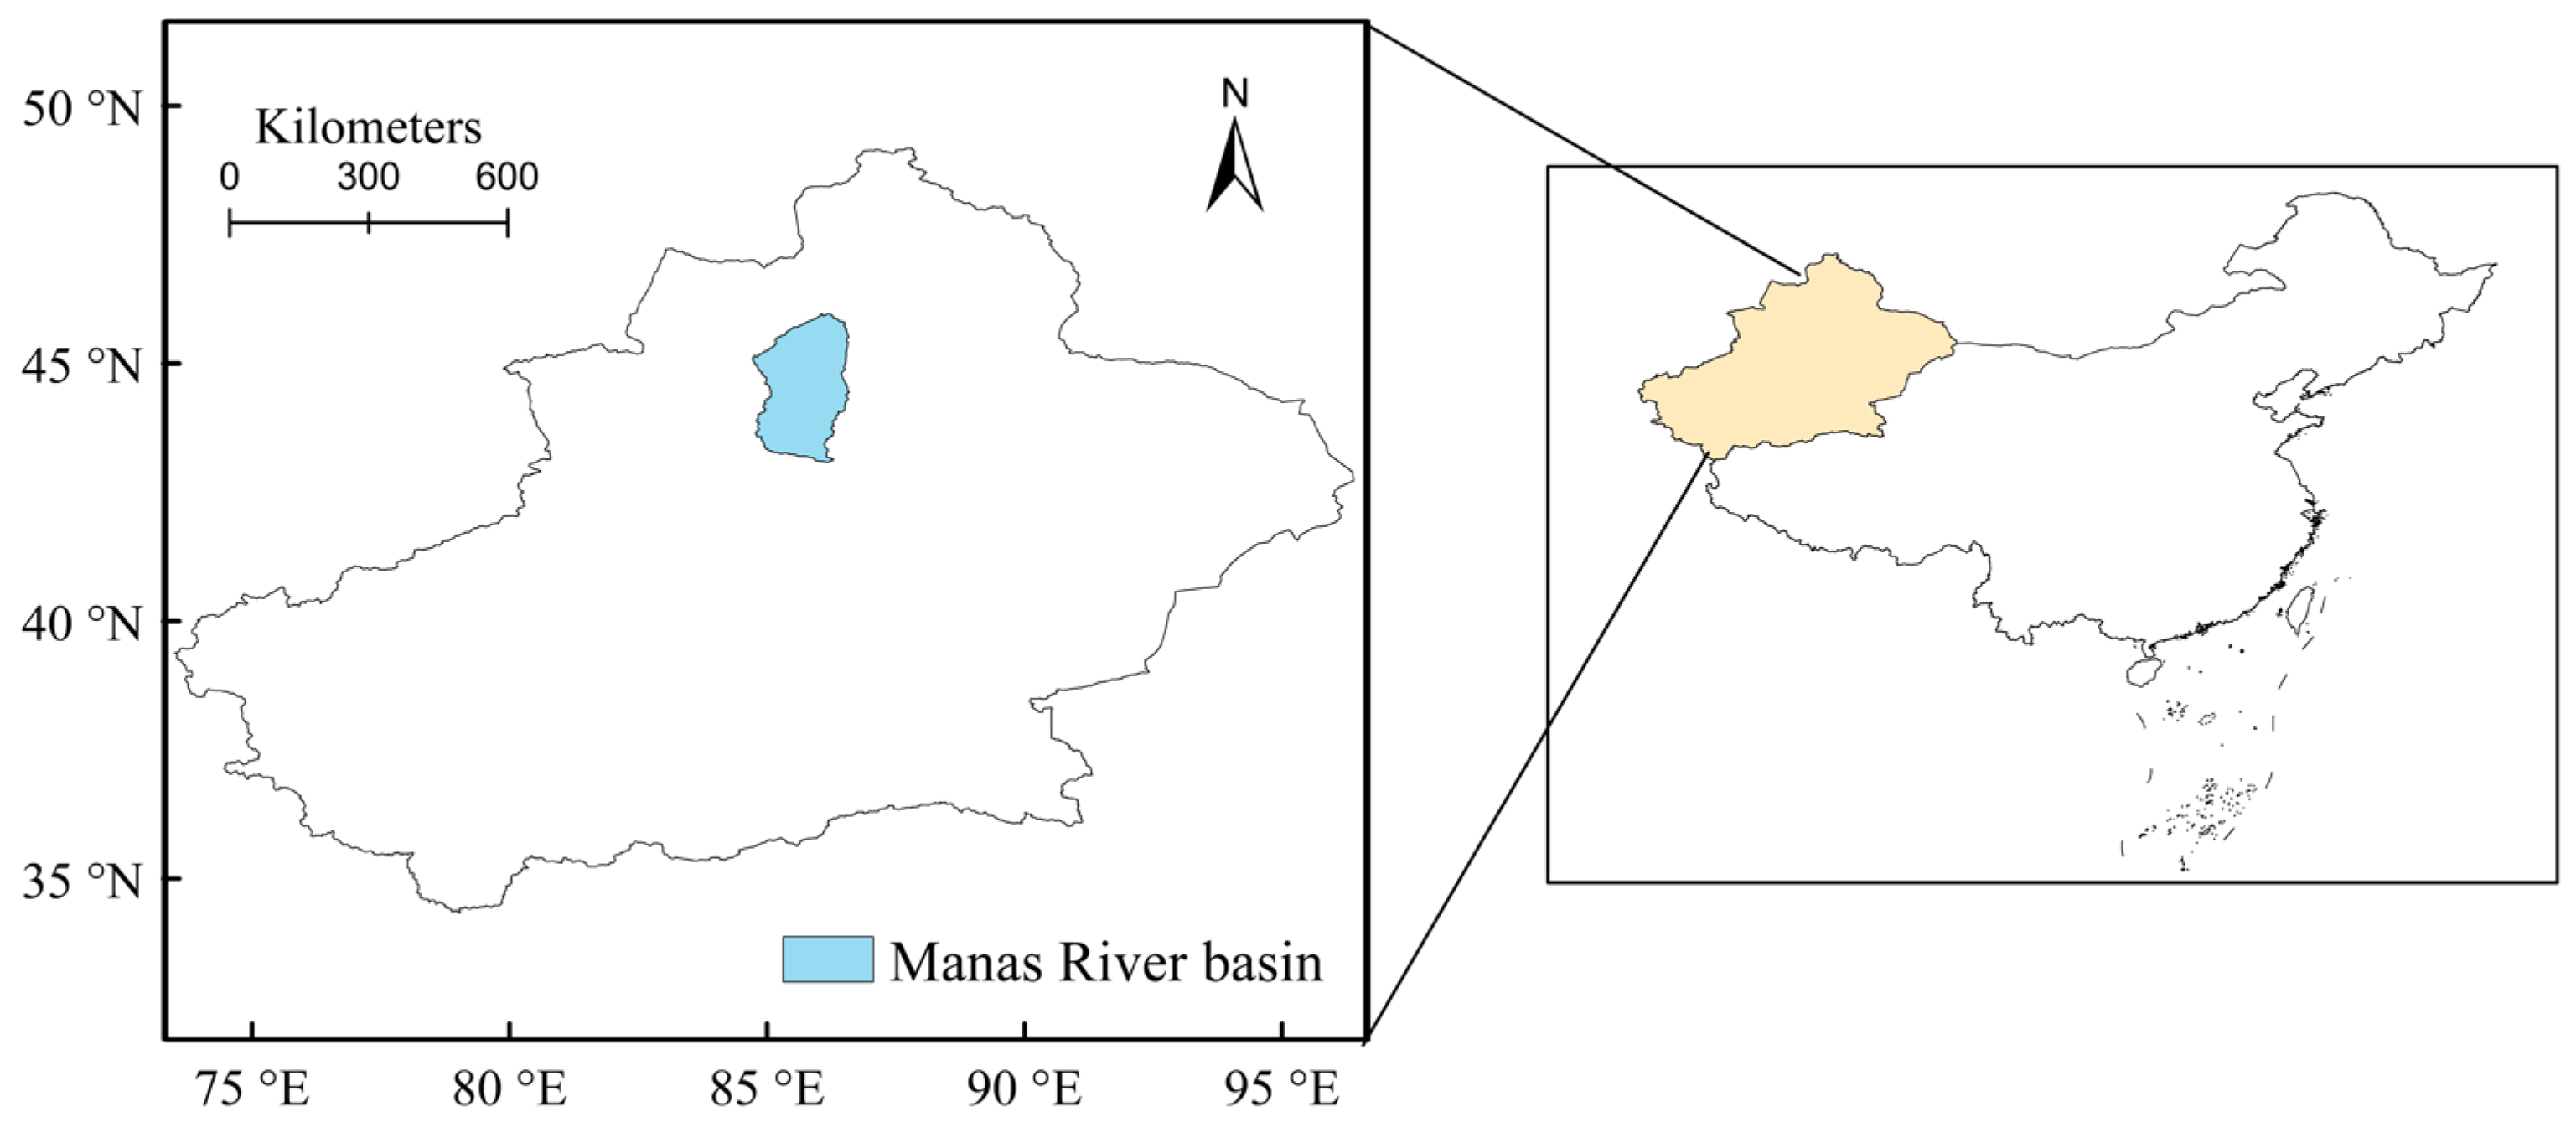
The Manas River basin is located at the northern foot of Xinjiang Uygur Autonomous Region, China (Figure 1), south of the northern slope of the Tianshan Mountains and north of the Gurbantunggut Desert, roughly located at 84°71′~86°59′ E, 43°08′~45°97′ N, 204~5252 m above sea level, decreasing from south to north [37]. Since the 1950s, the oasification and desertification within the basin have alternated frequently. There are three main reasons for LULC changes in the basin. Firstly, natural factors: China’s western region has entered a warm and humid climatic pattern. With rising temperatures, melting the Tianshan Mountains’ snow and increased precipitation have contributed to the expansion of oasis landscapes in the northern part of the Manas River Basin. Secondly, human activities: the large-scale promotion of drip irrigation water-saving technology in the region’s agricultural production has significantly improved water resource utilization efficiency. Surplus water has facilitated the restoration of natural vegetation in both oases and deserts. At the same time, the importance of ecological environmental protection policies in China has been increasingly recognized, playing a positive role in the conservation of forests and grasslands in the desert plains of the Manas River Basin [38]. From east to west, the watershed is distributed with major rivers such as the Tasi River, Manas River, Jingu River, Bayingou River, etc. The administrative divisions include ten townships in Shawan County, five in Manas County, Shihezi City and parts of Buxair Mongol Autonomous County, Karamay City and Wusu City, etc.

2.2. Study Methods

The spatiotemporal evolution of desertification (oasification) is mainly the changes in the area and spatial distribution of the corresponding land use types in different periods. Firstly, the magnitude, speed and trend of the change in desert and oasis area are quantitatively analyzed using the single dynamic degree and comprehensive dynamic degree. Secondly, the transfer matrix was used to obtain the relationship between desert and oasis conversion and the spatial layout of desertification and oasification over the past 40 years. Finally, the geographic detector was used to quantitatively analyze which factors drive desertification or oasification in the study area.

2.2.1. Dynamic Degree

The dynamic degree is based on the desert (oasis) area, reflecting the magnitude and rate of change of the desert (oasis) area in different periods, including single dynamic degree and comprehensive dynamic degree [34,39,40,41,42].
(1)
Single dynamic degree
The single dynamic degree is the ratio of the total area of a certain land type (e.g., Cultivated land) at the end of the period (e.g., 1990a) that is converted into other land types (all land types except Cultivated land) to the total area of that land type (Cultivated land) at the beginning of the period (e.g., 1980a) [39,40]. The model reflects the speed of change in the area of a particular land use type (e.g., Cultivated land) per unit of time. The formula is as follows:
D S = S t + 1 S t S t × 1 T × 100 %
where: D S is the desert (oasis) and its subordinate secondary land use type single dynamic degree. S t + 1 , S t denotes the area of a specific land use type at the end and the beginning of the study respectively and T is the study period.
(2)
Comprehensive dynamic degree
The comprehensive dynamic degree is the ratio of the total decrease (or total increase) of each class (referring to oasis or desert) in the region to two times the total area of the regional land class [34,41]. The model reflects the magnitude and rate of change in the overall land use type (referring to oasis or desert) area over the study period, and the formula is as follows:
D C = i = 1 n S i j 2 i = 1 n S i × 1 T × 100 %
where: D C is the comprehensive land use dynamic degree of the study area, S i j indicates the absolute value of the area of land use type i converted to other land use types in the study period, S i indicates the area of the land use type i at the beginning of the study period and T is the study period.

2.2.2. Transfer Matrix

The land use transfer matrix is a classic method for studying the direction and quantitative changes of transfers between land use types [42,43,44,45]. The model was used to explore the role of the interconversion of desert and oasis relationships. The overlay analysis in the software ArcGIS 10.7 was used to statistically calculate the dynamic change data generated to obtain the transfer matrix. From the transfer matrix, we can know the direction of land use type change in the Manas River basin, and the mechanism of interaction between oasification and desertification in the Manas River basin. The formula is as follows:
S i j = S 11 S 12 S 1 m S 21 S 22 S 2 m S m 1 S m 1 S m m
where S i j is the required area matrix, S represents the area, m indicates the number of land types under the oasis or desert, S i j means the area of desert or oasis component i at the beginning of the study period transformed into j at the end of the study period.

2.2.3. Geographical Detector

Spatial heterogeneity refers to the uneven distribution of attributes within a region or strata; for example, dryland and paddy fields are in the cultivated land. And the spatial heterogeneity among regions or strata is called spatial stratified heterogeneity [46], such as the distribution of LULC in different areas, or the difference in population density in other regions and climates. This phenomenon of spatial stratified heterogeneity has been widely described, but it is essential to determine whether such is statistically significant and whether further analysis of the stratification is warranted, so a geographical detector has been developed to address the above questions. The geographical detector is a novel statistical model that detects spatial stratification and reveals its driving forces [36]. First used to study the risk of diseases (e.g., neural tube defects (NTD)) caused by geographic factors (e.g., watersheds, rocky areas and soils) [47,48,49,50], the geographical detector is now widely used to examine the relationship between landscape patterns or urbanization, etc. and their potential drivers [51,52,53,54]. It is based on the principle that variable X has a driving effect on variable Y if the spatial distribution between variables X and Y tends to be the same, and the q value is used to measure the magnitude of this driving effect. It has the advantage of not limiting the nature of the original data, which can be both numerical and qualitative. The geographical detector mainly consists of divergence and factor detection, interaction detection, risk area detection and ecological detection. Factor detection and interaction detection were used in this study.
(1) Factor detection is used to detect the degree of influence of a variable on oasis or desertification in the Manas River basin [36] and is measured by the q-value. The formula is as follows:
q = 1 h = 1 L ( N h σ h 2 ) N σ 2 = 1 S S W S S T S S T = h = 1 L ( N h σ h 2 ) ,     S S T = N σ 2  
In formula (4), q is the result of the factor detector, which is the driving force of the variable on oasification or desertification in the Manas River basin. q ranges from (0,1), when the value of q is 0, it means that there is no relationship between variable X and variable Y. When the value of q is 1, it means that variable Y is completely determined by variable X. When q its value is between 0 and 1, the larger the value indicates that the driving force of variable X on variable Y is more vital. N is the number of units in the whole region, h = 1, 2, …L is the Strata of variable X or Y, N h is the number of units in Strata h, is the variance of units h, σ 2 is the variance of the whole study area. SSW and SST are within the sum of squares and the total sum of squares, respectively.
(2) Detection of factors interaction identifies interactions between different independent variables, i.e., to determine whether the driving force on variable Y increases or decreases when variables X1 and X2 interact. Or are the effects of X1 and X2 on Y independent? [36]. Five types of interactions can be obtained by comparing the interaction q-value ( q X 1 X 2 ) and these two individual factors’ q-value ( q X 1 and q ( X 2 ) ) (Table 1).

2.3. Study Data

The data for analyzing the oasification and desertification in the study region were land use data, obtained from the Multi-period Land Use Remote Sensing Monitoring Dataset of China (CNLUCC) [55]. CNLUCC is a Chinese national-scale multi-period LULC thematic database constructed by manual visual interpretation using Landsat remote sensing imagery from the United States as the primary information source. In this study, we mainly obtained five periods of data from CNLUCC, 1980, 1990, 2000, 2010 and 2020, in which Landsat-MSS remote sensing image data with a resolution of 40m were mainly used in 1980, Landsat-TM/ETM remote sensing image data in 1990, 2000 and 2010, and Landsat OLI remote sensing image data with a resolution of 30 m in 2020. A cell size of 30 m was obtained by resampling the MSS image using the nearest neighbor method in ArcGIS 10.7. Then, based on the Classification of Land Use Status of China [56], the data were classified using a two-level classification system, with the first level classified as desert and oasis, taking into account the actual and research needs of the study area. The second level is further classified into nine types according to the first level type (Table 2). Among them, deserts include four types of sandy land, Gobi, bare land (bare land and bare rocky land) and saline marsh, and oases include five types of forest, grassland, cultivated land, water and construction land. Based on the distribution of oases and deserts in 1980, the expansion or reduction of oases (and woodland, grassland, water, cultivated land and construction land) in 1990 (known as oasification), and the expansion or reduction of the deserts (and sand, Gobi, bare land and saline marsh) (known as desertification) and so on, were observed in 10-year increments. And the reclassification was executed from ArcGIS to obtain five issues that can be used for remote sensing interpretation maps of the Manas River basin for desertification and oasification analysis.
According to the relevant literature [33,57,58], geological (soil type), topographic factors (elevation, slope, aspect), socioeconomic factors (population density, average land GDP) and climatic factors (average annual temperature, annual precipitation, average annual wind speed) were selected to construct the index system. The above model analysis shows that the area transformed into oasis in the study area peaked in 2000–2010, considering the data availability. Therefore, 2000–2010 is used as the study period to explore the drivers of oasification and desertification in the Manas River basin. The characteristics of these data are summarized in Table 3.
This study quantifies the area’s driving mechanisms of oasification and desertification in terms of four major factors: geology, topography, social economy and climate. Soil type data in the geological factors were obtained from the Chinese soil and topography database published by the Land Degradation Assessment in Drylands (LADA) project of the Food and Agriculture Organization of the United Nations (FAO). Elevation, slope and aspect data in the geological factors were extracted from elevation maps. The annual average temperature, annual precipitation and annual average wind speed in the climatic factors were obtained from the Annual Spatial Interpolation Dataset of Meteorological Elements in China [59]. Population and GDP data in the socioeconomic factors were obtained from the Xinjiang Statistical Yearbook and the Corps Statistical Yearbook for 2000 and 2010.

3. Results and Analysis

3.1. Spatiotemporal Evolution of Oasification and Desertification

3.1.1. Oasis and Desert Structural Features

The structural changes of deserts and oases in the Manas River Basin from 1980 to 2020 are depicted in Figure 2 and Table 4. Among them, figures (a)-(e) represent land use distribution maps for the years 1980, 1990, 2000, 2010, and 2020, respectively.
The comparison reveals a slight difference in the overall area between the oasis and the desert. The ratio of the oasis area to the total area of the study area witnessed an overall trend of “increase-decrease-increase” from 1980 to 2020. The percentages for each year are as follows: 56.11%, 56.83%, 56.7%, 57.82% and 58.37%, respectively. Between 1980 and 2020, the oasis area in the study area increased by 757.34 km2, which is 4.03% higher than the initial oasis area. Simultaneously, the desert area as a whole displayed a fluctuating trend of decrease, with the ratio of the desert area to the total study area being 43.89%, 43.71%, 43.3%, 42.18% and 41.63% for the respective years. The desert area decreased by 757.34 km2 during this period, accounting for a 5.15% reduction compared to the initial desert area. In the oases, the cultivated land, construction land and water area increased significantly from 1980 to 2020, by 2036.53, 251.03 and 183.46 km2, respectively. Compared with the area in 1980, construction land had the most significant increase (86.39%), followed by cultivated land (34.91%) and water (20.65%). The overall area of grassland and forest decreased, by 1631.95 km2 and 81.74 km2, respectively, with a decrease of 14.51% and 15.14%. Among deserts, the area of sandy land and saline marsh decreased significantly from 1980 to 2020, by 438.83 and 307.11 km2, respectively, and compared with the initial area, saline marshes had the most significant reduction (59.46%), followed by sandy land (7.33%). In addition, the overall area of Gobi and bare land changed, but not significantly: the area of Gobi decreased by 13.97 km2, a decrease of 0.33%; the area of bare land increased by 2.57 km2, an increase of 0.06%.
A precise temporal scale characterizes the evolution of deserts and oases in the Manas River basin. In terms of oasis, the cultivated land had the most significant area change (2036.53 km2) in the last 40 years. From 1980 to 1990, the cultivated land area expanded by 137.00 km2. Subsequently, from 1990 to 2000 and from 2000 to 2010, there was a particularly notable increase in area, with expansions of 650.74 km2 and 782.28 km2, respectively. However, the expansion slowed down from 2010 to 2020, with an increase of 466.50 km2. The area of grassland decreased the most in the last 40 years (−1631.95 km2), not significantly in 1980–1990 (−28.25 km2) but declined precipitously in 1990–2000 (−672.71 km2) and leveled off in 2000–2010 and 2010–2020, but is still not negligible, with reductions of 441.26 and 489.73 km2, respectively. The land area for construction has changed considerably in the four time periods, among which 1980–1990 and 2010–2020 are more prominent, with an increase of 76.03 and 96.70 km2, respectively. In terms of the desert, the most significant change in sandy land area was observed between 1980 and 2020, with a substantial decrease in the area from 1980 to 1990 (−331.48 km2) and a significant increase from 1990 to 2000 (114.79 km2), which may be due to the rebound of the desert brought by desertification control. Saline marshes showed little change in area between 1980–1990 and 1990–2000 (71.93 and −60.71 km2) and decreased significantly between 2000–2010 and 2010–2020 (−190.32 and −128.02 km2).

3.1.2. Desert and Oasis Dynamic Degree Analysis

The rates of oasis and desert changes are shown by single and comprehensive dynamic degrees. As can be seen from Table 5, the oasis dynamic degree in the Manas River basin was 0.08% during 1980–1990, indicating that the annual rate of oasis change was flat. Among them, the annual rate of change of construction land is the largest in absolute value (2.62%), followed by the annual dynamic degree of water area (0.46%), the annual dynamic degree of cultivated land and forest land is similar in absolute value, and the annual dynamic degree of grassland is the smallest in absolute value (0.03%).
The rate of oasis change accelerated from 1990 to 2000, with a comprehensive dynamic degree of 0.38%. Among them, the absolute value of the forest dynamic degree is the largest, 1.41%, the middle of cultivated land and construction land dynamic degree and the smallest of grassland and water dynamic degree.
The rate of change of oasis slowed down in 2000–2010 and 2010–2020, with comprehensive dynamic degrees of 0.33% and 0.30%, respectively. In the first ten years, the rate of change of cultivated land was the largest, with an absolute value of degree of 1.18%, followed by construction land, grassland, forest land and water area. In the latter ten years, the absolute values of construction land and water dynamic degree were the largest, with 2.17% and 1.21%, respectively, while the absolute values of dynamic degree for cultivated land and grassland are in the middle and the absolute value of the dynamic degree for forest was the smallest.
Regarding deserts, the comprehensive dynamic degree of deserts during 1980–2020 was larger only in 1980–1990 and 2000–2010, with 0.15% and 0.14%, respectively, and 0.07% in the other two periods. Regarding single dynamic degree, saline marshes are the largest in absolute value in all four periods, followed by sandy land. The Gobi and bare land dynamic degree are basically zero.
Among the dynamic degree, construction land and cultivated land in oasis are the land types constantly changing, consistent with the conclusion in the structural analysis above. Forest and water are occasionally active, and grassland is relatively stable, which contradicts the structural change analysis above that grassland has the most significant reduction in area, which the large base of grassland area may cause. The reduction of grassland area in each period has little impact. Saline marshes are the most active land type in deserts, followed by sandy land, and the most stable desert land types are Gobi and bare land.

3.1.3. Temporal Characterization of Oasification and Desertification

The land transfer model was used to acquire the temporal change characteristics of desertification and oasification interconversion using ArcGIS 10.7 software (Table 6, Table 7, Table 8 and Table 9).
The temporal characteristics of oasification were analyzed by considering the oasis as a whole and the desert, Gobi, bare land and saline marsh as individual units. The areas shifting from desert to oasis exhibited a “decreasing-increasing-decreasing” trend. The conversion areas were similar between the periods of 1980 to 1990 and 2000 to 2010, amounting to 410.64 km2 and 413.85 km2 respectively. The smallest conversion area was observed from 1990 to 2000, with a measurement of 125.04 km2, followed by 154.48 km2 from 2010 to 2020. Next, the temporal characteristics of desertification are analyzed by taking the desert as a whole, taking the cultivated land, forest, grassland, water and construction land as units. Specifically, 1980–1990, 1990–2000, 2000–2010 and 2010–2020 oasis-to-desert conversion areas are 170.58, 169.79, 35.83 and 29.60 km2, respectively, showing a continuous decrease trend.
In the oasification, the area converted from saline marsh to oasis gradually increased from 1980 to 2010, reaching a peak of 222.07 km2 in 2010, then decreased from 2010 to 2020. The conversion area of sandy land to oasis showed a fluctuating downward trend, with the maximum area (369.44 km2) in 1980–1990 and the minimum area (19.35 km2) in 1990–2000. The conversion of bare land to oasis increased first and then decreased throughout the study period. Still, the total transformation was insignificant (46.33 km2), while there was almost no conversion of Gobi to oasis (19.37 km2). During 1980–2020, sandy land and saline marsh conversion to oasis accounted for 94.39% of the total conversion area. Thus, saline marsh and sandy land were the primary sources of oasis conversion.
Among desertification, grassland was the primary source of desert in 1980–1990, 1990–2000 and 2000–2010 with 65.19%, 75.55% and 90.81% contribution, respectively, but its contribution declined in 2010–2020 with only 13.94%. Cultivated land was the secondary source of desert in 1980–1990 and 1990–2000 with 34.72% and 11.66% contribution, respectively, but its contribution decreased in 2000–2020 with almost 0. Watershed contributed less to desert in 1980–2010 with 0.08%, 8.1% and 8.13%, respectively, and became the main source of desert in 2010–2020, with a contribution rate of 85.65%. The contribution rate of forest to desert increases first and then decreases and reaches its peak (4.69%) in 1990–2000. The contribution rate of construction land is the lowest, and its value is almost 0 in four periods. The contribution of desertification is ranked as follows: grassland > cultivated land > water > forest > construction land. Therefore, grassland and cultivated land are the primary sources of desertification.
Overall, the existing land use pattern in the Manas River basin results from the interaction of both oasification and desertification. Desertification shows a continuous decreasing trend, while oasification shows a “decreasing–increasing–decreasing” trend. In 1980–1990, the area of oasification was higher than the area of desertification; in 1990–2000, desertification was higher than oasification; and in 2000–2020, oasification was higher than desertification, which indicates that the Manas River Basin is currently in the stage of oasis expansion.

3.1.4. Spatial Characterization of Oasification and Desertification

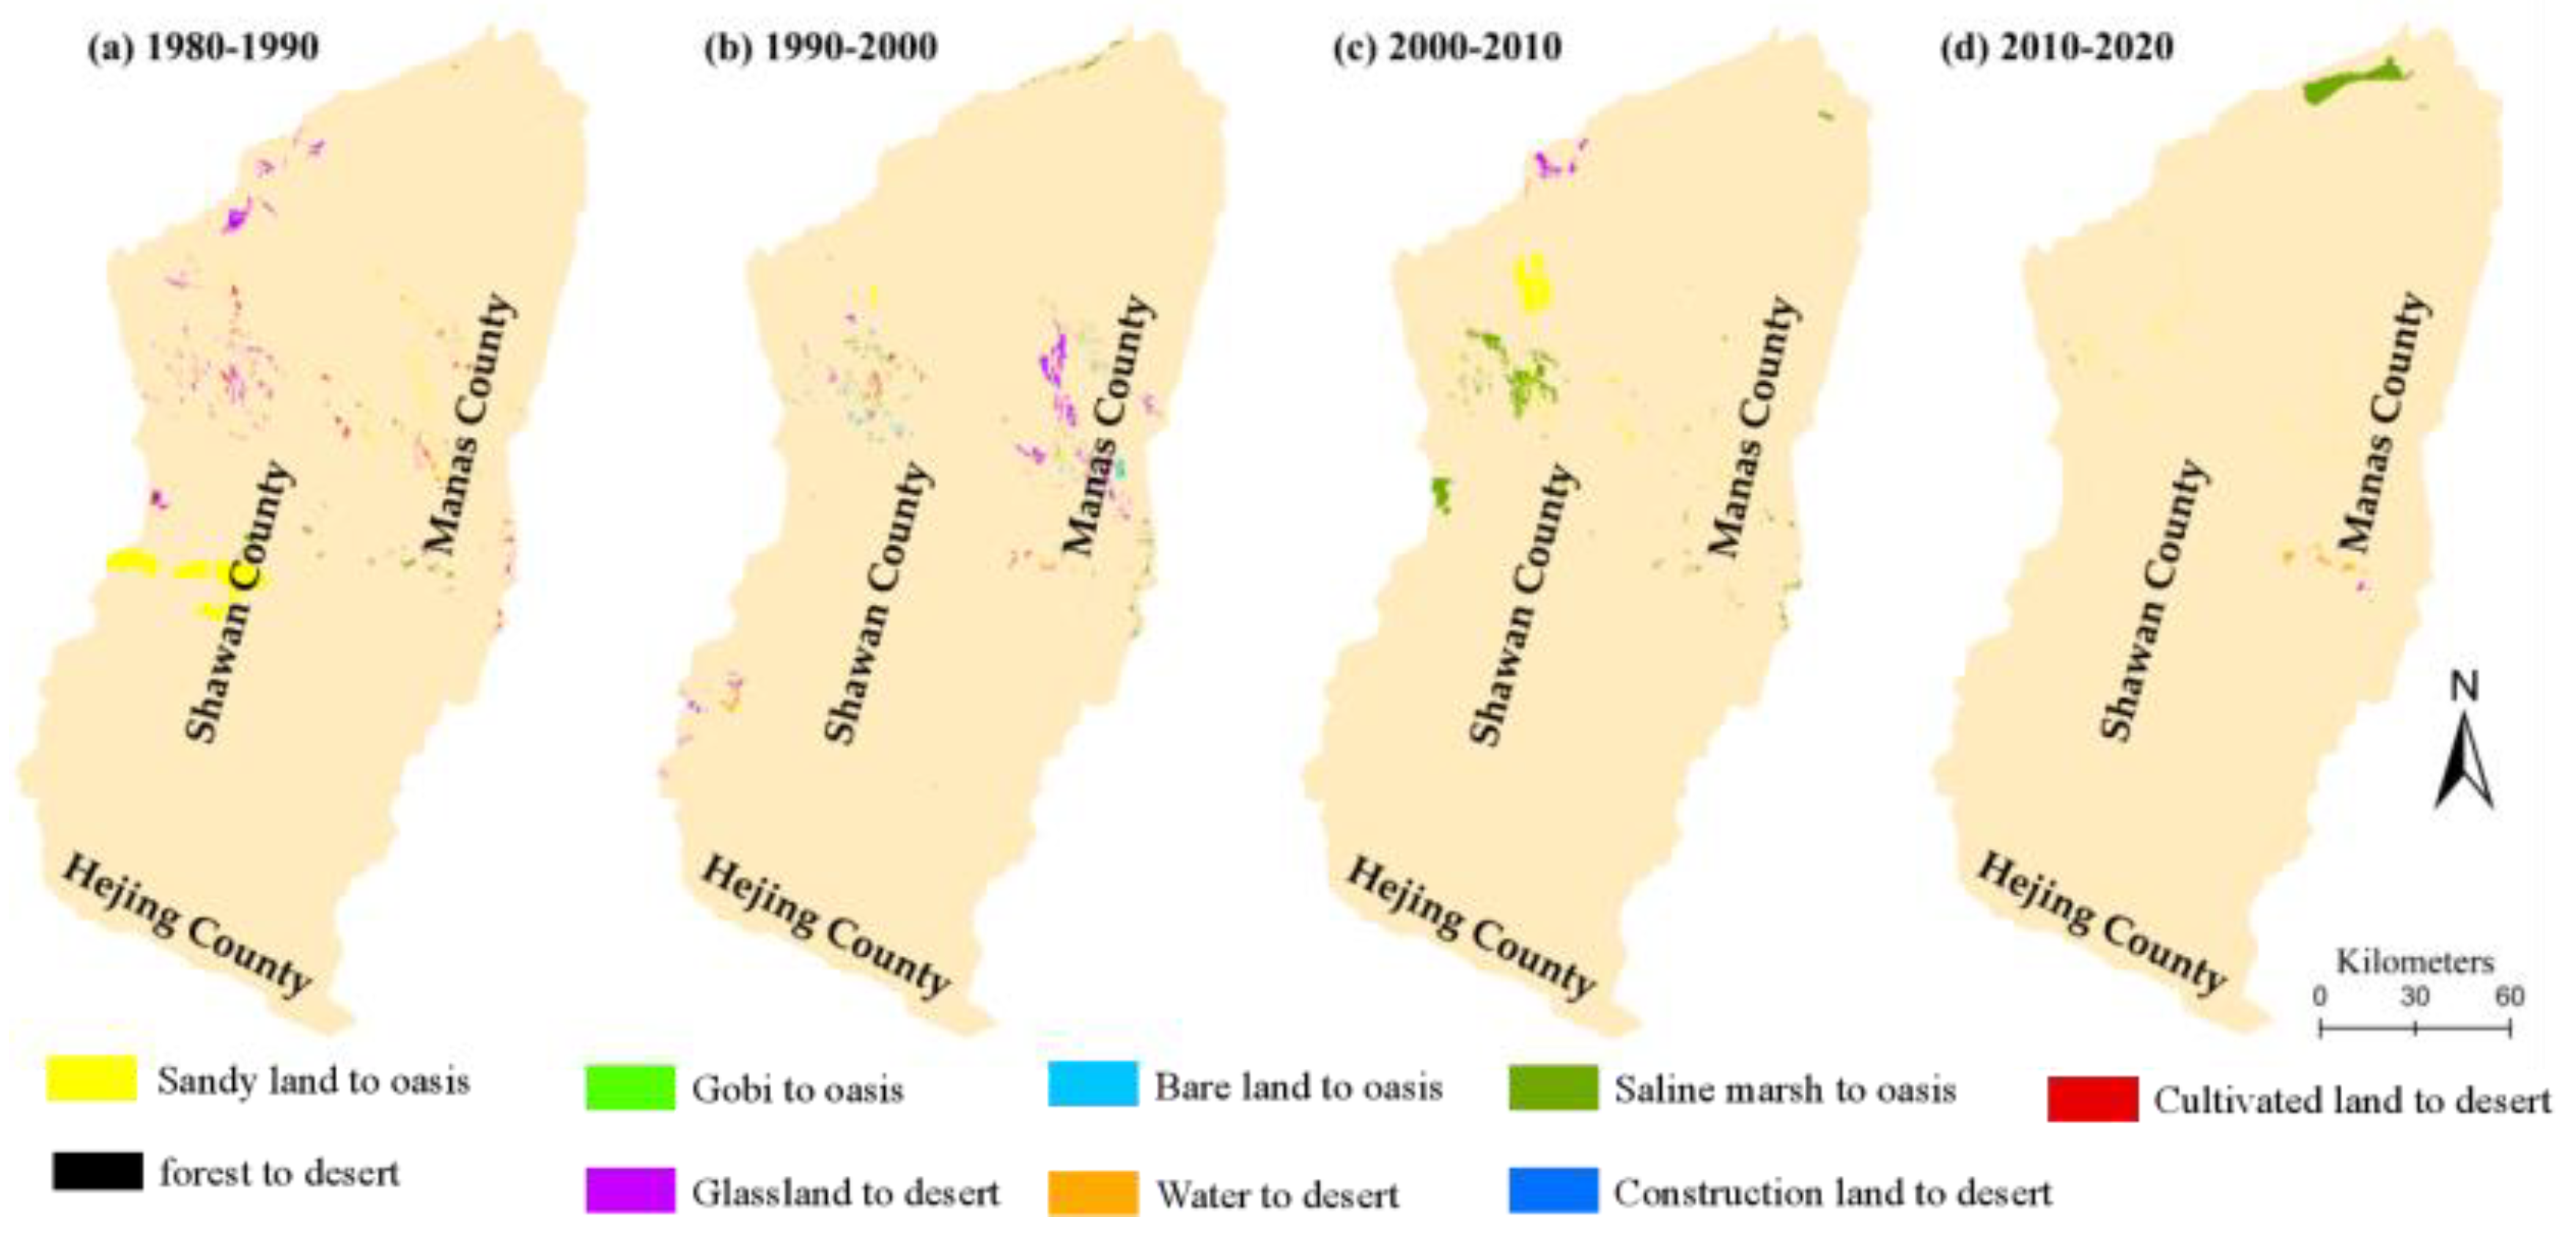
Through ArcGIS 10.7 software, the spatial distribution map of the mutual transfer of oasis and desert was output (Figure 3) to obtain the spatial characteristics of desertification and oasification in the Manas River basin. Figure 3a shows the spatial distribution of oasification and desertification in the Manas River basin during 1980–1990. Oasification is mainly distributed in the central and west-central part of the study area, within Shawan County and Dushanzi District, within the grassland, and a small part is located in the north-central part of Manas County. At the same time, desertification is heavily concentrated in the north-central and west-central parts of the study area, mainly located in the interlacing zone of oasis and desert or Gobi. Figure 3b shows the spatial distribution of oasification and desertification in the Manas River basin from 1990 to 2000. Oasification is mainly located in the north-central part, where oasis and desert are interspersed. At the same time, desertification is heavily concentrated in the northern part of Manas County, and a small part is located in the mosaic of desert and grassland in Usu City. Figure 3c presents the spatial distribution of oasification and desertification in the Manas River basin during 2000–2010. Oasification is mainly distributed in the western part of the study area, within Shawan County and Kuitun City, with sandy land and saline marsh as the main transformers. At the same time, grassland is the primary source of desertification, mainly within the alkaline zone. Figure 3d shows the spatial distribution of oasification and desertification in the Manas River basin during 2010–2020, during which oasification was mainly located in and around Manas Lake and desertification was located primarily on the northern administrative boundary of Shihezi City.
During 1980–2020, the spatial distribution of oasification shifted from central to east-west and then to northeast, and the spatial distribution of desertification shifted from east-west to east-central. In the past 40 years, the areas that are more prone to oasification are located in deserts within grasslands, where deserts and oases border, followed by saline marsh, and finally where Gobi and oases border, with sandy land more easily transformed into grasslands and saline marsh transformed into waters. The Gobi and bare land are more solid and less likely to be changed. The areas more prone to desertification are also mainly located where grassland, cultivated and sandy land border and construction land and water. Grassland and cultivated land are more likely to be transformed into desert, while forest is the most stable and less susceptible to desert erosion. Overall, oasis and desert transformation are more intense at the intersection of oasis and desert, and more prone to oasification or desertification. Sandy land and saline marsh are more prone to oasis, grasslands and cultivated land are unstable and more prone to desertification, and forests are the most stable and less prone to desertification.

3.2. Analysis of Driving Factors

3.2.1. Detection of Single Factor

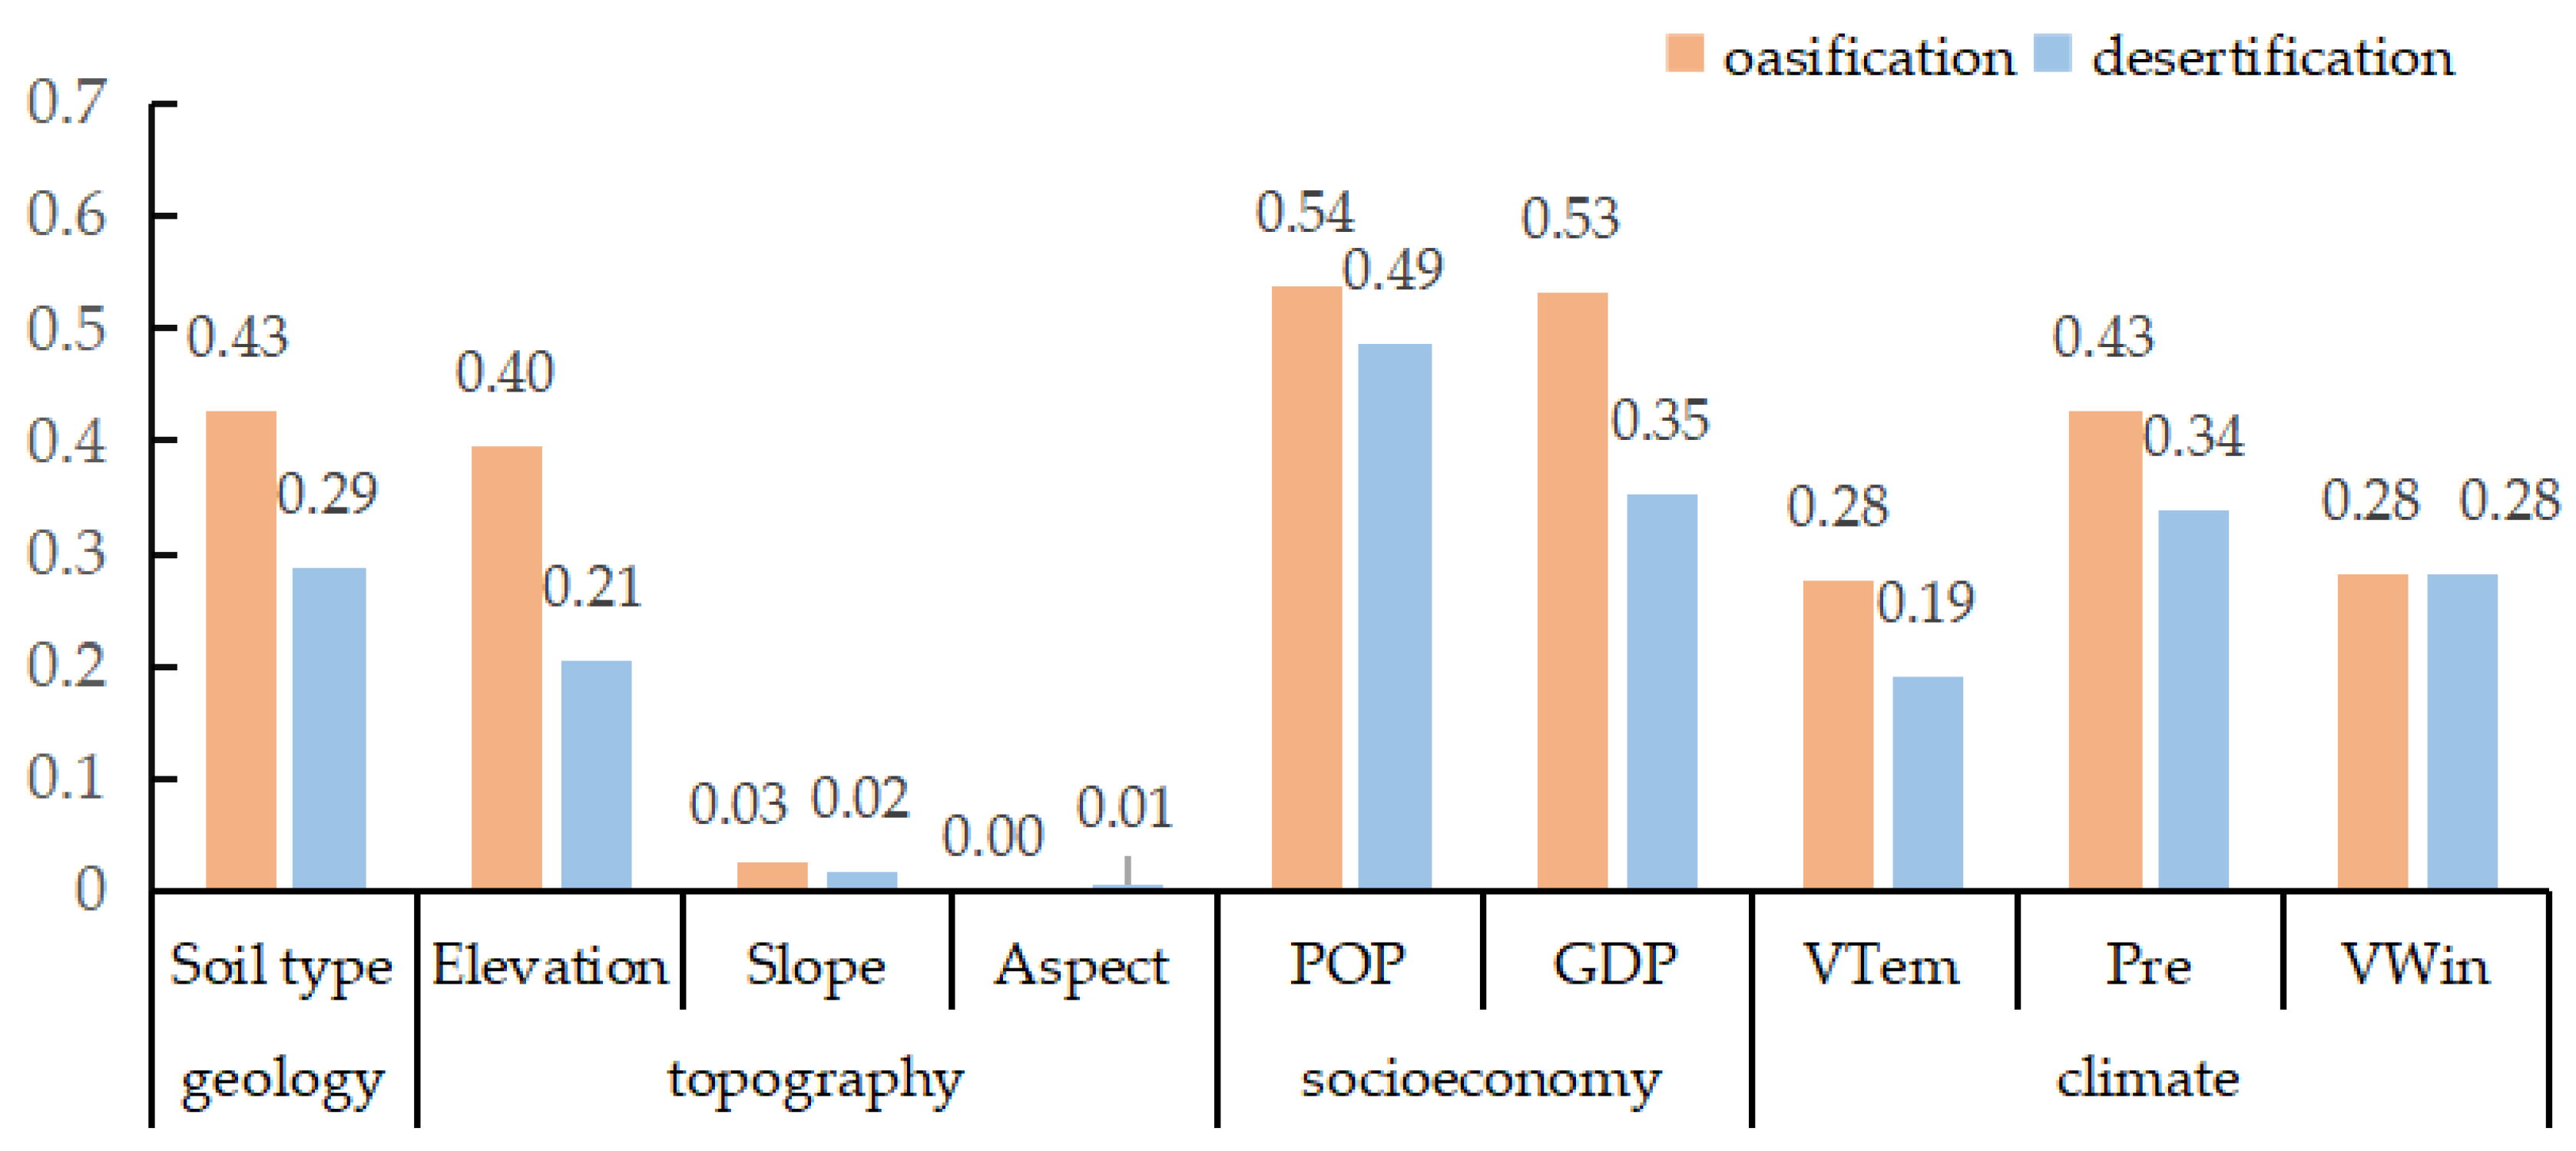
A geographic detector was applied to reveal the primary factors driving the spatial and temporal evolution of oasification and desertification in the Manas River basin. The area of sandy land, Gobi, bare land and saline marsh transformed into oasis is taken as the dependent variable Y1, and the area of cultivated land, forest, grassland, water and construction land transformed into desert is taken as the dependent variable Y2. The geographic detector explores the degree of influence of geological, topographical, socioeconomic and climatic factors on oasification and desertification. q values in the results (Figure 4) are the required driving force. p values are significance levels, and the vast majority of p-values in the results are 0, indicating that the results are significant and that the driving force of the driving factors on the dependent variables is credible.
The q-values of the driving factors affecting oasification in the Manas River basin are ranked as follows: Population density > Average land GDP > Soil type > Annual precipitation > Elevation > Average annual wind speed > Average annual temperature > Slope > Aspect, with most q-values below 0.3. The contribution of population density, average land GDP, soil type and annual precipitation to oasification (all greater than 0.4) is significantly more substantial than other factors, indicating that these four factors are the key factors driving oasification in the Manas River basin. These are followed by elevation, mean annual temperature and mean annual wind speed, which had q-values of 0.395, 0.276 and 0.282, respectively, with driving rates above 28%, indicating that these factors significantly influence oasification.
The q-values of the driving factors affecting desertification in the Manas River basin are ranked as follows: Population density > Average land GDP > Annual precipitation > Soil type > Average annual wind speed > Elevation > Average annual temperature > Slope > Aspect. The q-values of population density and averaged land GDP among the socio-economic factors were 0.488 and 0.354, respectively, with a driving rate of more than 35%, which were the key influences driving desertification in the Manas River Basin. And the q-values of annual precipitation, soil type, average annual wind speed, elevation and average annual temperature were 0.34, 0.288, 0.281, 0.206 and 0.191, respectively, with a driving rate of more than 19%, which had a more significant influence on desertification. In contrast, the q-values of slope and aspect among the topographic factors were 0.018 and 0.005, respectively, with a driving rate of less than 2%, which had a lesser influence on desertification.

3.2.2. Interaction Detection of Dual Factor

Using nine types of driving factors for interaction detection, the results (Table 10 and Table 11) present that the q-values of the interactions were all greater than the maximum of the q-values of any two factors or the sum of the two, for two-factor enhancement or non-linear enhancement, weakening or independent of each other does not exist. It indicates that the results of oasification and desertification in the Manas River Basin are driven by multiple factors together. The larger the interaction q value of the two factors, the higher the influence of two-factor interaction on oasification or desertification.
The six groups with the highest interaction driving force in the oasification process in descending order were: average land GDP and elevation, mean annual temperature and average land GDP, average land GDP and soil type, annual precipitation and average land GDP, average land GDP and population density, mean annual wind speed and average land GDP, and population density and elevation, and all six groups interacted at more than 64%. And after interacting with other factors, the driving force of economic factors increased significantly. The single slope and aspect factors had minor oasification driving forces. However, after interacting with other factors, the driving force increased significantly, and all showed non-linear enhancement.
In the desertification process, after the interaction of driving factors, the driving factors with higher driving forces in order are the interaction of mean annual wind speed and population density with a driving force of 0.614; the interaction of population density and elevation with a driving force of 0.602; the interaction of annual precipitation and population density with a driving force of 0.601; the interaction between population density and soil type is the same as the interaction between mean annual temperature and population density, both with a driving force of 0.6. The driving force of a single climatic factor on desertification in the Manas River basin is weak. Still, it is higher than that of climatic factors interacting with other factors after interacting with social economic factors. This suggests that the climatic factors will significantly affect the transformation of the oasis into desert after the population and economic factors reach certain climatic conditions.
4. Discussion

Through the above analysis, the oasification and desertification in the Manas River basin were more significant in each period from 1980 to 2020, with the total oasification area accounting for 4.03% of the initial oasis area and the total desertification area accounting for −5.15% of the initial total desert area. Among them, the oasis is dominated by the expansion of cultivated land, which coincides with the findings of Wang et al. [60] and Li et al. [61]. And where the most significant increase in cultivated land area from 1990 to 2010 was due to the growth in population size that promoted the rise in food demand and the limited amount of cultivated land, thus reclaiming cultivated land to balance the existing contradiction. On the other hand, the widespread diffusion of drip irrigation technology since 1999 has increased the efficiency of water resources, which have been used to reclaim newly cultivated land and reuse abandoned land. Li et al. [62] found a continuous decrease in grassland in the Manas River basin from 1976 to 2015, which is consistent with the conclusion that the single dynamic degree of grassland is less than 0 and shows a retreat from 1980 to 2020 in this study. But this study also found sandy land decreased the most in these nearly 40 years among the four secondary classifications of the desert. On the one hand, this was due to the reduction of the sandy land area as a result of the reclamation mentioned above of cultivated land, and on the other hand, due to the implementation of ecological projects such as afforestation and wind and sand control.
In the process of desertification, grassland was the main contributor to the desert in 1980–2020, with the area converted to desert accounting for 16.9% of the total reduction, followed by cropland, mainly in 1980–1990. The transformation of water into desert primarily occurred between 2010 and 2020, which may be because although the drip irrigation technology mentioned above saves a certain amount of water resources, the uncontrolled development of cultivated land exacerbates the contradiction between the supply and demand of water resources, resulting in a drastic reduction of water resources in a short period, which is more consistent with the arguments related to the existing literature [63]. In the process of oasification, the area converted from sandy land to oasis exceeded the total area reduced in the study period, which is due to the unstable sandy land morphology, where the sandy land is treated as oasis and then transformed into sandy land, and the transformation morphology is more frequent. Secondly, the most significant area converted to oasis is saline marsh, mainly converted to cultivated land. Therefore, oasis is primarily derived from the exploration and transformation of sandy land and saline marsh, and the increase is mainly cultivated land and construction land. In contrast, desertification is mainly derived from grassland and cultivated land, and the growth is mainly sandy land and saline marsh. Meanwhile, the conversion between oasis and desert is more likely to occur where the oasis–desert borders, because at the intersection, the confrontation between the two is more intense and the mutual conversion is more frequent; oasification and desertification are more likely to occur, followed by the ease of oasification of sandy land within oases and desertification of grasslands within deserts, consistent with some literature findings [64].
Among the driving factors of the spatial and temporal evolution of oasification and desertification, population density, average land GDP, soil type and annual precipitation are the key drivers of oasification in the Manas River Basin from 2000 to 2010, and the increasing population and socioeconomic development drive people to develop the desert, thus balancing the "human-cultivated land" imbalance. In addition to socioeconomic factors, geological and other natural factors also drive the evolution of oasification. Population density and average land GDP are the critical drivers of desertification in the Manas River basin from 2000 to 2010, which may be due to the increase in population and socioeconomic development exceeding the local oasis carrying capacity (e.g., depletion of water resources), resulting in the rebound of the desert and thus becoming the primary driver of desertification.

5. Conclusions

5.1. Research Conclusions

The spatiotemporal evolution pattern of desertification–oasification in the Manas River Basin 1980–2020 was obtained using the dynamic degree and land transfer matrix. The driving factors behind the desertification–oasification in the Manas River Basin from 2000 to 2010 were identified through factor and interaction detection conducted by the geographic detector. The main findings of the study are as follows.
(1) Regarding structural characteristics, the geographical landscape of the Manas River basin from 1980 to 2020 is dominated by oases, with oases accounting for more than 50% of the area. The overall trend is “expansion-recession-expansion” except for 1990–2000 when it was in retreat; all other periods were in expansion, and the desert was in “retreat-expansion-retreat.” The oasis area expanded the fastest from 2000 to 2010, with the growth and change rate up to 378.03 km2 and 1.9%, and the dynamic degree was much larger than that of the desert from 1990 to 2020, and both remained at 0.3% and above.
(2) In terms of the temporal evolution of oasification and desertification, the total area shifted from desert to oasis in the Manas River basin from 1980 to 2020 was as high as 1162.6 km2, and the overall desert to oasis shift showed a “decrease-increase-decrease ” trend, and the total transfer area from the oasis to the desert is up to 405.79 km2, with an overall trend of continuous decrease. In 1980–1990 the area of oasification was more significant than the area of desertification; in 1990–2000, the area of desertification was larger than the area of oasification; and in 2000–2020, the area of the oasis was larger than the area of desertification. The primary sources of oasification are sandy land and saline marshes, while the primary sources of desertification are grasslands and croplands.
From the spatial characteristics of oasification and desertification, they mainly occur in the border between oasis and desert, local desert development within large oasis and oasis degradation within large deserts. From the administrative division, oasification is mainly distributed in Shawan County; desertification is primarily distributed in Shawan County from 1980 to 1990, Manas County from 1990 to 2000 and from 2010 to 2020. The spatial distribution of oasification is shifted from central to northwest and then to northeast during 1980–2020, and the spatial distribution of desertification is shifted from northwest to northeast.
(3) The four factors of population density, average land GDP, soil type and annual precipitation are the key factors driving the degree of oasification in the Manas River basin from 2000 to 2010, with the driving force q-values above 0.4. The two factors of population density and average land GDP are the key factors driving the degree of desertification in the Manas River basin from 2000 to 2010, with a driving force above 0.35. The driving force of all the factors increased significantly after the interaction, and the influence of socioeconomic factors on the degree of oasification and desertification in the Manas River basin was higher than other factors.

5.2. Limitations and Directions for Future Research

Research limitations and future research directions are as follows: (1) In this study, the period of 2000–2010, the largest oasification area, was selected due to the availability of data to explore the driving factors of the spatiotemporal evolution of oasification in the Manas River basin and more extended time data can be used to explore the mechanism in the future further to obtain more general conclusions. (2) The analysis of desertification-oasification characteristics shows that the place where the transition between desert and oasis is more frequent is at the junction of the two, and the next step can be to explore how the stability of the desert–oasis transition zone is maintained. Secondly, it is known from the study’s conclusion that the current Manas River basin is in the stage of continuous oasis expansion, and the oasis area is still increasing with the addition of human factors. Li et al. [62] proposed that the constant increase of the oasis area will not only help the ecological environment, but also lead to its deterioration. In contrast, the oasis in the Manas River basin is mainly the continuous increase of cultivated land area; the next step can be from the suitable scale of cultivated land, the oasification governance and other aspects of research.

Author Contributions

Conceptualization, H.Z., J.L., X.Y. and X.Z.; methodology, J.L., X.Y. and X.Z.; software, J.L.; validation, H.Z., J.L. and X.Z.; formal analysis, J.L.; resources, J.L.; data curation, J.L.; writing—original draft preparation, J.L.; writing—review and editing, J.L.; visualization, J.L.; supervision, H.Z., X.Y.; funding acquisition, H.Z., X.Y. All authors have read and agreed to the published version of the manuscript.

Funding

This research was funded by the Corps Social Science Foundation of China (XiaoJun Yin; HongHui Zhu: Nos. 20YB23; Nos. 21YB05).

Data Availability Statement

The data and models used during the study are available from the corresponding author by request.

Conflicts of Interest

The authors declare no conflict of interest.

References

  1. Wang, T. Review and Prospect of Research on Oasification and desertification in Arid Regions. J. Desert. Res. 2009, 29, 1–9. [Google Scholar]
  2. Shen, W.; Zheng, Z.; Qin, Y.; Li, Y. Spatiotemporal Characteristics and Driving Force of Ecosystem Health in an Important Ecological Function Region in China. Int. J. Environ. Res. Public Health 2020, 17, 5075. [Google Scholar] [CrossRef]
  3. Monforte, P.; Ragusa, M.A. Temperature Trend Analysis and Investigation on a Case of Variability Climate. Mathematics 2022, 10, 2202. [Google Scholar] [CrossRef]
  4. Briassoulis, H. Combating Land Degradation and Desertification: The Land-Use Planning Quandary. Land 2019, 8, 27. [Google Scholar] [CrossRef] [Green Version]
  5. Kirkby, M. Desertification and development: Some broader contexts. J. Arid. Environ. 2021, 193, 104575. [Google Scholar] [CrossRef]
  6. Wang, T.; Liu, S.L. Regionalization for Regulating Oasification and Desertification in the Arid Regions of China: Aprogram. J. Desert. Res. 2013, 33, 959–966. [Google Scholar]
  7. Verón, S.R.; Paruelo, J.M.; Oesterheld, M. Assessing desertification. J. Arid Environ. 2006, 66, 751–763. [Google Scholar] [CrossRef]
  8. Salvati, R.; Salvati, L.; Corona, P.; Barbati, A.; Ferrara, A. Estimating the sensitivity to desertification of Italian forests. Iforest 2014, 8, 287–294. [Google Scholar] [CrossRef] [Green Version]
  9. Vendruscolo, J.; Marin, A.M.P.; Felix, E.D.; Ferreira, K.R.; Cavalheiro, W.C.S.; Fernandes, I.M. Monitoring desertification in semiarid Brazil: Using the Desertification Degree Index (DDI). Land Degrad. Dev. 2021, 32, 684–698. [Google Scholar] [CrossRef]
  10. Filei, A.A.; Slesarenko, L.A.; Boroditskaya, A.V.; Mishigdorj, O. Analysis of Desertification in Mongolia. Russ. Meteorol. Hydrol. 2018, 43, 599–606. [Google Scholar] [CrossRef]
  11. Liu, S.L.; Wang, T.; Kang, W.P.; David, M. Several challenges in monitoring and assessing desertification. Environ. Earth Sci. 2015, 73, 7561–7570. [Google Scholar] [CrossRef]
  12. Wang, X.; Ge, Q.; Geng, X.; Wang, Z.; Gao, L.; Bryan, B.A.; Chen, S.; Su, Y.; Cai, D.; Ye, J.; et al. Unintended consequences of combating desertification in China. Nat. Commun. 2023, 14, 1139. [Google Scholar] [CrossRef]
  13. Al-Obaidi, J.R.; Allawi, M.Y.; Al-Taie, B.S.; Alobaidi, K.H.; Al-Khayri, J.M.; Abdullah, S.; Ahmad-Kamil, E.I. The environmental, economic, and social development impact of desertification in Iraq: A review on desertification control measures and mitigation strategies. Environ. Monit. Assess. 2022, 194, 440. [Google Scholar] [CrossRef]
  14. Sun, C.L.; Feng, X.M.; Fu, B.J.; Ma, S.J. Desertification vulnerability under accelerated dryland expansion. Land Degrad. Dev. 2023, 34, 1991–2004. [Google Scholar] [CrossRef]
  15. Daza, Y.C.; Laguna, M.F.; Monjeau, J.A.; Abramson, G. Waves of desertification in a competitive ecosystem. Ecol. Model. 2019, 396, 42–49. [Google Scholar] [CrossRef] [Green Version]
  16. Bao, Y.S.; CHENG, L.L.; Bao, Y.F.; Yang, L.; Jiang, L.N.; Long, C.; Kong, Z.; Peng, P.; Xiao, J.; Lu, Q. Desertification: China provides a solution to a global challenge. Front. Agric. Sci. Eng. 2017, 4, 402–413. [Google Scholar] [CrossRef] [Green Version]
  17. Rivera-Marin, D.; Dash, J.; Ogutu, B. The use of remote sensing for desertification studies: A review. J. Arid. Environ. 2022, 206, 104829. [Google Scholar] [CrossRef]
  18. Ma, X.F.; Zhu, J.T.; Yan, W.; Zhao, C.Y. Projections of desertification trends in Central Asia under global warming scenarios. Sci. Total Environ. 2021, 784, 146777. [Google Scholar] [CrossRef]
  19. Xue, J.G.; Dong, W.L.; Jia, Q.S.; Huai, W.Z.; Fan, J.M.; Dong, L.J.; Qian, L.Y. Oasification: An unable evasive process in fighting against desertification for the sustainable development of arid and semiarid regions of China. Catena 2019, 179, 197–209. [Google Scholar] [CrossRef]
  20. Chasek, P.; Akhtar-Schuster, M.; Orr, B.J.; Luise, A.; Ratsimba, H.R.; Safriel, U. Land degradation neutrality: The science-policy interface from the UNCCD to national implementation. Environ. Sci. Policy 2019, 92, 182–190. [Google Scholar] [CrossRef]
  21. Stavi, I.; Lal, R. Achieving Zero Net Land Degradation: Challenges and opportunities. J. Arid. Environ. 2015, 112, 44–51. [Google Scholar] [CrossRef]
  22. Zhu, H.; Du, M.; Yin, X. Oasification in Arid and Semi-Arid Regions of China: New Changes and Re-Examination. Sustainability 2023, 15, 3335. [Google Scholar] [CrossRef]
  23. Wang, T. Some Issues on Oasification Study in China. J. Desert. Res. 2010, 30, 995–998. [Google Scholar]
  24. Lyu, Y.; Shi, P.; Han, G.; Liu, L.; Guo, L.; Hu, X.; Zhang, G. Desertification Control Practices in China. Sustainability 2020, 12, 3258. [Google Scholar] [CrossRef] [Green Version]
  25. Feng, Q.; Ma, H.; Jiang, X.; Wang, X.; Cao, S. What Has Caused Desertification in China? Sci. Rep. 2015, 5, 15998. [Google Scholar] [CrossRef] [Green Version]
  26. Zhang, Z.; Huisingh, D. Combating desertification in China: Monitoring, control, management and revegetation. J. Clean. Prod. 2018, 182, 765–775. [Google Scholar] [CrossRef]
  27. Liu, Z.; Song, Y.; Huang, S.; Li, H. Study on Desertification Control in China; Social Sciences Academic Press: Beijing, China, 2019; p. 14. [Google Scholar]
  28. Yu, X.; Lei, J.; Gao, X. An over review of desertification in Xinjiang, Northwest China. J. Arid Land 2022, 14, 1181–1195. [Google Scholar] [CrossRef]
  29. Fan, X.B.; Yan, L.L.; Xu, J.H.; Hao, X.H.; Li, H.Y.; Wang, J.; Liu, D.F. Analysis of glacier change in Manas River basin in the last 50 years based on multi-source data. J. Glac. Geocryol. 2015, 37, 1188–1198. [Google Scholar]
  30. Du, Z.; Xu, X.; Zhang, H.; Wu, Z.T.; Liu, Y. Geographical detector-based identification of the impact of major determinants on aeolian desertification risk. PLoS ONE 2016, 11, e0151331. [Google Scholar] [CrossRef]
  31. Liu, J.; Kuang, W.; Zhang, Z.; Xu, X.L.; Qin, Y.W.; Ning, J.; Zhou, W.C.; Zhang, S.W.; Li, R.D.; Yan, C.Z.; et al. Spatiotemporal characteristics, patterns, and causes of land-use changes in China since the late 1980s. J. Geogr. Sci. 2014, 24, 195–210. [Google Scholar] [CrossRef]
  32. Sun, J.G.; Li, B.G.; Lu, Q. Temporal-Spatial Analysis of Water and Cause of Desertification in Gong-he Basin in Qinghai Province. Resourc. Sci. 2004, 28, 55–61. [Google Scholar]
  33. Tang, F.S.; Chen, X.; Luo, G.P.; Lin, Q.; Liu, H.L. A contrast of two typical LUCC processes and their driving forces in oases of arid areas: A case study of Sangong River Watershed at the northern foot of Tianshan Mountains. Sci. China Series. D Earth Sci. 2007, 50, 65–75. [Google Scholar] [CrossRef]
  34. Wang, M.; Yang, M. Analysis of the Evolution of Land-Use Types in the Qilian Mountains from 1980 to 2020. Land 2023, 12, 287. [Google Scholar] [CrossRef]
  35. Zhang, J.X.; Gong, J.; Liu, D.Q. Dynamics and Driving Factors of Landscape Fragmentation Based on GeoDetector in the Bailongjiang Watershed of Gansu Province. Sci. Geogr. Sin. 2018, 38, 1370–1378. [Google Scholar]
  36. Wang, J.F.; Xu, C.D. Geodetector: Principle and prospective. Acta Geogr. Sin. 2017, 72, 116–134. [Google Scholar]
  37. Yang, A.M.; Zhu, L.; Chen, S.H.; Jin, H.; Xia, X.X. Geo-informatic spectrum analysis of land use change in the Manas River Basin, China during 1975–2015. Chin. J. Appl. Ecol. 2019, 30, 3863–3874. [Google Scholar]
  38. Yang, F.X. Some Problems on the Land Use and Degradation in Manas River Watershed. Environ. Prot. Xinjiang 2002, 24, 8–12. [Google Scholar]
  39. Wang, X.L.; Bao, Y.M. Study on the methods of land use dynamic change research. Prog. Geogr. 1999, 18, 83–89. [Google Scholar]
  40. Jiang, P.; Cheng, L.; Li, M.; Zhao, R.F.; Duan, Y.W. Impacts of LUCC on soil properties in the riparian zones of desert oasis with remote sensing data: A case study of the middle Heihe River basin, China. Sci. Total Environ. 2015, 506, 259–271. [Google Scholar] [CrossRef]
  41. Tan, Z.; Guan, Q.; Lin, J.; Yang, L.Q.; Luo, H.P.; Ma, Y.R.; Tian, J.; Wang, Q.Z.; Wang, N. The response and simulation of ecosystem services value to land use/land cover in an oasis, Northwest China. Ecol. Indic. 2020, 118, 106711. [Google Scholar] [CrossRef]
  42. Zhang, X.; Zhang, L.; He, C.; Li, J.L.; Jiang, Y.W.; Ma, L.B. Quantifying the impacts of land use/land cover change on groundwater depletion in Northwestern China—A case study of the Dunhuang oasis. Agric. Water Manag. 2014, 146, 270–279. [Google Scholar] [CrossRef]
  43. Zhang, B.; Xia, Q.Y.; Dong, J.; Li, L. Research on the Impact of Land Use Change on the Spatio-temporal Pattern of Carbon Storage in Metropolitan Suburbs: Taking Huangpi District of Wuhan City as an Example. J. Ecol. Rural. Environ. 2023, 39, 699–712. [Google Scholar]
  44. Guo, R.; Liu, W.; Li, Z.S. An analysis on the land use change characteristics and driving forces in Gansu part of the Qilian Mountain. J. Desert. Res. 2023, 43, 188–198. [Google Scholar]
  45. Hou, W.; Hou, X.Y.; Sun, M.; Song, B.Y. Land use/land cover change along low-middle latitude coastal areas of Eurasia and their driving forces from 2000 to 2010. World. Reg. Stud. 2021, 30, 813–825. [Google Scholar]
  46. Wang, J.F.; Zhang, T.L.; Fu, B.J. A measure of spatial stratified heterogeneity. Ecol. Indica 2016, 67, 250–256. [Google Scholar] [CrossRef]
  47. Wang, J.; Li, X.; Christakos, G.; Liao, Y.; Zhang, T.; Gu, X.; Zheng, X. Geographical Detectors-Based Health Risk Assessment and its Application in the Neural Tube Defects Study of the Heshun Region, China. Int. J. Geogr. Inf. Sci. 2010, 24, 107–127. [Google Scholar] [CrossRef]
  48. Ma, T.; Jiang, D.; Hao, M.; Fan, P.; Zhang, S.; Qu, Z.G.; Xue, C.; Han, S.; Wu, W.; Zheng, C.; et al. Geographical Detector-based influence factors analysis for Echinococcosis prevalence in Tibet, China. PLoS Negl. Trop. 2021, 15, e0009547. [Google Scholar]
  49. Ren, H.; Lu, W.; Li, X.; Shen, H. Specific urban units identified in tuberculosis epidemic using a geographical detector in Guangzhou, China. Infect. Dis. Poverty 2022, 11, 44. [Google Scholar] [CrossRef]
  50. Huang, J.; Wang, J.; Bo, Y.; Xu, C.; Hu, M.; Huang, D. Identification of Health Risks of Hand, Foot and Mouth Disease in China Using the Geographical Detector Technique. Int. J. Environ. Res. Public Health 2014, 11, 3407–3423. [Google Scholar] [CrossRef]
  51. Fang, Y.; Jiang, Y.; Tsai, C.-H.K.; Luo, B.; Chen, M.-H. Spatial Patterns of China’s Ski Resorts and Their Influencing Factors: A Geographical Detector Study. Sustainability 2021, 13, 4232. [Google Scholar] [CrossRef]
  52. Zhang, Z.; Yin, H.; Zhao, Y.; Wang, S.; Han, J.; Yu, B.; Xue, J. Spatial Heterogeneity and Driving Factors of Soil Moisture in Alpine Desert Using the Geographical Detector Method. Water 2021, 13, 2652. [Google Scholar] [CrossRef]
  53. Wang, Y.; Guo, E.; Kang, Y.; Ma, H. Assessment of Land Desertification and Its Drivers on the Mongolian Plateau Using Intensity Analysis and the Geographical Detector Technique. Remote Sens. 2022, 14, 6365. [Google Scholar] [CrossRef]
  54. Liu, Y.; Cao, X.; Li, T. Identifying Driving Forces of Built-Up Land Expansion Based on the Geographical Detector: A Case Study of Pearl River Delta Urban Agglomeration. Int. J. Environ. Res. Public Health 2020, 17, 1759. [Google Scholar] [CrossRef] [Green Version]
  55. Xu, X.L.; Liu, J.Y.; Zhang, S.W.; Li, R.D.; Yan, C.Z.; Wu, S.X. Multi-period land use remote sensing monitoring dataset in China. Res. Environ. Sci. Data Registr. Public Syst. 2018. [Google Scholar] [CrossRef]
  56. GB/T21010—2007; China National Standardization Administration Committee—Land Use Status Classification. Standard Publications House: Beijing, China, 2007.
  57. Fu, J.Y.; Zang, C.F.; Wu, M.W. Spatial and temporal variability characteristics and driving mechanism of land use in haiheriver basin from 1990 to 2015. Chin. J. Agric. Resourc. Reg. Plann. 2020, 41, 131–139. [Google Scholar]
  58. Wan, Y.; Yan, C.Z.; Xiao, S.C.; Xie, J.L.; Qian, D.W. Process, Spatial Pattern and Driving Mechanisms of the Aeolian Desertification in the Alxa Plateau from 1975 to 2015. J. Desert. Res. 2018, 38, 17–29. [Google Scholar]
  59. Xu, X.L. Annual spatial interpolation dataset of Chinese meteorological elements. Res. Environ. Sci. Data Registr. Public Syst. 2022. [Google Scholar] [CrossRef]
  60. Wang, Y.G.; Luo, G.P.; Feng, Y.X.; Han, Q.F.; Fan, B.B.; Chen, Y.L. Effects of Land Use /Land Cover Change on Carbon Storage in Manas River Watershed over the Past 50 Years. J. Nat. Res. 2013, 28, 994–1006. [Google Scholar]
  61. Li, J.J.; Luo, G.P.; Ding, J.L.; Xu, W.Q.; Zheng, S.L. Effect of Progress in Artificial Irrigation and Drainage Technology on the Change of Cultivated Land Pattern in the Past 50 Years in Manasi River Watershed. J. Nat. Res. 2016, 31, 570–582. [Google Scholar]
  62. Li, X.; He, X.; Yang, G.; Liu, H.G.; Long, A.H.; Chen, F.L.; Liu, B.; Gu, X.C. Land use/cover and landscape pattern changes in Manas River Basin based on remote sensing. Int. J. Agric. Biol. Eng. 2020, 13, 141–152. [Google Scholar] [CrossRef]
  63. Zhu, H.H.; Du, M.L.; Yin, X.J. Impact of water—saving agricultural technology on oasis agricultural ecological efficiency: Promote or inhibit? J. Arid Land Res. Environ. 2022, 36, 34–41. [Google Scholar]
  64. Huang, L.; Xu, L.P. Spatiotemporal Evolution of the Oasis and Change of Landscape Pattern in the Manas River Basin. Arid Zone Res. 2019, 36, 1261–1269. [Google Scholar]
Figure 1. The location of the study region.
Land 12 01487 g001
Figure 2. Oasis and desert structural features from 1980 to 2020.
Land 12 01487 g002
Figure 3. Spatial characterization of oasification and desertification.
Land 12 01487 g003
Figure 4. Driving factor detection results of oasification and desertification in 2000–2010. POP: Population density; GDP: Average land GDP; VTem: Average annual temperature; Pre: Annual precipitation; VWin: annual wind speed.
Land 12 01487 g004
Table 1. The type of interaction.
Quantitative RelationshipInteraction Effect
q X 1 X 2 = q X 1 + q ( X 2 ) Independent
q X 1 X 2 < M i n ( q X 1 , q ( X 2 ) ) Nonlinear-weaken
M a x ( q X 1 , q ( X 2 ) ) < q X 1 X 2 < M i n ( q X 1 , q ( X 2 ) ) Uni-weaken
q X 1 X 2 > M a x ( q X 1 , q ( X 2 ) ) Bivariate-enhance
q X 1 X 2 > q X 1 + q ( X 2 ) Nonlinear-enhance
Table 2. Oasis and desert classification systems in the Manas River basin [55].
Class I ClassificationClass II ClassificationDefinition
OasisCultivated landRefers to land planted with crops.
ForestRefers to the growth of trees, shrubs, bamboo and coastal mangrove land and other forestry land.
GrasslandRefers to all kinds of grasslands with herbaceous plants growing mainly and covering more than 5%.
WaterRefers to natural land water and water facilities land.
Construction landIt refers to urban and rural settlements and the land for industry, mining and transportation beyond them.
DesertSandy landRefers to the land with sand cover on the surface and vegetation cover of less than 5%.
Gobi Refers to land where the surface is dominated by gravel and the vegetation cover is less than 5%.
Bare landRefers to land with soil cover (land with less than 5% vegetation cover) or rocky or gravelly surface (land with >5% of its body).
Saline marshSaline refers to land where salt and alkali gather on the surface, vegetation is sparse and only salt-tolerant solid plants can grow. Swamp refers to land with flat, low-lying terrain, poor drainage, chronically wet, seasonally or perennially waterlogged and wet-growing plants on the surface.
Table 3. Data characteristics of driving factors.
FactorDateResolutionSourceAbbreviations
Soil type20091 kmhttps://www.fao.org/ (accessed on 20 January 2023)Soil
Elevation200030 mhttps://www.resdc.cn/ (accessed on 20 January 2023)DEM
Slope200030 mhttps://www.resdc.cn/ (accessed on 20 January 2023)-
Aspect200030 mhttps://www.resdc.cn/ (accessed on 20 January 2023)-
Population density2000–2010-http://tjj.xinjiang.gov.cn/
http://tjj.xjbt.gov.cn/ (accessed on 15 January 2023)
POP
Average land GDP2000–2010-http://tjj.xinjiang.gov.cn/
http://tjj.xjbt.gov.cn/ (accessed on 15 January 2023)
GDP
Average annual temperature2000–20101 kmhttps://www.resdc.cn/ (accessed on 10 January 2023)VTem
Annual precipitation2000–20101 kmhttps://www.resdc.cn/ (accessed on 10 January 2023)Pre
Average annual wind speed2000–20101 kmhttps://www.resdc.cn/ (accessed on 10 January 2023)VWin
Table 4. Area of land use types (unit: km2).
Class I ClassificationClass II Classification19801990200020102020
OasisCultivated land5833.115970.116620.857403.147869.64
Forest539.78554.14476.07463.25458.05
Grassland11,250.1011,221.8610,549.1410,107.889618.15
Water888.29929.22939.97956.041071.76
Construction land290.58366.61411.16444.91541.61
DesertSandy land5990.635659.155773.945596.935551.80
Gobi 4173.764170.764175.624171.554159.79
Bare land4024.394046.874032.674026.044026.96
Saline marsh516.54588.47527.76337.45209.43
Table 5. Desert and oasis dynamic degree.
Class I ClassificationClass II Classification1980–19901990–20002000–20102010–2020
Single dynamic degree of oasisCultivated land0.23%1.09%1.18%0.63%
Forest0.27%−1.41%−0.27%−0.11%
Grassland−0.03%−0.60%−0.42%−0.48%
Water0.46%0.12%0.17%1.21%
Construction land2.62%1.22%0.82%2.17%
Single dynamic degree of desertSandy land−0.55%0.20%−0.31%−0.08%
Gobi −0.01%0.01%−0.01%−0.03%
Bare land0.06%−0.04%−0.02%0.00%
Saline marsh1.39%−1.03%−3.61%−3.79%
Comprehensive dynamic degreeOasis 0.08%0.38%0.33%0.30%
Desert 0.15%0.07%0.14%0.07%
Table 6. Transfer matrix of Manas River Basin, 1980–1990.
YearType1990
CulandForestGrlandWaterConlandSanlandGobiBalandSamarshSumTo Derst
1980Culand5384.55 25.58 321.37 2.89 39.49 22.48 2.00 8.28 26.46 5833.11 59.23
Forest5.59 517.29 15.26 1.60 0.02 0.00 0.00 0.00 0.02 539.78 0.02
Grland536.06 8.03 10,552.89 8.97 32.97 19.98 0.09 4.31 86.82 11,250.10 111.19
Water0.36 0.12 1.91 885.77 0.00 0.00 0.00 0.00 0.13 888.29 0.13
Conland0.00 0.00 0.00 0.00 290.58 0.00 0.00 0.00 0.00 290.58 0.00
Sanland40.99 2.69 322.61 1.85 1.30 5616.02 2.44 2.12 0.60 5990.63 5621.19
Gobi0.00 0.00 0.33 0.00 1.16 0.00 4164.69 0.00 7.58 4173.76 4172.27
Baland0.00 0.00 0.00 0.15 0.00 0.00 0.00 4024.24 0.00 4024.39 4024.24
Samarsh2.56 0.43 7.49 28.00 1.09 0.67 1.54 7.92 466.85 516.54 476.97
Sum5970.11 554.14 11,221.86 929.22 366.61 5659.15 4170.76 4046.87 588.47 33,507.18 -
To oasis43.55 3.12 330.43 30.00 3.55 5616.69 4168.67 4034.28 475.03 --
Note: Culand: cultivated land; Grland: grassland; Conland: construction land; Sanland: sandy land; Baland: bare land; Samarsh: Saline marsh. “To desert” means the total area of cultivated land, forest, grassland, water and construction land converted to sandy land, Gobi, bare land and salt marshes, respectively. “To oasis” means the total area of sandy land, Gobi, bare land and salt marshes converted to cultivated land, forest, grassland, water and construction land, respectively. Same below.
Table 7. Transfer matrix of Manas River Basin, 1990–2000.
YearType2000
CulandForestGrlandWaterConlandSanlandGobiBalandSamarshSumTo Derst
1990Culand5777.33 1.28 96.67 10.28 64.76 3.69 0.00 0.36 15.74 5970.11 19.79
Forest44.41 461.14 37.83 1.40 1.42 2.68 0.11 1.12 4.05 554.14 7.96
Grland667.03 13.60 10,377.15 17.48 18.33 100.29 0.01 13.73 14.24 11,221.86 128.28
Water1.44 0.04 4.40 909.52 0.06 0.13 0.00 11.30 2.32 929.22 13.75
Conland32.44 0.01 8.31 0.06 325.77 0.00 0.00 0.00 0.01 366.61 0.01
Sanland15.75 0.00 2.82 0.54 0.23 5638.85 0.00 0.00 0.95 5659.15 5639.81
Gobi0.03 0.00 0.00 0.00 0.12 0.00 4170.61 0.00 0.00 4170.76 4170.61
Baland35.21 0.00 3.09 0.00 0.09 2.29 0.00 4006.15 0.03 4046.87 4008.47
Samarsh47.21 0.00 18.88 0.69 0.37 26.02 4.89 0.00 490.41 588.47 521.32
Sum6620.85 476.07 10,549.14 939.97 411.16 5773.94 4175.62 4032.67 527.76 33,507.18 -
To oasis98.20 0.00 24.79 1.23 0.81 5667.16 4175.50 4006.15 491.39 --
Table 8. Transfer matrix of Manas River Basin, 2000–2010.
YearType2010
CulandForestGrlandWaterConlandSanlandGobiBalandSamarshSumTo Derst
2000Culand6598.99 0.001.19 0.00 20.54 0.00 0.00 0.00 0.13 6620.85 0.13
Forest13.83 460.15 1.07 0.38 0.38 0.00 0.00 0.00 0.25 476.07 0.25
Grland433.22 2.07 10,058.43 17.38 5.51 2.02 1.22 0.00 29.30 10,549.14 32.53
Water0.89 0.00 5.97 930.17 0.04 0.00 0.00 0.00 2.91 939.97 2.91
Conland0.00 0.00 0.00 0.00 411.16 0.00 0.00 0.00 0.00 411.16 0.00
Sanland170.68 1.01 7.52 0.11 0.00 5589.67 0.00 0.17 4.78 5773.94 5594.62
Gobi5.42 0.00 0.47 0.00 0.08 0.00 4169.65 0.00 0.00 4175.62 4169.65
Baland4.25 0.00 2.24 0.00 0.01 0.03 0.00 4025.85 0.30 4032.67 4026.17
Samarsh175.86 0.01 30.99 8.00 7.21 5.22 0.68 0.02 299.78 527.76 305.69
Sum7403.14 463.25 10,107.88 956.04 444.91 5596.93 4171.55 4026.04 337.45 33,507.18 -
To oasis356.20 1.02 41.22 8.11 7.30 5594.91 4170.33 4026.04 304.86 --
Table 9. Transfer matrix of Manas River Basin, 2010–2020.
YearType2020
CulandForestGrlandWaterConlandSanlandGobiBalandSamarshSumTo Derst
2010Culand7265.14 0.01 72.28 0.00 65.58 0.12 0.00 0.00 0.00 7403.14 0.12
Forest5.03 457.77 0.40 0.04 0.00 0.00 0.00 0.00 0.00 463.25 0.00
Grland548.35 0.26 9532.04 3.83 19.26 0.73 0.00 0.01 3.39 10,107.88 4.13
Water2.25 0.00 13.17 910.47 4.81 0.06 0.00 2.20 23.10 956.04 25.35
Conland0.00 0.00 0.00 0.05 444.86 0.00 0.00 0.00 0.00 444.91 0.00
Sanland44.91 0.00 0.10 0.18 0.87 5550.86 0.00 0.00 0.00 5596.93 5550.87
Gobi0.00 0.00 0.00 8.92 2.84 0.00 4159.79 0.00 0.00 4171.55 4159.79
Baland1.28 0.00 0.00 0.00 0.00 0.01 0.00 4024.75 0.00 4026.04 4024.76
Samarsh2.67 0.00 0.16 148.27 3.38 0.03 0.00 0.00 182.94 337.45 182.97
Sum7869.64 458.05 9618.15 1071.76 541.61 5551.80 4159.79 4026.96 209.43 33,507.18 -
To oasis48.86 0.00 0.27 157.37 7.09 5550.90 4159.79 4024.75 182.94 --
Table 10. Results of oasification and desertification interaction detection from 2000 to 2010.
Factor InteractionInteraction q-ValueResultInterpretation
Soil∩DEM0.537>0.428 = Max(q(Soil), q(DEM))Bivariate-enhance
Soil∩Slope0.457>0.454 = q(Soil) + q(Slope)Nonlinear-enhance
Soil∩Aspect0.461>0.432 = q(Soil) + q(Aspect)Nonlinear-enhance
Soil∩POP0.631>0.538 = Max(q(Soil), q(POP))Bivariate-enhance
Soil∩GDP0.660>0.533 = Max(q(Soil), q(GDP))Bivariate-enhance
Soil∩VTem0.507>0.428 = Max(q(Soil), q(VTem))Bivariate-enhance
Soil∩Pre0.562>0.428 = Max(q(Soil), q(Pre))Bivariate-enhance
Soil∩VWin0.597>0.428 = Max(q(Soil), q(VWin))Bivariate-enhance
DEM∩Slope0.430>0.420 = q(DEM) + q(Slope)Nonlinear-enhance
DEM∩Aspect0.427>0.398 = q(DEM) + q(Aspect)Nonlinear-enhance
DEM∩POP0.645>0.538 = Max(q(DEM), q(POP))Bivariate-enhance
DEM∩GDP0.678>0.533 = Max(q(DEM), q(GDP))Bivariate-enhance
DEM∩VTem0.514>0.395 = Max(q(DEM), q(VTem))Bivariate-enhance
DEM∩Pre0.498>0.427 = Max(q(DEM), q(Pre))Bivariate-enhance
DEM∩VWin0.548>0.395 = Max(q(DEM), q(VWin))Bivariate-enhance
Slope∩Aspect0.082>0.029 = q(Slope) + q(Aspect)Nonlinear-enhance
Slope∩POP0.577>0.563 = q(Slope) + q(POP)Nonlinear-enhance
Slope∩GDP0.567>0.559 = q(Slope) + q(GDP)Nonlinear-enhance
Slope∩VTem0.310>0.302 = q(Slope) + q(VTem)Nonlinear-enhance
Slope∩Pre0.462>0.452 = q(Slope) + q(Pre)Nonlinear-enhance
Slope∩VWin0.369>0.307 = q(Slope) + q(VWin)Nonlinear-enhance
Aspect∩POP0.570>0.541 = q(Aspect) + q(POP)Nonlinear-enhance
Aspect∩GDP0.559>0.537 = q(Aspect) + q(GDP)Nonlinear-enhance
Aspect∩VTem0.316>0.280 = q(Aspect) + q(VTem)Nonlinear-enhance
Aspect∩Pre0.457>0.430 = q(Aspect) + q(Pre)Nonlinear-enhance
Aspect∩VWin0.330>0.285 = q(Aspect) + q(VWin)Nonlinear-enhance
POP∩GDP0.656>0.538 = Max(q(POP), q(GDP))Bivariate-enhance
POP∩VTem0.642>0.538 = Max(q(POP), q(VTem))Bivariate-enhance
POP∩Pre0.632>0.538 = Max(q(POP), q(Pre))Bivariate-enhance
POP∩VWin0.644>0.538 = Max(q(POP), q(VWin))Bivariate-enhance
GDP∩VTem0.669>0.533 = Max(q(GDP), q(VTem))Bivariate-enhance
GDP∩Pre0.658>0.533 = Max(q(GDP), q(Pre))Bivariate-enhance
GDP∩VWin0.646>0.533 = Max(q(GDP), q(VWin))Bivariate-enhance
VTem∩Pre0.496>0.427 = Max(q(VTem), q(Pre))Bivariate-enhance
VTem∩VWin0.597>0.558 = q(VTem) + q(VWin)Nonlinear-enhance
Pre∩VWin0.565>0.427 = Max(q(Pre), q(VWin))Bivariate-enhance
Note: Soil: Soil type; DEM: Elevation; POP: Population density; GDP: Average land GDP; VTem: Average annual temperature; Pre: Annual precipitation; VWin: annual wind speed (Table 3), same below.
Table 11. Results of desertification interaction detection from 2000 to 2010.
Factor InteractionInteraction q-ValueResultInterpretation
Soil∩DEM0.373>0.288 = Max(q(Soil), q(DEM))Bivariate-enhance
Soil∩Slope0.307>0.306 = q(Soil) + q(Slope)Nonlinear-enhance
Soil∩Aspect0.296>0.293 = q(Soil) + q(Aspect)Nonlinear-enhance
Soil∩POP0.600>0.488 = Max(q(Soil), q(POP))Bivariate-enhance
Soil∩GDP0.583>0.354 = Max(q(Soil), q(GDP))Bivariate-enhance
Soil∩VTem0.395>0.288 = Max(q(Soil), q(VTem))Bivariate-enhance
Soil∩Pre0.552>0.340 = Max(q(Soil), q(Pre))Bivariate-enhance
Soil∩VWin0.593>0.569 = q(Soil) + q(VWin)Nonlinear-enhance
DEM∩Slope0.226>0.225 = q(DEM) + q(Slope)Nonlinear-enhance
DEM∩Aspect0.213>0.212 = q(DEM) + q(Aspect)Nonlinear-enhance
DEM∩POP0.602>0.488 = Max(q(DEM), q(POP))Bivariate-enhance
DEM∩GDP0.558>0.354 = Max(q(DEM), q(GDP))Bivariate-enhance
DEM∩VTem0.275>0.206 = Max(q(DEM), q(VTem))Bivariate-enhance
DEM∩Pre0.369>0.340 = Max(q(DEM), q(Pre))Bivariate-enhance
DEM∩VWin0.516>0.288 = q(DEM) + q(VWin)Nonlinear-enhance
Slope∩Aspect0.034>0.023 = q(Slope) + q(Aspect)Nonlinear-enhance
Slope∩POP0.510>0.506 = q(Slope) + q(POP)Nonlinear-enhance
Slope∩GDP0.395>0.372 = q(Slope) + q(GDP)Nonlinear-enhance
Slope∩VTem0.210>0.209 = q(Slope) + q(VTem)Nonlinear-enhance
Slope∩Pre0.361>0.358 = q(Slope) + q(Pre)Nonlinear-enhance
Slope∩VWin0.353>0.300 = q(Slope) + q(VWin)Nonlinear-enhance
Aspect∩POP0.497>0.493 = q(Aspect) + q(POP)Nonlinear-enhance
Aspect∩GDP0.361>0.359 = q(Aspect) + q(GDP)Nonlinear-enhance
Aspect∩VTem0.199>0.196 = q(Aspect) + q(VTem)Nonlinear-enhance
Aspect∩Pre0.349>0.345 = q(Aspect) + q(Pre)Nonlinear-enhance
Aspect∩VWin0.293>0.286 = q(Aspect) + q(VWin)Nonlinear-enhance
POP∩GDP0.542>0.488 = Max(q(POP), q(GDP))Bivariate-enhance
POP∩VTem0.600>0.488 = Max(q(POP), q(VTem))Bivariate-enhance
POP∩Pre0.601>0.488 = Max(q(POP), q(Pre))Bivariate-enhance
POP∩VWin0.614>0.488 = Max(q(POP), q(VWin))Bivariate-enhance
GDP∩VTem0.551>0.545 = q(GDP) + q(VTem)Nonlinear-enhance
GDP∩Pre0.557>0.354 = Max(q(GDP), q(Pre))Bivariate-enhance
GDP∩VWin0.533>0.354 = Max(q(GDP), q(VWin))Bivariate-enhance
VTem∩Pre0.382>0.340 = Max(q(VTem), q(Pre))Bivariate-enhance
VTem∩VWin0.501>0.472 = q(VTem) + q(VWin)Nonlinear-enhance
Pre∩VWin0.509>0.340 = Max(q(Pre), q(VWin))Bivariate-enhance
Disclaimer/Publisher’s Note: The statements, opinions and data contained in all publications are solely those of the individual author(s) and contributor(s) and not of MDPI and/or the editor(s). MDPI and/or the editor(s) disclaim responsibility for any injury to people or property resulting from any ideas, methods, instructions or products referred to in the content.