Article

The Impact of Urban Built Environments on Elderly People’s Sense of Safety and Adaptation to Aging: A Case Study of Three Major Urban Agglomerations in China

1
Guangzhou Urban Planning & Design Survey Research Institute, Guangzhou 510030, China
2
School of Architecture and Urban Planning, Guangdong University of Technology, Guangzhou 510062, China
3
Faculty of Hospitality and Tourism Management, Macau University of Science and Technology, Macau 999078, China
*
Author to whom correspondence should be addressed.
These authors contributed equally to this work.
Land 2023, 12(8), 1486; https://doi.org/10.3390/land12081486
Submission received: 19 June 2023 / Revised: 22 July 2023 / Accepted: 23 July 2023 / Published: 27 July 2023
(This article belongs to the Section Land Socio-Economic and Political Issues)

Abstract

:
Against the backdrop of accelerating population aging and scarce elderly care resources and facilities in China, the issue of the sense of safety among the elderly has received widespread attention. This article is based on data from the China Labor Force Dynamics Survey (CLDS) in 2016 and takes three major urban agglomerations as examples to examine the impact mechanisms of urban built environments on elderly people’s sense of safety. The results indicate that the characteristics of the urban built environment, the social environment, and individual health affect the safety perceptions of the elderly. Among them, urbanization rate, hospital facilities, population density, greening rate, air quality, and frequency of dining out have significant impacts on elderly people’s sense of safety. Simultaneously, good daily exercise and mental health status can significantly improve elderly people’s sense of safety. This article summarizes the existing problems of aging-friendly spaces and facilities in three major urban agglomerations, proposes planning strategies to enhance elderly people’s sense of safety, and provides a useful reference for urban aging-friendly transformations and an elderly-friendly society.

1. Introduction

In recent years, the proportion of China’s elderly population has been increasing substantially. Estimates are that by 2035, China’s elderly population will exceed 400 million, accounting for more than 30% of the total population. However, there are still some elderly care problems in China’s urban environment. At the material level, environmental and social conflicts such as air pollution, ecological damage, and deterioration of the living environment are prominent [1], and the development of a livable environment for elderly people needs urgent attention. The outdoor environment is not suitable for the elderly because it lacks barrier-free facilities. Communities lack supporting facilities for the elderly [2] and face community disintegration in deference to commercial interests [3], the development of new sociospatial units such as affordable housing communities [4], and the disintegration of neighborhood relations. The elderly original neighborhood residents and the incoming new neighbors are different from one another. In terms of awareness, the elderly lack close contact with social welfare and social support in their homes and know little about community services [5]. Therefore, the question of how to build an age-friendly city has become an important part of China’s promotion of new urbanization and livable city construction. The World Health Organization (WHO) has proposed the concept of active aging [6], advocating that the elderly maintain good functions in five aspects: physical, psychological, intellectual, social, and economic, from the perspectives of health, community participation, and safety. In this regard, we actively explore ways to improve the health and well-being of the elderly and achieve active aging. The report of the 20th National Congress of the Communist Party of China aimed to “implement the national strategy of actively responding to population aging and develop the elderly care business and industry” [7]. Therefore, analyzing the influencing factors and mechanisms of the safety perceptions of the elderly is significant for optimizing urban construction and implementing the strategy of building a safe environment.
Significant aspects of the community residential environment in enhancing elderly safety have been increasingly recognized. Existing studies have found that the built environment is a powerful determinant of the sense of safety. Poor built environments are often associated with insufficient safety for older people, such as traffic safety [8,9], community safety [10], or individual safety [11]. Hong and Chen examined the relationship between the built environment, perceived safety from crime, and walking behavior [12]. They found that the community’s built environment, such as facility diversity, air quality, and building density, significantly impacted the sense of safety for older people. However, most research on elderly people’s sense of safety revolves around the built environment, and a comprehensive mechanism for safety impacts is still poorly understood. A few studies suggest that social environmental characteristics have direct and indirect effects on safety [13,14,15]. Urban greening (such as street trees and parks) plays a significant role in building elderly communities [16]. In addition to the built environment and the social environment, factors related to the individual’s health status may influence residents’ feelings and attitudes toward their sense of security [17], but the relevant research perspectives have not received sufficient attention. Furthermore, most studies focus on safety perception as a mediator variable; fewer studies have paid attention to the comprehensive consideration of safety intentions, measurements, and influencing factors [18]. China is currently experiencing unprecedented new urbanization and aging. However, the research on elderly people’s sense of safety in China still lags behind that in other countries, since it is mostly research related to the perspective of adaptation to aging facilities and is less based on geographical factors such as the urban built environment, which is used to explore the impacts on safety perceptions of the elderly [19]. Most studies on sense of safety have focused on residents, children, and migrant populations, and insufficient attention has been paid to vulnerable groups like the elderly. Elderly people are more sensitive to the built environment; for example, due to degradations in physical functioning, they have higher requirements of the built environment, such as air quality and lighting quantity [20]. Moreover, elderly people have special social needs; improving their sense of safety plays a significant role in outdoor sports activity participation, which enhances their health and active aging [21,22]. This is why it is crucial to pay more attention to the elderly.
This work addresses the above-mentioned shortcomings by analyzing data from the 2016 China Labor Dynamics Survey (CLDS) for three major urban agglomerations—Beijing–Tianjin–Hebei (BTH), the Yangtze River Delta (YRD), and the Pearl River Delta (PRD) [23]—to further understand the impact mechanisms of the safety perceptions of the elderly and urban aging, including problems with modernized spaces and facilities. Therefore, a strategy to improve the safety perceptions of the elderly is proposed, which provides a useful reference for the transformation of urban aging and the construction of an elderly-friendly society.
We first establish a linear regression model, with the sociodemographic characteristics of the three major urban agglomerations as control variables. Because each has resident and migrant populations in varying proportions and many elderly groups, they are typical and representative. Concurrently, social environment characteristics, urban built environment characteristics, and individual health characteristics are the investigative variables to understand their influence mechanisms on the safety perceptions of the elderly. Second, by analyzing the specific indicators covered in the characteristics, we determine how the elderly in each urban agglomeration are affected by different characteristics, in order to propose specific methods for improving the safety perceptions of the elderly in different urban agglomerations. Such analyses not only contribute to a better understanding of the status of and recent changes to the safety perceptions of elderly populations in China, but also have important implications for relevant policy formulation. Last, a constructive proposal is made for urban aging-related transformation strategies to help macro policies be more specifically implemented in differentiated urban agglomerations. This work has significance for building aging-friendly cities in future Chinese society and improving the safety perceptions of the elderly. It will help China build safe, aging-friendly communities in the future, thereby optimizing urban construction and implementing a safe environment construction strategy.

2. Literature Review

2.1. Sense of Safety

The concept of sense of safety originated from psychology and is used in theoretical research on psychoanalysis and human psychology [19]. Maslow believed that “psychological safety is the feeling of confidence, safety and freedom from fear and anxiety, especially the feeling of meeting a person’s present (and future) needs” [24]. Elders’ sense of security is a theme that can be found in the earliest official documents on aging-friendly cities. Research on the safety perceptions of the elderly in various countries has focused on the living environment and safety policy guarantees. Scholars have studied the impact of different community types and community land use on the safety perceptions of the elderly [14] and the application of community construction and development to elders’ community safety perceptions [3]. One study found that public health research has a positive impact on health policy development for the elderly [25]. Some scholars looked at the development of aging policies by studying the design of community environment models, including collaborative governance and participation of the elderly in the decision-making process [10].
Elderly people’s sense of safety is becoming a hot topic in academic circles. Compared with research in other countries, there are two deficiencies in China: (1) research mainly analyzes security perceptions as an indicator of social environment factors, and lacks comprehensive consideration of their connotations, measurements, and influencing factors; and (2) research is conducted from microscopic perspectives such as the renovation of facilities suitable for the elderly and is less based on the impact of geographical elements such as the urban built environment on sense of safety. Therefore, this comparative study on elderly people’s sense of safety in three major urban agglomerations revises scales from Zhang, Qin, and Tang [26] about residential sense of safety to include five items that measure feelings of safety in various situations within the urban built environment: unemployment, crime, terrorist attacks, consuming counterfeit medicines or food, and infectious disease. Respondents rated their agreement on a four-point Likert scale, part of the CLDS (highly possible = 1, highly impossible = 4), to examine the impact mechanism of the urban built environment on elderly people’s sense of safety, and on this basis, the differences between the three major urban agglomerations are compared.

2.2. Urban Environment, Social Environment, Individual Characteristics, and Sense of Safety among the Elderly

The influencing factors of sense of safety include the urban environment, the social environment, and individual characteristics, which encompass the built environment, socioeconomic variables, the policy environment, physical and mental health, and so on. Researchers have defined and described the urban environment from the perspective of the built environment [11,27]. Cervero found that the built environment consists of three dimensions (3Ds)—density, diversity, and design—which were later extended to five dimensions (5Ds) by including destination accessibility and distance to transit [28,29]. Many scholars have adopted the 5Ds evaluation framework. For example, Chen et al. used the number of parks and the density of leisure facilities to measure destination accessibility, the number of intersections to measure the design, and the sky exposure percentage to measure density [30]; Han et al. used the land-use mix and housing types of residential districts to measure diversity, and distance to transit was measured according to the density of public transportation facilities, road network accessibility, and traffic spatial constraints [1]. The 5Ds framework is suitable for research focusing on multiple measures of the urban environment and is a widely used indicator system.
An accumulating body of literature has linked the urban environment and the sense of safety. Baba and Austin investigated determinants of perceived neighborhood safety [10]. Their results indicated that improving the quality of built environmental characteristics can increase residents’ concern with the appearance of the neighborhood and their concern about the people that live there, which in turn increases the perceived level of neighborhood safety [12]. Hong and Chen found that people living in neighborhoods with good accessibility and pedestrian facilities tend to perceive their neighborhoods as safer, while density has the opposite impact [10]. Wood et al. found that as the distance between the post box and the respondent’s home increased, the mean score on feelings of safety decreased [21].
Empirical and review studies have found that social environments could be represented by the socioeconomic composition [31,32] or perceived neighborhood safety, cohesion, and trust [33,34,35]. In addition, Zhang and Yao characterized social environments by the sociodemographic composition, social ties of people, living pressure, social resource distribution, social safety, policy, and lifestyle [36]. In research on the effect of walkable environments on active aging, Marquet and Miralles-Guasch considered municipality size, average income, and vehicle and population density as socioeconomic variables [37]. Lee, Yoon, and Woo used median apartment-housing prices as a proxy for neighborhood economics [8]. Aliyas described low-socioeconomic-status neighborhoods in terms of unemployment, low-wage jobs, high rates of poverty, and low educational attainment [17]. Many researchers have demonstrated that people residing in low socioeconomic areas perceive less safety than those in moderate-to-high socioeconomic areas [38].
Another key component of the sense of safety is related to individual characteristics, such as psychosocial indicators, local area perceptions, health characteristics, perceived emotional support, community involvement, and so on. When studying the relationship between elderly people’s sense of security and physical activity, health characteristics often were a determinant [39]. Some studies have shown that the proportion of respondents reporting feeling very safe decreases as perceived health decreases, and the probability of feeling very safe decreases linearly with greater reported stress [13]. In brief, a good evaluation of individual characteristics is positively related to or enhances one’s sense of safety.

2.3. Research on the Elderly

Researchers have demonstrated the relationships of sense of safety and similar concepts to public facilities, street environment, and so on [13,19]. In one study, commercial activities along the street were conducive to a higher level of perceived safety because of the lively scenes, which reduced older pedestrians’ fear of crimes [40]. However, there are also studies showing that commercial activities and associated higher levels of pedestrian traffic and crowding led to increased risk of collisions or falls, negatively impacting the perceived safety of older pedestrians [19]. Although higher concentrations of services enhance the convenience of living and contribute to the mental well-being of older adults, they could also add to perceptions of insecurity and chaos, which offset the positive effects [27].
Another study found that the overall design and maintenance of public spaces and greenery, such as the quality of the pavement and any loose paving tiles, affect perceived safety [14]. The higher the ratio of intersection areas covered by trees and their shade, the less likely an older pedestrian is to be involved in a collision [41]. A well-maintained and clean street can improve the sense of safety and security [13]. In addition, the attitude of residents toward public space maintenance also has an impact on their sense of security [14]. However, some residents lack respect for public spaces, which means there is work needed to establish friendly communities for the elderly.
Community security positively contributes to the leisure activities of the elderly [1,4,27]. The designs of intersections and pedestrian crossings can improve pedestrian safety, thereby having a positive impact on sports activities and walking in favorable built environments. Loukaitou-Sideris systematically reviewed how neighborhood safety influences physical activity and concluded that the relationship of bus stops to the streets, the marking of crossroads, the positioning of neighborhood schools and playgrounds in relation to the street network, the types of land uses, and so on may reduce the risk of pedestrian collisions [9]. Related studies have found that negative built environments, such as locations with graffiti or garbage and dangerous roads/intersections increased the incidence of disease; positive built environments, such as access to parks and sidewalks, as well as accessible public spaces, reduce the occurrence of diseases [42]. Older adults that reported weekly, moderate-to-vigorous physical activity had reduced likelihoods of suffering major chronic diseases [43]. Physical activity and social interaction played mediating roles in the correlation between the built environment and elderly health [11,27].
Internal migration in China from rural areas to cities is known as interregional migration. Most internal migrants still register their place of residence as their place of origin and are considered a floating population, of which 7.2% (18 million) are elderly (60 years or older). Most previous studies on Chinese subjective well-being focused on migrant workers and neglected the migrant elderly who were more vulnerable in terms of social interactions and emotional state. The migrant elderly may become more vulnerable as their health status and economic ability decline. Similarly, in China, not only have migrant elders experienced significant urbanization and industrialization changes, but also non-migrant elders have experienced similar changes. These changes affect their well-being [44].

3. Materials and Methodology
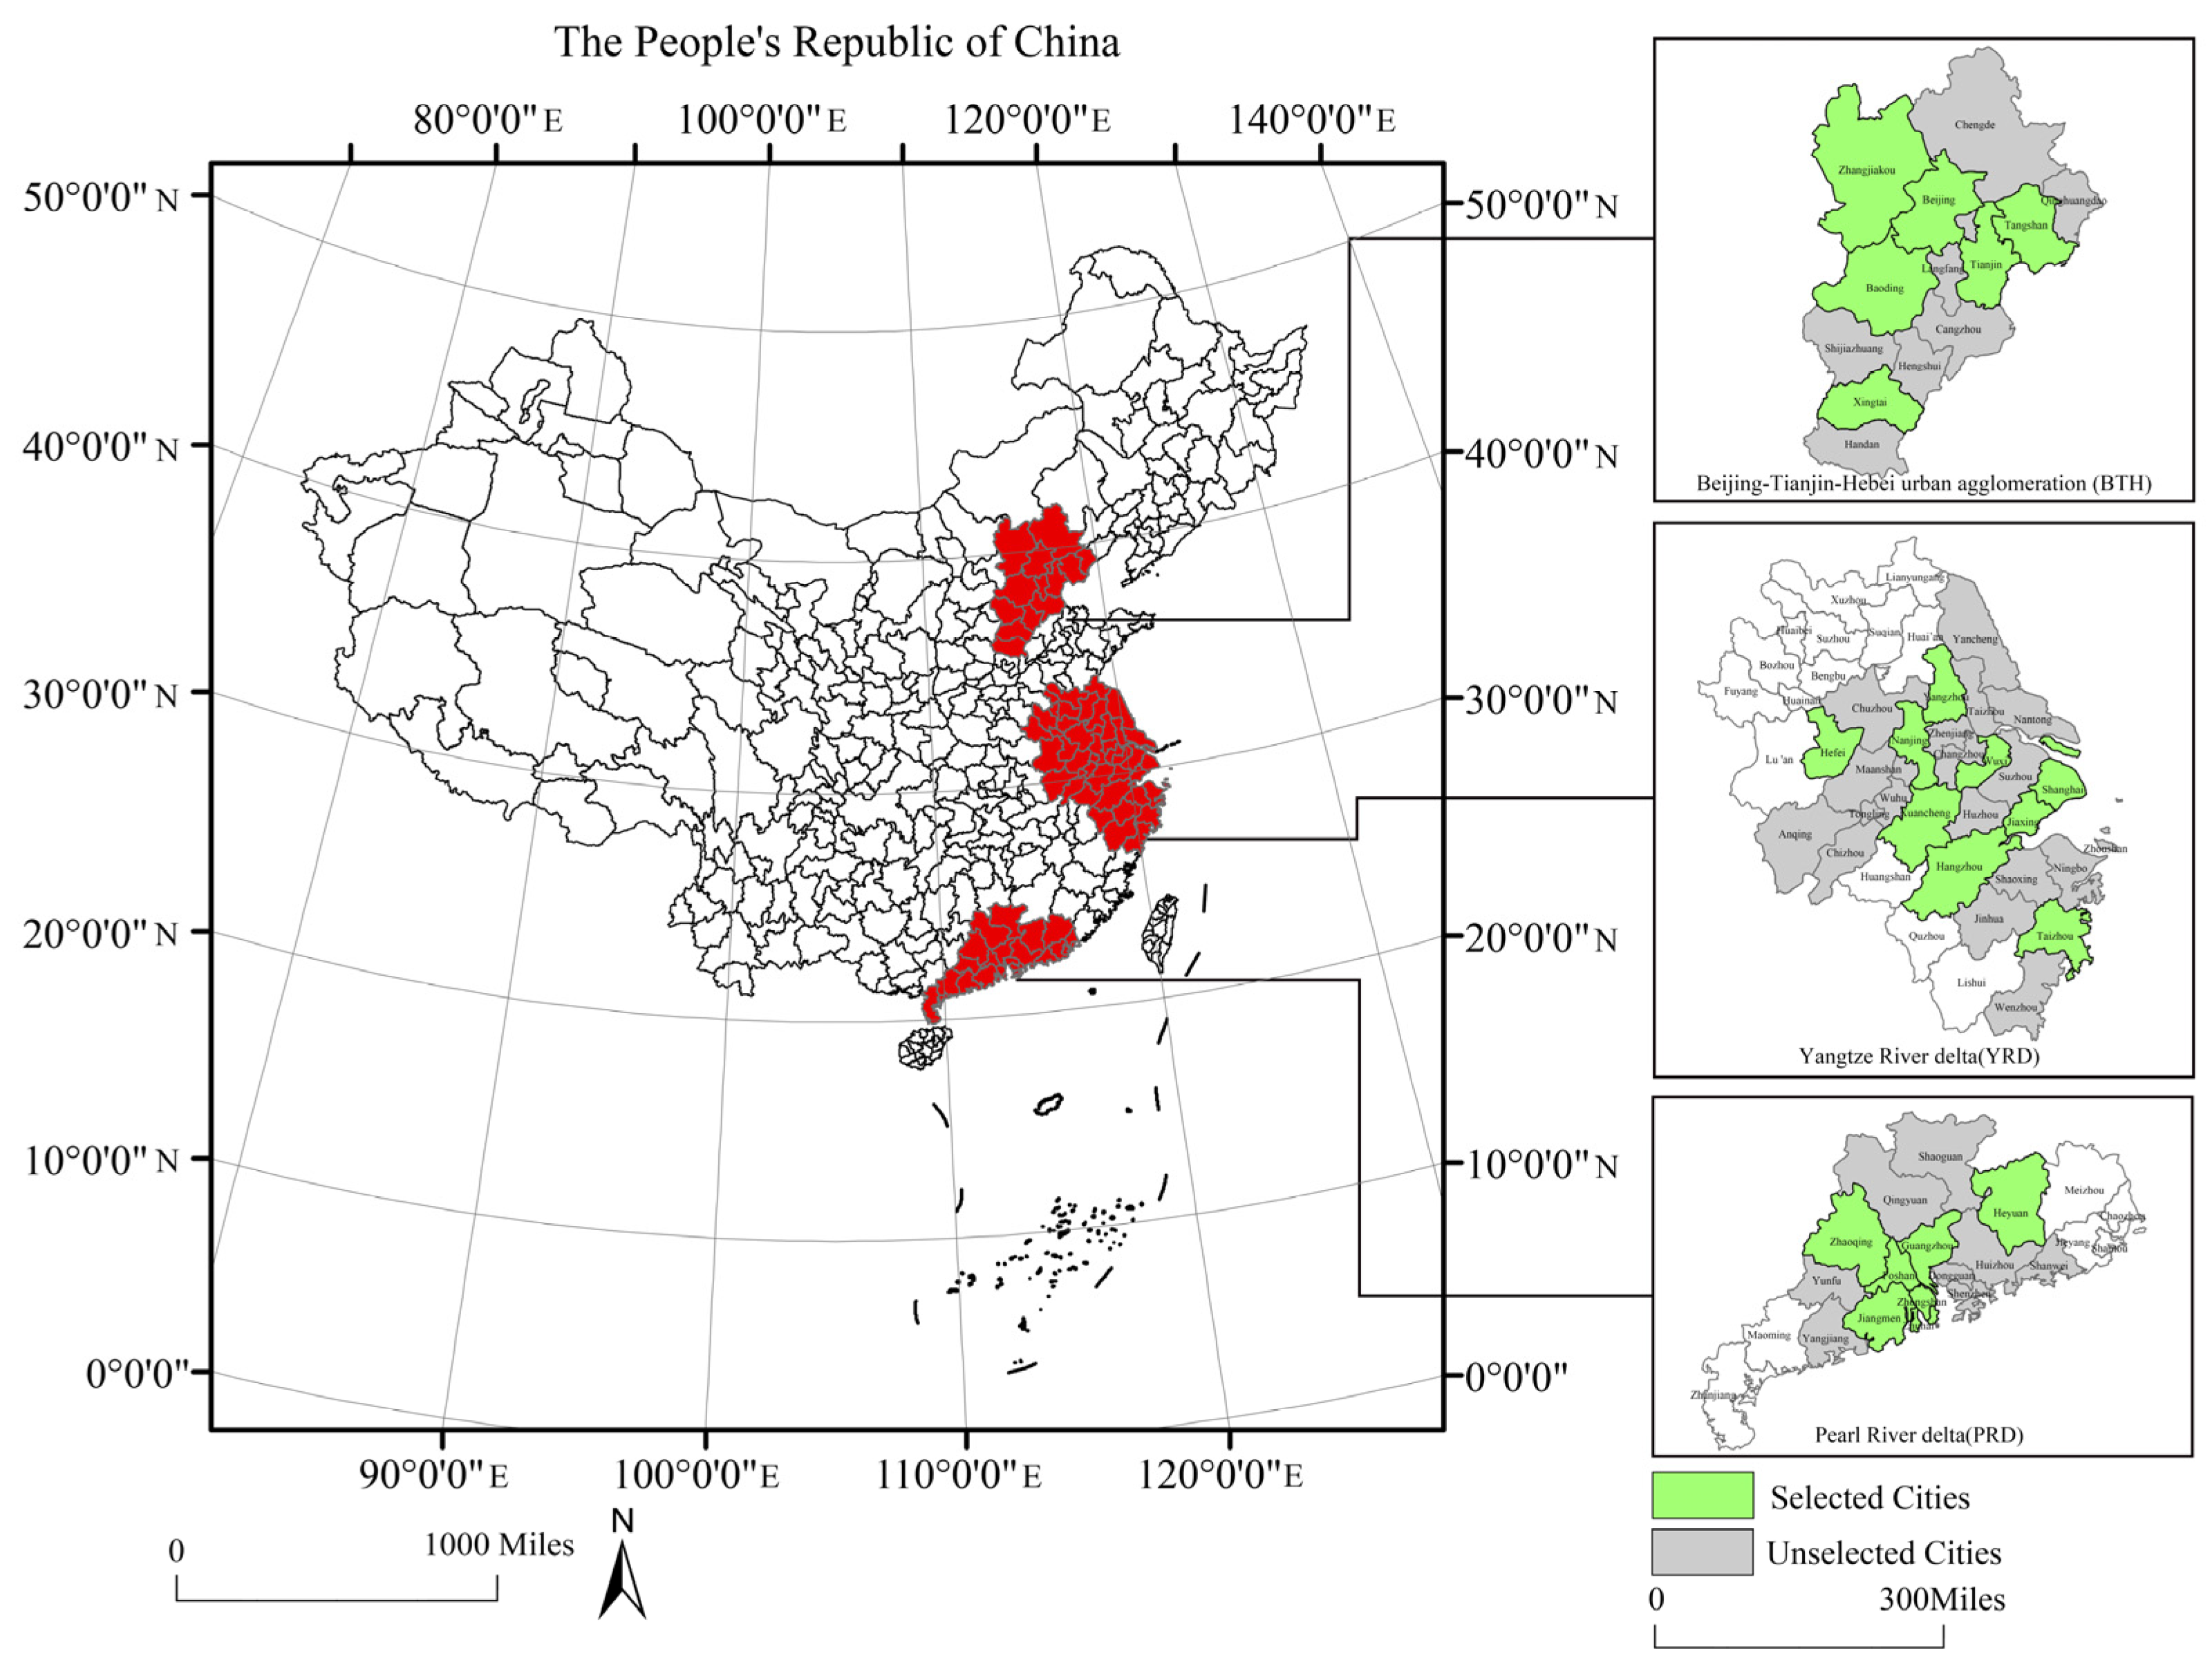
3.1. Case Study

The BTH, YRD, and PRD regions are highly urbanized areas. From 1994 to 2014, these three major urban agglomerations not only ranked among the top three in terms of annual average GDP, but also ranked among the top in terms of the increase in the total GDP. BTH, YRD, and PRD are in the economically developed eastern coastal areas. The total area of BTH is 216,000 km2. The permanent population of Beijing is 21.89 million, and the population aged 60 and above reached 4.30 million at the end of 2020, accounting for 19.70% of the total population. YRD is in the lower reaches of the Yangtze River, with a total area of 358,000 km2. At the end of 2020, the number of permanent residents in Shanghai reached 24.88 million, and the population aged 60 and above reached 5.82 million, accounting for 23.4% of the total population. PRD is in the lower reaches of the Pearl River in Guangdong Province, with a total area of 56,000 km2. By the end of 2020, the number of permanent residents in Guangzhou reached 18.74 million, and the number of people aged 60 and above reached 1.80 million, accounting for 18.27% of the total population. The total populations, numbers of elderly people, and their proportions in the total populations of the three major urban agglomerations are large, and the regions’ economic and geographical advantages are obvious. Therefore, this research explores the specific impacts of urban environment, social environment, individual health, and sociodemographic characteristics on elderly people’s sense of safety, with cities as the basic unit. Choosing these three major urban agglomerations as research case sites confers a certain typicality and representativeness. Based on the sample size limitations of existing databases, nine cities in YRD, six cities in BTH, and eight cities in PRD were selected (Figure 1).

3.2. Data Sources

The data in this work come from the comprehensive database established by the CLDS. In 2016, the CLDS database covered 29 provinces and cities in China, and the sample communities were randomly processed. Referring to the seventh population census, this work defines elderly people as males over 60 years old and females over 55 years old [45]. Sample screening was conducted in the CLDS 2016 database, and a total of 1212 respondents were selected from 23 cities. There are 368 respondents in YRD, 367 respondents in BTH, and 477 respondents in PRD. At the same time, we used basic geographic data to obtain urban environmental characteristic variable data, including the population density, urbanization rate, number of hospitals, greening rate, and air quality (PM10). The data on population density, urbanization rate, and number of hospitals all originated from the China Statistical Yearbook in 2016 [46]. Furthermore, the data on greening rate were extracted by reference to the LUCC database of China, which reflected the quality of urban environments [47]. The data on PM10 are reference to the data from China Science (http://www.resdc.cn (accessed on 15 June 2016).
Table 1 shows the social and demographic characteristics of the total sample and subsamples of the three major urban agglomerations. In the total sample, the average age of the elderly population is 62.31 years old, with a gender ratio of 39.69 male:60.31 female. The majority of the population is married (92.07%), 91.59% are not members of the Communist Party, and 56.4% have an education level of primary and secondary school or below. According to the 2017 China Demographic Yearbook, the male to female ratio of the elderly population is approximately 4:6 [46]. Therefore, the total sample data in this study have a certain representativeness.
The average ages of elderly people in PRD, YRD, and BTH are 63.17 years old, 62.50 years old, and 61.01 years old, respectively. The PRD and YRD regions have similar gender ratios of approximately 4:7, while BTH has a ratio of approximately 3:7. In terms of political affiliation, the proportion of party members in YRD is 12.8%, which is higher than those in PRD and BTH. The proportions of party members in PRD and BTH are similar, at 6.0% and 5.5%, respectively. The proportions of local hukou household registration in BTH and PRD are higher than that in YRD. The proportion of respondents with a bachelor’s degree and above is higher in YRD than those in PRD or BTH.

3.3. Research Methods

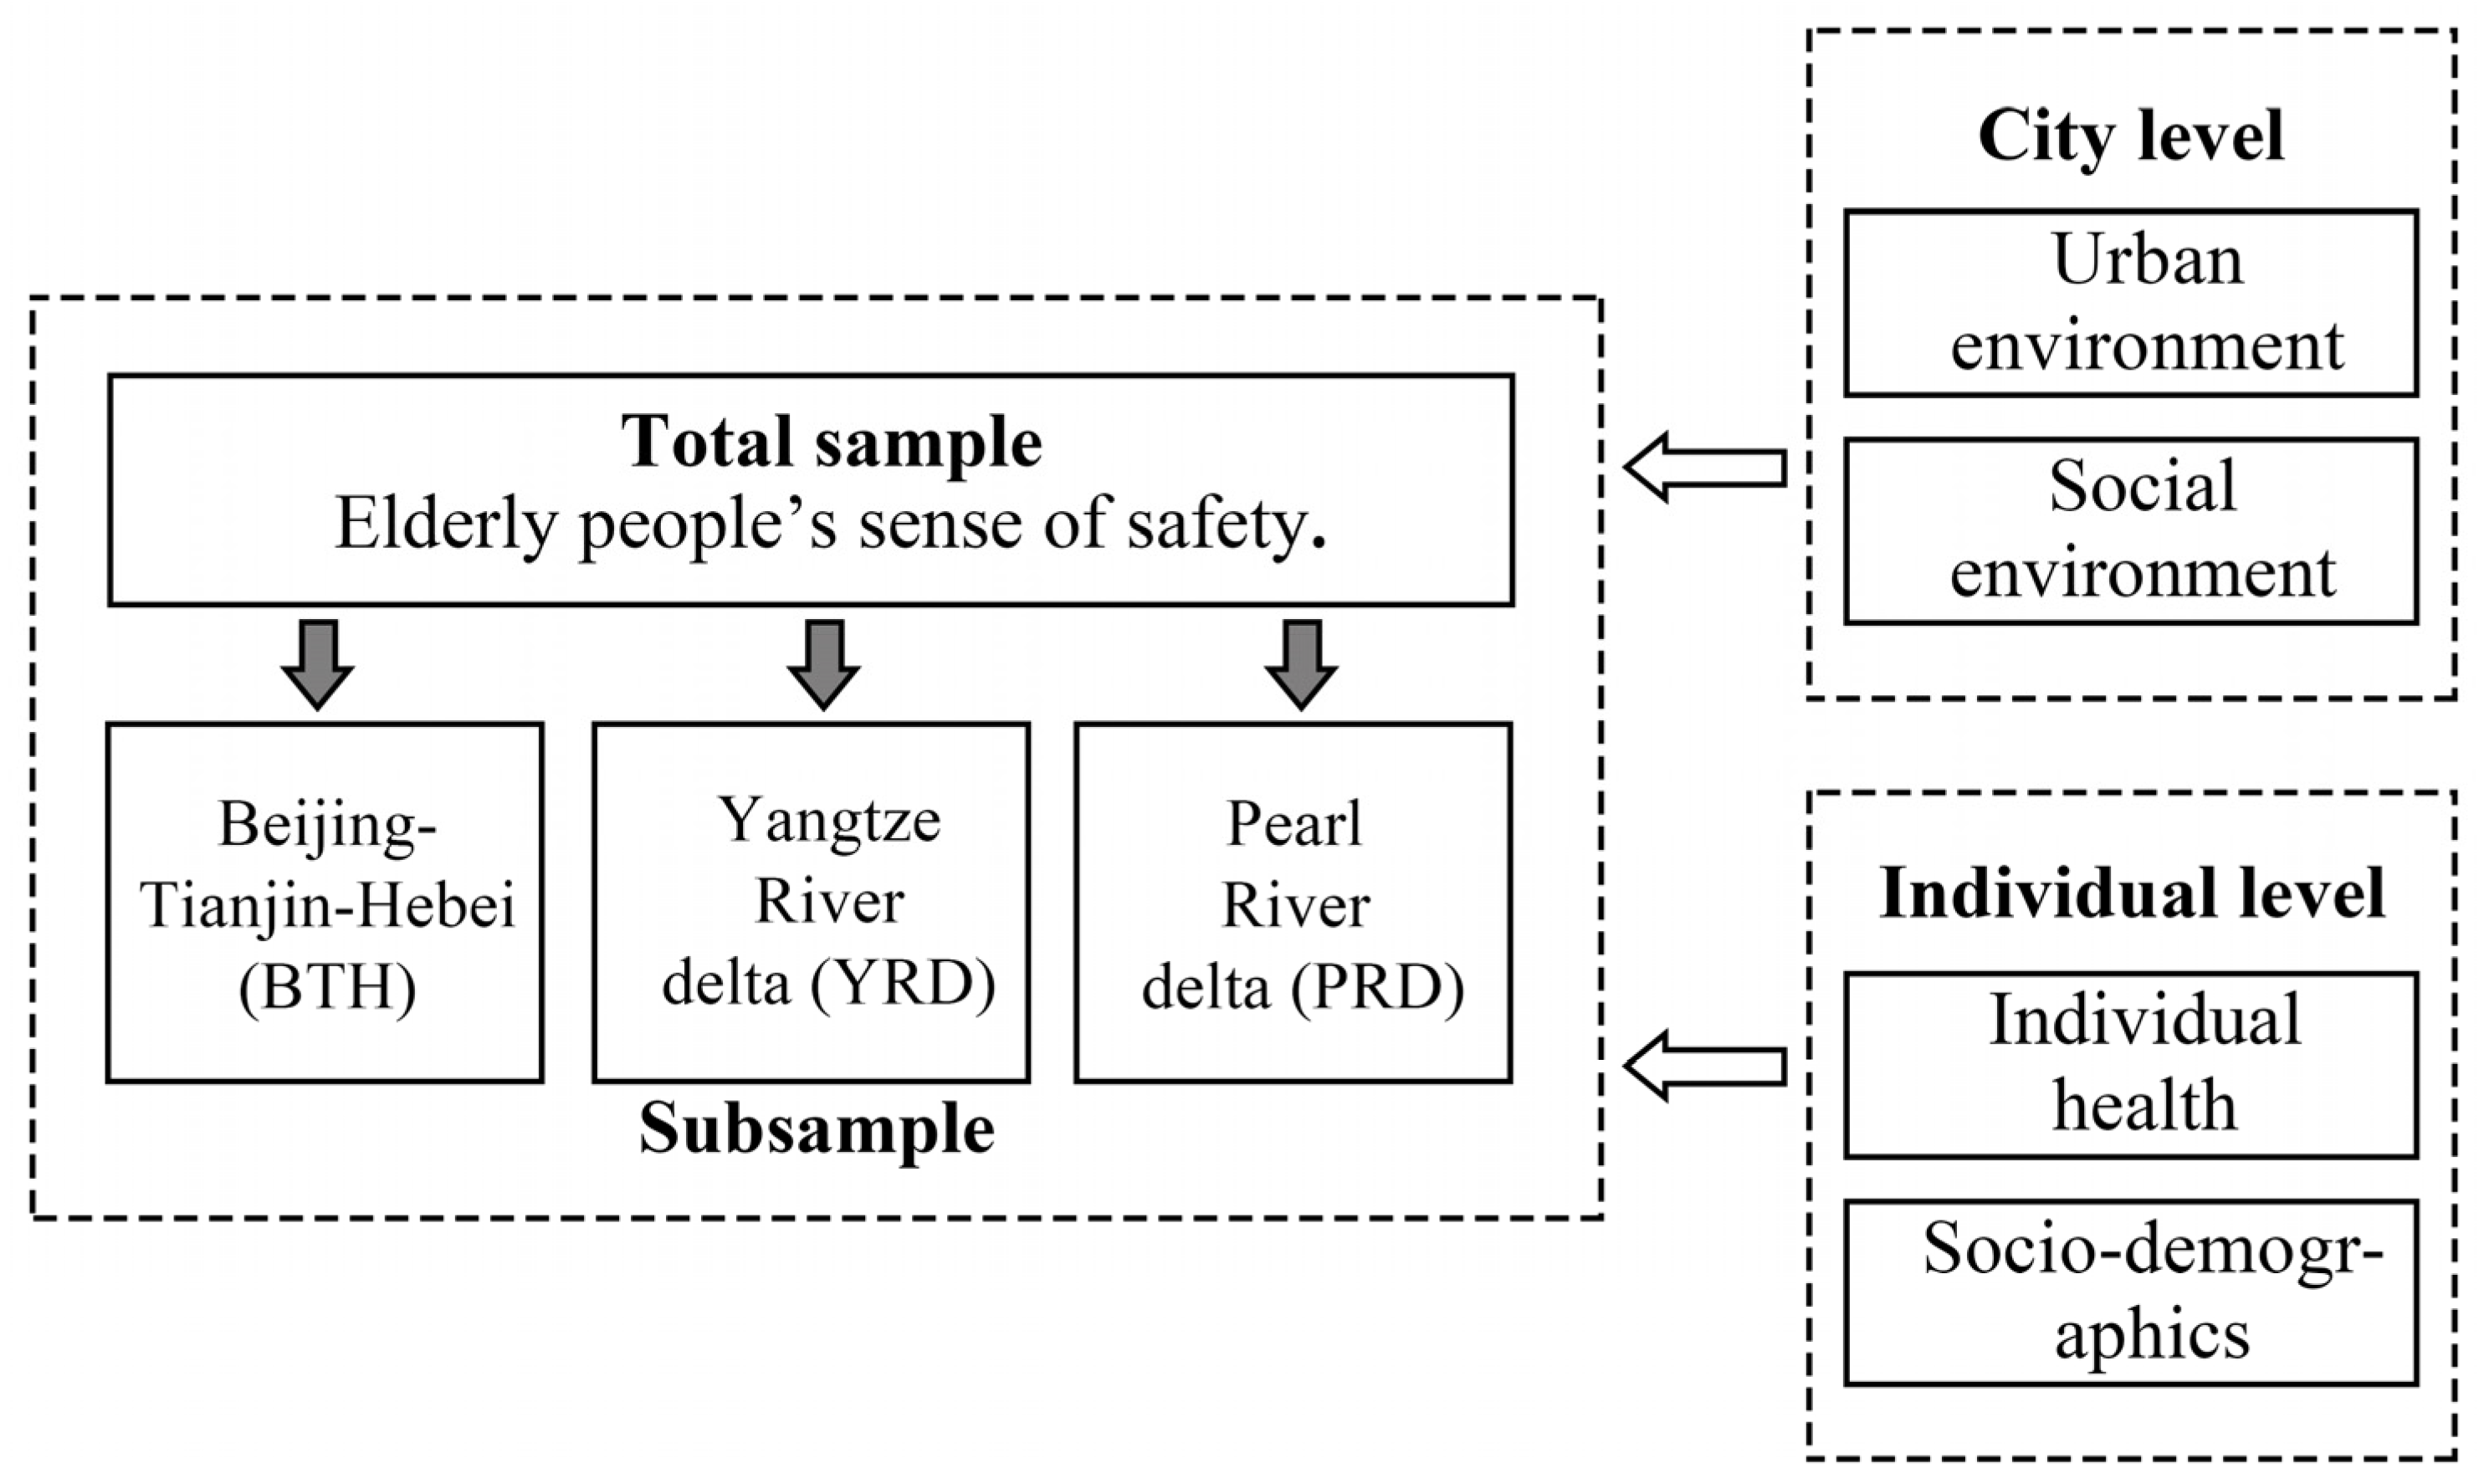
3.3.1. The Research Framework

With all the data prepared, we used the linear regression model to explore the impact mechanisms of urban environment, social environment, individual health, and sociodemographic characteristics on elderly people’s sense of safety in total sample and three major urban agglomeration subsamples. The research framework is shown in Figure 2.

3.3.2. Linear Regression Model

Elderly people’s sense of safety is often determined by the characteristics of the urban environment, social environment, and individual health. Selecting sense of safety as the dependent variable, this work uses the ordinary least squares method to establish a linear regression model to measure the impact of the urban built environment on elderly people’s sense of safety and calculates the explanatory power of each variable on the differences in elderly people’s sense of safety. Specifically, a random intercept model is used, for which the equation is as follows:
Y i j = α 1 + η X j + β 1 Z i j + γ 1 W i j + δ 1 S i j + μ i j + ε 1 i j + θ 1 i j
where Y i j represents the level of elderly people’s sense of safety of individual i in city j; X j represents the variables for urban environmental characteristics of city j; Z i j represents the variables for the sociodemographic characteristics of resident i of city j; W i j represents the variable for the social environment of resident i of city j; S i j represents the variable for the individual health characteristics of resident i of city j; α 1 represents the intercept; η is represents the total effect of the independent variables; β 1 represents the coefficient of the sociodemographic characteristics; γ 1 represents the coefficient of the social environment; δ 1 represents the coefficient of individual health; μ i j represents the residual of the sociodemographic characteristics; ε 1 i j represents the residual of the social environment; and θ 1 i j represents the residual of individual health characteristics.

3.4. Variables and Measures

3.4.1. Sense of Safety

Zeng et al. developed a specific scale to measure sense of safety [15]; this work draws on their research scale on residential sense of safety, and the scale is strictly revised according to the program for use. The Kaiser-Meyer-Olkin (KMO) value of the scale in this work is 0.933, and the Bartlett sphere test is significant. The overall Cronbach’s α value of the scale is 0.645 (Table 2), which shows that the questionnaire design is reasonable. Specifically, it includes five items about the likelihood of encountering related events in the next five years, including unemployment, crimes, terrorist attacks, consuming counterfeit drugs or substandard food, and infectious disease, aimed at measuring elderly people’s sense of safety. Responses range from 1 to 4, which are very likely, quite likely, relatively unlikely, and very unlikely, respectively. The overall score range of the scale is 5–20 points, and the higher the scale score, the higher the level of safety of the respondents.

3.4.2. Social Environment Characteristics

This article discusses the impact of social environment characteristics on elderly people’s sense of safety from three aspects: the availability of social support, community trust, and frequency of dining outside the home. Wood et al. pointed out that the safety experience depends on the closeness of the interactions between individuals and others [21], which shows that it is necessary to study social environment characteristics during research on the sense of safety. The urban environment often interacts with the social environment, thereby affecting elderly people’s sense of safety. The social disintegration theory posits that the weakening of community cohesion and the heterogeneity of population attributes caused by population mobility increase the sense of disorder and insecurity in society [48,49].
This study is based on the question “How many close friends/acquaintances do you have locally that can provide their support and assistance?” to explore indicators of the social support of elderly people in terms of social environment characteristics. This study uses 5-level scoring to measure the level of community trust among elderly people. A score of 1 indicates “very distrusting” and a score of 5 indicates “very trusting”. As the score increases, the trust level of elderly people toward residents in the living environment increases. The variables about frequency of dining out are based on a 5-level scoring measurement of five indicators: “dining out on weekdays”, “dining out on rest days”, “inviting people to dine out”, “being invited to dine out”, and “dining out with friends.” The frequency of dining out is considered from three aspects: different times, different situations, and different objects. The frequency of dining out is rated as 1 point for never to 5 points for often, and the higher the score, the higher the frequency of elderly people dining out in the past three months. The Cronbach’s α of the frequency of dining out is 0.926 (Table 3), which indicates good reliability of the questionnaire.

3.4.3. Urban Environmental Characteristics

Urban population density and urbanization rate are the basic indicators of economic development in the built environment of cities in the case study area, which are closely related to the quality of life of the elderly. Based on the concentrated leisure and entertainment venues and more frequent medical assistance seeking of the elderly, this work selects the number of urban hospitals, greening rate, and pollution with particulate matter of 10 µm or less (PM10) in June 2016 as indicators (Table 4).

3.4.4. Individual Health Characteristics

The health characteristics of elderly people are measured with two dimensions: physical and mental health. This work selected four indicators of physical health: smoking history, drinking history, hospitalization status, and exercise status. When the two indicators of smoking and drinking history have values of 1, the elderly person has a history of this behavior. The hospitalization status of the elderly is measured by whether they have been hospitalized since 2015. A value of 1 indicates that the elderly person has been hospitalized. In addition, a certain amount of physical exercise is beneficial for elderly people to have a healthy lifestyle. This study measures the exercise status of elderly people in the past month. Referring to the study by Qiu et al., the CES-D20 Depression Self-Rating Scale was used to measure mental health status [51]. Among the 20 items, there are 15 common negative emotions that may have appeared in the past week and 5 daily behaviors that can reflect negative psychological states, including worrying about some small things; not wanting to eat, mybecause of poor appetite; and even with the help of family and friends, being unable to get rid of depression. The scale adopts a 4-level reverse scoring system, with scores ranging from 1 to 4, which are sequentially (5–7 days), often (3–4 days), rarely (1–2 days), and never/almost never (less than 1 day). The higher the score, the better the mental health level of the elderly person in the past week. The Cronbach’s α of the mental health subscale is 0.929 (Table 5), which indicates good reliability of the questionnaire.

4. Results and Analysis

4.1. Analysis of Total Sample Results

As shown in Table 6, Model 1 shows the overall model regression results. In the social environment characteristics, the frequency of dining out has a significant negative impact on the sense of safety of elderly people, with a coefficient of −0.059. This indicates that in the past three months, the higher the frequency of dining out, the lower the sense of safety score of elderly people. Previous studies have shown that in terms of public social issues, the problem of elderly people being deceived is particularly severe [52,53]. Elderly people dining out may invite fraud incidents, which may cause economic losses and serious trauma to the elderly [54,55,56]. Elderly people’s sense of safety decreases as a result. In terms of urban environmental characteristics, the number of hospitals has a significant positive impact on elderly people’s sense of safety. For each additional hospital in the case area, the sense of safety score of the elderly increases by 0.002. The increase in coverage and use of medical and health resources is beneficial for the physical and mental health of the elderly. The medical security effect is a significant factor in improving the health of the elderly [57]. Therefore, numerous high-quality medical service institutions can to some extent enhance the sense of safety score of the elderly. In addition, urbanization rate, population density, greening rate, and PM10 have significant negative effects on elderly people’s sense of safety, with coefficients of −0.033, −0.000, −0.020, and −0.013, respectively. The reason for this is that the continuous acceleration of urbanization and industrialization has increased crowding effects; the increases in population density and transportation costs have adverse effects on the health of the elderly [19]. Elderly people may experience increased psychological pressure and low emotions when facing rapidly changing external environments, leading to a decrease in their sense of safety. Furthermore, studies have shown that the lack of safety management in green spaces may lead to thefts surrounding green spaces, which reduce residents’ sense of safety [58]. Additionally, He et al. found that air quality can affect residents’ travel, and elderly people with respiratory problems may be more likely to be affected [20]. Air pollutants have a negative impact on the health of the elderly, leading to a decrease in their sense of safety.
Among individual health characteristics, exercise and mental health have significant positive impacts on elderly people’s sense of safety. Specifically, for each unit of improvement in exercise and the mental health status of the elderly, their sense of safety scores increase by 0.366 and 0.041, respectively. Regular and sufficient physical activity can be beneficial for physical and mental health and can also reduce the risk of many chronic diseases [59]. Research has shown that community safety can promote residents’ outdoor activities, indicating a clear correlation and mutual influence between safety and exercise [1,4,9]. Additionally, previous studies have shown that social support promoted emotional calmness and stability in older adults, thereby affecting their sense of safety [60]. Therefore, the better the exercise and mental health status of the elderly, the higher their sense of safety score. In the sociodemographic control variables, the political affiliation indicator has a significant positive impact on elderly people’s sense of safety, with a coefficient of 0.181, indicating that elderly people who identify as members of the Communist Party of China have higher sense of safety scores than those without party membership. The reason for this is that party members are considered exemplary role models among the population, and political affiliation and identity are crucial factors affecting the sense of safety of the elderly.
Summarizing the above, elderly people’s sense of safety is influenced by four dimensions: urban environment, social environment, individual health, and sociodemographic characteristics. Firstly, the five variables of the urban environment have a significant impact on elderly people’s sense of safety. Among them, urbanization rate, greening rate, population density, and air quality (PM10) have a negative impact on elderly people’s sense of safety; the number of hospitals has a significant positive impact on elderly people’s sense of safety, and the increase in the number of hospitals enhances their sense of safety. Secondly, in terms of the social environment characteristics, the frequency of dining out among elderly people has a negative impact on their sense of safety. The increase in the frequency of dining out increases the frequency of elderly people encountering danger during outdoor activities to a certain extent. Thirdly, in terms of individual health, the increase in mental health and exercise status has a certain positive effect on elderly people’s sense of safety. Fourthly, in terms of the sociodemographic control variables, political affiliation has a significant impact on their sense of safety.

4.2. Comparative Analysis of Three Major Urban Agglomerations

This article takes sociodemographic characteristics as the control variables, and takes social environmental characteristics, urban environmental characteristics, and individual health characteristics as the inspection variables. We established subsample models for three major urban agglomerations to examine the variables’ impact mechanisms on the sense of safety among the elderly. As shown in Table 7, population density and greening rate in urban environmental characteristics have significant negative impacts on elderly people’s sense of safety in the YRD urban agglomeration (Model 2). Specifically, for each unit increase in population density and greening rate in YRD, the sense of safety scores of the elderly decrease by −0.001 and −0.023, respectively. Centralized services often accompany a high population density, and although the convenience of life has increased, so has the sense of chaos and insecurity [27]. Among individual health characteristics, hospitalization has a significant negative impact on elderly people’s sense of safety, with a coefficient of −1.285, indicating that obtaining a doctor’s diagnosis of hospitalization can decrease elderly people’s sense of safety.
In BTH (Model 3), the PM10 in urban environmental characteristics has a significant negative impact on elderly people’s sense of safety, with a coefficient of −0.040. This indicates that the higher the PM10 value in BTH, the lower the sense of safety score of the elderly. Among individual health characteristics, mental health status has a significant positive impact on elderly people’s sense of safety. For each unit of improvement in the mental health status of the elderly, their sense of safety score increases by 0.050 units. In terms of social demographic characteristics, gender has a significant negative impact on the sense of safety among the elderly, with a coefficient of −0.912. It is likely that gender affects residents’ feelings and attitudes toward sense of safety. Men’s sense of safety is often higher than women’s, which may be related to mental health level and frequency of sports activities [17,21].
Additionally, political affiliation has a significant positive impact on elderly people’s sense of safety, with a coefficient of 1.326, indicating that the sense of safety scores of elderly people who are members of the Communist Party of China are higher than those of non-party members.
In PRD, the influencing factors of elderly people’s sense of safety are reflected in the characteristics of the urban environment. Population density and PM10 value have significant negative impacts on elderly people’s sense of safety. For each unit increase in population density and PM10 values corresponding to each city in PRD, the sense of safety scores of the elderly decrease by −0.002 and −0.094 units, respectively. Specifically, the core area of PRD has always been the most densely populated area in Guangdong Province. The huge influx of people has led to sharp increases in population density, resulting in issues such as land resource scarcity and deterioration of urban living environments. As a result, elderly people’s sense of safety has also decreased. Additionally, atmospheric pollutant transport between various urban agglomerations in PRD leads to regional air pollution rather than local pollution [61,62]. Major atmospheric pollutants such as sulfur dioxide and nitrogen dioxide have seriously affected the ecological environment and human health [63], thereby affecting elderly people’s sense of safety.
In summary, the three major urban agglomerations are compared in terms of three aspects. First, the impacts of urban environmental characteristics on elderly people’s sense of safety in YRD and PRD are higher than that in BTH. Specifically, population density has a significant negative impact on elderly people’s sense of safety in both YRD and PRD. The population densities of YRD and PRD are high compared with BTH. The increase in population density caused by urban expansion can cause a series of negative external problems such as traffic congestion and environmental pollution. Due to their decline in physical function, elderly people walk outside, and the risks caused by collisions on the road are increasing, resulting in a decrease in their sense of safety [41,64]. PM10 has significant negative impacts in BTH and PRD, while the greening rate has a significant negative impact in YRD. In recent years, haze and air quality problems have become increasingly serious. Air pollution has seriously disrupted the production and life of Chinese citizens. The air pollution problem is particularly serious in BTH [65]. Second, the impact of individual health characteristics on elderly people’s sense of safety in YRD is greater than that in BTH, while the impact in PRD is not significant. Hospitalization and exercise status have significant impacts on elderly people’s sense of safety in YRD, while psychological health status has positive impacts on elderly people’s sense of safety in YRD and BTH. As life pressure increases, the elderly become more vulnerable, leading to a decrease in the quality of life [13].

5. Discussion

Elderly people’s sense of safety is related to the urban environment, the social environment, and individual health. However, few studies have analyzed the mechanism of the impact of elderly people’s sense of safety within a framework that includes these three factors. Therefore, it is necessary to conduct more in-depth research to explore the impact mechanism of elderly people’s sense of safety, in order to better improve their sense of safety and build an elderly-friendly city.
The comparison between our findings and the conclusions of previous studies is worth discussing. First, among urban environmental characteristics, the number of hospitals had a significant positive impact on elderly people’s sense of safety, while urbanization rate, population density, greening rate, and PM10 had significant negative impacts. The positive association between the number of hospitals and elderly people’s sense of safety was as expected, and some studies have pointed out that improvements in medical safety are related to the health level of elderly people [66,67,68]. The high level of urbanization, population density, and PM10 mean that the living environment is more crowded and complex for the elderly, thereby increasing the probability of their health being damaged, such as in traffic accidents [19]. Although many studies suggest a positive correlation between greening rate and residents’ health, there is also literature indicating a positive correlation between greening rate and criminal robbery cases [69,70]. As a vulnerable group, the elderly are more likely to be harmed, so greening rate may reduce their sense of safety toward the surrounding environment [71].
Meanwhile, among social environmental characteristics, the frequency of dining out had a significant negative impact on the sense of safety among the elderly. Among individual health characteristics, exercise status and mental health status significantly improved the sense of safety of elderly people. With the increase in age and the continuous decline in physical function, the physical labor that the elderly can expend for travel drops sharply, but the higher frequency of dining out means the elderly need to consume more physical strength when going out. If the surrounding travel facilities are not complete, this brings greater travel pressure to the elderly, and thus leads to a lower sense of safety [72,73]. Better exercise and mental health status indicate that the elderly live in a friendly and comfortable and relaxed environment, and therefore have a higher sense of safety, which is coincident with the conclusions of most of the previous literature [13,37].
In addition, different characteristics have different impacts on the three urban agglomerations. Population density has a significant negative impact on elderly people’s sense of safety in YRD and PRD. Air quality (PM10) significantly reduced the sense of safety of elderly people in BTH and PRD. Among individual health characteristics, hospitalization indicators had a negative impact on elderly people’s sense of safety in YRD, and exercise habits had a positive impact on safety, while good psychological health status improved elderly people’s sense of safety in YRD and BTH. These differences may be due to the different urban development stages, population characteristics, industrial structures, and policies of the three urban agglomerations [74,75].
This study uses a linear regression model to explore the impact mechanism of elderly people’s sense of safety in three major urban agglomerations in China, enriching the relevant research on sense of safety and the elderly group. These findings contribute to a deeper understanding of the mechanisms underlying the sense of safety among urban elderly people in China, as well as the impact of safety awareness on urban aging, including factors such as urban environment, social environment, and individual health. Based on the above conclusions, we propose strategies to enhance the safety awareness of the elderly, providing useful references for the transformation of urban aging and the construction of an elderly-friendly society. However, this study also has some limitations that could be improved in the future. First of all, this paper only uses the linear regression model to explore the mechanism that affects the sense of safety of the elderly, and the intermediary variables that affect the sense of safety of the elderly deserve further exploration. Second, this paper only measures the sense of safety from the subjective psychological characteristics of the elderly, which have certain deviations. Moreover, due to the limitations in data acquisition, it was not possible to analyze and study the cities in Northwest China. Therefore, the future research direction involves optimizing the methods and variables and enriching the research area to promote more objective and reasonable conclusions.

6. Conclusions and Recommendations

This work is based on the 2016 CLDS database, and explores the impact mechanisms of various factors on elderly people’s sense of safety in three major urban agglomerations. We explored the influencing factors and pathways of elderly people’s sense of safety from three aspects: urban environmental characteristics, social environmental characteristics, and individual health characteristics, and systematically compared the differences in safety perceptions among elderly people in the three major urban agglomerations of YRD, BTH, and PRD. The results show the following: (1) On the whole, in terms of urban environmental characteristics, the number of hospitals has a significant positive impact on the perception of environmental safety among the elderly, while urbanization rate, population density, greening rate, and PM10 have significant negative impacts on the perception of environmental safety among the elderly. In terms of social environmental characteristics, the frequency of dining out has a significant negative impact on the sense of environmental safety among the elderly. Among individual health characteristics, exercise status and mental health status can significantly improve the sense of safety level of elderly people. (2) Meanwhile, there are differences in the impact of different characteristics on the three major urban agglomerations of YRD, BTH, and PRD. Moreover, the results also indicate that Communist Party membership has a positive impact on the sense of safety of the elderly.
Based on the research findings, an urban aging adaptation transformation strategy consists of the following three points. (1) The first involves conducting aging adaptation transformations for green space environments: taking appropriate control of green areas, improving the quality of green environments, and improving green space safety management. In addition, aging adaptation transformations of medical and health facilities should be conducted. Community medical and health facilities should be combined with other community public facilities such as elderly care facilities and cultural facilities to achieve intensive development. (2) Second, improving the accessibility of dining venues can provide convenience and safety for elderly people’s lives. Promoting the construction of elderly dining tables, providing safe catering and dining services for elderly people in the community, and providing meal delivery services for elderly people with limited mobility can also enhance their sense of safety. (3) Third, enhancing the accessibility of leisure facilities and dividing sites according to functions can improve the mental health and exercise status of the elderly.

Author Contributions

Conceptualization, J.L. and M.D.; methodology, M.D. and F.L.; software, M.D. and L.Q.; validation, J.L. and F.L.; formal analysis, M.D.; investigation, B.C. and Z.L.; resources, J.L.; data curation, Z.Y.; writing—original draft preparation, J.L. and M.D.; supervision, R.W.; project administration, R.W.; funding acquisition, J.L. and R.W. All authors have read and agreed to the published version of the manuscript.

Funding

This work was supported by the National Natural Science Foundation of China (No. 42001147), the Guangdong Province Natural Science Fund (No. 2022A1515011728), the Science and Technology projects of Zhejiang Province (No. 2022C03168).

Institutional Review Board Statement

Not applicable.

Informed Consent Statement

Not applicable.

Data Availability Statement

Data are contained within the article.

Conflicts of Interest

The authors declare no conflict of interest.

References

  1. Han, H.; Yang, K.; Yang, C.; Yang, G.; Xu, L. Influence and Mechanism of a Multi-Scale Built Environment on the Leisure Activities of the Elderly: Evidence from Hefei City in China. Int. J. Environ. Res. Public Health 2022, 19, 9237. [Google Scholar] [CrossRef]
  2. Zhang, F.; Loo, B.P.; Wang, B. Aging in place: From the neighborhood environment, sense of community, to life satisfaction. Ann. Am. Assoc. Geogr. 2022, 112, 1484–1499. [Google Scholar] [CrossRef]
  3. van Hoof, J.; Marston, H.R.; Kazak, J.K.; Buffel, T. Ten questions concerning age-friendly cities and communities and the built environment. Build. Environ. 2021, 199, 107922. [Google Scholar] [CrossRef]
  4. Song, S.; Yap, W.; Hou, Y.; Yuen, B. Neighbourhood built Environment, physical activity, and physical health among older adults in Singapore: A simultaneous equations approach. Transp. Health 2020, 18, 100881. [Google Scholar] [CrossRef]
  5. Xin, Y.; An, J.; Xu, J. Continuous voluntary community care services for older people in China: Evidence from Wuhu. Front. Public Health 2022, 10, 1063156. [Google Scholar] [CrossRef] [PubMed]
  6. World Health Organization. Global Age-Friendly Cities: A Guide; World Health Organization: Geneva, Switzerland, 2007.
  7. Xi, J.P. File Assembly of Chinese Communist Party Twentieth National Congress; People’s Publishing House: Beijing, China, 2022. [Google Scholar]
  8. Lee, S.; Yoon, J.; Woo, A. Does elderly safety matter? Associations between built environments and pedestrian crashes in Seoul, Korea. Accid. Anal. Prev. 2020, 144, 105621. [Google Scholar] [CrossRef]
  9. Loukaitou-Sideris, A. Is it safe to walk? 1 neighborhood safety and security considerations and their effects on walking. J. Plan Lit. 2006, 20, 219–232. [Google Scholar] [CrossRef]
  10. Baba, Y.; Austin, D.M. Neighborhood environmental satisfaction, victimization, and social participation as determinants of perceived neighborhood safety. Environ. Behav. 1989, 21, 763–780. [Google Scholar] [CrossRef]
  11. Li, J.; Tian, L.; Ouyang, W. Exploring the relationship between neighborhood-built environment and elderly health: A research based on heterogeneity of age and gender groups in Beijing. Front. Public Health 2022, 10, 882361. [Google Scholar] [CrossRef]
  12. Hong, J.; Chen, C. The role of the built environment on perceived safety from crime and walking: Examining direct and indirect impacts. Transportation 2014, 41, 1171–1185. [Google Scholar] [CrossRef]
  13. Funk, L.M.; Allan, D.E.; Chappell, N.L. Testing the relationship between involvement and perceived neighborhood safety: A multinomial logit approach. Environ. Behav. 2007, 39, 332–351. [Google Scholar] [CrossRef]
  14. Van Hoof, J.; Dikken, J.; van Staalduinen, W.H.; van der Pas, S.; van den Hoven, R.F.; Hulsebosch-Janssen, L.M. Towards a better understanding of the sense of safety and security of community-dwelling older adults. the case of the age-friendly city of The Hague. Int. J. Environ. Res. Public Health 2022, 19, 3960. [Google Scholar] [CrossRef]
  15. Zeng, E.; Dong, Y.; Yan, L.; Lin, A. Perceived Safety in the Neighborhood: Exploring the Role of Built Environment, Social Factors, Physical Activity and Multiple Pathways of Influence. Buildings 2022, 13, 2. [Google Scholar] [CrossRef]
  16. Roe, J.; Mondschein, A.; Neale, C.; Barnes, L.; Boukhechba, M.; Lopez, S. The urban built environment, walking and mental health outcomes among older adults: A pilot study. Front. Public Health 2020, 8, 528. [Google Scholar] [CrossRef]
  17. Aliyas, Z. Does social environment mediate the association between perceived safety and physical activity among adults living in low socioeconomic neighborhoods? J. Transp. Health 2019, 14, 100578. [Google Scholar] [CrossRef]
  18. Bracy, N.L.; Millstein, R.A.; Carlson, J.A.; Conway, T.L.; Sallis, J.F.; Saelens, B.E.; Kerr, J.; Cain, K.L.; Frank, L.D.; King, A.C. Is the relationship between the built environment and physical activity moderated by perceptions of crime and safety? Int. J. Behav. Nutr. Phys. Act. 2014, 11, 24. [Google Scholar] [CrossRef] [Green Version]
  19. Wu, H.; Chen, Y.; Zhang, Z.; Jiao, J. The impact of street characteristics on older pedestrians’ perceived safety in Shanghai, China. J. Transp. Land Use 2020, 13, 469–490. [Google Scholar] [CrossRef]
  20. He, H.; Li, T.; Yu, Y.; Lin, X. Associations between built environment characteristics and walking in older adults in a high-density city: A study from a Chinese megacity. Front. Public Health 2020, 8, 577140. [Google Scholar] [CrossRef]
  21. Wood, L.; Shannon, T.; Bulsara, M.; Pikora, T.; McCormack, G.; Giles-Corti, B. The anatomy of the safe and social suburb: An exploratory study of the built environment, social capital and residents’ perceptions of safety. Health Place 2008, 14, 15–31. [Google Scholar] [CrossRef] [PubMed]
  22. Yung, E.H.; Conejos, S.; Chan, E.H. Social needs of the elderly and active aging in public open spaces in urban renewal. Cities 2016, 52, 114–122. [Google Scholar] [CrossRef]
  23. Cai, H. China Labor Force Dynamics Survey (CLDS); China Social Science Survey Platform: Guangzhou, China, 2016. [Google Scholar]
  24. Maslow, A.H.; Hirsh, E.; Stein, M.; Honigmann, I. A clinically derived test for measuring psychological security-insecurity. J. Gen. Psychol. 1945, 33, 21–41. [Google Scholar] [CrossRef]
  25. Schichel, M.C.; Veenstra, M.Y.; Kempen, G.I.; de Vugt, M.E.; van der Zanden, B.A.; Verhey, F.R. Senior friendly communities: Designing an approach for cross-border exchange of public health policy. Health Policy 2020, 124, 1129–1136. [Google Scholar] [CrossRef]
  26. Zhang, Y.; Qin, B.; Tang, J. The impact of urban built environment on residential security—Based on the empirical analysis of 278 urban communities across the country. Geogr. Sci. 2017, 37, 1318–1325. [Google Scholar]
  27. Yue, Y.; Yang, D.; Owen, N.; Van Dyck, D. The built environment and mental health among older adults in Dalian: The mediating role of perceived environmental attributes. Soc. Sci. Med. 2022, 311, 115333. [Google Scholar] [CrossRef] [PubMed]
  28. Cervero, R.; Kockelman, K. Travel demand and the 3Ds: Density, diversity, and design. Transp. Res. Part D Transp. Environ. 1997, 2, 199–219. [Google Scholar] [CrossRef]
  29. Ewing, R.; Cervero, R. Travel and the built environment: A meta-analysis. J. Am. Plan. Assoc. 2010, 76, 265–294. [Google Scholar] [CrossRef]
  30. Chen, S.; Bao, Z.; Chen, J.; Yang, L.; Lou, V. Sustainable built environment for facilitating public health of older adults: Evidence from Hong Kong. Sustain. Dev. 2022, 30, 1086–1098. [Google Scholar] [CrossRef]
  31. Morenoff, J.D. Neighborhood mechanisms and the spatial dynamics of birth weight. Am. J. Soc. 2003, 108, 976–1017. [Google Scholar] [CrossRef]
  32. Wang, D.; Lin, T. Built environments, social environments, and activity-travel behavior: A case study of Hong Kong. J. Transp. Geogr. 2013, 31, 286–295. [Google Scholar] [CrossRef]
  33. Lin, T.; Wang, D. Tradeoffs between in-and out-of-residential neighborhood locations for discretionary activities and time use: Do social contexts matter? J. Transp. Geogr. 2015, 47, 119–127. [Google Scholar] [CrossRef]
  34. Lin, T.; Wang, D.; Zhou, M. Residential relocation and changes in travel behavior: What is the role of social context change? Transp. Res. Part A Policy Pract. 2018, 111, 360–374. [Google Scholar] [CrossRef]
  35. McDonald, N.C. Travel and the social environment: Evidence from Alameda County, California. Transp. Res. Part D Transp. Environ. 2007, 12, 53–63. [Google Scholar] [CrossRef]
  36. Zhang, R.; Yao, E.; Liu, Z. School travel mode choice in Beijing, China. J. Transp. Geogr. 2017, 62, 98–110. [Google Scholar] [CrossRef]
  37. Marquet, O.; Miralles-Guasch, C. Neighbourhood vitality and physical activity among the elderly: The role of walkable environments on active ageing in Barcelona, Spain. Soc. Sci. Med. 2015, 135, 24–30. [Google Scholar] [CrossRef] [PubMed]
  38. Wilson, D.K.; Kirtland, K.A.; Ainsworth, B.E.; Addy, C.L. Socioeconomic status and perceptions of access and safety for physical activity. Ann. Behav. Med. 2004, 28, 20–28. [Google Scholar] [CrossRef]
  39. Tucker-Seeley, R.D.; Subramanian, S.V.; Li, Y.; Sorensen, G. Neighborhood safety, socioeconomic status, and physical activity in older adults. Am. J. Prev. Med. 2009, 37, 207–213. [Google Scholar] [CrossRef] [PubMed] [Green Version]
  40. Foster, S.; Giles-Corti, B.; Knuiman, M. Neighbourhood design and fear of crime: A social-ecological examination of the correlates of residents’ fear in new suburban housing developments. Health Place 2010, 16, 1156–1165. [Google Scholar] [CrossRef]
  41. Kim, D. The transportation safety of elderly pedestrians: Modeling contributing factors to elderly pedestrian collisions. Accid. Anal. Prev. 2019, 131, 268–274. [Google Scholar] [CrossRef]
  42. Mori, Y.; Tsuji, T.; Watanabe, R.; Hanazato, M.; Miyazawa, T.; Kondo, K. Built environments and frailty in older adults: A three-year longitudinal JAGES study. Arch. Gerontol. Geriat. 2022, 103, 104773. [Google Scholar] [CrossRef]
  43. Li, F. Physical activity and health in the presence of China’s economic growth: Meeting the public health challenges of the aging population. J. Sport Health Sci. 2016, 5, 258–269. [Google Scholar] [CrossRef] [Green Version]
  44. Liu, Y.; Sangthong, R.; Ingviya, T.; Wan, C. Nothing like living with a family: A qualitative study of subjective well-being and its determinants among migrant and local elderly in Dongguan, China. Int. J. Environ. Res. Public Health 2019, 16, 4874. [Google Scholar] [CrossRef] [PubMed] [Green Version]
  45. National Bureau of Statistics of China. The Seventh National Census; China Statistics Press: Beijing, China, 2021. [Google Scholar]
  46. National Bureau of Statistics of China. China Statistical Yearbook; China Statistics Press: Beijing, China, 2017. [Google Scholar]
  47. Liu, J.; Liu, M.; Deng, X.; Zhuang, D.; Zhang, Z.; Luo, D. The land use and land cover change database and its relative studies in China. J. Geogr. Sci. 2002, 12, 275–282. [Google Scholar]
  48. Lowenkamp, C.T.; Cullen, F.T.; Pratt, T.C. Replicating Sampson and Groves’s test of social disorganization theory: Revisiting a criminological classic. J. Res. Crime Delinq. 2003, 40, 351–373. [Google Scholar] [CrossRef]
  49. Abdullah, A.; Hedayati Marzbali, M.; Woolley, H.; Bahauddin, A.; Maliki, N.Z. Testing for individual factors for the fear of crime using a multiple indicator-multiple cause model. Eur. J. Crim. Policy Res. 2014, 20, 1–22. [Google Scholar] [CrossRef]
  50. Chinese Academy of Sciences. China Meteorological Data. Available online: http://www.resdc.cn (accessed on 15 June 2016).
  51. Qiu, Y.; Chen, H.; Li, Z.; Wang, R.; Liu, Y.; Qin, X. Exploring Neighborhood Environmental Effects on Mental Health: A Case Study in Guangzhou. Prog. Geogr. 2019, 38, 283–295. [Google Scholar]
  52. Lichtenberg, P.A.; Sugarman, M.A.; Paulson, D.; Ficker, L.J.; Rahman-Filipiak, A. Psychological and functional vulnerability predicts fraud cases in older adults: Results of a longitudinal study. Clin. Gerontol. 2016, 39, 48–63. [Google Scholar] [CrossRef] [Green Version]
  53. Burnes, D.; Henderson Jr, C.R.; Sheppard, C.; Zhao, R.; Pillemer, K.; Lachs, M.S. Prevalence of financial fraud and scams among older adults in the United States: A systematic review and meta-analysis. Am. J. Public Health 2017, 107, e13–e21. [Google Scholar] [CrossRef]
  54. Ross, M.; Grossmann, I.; Schryer, E. Contrary to psychological and popular opinion, there is no compelling evidence that older adults are disproportionately victimized by consumer fraud. Perspect. Psychol. Sci. 2014, 9, 427–442. [Google Scholar] [CrossRef] [PubMed]
  55. Kircanski, K.; Notthoff, N.; DeLiema, M.; Samanez-Larkin, G.R.; Shadel, D.; Mottola, G.; Carstensen, L.L.; Gotlib, I.H. Emotional arousal may increase susceptibility to fraud in older and younger adults. Psychol. Aging 2018, 33, 325. [Google Scholar] [CrossRef]
  56. Button, M.; Lewis, C.; Tapley, J. Not a victimless crime: The impact of fraud on individual victims and their families. Secur. J. 2014, 27, 36–54. [Google Scholar] [CrossRef]
  57. Lin, Y.; Wang, T.; Zhu, T. Do migration characteristics influence the utilization of basic public health services in internal elderly migrants in China? Front. Public Health 2021, 9, 514687. [Google Scholar] [CrossRef] [PubMed]
  58. Jiang, B.; Mak, C.N.S.; Zhong, H.; Larsen, L.; Webster, C.J. From broken windows to perceived routine activities: Examining impacts of environmental interventions on perceived safety of urban alleys. Front. Psychol. 2018, 9, 2450. [Google Scholar] [CrossRef]
  59. Bauman, A.E. Updating the evidence that physical activity is good for health: An epidemiological review 2000–2003. J. Sci. Med. Sport 2004, 7, 6–19. [Google Scholar] [CrossRef]
  60. Firdaus, G. Built environment and health outcomes: Identification of contextual risk factors for mental well-being of older adults. Ageing Int. 2017, 42, 62–77. [Google Scholar] [CrossRef]
  61. Wu, D.; Tie, X.; Li, C.; Ying, Z.; Lau, A.K.H.; Huang, J.; Deng, X.; Bi, X. An extremely low visibility event over the Guangzhou region: A case study. Atmos. Environ. 2005, 39, 6568–6577. [Google Scholar] [CrossRef]
  62. Wang, T.J.; Lam, K.S.; Xie, M.; Wang, X.M.; Carmichael, G.; Li, Y.S. Integrated studies of a photochemical smog episode in Hong Kong and regional transport in the Pearl River Delta of China. Tellus B Chem. Phys. Meteorol. 2006, 58, 31–40. [Google Scholar] [CrossRef]
  63. Tao, Y.; Zhong, L.; Huang, X.; Lu, S.E.; Li, Y.; Dai, L.; Zhang, Y.; Zhu, T.; Huang, W. Acute mortality effects of carbon monoxide in the Pearl River Delta of China. Sci. Total Environ. 2011, 410, 34–40. [Google Scholar] [CrossRef]
  64. Feng, J. The influence of built environment on travel behavior of the elderly in urban China. Transp. Res. Part D Transp. Environ. 2017, 52, 619–633. [Google Scholar] [CrossRef]
  65. Wang, A.N.; Jing, J.L.; Luo, F.L.; Liang, L.S. Analysis of aqi change characteristics and correlation with PM2.5 and PM10 in Beijing-Tianjin-Hebei region. Int. Arch. Photogramm. 2020, 42, 1041–1048. [Google Scholar] [CrossRef] [Green Version]
  66. Zhang, Y.; Yao, E. Exploring elderly people’s daily time-use patterns in the living environment of Beijing, China. Cities 2022, 129, 103838. [Google Scholar] [CrossRef]
  67. Fernandes, A.; Van Lenthe, F.J.; Vallée, J.; Sueur, C.; Chaix, B. Linking physical and social environments with mental health in old age: A multisensor approach for continuous real-life ecological and emotional assessment. J. Epidemiol. Commun. Health 2021, 75, 477–483. [Google Scholar] [CrossRef] [PubMed]
  68. Biswas, R.K.; Kabir, E. Influence of distance between residence and health facilities on non-communicable diseases: An assessment over hypertension and diabetes in Bangladesh. PLoS ONE 2017, 12, e0177027. [Google Scholar] [CrossRef] [PubMed]
  69. Liu, Y.; Wang, R.; Xiao, Y.; Huang, B.; Chen, H.; Li, Z. Exploring the linkage between greenness exposure and depression among Chinese people: Mediating roles of physical activity, stress and social cohesion and moderating role of urbanicity. Health Place 2019, 58, 102168. [Google Scholar] [CrossRef] [PubMed]
  70. Pouso, S.; Borja, Á.; Fleming, L.E.; Gómez-Baggethun, E.; White, M.P.; Uyarra, M.C. Contact with blue-green spaces during the COVID-19 pandemic lockdown beneficial for mental health. Sci. Total Environ. 2021, 756, 143984. [Google Scholar] [CrossRef] [PubMed]
  71. Brown, B.B.; Werner, C.M.; Smith, K.R.; Tribby, C.P.; Miller, H.J. Physical activity mediates the relationship between perceived crime safety and obesity. Prev. Med. 2014, 66, 140–144. [Google Scholar] [CrossRef] [PubMed] [Green Version]
  72. Collia, D.V.; Sharp, J.; Giesbrecht, L. The 2001 national household travel survey: A look into the travel patterns of older Americans. J. Saf. Res. 2003, 34, 461–470. [Google Scholar] [CrossRef] [PubMed]
  73. Gómez, L.F.; Parra, D.C.; Buchner, D.; Brownson, R.C.; Sarmiento, O.L.; Pinzón, J.D.; Ardila, M.; Moreno, J.; Serrato, M.; Lobelo, F. Built environment attributes and walking patterns among the elderly population in Bogotá. Am. J. Prev. Med. 2010, 38, 592–599. [Google Scholar] [CrossRef]
  74. Fishback, P.V.; Haines, M.R.; Kantor, S. Births, deaths, and New Deal relief during the Great Depression. Rev. Econ. Stat. 2007, 89, 1–14. [Google Scholar] [CrossRef]
  75. Chen, Y.L.; Shih, Y.H.; Tseng, C.H.; Kang, S.Y.; Wang, H.C. Economic and health benefits of the co-reduction of air pollutants and greenhouse gases. Mitig. Adapt. Strateg. Glob. Chang. 2013, 18, 1125–1139. [Google Scholar] [CrossRef]
Figure 1. The locations of the three major urban agglomerations and their studied cities in China.
Land 12 01486 g001
Figure 2. Conceptual framework.
Land 12 01486 g002
Table 1. Individual sociodemographic characteristics of the sample.
CharacteristicsTotalPRDYRDBTH
Number of samples1212477368367
Age (years)
Mean value62.3163.1762.5061.01
Gender (%)
Male39.6943.441.8532.70
Female60.3156.658.1567.30
Marital status (%)
Married92.0789.1089.9590.71
Unmarried/divorced/
widowed/separated
7.9310.9010.059.29
Political Affiliation (%)
Member of the Communist Party7.86.012.85.5
Non-Communist Party member92.294.086.994.5
Hukou status (%)
Local94.696.590.796.2
Nonlocal5.43.59.33.8
Education (%)
Primary school and below56.466.635.165.0
Middle and high school40.029.657.534.6
College and above3.63.87.40.4
Table 2. Reliability analysis of the sense of safety.
VariableCronbach’s αCronbach’s α Based on Standardized TermsExplanation
Sense of safety0.6450.7221. Unemployment
2. Crimes
3. Terrorist attacks
4. Consuming counterfeit drugs or substandard food
5. Being infected with a certain infectious disease
Table 3. Reliability analysis for the frequency of dining out.
VariableCronbach’s αCronbach’s α Based on
Standardized Terms
Explanation
Frequency of dining out0.9260.9261. Dining out on weekdays
2. Dining out on rest days
3. Inviting people to dine out
4. Being invited to dine out
5. Dining out with friends
Table 4. Urban environmental characteristics of the sample.
VariablesExplanationMeasurement Method
Population densityPopulation per unit land area (persons/km2)Number of permanent urban residents/total urban area
Urbanization rateThe proportion of urban permanent population to the total permanent populationUrban permanent population/total permanent population
Number of hospitalsNumber of hospitals in each case city
Greening rateThe proportion of green land to total land areaGreen land/total land area
Air quality (PM10)The average concentration of dust or drifting dust (particulate matter) with diameters of 10 μm or less (PM10) in the ambient air
Note: The data are from China Science (http://www.resdc.cn (accessed on 15 June 2016), the Statistical Yearbook of 2017, and the LUCC database of China [46,47,50].
Table 5. Reliability analysis of the mental health scale.
VariableCronbach’s αCronbach’s α Based on
Standardized Terms
Explanation
Mental health0.9290.9361. Worried about some small things.
2. Don’t want to eat, I have a bad appetite.
3. Even with the help of family and friends, I still can’t get rid of my depression.
4. Feeling inferior to others.
5. Unable to concentrate when doing things.
6. Feeling down.
7. Feeling that doing anything takes a lot of effort.
8. Feeling hopeless about the future.
9. Feeling like my life is a failure.
10. Feeling scared.
11. Poor sleep.
12. Feeling unhappy.
13. Speaking less than usual.
14. Feeling lonely.
15. Feeling that people are not very friendly to me.
16. Feeling that life is meaningless.
17. Crying.
18. Feeling nervous.
19. Feeling that people don’t like me.
20. Feeling that life cannot continue.
Table 6. Total sample regression model.
VariablesModel 1 (Total Sample)
CoefficientStandard ErrorT-Value
Urban environment
Urbanization rate−0.033 ***0.011−3.100
Greening rate−0.020 ***0.007−2.970
Number of hospitals0.002 **0.0012.050
Population density−0.000 *0.000−1.740
Air quality (PM10)−0.013 *0.007−1.920
Social environment
Social support−0.0060.006−1.050
Community trust−0.0140.113−0.130
Frequency of dining out−0.059 **0.028−2.120
Individual health
Mental health0.041 ***0.0123.550
Exercise status0.366 *0.2121.730
Smoking history−0.2720.275−0.990
Drinking history0.0660.2720.240
Hospitalization status−0.4690.318−1.470
Sociodemographic characteristics
Age0.0040.0220.180
Gender (Reference group: Female)
Male−0.3350.271−1.240
Marital status (Reference group: Unmarried/divorced/widowed/separated)
Married0.0370.3390.110
Political affiliation (Reference group: Non-Communist Party member)
Members of Communist Party0.181 **0.3530.510
Hukou status (Reference group: Nonlocal)
Local −0.8790.432−2.040
Education (Reference group: Primary school and below)
Middle and high school0.1420.2120.670
College and above−0.4200.590−0.710
Constant25.177 ***2.10311.970
Note: *, **, and ***, respectively, represent significance levels of 5%, 1%, and 0.1%, respectively.
Table 7. Subsample regression model.
VariablesModel 2 (YRD)Model 3 (BTH)Model 4 (PRD)
CoefficientStandard ErrorT-ValueCoefficientStandard ErrorT-ValueCoefficientStandard ErrorT-Value
Urban environment
Urbanization rate0.0420.0371.150−0.0020.044−0.0300.0000.054−0.000
Greening rate−0.023 *0.012−1.880−0.0510.033−1.570−0.0020.050−0.030
Number of hospitals0.0020.0040.6200.0000.0020.1000.0100.0061.610
Population density−0.001 **0.000−2.370−0.0010.001−1.310−0.002 **0.001−2.140
Air quality (PM10)−0.0160.029−0.550−0.04 **0.018−2.180−0.094 **0.044−2.140
Social environment
Social support−0.0190.013−1.4500.0070.0140.470−0.0050.007−0.760
Community trust−0.0810.239−0.340−0.2400.207−1.1600.1920.1731.110
Frequency of dining out−0.0270.056−0.490−0.0660.056−1.170−0.0510.046−1.120
Individual health
Mental health0.068 ***0.0223.0900.050 **0.0212.3400.0280.0191.450
Exercise status1.210 ***0.4082.960−0.1470.375−0.3900.3310.3790.870
Smoking history−0.7940.513−1.550−0.6150.495−1.2400.1800.4720.380
Drinking history0.4650.4930.9400.0810.5360.150−0.0040.442−0.010
Hospitalization status−1.285 *0.675−1.900−0.2880.625−0.4600.0150.4620.030
Sociodemographic characteristics
Age0.0100.0370.280−0.0730.068−1.0800.0040.0320.140
Gender (Reference group: Female)
Male−0.2050.457−0.450−0.912 *0.547−1.6700.1370.4640.300
Marital status (Reference group: Unmarried/divorced/widowed/separated)
Married−0.1630.649−0.2500.4420.7130.620−0.1390.503−0.280
Political affiliation (Reference group: Non-Communist Party member)
Members of
Communist Party
−0.7970.712−1.1201.326 **0.5642.350−0.5560.638−0.870
Hukou status (Reference group: Nonlocal)
Local−1.1370.916−1.240−0.8020.723−1.110−0.9600.821−1.170
Education (Reference group: Primary school and below)
Middle and high school0.2260.4580.490−0.1350.423−0.3200.0850.3390.250
College and above−1.1751.045−1.120−0.9250.886−1.0401.4842.1110.700
Constant19.447 ***4.3884.43032.627 ***5.0356.48024.642 ***6.1384.010
Note: *, **, and *** represent significance levels of 5%, 1%, and 0.1%, respectively.
Disclaimer/Publisher’s Note: The statements, opinions and data contained in all publications are solely those of the individual author(s) and contributor(s) and not of MDPI and/or the editor(s). MDPI and/or the editor(s) disclaim responsibility for any injury to people or property resulting from any ideas, methods, instructions or products referred to in the content.

