Abstract
As part of urban green space and emergency shelters, refuge green spaces (RGS) contribute significantly to the resilience of cities to natural disasters. In contrast, few studies have been conducted to assess the equity of RGS in relation to their planning layout. The presented research aims to quantitatively evaluate the equity of RGS within Chengdu’s Third Ring Road, and to propose corresponding optimization measures in conjunction with future green space planning. The rapid evacuation capacity of the RGS was evaluated by calculating the equity of the RGS in walking modes of 5, 10 and 15 min using an improved three-step floating catchment area method (3SFCA). Based on the results, RGS had an average equity in the study area. The total number of RGS within the Third Ring Road of Chengdu was insufficient, with an uneven spatial distribution and a structure to be optimized. The rapid evacuation capacity of RGS in 5 and 10 min needs to be further improved. The short-term resettlement capacity of RGS after 15 min was relatively good. Using Moran’s I index, the RGS equity and house price results were analyzed and no significant aggregation and polarization were observed. Following the evaluation, recommendations are made for optimizing and adding future RGS in accordance with Chengdu Green Space System Planning. The equity of RGS has been significantly improved after optimization, which can meet the needs of over 90% of residents for 15 min. This study provided feasible suggestions for the layout and structural optimization of the future RGS within the Third Ring Road of Chengdu, which aimed to create a RGS network with complex functions, to meet the multiple needs of citizens.
1. Introduction
1.1. Research Background
Urban green spaces serve a variety of functions, such as ecological restoration, recreation, and support [1]. Additionally, they contribute to the quality of life of residents, promote physical and psychological well-being, and reduce crime [2]. During a disaster, green spaces can also serve as safe and effective areas for evacuating and disaster prevention and mitigation [3]. In the built-up area, high-density places may suffer greater damage and losses when faced with urban disasters due to their high density [4]. Considering that China is an earthquake-prone developing country [5], disaster prevention planning and construction in central urban areas are key parts of the planning and construction process.
The equity of urban green spaces is a critical characterization of the allocation of public resources. Jennifer R Wolch proposed that urban green space equity is subordinate to environmental justice and social justice [6]. Viniece Jennings considered, in a broader sense, equity to refer to every individual’s right to adequate resources, services, and health [7]. A key component of equity in planning, according to John Rawls, was the distribution of specific interests of different groups in the process of resource allocation [8].
Refuge green space (RGS) is a special type of urban green space. RGS can provide space and temporary shelter for evacuation and relocation of residents, reducing the level of hazard to residents and also reducing secondary hazards after an earthquake [9]. To enhance the function of cities in terms of disaster prevention and mitigation, it is vital to conduct equitable research on the layout and optimization of RGS for high-density urban areas. This research aims to quantitatively evaluate the equity of RGS within Chengdu’s Third Ring Road, and to propose corresponding optimization measures in conjunction with future green space planning.
1.2. Literature Review
RGS includes various types of urban parks, public spaces, greenways, green belts, etc., which can provide places for evacuation and resettlement of residents in the event of a disaster [10,11,12]. Japan, as a country prone to earthquake disasters, has extensive experience of RGS construction. The Great Kanto Earthquake of the 1920s made people aware of the important role of RGS in safeguarding people’s lives. As part of the post-disaster reconstruction plan, the planning and construction of RGS were focused on [13]. The disaster prevention function of park construction was specified in the 1956 Urban Park Law of the Ministry of Construction of Japan. According to the 1973 Urban Green Space Preservation Law, urban parks were included in the disaster prevention system for urban green spaces [14]. By studying the protection of disaster occurrence, Japan has established disaster-proof living circles, planned evacuation sites in advance and formulated disaster prevention plans to minimize casualties and damage caused by disasters [15].
The United States began building a system of predominantly green parks after the Chicago fire in 1871. The high-density, contiguous urban areas were separated by parks to improve the city’s resistance to fire. The practice was pioneering in the application of park space to disaster prevention systems [16]. Since then, the United States has also established the National Response Framework (NRF) to provide guidelines for various disasters and emergencies [17]. The functions that parkland has to protect the environment, purify the air and prevent the spread of fire are seen as an important part of building disaster-proof spaces.
China’s research on RGS-related studies started relatively late. The early stage was for the reference and analysis of foreign experience [3,18,19]. Among them, Taiwan, due to its special geographical location where earthquake disasters are frequent, has conducted a great deal of research on disaster prevention systems, and formulated urban disaster prevention plans after the 921 earthquake, using green spaces as important evacuation areas [20]. Since 2000, most of the research on RGS has focused on spatial layout and optimization, using GIS technology to assist in quantitative analysis. For example, Liu Haiyan et al., analyzed the disaster prevention and refuge capacity of urban parks in Xi’an based on the population density [21]. Ye Mingwu et al., used a two-step floating catchment area method (2SFCA) to quantitatively study the accessibility status of parks for sheltering in the central city of Shanghai [22]. Population density indicators are usually used as an important element in the evaluation and planning of disaster preparedness and sheltered green spaces [23,24,25,26]. When a disaster occurs, elements such as the escape routes of residents, the evacuation capacity of the road network and the time costs to reach the RGS should be considered as important indicators for evaluating the service efficiency [27,28,29].
In general, research on the equity of urban RGS layout has gone through three stages of research: quantitative equity, spatial equity and social equity. In the current research, as the quantitative evaluation method of accessibility can identify the scarce areas of green space distribution, it is regarded as an effective way to measure the equity of green space distribution [30,31], reflecting the ease of reaching green space [32].
Accessibility is defined as the level of the opportunity for nodes in a transport network to interact with each other [33] and reflects how easy it is to reach a point [34]. Nowadays, accessibility evaluation methods are becoming increasingly sophisticated and widely used. In descending order of accuracy, the main methods are buffer zone analysis, network analysis, attractiveness index method, two-step floating catchment area method and so on [35,36]. The equity of RGS needs to consider the level of green space services under the influence of multiple factors such as green space supply and user demand [37]. Under the perspective of planning, accessibility can be considered as a quantitative basis for the study of RGS equity [38].
In the last few years, the two-step floating catchment area method (2SFCA) and its optimization methods have been widely used to evaluate the accessibility of urban green spaces. Compared to other methods, the two-step floating catchment area method is more accurate and takes into account both result elements and process elements [39]. A three-step floating catchment area method (3SFCA) was proposed by Wan et al., to address this problem by considering the competitive potential between facilities. This study adopted a further optimization of the 3SFCA.
1.3. Research Innovations
This study proposed the following innovations, drawing on previous research, which include the provision of a new methodology for the study of RGS systems as well as the optimization of calculation process.
A new RGS layout equity evaluation-optimization method was constructed through this research. In the evaluation part, relying on the modified 3SFCA, the layout of RGS was quantitatively analyzed from spatial equity. The evaluation method is highly applicable and easy to conduct cross-sectional comparison. In the optimization method section, additions were made using the maximum coverage model in combination with planning. The average area of different categories of RGS was used as an indicator of additions. This method provided a new path for future RGS planning and evaluation, which can judge the effectiveness of RGS planning and make appropriate adjustments based on the comparison.
This study integrated the disaster prevention function as well as the service function of RGS, and made quantitative calculations in conjunction with the 15-min living circle construction. By calculating the equity value of RGS under different time thresholds, the blind service areas were identified.
In the calculation process, the research method was further optimized. The selection effect and competition effect of the population on the facility points were simulated by introducing the competition function. Compared with the traditional model, this method focuses more on individuals and takes into account the heterogeneity of the actual needs of different residents. In terms of research granularity, the research object was shifted from neighborhood scale to residential points, eliminating the homogenization effect of raster data. The weights for different RGSs were added to further improve the accuracy of the research method.
2. Materials and Methods
2.1. Research Area
The research area is in Chengdu, China. In addition to being the capital of Sichuan Province, Chengdu is also a megacity. By the end of 2021, Chengdu had a resident population of 21.192 million, with an urbanization rate of 79.48% [40,41]. Located west of the Sichuan Basin, Chengdu’s terrain slopes from northwest to southeast [42].
The Third Ring Road of Chengdu, which is part of Chengdu’s city center, includes Jinniu District, Qingyang District, Wuhou District, Chengdu High-tech District, Jinjiang District, Longquanyi District and Chenghua District [43,44]. The total length of Chengdu’s Third Ring Road is approximately 51 km.
Chengdu is located in the middle of the North-South seismic zone, with the Longmenshan Fault Zone and Longquanshan Fault Zone passing through its territory, and is prone to moderate-to-strong earthquakes [45]. In Chengdu, there have been 20 earthquakes of magnitude 4 or higher, and eight earthquakes that have caused some damage and loss, including a 6.2 magnitude earthquake that occurred 50 km from downtown Chengdu on 24 February 1970 [46]. Besides earthquakes, other geological hazards such as landslides and mudslides have also posed a serious threat to the lives of citizens and resulted in huge economic losses for Chengdu [47].
Due to the fact that most of the areas within the Third Ring Road are urban built-up areas with comprehensive road networks and more advanced infrastructure, it was not feasible to select the area within the Fifth Ring Road or the entire Chengdu city for the study. Figure 1 shows the Ring Road of Chengdu. Since the population density and building density are relatively high within the Third Ring Road, the demand for RGS is also higher than in other areas. The areas outside of the Third Ring Road are more complex in terms of topographic changes, and many are still under development. To characterize Chengdu’s urban central area, this study evaluated the equity of RGS layout within the Third Ring Road of Chengdu.
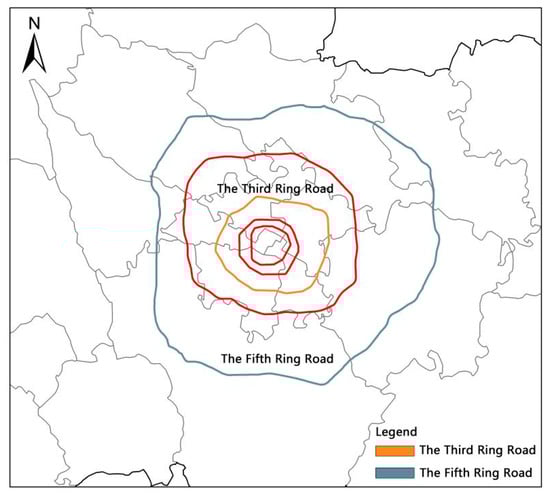
Figure 1.
Map of Chengdu Ring Road.
2.2. Data Processing
2.2.1. Refuge Green Space Data
As part of the Chengdu City Park Urban Green Space System Plan (2019–2035), it is intended that at the conclusion of the planning period (by the year 2035), a comprehensive green space system with clear evacuation channels, complete disaster prevention and avoidance facilities of all kinds and a reasonable layout will be established, in order to meet the disaster prevention and avoidance needs of over 90% of Chengdu City’s population by 2035 [48]. The overall capacity for disaster prevention and avoidance will be enhanced.
Refuge Green Spaces in Chengdu city formed a four-tiered green space system that includes “long term hazard avoidance green space-medium term hazard avoidance green space-short term hazard avoidance green space-emergency hazard avoidance green space” to create a disaster prevention and avoidance network consisting of disaster prevention park spaces, temporary sheltered green spaces and emergency sheltered green spaces [49].
Disaster prevention park spaces consist of urban green spaces with a size greater than 50,000 m2 and a service radius of no more than 5000 m. In general, disaster prevention park spaces include comprehensive parks, amusement parks, and large outdoor sports facilities. Temporary sheltered green spaces consist of green spaces with a size greater than 20,000 m2 and a service radius of no more than 1500 m, which usually include belt parks, riverfront green spaces, etc. An emergency sheltered green space is a green space that has a size of at least 1000 m2 and a radius of more than 500 m, such as a community park, a street green area, or a public square.
Each type of RGS serves a different purpose and performs a different function. In general, emergency sheltered green spaces are used for rapid evacuation following disasters, and can be reached within 5 min of a disaster occurring. As a short-term rescue site, the temporary sheltered green space can be reached within 10 min of a disaster. A large gathering place is provided by the disaster prevention park space. As well as providing residents with a place to live for a long period of time, it should also serve as a disaster prevention center [50].
These RGS will serve both as disaster-proof spaces in the event of a disaster and as a place of rest during normal times. In peacetime, they are part of the 15-min green living circle. The 15-min green living circle is an extension of the 15-min city concept [51]. The 15-min city concept was developed by Carlos Moreno and refers to a 15-min walk that meets the needs of at least 90% of the population in terms of food, shopping, entertainment, study, health care, and work [52]. The 15-min green circle indicates that most citizens will be able to reach their nearest urban park within 15 min. This study calculated and compared RGS equity at the aggregate level as well as by category using 5, 10 and 15 min equity value.
Based on data from the Chengdu Municipal Bureau of Planning and Natural Resources, the information of registered refuge green spaces (RGS) within the Third Ring Road of Chengdu can be obtained, shown in Figure 2.
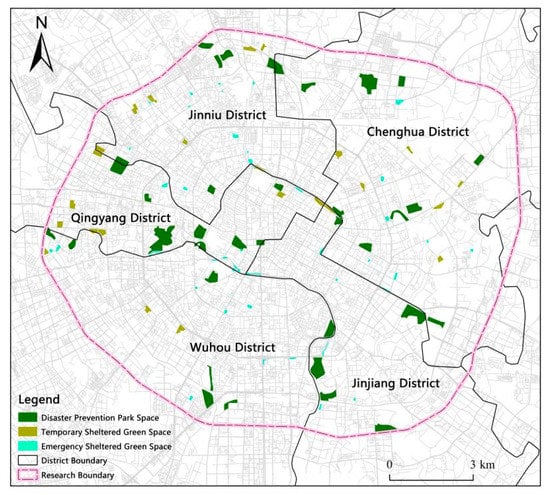
Figure 2.
Map of RGS in Research Area.
2.2.2. Population Data
Gaode Map’s Open Access API port provides access to residential areas within the Third Ring Road of Chengdu. In combination with data from the Seventh Population Census, the population can be calculated [53]. One residential unit’s population can be calculated using the following formula:
N is unit size (number of residents). D is the total amount of households. S is the average people number per household. M was taken as 2.49 in the Seventh Population Census of Chengdu [54]. Using residential neighbourhoods rather than blocks or streets allows for a higher level of detail [55]. The use of residential neighbourhoods reduces the homogenization effect resulting from Raster data, and allows the identification of incomes and house prices at different settlements. Figure 3 Shows the map of population and house price distribution.
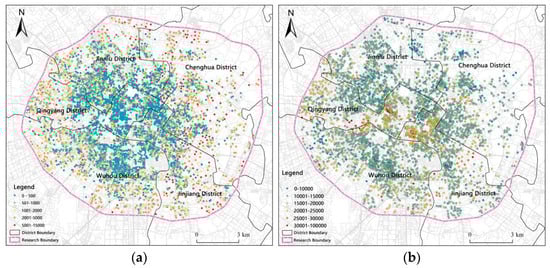
Figure 3.
(a) Population distribution map; (b) house price distribution map.
2.2.3. Road Network Data
The data for the road network was obtained from Open Street Map (OSM). Studies have shown that natural disasters, such as earthquakes, adversely affect the transportation systems of large cities [56]. The service capacity of RGS can therefore be measured less effectively with bicycles, cars, and trains [57,58]. As a result, walking is the focus of this study.
Walking time is more compatible with disaster prevention than spatial geometric distance. 5 min, 10 min, and 15 min of walking were used as distance measures in this study to represent the rapid evacuation and temporary resettlement capacity of the city after a disaster. Figure 4 shows the RGS coverage.
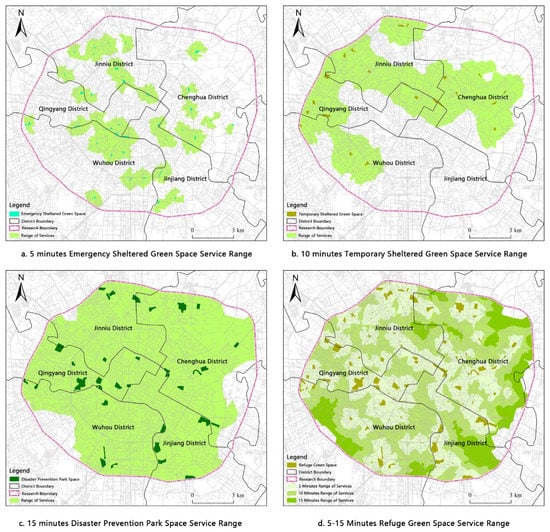
Figure 4.
Map of RGS coverage.
2.3. Calculation Process
In the first step, the ratio of supply to demand of RGS was calculated. As a starting point, the RGS was used to determine the distribution of residential areas at different distances from the center. The calculation method was shown in Formula (2).
In Formula (2), Rj represented the supply- demand ratio of RGS. j was the supply side, which was RGS. Residential areas were the demand side represented by i. Within the search radius, k represented the number of residential districts. RGS’s supply capacity was represented by Sj. Di was the size of the residential area. The distance between supply- demand was denoted by dij. In this study, walking commuting time (minutes) represented distance. d0 was the search radius.
In the calculation of Formula (2), Formula (3) was introduced to calculate the gravity-based attenuation G(dij), and Formula (4) to calculate the selection weight of the population for the facility W(dij) respectively.
G(dij) represented the gravity-based distance attenuation function, which was calculated as:
By introducing a gravity-based distance decay function, weights were assigned to simulate the exponential decrease of RGS attractiveness with distance decay in practice. Where β indicated the degree of decay. According to previous studies, β generally takes the value of 1 [59].
Then the selection weight function W(dij) was introduced to simulate the selection effect of people for different RGS when they escape.
W(dij) represented the selection and competition relationship between people for RGS, and its calculation formula was
Rj (m2/person) of RGS can be calculated by Formulas (2)–(4).
In the second step, the accessibility value of the residential area was calculated:
For this calculation, the distribution of RGS was searched and the functions were superimposed, starting with residential areas.
In Formula (5), m denoted the number of searched RGS. Rj denoted the ratio of supply-demand of RGS. Ai denoted the accessibility value.
Cj denoted the weights of different RGS and was calculated as:
Sij denoted the area of a certain type of RGS and Sp denoted the total area of RGS. This step introduced different RGS weights for types to facilitate the calculation of RGS separately. Based on the calculation of Formulas (5) and (6), the equity value enjoyed by the residential areas can be derived.
In the final step, the equity value of the RGS in the study area was calculated.
Each settlement point had an equity value called Ei. The RGS supply/demand ratio was represented by Rj. Each settlement point’s accessibility value was denoted by Ai.
3. Results
3.1. Overall Results for The Equity of RGS
The above calculation method can be used to determine the overall equity results of refuge green space in research area. First, the RGS in the study area were considered as a whole, and their equity values were calculated after weighting. The results were classified into Class I The Lowest Equity (Ei = 0), Class II Poor Equity (0 < Ei ≤ 0.25), Class III Relatively Poor Equity (0.25 < Ei ≤ 0.50), Class IV Moderate Equity (0.50 < Ei ≤ 0.75), Class V Relatively Good Equity (0.75 < Ei ≤ 1.00), Class Ⅵ Good Equity (Ei >1.00) [60,61,62,63]. The area classified as Class I is completely inaccessible within the specified time period, i.e., it is not covered by RGS and has the lowest supply capacity. Class VI refers to a situation where the RGS can be easily reached within the specified time, and the supply capacity is relatively good.
The results of the calculations were visualized in the GIS platform, which allowed for the evaluation of equity, as well as identification of areas where service was lacking.
Figure 5 demonstrates the overall 5-min equity results of RGS. There were 7129 residential areas in the research area. Among them, Class I accounted for 48.97%. It demonstrated that nearly half of the residential areas cannot reach the RGS within 5 min on foot. These areas were at the lowest equity level. The proportion of Class V and Class VI was 23.93%, indicating that less than a quarter of the residential areas were at a level of good equity, and it was easier to reach RGS within 5 min. The remaining 27.10% of the area was at an average level of equity. However, walking to the RGS within 5 min was still difficult for these areas.
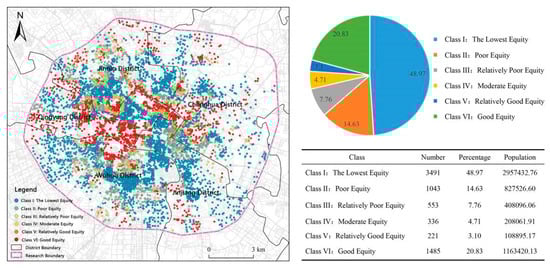
Figure 5.
RGS Overall 5 Minutes Equity.
Figure 6 illustrates the overall 10-min equity results of Refuge Green Space. Among them, Class I accounted for 4.45%. Only a very small number of residential areas cannot walk within 10 min to the RGS. Class V and Class VI made up 52.03%, indicating that more than half of the residential areas were at good equity level, and they were relatively easy to reach RGS within 10 min. The remaining 43.52% of the research area was at the average level of equity.
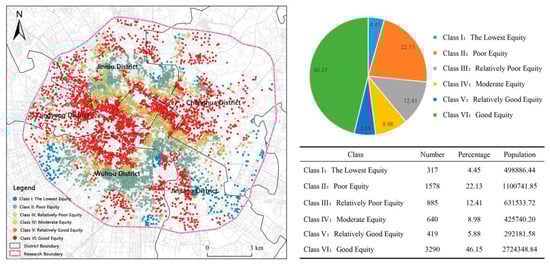
Figure 6.
RGS Overall 10 minutes equity.
Figure 7 shows the overall 15-min equity results of RGS in the study area. Among them, Class I accounted for 1.01%. Only a very small number of residential areas cannot walk to the RGS within 15 min, and these areas were at the lowest equity. Nearly 80% of the residential areas were at good equity level, and they were relatively easy to reach RGS within 15 min. The proportion of Class V and Class VI was 79.55%. The remaining 19.44% of the area was at an average level of equity.
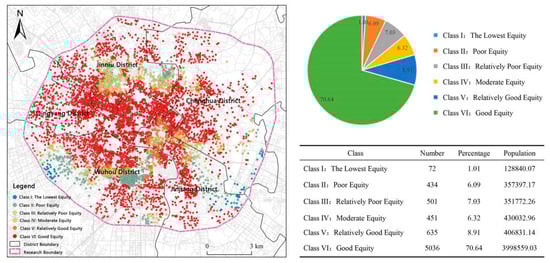
Figure 7.
RGS overall 15 Minutes equity.
Combining the results of the 5-min, 10-min, and 15-min equity calculations, it was evident that the RGS’s emergency evacuation capacity within Chengdu’s Third Ring Road was inadequate. Nearly half of the areas were completely inaccessible to the RGS based on the 5-min walk equity. While 95.55% of the 10-min areas had Ei values above 0. Roughly half of the areas were at the good equity level.
For the overall 15-min results, the degree of equity was relatively good. Nearly 80% of the area was at the good equity level, but about 20% of the area was still in the poor or relatively poor equity category. Graphs indicated that emergency shelters and temporary shelters need to be improved in terms of size and number. Thus, the three types of refuge green spaces must be calculated and discussed in detail.
3.2. Classification Results for the Equity of RGS
Sichuan Refuge Green Space Planning Guidelines [64] were used as a guidebook in this research to estimate the evacuation capacity of RGS. Using a 5-min emergency sheltered green space equity, a 10-min temporary sheltered green space equity, and a 15-min disaster prevention park space equity, The equity of the RGS layout can be evaluated quantitatively. The maximum walking time was 15 min [65], based on the concept of a 15-min city.
Figure 8 illustrates the 5-min equity results of emergency sheltered green space. Among them, Class I accounted for 71.72%. The report showed that nearly 70% of places cannot reach emergency sheltered green spaces within 5 min and these areas were at the lowest equity level. The proportion of Class V and Class VI was 5.24%. This indicated that only a very small number of residential areas were at the good equity level. They could easily reach an emergency sheltered green space within 5 min. The remaining 23.04% of regions were at the average level of equity.
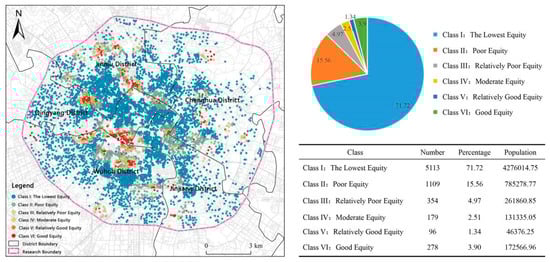
Figure 8.
5 minutes equity of emergency sheltered green space.
Figure 9 demonstrates the 10-min equity results of temporary sheltered green space. Among them, Class I accounted for 58.13%. Within 10 min, nearly 60% of the research area cannot reach temporary sheltered green space by walking. The proportion of Class V and Class VI was 12.03%, indicating that about 10% of the residential areas were at a level of good equity. Within 10 min, temporary sheltered green space can be accessed from these areas. Approximately 29.84% of regions were of average equity.
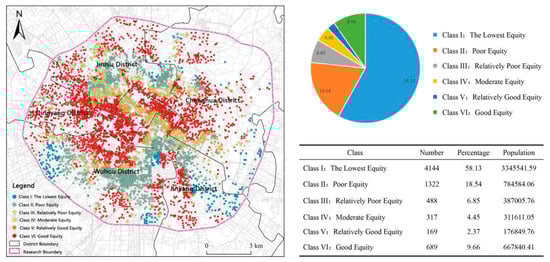
Figure 9.
10 minutes equity of temporary sheltered green space.
Figure 10 shows the 15-min equity results of disaster prevention park space in the study area. Among them, Class I accounted for 6.72%. According to the map, there were very few residential areas and it was impossible to walk to the disaster prevention park space within 15 min. The proportion of Class V and Class VI settlements was 5.66%, indicating that an insufficient number of settlements were at good equity levels. These areas were convenient to reach disaster prevention park space within 15 min. In addition, 87.62% of the regional equity was average. It was evident that there was a great potential for improvement.
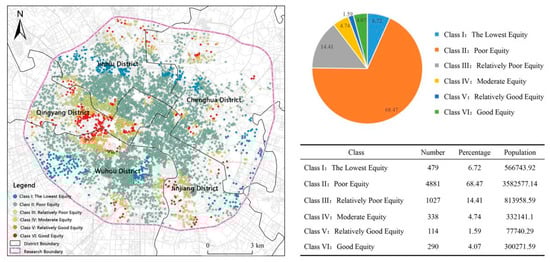
Figure 10.
15 minutes equity of disaster prevention park space.
Based on the combined results of the overall regional equity and the categorized RGS equity, it was found that the RGS within Chengdu’s Third Ring Road did not meet the disaster preparedness needs of most residents as it did not have sufficient rapid evacuation and resettlement capacity. The overall equity results indicated that the 5-min and 10-min RGS were of poor quality. Based on the calculation results, these two types of RGS were seriously lacking in number and scale. The disaster prevention park space can meet the needs of most residents for emergency and daily travel within 15 min. However, most of the areas were of average or low equity, and there was still much room for improvement.
4. Optimization
4.1. RGS Additions Based on Green Space System Plan
Based on the above results, quantitative optimization measures can be proposed [66]. According to Chengdu’s Green Transformation Development Plan, 100 brand-new key parks will be created by 2035 [67]. These key parks will become an instrumental part of the future disaster prevention and refuge green space network in Chengdu [68].
As a result, 100 parks were selected as the upper limit of the supplement indicator, fluctuating up and down by 5%. Using the GIS platform, a maximum coverage model was used to determine the location of parks that could be constructed. It is theoretically possible to address both the issues of continuous facility siting and continuous demand distribution using the maximum coverage model [69].
As shown in Figure 11, the first step was to construct a matrix of 5 min, 10 min, and 15 min. Initially, blind areas and additional locations of three types of RGS were identified.
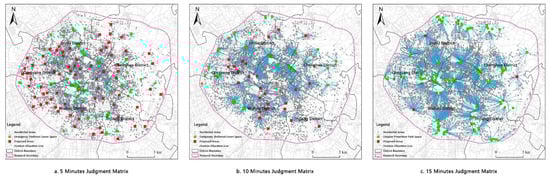
Figure 11.
RGS judgment matrix construction.
In order to add future components to the RGS, the points obtained from the matrix calculation were used as the center of mass. Also, the average size of each tape of RGS was calculated. The average size served as the basis for future additions, and the radius of each type of RGS was determined. In order to simulate the RGS surface for future additions, a circular area was created using the center of mass as the geometric center. To simulate an open boundary through which residents can access the RGS, the default circular boundary was left open around the area. The results are shown in Figure 12.
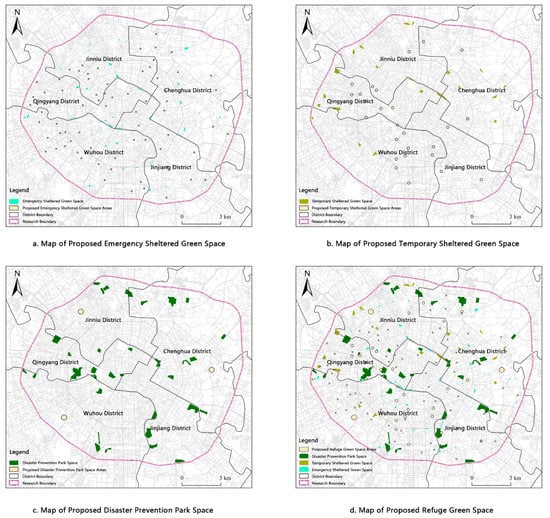
Figure 12.
Map of RGS additions locations.
In practice, most of the future additions to the RGS should be urban development land or urban green space [70]. In conjunction with the Chengdu city land use and planning map, high precision satellite maps were used to determine the locations of additional RGS. If the additional RGS were located on a built-up site, they would be relocated to the nearest area that should be urban development land. Through a GIS judgement matrix and manual identification, locations of the additional RGS were further optimized. All of the RGS additions were located within the existing or future urban development land, shown in Figure 13.
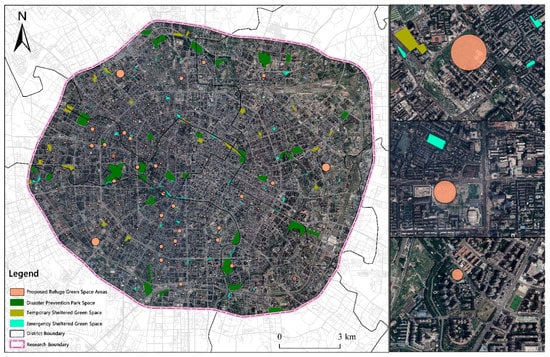
Figure 13.
Satellite Map of Future RGS Additions.
4.2. Equity Comparison before and after Optimization
In order to verify the improvement in equity after optimization, a comparison between the current RGS and the RGS after addition was conducted. RGS were compared in Table 1 by their number and area.

Table 1.
RGS Statistics Table.
Firstly, comparing the equity of the RGS within the Third Ring Road of Chengdu at a general level, Figure 14 can be obtained.
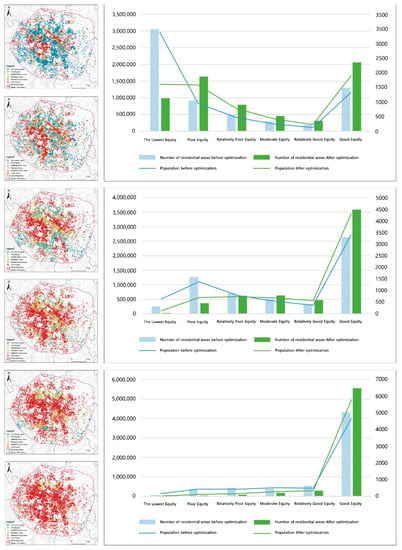
Figure 14.
Overall RGS equity statistics before and after the additions.
According to the statistical results, the equity of RGS has improved significantly following optimization in the study area. There will be a significant reduction in the number of settlements with the lowest equity rating in the overall 5-min equity. The 5-min coverage of the RGS has been significantly improved following the adoption of the optimized additions. In addition, the number of settlements with good equity has increased by approximately 1.5 times.
Using 10-min equity calculations, it appears that the number of plots with the lowest equity rating after optimization tends to be close to zero, suggesting that there is very little extreme inequality in the distribution of RGS after optimization. Additionally, the number of plots with a good equity rating will increase significantly after optimization, but there will still be some plots in the general class.
Based on 15-min equity calculation, there will be no extremely unfair plots after optimization, i.e., there is no lowest equity plot. Generally, all cells are able to reach the RGS within 15 min, but with varying degrees of difficulty. Following optimization, the number of plots with a good equity rating increased from 70.64% to 90.70%. The overall RGS after optimization can meet the needs of over 90% of the population. There will be a significant improvement in the equity of the plots.
Figure 15 illustrates the equity statistics of emergency shelter green space for 5 min, temporary shelter green space for 10 min, and disaster prevention park for 15 min. As can be seen from comparing before and after optimization, the majority of the neighborhoods have moved from lowest equity to average equity. Clearly, the coverage and capacity of 5-min emergency shelter space will be evidently improved. In most residential areas, the equity value obtained will be modest since only a special category of RGS is considered. Because of the high population density, emergency shelter space alone cannot meet residents’ needs for disaster preparedness.
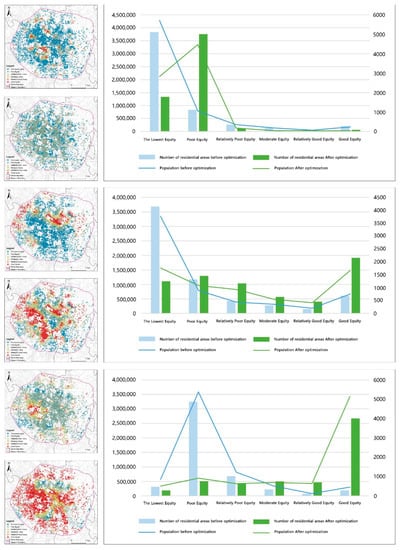
Figure 15.
RGS classification equity chart before and after additions.
The equity value of the 10-min temporary sheltered green space will also be greatly improved. The number of neighborhoods classified as lowest equitable will decrease by approximately one third, while the number of neighborhoods classified as good equitable will increase by approximately three times. As a result of the planned additions, the temporary sheltered green space will significantly improve its capacity for rapid evacuation and resettlement.
Based on the 15-min disaster prevention park space calculations, despite that only three disaster prevention parks will be added, equity values will be significantly improved while the service blind areas will be covered. Before optimization, most settlements were rated as relative equity, but most settlements will be rated as good equity after optimization. RGS equity calculations also show that the service capacity and coverage area of each type of RGS will be increased evidently. Within 15 min of walking, the optimized refuge green spaces within the Third Ring Road can meet the needs of more than 90% of the population.
5. Conclusions
For the results of RGS equity calculation, the following conclusions can be drawn. RGS had an average equity in the study area. The total number of RGS within the Third Ring Road of Chengdu was insufficient, with an uneven spatial distribution and a structure to be optimized. RGS was not skewed toward areas with high house prices or high-income levels within the Third Ring Road area of Chengdu.
The current situation of supply and demand between RGS and the community population in the research area is characterized by the insufficient total amount of RGS green space, spatial imbalance in distribution and a structure that needs to be improved.
5.1. RGS Equity Assessment
The 5-min RGS equity results illustrate a clear spatial clustering phenomenon as well as a polarization phenomenon. Most of the residential areas were in the state of no RGS coverage or no service (Ei = 0). The percentage of areas with relatively good equity or good equity was small and radially distributed, while the central and peripheral areas had poor or no RGS coverage.
In terms of the spatial distribution as well as the number of RGS, this calculation shows that the number of emergency sheltered green spaces was seriously insufficient. Under the 5-min threshold, only relying on the current RGS distribution is far from being able to meet the needs of residents. After the number of RGS was added according to the plan, although the service capacity of RGS had been significantly improved, there were still blind service areas. These blind service areas were mainly concentrated in the western part of Qingyang District, the eastern and western part of Wuhou District, the eastern part of Jinjiang District, the western part of Chenghua District and the western part of Jinniu District.
The polarization of the 10-min RGS equity results was not significant, and the overall equity had improved substantially compared to the 5-min threshold. The no-coverage area accounted for less than 5% of the study area. The regions with good equity and poor equity showed a staggered distribution. This result indicated that there were unreasonable distribution phenomena regarding the current RGS spatial density. In some areas, the distance between RGS was too far, which caused poor equity.
The regions with poor equity were concentrated in the middle and edge of Wuhou District, the north and west of Jinjiang District, and the middle of Jinniu District. After optimization, although the overall RGS equity had been improved significantly, the above regions were mostly in an average rank of equity. Therefore, further consideration needs to be given to other approaches, such as increasing the density of the road network and migrating the population.
The 15-min RGS equity results did not exhibit polarization. Only about 1% of the areas were located in the worst equity class, i.e., no service. These areas were located at the edge of the Third Ring Road. More than 80% of the residential areas were located in the good or relatively good equity level. After optimization, this value exceeded 90%. It indicated that the current RGS at the 15-min threshold was able to meet the needs of most residents.
On the whole, the total number of RGS within the Third Ring Road of Chengdu was insufficient, with an uneven spatial distribution and a structure to be optimized. The rapid evacuation capacity of RGS in 5 and 10 min needs to be further improved. The short-term resettlement capacity of RGS after 15 min was relatively good, but there was still great potential for improvement.
5.2. House Price-RGS Equity Clustering Situation
Based on the distribution of house prices within the study area and the results of the 5-min, 10-min and 15-min RGS equity calculations, the study area can be classified using the Moran’s I index. The Moran’s I index is often used to measure the degree of correlation between variables and the aggregation in space [71]. The results of Moran’s I index calculations are generally classified into five categories: H-H,H-L,L-H,L-L and no significant [72,73].
In this study, the Moran’s I index was used to measure the spatial accumulation of house prices and equity levels. The H-H category refers to areas with high house prices and high RGS equity. H-L category refers to areas with high house prices but low RGS equity. L-H category refers to areas with low house prices but high RGS equity. L-L category refers to areas with low house prices and low RGS equity. No significant refers to the region where the degree of aggregation of both is not significant. The results of the study were shown in Figure 16 and Figure 17.
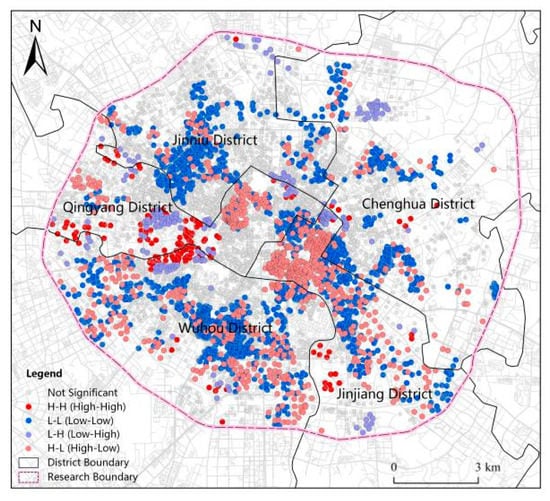
Figure 16.
Map of house price—5 min RGS equity.
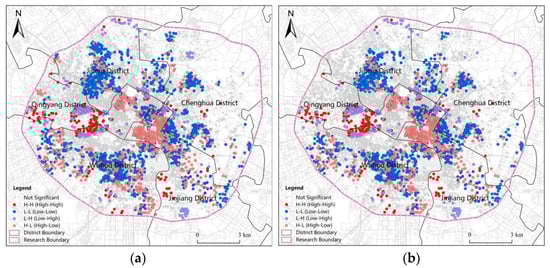
Figure 17.
(a) Map of house price—10 min RGS equity; (b) map of house price—15 min RGS equity.
Figure 16 shows the results of the distribution of house price-5 min RGS equity. It can be found that spatially, the cumulative relationship between house price and RGS equity within the study area was not significant. The no significant class accounted for nearly half of the study area. Three categories of regions, L-H, L-L and no significant category, occupied the majority of the studied regions. It shows that spatially, residential areas that enjoy high RGS equity were not evidently related to higher or lower house prices. Under the 5 min threshold, only the eastern part of Qingyang District and a few settlements were located in the H-H area, with both high house price and high RGS equity values. In general, the equity of RGS under the 5-min threshold was poor, which also contributed to its insignificant spatial accumulation.
Figure 17 shows the results of the distributions of house price-10 min RGS equity, and house price with 15 min RGS equity. Overall, the 5-min, 10-min and 15-min RGS equity distributions exhibited similar results with house prices. As the time threshold increased, the equity of RGS increased. The regions with high RGS equity were not skewed toward regions with high house prices. A considerable number of regions were located in L-H, H-L or no significant classes, indicating that the correlation between house prices and RGS equity and the spatial aggregation were not very close.
In research, house prices are often used to characterize the income of users [74,75]. Therefore, according to the calculation of Moran’s I index, it can be found that RGS, as a public resource, was not skewed toward areas with high house prices or high-income levels within the Third Ring Road area of Chengdu. Except for the eastern part of Qingyang District and some scattered settlements located in the H-H category, other regions exhibited no significant aggregation effect.
6. Improvement
To improve the equity of RGS in the study area, in addition to increasing the number and area of RGS, structural optimization and improving the quality of RGS play an equally important role. For regions with blind service areas or poor equity, increasing the number and area of RGS can play a relatively good role. For example, the western part of Wuhou District, the northwestern part of Qingyang District and the central part of Jinniu District. These areas have almost no RGS distribution at present. For the eastern part of Wuhou District and the western part of Chenghua District, the current RGS equity is relatively good. Therefore, the quality and service capacity of RGS need to be further improved on this basis.
From the perspective of long-term urban development, the relationship between the supply and demand of residents and RGS is in dynamic change, and the service capacity of RGS should be improved with the development of the city in an adaptive manner. At present, the area within the First Ring Road of Chengdu has a high population density and there is a serious lack of existing RGS. The current green space distribution is fragmented, poorly balanced and poorly connected. Therefore, in order to expand the scope of the RGS service area in this region and increase the effective evacuation green area per capita, a series of new street-side green areas can be considered to be built as emergency evacuation green areas in this region to strengthen the connectivity between green evacuation channels. In the vicinity of the Third Ring Road area with relatively low population density, more consideration needs to be given to the addition of long-term refuge green space. There is still a large area of land to be built near the existing Third Ring Road. Therefore, new RGS should be planned reasonably to ensure that the number of different types of RGS meet the basic needs of sustainable development.
At present, the distribution of RGS in the study area shows spatial heterogeneity, and the spacing between some RGS is too large, resulting in some areas without RGS coverage. The concentrated distribution of large RGS has caused polarization in some areas. Areas with good equity and areas with poor equity alternate, such as the western part of Jinjiang District and the eastern part of Jinniu District. To alleviate the polarization phenomenon, it is necessary to add small RGS near large RGS, such as emergency sheltered green space and temporary sheltered green space, to relieve the pressure of large RGS for disaster avoidance and create a composite system. For areas with high population density and difficulties in adding to them, such as urban centers, consideration can be given to combining public spaces such as squares and sports fields to strengthen their disaster avoidance function and relieve part of the population.
For the RGS already built, the transportation network system around the green area should be improved and additional entrances and exits should be provided. It is also important to give full play to the role of evacuation of areas such as school squares and parking lots, and integrate disaster prevention resources. Optimizing the facilities and the spatial layout inside the RGS will be critical. In the event of a disaster, even if the RGS as a whole has a high level of equity and accessibility, the lack of corresponding facilities can lead to chaos. The optimization of the internal space of the RGS involves many factors such as site environment, internal transportation system, and effective shelter space. Therefore, it is critical to build a safe external environment and a complete disaster relief support system, as well as to consider the planning layout of facilities and RGS.
7. Research Outlook
This study constructed a method to evaluate and optimize the equity of RGS layout by taking the Third Ring Road of Chengdu city as an example. However, there are still shortcomings in the study that could be improved further.
At the level of equity evaluation, the research object selected in this paper was RGS. In practice, public spaces such as playgrounds and squares also have the function of disaster prevention and risk avoidance. In future research, the research object can be further divided with the help of remote-sensing images and image segmentation technology for more accurate research.
The practice of using the full area of RGS as a calculation indicator in this study deserves further exploration. For different kinds of urban disasters, RGS will play different roles. For disasters such as earthquakes, the hard paved land in the RGS provides a staging area for users. For events such as urban fires and hazardous gas leaks, watersheds as well as woodlands in RGS will play an important deterrent role. The measurement approach currently used is more at the macro planning level to evaluate the overall RGS layout equity and identify blind service areas. A systematic RGS evaluation system by scientifically selecting evaluation indexes for different levels of urban disasters needs to be further constructed. This process requires the joint participation of urban management, urban planning, disaster management and other disciplines.
When considering the distance decay function, the value of β is set to 1 in this paper based on the previous research results. However, further research can be conducted regarding the difference in the values of β for mountainous cities as well as plain cities. In this study, when proposing quantitative optimization measures, the shape of the newly added RGS is round with open boundary by default. In practice, the shape of new green spaces, entrances and exits, and other elements can have an impact on the equity of RGS. Consequently, a more detailed study should be conducted by combining the shapes and layouts of different types of RGS. In adopting the measurement index, this study follows the walking speed assignment adopted by previous scholars. However, in practice, the escape speed and escape mode of different people, as well as the completeness of the transportation network system, can affect the equity calculation results.
In future research, a multidisciplinary intersection of equity calculation research can be carried out, while expanding the research dimension of equity in disaster prevention and avoidance green space.
Author Contributions
Conceptualization, Y.C. and Y.G.; methodology, Y.C. and Y.G.; software, Y.C., Y.G., Y.F. and X.H.; validation, Y.C., Y.G., Y.F. and X.H., formal analysis, Y.C.; investigation, Y.F.; resources, Y.G.; data curation, X.H.; writing—original draft preparation, Y.C. and Y.G.; writing—review and editing, Y.C. and Y.G.; visualization, Y.C., Y.G. and Y.F. All authors have read and agreed to the published version of the manuscript.
Funding
This research was funded by National Key Research and Development Plan, grant number 2022YFC3800203.
Data Availability Statement
The open access data were marked in the text with the source of acquisition. Additional data are available upon request from the authors.
Acknowledgments
We sincerely thank the five reviewers for their professional advice and patience.
Conflicts of Interest
The authors declare no conflict of interest.
References
- Kondo, M.C.; Fluehr, J.M.; McKeon, T.; Branas, C.C. Urban green space and its impact on human health. Int. J. Environ. Res. Public Health 2018, 3, 445. [Google Scholar] [CrossRef] [PubMed]
- Barbosa, O.; Tratalos, J.A.; Armsworth, P.R.; Davies, R.G.; Fuller, R.A.; Johnson, P.; Gaston, K.J. Who benefits from access to green space? A case study from Sheffield, UK. Landsc. Urban Plan. 2007, 2–3, 187–195. [Google Scholar] [CrossRef]
- Yun, L. Planning and construction of Japanese Urban Disaster Prevention Park after the Hanshin Light Road earthquake. Chin. Landsc. Archit. 2007, 7, 13–15. [Google Scholar]
- Torry, W.I. Urban earthquake hazard in developing countries: Squatter settlements and the outlook for Turkey. Urban Ecol. 1980, 4, 317–327. [Google Scholar] [CrossRef]
- Junfeng, H.; Baojun, Z.; Da, F.; Siquan, Y. Current situation and development ideas of standardization of comprehensive disaster prevention and reduction in China. J. Ecol. 2014, 33, 235–241. [Google Scholar]
- Wolch, J.R.; Byrne, J.; Newell, J.P. Urban green space, public health, and environmental justice: The challenge of making cities ‘just green enough’. Landsc. Urban Plan. 2014, 125, 234–244. [Google Scholar] [CrossRef]
- Jennings, V.; Baptiste, A.K.; Jelks, N.O.; Skeete, R. Urban green space and the pursuit of health equity in parts of the United States. Int. J. Environ. Res. Public Health 2017, 14, 1432. [Google Scholar] [CrossRef]
- Rawls, J. Justice as fairness: Political not metaphysical. In Equality and Liberty; Palgrave Macmillan: London, UK, 1991; pp. 145–173. [Google Scholar]
- Liu, W.; Xu, H.; Wu, J.; Hu, H. Measuring spatial accessibility to refuge green space after earthquakes: A case study of Nanjing, China. PLoS ONE 2022, 17, e0270035. [Google Scholar] [CrossRef]
- Yao, Y.; Zhang, Y.; Yao, T.; Wong, K.; Tsou, J.Y.; Zhang, Y. A GIS-based system for spatial-temporal availability evaluation of the open spaces used as emergency shelters: The case of Victoria, British Columbia, Canada. ISPRS Int. J. Geo-Inf. 2021, 10, 63. [Google Scholar] [CrossRef]
- Wei, Y.; Jin, L.; Xu, M.; Pan, S.; Xu, Y.; Zhang, Y. Instructions for planning emergency shelters and open spaces in China: Lessons from global experiences and expertise. Int. J. Disaster Risk Reduct. 2020, 51, 101813. [Google Scholar] [CrossRef]
- Lei, J. Research on China’s comprehensive disaster Reduction Legislation System. J. Natl. Acad. Gov. 2004, 6, 45–48. [Google Scholar]
- Peng, R.; Liu, Y. Japanese refuge planning and its implications. New Archit. 2009, 123, 102–106. [Google Scholar]
- Construction Bo. Disaster Prevention System Construction. Available online: https://www.kensetsu.metro.tokyo.lg.jp/jigyo/park/kouen0020.html (accessed on 20 April 2023).
- Fei, W.; Gao, X. A Comparative Study on the Disaster Prevention and Risk Avoidance Capability of Urban Dotted-like Green Open Spaces in China and Japan. AIJ J. Technol. Des. 2023, 29, 388–393. [Google Scholar] [CrossRef]
- Wang, Q. Study on Disaster Prevention Planning in Urban Center Area Under High-Density Environment; Tianjin University: Tianjin, China, 2013. [Google Scholar]
- Administration USGS. The National Response Framework. Available online: https://www.gsa.gov/governmentwide-initiatives/emergency-response/the-national-response-framework (accessed on 22 April 2023).
- Zhang, J. Technology trend of disaster prevention and mitigation in Japanese urban parks. Chin. Landsc. Archit. 2008, 9, 19–21. [Google Scholar]
- Neng, L.; Yan, P. Disaster Prevention Education in Shizuoka Prefecture Japan—Countermeasures to earthquake-tsunami continuous composite disaster. Int. Earthq. Dyn. 2012, 11, 34–35+38. [Google Scholar]
- Gong, S.L. Earthquake Disasters and Their Environmental Geological Problems in Taiwan. J. Catastrophol. 2002, 17, 76–81. [Google Scholar]
- Liu, H.; Wu, Z. Research on urban disaster prevention park planning based on GIS—Take Xi’an city as an example. Planners 2006, 22, 55–58. [Google Scholar]
- Ye, M.; Wang, J.; Liu, Y.; Xu, S. Study on refuge accessibility in downtown Shanghai park based on GIS. Geogr. Geo-Inf. Sci. 2008, 24, 96–98. [Google Scholar]
- Fu, S.; Liang, C. Research on the Spatial layout of urban disaster prevention Park based on the service area—Take Quanzhou urban area as an example. City Disaster Reduct. 2011, 56–59. [Google Scholar]
- Li, X.; Xiu, C.; Wei, Y.; He, H.S. Evaluating methodology for the service extent of refugee parks in Changchun, China. Sustainability 2020, 12, 5715. [Google Scholar]
- Li, X.; Xiu, C.; Cheng, L.; Wang, N. The application of—Neighborhood method in Changchun city. Chin. J. Appl. Ecol. 2016, 27, 3641–3648. [Google Scholar]
- Ye, M.Y.; Wang, J.; Liu, Y.; Xu, S. Study on refuge accessibility of park in inner: City of Shanghai based on GIS technique. Geogr. Geo-Inf. Sci. 2008, 2, 96–98. [Google Scholar]
- Wolshon, B.; Marchive, E. Emergency Planning in the Urban-Wildland Interface: Subdivision-Level Analysis of Wildfire Evacuations. J. Urban Plan. Dev. 2007, 133, 73–81. [Google Scholar] [CrossRef]
- Anhorn, J.; Khazai, B. Open space suitability analysis for emergency shelter after an earthquake. Nat. Hazards Earth Syst. Sci. 2015, 2, 4263–4297. [Google Scholar] [CrossRef]
- Zhu, X.; Tong, Z.; Liu, X.; Li, X.; Lin, P.; Wang, T. An improved two-step floating catchment area method for evaluating spatial accessibility to urban emergency shelters. Sustainability 2018, 10, 2180. [Google Scholar] [CrossRef]
- Ekkel, E.D.; de Vries, S. Nearby green space and human health: Evaluating accessibility metrics. Landsc. Urban Plan. 2017, 157, 214–220. [Google Scholar] [CrossRef]
- Cetin, M. Using GIS analysis to assess urban green space in terms of accessibility: Case study in Kutahya. Int. J. Sustain. Dev. World Ecol. 2015, 22, 420–424. [Google Scholar] [CrossRef]
- Jennings, V.; Johnson Gaither, C.; Gragg, R.S. Promoting environmental justice through urban green space access: A synopsis. Environ. Justice 2012, 5, 1–7. [Google Scholar] [CrossRef]
- Hansen, W.G. How accessibility shapes land use. J. Am. Inst. Plan. 1959, 25, 73–76. [Google Scholar] [CrossRef]
- Tao, Z.; Cheng, Y.; Zheng, Q.; Li, G. Measuring spatial accessibility to healthcare services with constraint of administrative boundary: A case study of Yanqing District, Beijing, China. Int. J. Equity Health 2018, 17, 7. [Google Scholar] [CrossRef]
- Yin, H.; Kong, F.; Zong, Y. Evaluation of the accessibility and fairness of urban green space. Acta Ecol. Sin. 2008, 7, 3375–3383. [Google Scholar]
- Kiran, K.; Corcoran, J.; Chhetri, P. Measuring the spatial accessibility to fire stations using enhanced floating catchment method. Socio-Econ. Plan. Sci. 2020, 69, 100673. [Google Scholar]
- Zhou, X.; Rana, M.P. Social benefits of urban green space: A conceptual framework of valuation and accessibility measurements. Manag. Environ. Qual. Int. J. 2012, 23, 173–189. [Google Scholar] [CrossRef]
- Hu, S.; Song, W.; Li, C.; Lu, J. A multi-mode Gaussian-based two-step floating catchment area method for measuring accessibility of urban parks. Cities 2020, 105, 102815. [Google Scholar] [CrossRef]
- Delamater, P.L. Spatial accessibility in suboptimally configured health care systems: A modified two-step floating catchment area (M2SFCA) metric. Health Place 2013, 24, 30–43. [Google Scholar] [CrossRef]
- Nesbitt, L.; Meitner, M.J.; Girling, C.; Sheppard, S.R. Urban green equity on the ground: Practice-based models of urban green equity in three multicultural cities. Urban For. Urban Green. 2019, 44, 126433. [Google Scholar] [CrossRef]
- Li, H.; Duan, J.; Wu, Y.; Gao, S.; Li, T. The spatial patterns of service facilities based on Internet big data: A case study on Chengdu. Math. Probl. Eng. 2021, 2021, 9283185. [Google Scholar] [CrossRef]
- Chengdu Bureau of Statistics. Available online: http://cdstats.chengdu.gov.cn/tjgzxxw/xhtml/tjxx_content.html?id=418032&channel= (accessed on 15 October 2022).
- Yu, B.; Wang, Z.; Mu, H.; Sun, L.; Hu, F. Identification of urban functional regions based on floating car track data and POI data. Sustainability 2019, 11, 6541. [Google Scholar] [CrossRef]
- Dai, W.; Yuan, S.; Liu, Y.; Peng, D.; Niu, S. Measuring equality in access to urban parks: A big data analysis from Chengdu. Front. Public Health 2022, 10, 1022666. [Google Scholar] [CrossRef]
- Tian, Y.; Sun, L.; Li, B.; Luo, Y. Discussion on planning and design of green space of Disaster prevention Park in Chengdu. Sichuan Build. Sci. 2010, 6, 232–235. [Google Scholar]
- Chengdu Municipal People’s Government. Available online: http://gk.chengdu.gov.cn/govInfo/detail.action?id=138170&tn=6 (accessed on 21 October 2022).
- Zhou, X. Study on disaster prevention system in key areas of urban forest park with multi-factor coupling--Chengdu Longquan Mountain as an example. Conf. Ser. Earth Environ. Sci. 2022, 983, 012074. [Google Scholar] [CrossRef]
- Tang, L.; Qi, G.; Zhang, L. A study on the quality of observation data of the Rapid seismic intensity Reporting Network—A case study of Chengdu Earthquake intensity Reporting Network. J. Disaster Prev. Reduct. 2020, 2, 23–32. [Google Scholar]
- Chengdu Green Space System. Available online: http://cdbpw.chengdu.gov.cn/cdslyj/c110447/2020-05/19/746b93c82f7b4fa39918bf9ad50d3e52/files/f6ecc4de27904dd1993ef9f22e2ca07d.pdf (accessed on 25 April 2023).
- Tang, S.; Wang, J.; Xu, Y.; Chen, S.; Zhang, J.; Zhao, W.; Wang, G. Evaluation of Emergency Shelter Service Functions and Optimisation Suggestions—Case Study in the Songyuan City Central Area. Sustainability 2023, 15, 7283. [Google Scholar] [CrossRef]
- Hong, B.; Li, S.; Hu, L. Investigation on disaster prevention and avoidance function of garden green space in Chengdu after Wenchuan Earthquake. Saf. Environ. Eng. 2009, 5, 8–12. [Google Scholar]
- Moreno, C.; Allam, Z.; Chabaud, D.; Gall, C.; Pratlong, F. Introducing the “15-Minute City”: Sustainability, resilience and place identity in future post-pandemic cities. Smart Cities 2021, 1, 93–111. [Google Scholar] [CrossRef]
- Liu, B.; Tian, Y.; Guo, M.; Tran, D.; Alwah, A.A.Q.; Xu, D. Evaluating the disparity between supply and demand of park green space using a multi-dimensional spatial equity evaluation framework. Cities 2022, 121, 103484. [Google Scholar] [CrossRef]
- Chengdu Report. Available online: https://www.cdgongzuo.com/article/50702.html (accessed on 21 October 2022).
- Li, M.; Yang, L.; Wei, Y. Improved Gaussian based 2-step floating catchment area method: A case study of green space accessibility in Shanghai. Prog. Geogr. 2016, 8, 990–996. [Google Scholar]
- Wang, Q.; Taylor, J.E. Patterns and limitations of urban human mobility resilience under the influence of multiple types of natural disaster. PLoS ONE 2016, 1, e0147299. [Google Scholar] [CrossRef]
- Zhang, Z.; Hu, Y.; Lu, W.; Cao, W.; Gao, X. Spatial accessibility analysis and location optimization of emergency shelters in Deyang. Geomat. Nat. Hazards Risk 2023, 14, 2213809. [Google Scholar] [CrossRef]
- Yazici, M.A.; Ozbay, K. Impact of probabilistic road capacity constraints on the spatial distribution of hurricane evacuation shelter capacities. Transp. Res. Rec. 2007, 1, 55–62. [Google Scholar] [CrossRef]
- Braubach, M.; Egorov, A.; Mudu, P.; Wolf, T.; Ward Thompson, C.; Martuzzi, M. Effects of urban green space on environmental health, equity and resilience. In Nature-Based Solutions to Climate Change Adaptation in Urban Areas: Linkages between Science, Policy and Practice; Springer: Berlin/Heidelberg, Germany, 2017; pp. 187–205. [Google Scholar]
- Xu, C.; Haase, D.; Pribadi, D.O.; Pauleit, S. Spatial variation of green space equity and its relation with urban dynamics: A case study in the region of Munich. Ecol. Indic. 2018, 93, 512–523. [Google Scholar] [CrossRef]
- Masuda, N. Disaster refuge and relief urban park system in Japan. Landsc. Archit. Front. 2014, 4, 52–61. [Google Scholar]
- Guan, J.; Wang, R.; Van Berkel, D.; Liang, Z. How spatial patterns affect urban green space equity at different equity levels: A bayesian quantile regression approach. Landsc. Urban Plan. 2023, 233, 104709. [Google Scholar] [CrossRef]
- Zheng, Z.; Shen, W.; Li, Y.; Qin, Y.; Wang, L. Spatial equity of park green space using KD2SFCA and web map API: A case study of zhengzhou, China. Appl. Geogr. 2020, 123, 102310. [Google Scholar] [CrossRef]
- Zhang, S.; Zhen, F.; Kong, Y.; Lobsang, T.; Zou, S. Towards a 15-minute city: A network-based evaluation framework. Environ. Plan. B Urban Anal. City Sci. 2022, 50, 500–514. [Google Scholar] [CrossRef]
- Threlfall, C.G.; Kendal, D. The distinct ecological and social roles that wild spaces play in urban ecosystems. Urban For. Urban Green. 2018, 29, 348–356. [Google Scholar] [CrossRef]
- Chengdu Government Report. Available online: http://gk.chengdu.gov.cn/govInfoPub/detail.action?id=3370298&tn=2 (accessed on 20 April 2023).
- Chengdu Green Space Report. Available online: http://mpnr.chengdu.gov.cn/ (accessed on 20 April 2023).
- Zhang, T.; Wang, B.; Ge, Y.; Li, C. Research on Green Space Service Space Based on Crowd Aggregation and Activity Characteristics under Big Data—Take Tacheng City as an Example. Int. J. Environ. Res. Public Health 2022, 19, 15122. [Google Scholar] [CrossRef]
- Karasakal, O.; Karasakal, E.K. A maximal covering location model in the presence of partial coverage. Comput. Oper. Res. 2004, 9, 1515–1526. [Google Scholar] [CrossRef]
- Zhu, J. From land use right to land development right: Institutional change in China’s urban development. Urban Stud. 2004, 7, 1249–1267. [Google Scholar] [CrossRef]
- Tiefelsdorf, M.; Boots, B. The exact distribution of Moran’s I. Environ. Plan. A 1995, 27, 985–999. [Google Scholar] [CrossRef]
- Li, H.; Calder, C.A.; Cressie, N. Beyond Moran’s I: Testing for spatial dependence based on the spatial autoregressive model. Geogr. Anal. 2007, 39, 357–375. [Google Scholar] [CrossRef]
- Assuncao, R.M.; Reis, E.A. A new proposal to adjust Moran’s I for population density. Stat. Med. 1999, 18, 2147–2162. [Google Scholar] [CrossRef]
- Kanuganti, S.; Sarkar, A.K.; Singh, A.P. Quantifying accessibility to health care using Two-step Floating Catchment Area Method (2SFCA): A case study in Rajasthan. Transp. Res. Procedia 2016, 17, 391–399. [Google Scholar] [CrossRef]
- Xing, L.; Liu, Y.; Wang, B.; Wang, Y.; Liu, H. An environmental justice study on spatial access to parks for youth by using an improved 2SFCA method in Wuhan, China. Cities 2020, 96, 102405. [Google Scholar] [CrossRef]
Disclaimer/Publisher’s Note: The statements, opinions and data contained in all publications are solely those of the individual author(s) and contributor(s) and not of MDPI and/or the editor(s). MDPI and/or the editor(s) disclaim responsibility for any injury to people or property resulting from any ideas, methods, instructions or products referred to in the content. |
© 2023 by the authors. Licensee MDPI, Basel, Switzerland. This article is an open access article distributed under the terms and conditions of the Creative Commons Attribution (CC BY) license (https://creativecommons.org/licenses/by/4.0/).