
Provincial-Scale Research on the Eco-Security Structure in the Form of an Ecological Network of the Upper Yellow River: A Case Study of the Ningxia Hui Autonomous Region


Abstract
:1. Introduction
2. Methods and Data
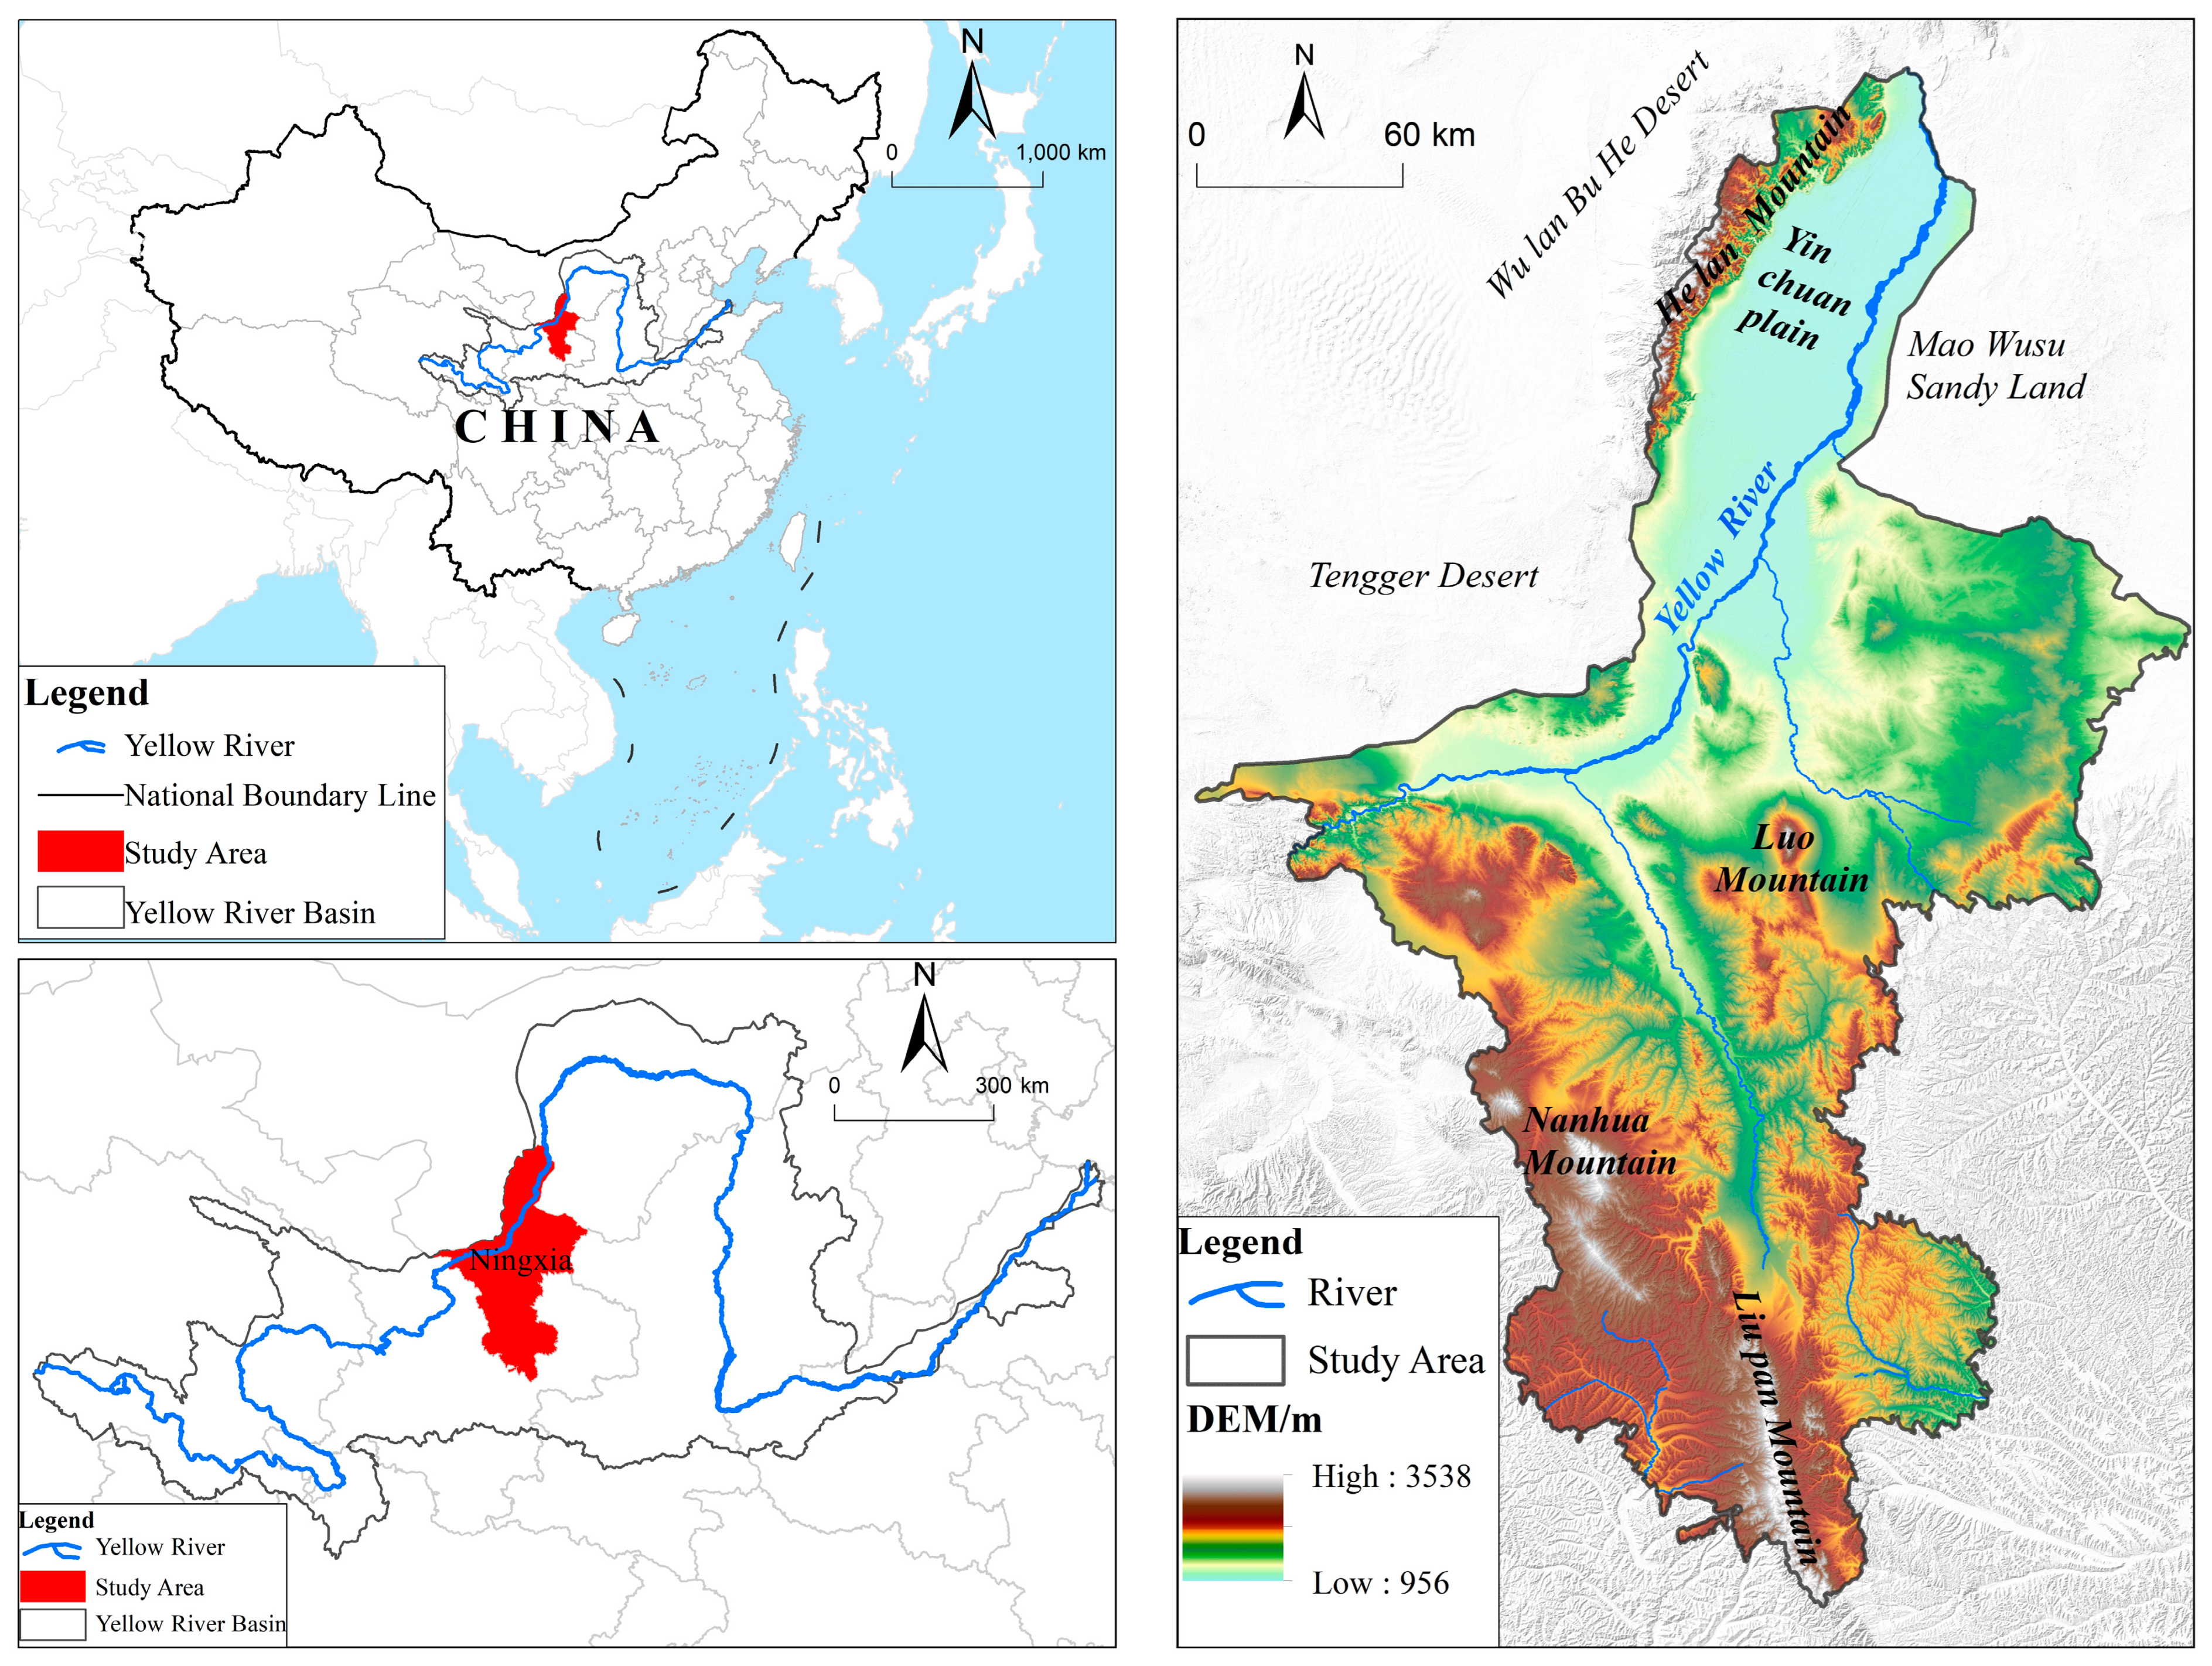
2.1. Study Area
2.2. Data Source and Processing
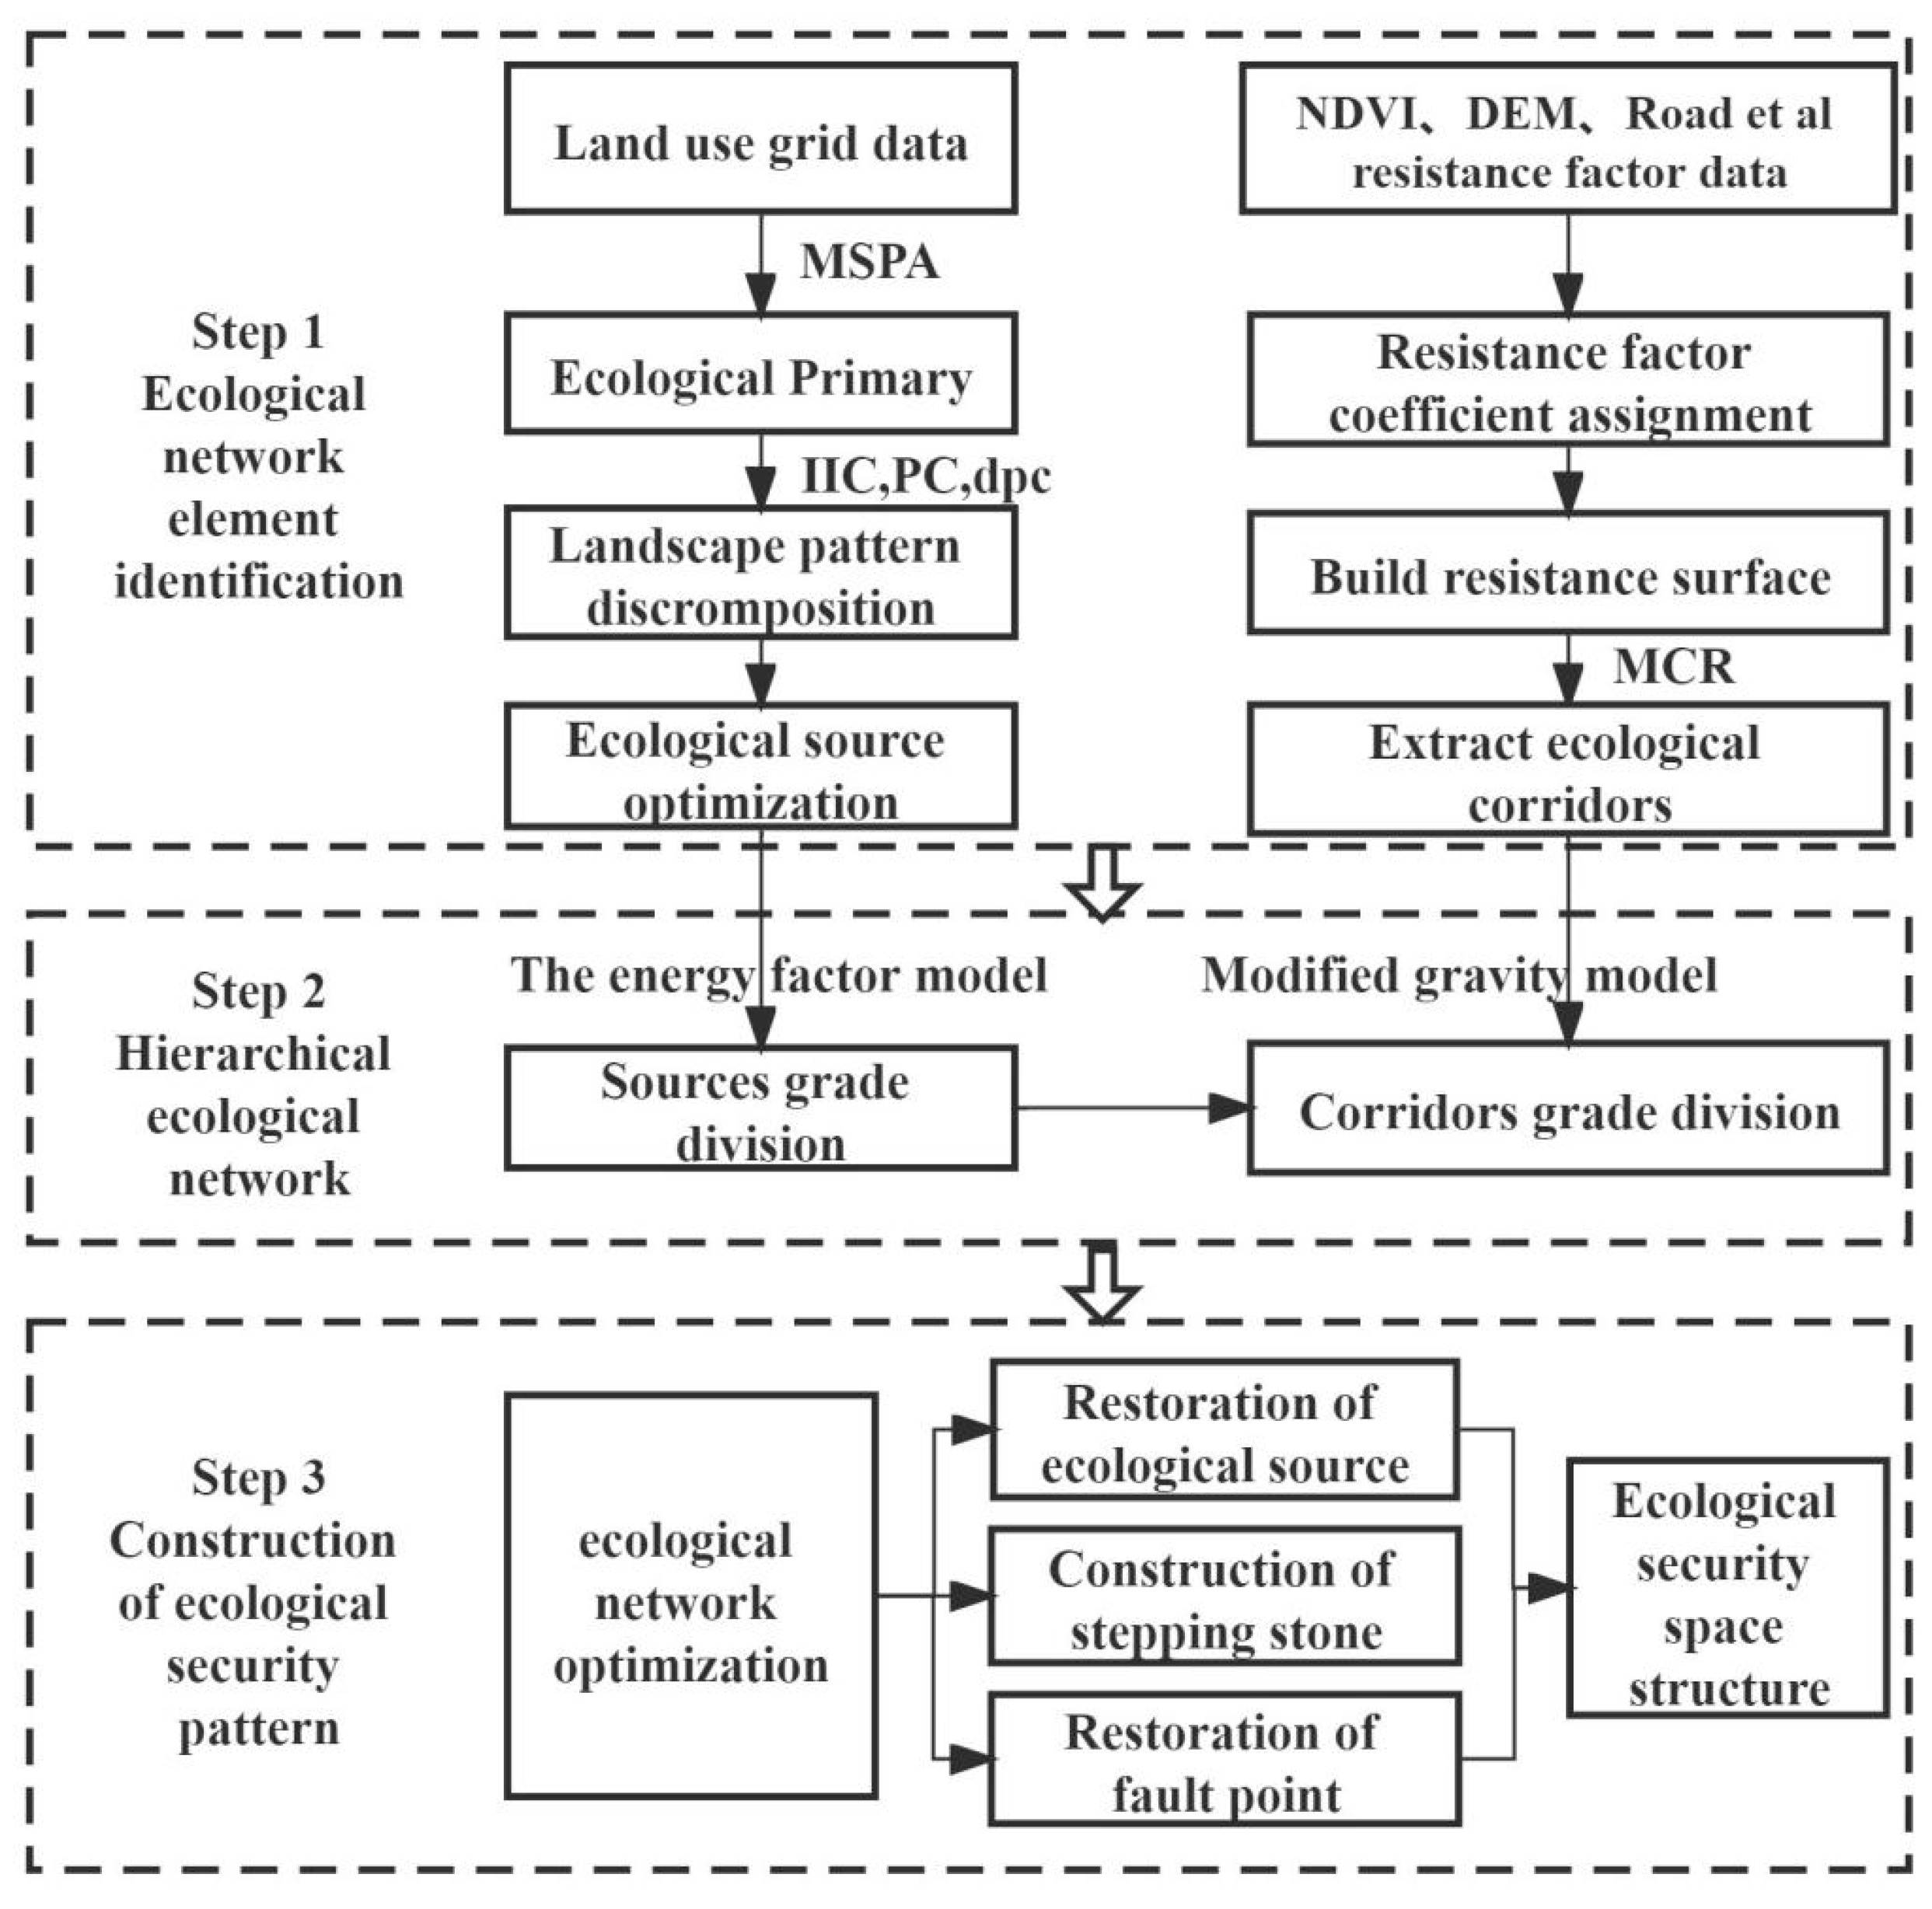
2.3. The MSPA–MCR Construction Method
2.3.1. Optimization of Ecological Source Identification and Classification Method
2.3.2. Improvement of the Method of Extracting Potential Ecological Corridors
2.3.3. Evaluation of Ecological Network Connectivity
3. Results and Analysis
3.1. Identification Results and Distribution Characteristics of Ecological Source Areas
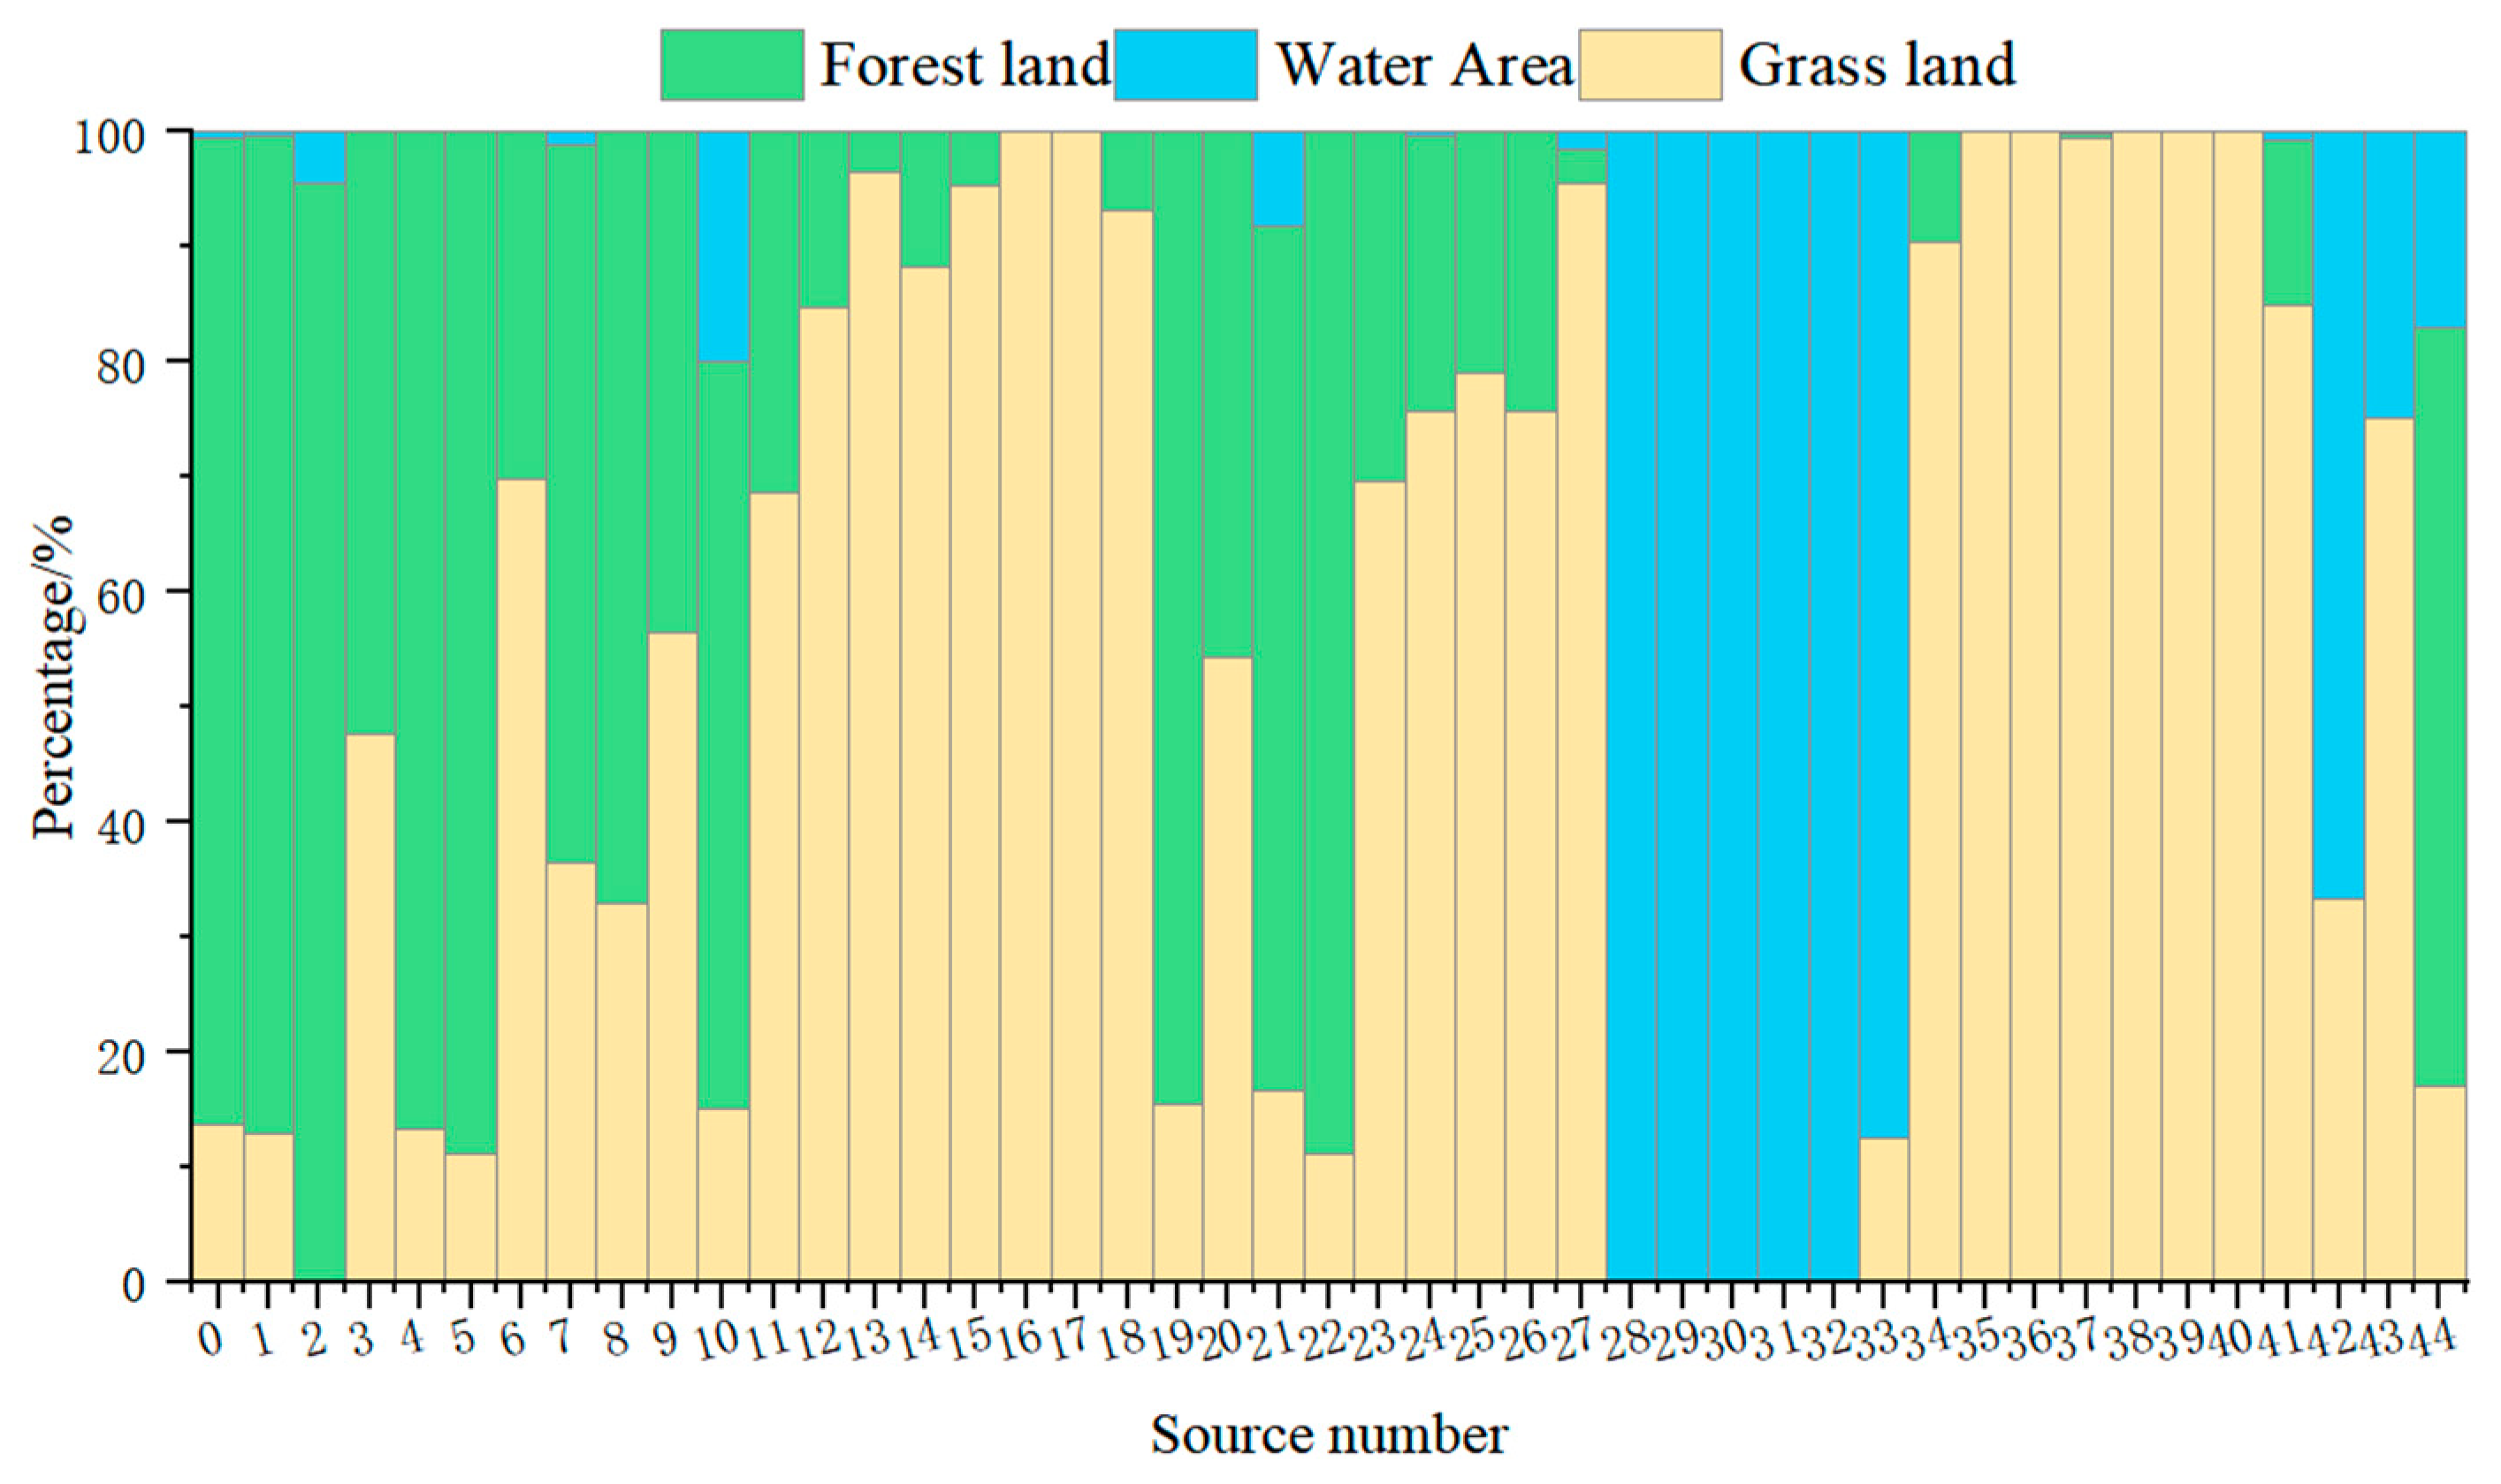
3.1.1. Landscape Pattern Characteristics and Structural Proportions
3.1.2. Spatial Pattern Characteristics of Ecological Source Areas
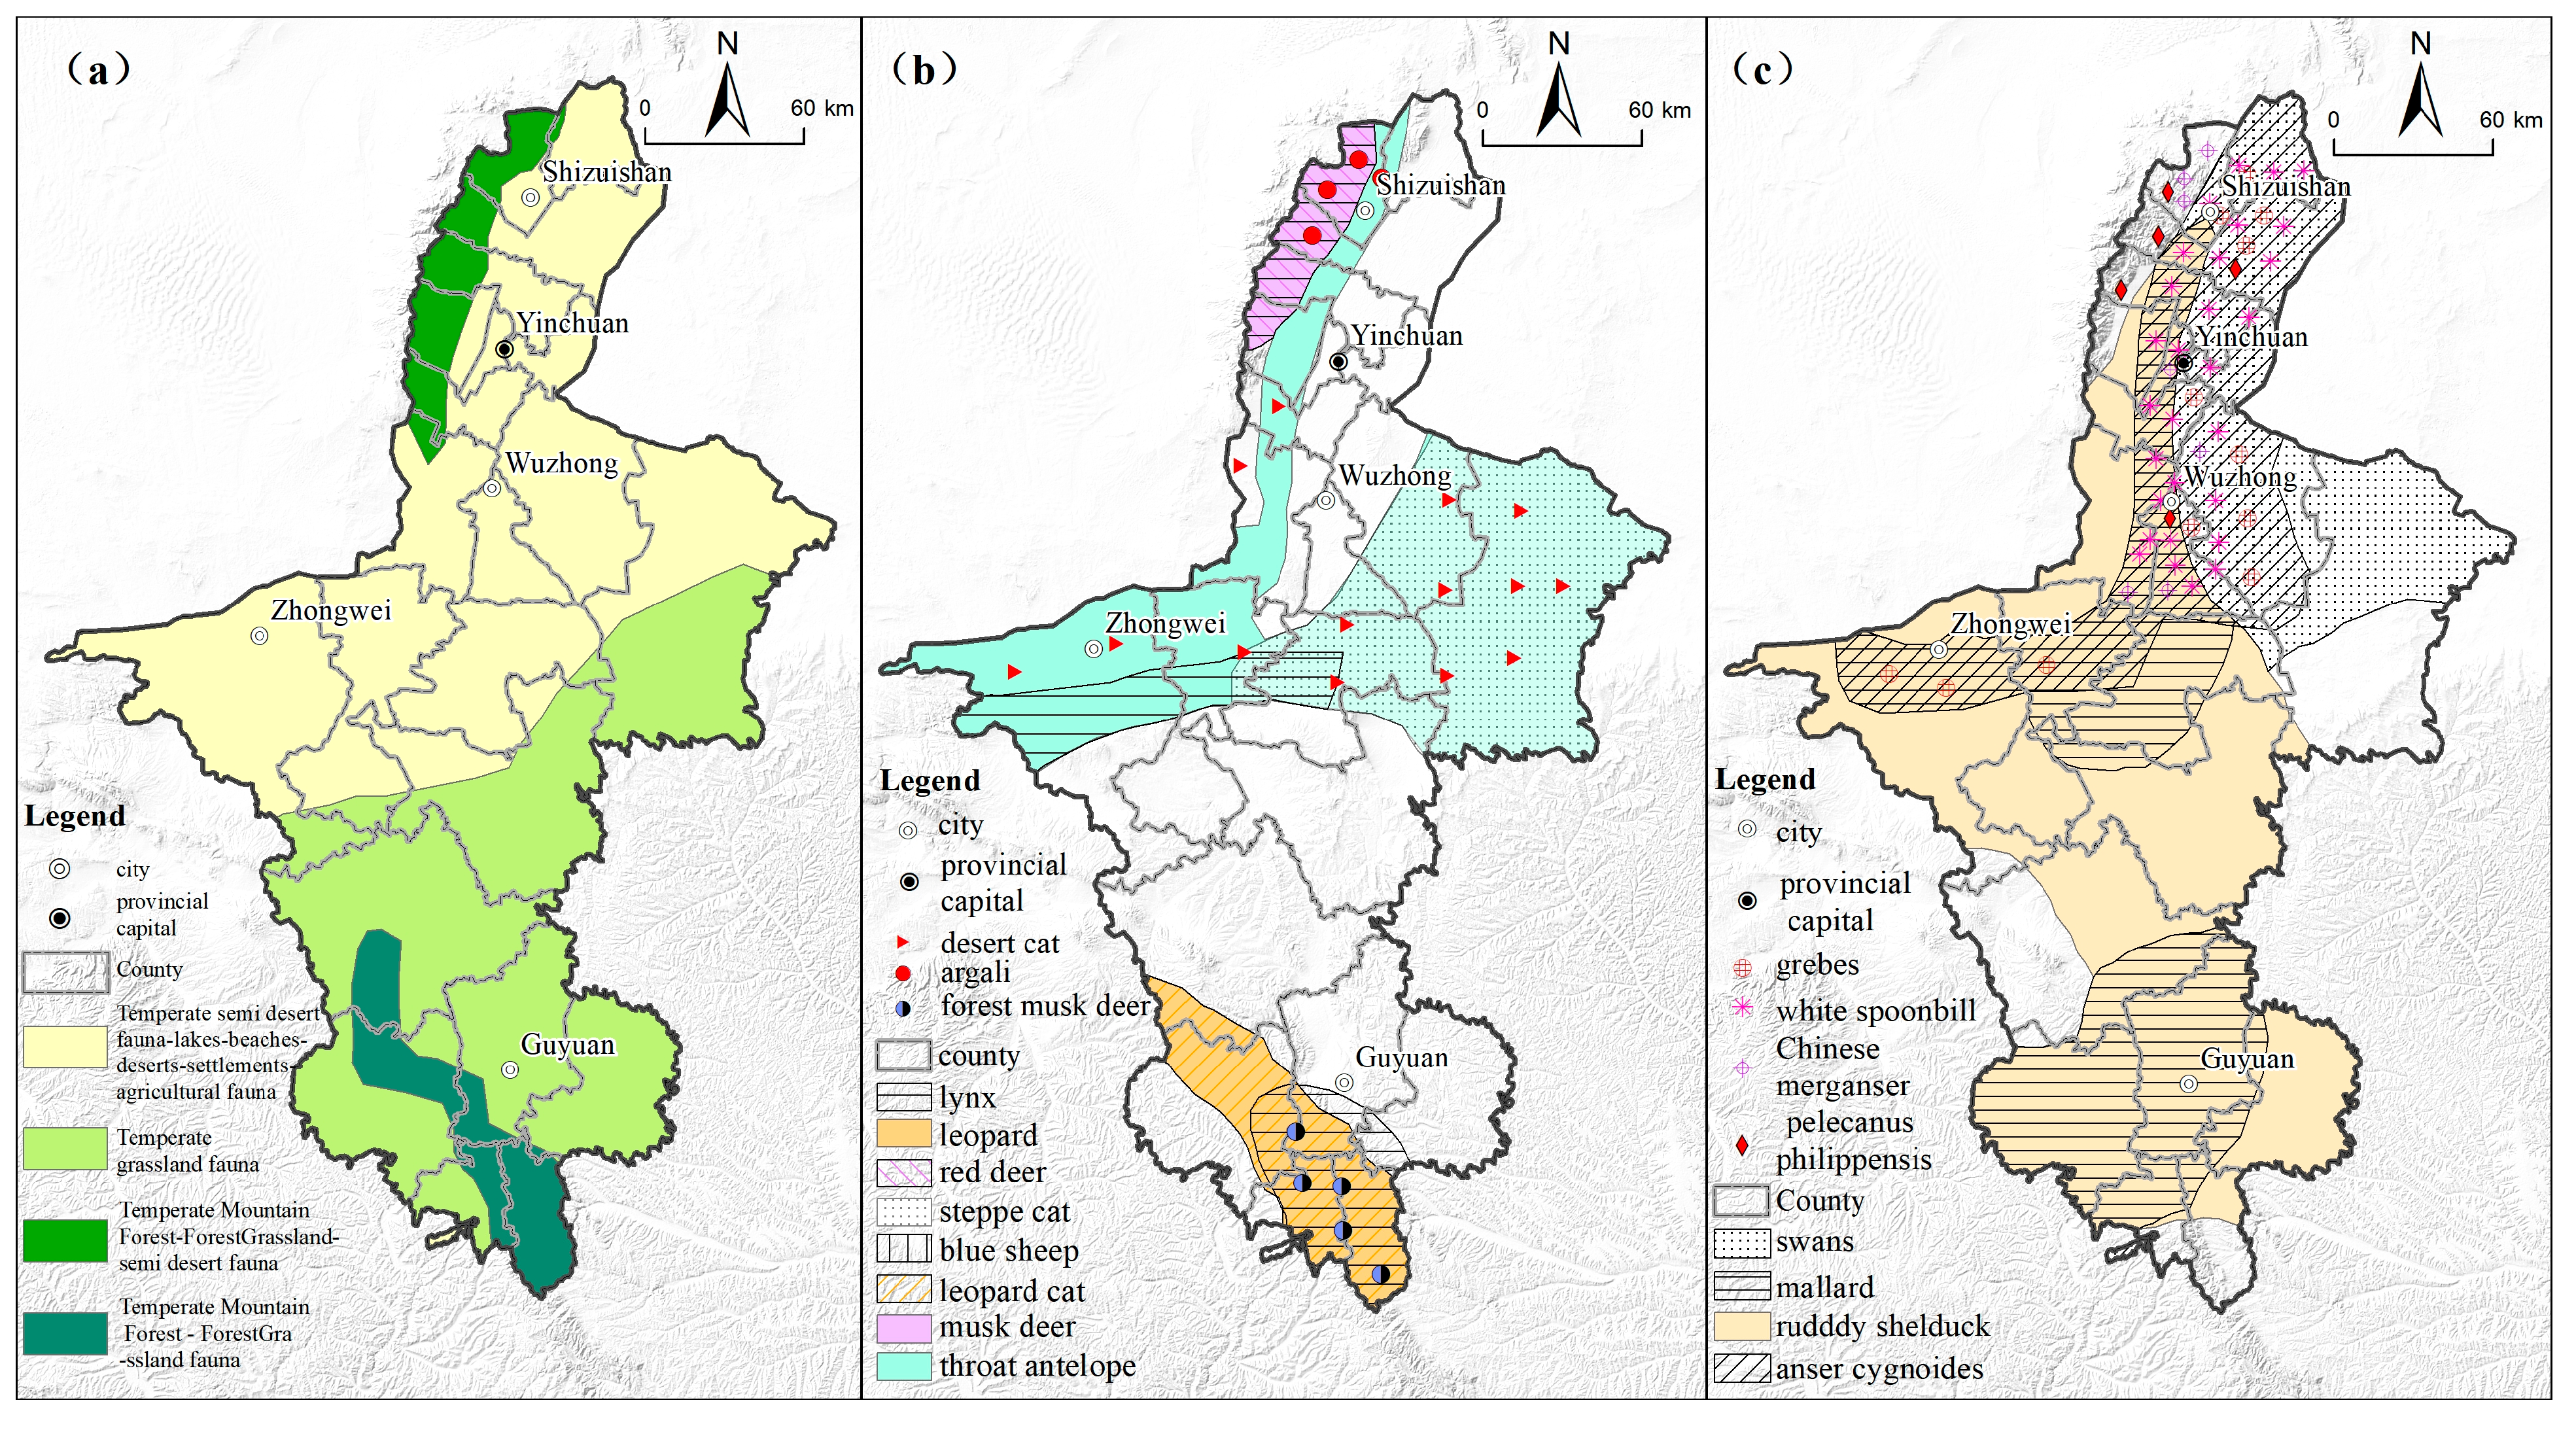
3.1.3. Analysis of Spatial Matching between Ecological Source Areas and Key Biodiversity Areas
3.2. Identification Results and Characteristics Analysis of Potential Ecological Corridors
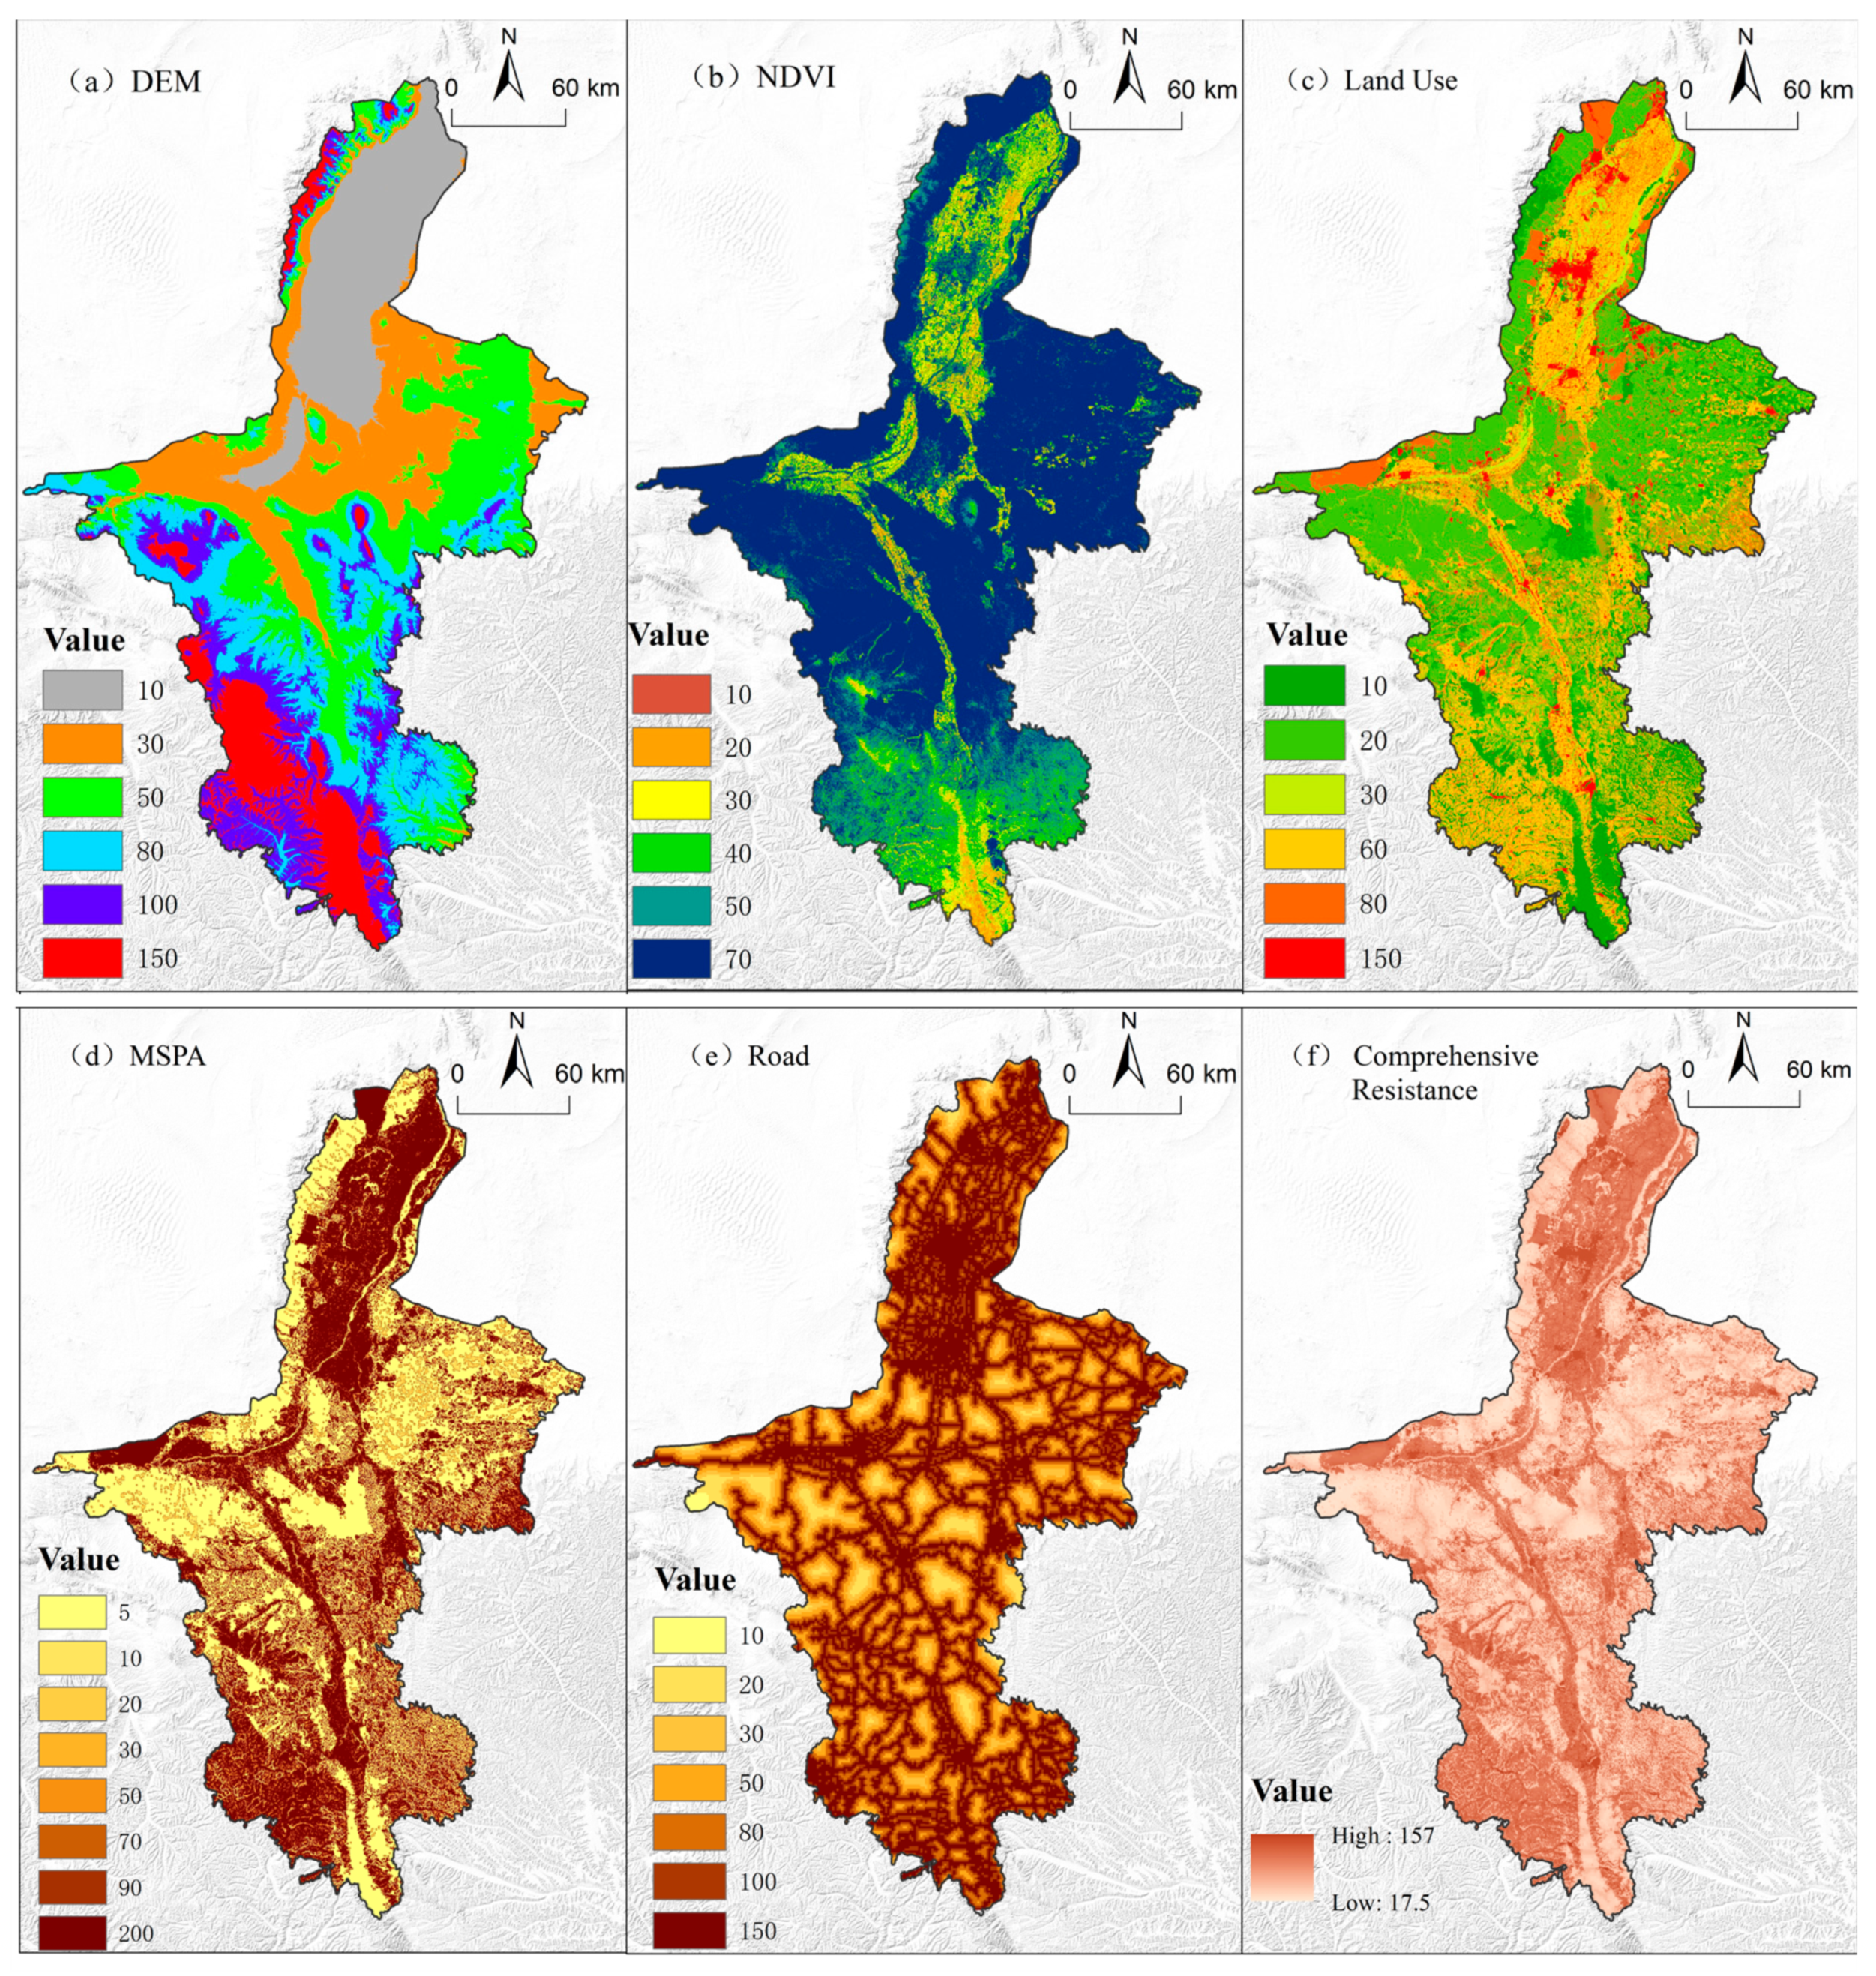
3.2.1. Characteristics of Resistance Surfaces
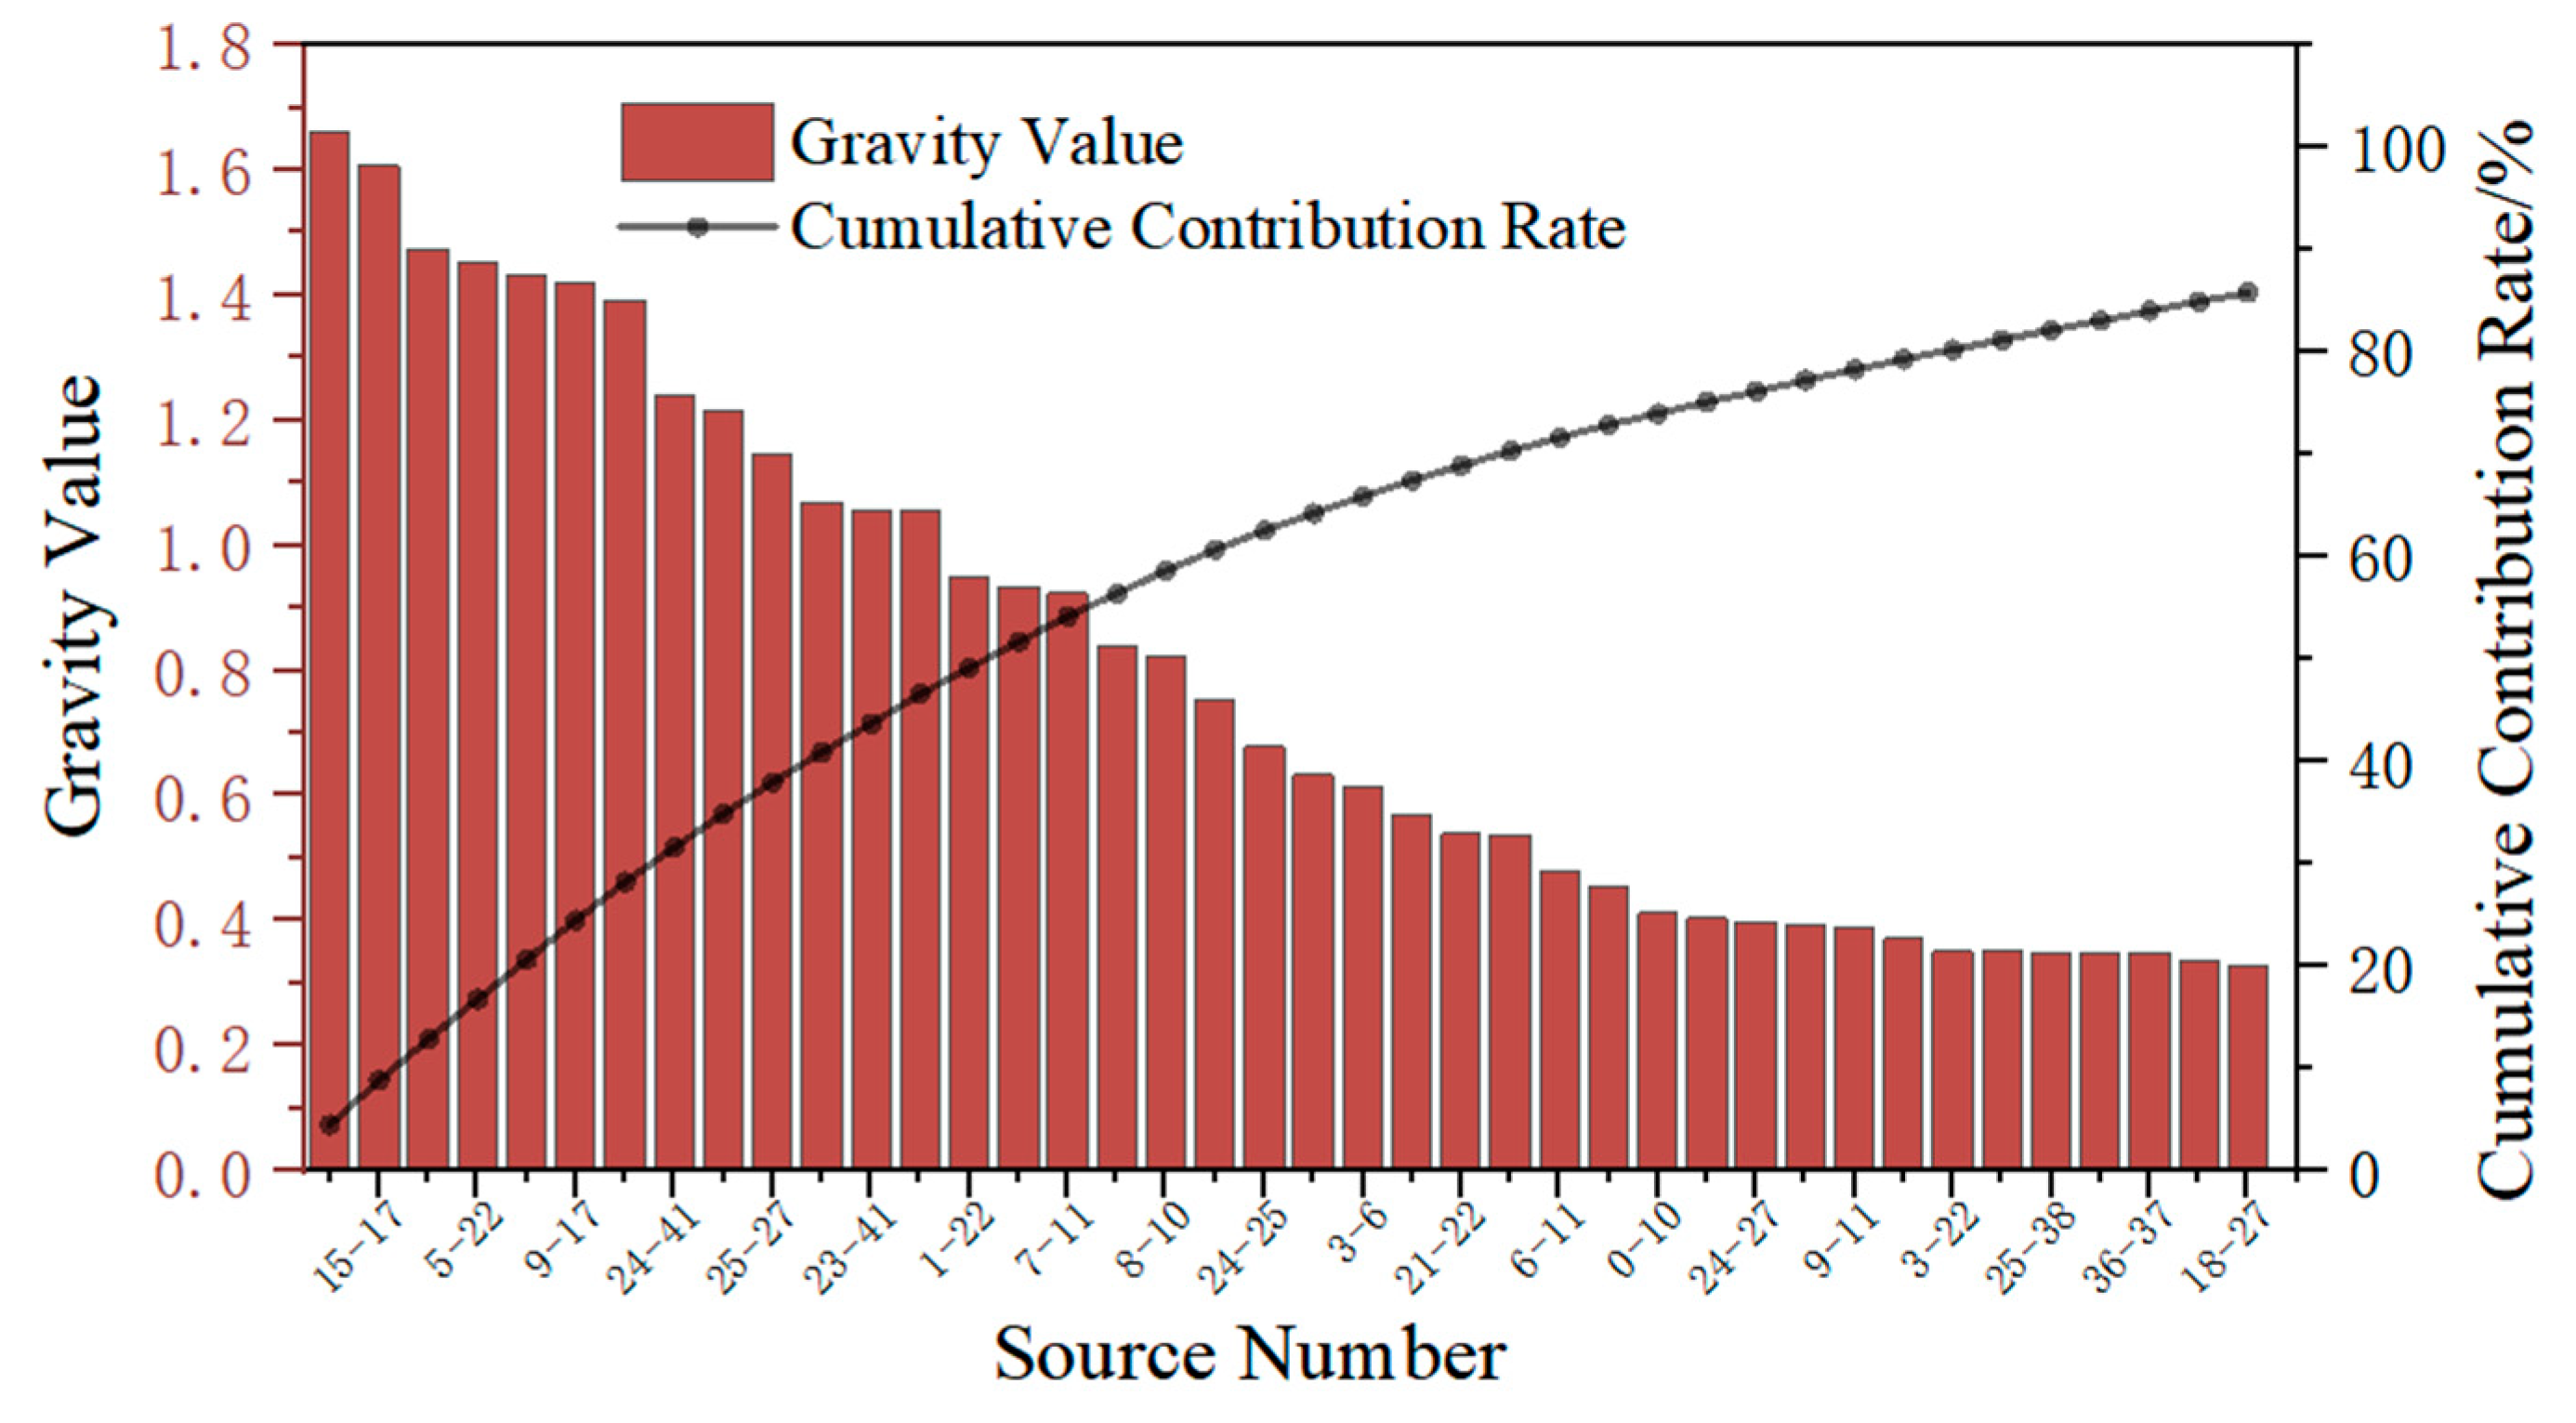
3.2.2. Extraction and Grading of Potential Ecological Corridors
3.3. Characteristics of the Ecological Security Pattern in Ningxia
4. Discussion and Conclusions
4.1. Discussion
- (1)
- Optimization of the classification of ecological source areas and the extraction method of key ecological corridors. The construction of a hierarchical ecological network mainly involves the classification of ecological sources and the classification of potential ecological corridors in terms of importance. Arid and semi-arid areas tend to have a fragile ecological environment, ecological networks are prone to fracture, and high- and low-level network structures restrict and influence each other. At present, there are few studies on arid and semi-arid areas, and there are ecological networks built around natural protection areas in Qinghai Province [25], while there are many related studies on humid areas [67,70]. Two different types of areas are mostly divided into corridor grades by area. In the classification of ecological sources where forest ecosystems are the main focus, quantifying the source area level on the basis of area units is relatively objective. However, in arid and semi-arid ecologically fragile areas, the ecological source areas are often composed of forests and grasslands or a combination of forests, grasslands, and water. Since source areas differ in size and component structure, relying solely on area measurement to determine the importance of ecological source areas is clearly lacking in scientific rigor. Therefore, on the basis of energy factors, this study proposes a classification of ecological sources that is more objective and accurate than one simply based on area. Since the importance of ecological source areas measured by energy factors is more objective, in the calculation of the gravity model of the ecological source area formula, the gravity factor of ecological source areas is expressed on the basis of the size of the energy factor, which is more scientifically rigorous than calculating gravity on the basis of area size.
- (2)
- The impact of road construction on the connectivity of ecological networks. In previous studies, scholars have been more concerned about the impact of human activities and the expansion of construction land on animal habitats [71,72], with more attention paid to the increase in the size and number of construction land patches. This study found that the rapid expansion of the transportation network system in recent years has blocked ecological patches. This blocking effect on ecological corridors needs further attention. Calculations have shown that there are numerous ecological rupture points where ecological corridors intersect with roads above the general highway level, not to mention the even more numerous impacts of township and village roads, which are even more complex. At present, the development of green infrastructure network protection strategies [73] and plantation of grass and trees on both sides of traffic arteries have led to the development of ecological corridors connecting ecological sources and fragmentary patches to improve the circulation of ecological networks [74]. In the future, to maintain the connectivity of ecological networks, it is necessary to pay attention to the restoration of such ecological rupture points. When new roads are being constructed, it is important to pay attention to the placement of facilities such as culverts and diversion areas that facilitate animal migration.
- (3)
- Enhancing the connectivity of ecological elements through the “network driving surface”. Species find it difficult to survive in fragmented landscapes, and conflicts between nature and society hinder conservation efforts. Movement is a product of species evolution and has significant impacts on the survival and reproduction of animal species in various forms. Animals migrate within their nest ranges, but they may also move to places far from their birthplaces, where their relatives still remain. As an ecological strategy, ecological networks embody the concept of ecological civilization and connect humans and nature in space, balancing economy and ecology. They play an important role in improving the material cycle, energy exchange, and information transmission of regional ecosystems. The ecological security pattern of a network driving surface connects important ecological sources in space and is important in establishing an ecological security pattern that facilitates the flow of ecological elements.
- (4)
- Restoration of an ecological source area. Ningxia is located in an ecologically fragile area; some important areas or areas to be restored have less woodland, grassland, and water coverage; and MSPA often fails to identify such areas, thus adversely affecting the maintenance of regional ecological security. The ecological red line includes important ecological functional areas and ecologically fragile and sensitive areas and is the bottom line of national and regional ecological security [75]. A superposition analysis of the ecological red line and the core patch is helpful in identifying and restoring relevant ecological sources. As shown in Figure 4, the patch of the core area is superimposed with the ecological red line to identify the source area of the Helan Mountain Nature Reserve to be repaired, and the source area restoration of the relevant ecologically fragile areas can effectively improve the quality of the source area and the stability of the ecological network.
4.2. Conclusions
- (1)
- The ecological source areas in Ningxia exhibit a distribution pattern characterized by forests dominating in mountainous areas, desert grassland ecosystems dominating in the eastern and western wings, and plain lake wetland systems dominating the plain systems. This has formed a composite ecological cluster source system with mountainous forest ecosystems as the main body, coupled with grassland and lake wetland ecosystems.
- (2)
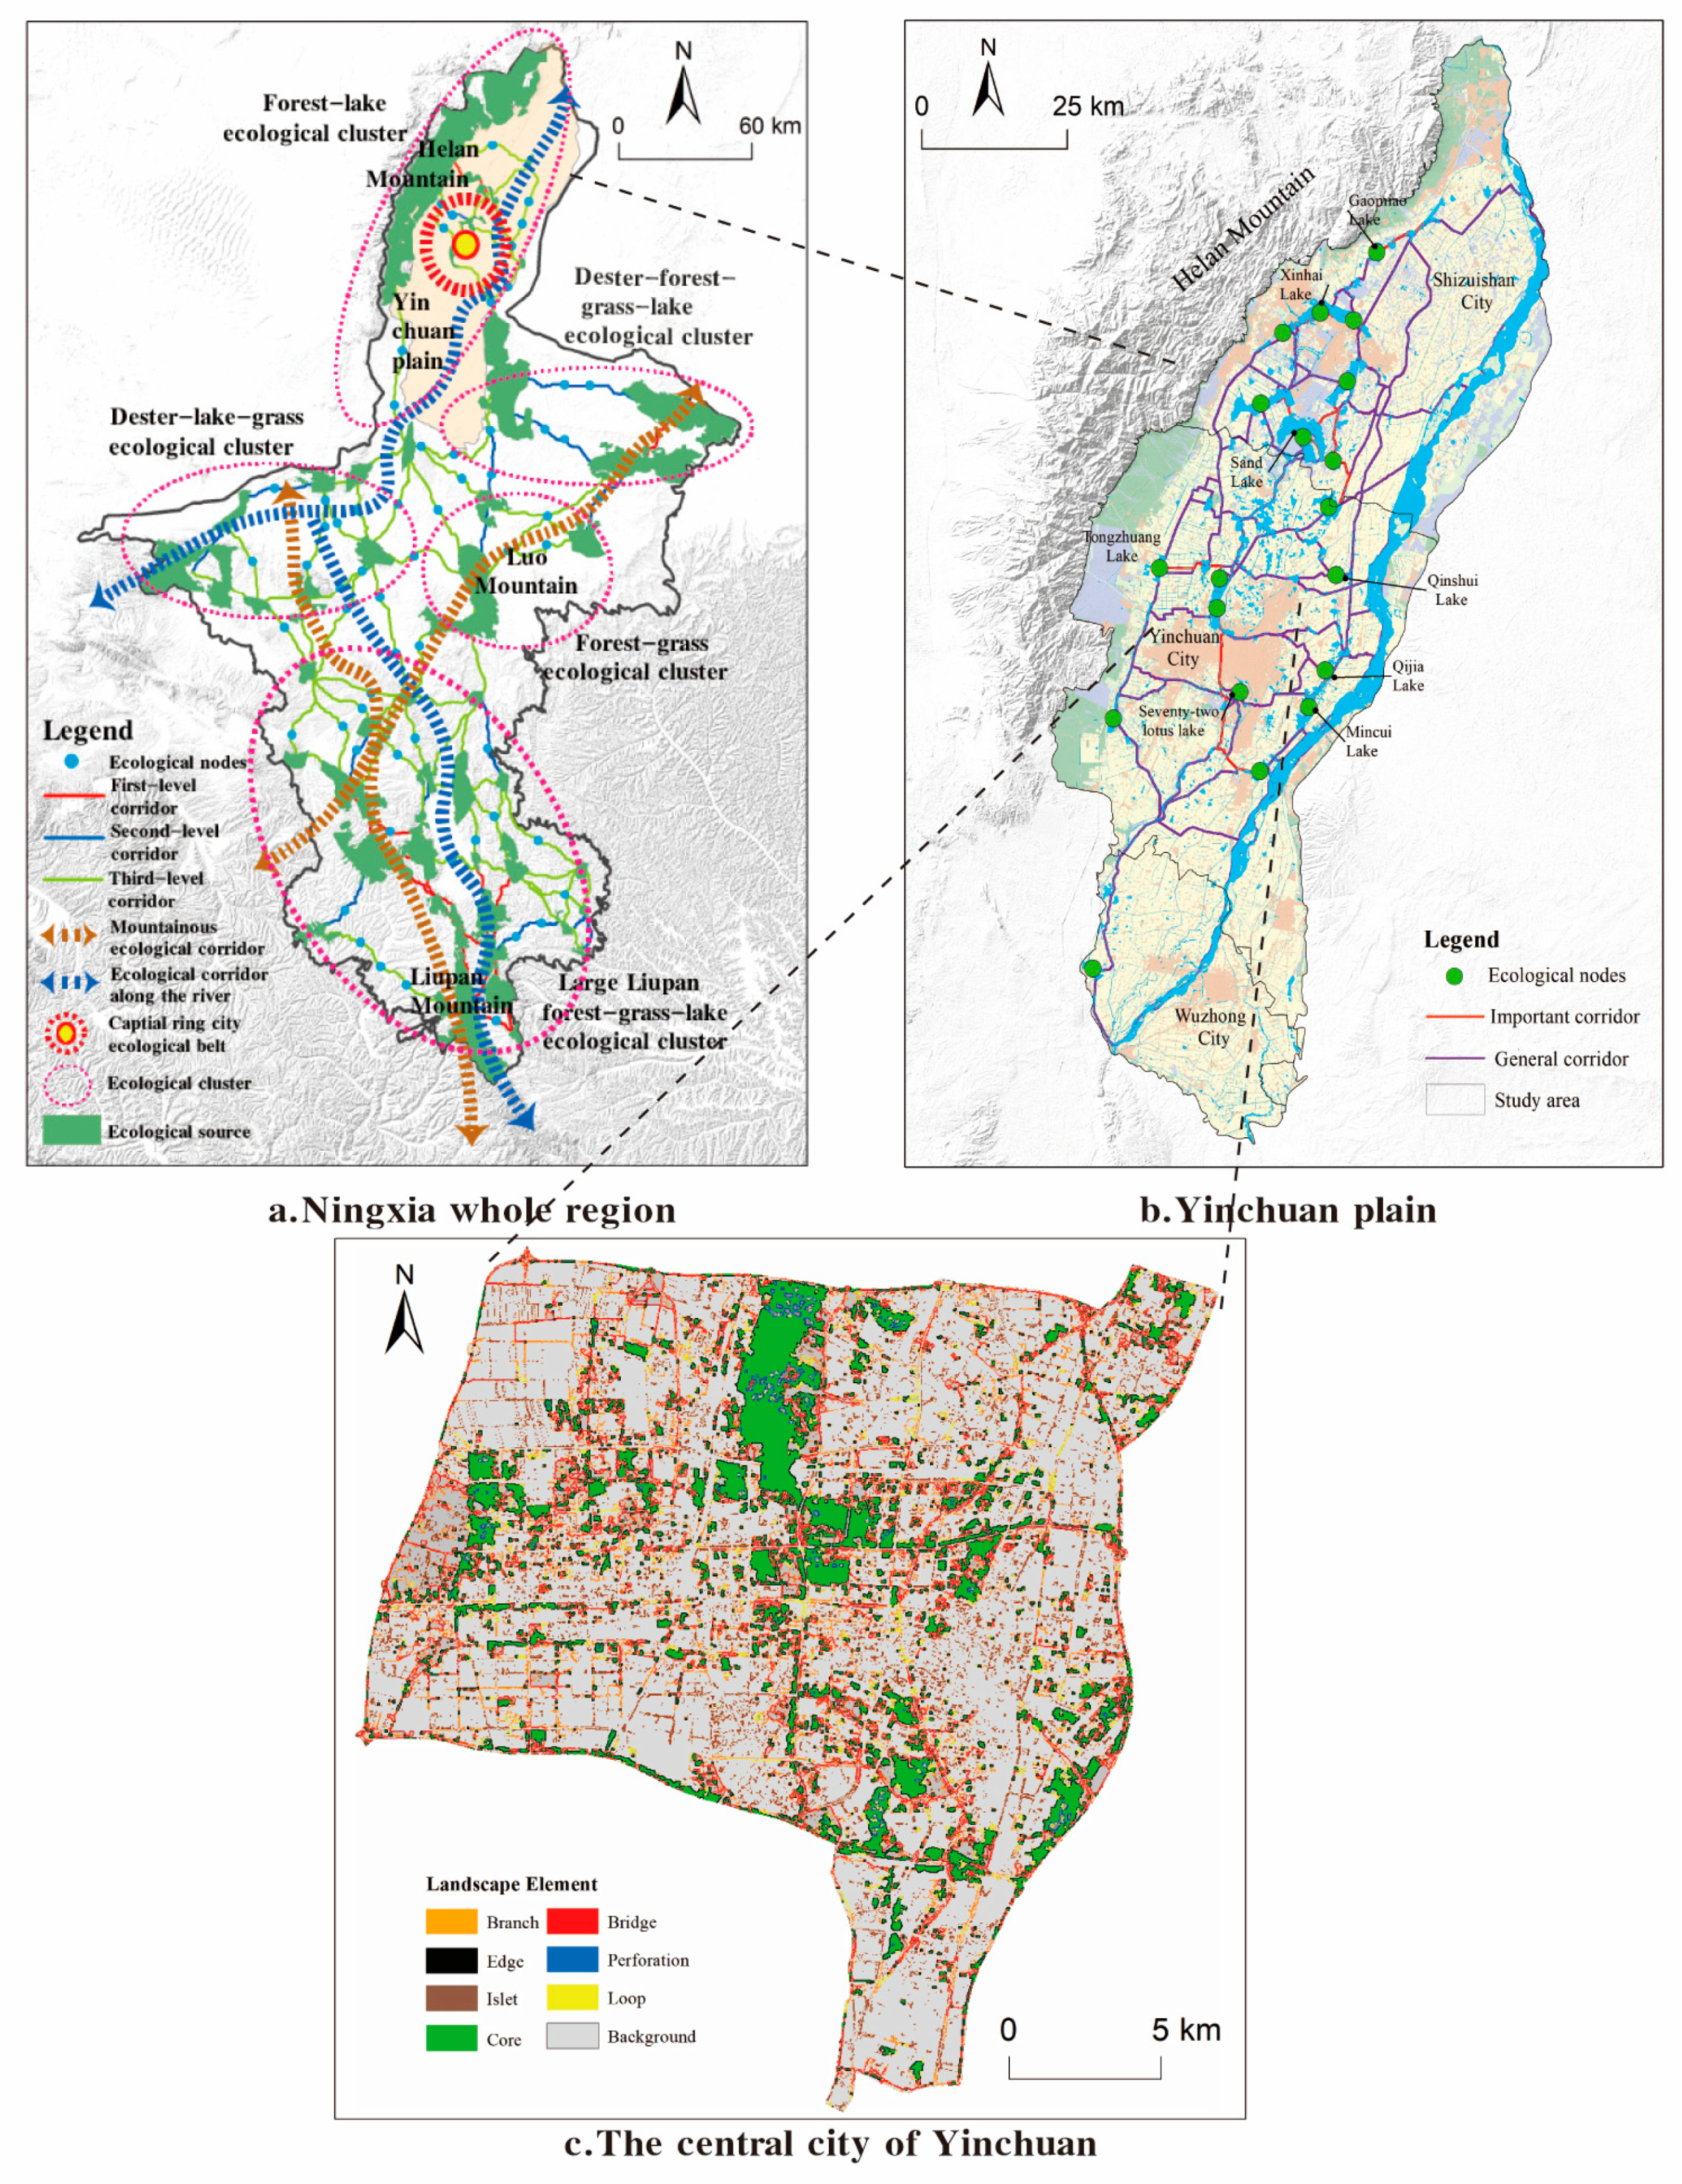
- A composite ecological corridor structure system, Ningxia is composed of a water system ecological corridor system and a land ecological corridor system. The northern region is dominated by the Yellow River water system network system. The Helan Mountain National Nature Reserve has a high degree of connection with the surrounding river and lake wetlands. The Liupan Mountain National Nature Reserve is connected to source areas 1, 19, 3, 7, and 8, all of which are important corridors. The Luo Mountain National Nature Reserve is mainly connected to ecological sources 23, 24, and 41 through secondary corridors.
- (3)
- There are many ecological breakpoints in the ecological network, resulting in poor connectivity. To enhance network connectivity, it is necessary to add 62 ecological stepping stones and repair 58 ecological breakpoints. After optimization, the α, β, and γ indices can be increased by 0.13, 0.25, and 0.09, respectively.
- (4)
- The ecological security structure of Ningxia is proposed to be a one-belt, three-screen, three-corridor, five-cluster structure based on the network driving surface. The belt is an ecological zone of rivers, lakes, and wetlands, mainly along the main axis of the Yellow River. The three screens refer to the ecological barriers of the Helan, Luo, and Liupan Mountains. The three corridors are the Qingshui River water system corridor, the large Liupan corridor, and the southwest–northeast ecological corridor in the central arid zone. The five clusters, which are desert–forest–grass–lake type, desert–lake–grass type, Daliupan forest–grass–lake type, forest–lake type, and forest–grass type, reflect the characteristics of biodiversity in the east, west, south, north, and central regions of Ningxia around the key source areas, respectively.
Author Contributions
Funding
Data Availability Statement
Acknowledgments
Conflicts of Interest
Appendix A

| Source Number | Source Name | Cluster | Source Number | Source Name | Cluster | Source Number | Source Name | Cluster |
|---|---|---|---|---|---|---|---|---|
| 0 | Liupan Mountain Nature Reserve | V | 15 | - | V | 30 | Sand Lake | I |
| 1 | Liupan Mountain Nature Reserve | V | 16 | - | V | 31 | - | I |
| 2 | - | V | 17 | - | V | 32 | - | I |
| 3 | Yunwu Mountain Nature Reserve | V | 18 | - | IV | 33 | - | I |
| 4 | - | V | 19 | - | V | 34 | - | V |
| 5 | - | V | 20 | - | V | 35 | - | III |
| 6 | - | V | 21 | - | V | 36 | Xiangshan National Grassland Park | III |
| 7 | - | V | 22 | - | V | 37 | - | III |
| 8 | Huoshizhai Nature Reserve | V | 23 | Haba Lake Nature Reserve | II | 38 | Tian hu National Wetland park | III |
| 9 | Nanhua Mountain Nature Reserve | V | 24 | Haba Lake Nature Reserve | II | 39 | - | III |
| 10 | Zhenhu wetland Reserve | V | 25 | Luo Mountain Nature Reserve | IV | 40 | - | III |
| 11 | - | V | 26 | - | I | 41 | Baijitan Nature Reserve | II |
| 12 | - | V | 27 | - | IV | 42 | - | I |
| 13 | - | V | 28 | - | I | 43 | Qingtongxia Reservoir Area Wetland | III |
| 14 | - | V | 29 | - | I | 44 | Shapotou Nature Reserve | III |
References
- Chen, X.Q.; Kang, B.Y.; Li, M.Y.; Du, Z.B.; Zhang, L.; Li, H.Y. Identification of priority areas for territorial ecological conservation and restoration based on ecological networks: A case study of Tianjin City, China. Ecol. Indic. 2023, 146, 109809. [Google Scholar] [CrossRef]
- Peng, J.; Pan, Y.J.; Liu, Y.X.; Zhao, H.J.; Wang, Y.L. Linking ecological degradation risk to identify ecological security patterns in a rapidly urbanizing landscape. Habitat Int. 2018, 71, 110–124. [Google Scholar] [CrossRef]
- Dang, X.W.; Zhou, L.; Hu, F.N.; Yuan, B.; Tang, J.J. Multi-scale influence of urban agglomeration expansion on ecological land in Guanzhong Plain. J. Ecol. 2022, 42, 3020–3032. [Google Scholar]
- Peng, J.; Lu, D.N.; Zhang, T.; Liu, Q.Y.; Lin, J. Systematic cognition of the ecological protection and restoration of mountains, rivers, forests, fields, lakes and grasslands. J. Ecol. 2019, 39, 8755–8762. [Google Scholar]
- Yao, C.Y.; An, R.; Dou, C.; Liu, Y.L. Construction and evaluation of woodland ecological network in the Three Gorges Reservoir Area based on MSPA and MCR model. Resour. Environ. Yangtze River Basin 2022, 31, 1953–1962. [Google Scholar]
- Zhang, Y.; Xu, D.Y.; Li, X.; Zhang, X.Y.; Wang, X.B.; Wang, S.Q. Construction of ecological corridor and identification of key nodes in the core area of the middle-old traffic corridor. J. Ecol. 2020, 40, 1933–1943. [Google Scholar]
- Liu, J.J.; Chen, J.R.; Lai, Y.N.; Luo, B.Y.; Zhao, F.; Du, Q. Optimization and application of Ecological Network Methods based on Landscape Pattern and Connectivity Evaluation. J. Appl. Ecol. 2019, 30, 3108–3118. [Google Scholar]
- Liu, X.Y.; Wei, M.; Zeng, J.; Zhang, S. Analysis and construction of ecological network in Fujian Triangle urban agglomeration. Resour. Sci. 2021, 43, 357–367. [Google Scholar]
- Chen, H.B. Promoting ecological priority and green development in the Yangtze River Economic Belt—Based on the perspective of biodiversity. Res. Social. Chin. Charact. 2020, 2, 79–87. [Google Scholar]
- Dai, L.; Liu, Y.B.; Luo, X.Y. Integrating the MCR and DOI models to construct an ecological security network for the urban agglomeration around Poyang Lake, China. Sci. Total Environ. 2021, 754, 141868. [Google Scholar] [CrossRef] [PubMed]
- Jiang, H.; Zhang, Z.M.; Xu, Z.H.; Dan, Y.Z.; Ye, Y.Y.; Li, J.Z.; Peng, J. Construction of ecological security pattern in Guangdong Province by integrating multiple ecological protection objectives. J. Ecol. 2022, 42, 1981–1992. [Google Scholar]
- Huang, X.Y.; Zhao, X.M.; Guo, X.; Ding, H.; Chen, L.; Zhang, J.J. Simulation analysis of the influence of land use change on the stability of ecological network in Poyang Lake Plain. J. Agric. Eng. 2022, 38, 277–287. [Google Scholar]
- Su, C.; Dong, J.Q.; Ma, Z.G.; Qiao, N.; Peng, J. Identification of priority areas for ecological protection and restoration of mountains, rivers, forests, farmland, lakes and grass based on ecological security pattern—Take Huaying Mountain area of Sichuan Province as an example. J. Ecol. 2019, 39, 8948–8956. [Google Scholar]
- Li, Z.Y.; Li, Y.Y.; Li, W.X.; Xue, M.K. Research on the construction of ecological security pattern in Kunming city based on the analysis of morphological spatial pattern and the minimum cumulative resistance model. J. Ecol. Rural. Environ. 2023, 39, 69–79. [Google Scholar]
- Li, Q.P.; Zhang, Z.D.; Wan, L.W.; Yang, C.X.; Zhang, J.; Ye, C.; Chen, Y.C. Optimization of Landscape Pattern in the Ningjiang River Basin Based on Landscape Ecological Risk Assessment. J. Geogr. 2019, 74, 1420–1437. [Google Scholar]
- Vergnes, A.; Kerbiriou, C.; Clergeau, P. Ecological corridors also operate in an urban matrix: A test case with garden shrews. Urban Ecosyst. 2013, 16, 511–525. [Google Scholar] [CrossRef]
- Shi, F.N.; Liu, S.L.; An, Y.; Sun, Y.X. Research on biodiversity conservation of mountains, rivers, forests, fields, lakes and grasses based on ecological network—Take Zuo River in Guangxi as an example. J. Ecol. 2019, 39, 8930–8938. [Google Scholar]
- Wu, M.Q.; Hu, M.M.; Wang, T.; Fan, C.; Xia, B.C. Identification of urban ecological sources based on ecological security pattern and multi-scale landscape connectivity. J. Ecol. 2019, 39, 4720–4731. [Google Scholar]
- Chen, X.; Peng, J.; Liu, Y.X. Construction of ecological security pattern in Yunfu city based on the framework of “importance-sensitivity-Connectivity”. Geogr. Res. 2017, 36, 471–484. [Google Scholar]
- Gao, M.W.; Hu, Y.C.; Li, X.; Song, R. Construction of ecological security pattern in karst mountainous areas based on the importance of ecosystem services and environmental sensitivity—Take Hechi in Guangxi as an example. J. Ecol. 2021, 41, 2596–2608. [Google Scholar]
- Zheng, Q.M.; Hu, J.H.; Shen, M.Z. Construction of Hunan Province ecological network based on MSPA and MCR models. J. Nat. Sci. Hunan Norm. Univ. 2021, 44, 1–10. [Google Scholar]
- Chen, Q.; Liu, P.H.; Zhu, C.M. Construction of Ecological Security Pattern in Fuzhou City, Jiangxi Province based on MCR model. Notif. Soil Water Conserv. 2022, 42, 210–218. [Google Scholar]
- Vogt, P.; Ferrari, J.R.; Lookingbill, T.R.; Gardner, R.H.; Riitters, K.H.; Ostapowicz, K. Mapping functional connectivity. Ecol. Indic. 2009, 9, 64–71. [Google Scholar] [CrossRef]
- Chen, Z.A.; Ma, B.B.; Wei, X.J.; Zeng, L.Q.; Jiang, X.H. Construction and optimization of ecological network in Nanchang city based on MSPA and MCR models. Soil Water Conserv. Bull. 2021, 41, 139–147. [Google Scholar]
- Shi, N.N.; Han, Y.; Wang, Q.; Quan, Z.J.; Luo, Z.L.; Ge, J.S.; Han, R.Y.; Xiao, N.W. Construction and optimization of ecological network in protected areas in Qinghai Province. J. Ecol. 2018, 37, 1910–1916. [Google Scholar]
- Zhang, Q.S.; Li, F.X.; Wang, D.W.; Li, M.C.; Chen, D. Study on ecological spatial connectivity changes in Jiangsu Province based on ecological network. J. Ecol. 2021, 41, 3007–3020. [Google Scholar]
- Chen, N.N.; Kang, S.Z.; Zhao, Y.H.; Zhou, Y.J.; Yan, J.; Lu, Y.R. Construction of mountain ecological network in Qinling Mountains (Shaanxi section) based on MSPA and MCR models. J. Appl. Ecol. 2021, 32, 1545–1553. [Google Scholar]
- Xu, F.; Yin, H.W.; Kong, F.H.; Xu, J.G. Construction of ecological network based on MSPA and minimum path method. J. Ecol. 2015, 35, 6425–6434. [Google Scholar]
- Zhang, L.L.; Zhang, H. Study on the evolution of landscape pattern in ecological sources based on grain size inversion method and MCR model—Take Fengdu County, Chongqing city as an example. Resour. Dev. Mark. 2020, 36, 1320–1325+1333. [Google Scholar]
- Yao, C.; He, Y.; Cheng, J.; Zhang, T.; Pan, H.; Ma, H. Research on evaluation and optimization of ecological security pattern in Minjiang River Basin based on MCR model and gravity model. J. Ecol. 2023, 43, 1–14. [Google Scholar]
- Mao, C.R.; Dai, L.M.; Qi, L.; Wang, Y.; Zhou, W.M.; Zhou, L.; Yu, D.P.; Zhao, F.Q. Construction of watershed Ecological security Pattern based on ecosystem services—Take the Liaohe River Basin of Liaoning Province as an example. J. Ecol. 2020, 40, 6486–6494. [Google Scholar]
- Ni, Q.L.; Ding, Z.Y.; Hou, H.P.; Jia, N.F.; Wang, H. Research on ecological pattern identification and protection based on circuit theory—Take Ningwu County as an example. Resour. Environ. Arid. Zone 2019, 33, 67–73. [Google Scholar]
- Lei, S.; Li, Z.B.; Xiao, L.; Wu, L.; Chen, S.Y.; Wei, L.; Yin, Z.Y. Construction and optimization of the ecological network in Heyuan City based on the MSPA-MCR model. For. Environ. Sci. 2023, 39, 1–11. [Google Scholar]
- Dai, J.P.; Zhu, K.; Zhou, T.Y.; Long, F.; Huang, L.; Peng, J.S. Urban ecological network optimization in Qujing Center based on MSPA and MCR models. J. Northwest Coll. For. 2022, 37, 250–257. [Google Scholar]
- Liu, J.H. Study on the Structure and Pattern Evolution of Ecological Network in Baotou Based on Hierarchical Analysis; Beijing Forestry University: Beijing, China, 2019. [Google Scholar]
- Wang, G.; Yu, Q.; Yang, D.; Zhang, Q.B.; Yue, D.P.; Liu, J.H. Research on the hierarchical ecological network structure based on the complex network analysis method. J. Agric. Mach. 2019, 50, 258–266+312. [Google Scholar]
- Yao, X.J.; Hu, Y.; Li, J.L.; Jiang, D. Construction of ecological security pattern in Linquan County, Anhui Province based on “pressure-state-response mode”. J. Anhui Agric. Univ. 2020, 47, 538–546. [Google Scholar]
- Peng, J.; Zhao, H.J.; Liu, Y.X.; Wu, J.S. Research progress and prospect of the construction of regional ecological security pattern. Geogr. Res. 2017, 36, 407–419. [Google Scholar]
- Yang, Z.G.; Jiang, Z.Y.; Guo, C.X.; Yang, X.J.; Xu, X.J.; Li, X.; Hu, Z.M.; Zhou, H.Y. Construction of ecological network in Guangzhou based on morphological spatial pattern analysis and minimum cumulative resistance model. J. Appl. Ecol. 2018, 29, 3367–3376. [Google Scholar]
- Feng, S.; Tang, Z.Y.; Yu, L.; Guo, C.; Tang, M.X.; Yang, Z.P. Take the Guangdong-Hong Kong-Macao Greater Bay Area as an example. J. Ecol. 2022, 42, 8223–8237. [Google Scholar]
- Wei, Q.Q.; Halike, A.; Yao, K.X.; Chen, L.M.; Balati, M. Construction and optimization of ecological security pattern in Ebinur Lake Basin based on MSPA-MCR models. Ecol. Indic. 2022, 138, 108857. [Google Scholar] [CrossRef]
- Jin, Y.L.; Zhou, D.M.; Zhou, F.; Yang, J.; Zhu, X.Y.; Ma, J.; Zhang, J. Construction and optimization of the ecological security network in the Shule River Basin. J. Appl. Ecol. 2023, 34, 1063–1072. [Google Scholar]
- Tang, F.; Wang, L.; Zhang, P.T.; Fu, M.C. Construction of county ecological security pattern based on ecological protection red line and ecological network. J. Agric. Eng. 2020, 36, 263–272. [Google Scholar]
- Yu, Y.; Meng, J.H.; Song, Z.M.; Xu, L. Construction of county ecological network based on MCR model and landscape connectivity. J. Nanjing For. Univ. (Nat. Sci. Ed.) 2023, 1–9. Available online: http://kns.cnki.net/kcms/detail/61.1202.S.20230403.1314.006.html (accessed on 12 May 2023).
- Guo, J.X.; Hu, Z.Q.; Li, H.X.; Liu, J.L.; Zhang, X.; Lai, X.J. Construction of the municipal ecological space network based on the MCR model. J. Agric. Mach. 2021, 52, 275–284. [Google Scholar]
- Shen, Q.W.; Lin, M.L.; Mo, H.P.; Huang, Y.B.; Hu, X.Y.; Wei, L.W.; Zheng, Y.S.; Lu, D.F. Construction and optimization of ecological network in Foshan city. J. Appl. Ecol. 2021, 32, 3288–3298. [Google Scholar]
- Gu, F.; Huang, Y.X.; Chen, C.M.; Cheng, D.L.; Guo, J.L. Construction and optimization of the ecological network of nature reserves in Fujian Province. J. Appl. Ecol. 2017, 28, 1013–1020. [Google Scholar]
- Ye, J.Y. Research on Ecological Landscape Pattern and Ecological Network Construction in Ecological Resettlement Area in South Ningxia. Master’s Thesis, Ningxia University, Yinchuan, China, 2018. [Google Scholar]
- Zhang, L. Research on the Construction of Green Land Ecological Network in Guyuan City; Suzhou University of Science and Technology: Suzhou, China, 2016. [Google Scholar]
- Zhou, Y.S.; Zheng, Z.H.; Wu, Z.F.; Guo, C.; Chen, Y.B. Construction and evaluation of ecological networks in highly urbanised regions: A case study of the Guangdong-Hong Kong-Macao greater Bay Area, China. Ecol. Indic. 2023, 152, 110336. [Google Scholar] [CrossRef]
- The CPC Central Committee and The State Council. The Outline of the Plan for Ecological Protection and High-quality Development of the Yellow River Basin. Available online: https://www.gov.cn/zhengce/2021-10/08/content_5641438.htm (accessed on 12 May 2023).
- Zhu, J.; Su, J.; Yin, H.W.; Kong, H.H. Construction of Xuzhou ecological network based on source comprehensive identification and multi-scale nested. J. Nat. Resour. 2020, 35, 1986–2001. [Google Scholar]
- He, J.H.; Guo, X. Construction of Datong County ecological network based on MSPA and MCR models. Spec. Econ. Zone Econ. 2022, 104–109. [Google Scholar]
- Xu, W.Z.; Huang, S.Y.; Geng, J.W.; Wang, X.Y.; Fu, W.C.; Lin, S.Y.; Dong, J.W. Construction of Xiamen Ecospace network based on the MCR and gravity model. J. Northwest Coll. For. 2022, 37, 264–272. [Google Scholar]
- Wang, Q.; Wang, C.; Zhang, L.G.; Guo, H. Construction and analysis of urban woodland ecological network in the lower reaches of the Yellow River-Taking Jinan as an example. J. Shandong Jianzhu Univ. 2022, 37, 101–107. [Google Scholar]
- Vogt, P.; Riitters, K. GuidosToolbox: Universal digital image object analysis. Eur. J. Remote Sens. 2017, 50, 352–361. [Google Scholar] [CrossRef]
- Wu, C.G.; Zhou, Z.X.; Wang, P.C.; Xiao, W.F.; Teng, M.J. Concept, measure of landscape connectivity and its application. J. Ecol. 2010, 30, 1903–1910. [Google Scholar]
- Mitchell, M.G.E.; Bennett, E.M.; Gonzalez, A. Linking Landscape Connectivity and Ecosystem Service Provision: Current Knowledge and Research Gaps. Ecosystems 2013, 16, 894–908. [Google Scholar] [CrossRef]
- Wang, G.; Yu, Q.; Yang, D.; Zhang, Q.B.; Yue, D.P.; Liu, J.H. Research on the construction method of hierarchical ecological network in Baotou city. J. Agric. Mach. 2019, 50, 235–242+207. [Google Scholar]
- Zeng, Z.; Ai, J.W.; Wang, Z.L.; He, T.Y.; Zheng, Y.S. Research on the spatial and temporal evolution of landscape pattern and ecological network construction in Sanming city. J. Ecol. Rural. Environ. 2023, 39, 1–13. [Google Scholar]
- Qin, Z.B.; Xuan, J.; Huang, L.J.; Liu, X.Z. Construction of sea-island urban ecological network based on MSPA and MCR models—Take Pingtan Island in Fujian Province as an example. Res. Soil Water Conserv. 2023, 30, 303–311. [Google Scholar]
- Liu, J.; Chen, J.J.; Yang, Y.P.; You, H.T.; Han, X.W. Construction and Optimization of an Ecological Network in the Yellow River Source Region Based on MSPA and MCR Modelling. Int. J. Environ. Res. Public Health 2023, 20, 3724. [Google Scholar] [CrossRef]
- Yu, C.; Wang, L.Z.; Zhao, S.; Gui, F. Construction and optimization of Zhoushan Island based on MSPA and MCR models. Ocean. Bull. 2023, 42, 102–111. [Google Scholar]
- Wei, B.J.; Su, J.; Hu, X.J.; Xu, K.H.; Zhu, M.L.; Liu, L.Y. Study on the comprehensive identification of Ecological corridors and ecological nodes based on “HY-LM”. J. Ecol. 2022, 42, 2995–3009. [Google Scholar]
- Urban, D.L.; Minor, E.S.; Treml, E.A.; Schick, R.S. Graph models of habitat mosaics. Ecol. Lett. 2009, 12, 260–273. [Google Scholar] [CrossRef]
- Kong, Y.; Wang, S.Y. Construction of urban and rural ecological network in Yanqing District of Beijing based on the MSPA model. J. Beijing For. Univ. 2020, 42, 113–121. [Google Scholar]
- Wang, Y.; Zhao, W.L.; Liu, C.Q. Ecological network optimization and its construction based on MSPA-Conefor-MCR pathway—Takes Pengze County as an example. J. Jiangxi Agric. Univ. 2022, 44, 504–518. [Google Scholar]
- Wang, B.Y.; Yan, H.M.; Feng, Z.H.; Yang, Y.Z. Changes in the Ecological Characteristics of Key Biodiversity Areas in the BRI Region. J. Resour. Ecol. 2022, 13, 328–337. [Google Scholar]
- The General Office of the People’s Government of Ningxia Hui Autonomous Region. The 14th Five-Year Plan for the Protection and Utilization of Natural Resources in Ningxia Hui Autonomous Region. Available online: https://www.nx.gov.cn/zwgk/qzfwj/202109/t20210924_3045970.html (accessed on 12 May 2023).
- Shao, R.Y.; Luo, Z.W.; Hu, X.J.; Wang, Y.Z.; Zhang, J.Y. Construction and optimization of Zhuzhou ecological network based on MSPA and MCR models. J. Northwest Univ. For. 2023, 1–15. Available online: http://kns.cnki.net/kcms/detail/32.1161.S.20230327.0921.002.html (accessed on 12 May 2023).
- Zhang, J. Study on Ecological and Economy Coupling in Wanzhou District Based on InVEST and Landscape Pattern Index; Southwest University: Chongqing, China, 2017. [Google Scholar]
- Yang, J. Influence Mechanism and Optimization Path of the Spatial Development Intensity of Construction Land under the Constraint of Ecological Network. Master’s Thesis, Huazhong Agricultural University, Wuhan, China, 2021. [Google Scholar]
- Shi, S.M.; Qin, M.Z.; Li, B.; Li, C.Y.; Song, L.L. Research on green infrastructure network in Zhengbian Metropolitan based on MSPA and circuit theory. J. Henan Univ. (Nat. Sci. Ed.) 2018, 48, 631–638. [Google Scholar]
- Pan, J.H.; Liu, X. Evaluation and pattern optimization of inland river landscape ecological safety based on spatial principal component and minimum cumulative resistance model—Take Ganzhou District of Zhangye City as an example. J. Appl. Ecol. 2015, 26, 3126–3136. [Google Scholar]
- Wu, Z.Q.; Wang, Z.Z. Red line of ecological protection, ecological compensation and farmers’ livelihood dilemma based on the perspective of governance. J. Chongqing Univ. (Soc. Sci. Ed.) 2020, 26, 230–243. [Google Scholar]


| Resistance Factor | Classification Index | Resistance Value | Weight | Resistance Factor | Classification Index | Resistance Value | Weight |
|---|---|---|---|---|---|---|---|
| DEM (m) | <1200 | 10 | 0.1 | NDVI | >0.6 | 10 | 0.1 |
| [1200, 1400) | 30 | [0.5, 0.6) | 20 | ||||
| [1400, 1600) | 50 | [0.4, 0.5) | 30 | ||||
| [1600, 1800) | 80 | [0.3, 0.4) | 40 | ||||
| [1800, 2000) | 100 | [0.2, 0.3) | 50 | ||||
| ≥2000 | 150 | <0.2 | 70 | ||||
| Road distance (km) | <0.5 | 150 | 0.2 | MSPA Landscape | Core | 5 | 0.3 |
| [0.5, 1.5) | 100 | Bridge | 10 | ||||
| [1.5, 3) | 80 | Loop | 20 | ||||
| [3, 5) | 50 | Branch | 30 | ||||
| [5, 7) | 30 | Islet | 50 | ||||
| [7, 14) | 20 | Perforation | 70 | ||||
| ≥14 | 10 | Edge | 90 | ||||
| Background | 200 | ||||||
| Land use | Forest land | 10 | 0.3 | ||||
| Grass land | 20 | ||||||
| Water Area | 30 | ||||||
| Arable Land | 60 | ||||||
| Unused Land | 80 | ||||||
| Construction Land | 150 |
| Landscape Type | Area/×104 hm2 | Percentage of Landscape Area/% | Percentage of Research Area/% |
|---|---|---|---|
| Core | 145.03 | 35.58 | 21.83 |
| Islet | 13.79 | 3.38 | 2.07 |
| Perforation | 10.84 | 2.66 | 1.63 |
| Edge | 41.05 | 10.07 | 6.18 |
| Bridge | 52.14 | 12.79 | 7.85 |
| Loop | 12.62 | 3.10 | 1.89 |
| Branch | 0.34 | 0.08 | 0.05 |
| Background | 131.84 | 32.34 | 19.85 |
| Total | 407.64 | 100.00 | 61.35 |
| Source Number | Area/ hm2 | Percentage/ % | Standard Energy | Number | Area/ hm2 | Percentage/ % | Standard Energy | Number | Area/ hm2 | Percentage/ % | Standard Energy |
|---|---|---|---|---|---|---|---|---|---|---|---|
| 0 | 69,845.4 | 6.94 | 1 | 15 | 5706.39 | 0.57 | 0.02 | 30 | 3531.74 | 0.35 | 0.03 |
| 1 | 49,079.5 | 4.88 | 0.47 | 16 | 4755.7 | 0.47 | 0.02 | 31 | 1618.35 | 0.16 | 0.02 |
| 2 | 5474.71 | 0.54 | 0.07 | 17 | 6816.79 | 0.68 | 0.03 | 32 | 1430.94 | 0.14 | 0.01 |
| 3 | 13,945.1 | 1.39 | 0.09 | 18 | 18,369.3 | 1.83 | 0.07 | 33 | 1987.73 | 0.2 | 0 |
| 4 | 3759.48 | 0.37 | 0.03 | 19 | 2863.09 | 0.28 | 0.04 | 34 | 6764.97 | 0.67 | 0.02 |
| 5 | 1899.48 | 0.19 | 0.02 | 20 | 2396.59 | 0.24 | 0.02 | 35 | 16,051.2 | 1.6 | 0.05 |
| 6 | 22,054.7 | 2.19 | 0.09 | 21 | 2381.54 | 0.24 | 0.02 | 36 | 6249.35 | 0.62 | 0.02 |
| 7 | 24,646.3 | 2.45 | 0.19 | 22 | 2929.73 | 0.29 | 0.02 | 37 | 62,416.7 | 6.2 | 0.19 |
| 8 | 45,322.3 | 4.51 | 0.42 | 23 | 61,164.3 | 6.08 | 0.24 | 38 | 15,020.1 | 1.49 | 0.05 |
| 9 | 31,121.1 | 3.09 | 0.22 | 24 | 53,766.2 | 5.34 | 0.22 | 39 | 11,362.6 | 1.13 | 0.03 |
| 10 | 10,121.9 | 1.01 | 0.07 | 25 | 60,512.2 | 6.02 | 0.27 | 40 | 9568.94 | 0.95 | 0.03 |
| 11 | 7465.77 | 0.74 | 0.03 | 26 | 233,578 | 23.22 | 0.7 | 41 | 73,084.2 | 7.27 | 0.28 |
| 12 | 3986.6 | 0.4 | 0.01 | 27 | 132,25.4 | 1.31 | 0.05 | 42 | 1120.28 | 0.11 | 0.01 |
| 13 | 6616.75 | 0.66 | 0.03 | 28 | 3708.38 | 0.37 | 0.02 | 43 | 8847.84 | 0.88 | 0.05 |
| 14 | 4373.74 | 0.43 | 0.02 | 29 | 3300.15 | 0.33 | 0.03 | 44 | 11,703 | 1.16 | 0.2 |
Disclaimer/Publisher’s Note: The statements, opinions and data contained in all publications are solely those of the individual author(s) and contributor(s) and not of MDPI and/or the editor(s). MDPI and/or the editor(s) disclaim responsibility for any injury to people or property resulting from any ideas, methods, instructions or products referred to in the content. |
© 2023 by the authors. Licensee MDPI, Basel, Switzerland. This article is an open access article distributed under the terms and conditions of the Creative Commons Attribution (CC BY) license (https://creativecommons.org/licenses/by/4.0/).
Share and Cite
Yang, Z.; Ma, C.; Liu, Y.; Zhao, H.; Hua, Y.; Ou, S.; Fan, X. Provincial-Scale Research on the Eco-Security Structure in the Form of an Ecological Network of the Upper Yellow River: A Case Study of the Ningxia Hui Autonomous Region. Land 2023, 12, 1341. https://doi.org/10.3390/land12071341
Yang Z, Ma C, Liu Y, Zhao H, Hua Y, Ou S, Fan X. Provincial-Scale Research on the Eco-Security Structure in the Form of an Ecological Network of the Upper Yellow River: A Case Study of the Ningxia Hui Autonomous Region. Land. 2023; 12(7):1341. https://doi.org/10.3390/land12071341
Chicago/Turabian StyleYang, Zhonghua, Caihong Ma, Yuanyuan Liu, Honghong Zhao, Yuqi Hua, Shengya Ou, and Xin Fan. 2023. "Provincial-Scale Research on the Eco-Security Structure in the Form of an Ecological Network of the Upper Yellow River: A Case Study of the Ningxia Hui Autonomous Region" Land 12, no. 7: 1341. https://doi.org/10.3390/land12071341
APA StyleYang, Z., Ma, C., Liu, Y., Zhao, H., Hua, Y., Ou, S., & Fan, X. (2023). Provincial-Scale Research on the Eco-Security Structure in the Form of an Ecological Network of the Upper Yellow River: A Case Study of the Ningxia Hui Autonomous Region. Land, 12(7), 1341. https://doi.org/10.3390/land12071341