Abstract
The accelerated urbanization process has resulted in increasingly prominent conflicts in land resource utilization and caused numerous ecological and environmental issues. Simulating the evolutionary patterns of land use conflicts (LUCs) is the foundation for promoting sustainable land use. The Markov and GeoSOS-FLUS models were used to predict the land use patterns under three different development scenarios, and to analyze the spatio-temporal characteristics of LUCs in Xiamen, China in 2030. Results showed the following: (1) From 2010 to 2020, land use/cover in Xiamen has changed substantially, with an increase of 6.93% in area of construction land and a decrease of 5.40% in area of cropland. (2) In the natural development scenario, the area of construction land in Xiamen is projected to increase, while the areas of cropland and other land types reduce. In the policy intervention scenario, the area of cropland continues increasing and the growth of construction land is effectively controlled. Under the sustainable development scenario, cropland, grassland, and wetlands of high quality that serve important ecological functions have been effectively protected. (3) LUCs in Xiamen differ greatly under the three scenarios in 2030. The sustainable development scenario (SDS) balances the land use needs of both socio-economic development and regional ecological security with the least LUCs, which could be an optimum solution for the long-term sustainable development in Xiamen. The results of this study provide support for decisions about eco-city construction and geospatial planning.
1. Introduction
With rapid socio-economic development and accelerated urbanization, the conflict between increasing land use demand and limited land resources has become more and more prominent since the 1990s [1,2]. Competitive land behaviors such as the construction land encroachment on arable land and ecological land have resulted in a serious imbalance in land use structure, and the deterioration of the ecological environment [3]. Frequent land use conflicts (LUCs) problems have become a serious obstacle to the sustainable use of land resources. Therefore, studying the spatio-temporal changes of LUCs is of great importance for promoting regional high-quality development and achieving coordinated regional development, which is a current research hotspot among scholars in China.
LUCs refers to the inconsistency and disharmony among various stakeholders during the process of land resource utilization with respect to land use methods and quantities, and the state of conflicts between land use methods and the ecological environment [4,5]. How to assess the level of LUCs and promote high efficiency and rational land use are major concerns for policy makers and researchers. Many previous studies have focused on conflict type identification, conflict driver analysis, and spatio-temporal dynamic analysis. Different models, including the multi-objective evaluation method [6], game theory [7], actor network analysis [8], rapid rural appraisal [9], and landscape pattern analysis [10], were used to quantify regional land use intensity and conflict characteristics. For example, Meng, et al. [10] conducted an attribution analysis of LUCs by analyzing the correlation between LUCs indices, socio-economic factors, and natural environmental factors in the Heihe River. Zhang, et al. [11] analyzed LUCs based on 3S technology, which obtained a spatial layout of LUCs, and explained the spatio-temporal changes in LUCs in the Yangtze River Delta city cluster over the past 40 years. Kuusaana, et al. [12] examined the land tenure system in the Asante Akim North District of Ghana, and how it affects LUCs between Fulani pastoralists and smallholder farmers by using a mixed qualitative approach of surveys, in-depth interviews, and focus group discussions. Steinhäußera., et al. [13] conducted interviews with national and regional stakeholders through participatory survey methods to analyze which LUCs exist and the similarities and differences between national and regional levels and priority regions in Germany. However, most of the current research is focused on LUCs in developed regions at a relatively large spatial scale based on historical spatial land use data [14], Only a few studies assessed future LUCs based on landscape structure at the microscopic scale.
To evaluate future LUCs, land use and land cover change (LUCC) simulations and predictions under different development scenarios are imperative [15]. In recent years, the commonly used LUCC simulation models include the Markov model [16], systems dynamics (SD) model [17], cellular automata (CA) model [18], and the conversion of land use and the extent of its effects on small regions (CLUE-S) model [19]. The Markov model mainly relies on the transition probabilities between different land use categories, but neglects the spatial distribution of land use changes [20,21]. The CA and CLUE-S model can simulate the spatial distribution of land use changes, and assess the influence of various factors on LUCC, such as natural and human drivers [22]. However, the determination of driver weights in the CA model depends on expert experience, which is subjective and easily influenced by human factors [23], and it cannot simulate and predict land use changes caused by factors such as policy planning and climate impact [24]. Therefore, coupling models of the Markov, CA, and CLUE-S models are expected to solve the inherent limitations of a singular model while simulating spatial changes in land use [25]. Liu, et al. [26] proposed a future land use simulation model (GeoSOS-FLUS) based on a traditional CA model. The GeoSOS-FLUS model can better address the relationship between driving forces and simulate the long-term spatial evolutionary trajectory of various types of land use. By coupling the top-down system dynamics with the bottom-up cellular automata, an adaptive inertia and competition mechanism is established in the CA model, which can effectively deal with the complexity and uncertainty among the intercon-version of different land use types from regional to national scales. The GeoSOS-FLUS model is currently broadly utilized in land use simulation [27], urban expansion simulation [28], and ecosystem services value [29]. In this study, we selected the Markov model combined with the GeoSOS-FLUS to simulate the LUCC in Xiamen.
The contribution of the paper is twofold. Firstly, most previous studies focused on larger-scale regional land use simulation and land use conflict assessment, while this study attempted to provide a reference for policy makers to develop future urban land planning layouts through case studies at the city level. Secondly, this paper simulated future land use conflicts based on different development goals such as cropland protection and ecological civilization construction, which can complement the analysis of the historical status of land use and supplement the planning that mostly is limited to the analysis of the current situation.
This study first assessed the historical land use dynamics during the period of 2010–2020 and simulated future land use trends in Xiamen, China using the Markov and the GeoSOS-FLUS model under three future scenarios: the natural development scenario (NDS), the policy intervention scenario (PIS), and the sustainable development scenario (SDS). Next, a comprehensive LUCs index measurement model was built based on the landscape pattern to analyze the differences in conflict levels and changing characteristics of the LUCC under the future scenarios. This study can provide support for land use management and ecological city construction in Xiamen and can be expanded to other regions in China.
2. Methods
2.1. Study Area
Xiamen is one of the special economic zones of China, and the central city of the Fujian region. It is located in the southeast of Fujian Province (117°53’–118°26’ E, 24°23’–24°54’ N) and consists of Xiamen Island and other islands and land areas, including six municipal districts (Figure 1). The area of Xiamen is approximately 1700.61 km2. It has a subtropical maritime monsoon climate. Xiamen has experienced a rapid urbanization since the 1990s. The permanent population of Xiamen has increased from 3.56 to 5.18 million, while the GDP has increased from RMB 205.37 to 638.40 billion for the period of 2010–2020. The urbanization rate increased from 88.33 to 89.41%, ranking it first in the Fujian province, which is higher than that of Shanghai and Beijing. The rapid urbanization process has brought substantial land use change, resulting in a structural and functional imbalance of ecosystem services in Xiamen. The excessive urbanization is incompatible with the sustainable development that Xiamen needs [30].
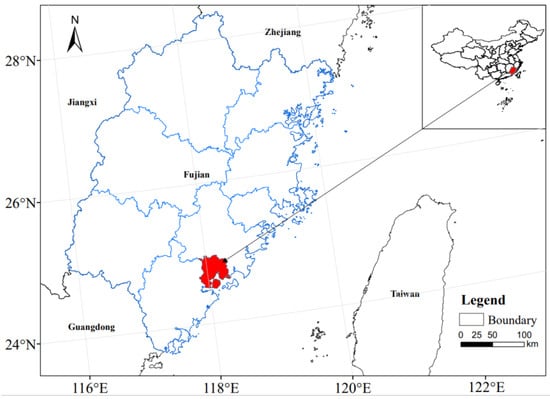
Figure 1.
Location of the study area.
2.2. Data Resources
The datasets used in the study are presented in Table 1, including the land use data, meteorological data, and traffic data.

Table 1.
Datasets used in the study.
2.3. LUCC Classification
Land use data in 2010, 2015, and 2020 were obtained from the global land cover data set developed by the European Aviation Agency. The raw data were taken from the Envisat satellite and photographed by the Medium Resolution Imaging Spectrometer (MERIS) sensor. The dataset provides global maps describing the land surface into 22 classes, which have been defined using the United Nations Food and Agriculture Organization’s (FAO) Land Cover Classification System (LCCS). The dataset can be used to study land cover trends, ecosystems, and climate change [31]. Based on the FAO-LCCS, we used the Reclassify tool with the support of ArcGis 10.8 software to integrate the original 22 land cover categories into cropland, forest, grassland, wetland, building land, and other land.
2.4. Methods
2.4.1. Scenario Design
Based on the historical land use trends and the 14th Five-year Construction of Ecological Civilization Plan in Xiamen, three future land use development scenarios were designed in this study.
- (1)
- The NDS
This scenario was designed based on the natural development in which the LUCC keeps pace with the historical trend from 2010 to 2020, and is affected by natural and human factors in Xiamen. Under this scenario, neither restrictions on mutual conversion of various types of land, nor policy planning constraints were considered. The Markov model was used to predict the area of each land use type in the future, which can be used as the scale demand parameter in the GeoSOS-FLUS model and was the basis for other scenarios.
- (2)
- The PIS
According to the Overall Plan for Land Utilization in Xiamen (2006–2020) and the 14th Five-year Agriculture and Rural Development Special Plan in Xiamen, the basic cropland protection area would remain at 88.67 km2 and the area of high-standard cropland would reach 10.67 km2 during the 14th Five-year Plan period. The scenario was designed based on the NDS and the two above plans, which aims to optimize the agricultural industry structure and spatial layout, and to promote urban modern agriculture development. Under this scenario, the permanent basic cropland protection areas and urban agricultural concentrated areas cannot be converted into other land use types. In the meantime, the Markov transition probability matrix is revised, and the probability of converting cropland into construction land is controlled at 10% in accordance with a study from the literature [32]. The transition probabilities of grassland and other land transfer to cropland is set 10% higher than the original values and cropland protection will be strictly implemented.
- (3)
- The SDS
This scenario considers the harmonious development between city development and ecosystem protection, aiming to achieve a high-quality spatial development in Xiamen. The scenario is also designed based on the natural development scenario. Under the scenario, the ecological protection red line restricted area cannot be converted into other land use types. The total probability of conversion of forest to other types decreased by 10%, the probability of conversion of cropland and construction land to forest increased by 10%, and the probability of the conversion of grassland and other land to forest increased by 50%.
2.4.2. The Markov Model
The Markov model is a dynamic random model that can calculate the conversion ratio among different land use types and predict future trends [33]. This study used the Markov model to simulate the future land use demands in 2030.
Firstly, we generated a transfer probability matrix of land use type for the period of 2010–2015 and 2015–2020 using the Markov model based on land use data in 2010, 2015, and 2020. The land use demand of Xiamen in 2030 under the natural development scenario was predicted based on land use in 2020 and the conversion probability of different land use types. To improve the simulation accuracy and eliminate possible deviation in long-term simulations, the demand for each land use type in 2025 and 2030 was predicted successively with an interval of five years. Finally, we obtained the trend of spatial land use changes in Xiamen under different scenarios.
2.4.3. The GeoSOS-FLUS Model
The GeoSOS-FLUS model is derived from the cellular automata (CA), with an integration with the artificial neural network (ANN) and system dynamic model (SD), and therefore has a higher simulation accuracy compared to other traditional models such as CLUE-S [26,34].
The study first used the embedded ANN to integrate all the selected human activities and natural driving factors, and to calculate the occurrence probability of various land types on each unit pixel. The sampling mode of training samples obtained by the ANN was set as the random sampling mode, and the values of the 13 driving factors were normalized. The suitability probability image for each land use type was calculated as follows:
where is the suitability probability of the kth land use type on grid and time ; is the adaptive weight between the hidden layer and the output layer; and is in the hidden layer, the signal received by neuron from all input neurons on grid cell at time .
The probability of land use conversion also depends on the weights of the neighborhood factors and adaptive inertia competition mechanism. The neighborhood impact factors, which can reflect the interactions between different land use types, were set based on a previous study [35]. As shown in Table 2.
Table 2.
The neighborhood factor parameters of the GeoSOS-FLUS model.
During the iterative process, the inertia coefficients for different types of land were determined according to the adaptive adjustment of the gap between their current area and the future demand. Next, the conversion cost matrix was designed for each of the scenario. Considering it is difficult to convert water to other land use types, it was set as a restricted area in future land use scenarios. In addition, the permanent basic cropland protection area in the policy intervention scenario and ecological the red line protection area in the sustainable development scenario were used as restricted areas. Finally, the CA was used to simulate the spatial layout of land use based on the newly generated conversion probability of different land use types.
2.4.4. Land Use Conflicts Model
Referring to previous studies [10,14], this study combined the ecological risk assessment conceptual model and landscape ecological index to build a LUCs model. The model not only describes the landscape spatial pattern, but also reveals regional ecological risks [36]. The LUCs model can be represented as follows:
where is the land use conflicts, is the external pressure, is the vulnerability, and is the stability. Three indicators of land use disturbance (external pressure), vulnerability, and stability were selected for measuring the intensity of LUCs in Xiamen [37,38].
- (1)
- Land use disturbance index (LUDI)
LUDI reflects the external pressure on the land system and can be considered as the risk source of LUCs. The area-weighted mean patch fractal dimension (AWMPFD) was chosen to calculate the LUDI. It is an index to represent the spatial complexity of the landscape patches and the interference degree of neighborhood landscapes on the current land use [39]. The larger the number of fractal dimension is, the more complex the landscape patch boundary is, and the greater the chance of interference from neighbors. The AWMPFD value ranges from 1 to 2. The formula is as follows:
where is the perimeter of the patch, is the area of the patch, and is the total area of the landscape.
- (2)
- Land use vulnerability index (LUVI)
LUVI reflects the exposure level of risk receptors (different land use types) while facing external pressure. According to the research results of relevant scholars [40,41], and combined with the situation of the research area, the vulnerability indices of construction land, unused land, water, cropland, grassland, and forest to be 6, 5, 4, 3, 2, and 1, respectively. The formula is as follows:
where is the area of land use type ; is the overall area of the land system; is the ecological risk coefficient of land use type ; and is the number of land use types.
- (3)
- Land use stability index (LUSI)
LUSI reflects the stability of land resources, which is a response indicator of LUCs and represents the risk effect of land use. LUCs will affect the regional landscape pattern, resulting in fragmentation of the regional landscape patches. Patch density (PD) can reflect the degree of landscape fragmentation in the region [38]. The larger the PD value is, the higher the degree of spatial fragmentation in the region is, and the lower the regional biodiversity and ecosystem stability. Finally, the PD value was normalized to between 0 and 1 and the opposite number was taken to obtain the risk effect value. The formula is as follows:
In Formula (5), is the number of patches of land use type .
We used the Moving Window function in Fragstats 4.2 to calculate landscape indices. The values of the three indices were linearly normalized to the (0, 1) norm for subsequent calculation of the LUCs. The LUCs were classified into four grades: stable and controllable (0.0, 0.35), mild conflict (0.35, 0.7), moderate conflict (0.7, 0.9), and intense conflict (0.9, 1). The higher the value is, the stronger the regional LUCs are.
2.4.5. Model Validation
In this study, the Kappa coefficient was used to evaluate the simulation accuracy of the GeoSOS-FLUS model. It is an index to test the difference between two images and ranges between −1 and 1, where +1 indicates perfect agreement and values of zero or less indicate a performance no better than random [42]. The mathematical operator is as follows:
where is the probability of correct simulation; is the probability of prediction simulation; and is the probability of ideal simulation.
The Markov and the GeoSOS-FLUS model were used to predict the scale of each type of land in Xiamen in 2020 (Figure 2). The overall accuracy and kappa coefficient were calculated by comparing the simulation results with the actual land use data in 2020. The calculation shows that the overall accuracy of this simulation is 0.93 and the Kappa coefficient is 0.89, indicating that the Markov and the GeoSOS-FLUS model have good applicability in Xiamen’s LUCC simulation, therefore it can be used to simulate the multi-scenario LUCC in 2030.
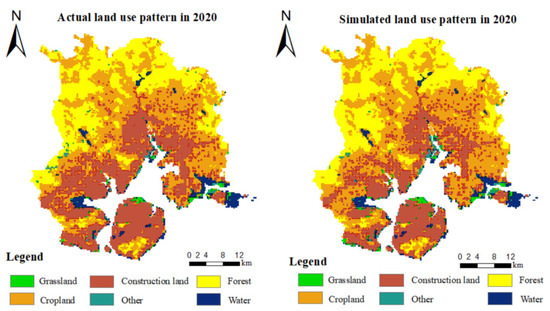
Figure 2.
Actual and simulated land use map for the year of 2020.
3. Results
3.1. LUCC from 2010 to 2020
The land cover maps of Xiamen in 2010, 2015, and 2020 are shown in Figure 3. In 2020, cropland accounted for the largest proportion of area, followed by the construction land, forest, and water in Xiamen (Table 3). From 2010 to 2020, the area of construction land had an upward trend, while the area of forest and grassland showed a trend first upward and then downward. The area of cropland and other had experienced a continuous process of decreasing.
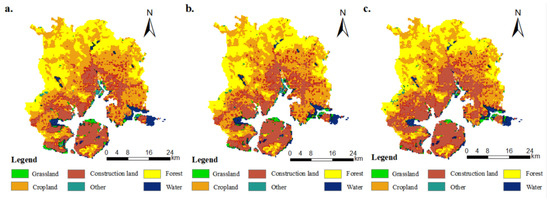
Figure 3.
Land cover map of Xiamen in 2010 to 2020: (a) 2010; (b) 2015; and (c) 2020.
Table 3.
LUCC in Xiamen from 2010 to 2020 (unit: km2).
According to the land use transition matrix from 2010 to 2020, the area of construction land had a large increase in Xiamen, up to 108.99 km2 (Table 4). In the meantime, Xiamen also experienced a rapid cropland decrease (84.96 km2). The lost cropland was mainly converted into construction land, distributed in the Haicang, Jimei, Tongan, and Xiang ‘an districts (Figure 3).
Table 4.
Land use conversion in Xiamen from 2010 to 2020 (unit: km2).
3.2. Distribution Characteristics of Future Land Cover under Different Scenarios
This study performed the LUCC simulation for the period of 2020–2030 under the three different scenarios. Results show that the spatial land use pattern of Xiamen in 2030 differs greatly under the different scenarios (Figure 4). Under the NDS, the trend of changes in land use/cover from 2020 to 2030 is similar as that during 2010–2020. Cropland, forest, grassland, and other ecological protection lands are threatened by human activities. The area of construction land increases by 144.84 km2 (Table 5), with an annual average growth rate of 3.04%. A large area of cropland is converted into construction land. Under the PIS, the extension of construction land has been effectively controlled and the area of cropland has a large increase up to 67 km2. Under the SDS, the environmental protection has reached a higher level. Both forest and grassland have relatively high increases in area (7.37% and 23.87%). The area of cropland slightly increases compared to that in 2020.
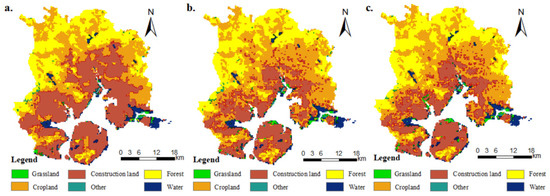
Figure 4.
Three scenario simulation results in 2030: (a) NDS; (b) PIS; and (c) SDS.
Table 5.
Multi-scenario simulation of land use type change in 2030.
3.3. Land Use Conflicts Status
3.3.1. Component Index Analysis of LUCs under Different Scenarios
Land Use Disturbance Index (LUDI)
Compared with 2020, the LUDI in 2030 differs greatly among the three scenarios (Figure 5). Under the PIS, Xiamen has more land use patches with a high value of the LUDI, followed by the NDS and SDS (Figure 5c). Under the NDS, the LUDI values of forest land and construction land are low, and the high value areas are primarily concentrated in cropland and grassland (Figure 5b). The spatial characteristics of the LUDI under the NDS show that forest land and construction land in the study area are less disturbed. In contrast, the cropland and grassland in the Tongan, Jimei, Haicang, and Siming districts were substantially disturbed. Under the PIS, the value of the disturbance index is higher for cropland, grassland, and construction land, and lower for forest land and water, indicating that construction land and cropland in Xiamen are greatly disturbed, while forest land in Huli District and Tongan District is less disturbed (Figure 5c). Under the SDS, the higher value areas are primarily located in cropland and construction land, while the lower value areas are mainly located in forest, grassland, and water, which shows that the woodland, grassland, and water in the study area are less disturbed, while cropland and construction land in the Jimei, Haicang, and Tongan districts are more disturbed (Figure 5d).
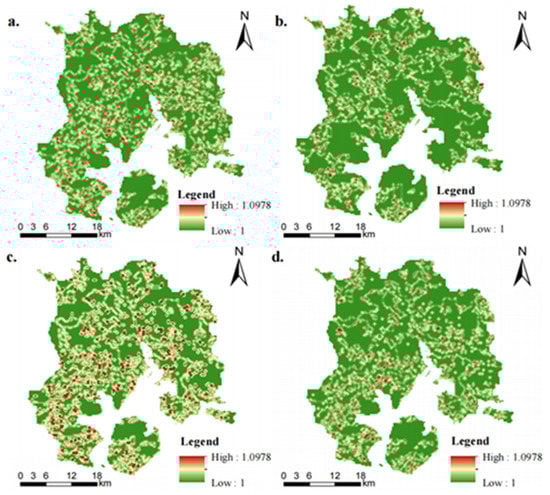
Figure 5.
Land use disturbance index distribution in 2020 and 2030: (a) 2020; (b) NDS; (c) PIS; and (d) SDS.
Land Use Vulnerability Index Distribution (LUVI)
The distribution of LUVI in Xiamen in 2020 and 2030 in the three scenarios is shown in Figure 6. Under the SDS, the ability of the regional landscape to resist risks is the strongest, and the ecological function of land is not easy to lose, followed by the PIS and NDS (Figure 6d). Compared with 2020, land use in Xiamen under the NDS is more vulnerable, indicating that the external pressures, rapid development of cities, and the extension of construction land may lead to the fragility of the land’s ecological function. Figure 6b also shows that land use types with a lower vulnerability are mainly water and grassland in Xiamen under the NDS, indicating that its land ecological function is easily changed. In the PIS, the land use types with high value LUVI are forest and cropland, indicating that the regional landscape in this scenario is less disturbed by the external pressures and has a strong ability to resist the risks. In the SDS, the areas with high value of the LUVI are the largest, which indicates that the regional landscape is more resilient to risks, and the landscape security is also increased (Figure 6d), which may be caused by the implementation of strict ecological protection in this scenario.
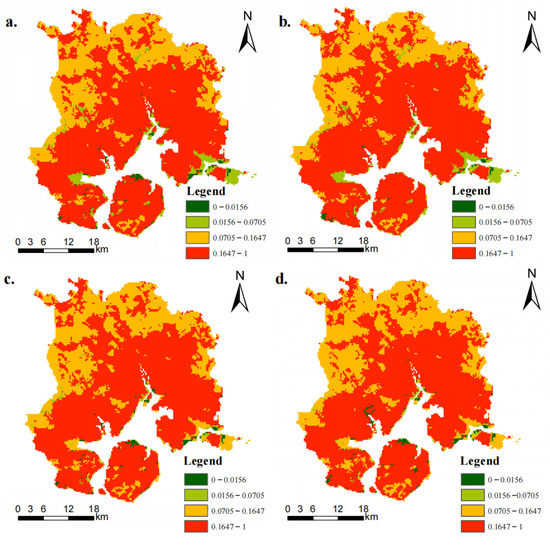
Figure 6.
Land use vulnerability index distribution in 2020 and 2030: (a) 2020; (b) NDS; (c) PIS; and (d) SDS.
Land Use Stability Index (LUSI)
The results show that the visible difference of the distribution of LUSI in Xiamen in 2030 under three scenarios (Figure 7). Compared with the NDS and SDS, the area with high value LUSI and landscape fragmentation degree were the largest in the PIS. The areas with high-value LUSI in the NDS in 2030 are mainly found in grassland, cropland, and water patches, while the areas with low value LUSI are mainly found in construction land and forest patches. The results show that the greater the fragmentation of grassland, cropland, and water in the study area, the lower the stability of the ecosystem. In the PIS, the LUSI changes sharply, and the high value areas are primarily distributed in the cropland, forest, grassland, and construction land patches, indicating that land use pattern is not stable and the landscape fragmentation is obvious in the PIS (Figure 7c). In the SDS, the area with low value LUSI increases compared with 2020, mainly distributed in the construction land, forest, cropland, and water patches, indicating that the landscape fragmentation is smaller and the regional ecosystem stability is higher in this scenario (Figure 7d).
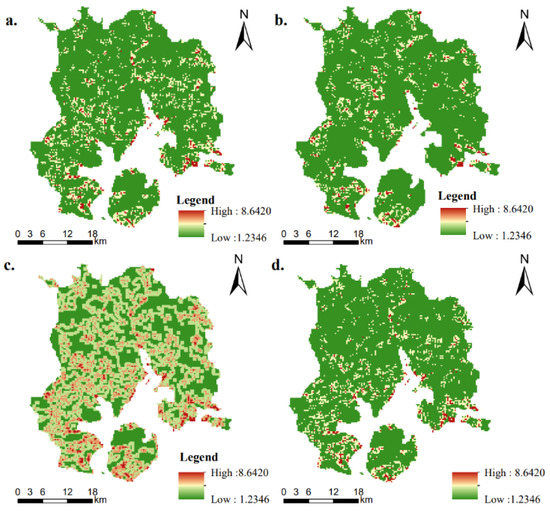
Figure 7.
Land use stability index distribution in 2020 and 2030: (a) 2020; (b) NDS; (c) PIS; and (d) SDS.
3.3.2. Distribution Characteristics of LUCs under Different Scenarios
Table 6 and Figure 8 show that the extent of LUCs under the NDS is much higher than that under the PIS and SDS, indicating the land use strategies under the PIS and SDS can effectively mitigate the LUCs in Xiamen.
Table 6.
The calculated result of LUCs indexes in Xiamen in 2020 and 2030.
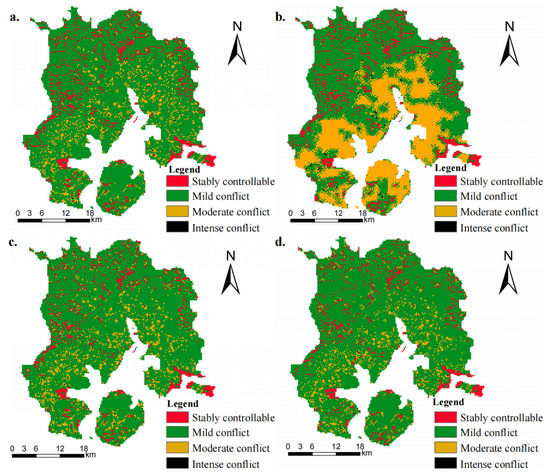
Figure 8.
Spatial distribution of LUCs in 2020 and 2030: (a) 2020; (b) NDS; (c) PIS; and (d) SDS.
The spatial distribution of the integrated LUCs index in Xiamen in 2020 has the following characteristics: the main type of LUCs is mild conflict, with an area of about 1188.45 km2, accounting for 83.55% of the total area. Mild conflict areas are mainly distributed in the forest and cropland areas, with less interference from human activities, strong landscape continuity, and low conflict intensity. Areas with higher conflict index are relatively concentrated in the construction land, these are highly populated areas with developed economy and strong demand for land use.
Table 6 showed that the area of regions with mild conflict is 828.99 km2 under the NDS, accounting for 58.28% of the total area, which is lower than that under the other two scenarios. However, the areas that are stable and controllable or experiencing moderate conflict and intense conflict under the NDS are larger than those under the PIS and SDS. The area of moderate conflict was 462.15 km2, which increased sharply to 32.49% compared with 2020, mostly concentrated in the construction land area, and the area of stable and controllable was 127.53 km2, mainly distributed in the forest area at high altitude or water. This may be because the LUCC under the NDS is not subject to external interference and constraints, which leads to the rapid conversion of large amounts of cropland and forest into construction land based on the previous development trend. The proportion of construction land increases significantly, thus leading to the sprawl and expansion of the moderate conflict areas. Especially in the Jimei, Huli, and Xiangan districts, the moderate conflict areas show an agglomeration and continuous expansion trend. The PIS and SDS have a more stable and moderate land use pattern and conflict level in comparison to the NDS.
The overall conflict trend under the PIS in 2030 is like that in 2020 (Figure 8c), but the area of the mild conflict regions (1181.52 km2) is smaller than that in 2020. Compared with the NDS, moderate conflict and intense conflict areas under the PIS both decreased (132.66 and 1.53 km2), accounting for 9.33% and 0.11%, respectively. The strict protection of cropland under the PIS has restricted the uncontrolled extension of construction land, as well as encouraged other types of land to convert into cropland. Therefore, the area of cropland under the PIS is the largest in comparison to that under the other two scenarios.
Under the SDS, the intense conflict, moderate conflict, and stable and controllable areas occupy the smallest area of the three scenarios (Figure 8d). A series of strict ecological protection regulations were designed for the SDS, focusing more on the coordination of natural ecology and socio-economics, and effectively mitigating the extent of regional LUCs by restraining the extension of non-ecological land uses such as construction land. In addition, the areas of moderate conflicts are concentrated in urban built-up areas, which are important places for human economic activities, and the extension of construction land may lead to a definite diffusion effect of LUCs.
Our study showed that the LUCs model based on landscape pattern can precisely depict the evolution pattern of LUCs and predict the potential risk of land use in Xiamen. However, the LUCs model can only reflect the degree of LUCs of various land use types, but cannot analyze the internal mechanism that cause conflicts, identify potential conflict areas, and comprehensively diagnose the intensity of land use conflicts in the regional area. In addition, LUCs are measured only based on the perspective of landscape pattern, which lacks consideration of economic and social factors. Therefore, in the process of identifying future LUCs, combining the qualitative and quantitative methods such as participatory surveys and 3S technology is an important direction to optimize LUCs research.
4. Discussion
This study simulated future LUCC under three different development scenarios based on the Markov and the GeoSOS-FLUS model, and analyzed the spatio-temporal characteristics of LUCs in Xiamen by using the LUCs model. The study showed that the LUCs model based on landscape pattern can precisely depict the evolution pattern of LUCs and predict the potential risk of land use in Xiamen. The simulation results can provide support for the implementation of territorial spatial planning, optimization of “three lines” demarcation results, implementation of food security control, and construction of an ecological security early warning system, and also contribute to regional land management and land protection.
With the rapid growth of population and high-speed economic development, construction land is constantly encroaching on arable land, forest land, and other ecological land, and the conflicts between development and protection occurs frequently. Fan, et al. [43] concluded that about 3.2% of the land area in China has a high or relatively high urbanization function, mainly concentrated in the eastern coastal region and the middle and lower reaches of the Yangtze River. Land use changes in these regions are likely to face the same situation as Xiamen. Therefore, the model framework constructed in this study can also be used for simulating future land use changes in other regions. The “win-win” development pattern is not only applicable to Xiamen, but also can provide important references for the sustainable development of other cities and countries with a high degree of urbanization.
LUCs are inevitable due to land resources scarcity and the unlimited growth of human demand [44]. The results of this study show that the intensity of LUCs has an overall upwards trend, and human activities play a major role in the process. In this circumstance, a better understanding of land use conflicts is needed. Therefore, we constructed a LUCs model, and successfully identified current and potential land use conflicts in Xiamen. In addition, we integrated various strategic land use plannings (for example, the Overall Plan for Land Utilization in Xiamen, the 14th Five-year Construction of Ecological Civilization Plan in Xiamen, and the 14th Five-year Agriculture and Rural Development Special Plan in Xiamen), and designed three future land use development scenarios. LUCs in Xiamen differ greatly under the three scenarios in 2030. The strategies under the SDS can balance the land use needs of both socio-economic development and regional ecological security with the least LUCs, which could be an optimum solution for the long-term sustainable development in Xiamen.
Although the research results fit the development situation of regional land use well, there are still some limitations: (1) The LUCs model can only reflect the degree of LUCs of various land use types, but cannot accurately reflect the specific geographic location of conflicts. In addition, LUCs are measured only based on the perspective of landscape pattern, which lacks consideration of economic and social factors. Therefore, in the process of identifying future LUCs, combining the qualitative and quantitative methods such as participatory surveys and 3S technology is an important direction to optimize LUCs research. (2) The classification of the conflict levels and model parameters in this study were mainly adopted from previous research experience, which creates difficulty when avoiding the errors caused by subjective factors. Hence, our future research will focus on how to improve the accuracy of the research results. In addition, this paper also lacks comparison with other models. These need to be further studied in the follow-up.
5. Conclusions
The study simulated future LUCC under three different development scenarios, and assessed the spatio-temporal evolution of LUCs in Xiamen. Results indicated that land use/cover in Xiamen has remarkably changed. Cropland area decreased by 84.96 km2, while construction land increased by 108.99 km2 in Xiamen from 2010 to 2020. Most of the expansion of the area of construction land comes from the occupation of the area of cropland. LUCs in Xiamen differ greatly under the three scenarios in 2030. Under the NDS, the rapid urbanization process continuing the previous development trend has led to changes in various land use types, with a reduced area of cropland and an expanded area of construction land. The area of moderate conflict reached 462.15 km2, the area of intense conflict reached 3.78 km2, and the intensity of LUCs showed an overall upward trend. In the PIS, considering the protection of cropland, construction land expansion has been slowed down, and there is a small growth in grassland. The degree of LUCs is moderate compared with the NDS, and is mainly concentrated on two levels of moderate conflict and mild conflict. The moderate conflict area decreased by 23.16% compared with that under the NDS. Under the SDS, due to the balance of economic development and ecological benefits, the vegetation cover in Xiamen was considerably increased, forest and grassland reached the highest level, and the area of both moderate conflict and intense conflict reached the lowest among the three scenarios. The SDS balances the land use needs of both social and economic development and regional ecological security with the least LUCs, which could be an optimum solution for the long-term sustainable development in Xiamen. The results of this study provide support for decisions about eco-city construction and geospatial planning.
Author Contributions
Conceptualization, M.Z. and D.Y.; methodology, M.Z. and X.L.; software, M.Z. and D.Y.; validation, M.Z. and D.Y.; writing—original draft preparation, M.Z.; writing—review and editing, M.Z. and D.Y.; supervision, X.L. All authors have read and agreed to the published version of the manuscript.
Funding
This research was funded by [Chinese Academy of Sciences] grant number [132C35KYSB20200007] and [The Soft Science Research Project of Henan Province] grant number [212400410077].
Data Availability Statement
Not applicable.
Conflicts of Interest
The authors declare no conflict of interest.
References
- Hu, Y.; Batunacun; Zhen, L.; Zhuang, D. Assessment of Land-Use and Land-Cover Change in Guangxi, China. Sci. Rep. 2019, 9, 2189. [Google Scholar] [CrossRef] [PubMed]
- Lin, L.; You, T.; Liu, J.; Chen, Y.; Huang, J.; Kuang, K.; Lu, C. Land use changes and driving forces in Xiamen City from 1985 to 2015. J. Fujian Agric. For. Univ. (Nat. Sci. Ed.) 2019, 48, 103–110. [Google Scholar] [CrossRef]
- Jiang, S.; Meng, J. Process of land use conflict research: Contents and methods. Arid. Arid. Arid. Land Geogr. 2021, 44, 807–818. [Google Scholar]
- Yu, B.; Lv, C. The Progress and Prospect of Land Use Conflicts. Prog. Prog. Prog. Geogr. 2006, 25, 3. [Google Scholar] [CrossRef]
- Zou, L.; Liu, Y.; Wang, Y. Research progress and prospect of land-use conflicts in China. Prog. Geogr. 2020, 39, 298–309. [Google Scholar] [CrossRef]
- Wang, J.; Yu, D.; Lu, Y.; Zhang, T.; Zheng, Y. Recognition and analysis of land use conflicts at county level based on “Production-Living-Ecological” suitability. J. Nat. Resour. 2021, 36, 1238–1251. [Google Scholar] [CrossRef]
- Ruan, S.; Wu, K. Research of the Land Use Conflict and Mitigation Mechanism During the Urbanization in China. China Popul. Resour. Environ. 2013, 23, 388–392. [Google Scholar]
- Wang, A.; Ma, X.; Yan, X. Land Use Conflicts and Their Governance Mechanics on Actors Network Theory: A Case of Fruit Tree Protection Zone of Haizhu District, Guangzhou City. Sci. Geogr. Sin. 2010, 30, 80–85. [Google Scholar]
- Orr, A.; Mwale, B. Adapting to Adjustment: Smallholder Livelihood Strategies in Southern Malawi. World Dev. 2001, 29, 1325–1343. [Google Scholar] [CrossRef]
- Meng, J.; Jiang, S.; Laba, Z.; Zhang, W. The Spatial and Temporal Analysis of Land Use Conflict in the Middle Reaches of the Heihe River Based on Landscape Pattern. Sci. Geogr. Sin. 2020, 40, 1553–1562. [Google Scholar] [CrossRef]
- Zhang, X.; Gu, R. Spatio-temporal pattern and multi-scenario simulation of land use conflict: A case study of the Yangtze River Delta urban agglomeration. Geogr. Res. 2022, 41, 1311–1326. [Google Scholar] [CrossRef]
- Kuusaana, E.D.; Bukari, K.N. Land conflicts between smallholders and Fulani pastoralists in Ghana: Evidence from the Asante Akim North District (AAND). J. Rural Stud. 2015, 42, 52–62. [Google Scholar] [CrossRef]
- Steinhäußera, R.; Sieberta, R.; Steinführerb, A.; Hellmich, M. National and regional land-use conflicts in Germany from the perspective of stakeholders. Land Use Policy 2015, 49, 183–194. [Google Scholar] [CrossRef]
- Peng, J.; Zhou, G.; Tang, C.; He, Y. The Analysis of Spatial Conflict Measurement in Fast Urbanization Region Based on Ecological Security—A Case Study of Changsha Zhuzhou Xiangtan Urban Agglomeration. J. Nat. Resour. 2012, 27, 1507–1519. [Google Scholar] [CrossRef]
- Nourqolipour, R.; Shariff, A.R.B.M.; Balasundram, S.K.; Ahmad, N.B.; Sood, A.M.; Amiri, T.B.F. A GIS-based model to analyze the spatial and temporal development of oil palm land use in Kuala Langat district, Malaysia. Environ. Earth Sci. 2015, 73, 1687–1700. [Google Scholar] [CrossRef]
- Wu, Q.; Li, H.; Wang, R.; Paulussen, J.; He, Y.; Wang, M.; Wang, B.; Wang, Z. Monitoring and predicting land use change in Beijing using remote sensing and GIS. Landsc. Urban Plan. 2006, 78, 322–333. [Google Scholar] [CrossRef]
- Tian, H.; Liang, X.; Li, X.; Liu, X.; Ou, J.; Hong, Y.; He, Z. Simulating Multiple Land Use Scenarios in China during 2010-2050 Based on System Dynamic Model. Trop. Geogr. 2017, 37, 547–561. [Google Scholar] [CrossRef]
- Li, X.; Liu, X. Case-based Cellular Automaton for Simulating Urban Development in a Large Complex Region. Acta Geogr. Sin. 2007, 62, 1596–1603. [Google Scholar] [CrossRef]
- Zeng, Y.; Jin, W.; Wang, H.; Zhang, H. Simulation of land-use changes and landscape ecological assessment in eastern part of Qinghai Plateau. Trans. Chin. Soc. Agric. Eng. 2014, 30, 185–194. [Google Scholar] [CrossRef]
- Portela, R.; Rademacher, I. A dynamic model of patterns of deforestation and their effect on the ability of the Brazilian Amazonia to provide ecosystem services. Ecol. Model. 2001, 143, 115–146. [Google Scholar] [CrossRef]
- Lu, R.; Huang, X.; Zuo, T.; Xiao, S.; Zhao, X.; Zhang, X. Land Use Scenarios Simulation Based on CLUE -S and Markov Composite Model. Sci. Geogr. Sin. 2009, 29, 577–581. [Google Scholar] [CrossRef]
- Liang, Y.; Xu, Z.; Zhang, F. Land use scenario analyses by based on system dynamic model and CLUE-S model at regional scal: A case study of Ganzhou district of Zhangye city. Geogr. Geogr. Res. 2011, 30, 564–576. [Google Scholar] [CrossRef]
- Mas, J.-F.; Kolb, M.; Paegelow, M.; Camacho Olmedo, M.T.; Houet, T. Inductive pattern-based land use/cover change models: A comparison of four software packages. Environ. Model. Softw. 2014, 51, 94–111. [Google Scholar] [CrossRef]
- Ward, D.P.; Murray, A.T.; Phinn, S.R. A stochastically constrained cellular model of urban growth. Comput. Environ. Urban Syst. 2000, 24, 539–558. [Google Scholar] [CrossRef]
- Liu, J.; Hu, T.; Pan, X.; Zhang, D.; Zhang, L.; Li, Y. Simulating coastal wetland changes in Hangzhou bay using Markov-CLUES coupling model. Ecol. Environ. Sci. 2018, 27, 1359–1368. [Google Scholar] [CrossRef]
- Liu, X.; Liang, X.; Li, X.; Xu, X.; Ou, J.; Chen, Y.; Li, S.; Wang, S.; Pei, F. A future land use simulation model (FLUS) for simulating multiple land use scenarios by coupling human and natural effects. Landsc. Urban Plan. 2017, 168, 94–116. [Google Scholar] [CrossRef]
- Xu, H.; Song, Y.; Tian, Y. Simulation of land-use pattern evolution in hilly mountainous areas of North China: A case study in Jincheng. Land Use Policy 2022, 112, 105826. [Google Scholar] [CrossRef]
- Feng, D.; Bao, W.; Fu, M.; Zhang, M.; Sun, Y. Current and Future Land Use Characters of a National Central City in Eco-Fragile Region—A Case Study in Xi’an City Based on FLUS Model. Land 2021, 10, 286. [Google Scholar] [CrossRef]
- Lin, M.; Liu, H.; Zhou, R.; Gong, J. Evaluation and trade-offs of ecosystem services in Guangdong-Hong Kong-Macao Greater Bay Area under multi-scenario simulation. Geogr. Geogr. Res. 2021, 40, 2657–2669. [Google Scholar] [CrossRef]
- Liang, C.; Zeng, J.; Wang, Q. Spatial pattern analysis and management of urban ecosystem services under rapid urbanization: A case study of Xiamen City. Acta Ecol. Sin. 2021, 41, 90–96. [Google Scholar] [CrossRef]
- Arino, O.; Bicheron, P.; Achard, F.; Latham, J.; Weber, J.L. GLOBCOVER: The most detailed portrait of Earth. Esa Bull. Bull. Ase. Eur. Space Agency 2008, 2008, 24–31. [Google Scholar]
- Yang, Y.; Bao, W.; Liu, Y. Scenario simulation of land system change in the Beijing-Tianjin-Hebei region. Land Use Policy 2020, 96, 104677. [Google Scholar] [CrossRef]
- Ibarra-Bonilla, J.S.V.-G.; Prieto-Amparán, J.A.F.; Santellano-Estrada, E.; Pinedo-Alvarez, A. Characterizing the impact of Land-Use/Land-Cover changes on a Temperate Forest using the Markov model. Egypt. J. Remote Sens. Space Sci. 2021, 24, 1013–1022. [Google Scholar] [CrossRef]
- Li, X.; Li, D.; Liu, X. Geographical Simulation and Optimization System (GeoSOS) and Its Application in the Analysis of Geographic National Conditions. Acta Geod. Et Cartogr. Sin. 2017, 46, 1598. [Google Scholar] [CrossRef]
- Guo, H.; Cai, Y.; Yang, Z.; Zhu, Z.; Ouyang, Y. Dynamic simulation of coastal wetlands for Guangdong-Hong Kong-Macao Greater Bay area based on multi-temporal Landsat images and FLUS model. Ecol. Indic. 2021, 125, 107559. [Google Scholar] [CrossRef]
- Zhou, D.; Lin, Z.; Lim, S.H. Spatial characteristics and risk factor identification for land use spatial conflicts in a rapid urbanization region in China. Environ. Monit. Assess. 2019, 191, 677. [Google Scholar] [CrossRef]
- Zhang, Y.; Li, Y.; Lv, J.; Wang, J.; Wu, Y. Scenario simulation of ecological risk based on land use/cover change – A case study of the Jinghe county, China. Ecol. Indic. 2021, 131, 108176. [Google Scholar] [CrossRef]
- Wang; Wu, Z.; Wang, J.; Yin, H.; Li, B. Study on Spatial Conflict of “Production-Living-Ecological” Land in Oasis Cities in Arid Area. Bull. Soil Water Conserv. 2022, 42, 330–337. [Google Scholar] [CrossRef]
- Wu, M.; Zhou, F.; Cheng, J. Spatial conflict measurement in rapid urbanization areas from the perspective of ecosystem services. China Popul. Resour. Environ. 2021, 31, 125466. [Google Scholar]
- Zuo, Q.; Zhou, Y.; Wang, L.; Li, Q.; Liu, J. Impacts of future land use changes on land use conflicts based on multiple scenarios in the central mountain region, China. Ecol. Indic. 2022, 137, 108743. [Google Scholar] [CrossRef]
- Qiu, G.; Niu, Q.; Wu, Z.; Guo, S.; Qin, L.; Wang, Y. Spatial Evaluate and Heterogeneity Analysis of Land Use Conflict in Su-Xi-Chang Urban Agglomeration. Res. Soil Water Conserv. 2022, 29, 5936. [Google Scholar] [CrossRef]
- Islam, S.; Li, Y.; Ma, M.; Chen, A.; Ge, Z. Simulation and Prediction of the Spatial Dynamics of Land Use Changes Modelling Through CLUE-S in the Southeastern Region of Bangladesh. J. Indian Soc. Remote Sens. 2021, 49, 2755–2777. [Google Scholar] [CrossRef]
- Fan, J.; Wang, Y.; Wang, C.; Chen, T.; Jin, F.; Zhang, W.; Li, L.; Xu, Y.; Dai, E.; Tao, A.; et al. Reshaping the Sustainable Geographical Pattern: A Major Function Zoning Model and Its Applications in China. Earth’s Future 2019, 7, 25–42. [Google Scholar] [CrossRef]
- Ma, W.; Jiang, G.; Chen, Y.; Qu, Y.; Zhou, T.; Li, W. How feasible is regional integration for reconciling land use conflicts across the urban–rural interface? Evidence from Beijing–Tianjin–Hebei metropolitan region in China. Land Use Policy 2020, 92, 104433. [Google Scholar] [CrossRef]
Disclaimer/Publisher’s Note: The statements, opinions and data contained in all publications are solely those of the individual author(s) and contributor(s) and not of MDPI and/or the editor(s). MDPI and/or the editor(s) disclaim responsibility for any injury to people or property resulting from any ideas, methods, instructions or products referred to in the content. |
© 2023 by the authors. Licensee MDPI, Basel, Switzerland. This article is an open access article distributed under the terms and conditions of the Creative Commons Attribution (CC BY) license (https://creativecommons.org/licenses/by/4.0/).