Article

Characterization of Ecosystem Services and Their Trade-Off and Synergistic Relationships under Different Land-Use Scenarios on the Loess Plateau

1
School of Earth Resources, China University of Geosciences (Wuhan), Wuhan 430074, China
2
Key Laboratory of Natural Resource Coupling Process and Effects, Ministry of Natural Resources of the People’s Republic of China, Beijing 100055, China
3
Urumqi Comprehensive Survey Center on Natural Resources, China Geological Survey, Urumqi 830099, China
4
Command Center of Natural Resource Comprehensive Survey, China Geological Survey, Beijing 100074, China
5
College of Geography and Remote Sensing Sciences, Xinjiang University, Urumqi 830046, China
*
Author to whom correspondence should be addressed.
These authors contributed equally to this work.
Land 2023, 12(12), 2087; https://doi.org/10.3390/land12122087
Submission received: 25 August 2023 / Revised: 11 November 2023 / Accepted: 14 November 2023 / Published: 21 November 2023

Abstract

:
The Loess Plateau is one of the most fragile ecological regions in China due to its shortage of water resources and severe soil erosion. The rapid development of urbanization and the implementation of the project of returning farmland to forest (grass) have caused the ecological environment of the region to be strongly impacted by human activities. It is necessary to investigate the spatial and temporal evolution characteristics of ecosystem services and trade-off/synergy relationships on the Loess Plateau, to achieve scientific management of ecological services and sustainable development of the region. This study quantitatively assesses three ecosystem services of water yield (WY), carbon storage (CS), and soil conservation (SC) on the Loess Plateau under different scenarios from 2000 to 2030 by using the InVEST and PLUS models. Further, the trade-off and synergistic relationships among the ecosystem services have been investigated by Spearman correlation analysis. The results showed that the land-use differences are more obvious under different policy scenarios, with a sharp expansion of constructed land, a gradual increase of forest land, and a continuous decrease of arable land in the Loess Plateau from 2000 to 2020; the water yield and soil conservation increase from 2000 to 2020, and the carbon storage shows an opposite trend. The soil conservation and carbon storage scenarios are the best under the ecological conservation scenario in 2030, while the water yield service is the best under the economic development scenario. There is a synergistic relationship between CS and SC, while there is a trade-off relationship between CS and WY. In addition, there are significant trade-off effects between SC and WY. These results can support guiding land-use management and ecological restoration.

1. Introduction

Ecosystem services (ESs) can be described as the environmental conditions and utilities formed and maintained by ecosystems that humans depend on for survival and development, directly and indirectly affecting human well-being [1,2]. In recent decades, rapid global population growth and socio-economic development have led to frequent human activities and increased demand for ecological services—seriously affecting current and future ES provision. According to the United Nations’ Ecosystem Assessment, over 60% of global ESs have been or are being degraded [3]. To effectively use ecosystems, numerous studies have been conducted both domestically and internationally to quantify and assess different types of ESs. Currently, the main models used to quantify and assess ESs are SoLVES (Social Values for Ecosystem Services) [4], ARIES (Artificial Intelligence for Ecosystem Services) [5], and InVEST (Integrated Valuation of Ecosystem Services And Tradeoffs) [6]. Among these models, the InVEST model has the characteristics of “refinement, quantification, and spatialization” and has become the most widely used ES assessment model to date [7,8]. In fact, ecosystem services are a complex whole with interconnections and interactions, and their interrelationships are complex and dynamic [9]. Ecosystem services are closely related to human well-being, so the assessment and optimization of the relationships between ecosystem services are becoming increasingly important. Relationships among ESs are usually expressed as trade-offs, synergies, and irrelevance [10]. For example, in the Ili River basin, China, there is a trade-off effect between carbon storage and nutrient export, whereas water yield and soil conservation are positively correlated with synergistic effects [11]. As another example, synergistic effects between biomass and food production have been observed in Wroclaw, Poland [12]. At present, most studies have focused on the “past-status” ecosystem service relationships, and there is a lack of research on multiple interactions between ESs in future scenarios.
Land-use and land-cover changes are important influences and direct manifestations of ecosystem service changes [13,14,15]. Therefore, the study of land-use change and its response to ecosystem services has become a current research hotspot. Considering the important role of land-use change on ecosystem services [16], scholars at home and abroad usually choose to set up different scenarios based on land-use change in their studies on scenario analysis of ecosystem services, which are used to carry out ecosystem service assessment and relationship analysis of future scenarios [17,18,19]. Currently, the more widely used land-use simulation models include SD [20], FLUS [21], ANN-CA [22], logistic-CA [23] and PLUS [24]. Most of the land-use simulation models are linear and numerical-based, which makes it difficult to cover all the processes of land-use change [25,26]. Compared to these models, the PLUS model can better portray the landscape pattern of different future scenarios. Several scenarios can be set up based on human preferences to reveal changes in ESs under different future land-use patterns, which are important for land-use decision-making and ecosystem management [27]. For example, Jian explored the spatial patterns and relationships of different ESs under four scenarios of “China’s Grain-for-Green Program” (GFGP) in northwest Yunnan [28]. Similarly, D.A. Shoemaker simulated the land use and ESs under different urban pattern scenarios in Charlotte, North America in 2030, and explored the trade-offs between urban patterns and ESs [29]. Gao designed four land-use/cover development scenarios and two climate change scenarios based on the FLUS model and the downscaling correction method, and evaluated water yield and soil erosion under different land–climate scenarios in the Sanjiangyuan region [30]. Currently, there are abundant research results related to trade-offs and synergistic relationships among ecosystem services. However, most of the studies on ecosystem service trade-offs and synergistic relationships under scenarios have used statistical methods such as Pearson’s correlation, Spearman’s correlation, and root-mean-square error [31,32,33], focusing on analyzing the trade-offs and synergistic relationships without combining the overall ESs and their trade-off results. However, for the best land management strategy, the maximization of overall ESs and the minimization of trade-offs must be considered.
Given the limitations of existing studies on ESs and scenarios, we aim to analyze land-use changes in the Loess Plateau under different socioeconomic and policy-driven scenarios, as well as changes in ESs and their trade-offs. The Loess Plateau is a typical ecologically fragile area. With the implementation of a series of ecological restoration and management projects (e.g., the return of farmland to forest and grass), the land-use pattern has changed dramatically, leading to significant changes in ESs—mainly water yield, carbon storage, and soil conservation—which directly affect ecosystem security and sustainability [34,35]. Therefore, this study focuses on three aspects of analysis: (1) revealing and predicting land-use changes in historical periods and 2030 under natural evolution, ecological conservation, and economic development scenarios under the combined influence of climate and policies; (2) quantifying and analyzing changes in water yield, carbon storage, and soil conservation in historical periods and under different future scenarios; (3) comparing and analyzing the trade-offs and synergistic effects of ESs at the county scale.

2. Materials and Methods
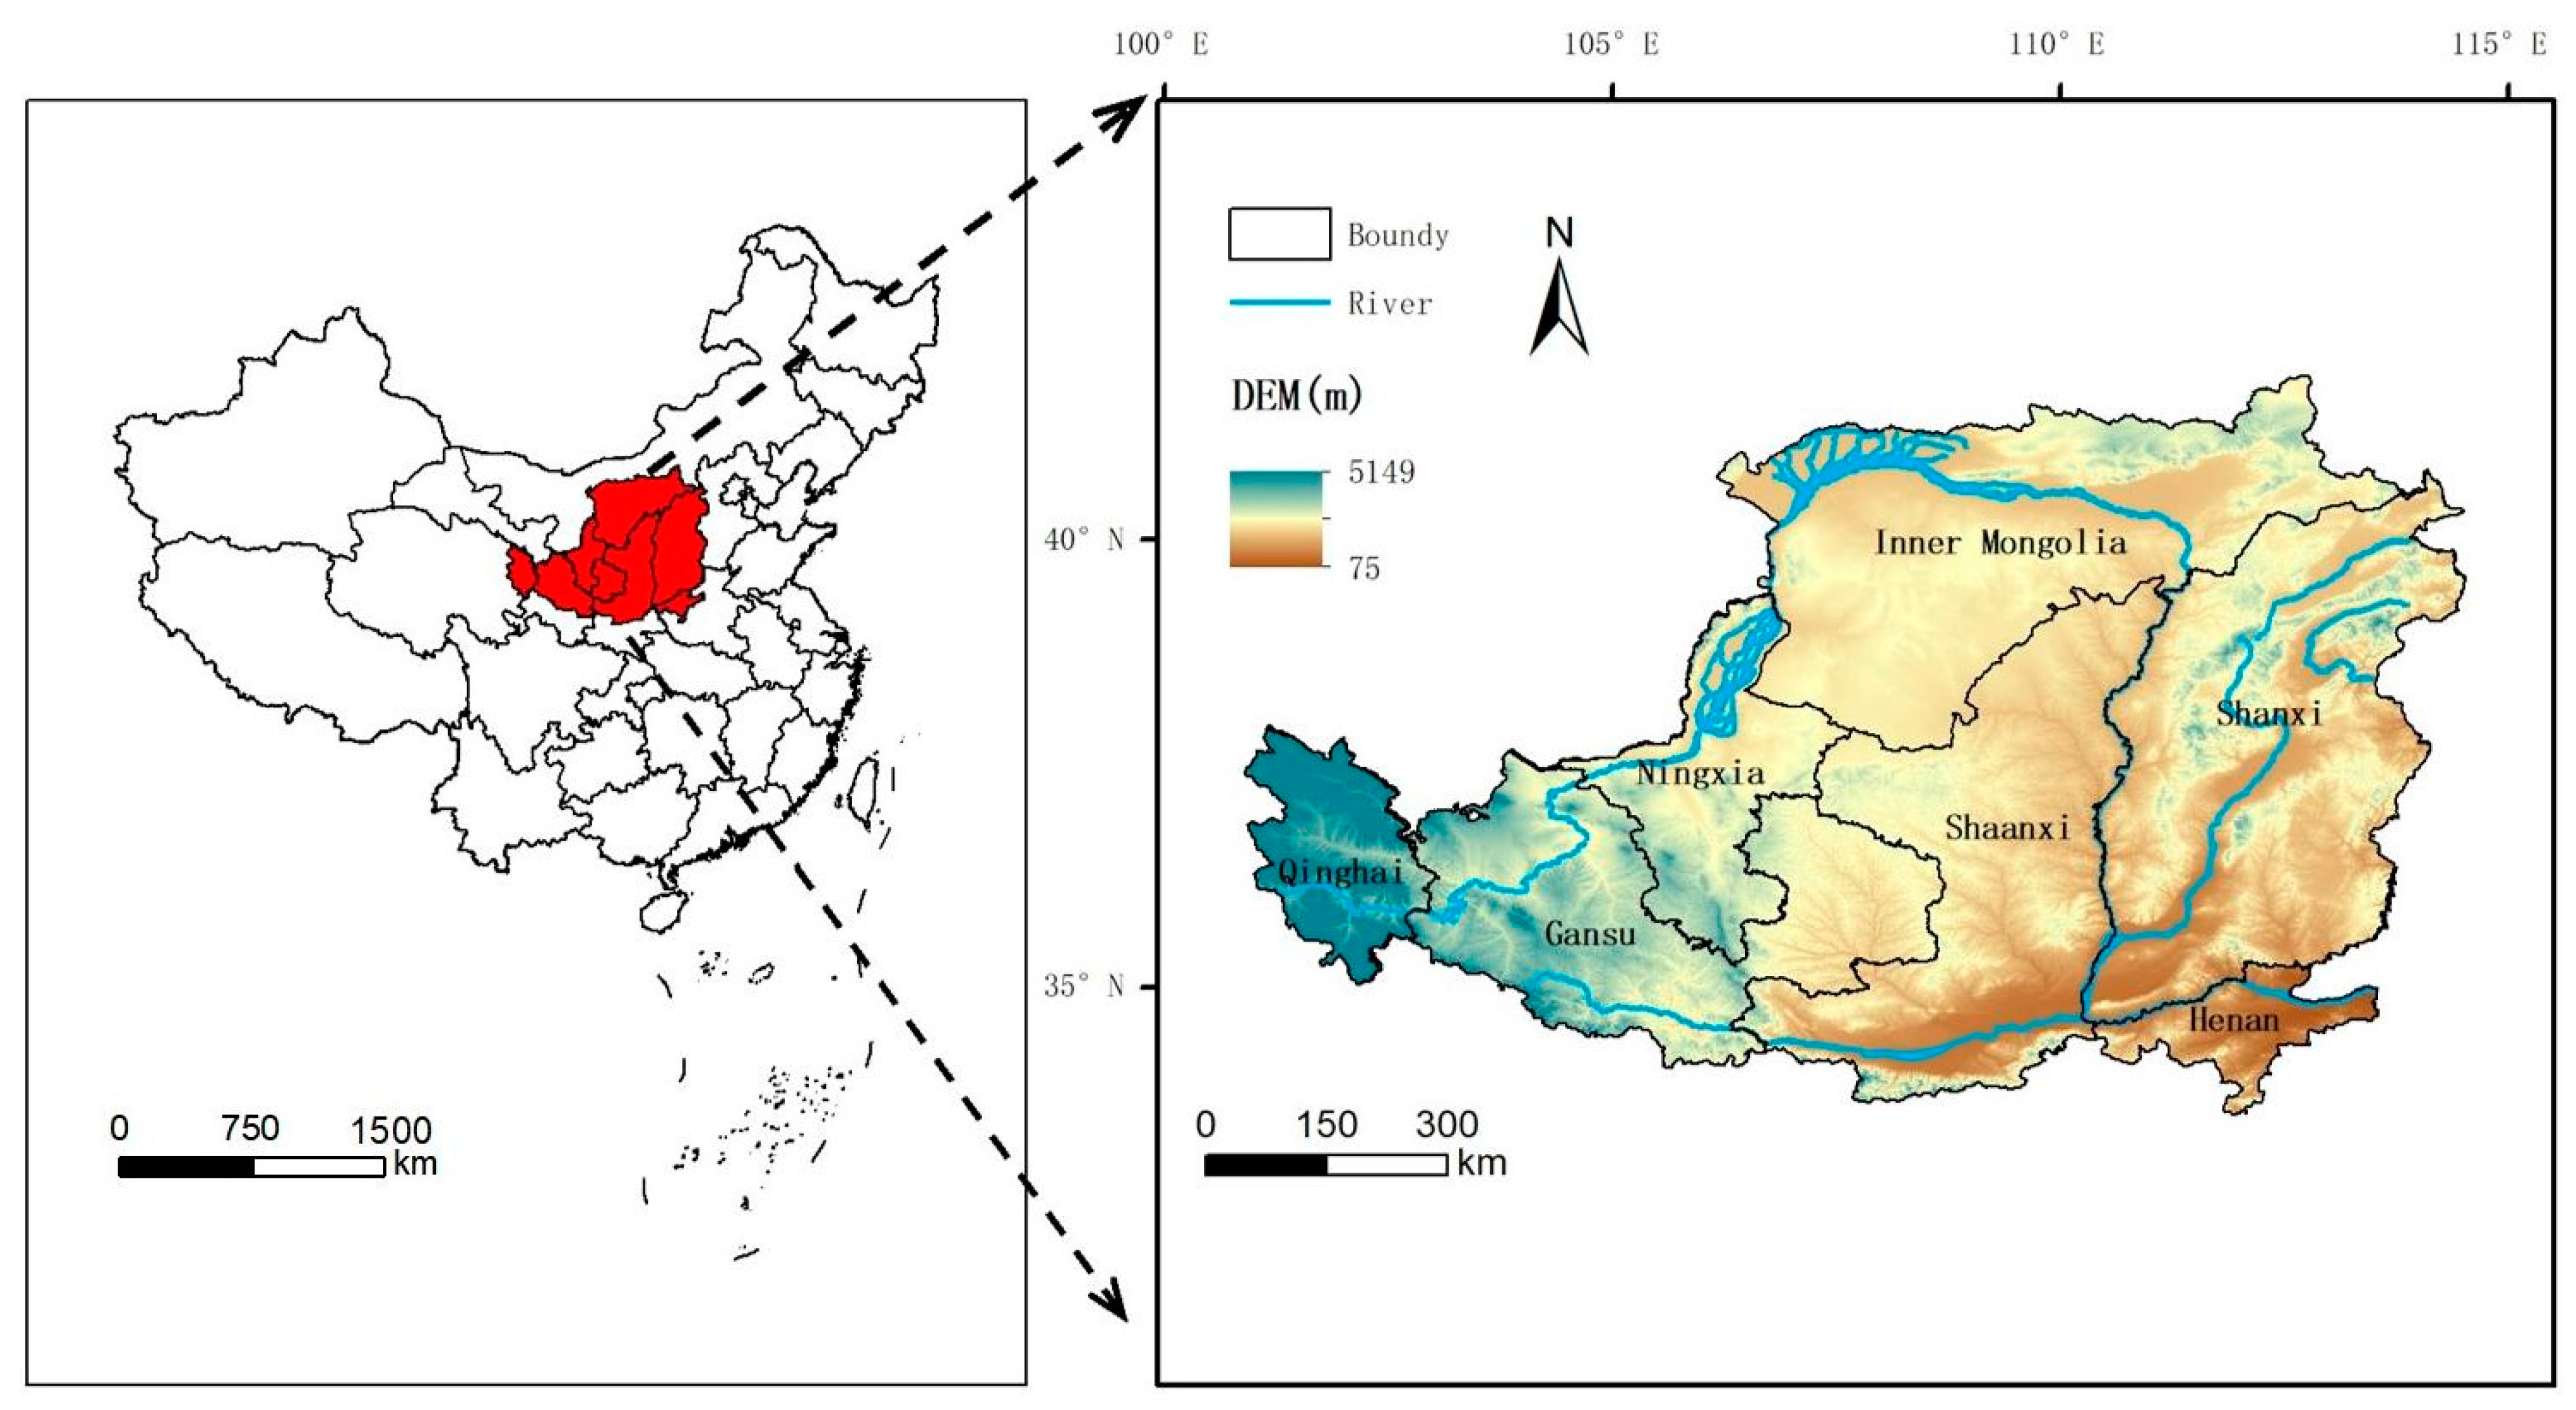
2.1. Study Area

The Loess Plateau is located to the north of central China and is one of the country’s four major plateaus. The region mainly includes parts of Shanxi, Shaanxi, Gansu, Qinghai, Ningxia, and Henan provinces, with a total area of about 640,000 square kilometers (Figure 1), carrying a population of over 100 million. The Loess Plateau is characterized by a typical continental monsoon climate, with large annual and daily temperature differences and strong evaporation. The region suffers from severe soil erosion, high sand content in rivers, and local water shortages, which exacerbate its ecological vulnerability [36].
Since the 1970s, China has implemented many soil and water conservation measures, including terracing, returning farmland to forest and grassland, and dam construction. Since the implementation of the GFGP in 1999, the land-use type in the region has been significantly transformed, and the Loess Plateau has become one of the most successful ecological restoration areas in China [37]. However, as one of the regions with the highest concentration of population, resource, and environmental conflicts in China, the fragile natural conditions coupled with the long-term high-intensity land use still render the whole regional ecosystem very fragile.

2.2. Data Sources

The data used in this study include the following: (1) Three phases of land-use data in 2000, 2010, and 2020 from the Resource and Environment Science and Data Center of the Chinese Academy of Sciences “https://www.resdc.cn/” (accessed on 30 March 2022), containing six types of land use, namely, arable land, forest land, grassland, water, constructed land, and unused land; (2) Digital Elevation Model (DEM) data derived from the Resource and Environment Science and Data Center of the Chinese Academy of Sciences "https://www.resdc.cn/” (accessed on 25 March 2022); (3) Meteorological data (i.e., monthly rainfall, monthly evapotranspiration, and annual mean temperature data from 2000 to 2020) derived from the National Center for Earth System Science and Data “http://www.geodata.cn” (accessed on 30 March 2022); (4) Soil data from the China Soil Data Set (v1.1) of the World Soil Database (HWSD) “http://westdc.westgis.ac.cn/” (accessed on 2 October 2022), mainly to obtain data on soil type, texture, soil organic carbon content, and the ratio of each soil grain size; (5) Socio-economic data, such as population, GDP, public (railway) road distribution, and other data, used in the PLUS model for land-use prediction and derived from the Resource and Environment Science and Data Center of the Chinese Academy of Sciences “https://www.resdc.cn/” (accessed on 4 May 2022) and the National Geographic Information Resources Catalogue Service System “https://www.webmap.cn/” (accessed on 11 October 2022). To ensure matching accuracy, all data in this study were uniformly spatially resolved to 1 km, and the coordinate system was uniformly converted to an Asia_North_Albers_Equal_Area_Conic projection.

2.3. Methods

This study combines the PLUS and InVEST models to investigate changes in ecological services, as well as trade-offs and synergistic relationships, by simulating and predicting land use under different development scenarios. The research framework of this paper is divided into three parts (Figure 2). First, nine driving factors of elevation, slope, annual rainfall, average annual temperature, GDP, population density, distance from the road, distance from railroad, and distance from water system are selected to simulate the land-use distribution under different scenarios in 2000, 2010, 2020, and 2030 by the PLUS model. Here, the future scenarios are combined with climate data under shared socioeconomic pathways (SSPs) scenarios SSP245, which are set as (1) natural evolution (NE), (2) ecological conservation (EC), and (3) economic development (ED). Based on the historical land-use data and future land-use simulation results, the InVEST model is used to realize the ecosystem service assessment between the historical period and the future. Considering the environmental problems in the study area (e.g., severe soil erosion and water shortage), three ecological services with a high functional value in the region are selected in this paper: carbon storage (CS), water yield (WY), and soil conservation (SC). The trade-offs and synergistic relationships between ecological services are analyzed by Spearman correlation analysis and root-mean-square deviation.

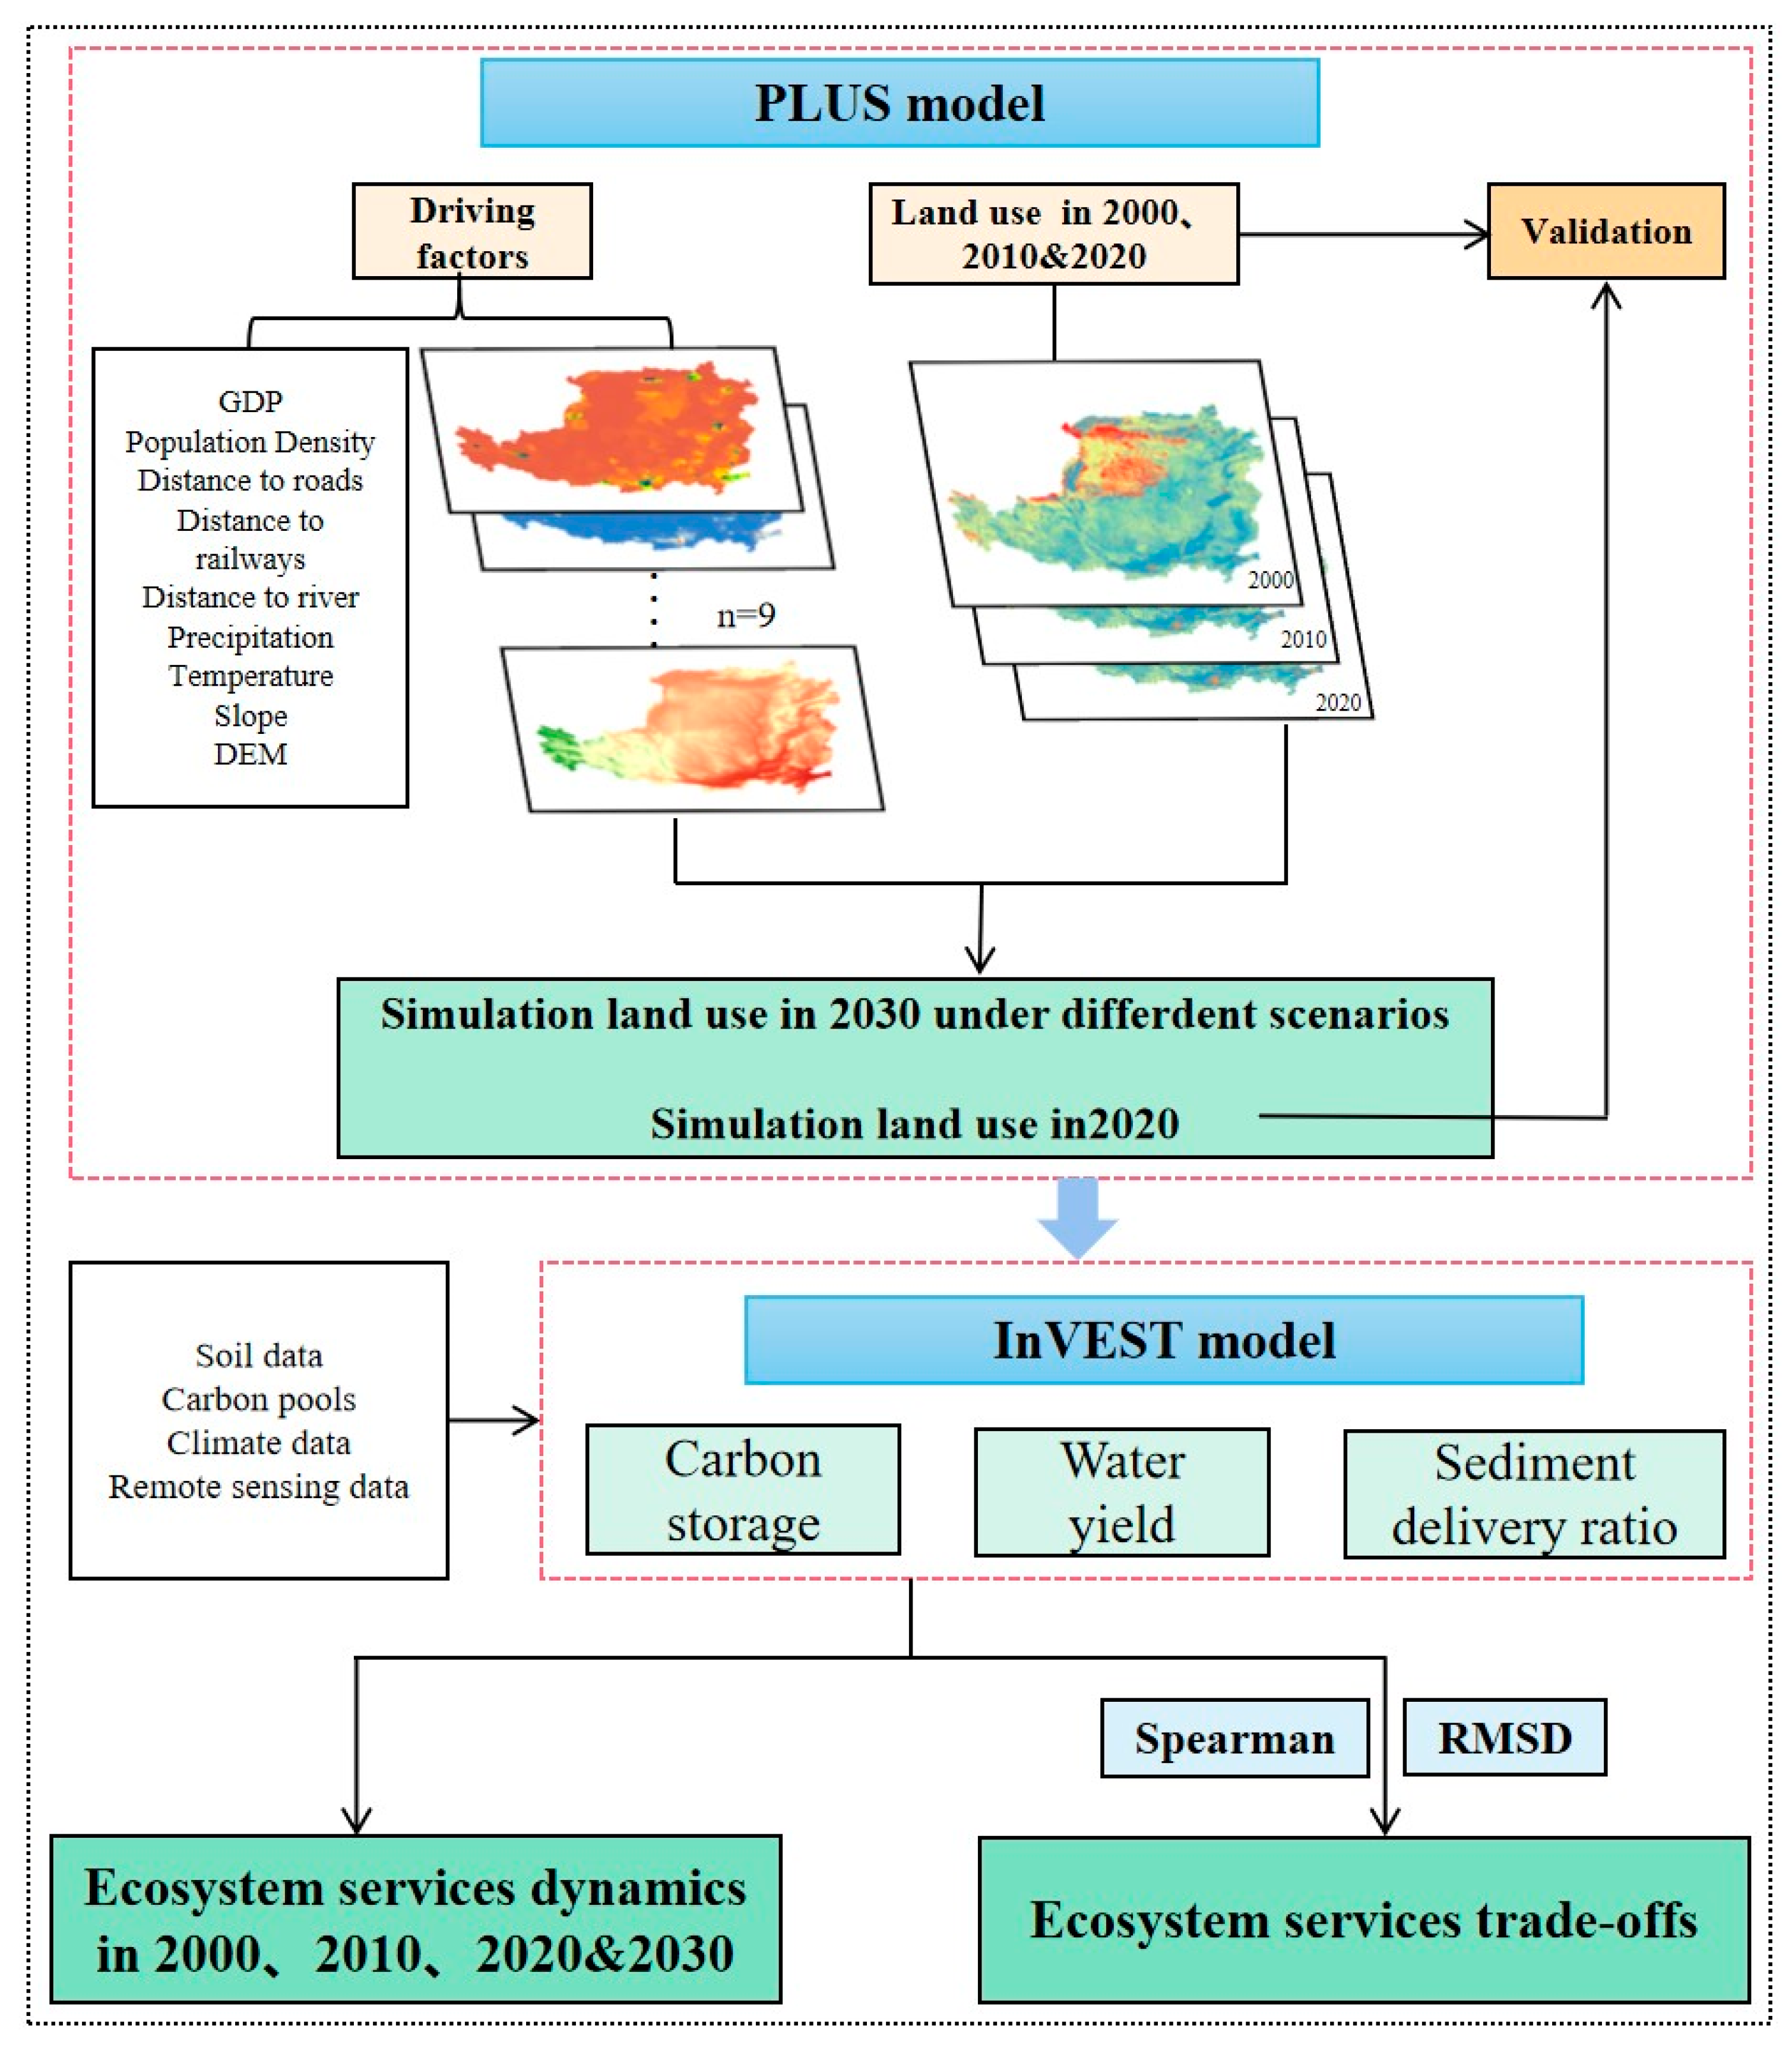
2.3.1. Land-Use Prediction Based on the PLUS Model

The PLUS model is a cellular automata (CA) model based on raster data that can be used for patch-scale land-use/land-cover change simulation. The model integrates a rule-mining approach based on land sprawl analysis and a CA model based on a multi-type stochastic seeding mechanism to mine the drivers of land sprawl and predict the patch-level evolution of land-use landscapes [38]. The model uses the random forest algorithm to obtain the development probability of each type of land by extracting its expansion part in the two-phase land change and then uses the CA model based on multi-class random patch seeds to simulate and predict the future landscape pattern. This study fully considers regional spatial policies, regulations, and restrictions set by the government as well as land-use planning decision-makers and sets up conversion rules between land-use types according to land-use needs. First, the Land Use Expansion Analysis Strategy (LEAS) module in the model is used to calculate the development probability of each land-use landscape in the study area, as well as the contributions of the driving factors of the expansion of each land-use type in that period. Then, the target number of image elements, the transfer cost matrix, the probability of random patch seeds and neighborhood factors for each type of future land use, and other related parameters are set, and the patch evolution of multiple land-use types is simulated by the CA model. Finally, the simulation of landscape-type change in the study area is realized.
Combining the actual situation of the Loess Plateau and official documents such as local land remediation plans, three land-use/cover development scenarios (i.e., NE, EC, and ED) are proposed under the typical SSPs climate scenario (SSP2) model, which is based on a series of scientific assumptions that reasonably describe the spatial and temporal distribution of future climatic conditions, with the SSP2 (moderate development) scenario representing a future development trend that roughly follows the historical pattern [39]. The future scenarios are the Natural Evolution Scenario (NE), the Ecological Conservation Scenario (EC), and the Economic Development Scenario (ED). The principles and objectives of scenario-setting in this paper are as follows: (1) First is the NE scenario, which assumes that the trend of land-use change in 2020–2030 is not disturbed by any external factors, continues the land-use development trend of 2010–2020, keeps the transfer probability of each land-use type unchanged, and simulates the land-use pattern in 2030. (2) Second is the EC scenario, with ecological protection as the primary objective, which limits urbanization and enhances the conversion of other land-use types to ecological land use. This scenario increases the probability of conversion of arable land to forest, grassland, and watershed by 20 percent from the historical probability and the probability of conversion of unused land to forest, grassland, and watershed by 20 percent, in accordance with the policy of ecological protection of the Loess Plateau. (3) The ED scenario is third, in which, according to the principle of land economics, land resources can be directly used for urban economic growth. Thus, this scenario aims to maximize the economic benefits of the study area by strengthening the expansion capacity of construction land and arable land, and this scenario reduces the probability of conversion of arable land and construction land to forest, grassland, and watershed by 20 percent, and increases the probability of conversion of unused land to arable land for construction by 30 percent, based on the development trend of land use in the period 2010–2020.

2.3.2. Ecosystem Service Assessment

(1)
Water yield
The InVEST water yield module is based on the basic water balance principle, in which the precipitation of a grid cell minus the actual evapotranspiration is the water yield of the cell, which takes into account surface runoff, soil moisture, the water-holding capacity of litter, and canopy interception. The main algorithms of the model are from existing research as follows [40,41]:
  W Y x = 1 A E T X P X × P ( x ) ,
A E T x P x = 1 + P E T ( x ) P ( x ) [ 1 + ( P E T ( x ) P ( x ) ) ω ] 1 / ω ,
ω = Z × A W C x P x + 1.25 ,
where WY(x) is the annual water yield of grid x (mm); AET(x) is the annual actual evapotranspiration of grid x (mm); P(x) is the annual rainfall of grid x (mm); PET(x) is the annual potential evapotranspiration of grid x (mm); Z is the Zhang coefficient [41,42], which ranges from 1 to 30 and represents the regional precipitation distribution and other hydrogeological characteristics; and AWC(x) is the effective soil water content of grid x.
(2)
Carbon storage
In this study, the carbon stocks in the study area were analyzed based on the carbon storage and sequestration module of the InVEST model. This module estimates the amount of carbon currently stored in the landscape or sequestered over time from land-use data and the storage in four carbon pools (i.e., aboveground biomass, belowground biomass, soil, and dead organic carbon), simplifying the carbon cycle and assuming that carbon sequestration varies linearly over time. The model requires carbon density values for the four carbon pools described above. The carbon density data used in this study refer to the existing literature [43,44,45,46], and the carbon densities of the same area, or those of areas similar to the study area, were preferentially selected.
(3)
Soil conservation
The soil retention module (sediment delivery ratio, SDR) of the InVEST model expresses soil retention by calculating the difference between the potential soil erosion and the actual soil erosion for each raster cell. The main equation is as follows [47]:
S E D R E T = R K L S U S L E ,
R K L S = R × K × L S ,
U S L E = R × K × L S × C × P ,
where SEDRET is the amount of soil retention (tons·ha−1·a−1), RKLS is the potential soil erosion (tons·ha−1·a−1), and USLE is the actual soil erosion (tons·ha−1·a−1). The monthly scale calculation model is selected to acquire R, which is the rainfall erosivity factor (MJ·mm·ha−1·h−1·a−1) [48]. K is the soil erodibility factor (tons·h·MJ−1·mm−1), which is obtained using the EPIC model based on soil texture and organic matter content [49]. LS is the slope length-gradient factor, C is the cover-management factor, and P is the support practice factor (all dimensionless).

2.3.3. Ecosystem Service Trade-Off and Synergy Analysis

ESs often exhibit two types of relationships, trade-offs, and synergies, in response to their internal and external influences [10,50]. Trade-offs are negative relationships where the provision of certain ESs is reduced by increases in other types of ESs, whereas synergies are positive relationships. In this paper, Spearman correlation analysis was used to determine the correlation between each ES at different periods (i.e., different scenarios from 2020 to 2030). A total of 2500 random points were generated in the study area using ArcGIS 10.5, and the values of ES pixel points were extracted and then aggregated for correlation analysis.
In addition, this study used root-mean-square deviation (RMSD) to quantify ES trade-offs. RMSD extends the traditional negative correlation of trade-offs to the uneven rate of change by describing the relative difference between individual ESs and average ESs, thus quantifying the trade-offs between any two or more ESs. RMSD is calculated as follows [51]:
R M S D = 1 n 1 × i = 1 n ( E S i E S ¯ ) 2 ,
where n is the number of ESs, E S i is the standard value of ESs, and E S ¯ is the expected value of ESs. Data standardization is required to eliminate the effects caused by ES unit differences. The standardized ES is defined by the following equation [52]:
E S i = E S E S m i n E S m a x E S m i n ,
where E S i is the standardized ES value in the range of 0–1, ES is the observed value, and E S m i n and E S m a x are the minimum and maximum ES values, respectively.

3. Results

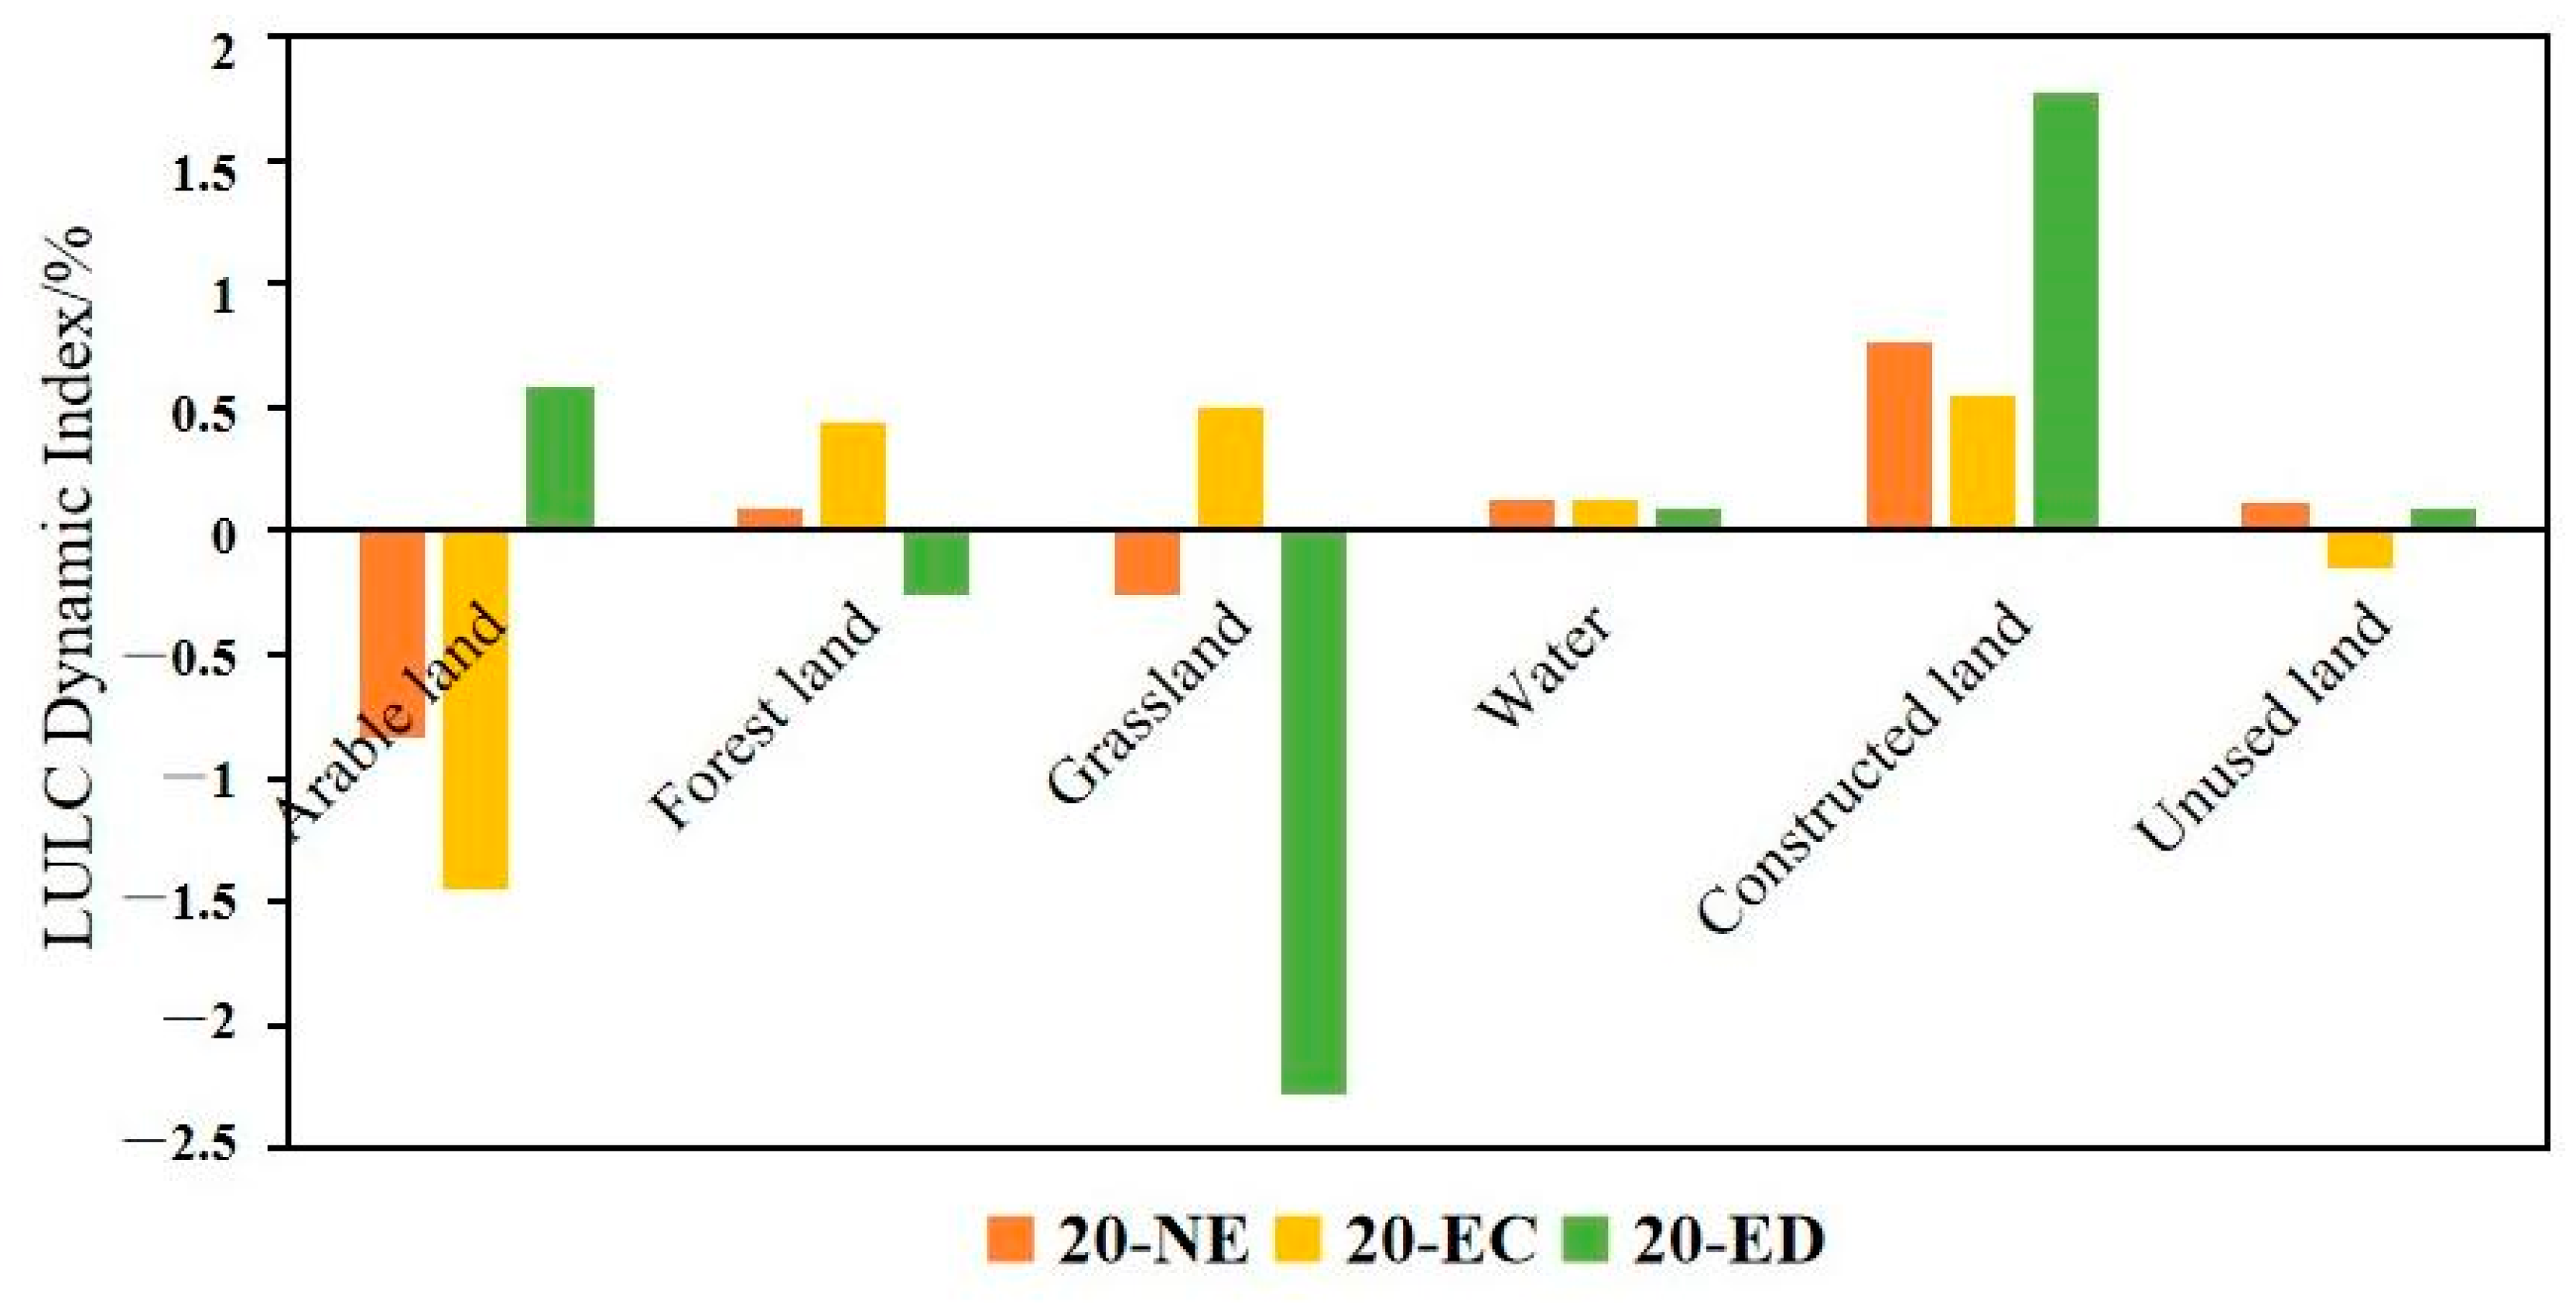
3.1. Land-Use Change and Scenarios Simulation

The study obtained land-use data of the Loess Plateau under different scenarios in 2000, 2010, 2020, and 2030 (Figure 3). It can be seen that the land-use types of the Loess Plateau are mainly arable land and grassland, which together account for more than 70% of the total land area, followed by forest land and unused land. During the 2000–2020 period, arable land and unused land showed a decreasing trend, with arable land decreasing by 14,092 km2; whereas construction land and forest land showed an increasing trend, with increases of 1.75% and 0.56%, respectively. It can be seen that the rapid expansion of land for construction, the gradual increase of forest land, and the continuous decrease of arable land are the main characteristics of land-use changes in the Loess Plateau in recent years.
The spatial and temporal LULC divergence pattern of the region in 2020 was simulated using the PLUS model, and the actual LULC accuracy was verified. The total accuracy of the PLUS simulation results is 0.93, and the Kappa coefficient is 0.89. Usually, when 0.75 < Kappa ≤ 1, the stochastic seed model based on the PLUS model can obtain a higher simulation accuracy, which indicates that this parameter setting method can be used for the prediction and simulation of future land-use patterns. Therefore, this paper explores three different 2030 scenarios using the PLUS model:
In the NE scenario, grassland is the dominant land type on the Loess Plateau, accounting for 40% of the entire study area, followed by arable land. The natural evolution scenario was set based on the probability of land-use transfer from 2010 to 2020. Compared to land use in 2020, arable land and grassland show a decreasing trend (Figure 4), whereas water and constructed land show an increasing trend. The expansion of constructed land is not well restrained and continues to occupy arable land, forest land, and other ecological lands, which is not conducive to the ecological security and sustainable development of the urban area. In the ecological conservation scenario, the implementation of the policy of returning farmland to forest and ecological projects, forest and grass, water, and other ecological land has been protected. Forest land, grassland, and water increased by 0.44%, 0.5%, and 0.13% compared to 2020, respectively, whereas arable land decreased by a larger rate of 1.45%, restraining the disorderly expansion of regional constructed land to a certain extent. Food security and economic development are taken into account in the ED scenario, and the probability of transferring arable land to other sites is reduced. Meanwhile, the urban area near the Yellow River Basin expands rapidly, the extent of constructed land expands exponentially, and urban patches become more compact. Compared to land use in 2020, the expansion of arable and constructed land increased by 0.59% and 1.77%, respectively, at the expense of forests and grasslands to support the urban and rural construction and economic development needs of the area.

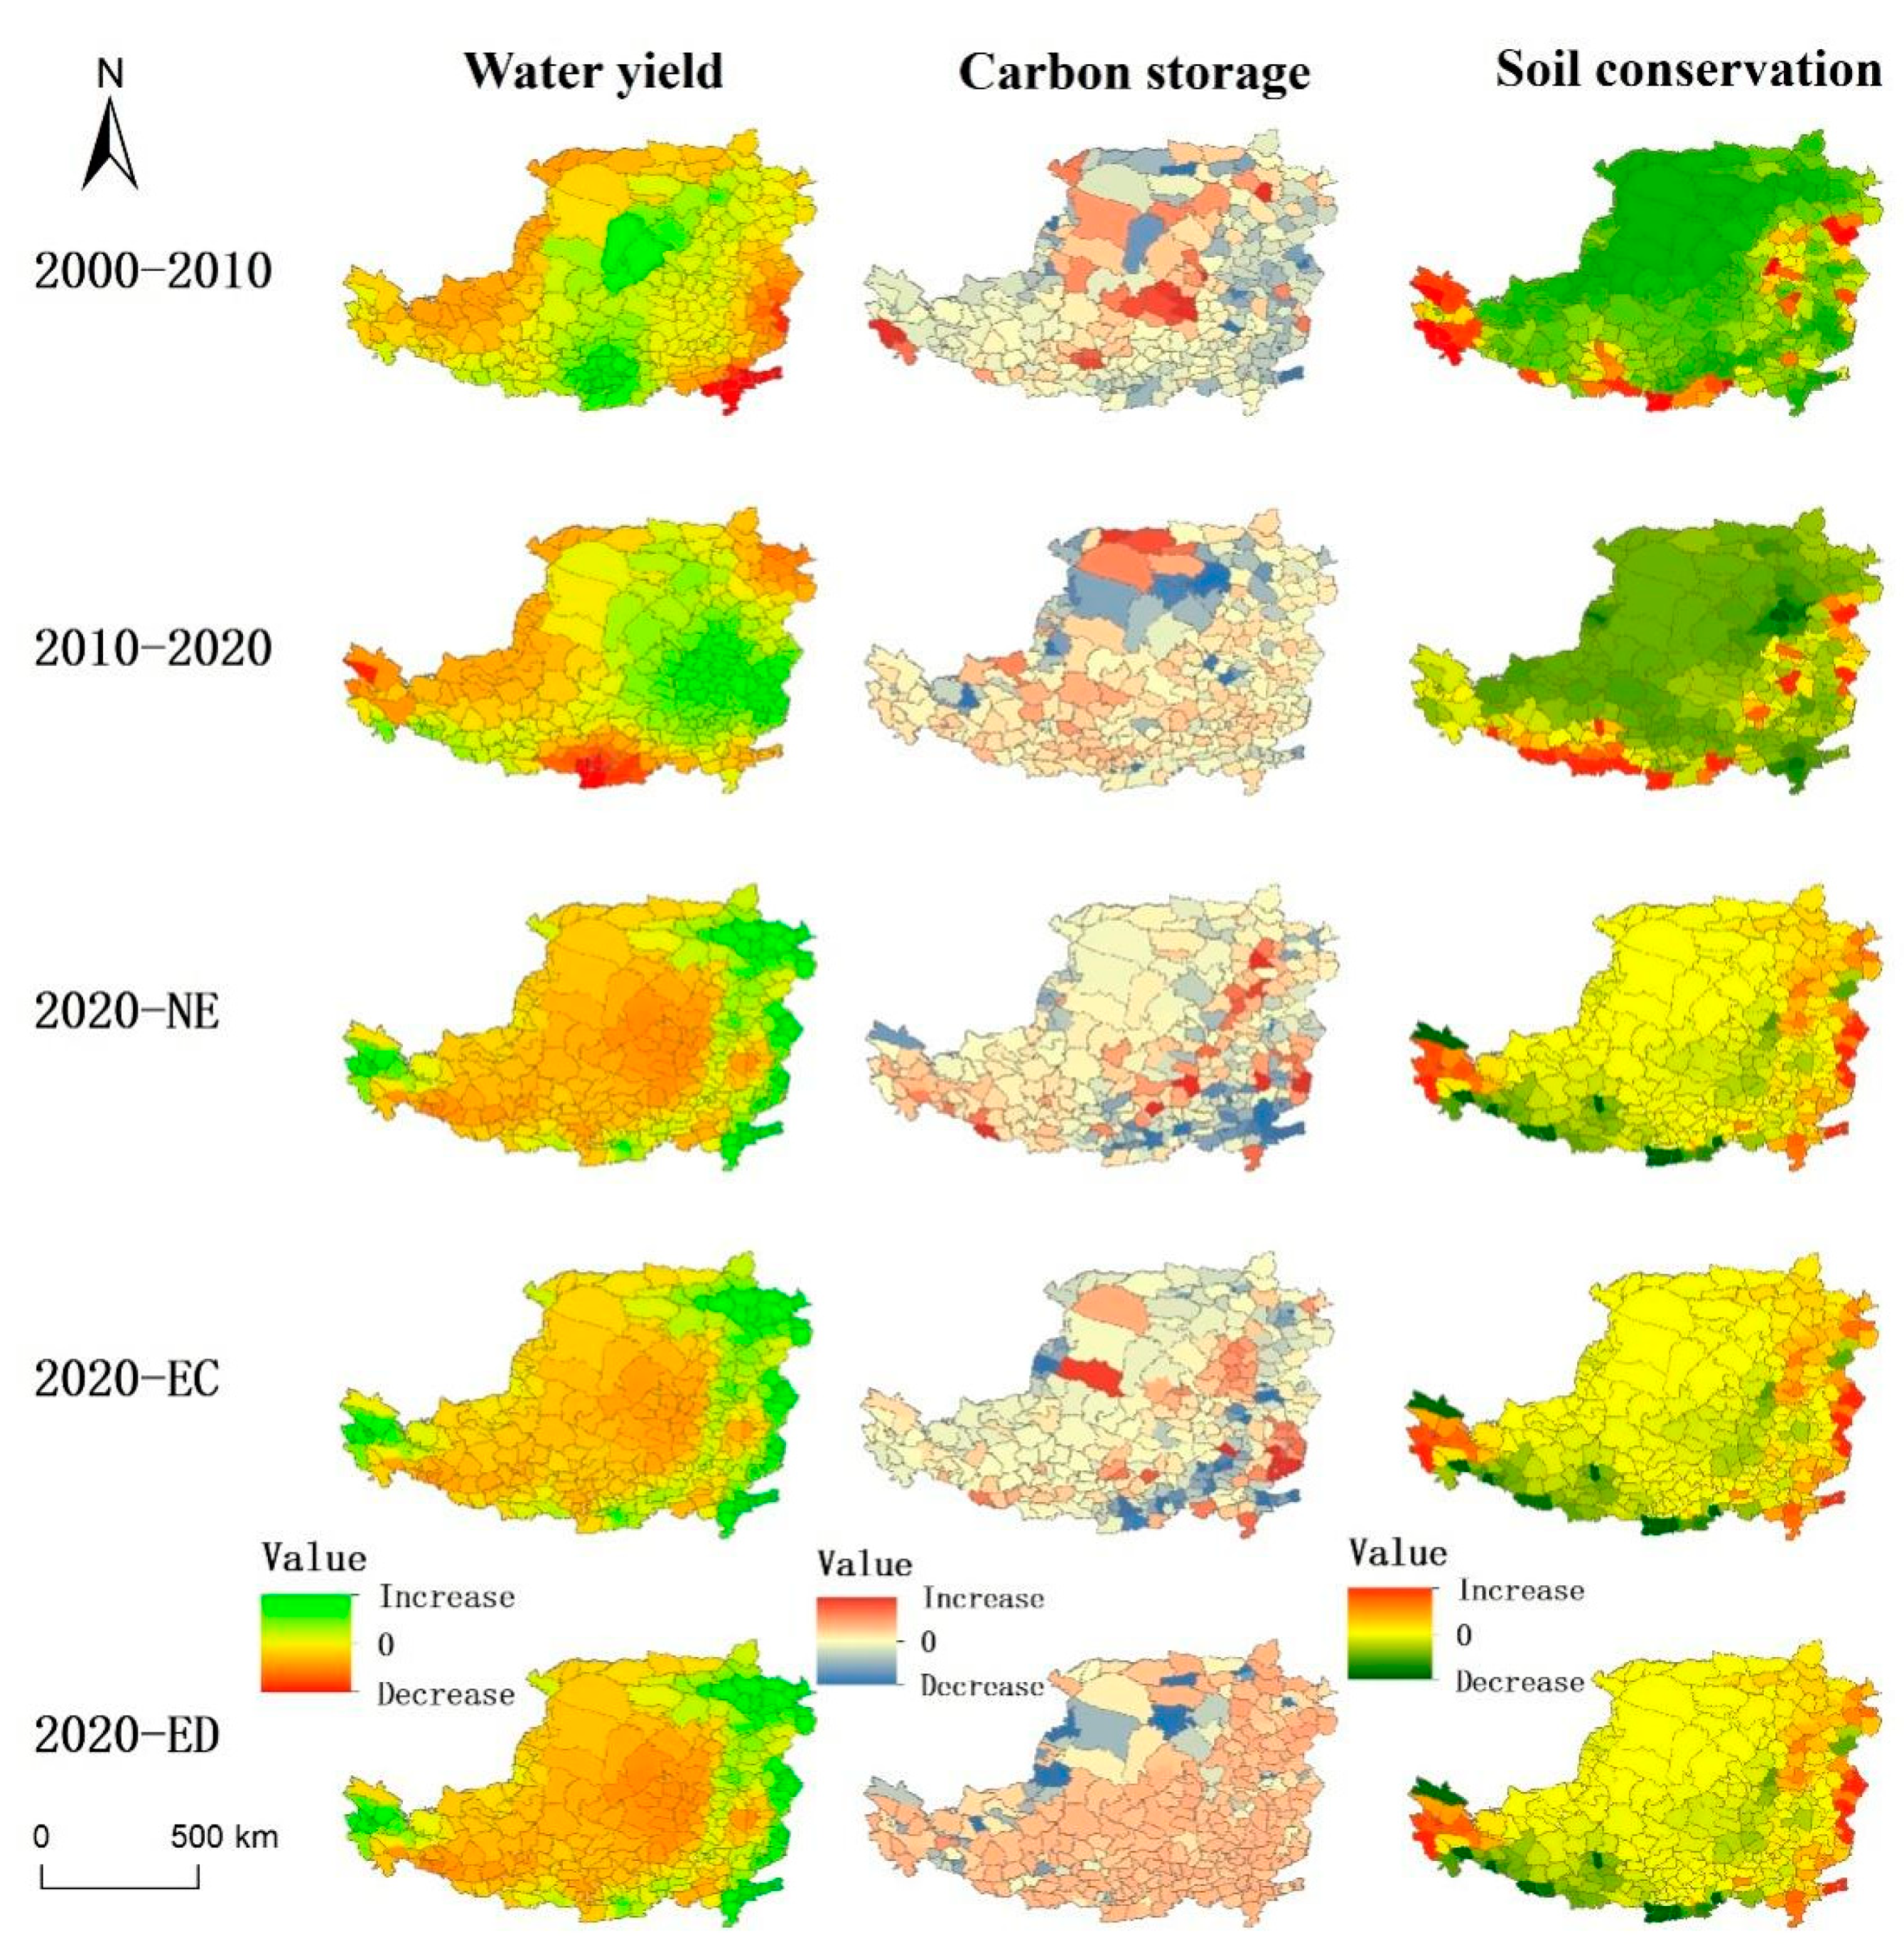
3.2. Changes in Ecosystem Services

At the county scale of the Loess Plateau, ESs have a clear spatial heterogeneity in spatial distribution (Figure 5). Water yield showed an overall spatial pattern of high in the south and low in the north in 2000, 2010, and 2020, with the average water yield increasing significantly from 47.46 mm in 2000 to 102.44 mm in 2020 (Table 1). This is closely related to the amount of rainfall and land use in that year. The spatial distribution of carbon storage on the Loess Plateau is very similar from south to north, and there is no significant change in carbon storage in the three study years, with regional average carbon storage of 57.24, 57.38, and 57.1 t/ha, respectively, showing a slight increase and a change in characteristics of rising and then falling. As the proportion of grassland and arable land in the regional landscape matrix is relatively stable, the overall carbon stock in the region is less variable. The overall spatial pattern is high in the south-east and low in the rest of the region, with soil conservation across the region increasing significantly from 39.3 t/ha in 2000 to 57.6 t/ha in 2020, which is closely related to the state of vegetation recovery in the region. The region has a large amount of forest land and the increase in plant cover has enhanced the soil conservation capacity, which has led to a reduction in soil loss.
The total water yield in 2020 is 67.28 × 10⁹ m3 and is expected to increase to 111.408 × 10⁹ m3 in 2030 under the ecological conservation scenario. Under the natural evolution and economic development scenarios, the total water yield increases to 111.64 × 10⁹ and 112.206 × 10⁹ m3, respectively. This is mainly due to the expansion of land for construction, resulting in a higher capacity for runoff generation from the substratum and increased water yield. In terms of spatial distribution, the eastern part of the Loess Plateau shows an increasing trend in water production services, mainly due to the increase in rainfall in 2030 compared to 2020 under the SSP2 shared socio-economic path.
The total carbon storage in 2020 is 3.718 × 10⁹ t and is expected to decline to 3.701 × 10⁹ t in 2030 under the natural evolution scenario. The ecological conservation scenario has the highest carbon storage at 3.733 × 10⁹ t, with an overall increase over the 20 years. The economic development scenario has the lowest carbon stocks at 3.638 × 10⁹ t, with the north-western region having significantly fewer carbon stocks than in 2020.
The total soil conservation in the ecological conservation scenario decreases the least from 4.432 × 10⁹ t in 2020 to 4.325 × 10⁹ t in 2030, while soil conservation in the economic development scenario decreases the most to 4.29 × 10⁹ t in 2030. The spatial distribution at the county scale shows very similar trends in soil conservation for the three scenarios.

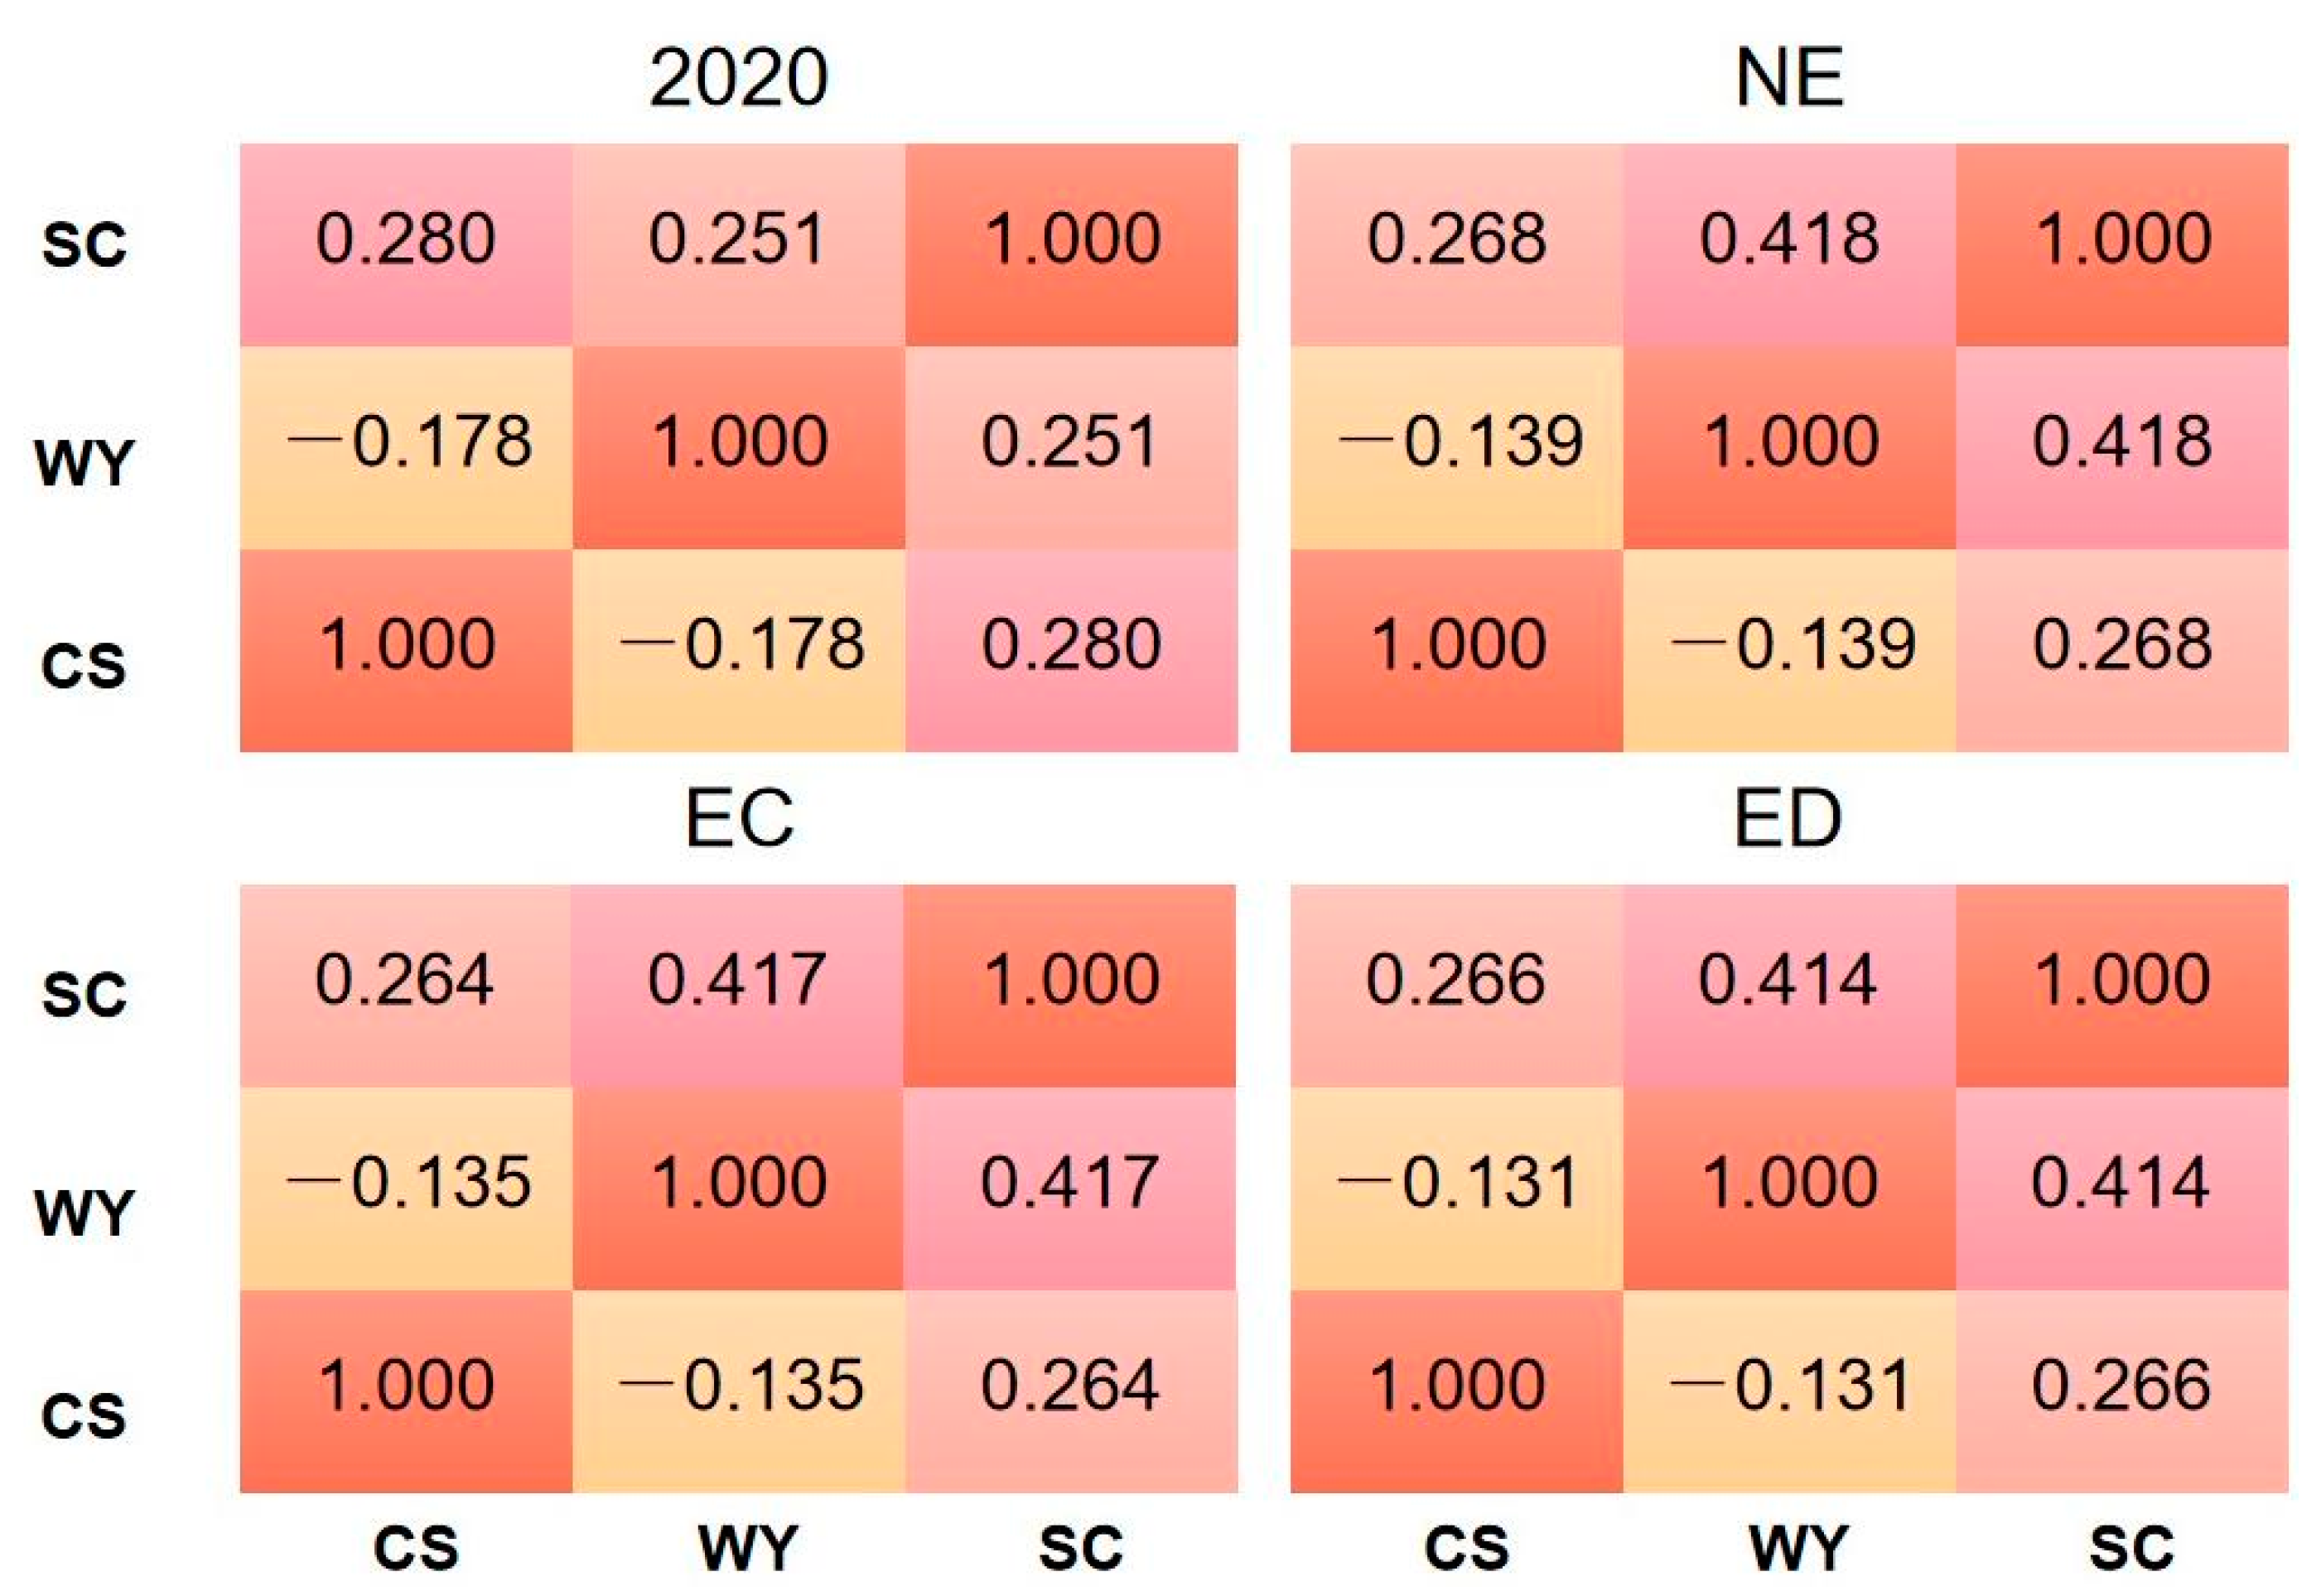
3.3. The Analysis of the Trade-Offs and Synergies of ESs

In the Loess Plateau, the variation of spatial pattern in each ES showed a significant positive spatial correlation, indicating that the space is clustered rather than randomly distributed. The Spearman correlation coefficient shows that there is synergy between WY and SDR, as well as SDR and CS and that there is a trade-off between WY and CS (Figure 6). Spatial heterogeneity in ESs is evident from the spatial pattern of ecological services. Significant correlations (p < 0.05) were found between carbon storage, soil conservation, and water yield on the Loess Plateau between 2020 and 2030, indicating trade-offs and synergistic effects between these ESs. There are significant positive correlations between carbon storage and soil conservation, as well as soil conservation and water yield, during the entire study period, suggesting synergistic relationships. The strongest correlation between water yield and soil conservation may be related to the important role of ecological land use in water yield and soil conservation. Carbon storage and water yield are negatively correlated from 2020 to 2030 under the three different scenarios, suggesting a trade-off between carbon storage and water yield. Overall, the relationship between ES pairs was consistent throughout the study period, with some exceptions. Water yield is positively correlated with carbon storage from 2000 to 2020 for all three scenarios, with an opposite trend from 2020 to 2030, which implies that the potential future capacity of arable land to absorb carbon will decrease as urban land continues to expand.
The counties of the Loess Plateau are classified into four scenario categories based on the average overall ES and pixel-level trade-off values in 2020 (Figure 7): (1) Overall ES and trade-offs exceed those of 2020; (2) Overall ES exceeds that of 2020 but trade-offs are less than those of 2020; (3) Overall ES is below that of 2020 but trade-offs exceed those of 2020; (4) Overall ES and trade-offs are below those of 2020. Among these, the second scenario category is the most ecologically favorable, the fourth is the least favorable, and the rest are in between. In this study, county-level trade-offs for ESs judged using these four scenarios showed overall spatial consistency, but local differences existed. Scenario 1 is predominantly found in the eastern and southwestern regions, whereas Scenario 2 is mainly found in the southwestern basin. Of all the scenarios, three increased in the eastern region, with those of natural development and ecological conservation increasing the most. Scenario 3 occurs mainly in the northwestern region, and Scenario 4 is mainly distributed in the central part of the region.
The area of the best-case scenario increases in all three land-use scenarios in 2030 compared to 2020. The EC scenario shows the largest distribution of best-case scenarios among the three land-use scenarios, with the largest increase in the proportion of the overall ES over 2020 compared to the NE and ED scenarios. Meanwhile, Scenario 4 shows the largest decrease in area share. The ED land-use scenario has the largest increase in Scenario 3, with low ESs and high trade-offs being the most detrimental to ecological conservation. Therefore, the ecological conservation scenario is considered the optimal scenario.

4. Discussion

4.1. Land-Use Impacts on Ecological Services

Most of the land-use prediction simulation models used in current studies, such as FLUS [53], CA-Markov [54], SLEUTH [55], and CLUE-S [56], have some weaknesses, such as difficulty in dynamically simulating the evolution of multiple types of land-use patches. In contrast, the coupled Markov chain and PLUS models in this paper can accurately simulate the non-linear relationship of LUCC using patch-level land-use simulation models, which enables higher simulation accuracy and more similar landscape pattern metrics to the real landscape [38]. We used the PLUS and InVEST models, combined with the future climate model of the SSP2 path, to predict possible land-use development in 2030 under a combination of climate and policy influences. We also quantitatively assessed three ESs—water yield, carbon storage, and soil conservation—for historical periods and different future scenarios on the Loess Plateau. For land-use change characteristics, arable land and unused land are the main sources of transfer of constructed land, forest land, and grassland. The continuous decrease in the area of arable land and the increase in the area of forest and grasslands are largely related to the government’s policy of returning farmland to forest and grassland, as well as increased levels of urbanization, which is consistent with existing studies [57,58]. The differences in land-use patterns among the three future scenarios in this study are not obvious, partly because although the area of conversion between land types is thousands of square kilometers, such changes are not obvious on a large scale. In addition, in the process of setting up the three future scenarios in this paper, the increase or decrease in the conversion rate of the land classes is set in the feasible 20−30% range. Although the land types are changed in different target directions in the ED and EC scenarios, respectively, the conversion of land types does not take place in a one-way direction, which also results in insignificant land-use differences among the three scenarios. The main focus of this study is to simulate land-use change and its resulting ecosystem service changes. Although LUCC shows overall spatial consistency under the three scenarios, by setting different scenarios, the intention is to analyze the ecological effects of ecosystem services on it. Therefore, to clarify whether land-use changes triggered in the pursuit of higher ecosystem service benefits will cause changes in the trade-offs and synergistic relationships between ecosystem services and how to carry out the balance between the two, it is still necessary to carry out the analysis of LUCC and ESs under the scenarios.
Changes in the landscape pattern of the Loess Plateau have caused changes in multiple ESs and their trade-off/synergistic effects. In this study, the area of arable land has decreased by 14,092 km2, and the area of constructed land and forest land has increased by 11,397.8 km2 and 3621.6 km2, respectively, over the past 20 years. This resulted in a decrease in carbon stock of 0.098 × 10⁸ t, an increase in soil retention of 1.393 × 10⁹ t, and an increase in water production of 35.75 × 10⁹ m3. The results of the study are consistent with those of Yang Jie in the Yellow River basin [42,59]. The reason for this phenomenon is that the increase in built-up land due to urban expansion has led to an increase in the impermeable layer of concrete and cement-based ground, which has prevented some of the soil from being exposed to the surface. Meanwhile, impervious surfaces reduce water infiltration, making it easy for precipitation to quickly form runoff at the surface, with a subsequent increase in water yield. However, the increase in constructed land area will inevitably lead to the loss of many biological properties of the soil, resulting in a decrease in soil carbon storage [60,61]. In addition, the implementation of the ecological project of returning farmland to forest and grassland on the Loess Plateau in recent years has effectively improved the regional ecological environment, and the vegetation cover has been greatly increased. The retention and absorption of precipitation by the forest canopy layer, deadfall layer, and soil layer have reduced the loss of precipitation to the soil and enhanced the soil conservation capacity [62]. Summarizing the changes in LUCC and ESs over the 20-year period, we believe that the current land-use pattern, while improved compared to 2000, still requires further refinement.
This study also identified trade-off/synergistic relationships between ESs at different periods, showing that there is a trade-off relationship between water yield and carbon storage, whereas soil conservation is synergistic with both water yield and carbon storage, respectively. This is generally consistent with the results of previous studies [58,59], with some differences. Feng concluded that there was a trade-off between water yield and soil conservation in the central part of the Loess Plateau between 2000 and 2014 [63], but the two ecological services were synergistic in this study. The sediment transfer ratio module of the InVEST model quantifies the estimation of sediment eroded from pixels retained by vegetation on the landscape downslope, whereas the estimation of rainfall erosion forces in this study is based on month-by-month rainfall, resulting in different spatial patterns of soil retention. Li concluded that the synergistic effect of carbon storage and soil conservation was reduced in a study of ESs on the Loess Plateau from 2000 to 2015 [64], whereas the synergistic effect between the two was enhanced in this study, mainly because the carbon storage depends on the carbon density estimation method and the way land-use types are assigned in the InVEST model. Additionally, there is a time lag effect in the apoplastic carbon pools that can also contribute to the differences [51]. Therefore, to meet different research objectives, the quantification of ESs requires different data and computational models, and the results should be separated.

4.2. Research Limitations and Future Research Directions

We focused on modeling land-use change and the resulting changes in ESs by combining the PLUS and InVEST models, overcoming the shortcomings of a single model and fully exploiting the advantages of both models in terms of quantitative prediction and spatial layout allocation. However, there are still some limitations in the study, as changes in land use and ES are influenced by a combination of factors.
In the land-use modeling, only three different future scenarios of future climate patterns under the intermediate development path SSP2 have been set up based on policy development trends. However, in reality, these three options are not representative of all possible LULC scenarios. Therefore, more comprehensive scenarios should be explored in subsequent studies to comprehensively consider natural environmental factors, policy factors, and influencing factors to propose the best land-use policy that meets the needs of multiple parties. For example, the liberalization of the family-planning policy and the implementation of the carbon taxation policy in China in recent years have affected regional landscape patterns and changes in ecological services to a certain extent. The liberalization of the family-planning policy means an increase in population [65], and more human activities may lead to an increase in the demand for ecological resources in human society. The implementation of a carbon taxation policy can effectively promote industrial structure upgrading and clean energy optimization and development [66], which is conducive to the protection of the ecological environment and the realization of sustainable development. Although the relationship between social factors (policy-making, economic factors, etc.) is intricate, their impact on ecosystem services cannot be ignored, so it is necessary to consider how to combine policy and socio-economics to set a more comprehensive development of land-use demand in further research. In addition, the modeling drivers factors selected in this paper, including nine factors in three aspects of natural environmental factors, socio-economic factors, and accessibility, are not comprehensive. Factors affecting human activities and the natural environment, such as geological structure, soil properties, and regional industrial structure, are not taken into account, which to a certain extent affects the explanatory effect of the model’s regression function. In the future, in order to improve the running accuracy of the PLUS model, it is necessary to improve its driving factor system.
Some objective factors are not fully taken into account when setting module parameters in the InVEST model. The time lag effect of the carbon pool of apoptosis, to a certain extent, will affect the final assessment results of carbon storage. In addition, in the process of carbon storage estimation in InVEST, the carbon density value is subject to human activities and environmental changes are prone to dynamic changes, so the carbon storage assessed in this paper is prone to bias, and the reasonableness of the carbon density value needs to be verified by the measured value in future research. There are more modeling factors needed in the soil conservation module, and some of the basic data come from different sources, but there are differences in the way data are processed in different data sites, affecting the accuracy of the model calculation results to a certain extent. The water yield module in vegetation calculation can use the water content index and be distributed in different locations of the same land-use type, corresponding to the topography and climatic conditions. However, in ES calculation, it still uses the same parameters. There are local unreasonable situations, which need further refinement. In the analysis of trade-off synergies between ESs, the correlation coefficient method can characterize the numerical relationship between ES trade-offs and synergies, but it does not fully reflect the underlying mechanisms of ESs and should be further explored in future research.

5. Conclusions

In this study, the PLUS model and the InVEST model are combined to assess regional land-use and ES changes under different scenarios on the Loess Plateau. The main conclusions are: (1) According to our estimates, the land-use types of the Loess Plateau are mainly arable land and grassland. In the past 20 years, the constructed land area on the Loess Plateau has expanded sharply, while forest land has gradually increased and arable land has continued to decrease under the policy of returning farmland to forest and grassland. The differences in land use are more obvious under the different development scenarios we investigated. (2) Water yield and soil conservation show an increasing trend from 2000 to 2020, whereas carbon storage continuously decreases. The soil conservation and carbon storage scenarios under the ecological conservation scenario are most favorable to the natural environment compared to the base year of 2020, and soil conservation and carbon storage under the nature scenario showed a decreasing trend. Whereas in the economic development scenario, the water yield service is the best, and carbon storage and soil conservation are worse. To improve ecosystem services, it is recommended that water yield enhancement on the Loess Plateau under the EC scenario should be closely integrated with the construction of ecological forests and ecological reserves. Ecological protection and management should be carried out in accordance with local conditions. In the NE scenario and the ED scenario, the government should emphasize the intensive use of constructed land in the eastern part of the Loess Plateau. Promote the construction of high-standard farmland and delimit the ecological red line area to maintain ecological green and sustainable development. (3) By using Spearman correlation and root-mean-square deviation analyses of the relationships between ESs, synergistic relationships were found between carbon storage and soil conservation, as well as soil conservation and water yield, with water yield and soil conservation being the most strongly correlated. After a comprehensive analysis of the three ESs and trade-offs, the ecological conservation scenario is considered the best scenario to guide land-use decision-making and ecosystem management compared to the 2020 ecosystem services trade-offs. Thus, the main objective of future planning is considered to be the enhancement of ecosystem services through the restoration of ecological land.

Author Contributions

M.X. and F.L. designed the research framework, performed the data analysis, and wrote the first draft; X.L.(Xiaohuang Liu) administrated the project and obtained funding; J.L. and X.L.(Xinping Luo) reviewed and edited the manuscript; L.X. and R.W. collated data and analyzed the forms; H.L. and F.G. commented on the manuscript. All authors have read and agreed to the published version of the manuscript.

Funding

This research was funded by Science and Technology Innovation Fund of Command Center of Integrated Natural Resources Survey Center(Grant No. 2021xjkk1400, and Grant No. DD20230514).

Data Availability Statement

No new data were created or analyzed in this study. Data sharing is not applicable to this article.

Conflicts of Interest

The authors declare no conflict of interest.

References

  1. Costanza, R.; d’Arge, R.; Groot, R.d.; Farber, S.; Grasso, M.; Hannon, B.; Limburg, K.; Naeem, S.; O’Neill, R.V.; Paruelo, J.; et al. The value of the world’s ecosystem services and natural capital. Ecol. Econ. 1998, 25, 253–260. [Google Scholar] [CrossRef]
  2. Fu, B.J.; Zhou, G.Y.; Bai, Y.F.; Yong, C.C.; Liu, J.Y.; Zhang, H.Y.; Lv, Y.H.; Zheng, H.; Xie, G.D. The Main Terrestrial Ecosystem Service and Ecological Security in China. Adv. Earth Sci. 2009, 24, 571–576. [Google Scholar]
  3. Parkes, M. Personal Commentaries on “Ecosystems and Human Well-being: Health Synthesis—A Report of the Millennium Ecosystem Assessment”. EcoHealth 2006, 3, 136–140. [Google Scholar] [CrossRef]
  4. Martínez-López, J.; Bagstad, K.J.; Balbi, S.; Magrach, A.; Voigt, B.; Athanasiadis, I.; Pascual, M.; Willcock, S.; Villa, F. Towards globally customizable ecosystem service models. Sci. Total Environ. 2019, 650, 2325–2336. [Google Scholar] [CrossRef] [PubMed]
  5. Zhang, Z.C.; Zhang, H.J.; Feng, J.; Wang, Y.Y.; Liu, K. Evaluation of Social Values for Ecosystem Services in Urban Riverfront Space Based on the SolVES Model: A Case Study of the Fenghe River, Xi’an, China. Int. J. Environ. Res. Public Health 2021, 18, 2765. [Google Scholar] [CrossRef]
  6. Wang, Y.; Meng, J.J.; Qi, Y.; Peng, F.L. Review of Ecosystem Management Based on the InVEST Model. Chin. J. Ecol. 2015, 34, 3526–3532. [Google Scholar] [CrossRef]
  7. Wang, X.F.; Zhang, X.R.; Feng, X.M.; Liu, S.R.; Yin, L.C.; Chen, Y.Z. Trade-offs and Synergies of Ecosystem Services in Karst Area of China Driven by Grain-for-Green Program. Chin. Geogr. Sci. 2020, 30, 101–114. [Google Scholar] [CrossRef]
  8. Groff, S.C.; Loftin, C.S.; Drummond, F.; Bushmann, S.; McGill, B. Parameterization of the InVEST Crop Pollination Model to spatially predict abundance of wild blueberry (Vaccinium angustifolium Aiton) native bee pollinators in Maine, USA. Environ. Model. Softw. 2016, 79, 1–9. [Google Scholar] [CrossRef]
  9. Li, Y.; Li, S.C.; Gao, Y.; Wang, Y. Ecosystem services and hierarchic human well-being: Concepts and service classification framework. Acta Geogr. Sin. 2013, 68, 1038–1047. [Google Scholar]
  10. Bennett, E.M.; Peterson, G.D.; Gordon, L.J. Understanding relationships among multiple ecosystem services. Ecol. Lett. 2009, 12, 1394–1404. [Google Scholar] [CrossRef]
  11. Shi, M.J.; Wu, H.Q.; Fan, X.; Jia, H.T.; Dong, T.; He, P.X.; Fahad, B.M.; Jiang, P.G. Trade-Offs and Synergies of Multiple Ecosystem Services for Different Land Use Scenarios in the Yili River Valley, China. Sustainability 2021, 13, 1577. [Google Scholar] [CrossRef]
  12. Sylla, M.; Hagemann, N.; Szewrański, S. Mapping trade-offs and synergies among peri-urban ecosystem services to address spatial policy. Environ. Sci. Policy 2020, 112, 79–90. [Google Scholar] [CrossRef]
  13. Wang, X.C.; Dong, X.B.; Liu, H.M.; Liu, H.M.; Wei, H.J.; Fan, W.G.; Lu, N.C.; Xu, Z.H.; Ren, J.H.; Xing, K.X. Linking land use change, ecosystem services and human well-being: A case study of the Manas River Basin of Xinjiang, China. Ecosyst. Serv. 2017, 27, 113–123. [Google Scholar] [CrossRef]
  14. Rimal, B.; Sharma, R.; Kunwar, R.; Keshtkar, H.; Stork, N.E.; Rijal, S.; Rahman, S.A.; Baral, H. Effects of land use and land cover change on ecosystem services in the Koshi River Basin, Eastern Nepal. Ecosyst. Serv. 2019, 38, 100963. [Google Scholar] [CrossRef]
  15. Huang, L.; Zhu, P.; Cao, W. The Impact of the Grain for Green Projec on the Trade-off and Synergy Relationships among Multiple Ecosystem Services in China. Acta Ecol. Sin. 2021, 41, 1178–1188. [Google Scholar]
  16. Anchal, J.; Upender, S.; Rakesh, S.; Swapna, S.; Anil, K. Impact of change of land use on ecosystem services. Curr. Adv. Agric. Sci. 2020, 12, 113–116. [Google Scholar]
  17. Xie, L.; Wang, H.W.; Liu, S.H. The ecosystem service values simulation and driving force analysis based on land use/land cover: A case study in inland rivers in arid areas of the Aksu River Basin, China. Ecol. Indic. 2022, 138, 108828. [Google Scholar] [CrossRef]
  18. Sunsanee, A.; Shrestha, R.P. Assessing Land Use Change and Its Impact on cosystem Services in Northern Thailand. Sustainability 2016, 8, 768. [Google Scholar]
  19. Hasan, S.S.; Lin, Z.; Miah, M.G.; Ahamed, T.; Samie, A. Impact of land use change on ecosystem services: A review. Environ. Dev. 2020, 34, 100527. [Google Scholar] [CrossRef]
  20. Cao, Q.W.; Gu, C.L.; Guan, W.H. China’s urbanization SD modelling and simulation based on land use. J. Nat. Resour. 2021, 36, 1062–1084. [Google Scholar] [CrossRef]
  21. Shao, Z.L.; Chen, C.Y.; Liu, Y.L.; Cao, J.; Liao, G.T.; Lin, Z.Y. Impact of Land Use Change on Carbon Storage Based on FLUS-InVEST Model: A Case Study of Chengdu–Chongqing Urban Agglomeration, China. Land 2023, 12, 1531. [Google Scholar] [CrossRef]
  22. Xu, Q.L.; Wang, Q.; Liu, J.; Liang, H. Simulation of Land-Use Changes Using the Partitioned ANN-CA Model and Considering the Influence of Land-Use Change Frequency. ISPRS Int. J. Geo-Inf. 2021, 10, 346. [Google Scholar] [CrossRef]
  23. Guan, D.J.; Zhao, Z.L.; Tan, J. Dynamic simulation of land use change based on logistic-CA-Markov and WLC-CA-Markov models: A case study in three gorges reservoir area of Chongqing, China. Environ. Sci. Pollut. Res. Int. 2019, 26, 20669–20688. [Google Scholar] [CrossRef] [PubMed]
  24. Lin, X.F.; Fu, H. Spatial-Temporal Evolution and Driving Forces of Cultivated Land Based on the PLUS Model: A Case Study of Haikou City, 1980–2020. Sustainability 2022, 14, 14284. [Google Scholar] [CrossRef]
  25. Zhao, M.M.; He, Z.B.; Du, J.; Chen, L.F.; Lin, P.F.; Fang, S. Assessing the effects of ecological engineering on carbon storage by linking the CA-Markov and InVEST models. Ecol. Indic. 2019, 98, 29–38. [Google Scholar] [CrossRef]
  26. Zheng, H.W.; Shen, G.Q.; Wang, H.; Hong, J.K. Simulating land use change in urban renewal areas: A case study in Hong Kong. Habitat Int. 2015, 46, 23–34. [Google Scholar] [CrossRef]
  27. Hu, Y.N.; Peng, J.; Liu, Y.X.; Tian, L. Integrating ecosystem services trade-offs with paddy land-to-dry land decisions: A scenario approach in Erhai Lake Basin, southwest China. Sci. Total Environ. 2018, 625, 849–860. [Google Scholar] [CrossRef]
  28. Peng, J.; Hu, X.Y.; Wang, X.Y.; Meersmans, J.; Liu, Y.X.; Qiu, S.J. Simulating the impact of Grain-for-Green Programme on ecosystem services trade-offs in Northwestern Yunnan, China. Ecosyst. Serv. 2019, 39, 100998. [Google Scholar] [CrossRef]
  29. Shoemaker, D.A.; BenDor, T.K.; Meentemeyer, R.K. Anticipating trade-offs between urban patterns and ecosystem service production: Scenario analyses of sprawl alternatives for a rapidly urbanizing region. Comput. Environ. Urban Syst. 2019, 74, 114–125. [Google Scholar] [CrossRef]
  30. Min, G.; Yan, X.; Hu, Y.F. Evaluation of Water Yield and Soil Erosion in the Three-River-Source Region under Different Land-Climate Scenarios. J. Resour. Ecol. 2020, 11, 13–26. [Google Scholar] [CrossRef]
  31. Lin, S.W.; Wu, R.D.; Yang, F.L.; Wang, J.J.; Wu, W. Spatial trade-offs and synergies among ecosystem services within a global biodiversity hotspot. Ecol. Indic. 2018, 84, 371–381. [Google Scholar] [CrossRef]
  32. Fan, Y.T.; Jin, X.B.; Gan, L.; Lin, J.H.; Yang, Q.K.; Lv, L.G.; Li, Y. Spatial characteristics and influencing mechanism of trade-offs between multiple land use functions in the Yangtze River Delta region. Resour. Sci. 2022, 44, 1589–1603. [Google Scholar] [CrossRef]
  33. Chawanji, S.; Masocha, M.; Dube, T. Spatial assessment of ecosystem service trade-offs and synergies in Zimbabwe. Trans. R. Soc. South Afr. 2018, 73, 172–179. [Google Scholar] [CrossRef]
  34. Zhao, X.Y.; Ma, P.Y.; Li, W.Q.; Du, Y.X. Spatiotemporal Changes of the Supply and Demand of Ecosystem Services in the Loess Plateau. Acta Geogr. Sin. 2021, 76, 2780–2796. [Google Scholar]
  35. Zhang, L.X.; Fan, J.W.; Zhao, H.Y.; Zhou, D.C. Spatio-temporal Variations and Their Driving Forces of Ecological Vulnerability in the Loess Plateau. Environ. Sci. 2022, 43, 4902–4910. [Google Scholar]
  36. Wei, L.; Fu, B.J.; Wang, C.; Zhang, W.B.; Zhao, J.; Feng, X.M.; Yan, J.W.; Liu, Y.; Zhou, S. Quantification of the ecosystem carrying capacity on China’s Loess Plateau. Ecol. Indic. 2019, 101, 192–202. [Google Scholar]
  37. Fu, B.J.; Wang, S.; Liu, Y.; Liang, W.; Miao, C.Y. Hydrogeomorphic Ecosystem Responses to Natural and Anthropogenic Changes in the Loess Plateau of China. Annu. Rev. Earth Planet. Sci. 2017, 45, 223–243. [Google Scholar] [CrossRef]
  38. Liang, X.; Guan, Q.; Clarke, K.C.; Liu, S.S.; Wang, B.Y.; Yao, Y. Understanding the drivers of sustainable land expansion using a patch-generating land use simulation (PLUS) model: A case study in Wuhan, China. Comput. Environ. Urban Syst. 2021, 85, 101569. [Google Scholar] [CrossRef]
  39. Chen, M.; Vernon, C.R.; Graham, N.T.; Hejazi, M.; Huang, M.Y.; Cheng, Y.Y.; Calvin, K. Global land use for 2015–2100 at 0.05° resolution under diverse socioeconomic and climate scenarios. Sci. Data 2020, 7, 320. [Google Scholar] [CrossRef]
  40. Donohue, R.J.; Roderick, M.L.; McVicar, T.R. Roots, storms and soil pores: Incorporating key ecohydrological processes into Budyko’s hydrological model. J. Hydrol. 2012, 436–437, 35–50. [Google Scholar] [CrossRef]
  41. Zhang, L.; Dawes, W.R.; Walker, G.R. Response of mean annual evapotranspiration to vegetation changes at catchment scale. Water Resour. Res. 2001, 37, 701–708. [Google Scholar] [CrossRef]
  42. Yang, J.; Xie, B.P.; Zhang, D.G. Spatio-temporal variation of water yield and its response to precipitation and land use change in the Yellow River Basin based on InVEST model. J. Appl. Ecol. 2020, 31, 2731–2739. [Google Scholar]
  43. Xu, L.; He, N.P.; Yu, G.R. A dataset of carbon density in Chinese terrestrial ecosystem (2010s). China Sci. Data 2019, 4, 90–96. [Google Scholar]
  44. Yang, J.; Xie, B.P.; Zhang, D.G. Spatio-temporal evolution of carbon stocks in the Yellow River Basin based on InVEST and CA-Markov models. Chin. J. Eco-Agric. 2021, 29, 1018–1029. [Google Scholar]
  45. Li, M.Y.; Shangguan, Z.P.; Deng, L. Spatial distribution of carbon storage in the terrestrial ecosystem and its influencing factors on the Loess Plateau. Acta Ecol. Sin. 2021, 41, 6786–6799. [Google Scholar]
  46. Yu, H.; Jin, L.; Tang, B.X.; Qi, Z.; Shen, M.T.; Mou, S.H. Trade-off and Synergy Analysis of Ecological Services of Grain for Green Program in Loess Plateau: A Case Study of Ansai County. Chin. J. Ecol. 2023, 42, 544–551. [Google Scholar]
  47. Renard, K.G.; Foster, G.R.; Weesies, G.A.; Porter, J.P. Rusle: Revised universal soil loss equation. Soil Water Conserv. 1991, 46, 30–33. [Google Scholar]
  48. Zhang, W.B.; Fu, J.S. Rainfall erosivity estimation under different rainfall amount. Resour. Sci. 2003, 1, 35–41. [Google Scholar]
  49. Williams, J.R. The Erosion-Productivity Impact Calculator (EPIC) Model: A Case History. Philos. Trans. Biol. Sci. 1990, 329, 421–428. [Google Scholar]
  50. Harmáčková, Z.V.; Vačkář, D. Modelling regulating ecosystem services trade-offs across landscape scenarios in Třeboňsko Wetlands Biosphere Reserve, Czech Republic. Ecol. Model. 2015, 295, 207–215. [Google Scholar] [CrossRef]
  51. Lv, Y.; Fu, B.; Feng, X.; Zeng, Y.; Liu, Y.; Chang, R.; Sun, G.; Wu, B. A policy-driven large scale ecological restoration: Quantifying ecosystem services changes in the Loess Plateau of China. PLoS ONE 2017, 7, e31782. [Google Scholar]
  52. Bradford, J.B.; D’Amato, A.W. Recognizing trade-offs in multi-objective land management. Front. Ecol. Environ. 2012, 10, 210–216. [Google Scholar] [CrossRef] [PubMed]
  53. Wang, B.S.; Liao, J.F.; Zhu, W.; Qiu, Q.Y.; Wang, L.; Tang, L.N. The weight of neighborhood setting of FLUS model based on a historical scenario: A case study of land use simulation of urban agglomeration of the Golden Triangle of Southern Fujian in 2030. Acta Ecol. Sin. 2019, 39, 4284–4298. [Google Scholar]
  54. Babbar, D.; Areendran, G.; Sahana, M.; Sarma, K.; Raj, K.; Sivadas, A. Assessment and prediction of Carbon Sequestration using Markov chain and InVEST model in Sariska Tiger Reserve, India. J. Clean. Prod. 2021, 278, 123333. [Google Scholar] [CrossRef]
  55. Chaudhuri, G.; Clarke, K.C. Modeling an Indian megalopolis–A case study on adapting SLEUTH urban growth model. Comput. Environ. Urban Syst. 2019, 77, 101358. [Google Scholar] [CrossRef]
  56. Gong, J.Z.; Hu, Z.R.; Chen, W.R.; Liu, Y.S.; Wang, J.Y. Urban expansion dynamics and modes in metropolitan Guangzhou, China. Land Use Policy 2018, 72, 100–109. [Google Scholar] [CrossRef]
  57. Ning, J.; Shao, Q.Q. Temporal and spatial characteristics of land use and ecosystem services in the Loess Plateau. J. Agro-Environ. Sci. 2020, 39, 774–785. [Google Scholar]
  58. Wang, X.Z.; Wu, J.Z.; Wu, P.X.; Shangguan, Z.P.; Deng, L. Spatial and Temporal Distribution and Trade-offs of Water Conservation, Soil Conservation and NPP Services in Ecosystem of the Loess Plateau from 2000 to 2015. J. Soil Water Conserv. 2021, 35, 114–121+128. [Google Scholar]
  59. Yang, J.; Xie, B.P.; Zhang, D.G. Spatial-temporal heterogeneity of ecosystem service trade-off synergy in the Yellow River Basin. J. Desert Res. 2021, 41, 78–87. [Google Scholar]
  60. Lyu, R.F.; Zhang, J.M.; Xu, M.Q.; Li, J.J. Impacts of urbanization on ecosystem services and their temporal relations: A case study in Northern Ningxia, Chinac. Land Use Policy 2018, 77, 163–173. [Google Scholar] [CrossRef]
  61. Lang, Y.Q.; Song, W.; Zhang, Y. Responses of the water-yield ecosystem service to climate and land use change in Sancha River Basin, China. Phys. Chem. Earth 2017, 101, 102–111. [Google Scholar] [CrossRef]
  62. Hou, G.R.; Bi, H.X.; Wei, X.; Zhou, Q.Z.; Kong, L.X.; Wang, J.S.; Jia, J.B. Water Conservation Function of Litter sand Soil in Three Kinds of Woodlands in Gully Region of Loess Platea. J. Soil Water Conserv. 2018, 32, 357–363+371. [Google Scholar]
  63. Feng, Q.; Zhao, W.W.; Hu, X.P.; Liu, Y.; Daryanto, S.; Cherubini, F. Trading-off ecosystem services for better ecological restoration: A case study in the Loess Plateau of China. J. Clean. Prod. 2020, 257, 120469. [Google Scholar] [CrossRef]
  64. Li, T.; Lv, Y.H.; Fu, B.J.; Hu, W.Y.; Comber, A.J. Bundling ecosystem services for detecting their interactions driven by large-scale vegetation restoration: Enhanced services while depressed synergies. Ecol. Indic. 2019, 99, 332–342. [Google Scholar] [CrossRef]
  65. Liu, K.D.; Yang, D.G.; Wang, G.H.; Zhou, Z.T. Policy Modeling and Simulationon Ecological Civilization Constructionin China Based on System Dynamics. Chin. J. Manag. Sci. 2020, 28, 209–220. [Google Scholar]
  66. Liu, Z.X.; Ruan, Y.L. The Research on the Comprehensive Evaluation and Spatiotemporal Evolution of Ecological Tax and Environmental Integration Development in China. Ecol. Econ. 2022, 38, 179–187. [Google Scholar]
Figure 1. Location of the study area in China together with the DEM (Digital Elevation Model).
Land 12 02087 g001
Figure 2. Research framework.
Land 12 02087 g002
Figure 3. Land-use maps of the Loess Plateau from 2000 to 2030 under the natural evolution scenario (NE), the ecological conservation scenario (EC), and the economic development scenario (ED).
Land 12 02087 g003
Figure 4. The dynamic index (%) of the area proportion of land use/land cover (LULC) in the Loess Plateau from 2020 to 2030 under three scenarios.
Land 12 02087 g004
Figure 5. Spatial distribution of ESs changes in the Loess Plateau from 2000 to 2030 under different scenarios.
Land 12 02087 g005
Figure 6. Heat map of Spearman correlation coefficient between ecosystem services from 2020 to 2030 under different scenarios.
Land 12 02087 g006
Figure 7. Spatial distribution of ES trade-offs at the county level scale in 2020 and 2030 under different scenarios.
Land 12 02087 g007
Table 1. The total and average value of multiple ecosystem services (ESs) from 2000 to 2020 and the predicted ESs in 2030 under three different scenarios.
Water YieldCarbon StorageSoil Conservation
Average
(mm)
Total
(108 m3)
Average
(t/km2)
Total
(108 t)
Average
(t/km2)
Total
(108 t)
200047.46315.275724.28937.2783930.69430.39
201074.044488.7185738.74637.3715098.92138.99
2020102.44672.8255709.7337.185760.77244.32
NE169.521116.45683.9137.0125615.2243.19
EC169.151114.085732.8237.335622.9443.247
ED170.091120.065587.0436.385567.3242.9
Disclaimer/Publisher’s Note: The statements, opinions and data contained in all publications are solely those of the individual author(s) and contributor(s) and not of MDPI and/or the editor(s). MDPI and/or the editor(s) disclaim responsibility for any injury to people or property resulting from any ideas, methods, instructions or products referred to in the content.

