Abstract
Rational differentiated utilization of cultivated land can effectively coordinate the contradiction between ecological protection, cultivated land utilization, and urban development. Therefore, this article adopts the southern section of the Yellow River Basin as an example, starting with vulnerability and resilience and then formulating an index system for evaluating farmland ecological vulnerability and farmland resilience. Moreover, this article combines Future Land-Use Simulation–Urban Growth Boundaries (FLUS–UGBs) to conduct urban development boundary simulations, which take the urban development boundary as restrictions and comprehensive division and determine the differentiated utilization zoning strategies for cultivated land to achieve coordinated development between ecological protection, cultivated land use, and urban development. The following results are presented: (1) The ecological vulnerability of the research area mainly involves low-to-medium vulnerability; the western and middle sections of the research area demonstrate high and low ecological vulnerability, respectively. (2) Areas with high resilience of cultivated land are mainly located in the mid-eastern part of the research area, and those with low resilience mainly involve the western mountains. (3) The four-quadrant method, the PLUS model, and the FLUS-UGB module are employed to determine differentiated usage zones for cultivated land to achieve rational allocation and effective use of resources.
1. Introduction
Cultivated land is the basis of agricultural production, which is the “ballast stone” of food security. In recent years, people have become profoundly aware of the importance of cultivated land and have strictly abided by the red line of 1.8 billion mu of cultivated land. The importance of farmland has attracted widespread attention at the national and global levels, and there is growing recognition of the importance of farmland for national food security and social stability. However, global and regional problems of cultivated land are becoming increasingly prominent within urban and industry development [1]. On the one hand, cultivated land resources have been irrationally occupied and overcultivated for a long time, which causes the loss of high-quality arable land resources; on the other hand, high-strength, unreasonable development, and utilization lead to overdrawn cultivated land and quality deterioration. Additionally, soil fertility degradation and pollution aggravation are frequent due to the overuse of pesticides, fertilizers, and films, which seriously damages the structure and function of farmland ecosystems. Such problems frequently appear, making the ecosystem of cultivated land very fragile, seriously threatening the subsequent sustainable use of cultivated land in China. Moreover, the situation of natural disasters in China is complex and severe and extreme weather and climate events are frequent. The 2021 National Natural Disaster Statistics released by the Ministry of Emergency Management revealed 42 heavy rainfall processes in China. Consequently, the area of crop damage is 117,390 km2 and the direct economic loss is 334.02 billion CNY. Particularly, in mid-to-late July 2021, Henan was hit by exceptionally heavy rains and floods, which affected 150 counties (cities and districts) in 16 cities, including Zhengzhou, Xinxiang, and Hebi. Extreme heavy rainfall occurred in Suizhou, Hubei and Xi’an, Shanxi, in August, which also induced severe waterlogging, flash floods, and geological disasters that considerably harmed crop growth and food production. Statistics indicate that ecologically fragile areas in China account for more than 60% of its land area; it is also one of the countries in the world with the largest distribution of ecologically fragile areas and relatively evident ecological fragility, which seriously restricts the sustainable development of its economy and society. Additionally, the overall ecological environment of China is fragile, and ecological degradation due to development and construction in local areas and other problems are still relatively serious, with the overall trend of biodiversity decline not being effectively curbed [2]. Therefore, important means that can be used to coordinate ecological environment protection and development not only involve scientific understanding, rational optimization, and regulation of regional ecological environment, but also involve the urgent need for ecological civilization construction.
With the growth of its population and economic development, China’s demand for agricultural production and arable land resources is increasing. Exploring the sustainable utilization strategy of arable land from a vulnerability perspective can address current and future agricultural needs while ensuring food security and the sustainability of rural development. The concept of ecological fragility was introduced in the field of ecology by Clements in 1905 [3], referring to the ecological interface zone between different communities. In the 1980s, with the advancement of research, it was recognized as the ecological transition zone between adjacent ecosystems [4], defined by the phenomena of ecological environment degradation, landscape fragmentation, and land-use change caused by the joint action of nature and human activities, thus resulting in the formation of a fragile ecological environment. Hence, the study of ecological vulnerability has gradually become the research direction of the International Geosphere–Biosphere Program and the Intergovernmental Panel on Climate Change (IPCC), and the IPCC noted that vulnerability and adaptation assessment is an important practice for the impact of climate change on natural and human systems [5]. There are three main understandings of ecological and environmental vulnerability [6,7,8]. The first view is defined from the attributes of natural ecology, in which ecosystems exhibit undesirable changes once they exceed their self-healing capacity. The second view is from the source of ecological vulnerability, in which ecological vulnerability is the capability of internal systems to withstand adverse impacts. The third view of ecological vulnerability manifests itself as a combination of internal and external effects within and outside the system. Considering this view, vulnerability is defined as a collection of risk, stress, resilience, adaptability, and sensitivity. Different perspectives and research backgrounds of ecological vulnerability lead to various disciplinary understandings. Therefore, the concept of ecological vulnerability is not yet uniformly defined [9]. This article considers the resistance, resilience, and regenerative power of the ecological environment when it is disturbed by the outside world. The formation of this environment is not only related to natural factors, such as geographical location and climatic conditions, but also related to human factors, such as industrial structure and the economic development mode, which reflects the likelihood and magnitude of ecological problems within the region. At this stage, the methods of ecological vulnerability assessment mainly include the ecological footprint method [10], numerical modeling method [11], parametric system method [12,13], and landscape pattern analysis [14]. The index system generally comprises the pressure–state–response index [15], cause–effect indicator [16], coercion–sensitivity–adaptability index [17], and multisystem evaluation index [18]. As the scale of ecological vulnerability gradually deepens from micro to macro, there is no unified standard for its evaluation index system. With comprehensive investigation, research on ecological vulnerability has gradually expanded to analyze the evolution of space and time [19] and explore drivers [20], multiscale transfer [21], and multisource data mining [22]. However, avoiding the problems of difficult unification of evaluation indicators, strong subjectivity of weights, and complexity in defining outcome thresholds is still impossible. The fragility of arable land in China is intricately connected to the fragility of the nation’s overall ecological environment. China’s arable land confronts various challenges of vulnerability, including climate change, land degradation, and water scarcity. Human activities have also resulted in detrimental impacts on cultivated land, such as over-cultivation and excessive fertilization. When these issues afflict arable land, the overall ecological environment suffers damage, leading to a decline in biodiversity and the exacerbation of water and air pollution. Consequently, the overall ecological environment becomes more fragile. By safeguarding and restoring the cultivated land ecosystem, we can uphold ecological balance and promote sustainable agricultural development, thereby achieving the stability and sustainability of the overall ecological environment.
Contrary to vulnerability, resilience emphasizes the capability of the system to absorb, adapt, resist, and maintain its original state [23]. The term resilience, which indicates the capability of a system to resist, adapt, and recover, was first applied to the study of mechanics [24]. However, cultivated land, which is the most important component of the farmland ecosystem, is not only limited by the natural environment but also affected by human activities. Therefore, cultivated land resilience can be summarized as the capability of cultivated land ecosystems to maintain or restore their original state after external disturbances [25]. With the development of the economic society, the cultivated land utilization system has undergone an intricate evolution process from simple to complex and from disorder to order; its structure has also gradually evolved into a complex of natural endowments coupled with socioeconomic development [26]. Therefore, the resilience of the cultivated land-use system can be divided into two parts. The first part lies in the inherent resilience of cultivated land resources, which is mainly manifested as the natural endowments of cultivated land, such as soil, hydrology, climate, topography, and light. This system is a concentrated embodiment of the quality of cultivated land and is also the intrinsic driving force for the resilience of the cultivated land utilization system. The second part focuses on the external resilience of cultivated land resources, which is closely related to labor, machinery, technology, capital, and property rights. Thus, this system is also the external support for the resilience of the cultivated land utilization system. Current research on resilience is mostly focused on the fields of materials [27,28] and cities [29,30], while the agricultural sector has only gradually begun to measure rural resilience in recent years [31]. Research on the resilience of arable land is limited; therefore, this article can expand on the field of resilience research. Research on sustainable farmland utilization strategies contributes to enhancing the resilience of cultivated land. This involves enhancing cultivated land management and protection measures, optimizing the utilization of land resources, and improving the resilience of agricultural production systems to ensure the long-term sustainability of agricultural production.
Cultivated land has a profound impact on China’s food security strategies. In the outline of the 14th Five-Year Plan for National Economic, Social Development, and the Long-Range Goals for 2035, food security is also ranked first among the three major security strategies in the new stage.
However, the rapid expansion of urban areas inevitably leads to the issue of cultivated land conversion. According to statistics, the national area of construction land increased by 41.04% from 2010 to 2020. Additionally, with the acceleration of urbanization, the land demand for urban construction will continue to increase in the future, further intensifying the contradiction between urban development and arable land protection.
The red line of 1.8 billion mu of arable land represents the minimum requirement for ensuring food security in China. However, for the rational and efficient development of cities and towns, it is necessary to uphold the strict bottom line while embracing flexible utilization approaches. By prioritizing cultivated land protection and considering urban development, we can promote urban growth while ensuring the efficiency of land use. Simultaneously, efforts should be made to reconcile and mitigate the inherent contradiction between the two, thereby fostering high-quality urban development. This article employs the PLUS model [32] based on the evaluation of ecological vulnerability and cultivated land resilience to simulate future land-use patterns. In addition, the UGB module simulates the urban development boundary under different development scenarios through the FLUS model. This strategy aims to realize the rational and optimal allocation of ecological protection, cultivated land utilization, and urban development and promote the high-quality development of river basins. Furthermore, this study combines the results of land ecological vulnerability and farmland resilience to implement farmland zoning protection, aiming to protect farmland more effectively and promote the rational and sustainable utilization of farmland resources. In comparison to the single evaluation of farmland, this study adopts multiple methods and models to investigate strategies for sustainable farmland utilization. The evaluation results are more informative and can provide theoretical references for research in other regions.
2. Materials and Methods
2.1. Overview of the Research Area
The southern section of the Yellow River Basin (As shown in Figure 1) mainly includes 43 counties (cities) under the jurisdiction of 8 prefectures and cities of Sanmenxia, Jiyuan, Luoyang, Zhengzhou, Jiaozuo, Xinxiang, Kaifeng, and Puyang, which are located at 110°21′–116°39′ E, 33°55′–36°22′ N. This area has an average annual temperature of 12.7 °C and an average annual precipitation of 630 mm. The terrain is high in the west and low in the east, transitioning from medium and low mountains and hills to plains. The cultivated land area of the Yellow River Basin of Henan Province is 20,833.84 km2 and the forest area is 14,826.16 km2, accounting for 39.9% and 28.4% of the regional land area, respectively. The data of the seventh population census indicated that the permanent population within the study area in 2020 was 21,485,300, accounting for 21.6% of the total population of the province. The GDP of the region is 1.458608 billion CNY, accounting for 30.4% of the province, and the per capita GDP is 59,334 CNY. With the proposal of the national strategy for ecological protection and high-quality development of the Yellow River Basin, a total of 773.34 km2 of afforestation and greening have been implemented in the southern section of the Yellow River Basin, with 486.67 km2 accounting for forest tending, and 280 km2 accounting for soil erosion treatment. Moreover, the wetland conservation rate was 53.3% in 2021, which was 8.4% higher than the provincial average, demonstrating satisfactory results in ecological protection. Furthermore, as of 2022, a total of 32,940 km2 of high-standard farmland has been established in the Yellow River Basin of Henan Province, accounting for more than 65% of the province, and the area of high-quality special wheat in the region is 8066.67 km2, accounting for 74.3% of the province. Grain production in the southern section of the Yellow River Basin is arduous and food security is prominent, indicating that economic development is also related to the high-quality development of the Yellow River Basin. The grain production capacity of the southern section of the Yellow River Basin plays a pivotal role in the sustainable development of the nation. By implementing efficient agricultural production management and fostering technological innovation, the southern section of the Yellow River Basin can reliably provide a substantial grain supply, thereby ensuring the country’s food security. Therefore, studying the sustainable use of cultivated land not only effectively promotes the implementation of the national strategy of ecological protection and high-quality development of the Yellow River Basin, but also provides reference for similar regional development.
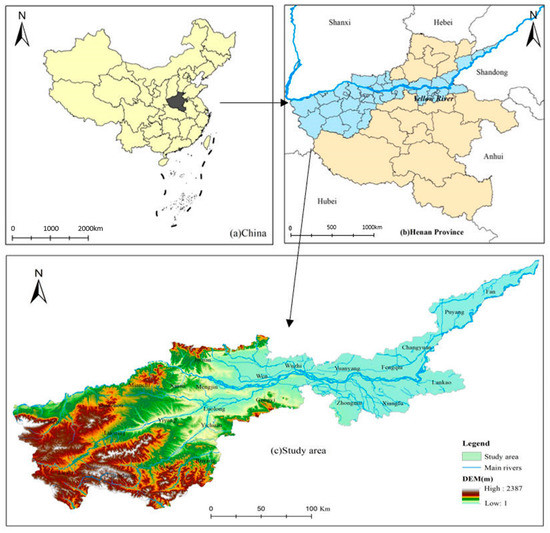
Figure 1.
Study area overview.
2.2. Data Sources
- Spatial data
The land-use data used in this paper are derived from the 30 m China Land Cover Dataset (CLCD) [33]; soil data are sourced from the HWSD World Soil Database and Henan Province Soil Database; nighttime light data come from the Luojia-1 satellite; DEM data come from the geospatial data cloud; NPP data come from MOD17A3HGF Version 6.0 products; the leaf area index is derived from the globmap leaf area index dataset [34]; rainfall data are from the National Earth System Science Data Center and river system data from the OSM map platform (Table 1).

Table 1.
Data sources and access methods.
- 2.
- Statistics. From Henan Statistical Yearbook, Statistical Yearbook of various cities, Henan Provincial Water Resources Bulletin.
2.3. Research Methods
2.3.1. Research Framework
From the perspective of combining ecological vulnerability and cultivated land resilience, a research framework for cultivated land zoning protection in the Yellow River Basin of Henan Province was constructed, and the entire framework was divided into six parts. (1) The AHP analytic hierarchy method was used on the basis of the SRP model to evaluate the ecological vulnerability of the study area. (2) The resilience of cultivated land in the study area is assessed from the perspectives of internal and external resilience. (3) The four-quadrant method is used to divide different protection zones according to the spatial overlay relationship. (4) Land-use change is simulated using the PLUS model, and drivers include DEM, slope, aspect, rainfall, GDP level, population density, distance from town center, road distance, rail distance, and water system distance. (5) The FLUS–GB module is adopted in accordance with different development scenarios to calculate the urban development boundary. (6) The evaluation results of urban development boundary, ecological vulnerability, and cultivated land resilience revealed the reasonable division of cultivated land utilization zoning (Figure 2).
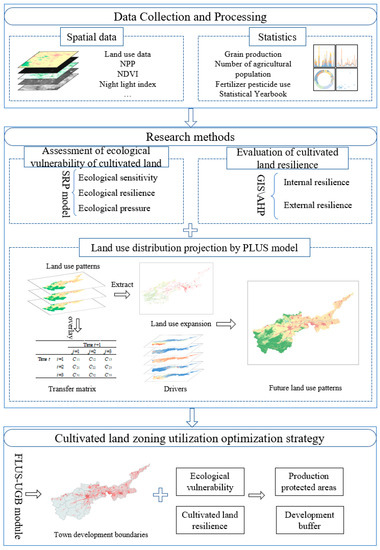
Figure 2.
Research framework.
2.3.2. Ecological Vulnerability Assessment
The ecological vulnerability of the study area is evaluated from three dimensions based on the SRP model: ecological sensitivity, ecological resilience, and ecological stress [35,36]. Ecological sensitivity refers to the extent to which the components of the land ecosystem in a region respond to adverse impacts when disturbed by natural or anthropogenic factors. This sensitivity also reflects the likelihood and magnitude of ecological problems within the region. Ecological sensitivity indexes were selected in this paper from the aspects of topographic and soil erosion factors. Ecological resilience refers to the capability of an ecosystem to return to its original state or near its original state under disturbance from the outside world. The evaluation indicators of ecological resilience were selected from the aspects of vegetation and meteorological factors. Ecological stress indicates the intensity of possible interference with the ecosystem, which is closely related to human activities. Therefore, the evaluation index of ecological stress is selected in this paper from the aspect of human activity factors (Table 2).

Table 2.
Indicator system and weight of farmland ecological vulnerability assessment in the Yellow River Basin (Henan section).
Connotation and Calculation of Ecological Vulnerability Assessment Indicators
- Indicators of ecological sensitivity
(1) Terrain factor: Terrain factors are mainly used to reflect the topographic conditions within the study area, including the following three indicators: DEM, slope, and terrain undulation. The terrain undulation represents the difference in elevation between the highest and lowest points within the study area; it is also regarded as a macro indicator, which describes the flatness of the terrain in an area. Moreover, terrain undulation needs the maximum height difference within a certain range of the ground for calculation.
(2) Soil erosion factor: This factor includes soil and rainfall erosion. Among these factors, soil erosion refers to the difficulty of separation and transportation of soil particles by water and is mainly related to soil texture, soil structure, and organic matter content.
where mc, msilt, ms, and orgC are the percentage content of clay, powder, sand, and organic carbon, respectively.
Rainfall erosion refers to the potential capacity of soil erosion due to rainfall, which indicates the erosion degree of the ground by rainwater and is closely related to local rainfall. This study uses the empirical formula proposed by Wischmeier [37] for calculating rainfall erosion force factor R as shown below.
where Pi and P are the average monthly and annual rainfall, respectively.
- 2.
- Indicators of ecological resilience
(1) Vegetation factor: This factor includes vegetation cover, leaf area index, net primary productivity, and species abundance index. Vegetation coverage refers to the proportion of the area occupied by the vertical projection of the canopy, branches, and leaves of all vegetation (trees, shrubs, grasses, and crops) within the growing area. The quality of the regional ecological environment can be effectively described through vegetation coverage. The cell dichotomous method is currently used for calculations through NDVI; that is, the cell dichotomous model is established by using NDVI and vegetation coverage to estimate the vegetation coverage of the study area. The calculation formula is as follows:
where is the pixel value in the infrared band, and is the pixel value in the red band.
Net primary productivity of vegetation: This indicator reflects the productive capacity of plant communities under natural environmental conditions and is also an important factor in determining the quality of ecosystems and carbon sinks. Moreover, this indicator reflects the productive capacity and ecological processes of vegetation communities.
Leaf area index: This index refers to the multiple of the total area of plant leaves to the total land area per unit land area. The leaf area index can dynamically reflect the growth of crop groups and the stability of ecosystems and measure the number of plant pages, canopy structure changes, plant community vitality, and environmental effects in an area.
Species abundance index: This index is one of the indicators used to measure the abundance of biodiversity in an area and is also one of the most essential characteristics that reflect the quality and stability of the ecosystem. The calculation formula is as follows:
where Abio is the normalization coefficient of the biological abundance index, and Amax is the maximum value before normalization treatment.
(2) Meteorological factors: Weather is an important part of ecosystems, and common meteorological factors include temperature and rainfall. Temperature variations within the study area are within 1–2 °C and the change is small, so the impact of temperature changes on the ecological resilience of cultivated land is excluded. On the one hand, rainfall can increase soil moisture, promote crop growth, and improve microbial activity; on the other hand, it can supplement the required water for plant growth and improve the quality of the ecological environment. Therefore, this paper selects rainfall to measure the impact of meteorological factors on ecological resilience.
- 3.
- Indicators of ecological stress
(1) Expansion of construction land: In the process of urbanization, the ecological and environmental problems caused by the expansion of construction land are inevitable (for example, the risk of heavy metal pollution induced by the discharge of “exhaust gas,” “wastewater,” and “solid waste” in industrial production). Surface hardening caused by human engineering activities can increase the difficulty of seeping down for surface water; thus, groundwater will not be recharged. The magnitude of surface temperature change is drastic, and the buffering effect is poor, destroying the living environment of microorganisms and inducing many other ecological problems. Overall, these conditions can seriously affect regional ecological stability. The PLUS model is used in this paper to predict future land-use changes and in conjunction with trends in the expansion of construction land to reflect future pressures on ecosystems.
(2) Intensity of fertilizer pesticide use: In the process of agricultural production, fertilizers and pesticides produce organic matter, and nitrogen and phosphorus pollution through surface runoff and groundwater infiltration can seriously destabilize the ecosystem.
(3) Road construction: Road construction has a serious impact on surface vegetation, landscape, and water bodies. This indicator destroys the integrity of the landscape and increases landscape fragmentation, fragmenting the living environment of animals and finally raising the pressure on the ecological environment.
- 4.
- Standardization of evaluation indicators
Ecological vulnerability involves multiple indicators. However, the index units of various parties are different, and the range of values varies, thereby resulting in a lack of comparability. This article uses the min–max standardization method to eliminate the influence of dimensions and standardize the evaluation indexes.
Positive indicators:
Negative indicators:
where is the normalized value; is the actual value of the indicator; d e the minimum and maximum values of the indicator within the study area.
- 5.
- Ecological vulnerability index calculation
The comprehensive composite index method was used in this paper to evaluate the ecological vulnerability of the study area, and the calculation formula is as follows:
where EVI is the eco-vulnerability index, and is the standardized value of the indicator (including ecological sensitivity, resilience, and stress indexes) is the weight of the metric, and n is the number of indicators.
(1) Calculation formula of the ecosensitivity index:
where ESI is an ecosensitivity index, is a normalized value for the ecosensitivity indicator, is the weight of the metric is the weight of the metric, and n is the number of indicators.
(2) Calculation formula of the ecological resilience index:
where ERI is the ecological resilience index, is the normalized value of the ecological resilience indicator, is the weight of the metric, and n is the number of indicators.
(3) Calculation formula of the ecological stress index:
where EPI is the eco-stress index, is the standardized value of the ecological stress index, is the weight of the metric, and n is the number of indicators.
- 6.
- Ecological vulnerability classification
The ecological vulnerability index is standardized before grading, and the calculation formula is presented as follows:
Based on existing research experience [38], the normalized ecological vulnerability index is divided into five levels, and the grading standards for each grade are as follows (Table 3).

Table 3.
Eco-fragility index grading.
2.3.3. Cultivated Land Resilience Diagnosis
Cultivated land resilience refers to the combination of internal motivation and external power; that is, absorbing and adapting to external interference and impacts to the greatest degree. This type of resilience can also be understood as the capability of cultivated land ecosystems to maintain or restore their original state after external disturbance: a high resilience strengthens the capability of the region to resist external disturbances or restore the status quo and vice versa. Therefore, a comprehensive index system was constructed on the basis of the two aspects of internal resilience and resilience to evaluate the stress resistance of cultivated land.
Internal resilience mainly refers to natural endowments, including soil, hydrology, topographic conditions, and other factors.The internal resilience of the cultivated land system in the study area was measured in this article by using the surface soil texture, groundwater level, slope, soil water content, and organic carbon content indicators. The effective soil thickness refers to the thickness of the soil layer, which can provide the nutrients and water required for crop growth. This thickness is the basic condition for plants to take root and is closely related to the growth of crop roots; a thick soil layer strengthens its capability to retain water and fertilizer. Organic carbon content refers to various positive carbon-containing organic compounds in the soil. This type of content is not only an important ecological factor but also affects the quality of cultivated land and the sustainable development of agriculture. Moreover, this content directly affects the level of soil fertility and erosion resistance. Soil texture is closely related to soil aeration, fertilizer retention, water retention, and cultivation difficulty; it is the basis for self-regulating the ecological quality of cultivated land.
External resilience is closely related to the socioeconomic factors, such as manpower, capital, and machinery provided by human society [39]. The degree of agricultural mechanization, ditch density, distance from rivers, GDP level, and population density were selected in this paper to reflect the external resilience of the cultivated land-use system. The degree of agricultural mechanization reflects the mechanization level of agricultural production and is mainly calculated by the number of agricultural machines in the region, the total power of agricultural machinery, and the amount of agricultural diesel used. The distance from the river and the density of the ditch reflect the irrigation and drainage capacity of the field. Meanwhile, the distance to the river is obtained using the near analysis tool. The density of ditches is the degree of distribution concentration of ditches per unit area, and its calculations are performed by using the ArcGIS software kernel density analysis tool. The level of GDP reflects the financial support of the local government and population density reflects regional manpower support.
This article adopts the analytic hierarchy method to determine the comprehensive weights, and the indicators are graded as follows (Table 4).

Table 4.
Evaluation index system and weight of cultivated land resilience in the Yellow River Basin (Henan section).
This article adopts the weighted comprehensive evaluation method to calculate the total score of each evaluation unit, and the calculation formula is as follows:
where Q is the total score of the evaluation unit; Qi and Wi are the scores and weights of the i-th indicator, respectively; and n is the number of evaluation units.
2.3.4. Simulation of Future Land-Use Change
Land-use change simulation is conducted in this paper based on the PLUS model (Figure 3), which comprises the following three parts: extracted land expansion, the land-use expansion analysis strategy, and the CA model (CARS) based on multiclass random plaque seeds. This article selects the following eight factors as drivers of land-use change: slope, rainfall, DEM, GDP, population density, distance to highway, distance to railway, and distance to urban center [40]. The river water surface is also chosen as the restriction conversion area. The Kappa coefficient is used to test the accuracy of the model by simulating land use in 2020 based on the 2010 land-use data. The land-use change in 2035 is also simulated after passing the test.
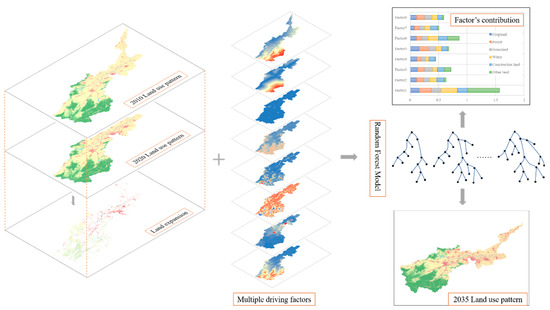
Figure 3.
Future land-use change simulation based on the PLUS model.
3. Results and Analysis
3.1. Ecological Vulnerability Analysis
The ecological sensitivity index is calculated on the basis of topographic and soil erosion factors. This index is mainly manifested as the spatial distribution characteristics; that is, high in the southwest and northeast regions and low in the middle (Figure 4a). For high-value areas, the terrain undulations in the southwest mountainous hilly area can reach up to 781 m, with severe terrain undulations leading to severe soil erosion. Moreover, the northeast plain area is low-lying and prone to waterlogging; therefore, the ecological sensitivity is high. The ecological resilience index, which is mainly characterized by the spatial distribution of low and high in the northeast and southwest regions, respectively, is calculated on the basis of vegetation and meteorological factors (Figure 4b). The northeast region has a high intensity of human activities, whereas the mountainous region of the southwest restricts human social activities due to topographic conditions. The land-use type is mainly forest land and has high vegetation cover; therefore, its ecosystem structure and function are relatively stable. The ecological stress index, which is mainly manifested as the spatial distribution characteristics of generally low and local high, is calculated on the basis of human activities (Figure 4c). The high value areas are mainly due to the use of chemical fertilizers and pesticides, which far exceeds that of the rest of the regions, resulting in higher ecological pressure in the region relative to the rest of the region.
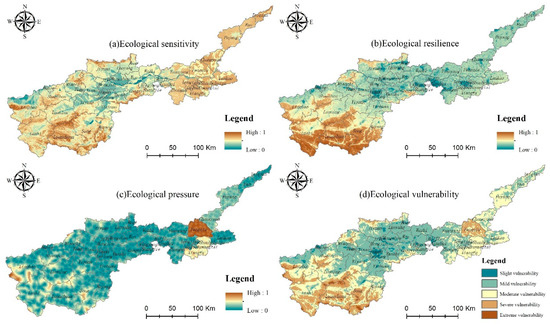
Figure 4.
Ecological vulnerability level of the southern section of the Yellow River Basin.
The ecological vulnerability index, which is mainly characterized by the spatial distribution of high in the southwest, low in the middle, and unevenly distributed in the northeast, is calculated on the basis of the ecological sensitivity, resilience, and ecological stress indexes (Figure 4). The western region has strong ecological resilience; however, its ecological sensitivity is high and susceptible to interference from external factors. Moreover, the ecosystem structure of this region is unstable and has high ecological vulnerability; generally, ecological vulnerability is in the range of moderate and extreme vulnerability. However, the central region has flat terrain and a low ecological sensitivity index and ecological pressure index, although the ecological resilience is worse than that of the southwest region, but on the whole, the ecological vulnerability status is good, between micro vulnerability and mild vulnerability, and the ecosystem function is stable and the structure is good.
3.2. Evaluation of Cultivated Land Resilience
This article adopts the natural breakpoint method to divide the toughness grades of cultivated land in the study area into the following: low toughness, lower toughness, medium toughness, high toughness, and higher toughness.
Internal resilience evaluation (Figure 5a) revealed that the resilience rating in the north-central part of the study area was low and was mainly concentrated in Jiyuan City, Xin’an County, and parts of Yuchi County and Shaanzhou District. Moreover, the natural endowment conditions of cultivated land in this area are poor, as shown by the low effective soil thickness and poor soil water content. In terms of external resilience evaluation (Figure 5b), the resilience level of the western part of the study area was lower than that in the central and eastern regions, and the resilience level of Luoning County and Song County in the western region was higher. The Middle East has a high level of toughness, and the low-resilience areas were mainly concentrated in the western mountainous areas of the study region, including Gongyi City, Lingbao City, Lushi County, Shaanzhou District, Yuchi County, Luanchuan County, and Ruyang County, which are closely related to the local socio-economic development situation. Guaranteeing and supporting the utilization of cultivated land based on the low socioeconomic level is difficult due to the low GDP and weak night lighting index, and the external resilience of cultivated land is low.
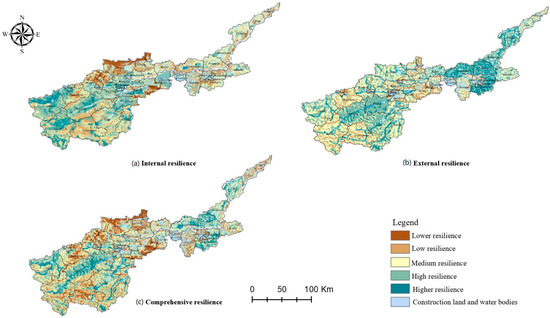
Figure 5.
Resilience grade of cultivated land in the southern section of the Yellow River Basin.
The comprehensive internal and external resilience evaluation results were obtained from the comprehensive resilience evaluation grade of the cultivated land system in the study area (Figure 5c). Overall, the areas of high resilience were mainly concentrated in the counties of Xiangfu, Lankao, Changyuan, Puyang, and Yuanyang in the central and eastern parts of the study area. These areas have flat terrain, fertile soil, good natural conditions of cultivated land, high regional GDP level, sufficient labor force, high level of agricultural mechanization, and a strong resilient cultivated land utilization system. The low-resilience areas were mainly concentrated in Shaanzhou District, Lushi County, Luanchuan County, and Jiyuan County, and Bo’ai County in the northwest part of the study area. The quality and distribution of cultivated land in this region are markedly affected by topography, which is mostly scattered in mountainous areas. Thus, forming large-scale mechanized farming is difficult, and the level of social and economic development is lower than that of the central region, demonstrating a lack of labor and poor resilience of cultivated land.
3.3. Multi-Scenario Simulation of Future Land-Use Change
Forecast future land-use needs in the study area based on the Markov chain and CARS module based on the PLUS model constrained by quantity requirements are determined by simulating the land-use change pattern in the study area in 2035 and obtaining the land-use distribution of the southern section of the Yellow River Basin in 2035 (Figure 6). Overall, the construction land mainly shows an expansion trend with Luoyang, Zhengzhou, and Kaifeng as the central cities; among them, the change range in the middle of the study area was the most evident. By contrast, cultivated land is sporadically reduced around towns and near roads, and the spatial variation characteristics of woodland and grassland are not observed. Moreover, water bodies are added in the model as restricted conversion areas; thus, water will remain largely unchanged in 2035 compared to that in 2020. In quantity (Figure 7), the land-use mode from 2010 to 2020 was mainly manifested as the transformation of cultivated land to forest land, grassland and construction land, and grassland to cultivated land; however, the transfer of construction land is relatively rare. The pattern of land-use change from 2020 to 2035 is mainly manifested in the transfer of cultivated land to construction land, which has led to a continuous decline and increase in the areas of cultivated and construction land, respectively.
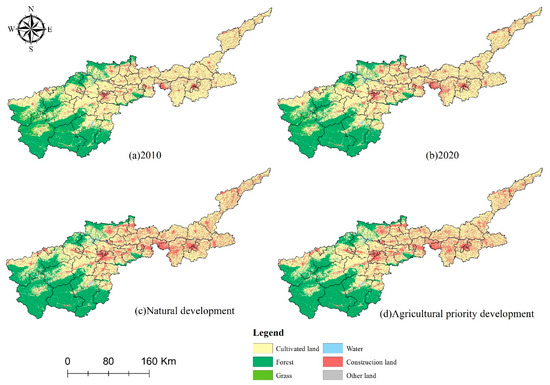
Figure 6.
Land-use change pattern under different development scenarios in the southern section of the Yellow River Basin from 2010 to 2035.
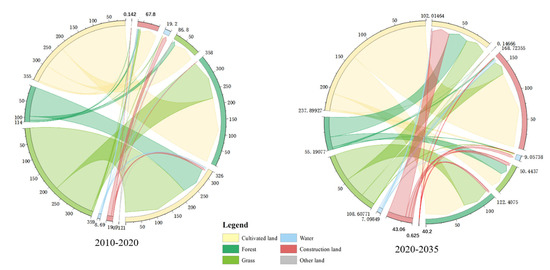
Figure 7.
Land-use-type conversion map of Henan section of the Yellow River Basin from 2010–2020.
3.4. Determination of Urban Development Boundaries under Different Development Scenarios
Based on the 2035 land-use change scenario, morphological erosion and dilation (MED) operations are used with the help of the FLUS–UGB delineation module to obtain urban development boundaries under the natural and agricultural priority development scenarios, as, respectively, shown in Figure 7 and Figure 8. Comparing the two different urban development boundaries, the degree of urban expansion is remarkably intense under the natural development scenario, while that of construction land expansion is weaker than that of natural development scenarios under the scenario of priority agricultural development due to the limitation of basic farmland protection areas. Combining the two urban development boundaries, the comprehensive urban development scope can be obtained after removing the small patches.
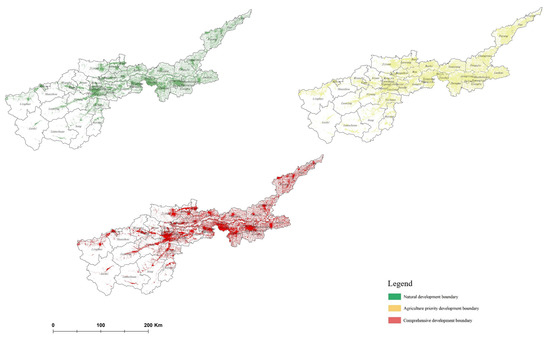
Figure 8.
Urban development boundary in the southern section of the Yellow River Basin in 2035.
3.5. Arable Land Zoning Protection Strategy
Strengthening the protection of the “trinity” of cultivated land quantity, quality, and ecology is necessary to form a new pattern of farmland protection with robust security, smooth implementation, and highly efficient management. The protection of cultivated land should be considered in terms of the situation, ecological environment, and differentiated protection in different regions. Therefore, this article adopts the four-quadrant method (Figure 9) to couple the cultivated land resilience and ecological environment sensitivity; combine the urban development boundaries under different scenarios to divide cultivated land protection zoning; and achieve coordinated development of ecological protection, cultivated land utilization, and urban construction.
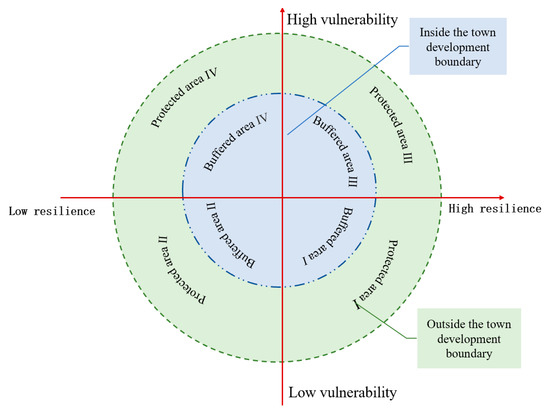
Figure 9.
Schematic of cultivated land protection zoning based on four-quadrant method.
(1) Cultivated land-use reserve (Figure 10) refers to cultivated land outside the boundary of integrated urban development. Four types of protection are categorized on the basis of the evaluation results of ecological vulnerability and cultivated land resilience. Protected area I has low ecological vulnerability and high resilience of cultivated land, and their existing agricultural production conditions and ecological environment are in a superior situation. Thus, attention should be paid to the maintenance and protection of the quality of existing cultivated land and the status of the ecological environment. Improving the quantity, quality, and ecological environment supervision systems of cultivated land resources is necessary, and incorporating the quality of the cultivated land and ecological environment into the assessment system of the local government can effectively promote the maintenance of cultivated land quality and the protection of the ecological environment. Protected area II has low ecological vulnerability and stable ecological environment. However, the population density and GDP levels are low, and the arable land is slightly resilient, which should increase the input of diversified resources and promote the professionalization of farmers, the specialization of agricultural machinery, and the value of agricultural land. Protected area III has high cultivated land resilience, strong ecological fragility, and poor ecological background. Thus, focusing on the improvement and governance of the ecological environment is necessary. Measures include strictly controlling the discharge of wastewater and waste from enterprises, regularly monitoring the regional environment, orderly establishing garbage disposal stations, other ways to improve the external ecological environment and achieve reasonable dense and ridge planting, and other behaviors to enhance vegetation cover; or, alternatively, implement mulching technology using local materials and straw, wheat straw, corn stalks, and weeds for full coverage. These measures can reduce ecological sensitivity and increase ecological resilience. Protected area IV has low resilience and high ecological vulnerability. The cultivated land is of a poor condition and is vulnerable to sudden natural disasters and persistent agricultural pollution. Thus, attention should be focused on improving the endogenous dynamics of the arable land utilization system; increasing the cohesion of the numerous natural endowments of the system, such as fallow and rotational tillage to improve soil properties and intercropping; and rotation to balance soil nutrients. Second, performing centralized and harmless disposal of pesticides, packaging, agricultural film, and other wastes and minimizing the impact of agricultural production on ecological quality is necessary.
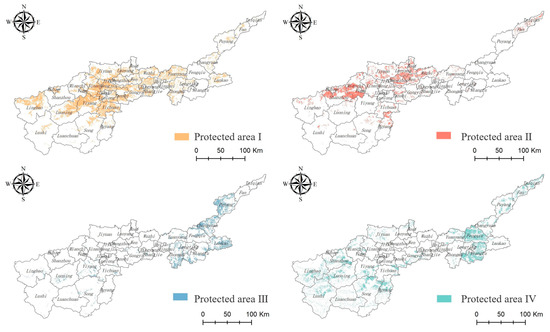
Figure 10.
Distribution map of cultivated land utilization reserve in the southern section of the Yellow River Basin.
(2) Urban development buffer zone (Figure 11) refers to the cultivated land area within the boundary of integrated urban development. This zone is divided into four types of utilization according to its natural economic characteristics. Buffered area I has high cultivated land water, soil resources, and a cultivated land ecological security level, and its leading function is production. Thus, flexible production and supply according to market demand, establishment of a large food concept, and creation of a diversified food supply system are possible due to its proximity to urban areas. Simultaneously, food supply should be ensured; location advantages should be maximized to maintain the effective supply of agricultural products, such as meat products, vegetables, fruits, and aquatic products; food characteristics, greening, and freshness should be promoted; diversified food species should be developed; and a balance between supply and demand of various agricultural products should be achieved. Second, establishing and improving the “balance in and out” system of cultivated land is necessary, allowing for spatial replacement between scattered cultivated, garden, forest, and other agricultural lands and optimizing the structure of the agricultural industry. Buffered area II and Buffered area III have cultivated land with poor resilience or ecological status. The development route of “agricultural production experience” and “production + education” can be attempted due to the proximity of these zones to the urban area. Food production can be regarded as an “artistic process” and an “educational act”; thus, the barriers of urban youth perception of traditional farming can be broken down, agricultural knowledge can be popularized, curious information can be transmitted, and teenagers who grew up in cities can be allowed to feel the farming scene and experience the farming process. For local farmers, on the one hand, setting up experience programs in stages according to the target group is necessary. For example, early childhood programs utilize the curious nature of children, focusing on cognitive enlightenment in relation to vegetables, fruits, and cereals. At the primary school level, projects, such as seedlings, harvesting, and pest control, can be set up; at the junior high school stage, links, such as the identification of Chinese herbal medicines and the processing and packaging of agricultural products, can be opened; at the high school level, students can explore the cultivation of pollution-free food, health, and wellness. Buffered area IV has disadvantageous cultivated land conditions. Thus, these zones can be given priority as land plots for urban development, thereby becoming not only an ideal space for urban development, but also leading the direction for urban development. Strictly implementing the state’s policy of “taking advantage of one to supplement one, and taking advantage of the superior to supplement the superior” and conscientiously implementing the stipulation that cultivated land occupied by construction is “to make up for the occupation, and first make up for the occupation before occupying”, is necessary. Moreover, replenishment of the cultivated land occupied by construction in a timely manner with quality and quantity should be realized. When replenishment of cultivated lands of comparable quantities and quality is impossible, the cultivated land reclamation fee shall be paid in full and in accordance with regulations. When the reserve resources of the cultivated land are insufficient, the balance of the supplementary land can be achieved by purchasing the balance index of the supplementary cultivated land in the province that is rich in resources and has a surplus index.
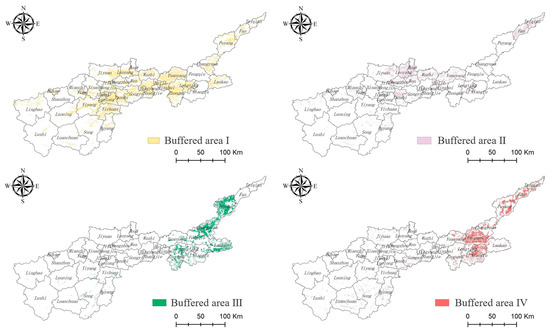
Figure 11.
Distribution of urban development buffer zone in the southern section of the Yellow River Basin.
4. Discussion
- Conflict optimization for protection and development
In recent years, resource utilization and cultivated land protection have continued to become popular areas of concern in China [41,42]: cultivated land is not only an indispensable material basis for food production, but also has the functions of political stability, social security, cultural inheritance, and ecological services. Moreover, cultivated land has a considerable impact on national economic, political, cultural, social, and ecological civilization constructions [43]. China is currently facing issues with limited land resources, unreasonable development and utilization, and serious pollution damage, further aggravating the contradiction between production, ecology, and living space. Land-use conflicts are also intensifying [44], seriously affecting the development of the national economy and the sustainable use of resources. Therefore, regulating the conflict between cultivated land protection and economic development and realizing the optimal utilization and rational allocation of cultivated land resources in time and space must be achieved imminently. The rigid control measures for cultivated land have a significant effect on the protection of cultivated land quantity. However, the substantial economic and environmental costs are inconsistent with the current concept of comprehensive and coordinated sustainable development. With the economic and social transformation of China [45], the level of urbanization and the income of residents have increased, while the direct food consumption of Chinese residents demonstrated a declining trend. The proportion of grain used as raw feed materials is also increasing. Moreover, nonfood items, such as vegetables, fruits, and aquatic products, have steadily developed, and the food consumption structure of residents has become increasingly diversified. The growing demand for diversified food requires arable land that cannot be used for food production alone. Therefore, the protection of cultivated land should implement flexible utilization policies on the rigid bottom line, consider the needs of urban development under the premise of ensuring food production, prioritize cultivated land protection, and consider urban development. This article constructs farmland conservation zoning based on ecological vulnerability and cultivated land resilience using the FLUS–UGB module to determine the urban development boundary under different development scenarios in 2035. Cultivated land-use reserves and urban development buffer zones are divided by simulating town development boundaries. With the use of cultivated land, the core task of protected areas is to ensure food production; therefore, suitable farming can be conducted in accordance with the condition of the cultivated land itself. The core task of the urban development buffer zone is to rely on the location advantage to ensure the diversified food needs of urban residents. Meanwhile, poor cultivated land can be used as reserved space for urban development and can simultaneously guide the direction of urban development. The use and protection of cultivated land can then be effectively implemented. Therefore, the contradiction between cultivated land utilization, ecological protection, and urban development can be successfully alleviated, and the coordinated development of life–ecology–production can be achieved.
- 2.
- Contribution, limitations, and future work
As the most basic agricultural resource, cultivated land is related to the country’s food security. However, with the acceleration of economic development and urbanization, conflicts between cultivated land and ecology have continued. Additional attention has been previously provided to the protection of the quantity and quality of cultivated land. However, at this stage, the ecological protection of cultivated land has gradually received attention with the construction of ecological civilization. Therefore, combined with the results of land ecological vulnerability and cultivated land resilience, cultivated land zoning protection was conducted. This strategy not only focuses on the use of cultivated land to ensure ecological security, but also emphasizes cultivated land protection, thereby promoting the rational and sustainable utilization of cultivated land resources. In addition, this article takes differentiated protection measures for cultivated land based on the future land-use change pattern. These measures aim to promote the optimal allocation and rational utilization of resources in time and space. The current study still has some limitations despite the considerable amount of work performed.
First, only open water and basic farmland protected areas are considered for constraints for future land-use change simulations; no other special areas, such as nature reserves, were added to the model, relatively reducing the accuracy of the simulation. In addition, only the urban development boundary is delineated in the simulation process based on the land-use change pattern to provide reference for the current research. In the new round of territorial spatial planning, the delimitation of urban development boundaries should comprehensively consider the resource carrying capacity, population distribution, economic layout, urban–rural coordination, urban development stages, and development potential. The use of spatial planning results can produce highly informative findings due to the availability of data.
Therefore, in addition to open water, including nature reserves, ecological protection redlines, and other areas into the limiting conversion factors is necessary in future research. Therefore, the simulation results are remarkably consistent with the real situation. The revision and improvement of the urban development boundary can increase the instructiveness of research results for regional arable land protection and rational utilization of resources.
5. Conclusions
(1) A comprehensive index system of ecological vulnerability was constructed through ecological sensitivity, resilience, and stress to obtain the ecological vulnerability grading results of the southern section of the Yellow River Basin. Overall, the ecological situation of the study area was mainly defined as indicative of medium and low vulnerability. Meanwhile, the ecological low-vulnerability areas were mainly distributed in the middle and the ecologically high-vulnerability areas were mainly concentrated in the counties of Luanchuan, Song, Ruyang, and Lushi in the western part of the study area and Fengqiu in the eastern part of the study area.
(2) The evaluation index system of cultivated land resilience was constructed in accordance with internal and external resilience. The results showed that the low resilience areas were mainly distributed in the western part of the study area, including the central Jiyuan City and Wenxian County, and those with high resilience levels were mainly concentrated in the urban area of Luoyang City, Xingyang City, Zhongmu County, Longting District, Lankao County, and Puyang County.
(3) The urban development boundary was simulated on the basis of different change scenarios, and the cultivated land-use reserve and urban development buffer zone were delineated as the guides. Differentiated utilizations of cultivated and protected land areas mainly include ensuring food production. Reasonable use changes were conducted for the urban development buffer zone according to the characteristics of the cultivated land and location advantages, thereby promoting the rational allocation of resources in time and space and effectively alleviating the contradictions and conflicts between ecological protection, cultivated land utilization, and urban development.
Author Contributions
Conceptualization, C.L. and Y.C.; methodology, Y.C.; software, C.L.; validation, X.W. and S.H.; formal analysis, Y.C.; investigation, C.L. and X.W.; resources, X.W.; data curation, S.H.; writing—original draft preparation, Y.C.; writing—review and editing, L.D.; visualization, C.L.; supervision, X.W.; project administration, L.L.; funding acquisition, X.W. All authors have read and agreed to the published version of the manuscript.
Funding
This research was funded by the National Key R&D Program (grant number 2021YFD1700900); the National Natural Science Foundation of China Youth Fund Project (grant number 42007003); and the Henan Province Science and Technology Research Project (grant number 202102310213).
Data Availability Statement
Not applicable.
Conflicts of Interest
The authors declare no conflict of interest.
References
- Tan, Y.; Chen, H.; Lian, K.; Yu, Z. Comprehensive Evaluation of Cultivated Land Quality at County Scale: A Case Study of Shengzhou, Zhejiang Province, China. Int. J. Environ. Res. Public Health 2020, 17, 1169. [Google Scholar] [CrossRef] [PubMed]
- Yan, J.-Y.; Zhao, Y. Research Hot and Prospect of Ecologically Vulnerable Area in China in the Past Three Decades. J. Nanjing Norm. Univ. (Nat. Sci. Ed.) 2020, 43, 74–85. [Google Scholar]
- Shang, Y.-R. Vulnerability Study-The New Development of Synthetized Study on Natural Disasters. Areal Res. Dev. 2000, 19, 73–77. [Google Scholar] [CrossRef]
- Smith, K. Vulnerability. Resilience and the collapse of socieiy: A review of models and possible climatic applications. Int. J. Climatol. 1981, 1, 396. [Google Scholar] [CrossRef]
- Dow, K. Exploring differences in our common future(s): The meaning of vulnerability to global environmental change. Geoforum 1992, 23, 417–436. [Google Scholar] [CrossRef]
- Hou, K.; Tao, W.-D.; Wang, L.-M.; Li, X.-X. Study on hierarchical transformation mechanisms of regional ecological vulnera bility and its applicability. Ecol. Indic. 2020, 114, 106343. [Google Scholar] [CrossRef]
- De Lange, H.J.; Sala, S.; Vighi, M.; Faber, J.H. Ecological vulnerability in risk assessment—A review and perspectives. Sci. Total Environ. 2010, 18, 3871–3879. [Google Scholar] [CrossRef]
- Chen, Y.; Xiong, K.; Ren, X.; Cheng, C. An overview of ecological vulnerability: A bibliometric analysis based on the Web of Science database. Environ. Sci. Pollut. Res. 2022, 29, 12984–12996. [Google Scholar] [CrossRef]
- Kang, H.; Tao, W.; Chang, Y.; Zhang, Y.; Xuxiang, L.; Chen, P. A feasible method for the division of ecological vulnerability and its driving forces in Southern Shaanxi. J. Clean. Prod. 2018, 205, 619–628. [Google Scholar] [CrossRef]
- Lu, W.H.; Liu, J.S.; Cai, W.X. Analysis on the ecological vulnerability of Jilin Province based on ecological footprint. J. Arid. Land Resour. Environ. 2010, 24, 17–21. [Google Scholar] [CrossRef]
- Zhang, Q.; Wang, G.; Yuan, R. Dynamic responses of ecological vulnerability to land cover shifts over the Yellow river Basin, China. Ecol. Indic. 2022, 144, 109554. [Google Scholar] [CrossRef]
- Hu, X.; Ma, C.; Huang, P. Ecological vulnerability assessment based on AHP-PSR method and analysis of its single parameter sensitivity and spatial autocorrelation for ecological protection—A case of Weifang City, China. Ecol. Indic. 2021, 125, 107464. [Google Scholar] [CrossRef]
- Cai, X.; Li, Z.; Liang, Y. Tempo-spatial changes of ecological vulnerability in the arid area based on ordered weighted average model. Ecol. Indic. 2021, 133, 108398. [Google Scholar] [CrossRef]
- Qiu, P.-H.; Xu, S.-J.; Xie, G.-Z. Analysis on the ecological vulnerability of the western Hainan Island based on its landscape pattern and ecosystem sensitivity. Acta Ecol. Sin. 2007, 27, 1257–1264. [Google Scholar] [CrossRef]
- Jiang, Y.; Shi, B.; Su, G. Spatiotemporal analysis of ecological vulnerability in the Tibet Autonomous Region based on a pressure-state-response-management framework. Ecol. Indic. 2021, 130, 108054. [Google Scholar] [CrossRef]
- Shang, L.-Z.; Zhang, L.-S. Quantitative Evaluation of Ecological Vulnerability of Gansu Counties Based on “Cause and Effect” Indicators. Soil Water Conserv. China 2010, 6, 11–13+23. [Google Scholar] [CrossRef]
- Zhang, X.; Liu, K.; Wang, S.; Wu, T.; Li, X.; Wang, J.; Wang, D.; Zhu, H.; Tan, C.; Ji, Y. Spatiotemporal evolution of ecological vulnerability in the Yellow River Basin under ecological restoration initiatives. Ecol. Indic. 2022, 135, 108586. [Google Scholar] [CrossRef]
- Mafi-Gholami, D.; Pirasteh, S.; Ellison, J.C.; Jaafari, A. Fuzzy-based vulnerability assessment of coupled social-ecological systems to multiple environmental hazards and climate change. J. Environ. Manag. 2021, 229c, 113537. [Google Scholar] [CrossRef]
- Guo, B.; Luo, W.; Zang, W. Spatial-temporal shifts of ecological vulnerability of Karst Mountain ecosystem-impacts of global change and anthropogenic interference. Sci. Total Environ. 2020, 741, 140256. [Google Scholar] [CrossRef]
- Qin, Z.; Haili, X.; Xiao, L.; Luwei, D.; Bojie, W.; Fengqi, C.; Haiping, T. Livelihood vulnerability of pastoral households in the semiarid grasslands of northern China: Measurement and determinants. Ecol. Indic. 2022, 140, 109020. [Google Scholar] [CrossRef]
- Ippolito, A.; Sala, S.; Faber, J.; Vighi, M. Ecological vulnerability analysis: A river basin case study. Sci. Total Environ. 2009, 408, 3880–3890. [Google Scholar] [CrossRef]
- Zhang, F.; Liu, X.; Zhang, J.; Wu, R.; Ma, Q.; Chen, Y. Ecological vulnerability assessment based on multi-sources data and SD model in Yinma River Basin, China. Ecol. Model. 2017, 349, 41–50. [Google Scholar] [CrossRef]
- Lv, X.; Wang, Y.-N.; Wang, B.-Y. Some thoughts on the use and conservation of arable land from the perspective of resilience theory. China Land 2022, 4. [Google Scholar] [CrossRef]
- Guo, Y.-Y.; Luo, F.-Z.; Zhong, X.-R. Study on Urban Resilience Assessment Based on Entropy Weight-Normal Cloud Model. J. Catastrophol. 2021, 36, 168–174. [Google Scholar]
- Hou, X.; Liu, J.; Zhang, D.; Zhao, M.; Xia, C. Impact of urbanization on the eco-efficiency of cultivated land utilization: A case study on the Yangtze River Economic Belt, China. J. Clean. Prod. 2019, 238, 117916. [Google Scholar] [CrossRef]
- Su, H.; Wu, C.-F. Mechanism of cultivated land system change in black soil areas of Northeast China. Trans. Chin. Soc. Agric. Eng. 2021, 37, 243–251. [Google Scholar] [CrossRef]
- Zheng, H.; Li, Y.; Tu, H.-Y. Interlayer properties of short fiber interlayer carbon fiber/epoxy composites. Acta Mater. Compos. Sin. 2022, 39, 8. [Google Scholar] [CrossRef]
- Chen, J.-P.; Hu, X.-W.; Qian, J.-Q. Study on high temperature hot ductility of high corrosion resistance weathering steel S450EW. J. Plast. Eng. 2021, 28, 166–172. [Google Scholar] [CrossRef]
- Duan, Y.-Y.; Zhai, G.-F.; Li, W.-J. International Research Advances in Urban Resilience Measurement. Urban Plan. Int. 2019, 439, 79–85. [Google Scholar] [CrossRef]
- Zhang, Y.-H.; Xue, Y.; Xu, M.-L.; Li, F. Research on the Dynamic Prediction and Spatial-temporal Evolution of Urban Resilience. Mod. Manag. 2021, 41, 77–81. [Google Scholar] [CrossRef]
- Li, B.; Liu, Y.; Xing, H.; Meng, Y.; Yang, G.; Liu, X.; Zhao, Y. Integrating urban morphology and land surface temperature characteristics for urban functional area classification. Geo-Spat. Inf. Sci. 2022, 25, 16. [Google Scholar] [CrossRef]
- Liang, X.; Guan, Q.; Clarke, K.C.; Liu, S.; Wang, B.; Yao, Y. Understanding the drivers of sustainable land expansion using a patch-generating land use simulation (PLUS) model: A case study in Wuhan, China. Comput. Environ. Urban Syst. 2021, 85, 101569. [Google Scholar] [CrossRef]
- Yang, J.; Huang, X. The 30 m annual land cover dataset and its dynamics in China from 1990 to 2019. Earth Syst. Sci. Data 2021, 13, 3907–3925. [Google Scholar] [CrossRef]
- Liu, Y.; Liu, R.; Chen, J.M. Retrospective retrieval of long-term consistent global leaf area index (1981–2011) from combined AVHRR and MODIS data:LONG-TERM GLOBAL LEAF AREA INDEX. J. Geophys. Res. Biogeosci. 2012, 44, 1872–1884. [Google Scholar] [CrossRef]
- Zou, T.; Chang, Y.; Chen, P.; Liu, J. Spatial-temporal variations of ecological vulnerability in Jilin Province (China), 2000 to 2018. Ecol. Indic. 2021, 133, 108429. [Google Scholar] [CrossRef]
- Mary, A.B. Ecological vulnerability indicators. Ecol. Indic. 2016, 60, 329–334. [Google Scholar] [CrossRef]
- Dai, Q.; Zhu, J.; Zhang, S.; Zhu, S.; Han, D.; Lv, G. Estimation of rainfall erosivity based on WRF-derived raindrop size distributions. Hydrol. Earth Syst. Sci. 2020, 24, 5407–5422. [Google Scholar] [CrossRef]
- Zhang, X.; Wang, L.; Fu, X.; Li, H.; Xu, C. Ecological vulnerability assessment based on PSSR in Yellow River Delta. J. Clean. Prod. 2017, 167, 1106–1111. [Google Scholar] [CrossRef]
- Jiang, G.; Wang, M.; Qu, Y.; Zhou, D.; Ma, W. Towards cultivated land multifunction assessment in China: Applying the “influencing factors-functions-products-demands” integrated framework. Land Use Policy 2020, 99, 104982. [Google Scholar] [CrossRef]
- Ji, Z.; Wei, H.; Xue, D.; Liu, M.; Cai, E.; Chen, W.; Feng, X.; Li, J.; Lu, J.; Guo, Y. Trade-Off and Projecting Effects of Land Use Change on Ecosystem Services under Different Policies Scenarios: A Case Study in Central China. Int. J. Environ. Res. Public Health 2021, 18, 3552. [Google Scholar] [CrossRef]
- Chen, W.-G.; Kong, X.-B.; Liao, Y.-B. Countermeasures and Suggestions to Improve the “North-South Imbalance” in the Utilization and Protection of Arable Land Resources. China Land 2021, 12, 12–13. [Google Scholar] [CrossRef]
- Xiao, L.-Q.; Deng, Q.-Z.; Lin, Y.-Q. Study on the Synergistic Development of Arable Land Protection and Intensive Use of Construction Land in the Context of New Urbanization. Chin. J. Agric. Resour. Reg. Plan. 2021, 42, 62–71. [Google Scholar]
- Song, X.-Q.; Ouyang, Z. Multifunctional connotation of arable land and its implication for arable land conservation. Prog. Geogr. 2012, 31, 859–868. [Google Scholar] [CrossRef]
- Jiang, S.; Meng, J.; Zhu, L.; Cheng, H. Spatial-temporal pattern of land use conflict in China and its multilevel driving mechanisms. Sci. Total Environ. 2021, 801, 149697. [Google Scholar] [CrossRef] [PubMed]
- Chen, J.; Fu, H.; Chen, S.T. Multi-Scenario Simulation and Assessment of Ecosystem Service Value at the City Level from the Perspective of “Production–Living–Ecological” Spaces: A Case Study of Haikou, China. Land 2023, 12, 1021. [Google Scholar] [CrossRef]
Disclaimer/Publisher’s Note: The statements, opinions and data contained in all publications are solely those of the individual author(s) and contributor(s) and not of MDPI and/or the editor(s). MDPI and/or the editor(s) disclaim responsibility for any injury to people or property resulting from any ideas, methods, instructions or products referred to in the content. |
© 2023 by the authors. Licensee MDPI, Basel, Switzerland. This article is an open access article distributed under the terms and conditions of the Creative Commons Attribution (CC BY) license (https://creativecommons.org/licenses/by/4.0/).