Article

Integration of Analytic Hierarchy Process (AHP) and Remote Sensing to Assess Threats to Preservation of the Oases: Case of Al Ain, UAE

Department of Geography and Urban Sustainability, College of Humanities and Social Sciences, UAE University, Al Ain P.O. Box 15551, United Arab Emirates
*
Author to whom correspondence should be addressed.
Land 2023, 12(7), 1269; https://doi.org/10.3390/land12071269
Submission received: 25 May 2023 / Revised: 15 June 2023 / Accepted: 19 June 2023 / Published: 21 June 2023

Abstract

:
Identifying threats to historical sites is important for formulating preventive measures to reduce their impacts. The oases in Al Ain, United Arab Emirates (UAE), are one of the historical sites and were inscribed as cultural sites in 2011 by UNESCO World Heritage Committee. This study assessed the threats to oases based on the UNESCO-listed factors affecting the outstanding universal value of the World Heritage properties. An Analytic Hierarchy Process (AHP) coupled with remote sensing was used for data collection and analysis. Expert feedback showed that water, urban expansion, soil salinity, palm disease, and the legal framework were major threats. To determine whether urban expansion influences oases preservation, remote sensing images were used to investigate land use and land cover (LULC) around the oases. The LULC change between 1972 and 2022 showed that palm trees, grass, and built-up areas increased by 59%, 76%, and 91%, respectively. The normalized difference vegetation index (NDVI) and normalized difference water index (NDWI) were used to assess stress in the oases. The results indicated that oases have not been impacted by urban expansion since 1972, reflecting the UAE’s commitment to the preservation of oases. The availability of cloud-based and open-access satellite images coupled with AHP is an effective tool for understanding threats. This research aligns with UN SDG 15—“Life on Land”. The concept of this study could be used to assess threats to historical sites. It is recommended that policies for the oases’ preservation be maintained and updated to cater to issues related to population and climate change. Gray water and smart irrigation systems could be assessed as alternatives to minimize water use. Hyperspectral remote sensing is recommended for future studies related to soil salinity and palm diseases.

1. Introduction

The impact of human activities on cultural sites is well documented globally [1], and assessing threats at the local level is required. This study aligns with the United Nations Sustainable Development Goal SDG 15—“Life on Land” to manage forests and promote sustainable use of terrestrial ecosystems [2,3]. In arid areas, oases represent terrestrial ecosystems equivalent to artificial forests, and many organizations, such as the Food and Agriculture Organization of the United Nations (FAO), emphasize the primary importance of oasis ecosystems [4]. Historically, oases in the United Arab Emirates (UAE) played a major role before oil exploration and continue to act as ecosystems that sustain life [5]. Oases are protected by policies and legislation that ensure the preservation and sustainable utilization of their products (SDG 12 aims to establish sustainable consumption and production).
In 2011, the UNESCO World Heritage Committee inscribed four cultural sites in Al Ain, one of which is an oasis [6]. This inscription reflects the importance of oases as cultural sites supporting life throughout history and includes a unique irrigation system (Falaj/Aflaj) [7]. Many sunken date palm gardens and associated underground water channels (Falaj, Aflaj) were cut in the late Islamic period (1692–1711), and the present oases landscape is a product of this activity [8]. Oases are characterized by a combination of cultivated areas, historical buildings, archaeological sites, and other elements of the historic environment [9]. In 2015, the FAO recognized the Al Ain and Liwa historical date palm oases as a globally important agricultural heritage system (GIAHS) [10].
Social, economic, environmental, and ecotourism-related benefits are among the reasons for the preservation of oases [11,12]. Socially, the palm tree is an icon for human, animal, and bird survival. Humans have a special respect for palm trees, “the blessed trees”, because they previously supported their lives in harsh environments. Oases (including the date palm, Phoenix dactylifera L.) produce dates and are considered food sources and economic commodities [13,14]. The location of oases as green areas within the urban structure and their inclusion of old irrigation systems (a falaj) make them eco-tourist destinations. The oases act as the “lungs of the city” because palm trees absorb carbon dioxide and, hence, improve the environment (reduce temperature and enhance livelihood) [15,16]. Oases provide shelter for many types of birds, such as house sparrows, palm doves, mynahs, francolins, sunbirds, and feral pigeons. Palms in oases are tall and can survive for approximately 100 years, providing shade and protection for other native plants and multi-strata cropping systems. Oases include palm trees, fruit trees, vegetables, and fodder [17]. Palmwood (timber, fiber, and by-products) is used for human shelters, and palm waste can be used as biomass for energy production [18]. The environmental benefits of oases also include their role as water catchment areas, combating desertification, and reducing damage caused by sandstorms. Palm trees can tolerate hot temperatures, salinity, and dry conditions, making them suitable species for the UAE climate. The overall benefits of the oases are aligned with SDG 15—“Life on Land”.
Despite the historical and environmental values of these oases, their survival is under threat. For example, an increase in population threatens oases because of the demand for more buildings and utilities (anthropogenic activities). However, low amounts of rain pose a climatic threat. Land use change can be used to assess anthropogenic activities. Previous studies on land use change in Al Ain used remote sensing and addressed the changes broadly at the city level [12], whereas this study focused on the oases as a cultural site. The use of satellite images to assess the preservation of oases provides many benefits, such as saving time and money, over traditional land cover monitoring approaches that depend on field surveys [16]. Improvements in satellite images, such as spatial, spectral, radiometric, and temporal resolutions, have initiated new applications for environmental monitoring [19].
The Scopus database was used to review published articles that focused on the use of remote sensing to preserve oases. A search query that included the terms “remote sensing”, “conservation or preservation”, and “oases” was performed on the abstract, title, and keywords of articles. The search was limited to articles published in peer-reviewed English journals. This process yielded 43 documents published between 2003 and 2023. Table 1 presents the most frequently used keywords. Keyword analysis indicates a scarcity of research on the integration of remote sensing information with expert opinions. Therefore, this study contributes to the body of knowledge by integrating remote sensing-derived information with expert opinions for the efficient and sustainable preservation of Al Ain oases as a case study. Moreover, in the majority of previous studies, the oases were located in rural areas [20,21,22], whereas the oases in this study are located in urban areas, and this represents a challenge for preservation. Previous studies [22,23] have demonstrated that urban and built-up areas have expanded at the expense of cultivated and bare land. A study conducted by Ullah et al. [22] in Desert-Oasis (Cholistan-Pakistan) showed that significant expansion (43%) in the built-up area occurred between 2015 and 2022, but there was a decline in agriculture and vegetation area by 8%. Similarly, another study conducted in Northwest China found that cultivated and built-up areas expanded between 1972 and 2014, whereas forest and grassland areas declined [23]. In contrast, research done in Ternata oasis, Morocco, showed an expansion of desert land and a decrease in cultivated land [24]. An expansion in oases at the expense of desert vegetation was also reported by Zhang et al. [25]. However, in the current study, the cultivated land (oases) has been successfully preserved, and the observed decrease in the land area primarily pertains to bare land (desert).
This study aimed to assess the threats to oases in Al Ain, UAE. The threats were assessed based on the UNESCO-listed threats/factors affecting the outstanding universal value of World Heritage Properties, such as land conversion (building and development) and water [1,26]. The current study employs a methodological approach that encompasses two components: an expert survey and remote sensing image analysis. The expert survey aims to collect information on the condition of the oases and the threats they encounter. Concurrently, the remote sensing component extracts data that can influence the preservation of the oases, including changes in land use and land cover, water index, and vegetation index.
Experts were surveyed to identify threats, and an Analytic Hierarchy Process (AHP) was used to rate the threats. The land conversion was assessed by quantifying changes in the total area of the oases using historical aerial photographs and satellite images. The normalized difference vegetation index (NDVI) and normalized difference water index (NDWI) were used to assess stress in the oases. This study tested two hypotheses: (a) water for irrigation is the major threat to oases, and (b) oases are preserved. The results can help establish plans to minimize the impact of threats and improve the city’s sphere. The potential beneficiaries of this study include urban planning councils, heritage organizations, environmental agencies, agriculture departments, water resource departments (soil and biodiversity), and other stakeholders involved in preservation and sustainability.
The article is structured in such a way that Section 2 addresses the methodology including a description of the study area and the Analytic Hierarchy Process (AHP) while Section 3 covers the results. Section 4 of the study presents a discussion, while Section 5 and Section 6 provide a summary of the research findings and recommendations, respectively.

2. Methodology

2.1. Study Area

Al Ain is located in the southeastern part of the United Arab Emirates (UAE) (Figure 1). The total population of Al Ain City is 284,730 [27]. The city has a hot desert climate with a mean annual temperature of 36.5 °C and a mean annual rainfall of 96.4 mm [16]. Previously, the city was a trading post with other civilizations in Mesopotamia, Persia, and the Indus Valley. It is also considered the most ‘authentic city’ within the emirate, with a cultural legacy that dates to the fifth millennium BC [28].
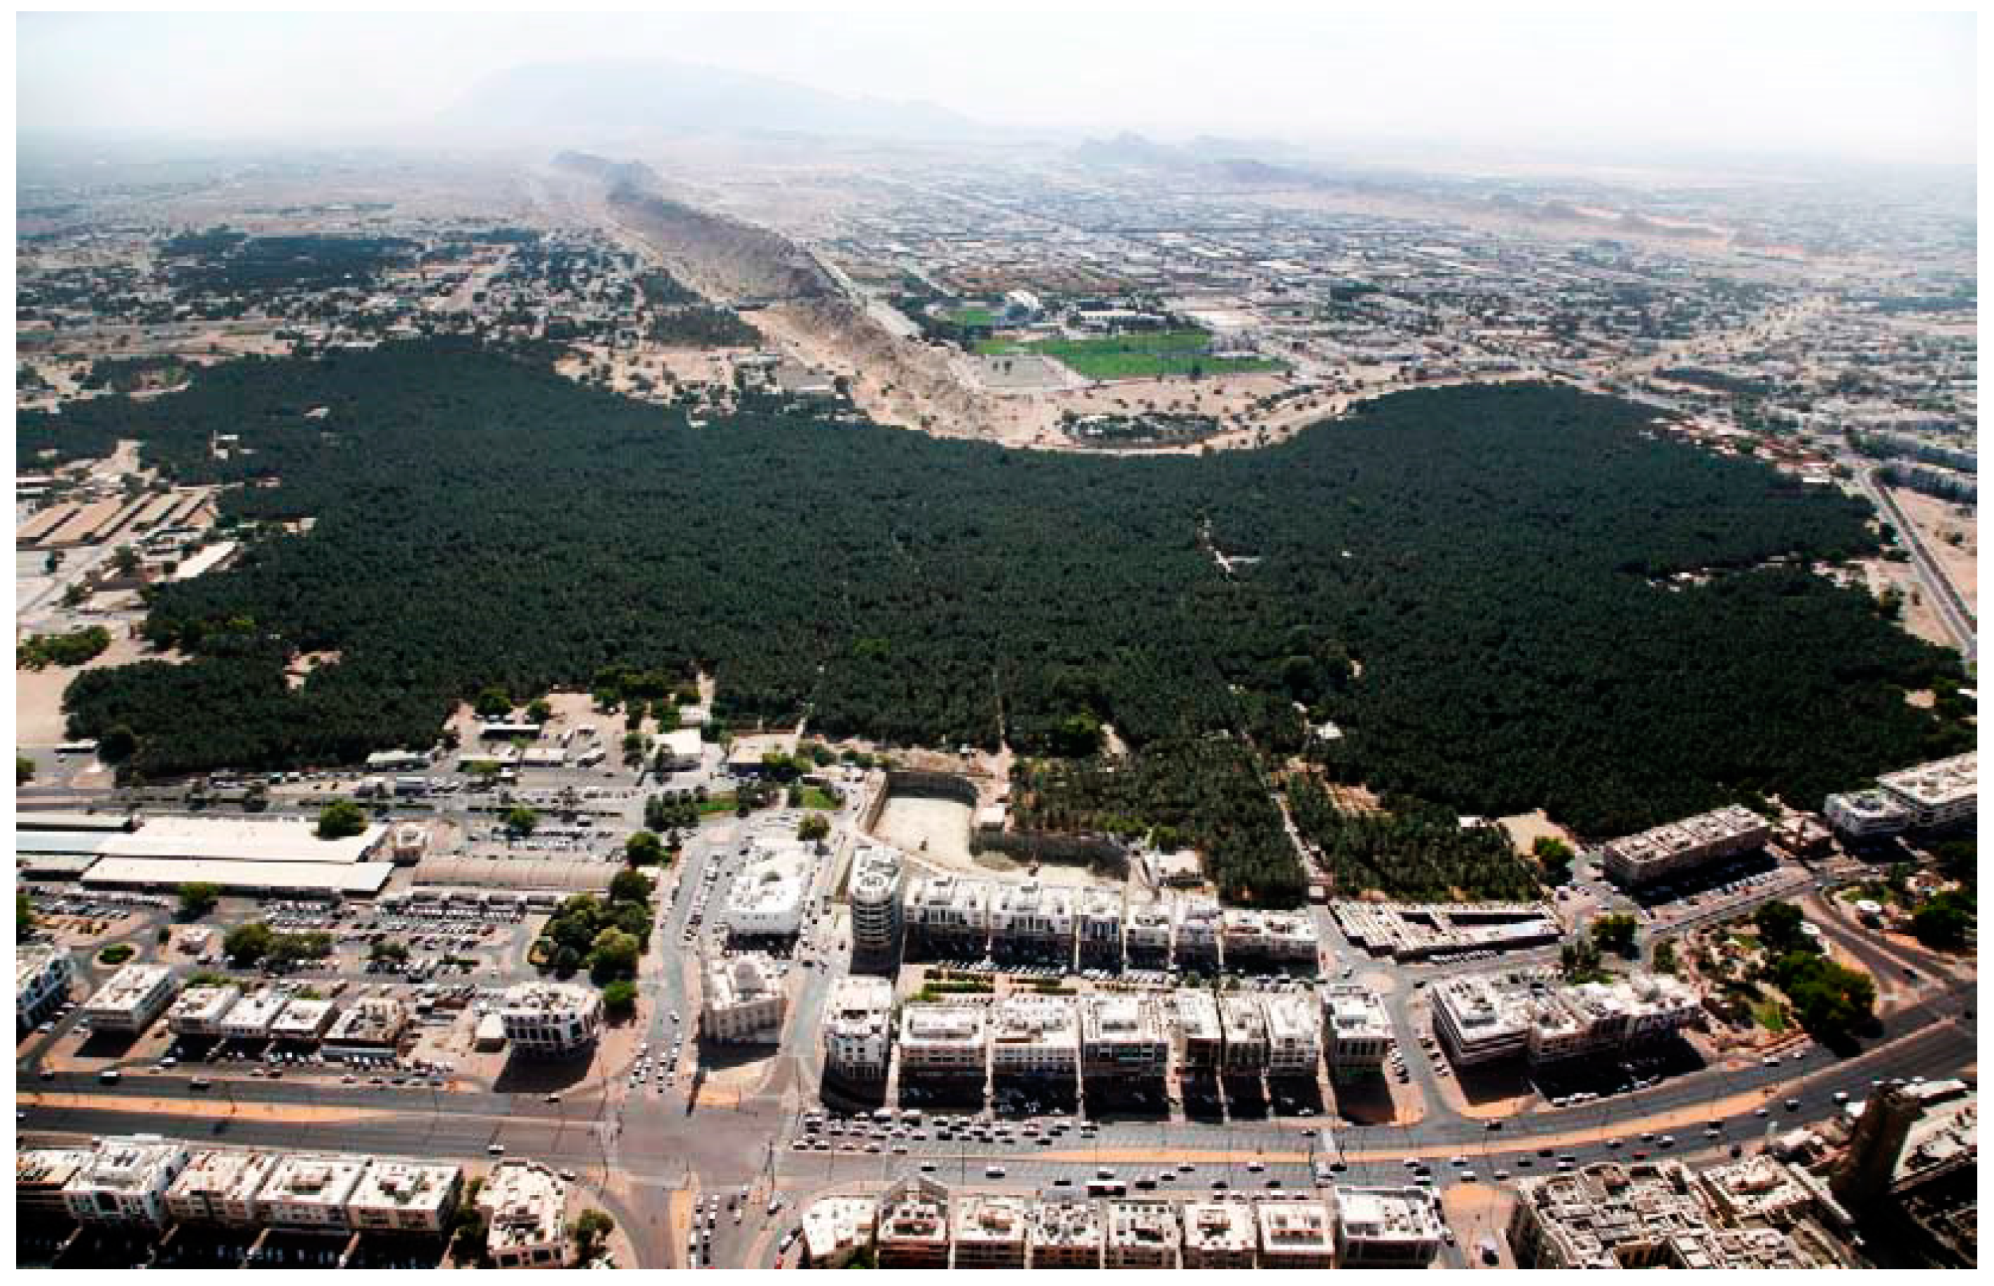
There are seven oases in Al Ain, namely Al Ain, Al Hili, Al Qattara, Al Jimi, Al Jahli, Al Mutarid, and Al Muwaiji [17] (Figure 1). The Al Ain oases include approximately 170,667 date palms and other types of trees, covering an area of approximately 370 ha owned by about 1360 residents [17]. The support of the late Sheikh Zayed Bin Sultan Al Nahyan played a key role in preserving the historical sites in Al Ain and in the inclusion of the cultural sites of Al Ain (Hafit, Hili, Bida bint Saud, and Oases) in UNESCO’s list of World Heritage Sites [28]. The protection of the physical structures and farming practices of the oases was legally guaranteed by decrees issued in 2004 and 2005 [28]. The oases were previously irrigated through hand-dug wells and underground tunnels called Falaj/Aflaj, which harvest surface water through the valleys [7]. The city’s location at the foot of the Hajar Mountains allows many valleys to drain into it, increasing water availability for oases. However, many of these valleys have disappeared because of low rainfall and urban expansion. As a result, Afalaj’s water ran dry in the 1970s and has since been replaced by desalinated water piped from Abu Dhabi and Fujairah [29]. Moreover, urban expansion also represents a threat to the oases (Figure 2).
The UAE has adopted practical measures to support palm preservation. For example, in 2009, the UAE initiated the Khalifa International Award for Date Palm and Agricultural Innovation to encourage researchers worldwide, farmers, and professionals in the field of palms (cultivation, disease prevention, food processing, and marketing) [30]. In addition, UAE University established a date palm R&D unit to conduct and attract funding for research in the field of palms.

2.2. Analytic Hierarchy Process (AHP)

The AHP is a multi-criteria decision-making process that structures factors into a hierarchical framework that helps decision-makers evaluate the relative importance of various elements using pairwise comparison [31]. Hierarchical model structures in the AHP allow users to focus on measures and sub-criteria when designing weights [31]. The AHP has three parts: the main goal to achieve or solve the problem, all the different ways to solve the problem (alternatives), and the procedure used to judge the alternatives. AHP helps make smart choices by assigning numbers to alternatives and comparing them to the main goal [32]. Several studies have used AHP to assess the vulnerability of heritage sites. For example, Agapiou et al. [33] assessed the natural and anthropogenic hazard risks of cultural heritage sites and monuments in the Paphos District using GIS and remote sensing coupled with AHP.
Furthermore, some studies have used the AHP to evaluate flood hazards at heritage sites [34]. Similarly, Kutut et al. [35] used AHP to outline priority alternatives for the preservation of historical buildings.
In this study, a survey was conducted on 10 experts from Al Ain Municipality (Oases and Aflaj Section) and the Department of Culture and Tourism, Abu Dhabi, with expertise in agriculture and heritage preservation, to provide their opinions on the main threats facing the Al Ain oases (Figure 3). Daim et al. [36] also used 10 experts to provide third-party logistics providers. Experts were asked to rate the threats to the oases on a scale of 1 to 5 (Table S1). The 1–5 scale was chosen because of its ease of understanding by the experts, where 1 indicates a very low threat and 5 indicates a very high threat. The threats included the impact of management (policy, funding, and knowledge), development (land conversion, transportation, and tourism), and physical nature (water availability, water quality, and soil degradation). The experts’ opinions were converted from a scale 1–5 to a scale 1–9 to match the fundamental scale in AHP (Table S2). A pairwise comparison matrix was created based on the hierarchical structure. The pairwise comparison judgments provided by the five experts were combined using the geometric mean, following the approach outlined by Saaty in 1980 [37]. The decision to utilize the geometric mean instead of the arithmetic mean for combining judgments from different individuals was mathematically justified by Saaty in 1980. This methodology was applied to determine the priorities of the sub-factors. For this study, we utilized the free online AHP tool available at https://bpmsg.com/ahp/ahp.php (accessed on 5 March 2023).
The pairwise comparison provided all criteria and compared each pair based on the Saaty comparison, which shows the scale of relative importance, each value’s meaning, and experts’ opinions [31]. Factor weight calculations were performed based on the resulting pairwise comparison, and the considered properties were ranked based on matrix normalization. After calculating the pairwise comparisons, each criterion factor was assigned a weight. The number of comparisons was determined, and consistency ratios (Equations (1)–(3)) were calculated to ensure that the expert opinions were dependable.
C I = λ n n 1
C R = C I R I
where CI is the consistency index, ʎ is the consistency vector, n is the number of primary criteria, CR is the consistency ratio, and RI is the random index [37].
λ m = λ m a x   w ,     λ m a x n  
λ m = a j w j n w 1
A = { a i j }   with   a i j = 1 / a i j
where A is a pairwise comparison, W is the normalized weight vector, λ m a x   is the maximum eigenvalue of matrix A, and a i j   is the numerical comparison between values i and j.

2.3. Land Use and Land Cover Change

The land use and land cover (LULC) map of Al Ain was prepared from Landsat images captured in 1972, 1984, 1993, 2003, 2013, and 2022 (Table 2, Figure 3). A Digital Elevation Model (DEM) was used to aid in the identification of highlands. Image selection began in 1972 owing to the availability of Landsat images. Subsequently, an interval of 10 years was selected for image classification. However, owing to image quality (cloud cover and dropped scan lines) and availability, the 10-year interval was not strictly followed. A Random Tree (RT) classifier was used to classify each image into five classes (built-up, desert, grass, highland, and palm) at the city level and four classes around the oases. An RT is an ensemble learning method that utilizes a collection of decision trees, where each tree is constructed from a training dataset. The RT algorithm is non-parametric and requires two parameters to establish the model: the number of trees and features in each split [38]. The number of training samples produced many decision trees, providing an individual classification tree with the chosen power. This study used 379 samples (built-up, 100; desert, 100; grass, 60; palm, 70; and highland, 49) to train the classifier (citations for sample use and accuracy assessment). More samples were considered from built-up areas and deserts because built-up areas are mixed with trees, and deserts have different soil textures. To check the accuracy, 250 samples were used. The training samples for the 1972 Landsat image were prepared from aerial photography in 1976 because the identification of training samples from the Landsat image was difficult. The training sample was prepared for the other years by changing the band combinations of the Landsat images and referring to Google Earth. Subsequently, the classification accuracy was evaluated using the testing samples. Two accuracy assessments, namely producer and Kappa, were used in this study. The purpose of Kappa is to assess the classification’s performance by comparing it to random assignment, essentially determining if the classification outperformed random chance. Finally, the area of each LULC was calculated for the entire city. Furthermore, the LULC change around a 1.5 km buffer zone of the oases was computed. The buffer zone was selected because it is considered to be the most important zone around the oases. Similarly, Shi et al. [39] highlighted that a 2-kilometer buffer zone was adequate for understanding city expansion around a station. However, using a 2-kilometer buffer zone around the oases causes the overlap of two or more zones; therefore, we set the buffer zone to 1.5 km.

2.4. Oases Stress

This study used satellite images to assess the stress on the oases. Plants suffer from osmotic stress when they fail to take up water, even when it is present in the soil. Another effect of soil salinity on agriculture is ionic stress caused by harmful ions in soil salts, such as chloride or sodium [40]. This is similar to osmotic stress due to the salinization of vegetation, and biodiversity is threatened. NDVI and NDWI are sensitive to soil moisture changes and provide plant drought stress information [41].
The normalized difference vegetation index (NDVI) and normalized difference water index (NDWI) were used to assess stress in the oases. The indices were calculated from the available Sentinel 2A satellite images (Table 2) for 2019–2022 using the Google Earth Engine. The measurement interval was five days, concurrent with the Sentinel revisit time. Before computing the NDVI and NDWI, sentinel images were filtered and masked for cloud cover. The NDVI provides information on the greenness of the vegetation, whereas the NDWI provides information on the wetness or water content of the vegetation [42,43]. The NDVI was computed using near-infrared (NIR) and red reflectance (Equation (4)). In contrast, the NDWI was computed using near-infrared and short-wave infrared (SWIR) reflectance [44] (Equation (5)).
NDVI = N I R R e d N I R + R e d
NDWI = N I R S W I R N I R + S W I R
where NDVI is the normalized difference vegetation index, NDWI is the normalized difference water index, NIR is the near-infrared band, Red is the red band, and SWIR is the short-wave infrared band. In Sentinel 2A, NIR is the band B8A, Red is the band B4, and SWIR is the band B11 [45].

3. Results

3.1. Survey Analysis

The feedback collected from the experts is summarized in Table S1. Pairwise comparisons between five different criteria—water, urban expansion, soil, palm disease, and legal framework—based on the Analytic Hierarchy Process (AHP) analysis were created (Table 3). The values represent the relative importance of each criterion compared with the others.
The pairwise comparison shows experts’ viewpoints regarding threats, and a sample of pairwise comparisons was used to create the final decision matrix. For most comparisons, the groups were homogenous. The calculated consistency ratio (CR) was ≤ 0.1 (Table 4); this is appropriate as it corresponds to 10% [31]. The CR values confirmed the reliability and accuracy of the assessment results (Table 4). All threats were weighed and compared to those with the highest influence (water). The other threats were compared individually to water. The resulting weights for the threats indicate that water poses the highest threat with a value of 0.51 (Table 4), which is close to the weight criteria value found in the AHP method by [46].
Based on expert feedback, water is considered a major threat to oases (Table 4). The number of palm trees and water consumption for each oasis are shown in Table 5. On average, each palm needs approximately 1093 gallons per month. Santoro [47] also found that the main threat to traditional oases in Northern Africa is water with related issues (desertification, drought, salinization, or overexploitation), whereas the most pressing threat to the US and Mexican date industries is the South American Palm Weevil (SPW) [48]. Other threats identified from the survey were urban expansion (human impact) and soil and palm diseases (Red Palm Weevil (RPW)) (Table 4).

3.2. LULC Change

The land use classification had an overall Kappa accuracy between 0.84 and 0.91, and Producer Accuracy (PA) was between 0.89 and 0.94 (Table S3). The confusion matrix for the LULC classification of 2022 is shown in Table 6. The accuracy obtained was higher than the value (85%) recommended by Foody [49] and Thomlinson et al. [50].
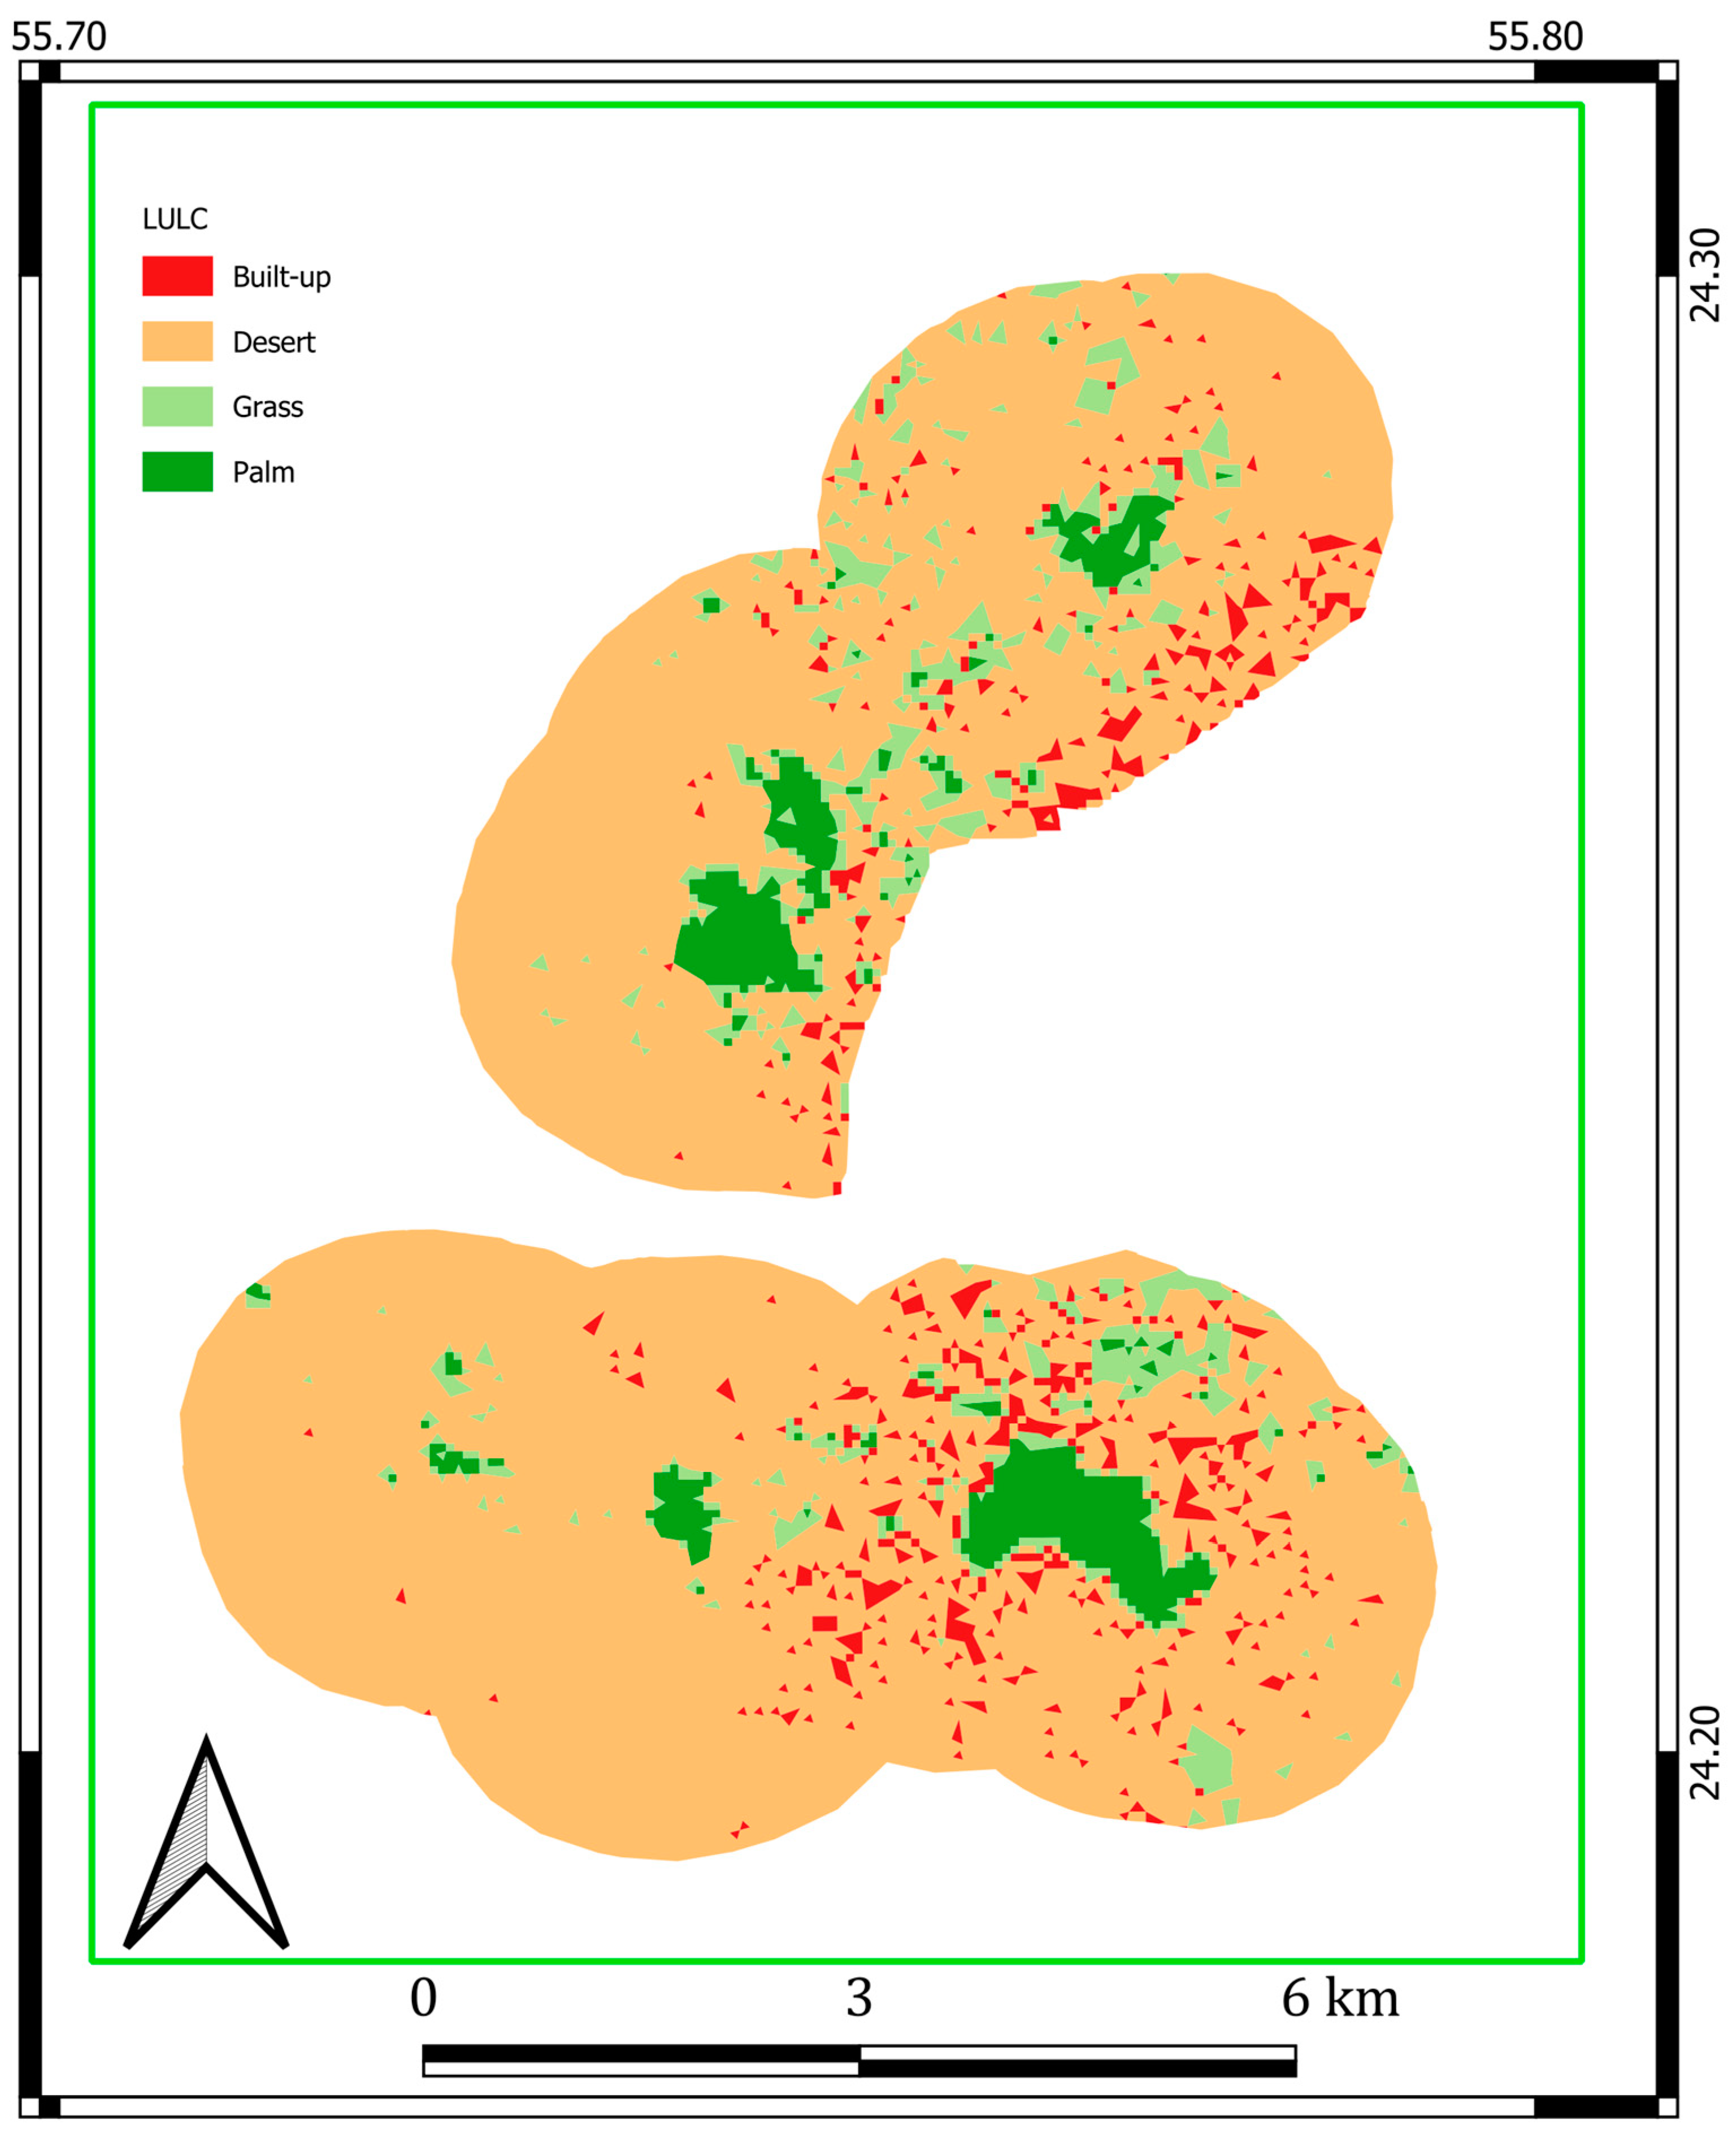
A prominent trend of LULC changes in the city was observed between 1972 and 2022 (Figure S1). In 1972, the city was mostly covered by deserts; however, after the discovery of oil in the 1970s, the city’s urban area began to expand exponentially. The most urbanized areas were in the eastern part of the city, around the Al Ain oases (Figure 4 and Figure 5). Over the past 50 years, urbanization has expanded more toward the city’s western, southwestern, and northern parts. The expansion of green areas (grass and palm trees) is more closely connected to the expansion of urban areas. Desert areas are hardly covered by vegetation, whereas areas inhabited by humans have vegetation, such as road verges, parks, compound gardens, oases, and farmlands.
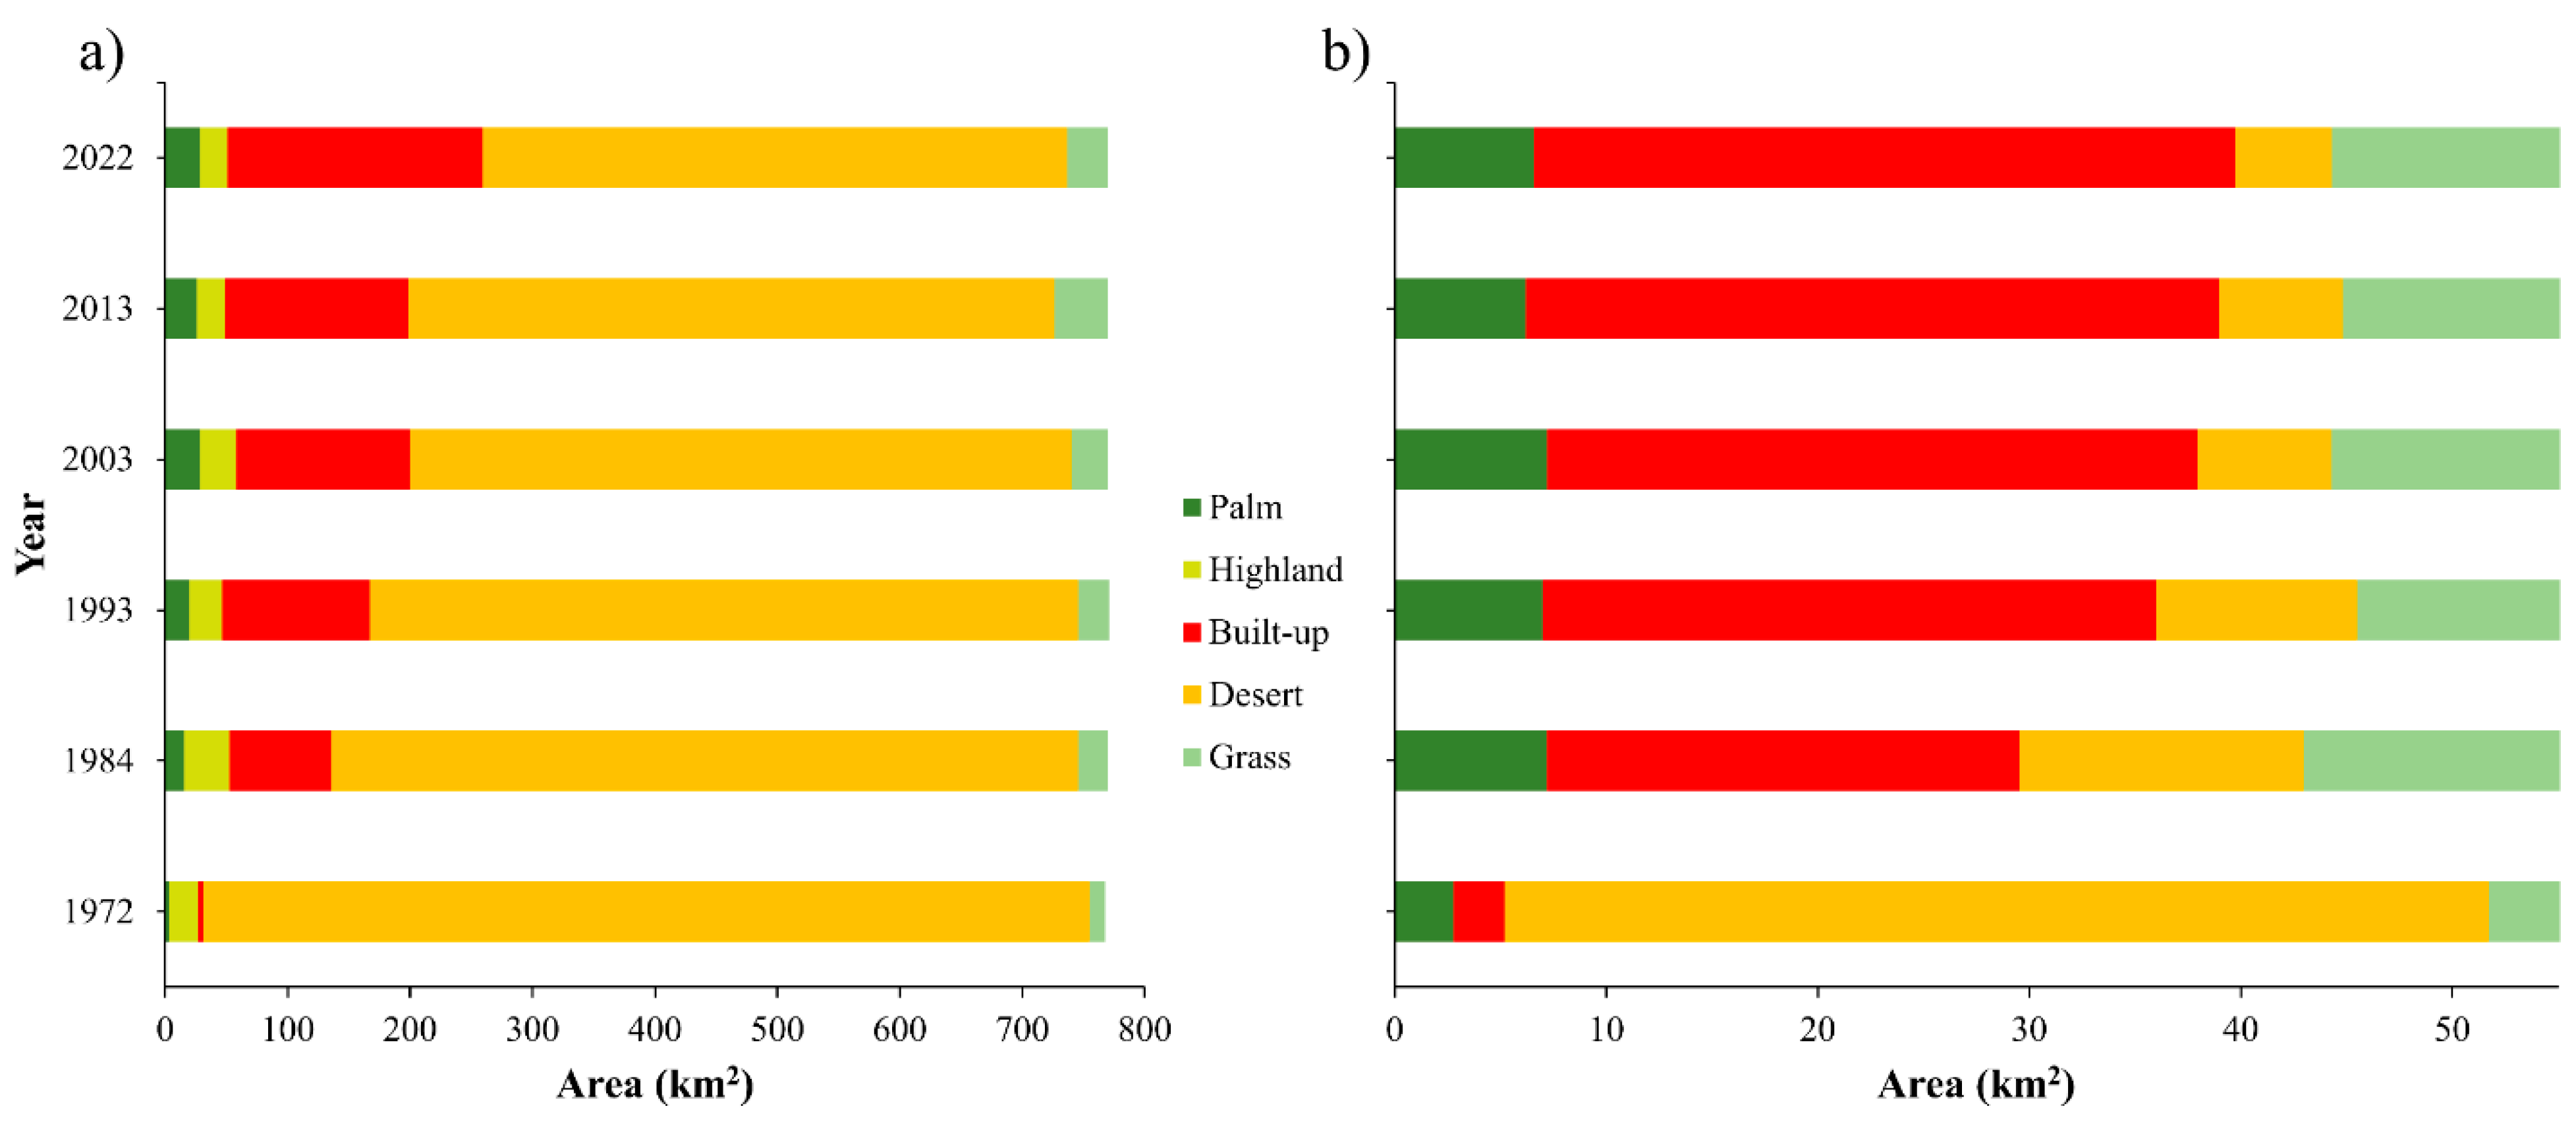
The area covered by each land-use and land-cover class in Al Ain City has changed remarkably since 1972 (Figure 6a). For example, between 1972 and 2022, built-up, palm tree-covered, and grass-covered areas increased by 98%, 89%, and 61%, respectively. Moreover, the desert and highland areas decreased by 52% and 10%, respectively.
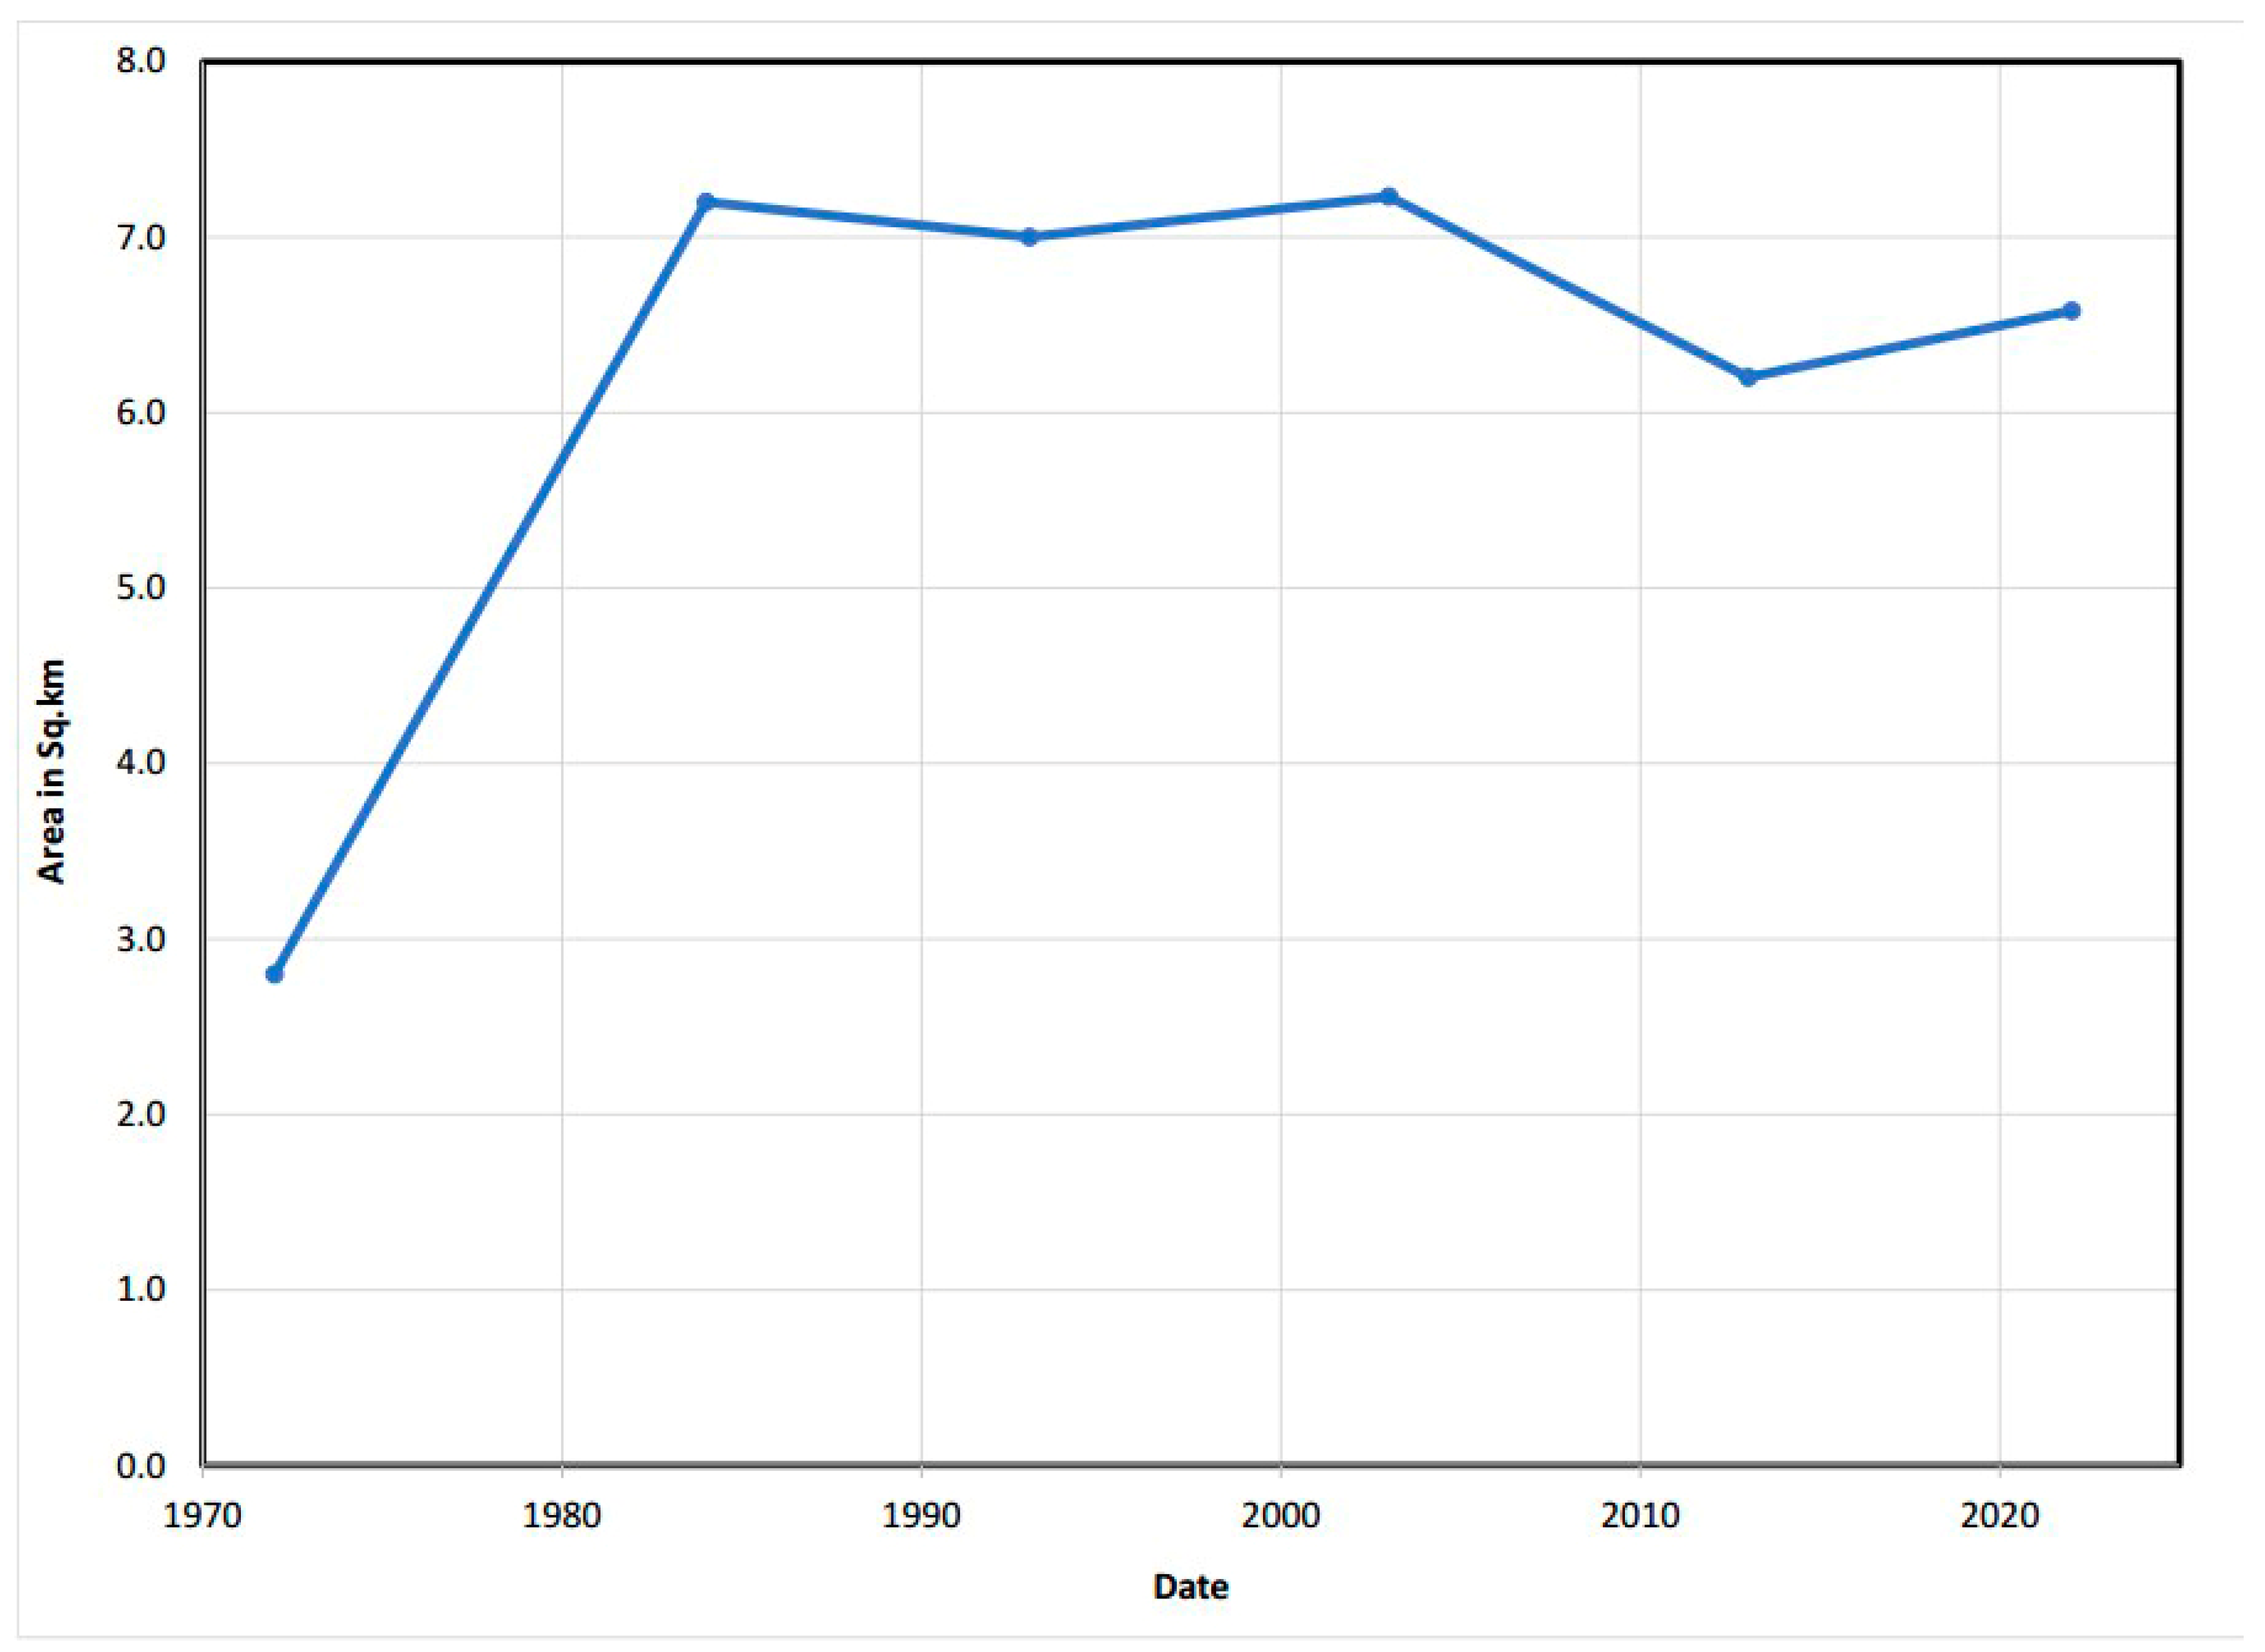
Furthermore, LUCL change analysis within a 1.5-kilometer buffer zone around the oases showed considerable land transformation (Figure 6b). The desert area decreased by 914% in 2022 compared to 1972 (Table 7). In contrast, urban areas, grass, and palm trees increased by 93%, 67%, and 57%, respectively, between 1972 and 2022. This increase was based on desert reclamation. The significant increase in palm trees between 1972 and 2022 indicates that the oases have been preserved for 50 years (Table 7). The area of the palms in 1972 was 2.8 sq. km. It increased to around 6.0 sq. km in 1980 and maintained/preserved an area of 6–7 sq. km between 1980 and 2022 (Figure 7). The increase occurred after oil exploration and due to the “Greening of the Desert” revolution led by the late Sheikh Zayed Bin Sultan Al Nahyan. Sheikh Zayed received many awards related to the environment, such as the 2005 United Nations Environment Program (UNEP) ‘Champion of the Earth’ award, Environment and Development Award, FAO Award for Agricultural Development, and WWF Golden Panda Award [51].
The issuing of decrees in 2004 and 2005 indicates that policy has significantly contributed to the preservation of the oases (Section 2.1). Moreover, a time-series analysis of the oases area from 1972 to 2022 reveals that the total surface area has remained relatively stable (Figure 7). Specifically, there was an increase in the oasis area between 1972 and 1985. Subsequently, the area remained constant from 1985 to 2002, with a slight decrease occurring in 2012.

3.3. Oases Stress

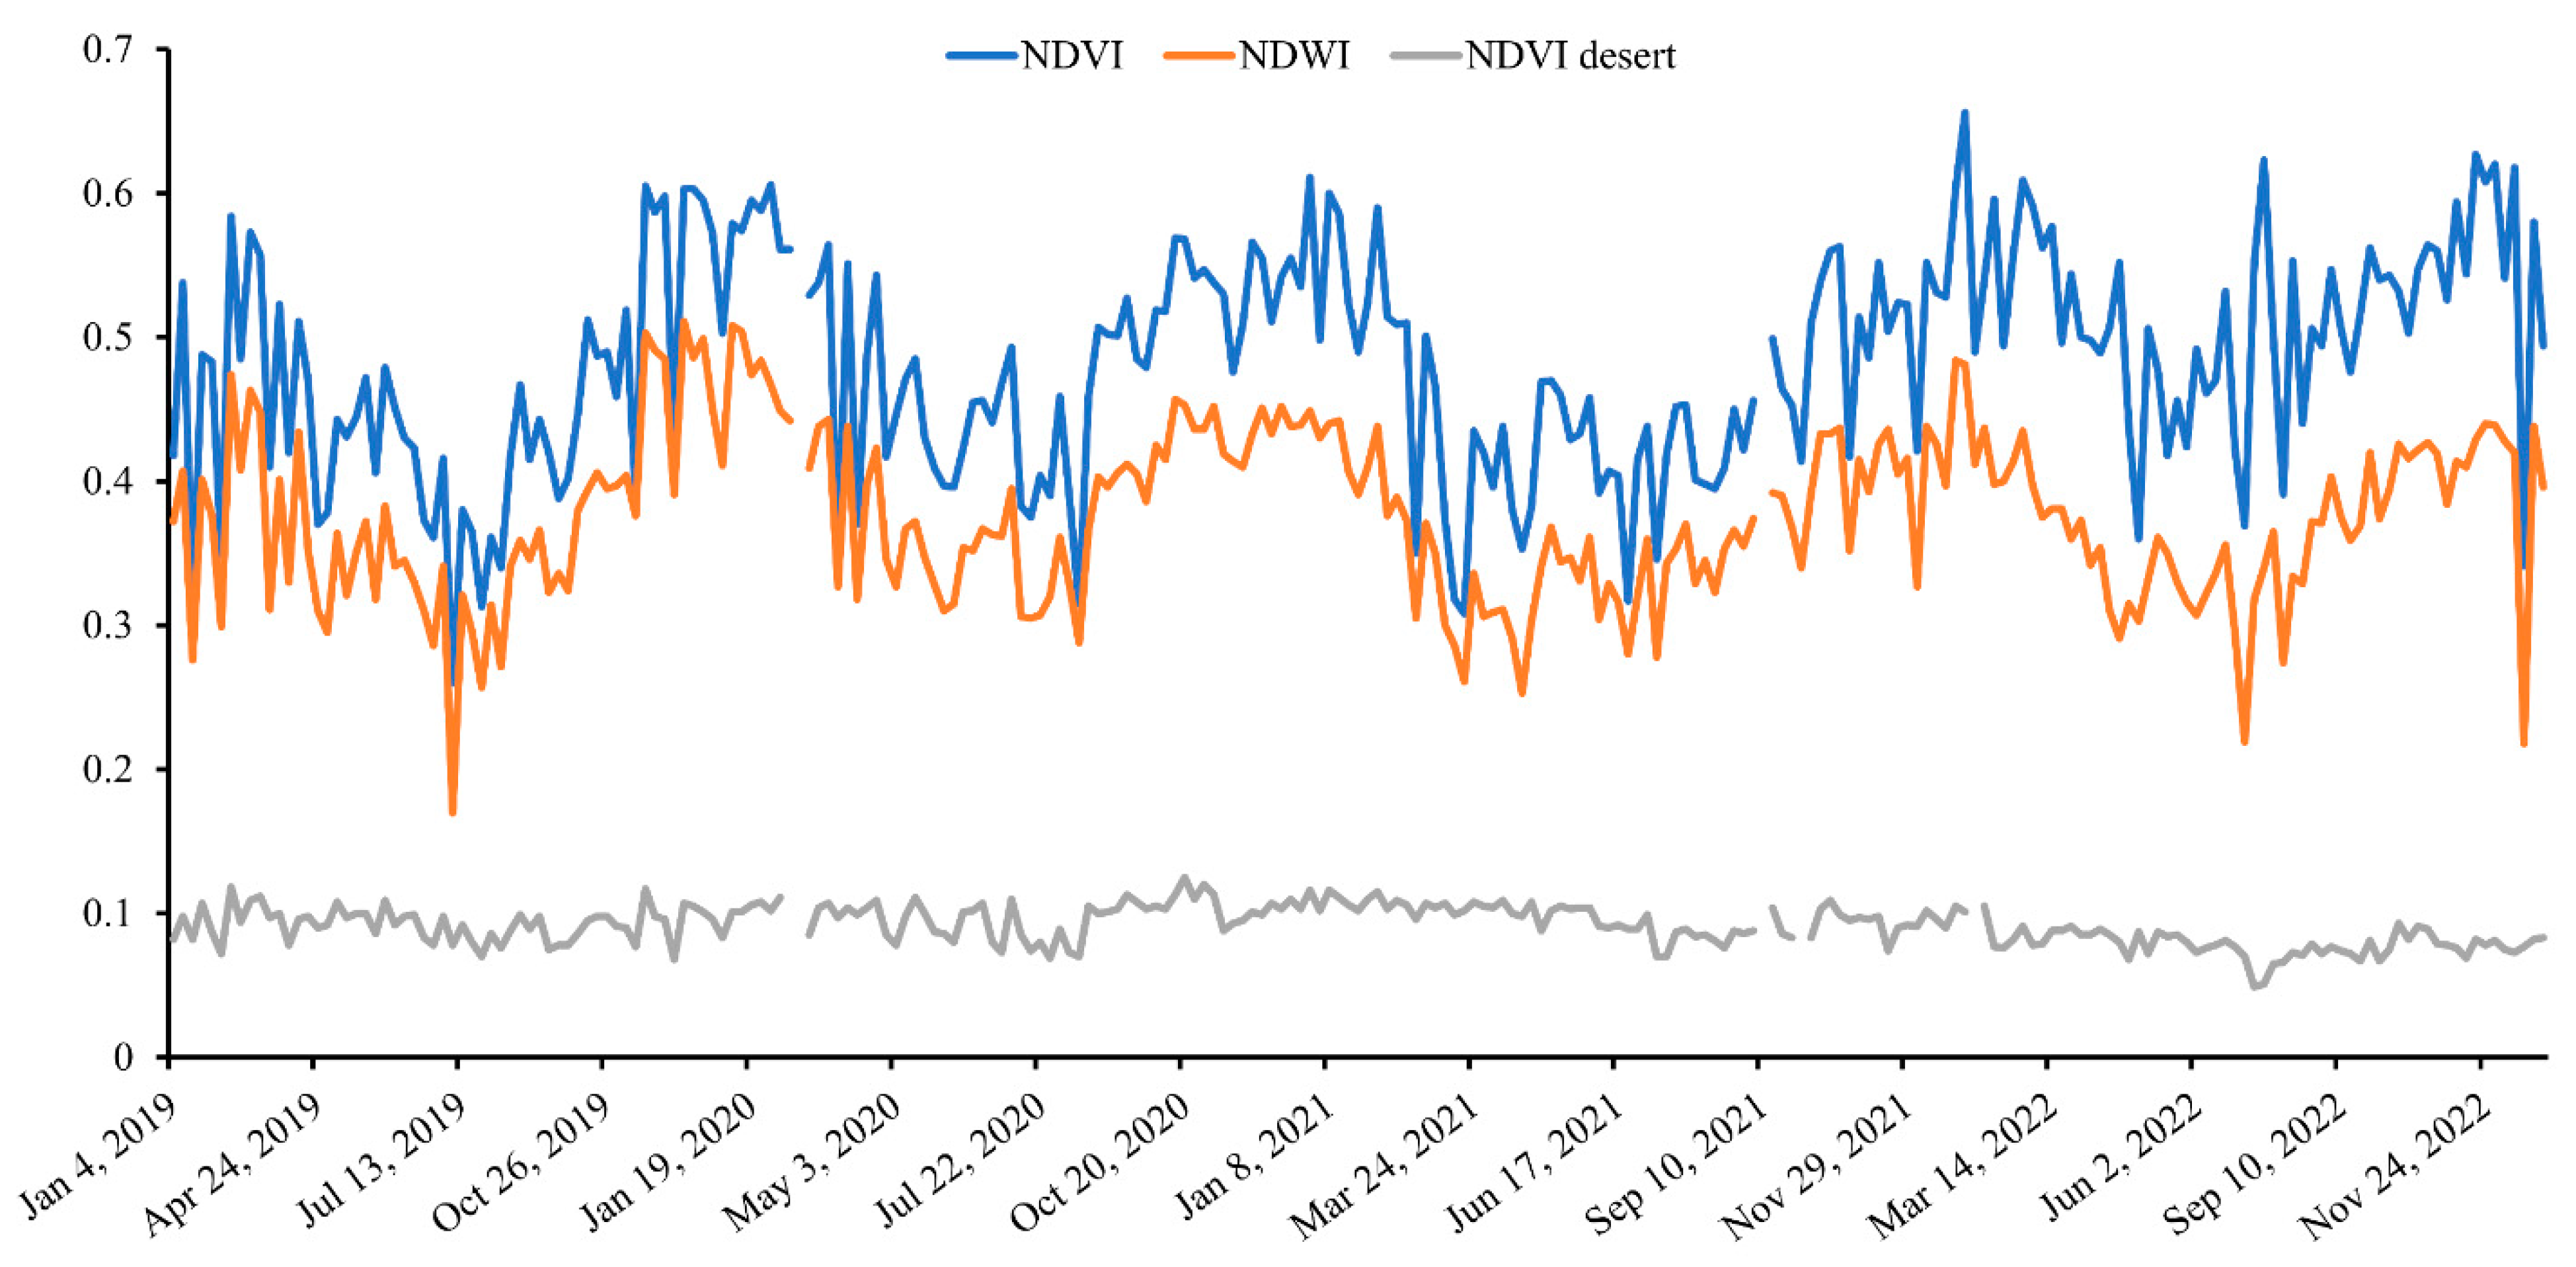
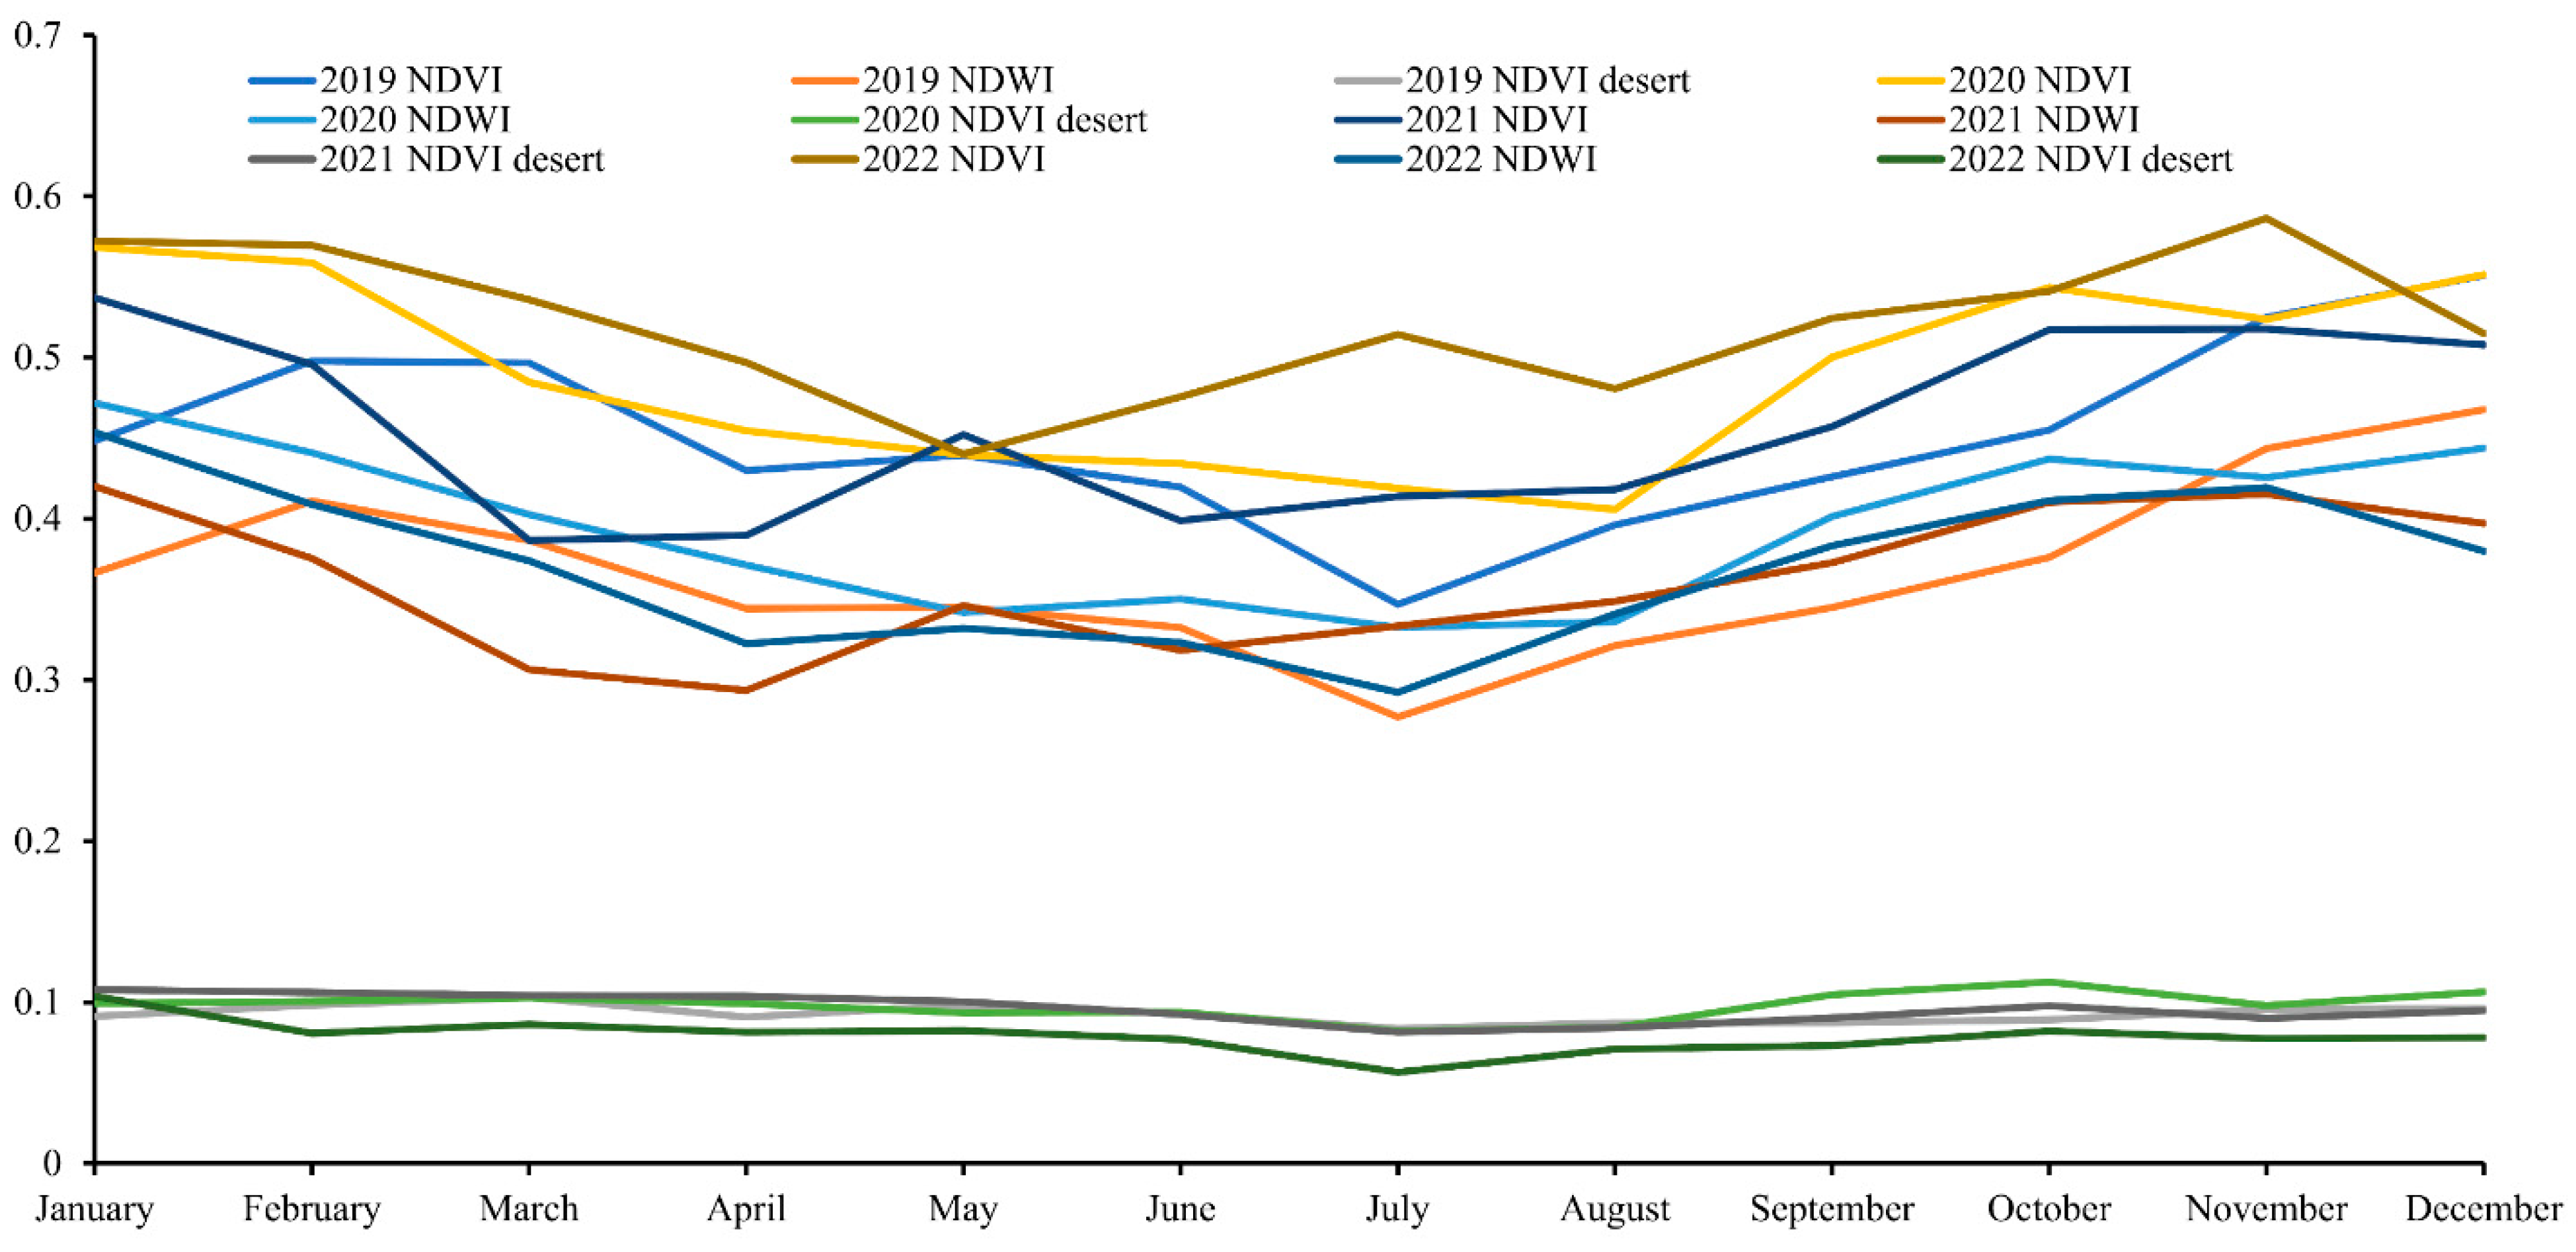
Figure 8 and Figure 9 show the time-series variation of NDVI and NDWI over the seven Al Ain oases. The NDVI and NDWI were calculated for the desert as benchmarks. It indicates seasonal vegetation and scattered trees in the desert, and the values are below those of the oases. Generally, the average NDVI and NDWI for the Al Ain oases were 0.47 and 0.38, respectively, indicating that the oases were green throughout the year, suggesting effective irrigation management. The NDVI value peaked at 0.66 during the winter (January), and the lowest value of 0.26 was in the summer, indicating deteriorating plant health. NDWI provides information regarding the water content of the vegetation. The lowest NDWI value (0.17) during summer indicates vegetation water stress, whereas the highest NDWI value (0.51) during winter indicates healthy vegetation. The lowest values are due to high evapotranspiration during the summer and low rainfall (Figure 10). For example, the average temperature during the summer is 36.2 °C, while in the winter, it is recorded below 20 °C [52]. Vegetation water stress may lead to crop failure or lower crop production [42]. Therefore, the NDWI can be used to adjust irrigation timing that aligns with the plant’s water needs.

4. Discussion

The LULC change analysis highlights the interplay between population growth, economic development, and LULC change. Oil discoveries in the 1970s significantly boosted the city’s economy, increasing the number of people and businesses. This resulted in the rapid expansion of the city’s urban areas and the accompanying growth of green spaces. The results suggest that urbanization and the associated LULC change are closely tied to the city’s economic development and that the expansion of urban areas will likely continue as the city continues to grow. Moreover, desertification also threatens the preservation of the oases [53]. Although there was a dramatic change in LULC around the oases, the oases remained resilient and were preserved for 50 years. A similar study by [12] indicated that oases owners do not want to sell their land because it is important to them. In contrast to the present finding, a study conducted in Ganzhou District showed that urban land expansion increased pressure on the oases [54]. Oases used to be the main source of food and shelter and are a unique heritage for landowners. Some landowners believe that having a farm at the center of the oases reflects their history. The support of the UAE government for farm owners in the oases has played a crucial role in the preservation of the oases. However, challenges exist in preserving these oases. Based on expert opinions, water is a major threat to the preservation of oases (Table 3 and Table 4). Previously, oases were irrigated with rain and groundwater through groundwater channels (Aflaj). Rainwater was collected from the valleys and directed to the oases via the Aflajs. Rainfall and groundwater have been insufficient to irrigate oases since the 1970s [29]. This was due to decreased rainfall, urban development (demand for more water), and increased extraction due to increased green areas (Table 5 and Table 7). In the UAE, groundwater consumption in the agricultural sector totals 70% [55], and this has already affected the aquifer’s productivity both quantitatively and qualitatively [56]. The uncontrolled water extraction leads to significant negative impacts, such as decreasing groundwater levels, increasing salinity in some regions, and widespread groundwater pollution due to agricultural practices. In the same vein, a study conducted by AbdelRahman et al. [57] suggested that degradation in groundwater quality due to its salinity, which affects soil salinity, needs proper land reclamation programs and effective irrigation and drainage systems.
Currently, oases irrigated with desalinated seawater from the Al Ain distribution company are supported by groundwater. However, water consumption for agricultural activities was charged at a rate of 3.13 AED/m3 [58]. The tariff/price of water is high because of the cost incurred in the desalination and transportation of water from remote locations (130–200 km). This places a burden on farmers to sustain their palms. One possible way to deal with irrigation water shortages is to use gray water and smart irrigation systems.
Typically, “gray water” refers to wastewater from various household activities such as washing hands, using a washing machine, dishwashing, laundry, and cooking in the kitchen [59]. Graywater is an alternative irrigation source for arid climates. Mattar et al. [60] suggested that treated wastewater can be a viable alternative to fresh water for the irrigation of date palms, as it has no significant effect on their yield or fruit quality.
One management method for irrigation water shortages could be the introduction of a smart irrigation system. A smart irrigation system based on the Internet of Things (IoT) can potentially reduce water consumption compared to traditional irrigation systems [61]. Smart irrigation uses a sensor that detects the requirement for a plant and waters the farm accordingly. Smart irrigation involves drip irrigation underneath a plastic film mulch.
Urban expansion is a critical issue highlighted by experts as a threat to oases. A similar study conducted in Algeria highlighted that urban expansion is influenced mainly by demographic growth and inadequate urban planning [62]. Land use and land cover (LULC) change analysis further supports this concern. In 1972, the built-up areas accounted for approximately 4% of the total area. In 2022, the urban area increased to 60%, primarily through desert reclamation. Urbanization is characterized by the transformation of natural and rural landscapes into urban areas, leading to significant changes in land use, land cover, and ecosystems. The location of oases in Al Ain City makes them more vulnerable to urban expansion than those in rural areas. Thus, the preservation of oases and their associated ecosystems is a crucial challenge for sustainable urban development. The LULC change analysis demonstrated the extent of the impact of urban expansion on oases in Al Ain. The analysis showed a significant increase in built-up areas (Figure 4 and Figure 5). The analysis also indicated that the pace of urban expansion is accelerating, posing a significant threat to the oases (Table 7). A notable example illustrating this is the transformation of the vegetated portion of Al Hassa oases in Saudi Arabia, where rapid development has led to the conversion of the oases’ vegetation into bare soil [63]. Therefore, preservation policies must be prioritized and supported by community engagement for the sustainable use and preservation of oases [64].
The legal framework is highlighted as a threat to the oases. This deals with policies and rules related to land ownership inside the oases and how owners use the land while preserving palm farms. The protection of the physical structures and farming practices of the oases was legally guaranteed by decrees issued in 2004 and 2005 [28]. The land use change over the last 50 years (Table 7, Figure 7) shows that palm areas have been preserved, indicating the implementation of the policy.
Soil salinity was among the threats identified by the experts (Table 3 and Table 4). Soil salinity is caused by the dry and hot climate (low precipitation and high evaporation) and the use of saline water for irrigation. The soil’s many soluble salts negatively influence plant growth, and the salt concentration may become toxic to plants. The excessive salt content in the soil can cause problems related to osmosis and ions, harming biological activity and reducing plant growth [65]. Moreover, a study conducted in Saudi Arabia highlighted the effect of soil salinity, which causes leaf injury, on date palm growth and biomass [66]. Soil salinity in the UAE’s agricultural soil is mainly caused by brackish groundwater and the absence of rainwater to recharge groundwater [55].
Soil salinity can be reduced by minimizing salt water during irrigation, using deep-rooted plants to maximize water extraction, planting salt-tolerant crops, crop rotation, reducing evaporation by mulch or crop residue, and adding organic matter. Lashari et al. [67] conducted a two-year field experiment on moderately salt-stressed soil in central China to investigate the effects of soil amendment using biochar poultry manure compost (BPC) and pyroligneous solution (PS) on soil salinity, fertility, and crop yield. The BPC-PS amendment significantly decreased soil salinity, pH, and bulk density while increasing soil organic carbon and available phosphorus. The crop yield also significantly increased under this treatment.
Date palm disease is another issue related to the preservation of oases (Table 3 and Table 4). In particular, invasive red palm weevils (RPW) threaten plant preservation within oases. The FAO has identified RPW as a category-1 pest of date palms in the Middle East, accounting for 30% of the world’s date production [68]. Therefore, palm disease must be addressed and perhaps eradicated for the sustainable preservation of oases. One containment measure is the early detection of RPW. Visual inspection is the most commonly used method for RPW detection and monitoring. This involves searching for signs of infestation, such as frass, boreholes, and damage to tree crowns [69]. However, this method is time-consuming and may not be effective for large-scale plantations. An alternative to visual inspection for RPW detection and monitoring is remote sensing, which uses satellite or airborne sensors to detect changes in vegetation that may indicate infestations. This method covers large areas and can detect early-stage infestations.

5. Conclusions

Water is a significant threat to oases. Previously, oases were irrigated from groundwater using channels (Aflajs); however, decreased rainfall, urban expansion, and increased extraction due to increased green areas have made groundwater insufficient to irrigate the oases. Desalinated seawater is currently used for irrigation. The remote location of the city from the oceans (130–200 km) increases the cost of desalinated water.
Urban expansion is another critical issue that poses a significant threat to the oases in Al-Ain City. LULC change analysis indicates that the pace of urban expansion is accelerating, posing a significant threat to oases, and preservation policy needs to be prioritized by community engagement for the sustainable use and preservation of oases. This change highlights the interplay between population growth, economic development, and LULC change and how it has impacted oases. The discovery of oil in the 1970s led to a significant boost in the city’s economy, leading to rapid urbanization and the expansion of green spaces. However, urbanization and LULC changes are closely tied to a city’s economic development, and the expansion of urban areas is likely to continue as the city grows. Nevertheless, the oases in Al Ain City remained resilient and were preserved for many years despite the dramatic change in the LULC around them.
Soil salinity also threatens oases because excessive salt in the soil can harm biological activity and lower plant growth. Therefore, soil salinity must be addressed using soil improvement practices and management strategies. In conclusion, this study emphasized the importance of preservation policies and community engagement in the sustainable use and preservation of oases. This study suggests that policymakers should prioritize the implementation of effective policies for managing groundwater, gray water irrigation, smart irrigation systems, soil improvement practices, palm diseases, and management strategies to address the significant threats to oases in Al Ain City. The environmental and economic services provided by oases could be a future research topic.

6. Recommendations

Based on the findings and conclusions of this study, several recommendations can be made to address the significant threats to oases in Al Ain City and ensure their sustainable use and preservation.
  • Effective groundwater management: Given that groundwater consumption in the agricultural sector accounts for a substantial portion of water usage, it is crucial to implement effective policies and regulations for managing groundwater. This should include controlling water extraction, monitoring groundwater levels, and addressing issues such as salinity and pollution.
  • Gray water for irrigation and smart irrigation systems: To mitigate irrigation water shortages and reduce the burden on farmers, alternative water sources like gray water can be assessed for irrigation purposes. Additionally, the adoption of smart irrigation systems based on the Internet of Things (IoT) can help optimize water consumption by providing precise irrigation based on plant needs. These measures can contribute to more efficient water use and reduce the strain on oases.
  • Soil improvement practices: Given the threat of soil salinity to oases, implementing soil improvement practices is essential. Strategies such as minimizing saltwater during irrigation, planting deep-rooted and salt-tolerant crops, using mulch or crop residue to reduce evaporation, and adding organic matter to enhance soil fertility can help reduce soil salinity and promote healthy plant growth.
  • Palm disease management: The invasive red palm weevil (RPW) poses a significant threat to date palms within oases. Early detection and containment measures are crucial for the sustainable preservation of oases. Combining visual inspection with remote sensing technologies can improve the efficiency and effectiveness of RPW detection, allowing for early intervention and control measures to be implemented.
  • Future research: This study highlights the environmental and economic services provided by oases. Further research can explore the potential economic benefits of oases, such as eco-tourism, sustainable agriculture, and ecosystem services. Understanding the value of oases beyond their cultural significance can contribute to the development of comprehensive preservation strategies.
By implementing these recommendations, policymakers and stakeholders can work together to address the identified threats and ensure the long-term sustainability of oases in Al Ain City. The preservation of oases not only protects their cultural heritage but also contributes to the overall environmental resilience and well-being of the city and its residents.

Supplementary Materials

The following supporting information can be downloaded at: https://www.mdpi.com/article/10.3390/land12071269/s1, Table S1. Experts rating of the threats to the oases. Table S2. Fundamental scale in AHP (Saaty, 1980). Table S3. Confusion matrix for LULC classification. Figure S1. Land use and land cover of Al Ain.

Author Contributions

M.M.Y. developed the research idea, wrote the paper, and managed the overall project flow. T.A. participated in the research idea and review of the paper. Y.T.T. processed the satellite images and did the AHP analysis. K.A. distributed the survey and collected data. M.A. and M.E.A. reviewed the literature. All authors contributed critically to the drafts and gave final approval for publication. All authors have read and agreed to the published version of the manuscript.

Funding

This research was funded by UAE University SDGs Research Program (SDG 15—Life on Land) [Grant number: G00004084].

Informed Consent Statement

Consent was obtained from all experts involved in the study.

Data Availability Statement

The data used in this study are available from the corresponding author upon request.

Acknowledgments

The authors are grateful to UAE University Research Affairs for funding this research (Grant number: G00004084). The views and conclusions are those of the authors and should not be considered by those of the sponsor. Shehab Majud is acknowledged for following up on the editing process. We extend our thanks to all experts who have participated in the survey. We highly appreciate the invaluable suggestions and comments made by the reviewers and the following up by the editorial team.

Conflicts of Interest

The authors declare that they have no financial interests or personal relationships that could have appeared to influence the work reported in this paper.

References

  1. Veillon, R. State of Conservation of World Heritage Properties: A Statistical Analysis (1979–2013); UNESCO World Heritage Centre: Paris, France, 2014. [Google Scholar]
  2. SDG. Biodiversity and Ecosystems. 2022. Available online: https://sdgs.un.org/topics/biodiversity-and-ecosystems (accessed on 12 January 2023).
  3. UN. The Sustainable Development Agenda. 2022. Available online: https://www.un.org/sustainabledevelopment/development-agenda/ (accessed on 15 May 2022).
  4. FAO. Adaptive Management and Monitoring of Oasis Eco-Systems in the Maghreb. 2017. Available online: https://www.fao.org/neareast/news/view/en/c/1072400/ (accessed on 11 May 2022).
  5. Petersen, A. Islamic urbanism in Eastern Arabia: The case of the al-Ayn-al-Buraymī oasis. Proc. Semin. Arab. Stud. Lond. 2009, 39, 61–74. Available online: https://www.jstor.org/stable/41223990 (accessed on 13 February 2023).
  6. UNESCO World Heritage Convention. United Arab Emirates. 2022. Available online: https://whc.unesco.org/en/statesparties/ae (accessed on 12 September 2022).
  7. Al-Tikriti, W.Y. An early Islamic Falaj from al-Ain, UAE. Bull. Soc. Arab. Stud. 2003, 8, 11–19. [Google Scholar]
  8. Power, T.C.; Sheehan, P.D. The origin and development of the oasis landscape of al-Ain (UAE). Proc. Semin. Arab. Stud. 2013, 42, 291–308. Available online: https://www.jstor.org/stable/41623644 (accessed on 3 February 2023).
  9. Power, T.C.; Sheehan, P.D. The Bayt Bin Ātī in Qattärah Oasis: A prehistoric industrial site and the formation of the oasis landscape of al-Ayn, UAE. Proc. Semin. Arab. Stud. 2011, 41, 267–282. Available online: https://www.jstor.org/stable/41622139 (accessed on 10 February 2023).
  10. FAO. Al Ain and Liwa Historical Date Palm Oases, United Arab Emirates. 2023. Available online: https://www.fao.org/giahs/giahsaroundtheworld/designated-sites/near-east-and-north-africa/al-ain-and-liwa-historical-date-palm-oases/en/ (accessed on 10 August 2022).
  11. Allali, K.; Fadlaoui, A.; Arib, F.; de-Miguel, M.D.; Alcon, F. Economic valuation of cultural services at the Todgha Oasis, Morocco. J. Nat. Conserv. 2023, 73, 126371. [Google Scholar] [CrossRef]
  12. Yagoub, M.M. Monitoring of urban growth of a desert city through remote sensing: Al-Ain (UAE) between 1976 and 2000. Int. J. Remote Sens. 2004, 25, 1063–1076. [Google Scholar] [CrossRef]
  13. Al Foah. Taking UAE’s Rich Heritage Global. 2023. Available online: https://alfoah.com/ (accessed on 15 February 2023).
  14. Siddiq, M.; Aleid; Salah, M.; Kader, A.A. Dates: Postharvest Science, Processing Technology and Health Benefits; John Wiley & Sons Ltd.: Chichester, UK, 2013. [Google Scholar]
  15. Jaiswal, N.; Deb, S.K.; Panda, S.K.; Mandal, A.K.; Khan, A.W.; Kishtawal, C.M. Investigating Intra-Urban thermal variability of Ahmedabad, India: Heat wave prediction perspective. J. Indian Soc. Remote Sens. 2022, 50, 1903–1913. [Google Scholar] [CrossRef]
  16. Yagoub, M.M.; Tesfaldet, Y.T.; Elmubarak, M.G.; Al Hosani, N. Extraction of Urban Quality of Life Indicators Using Remote Sensing and Machine Learning: The Case of Al Ain City, United Arab Emirates (UAE). ISPRS Int. J. Geo-Inf. 2022, 11, 458. [Google Scholar] [CrossRef]
  17. Al Shaiba, O.M. Creation and Use of a GeoDatabase in the Study of the Oases of Jimi and Quattra in Al Ain; A Capstone Report; United Arab Emirates University: Abu Dhabi, United Arab Emirates, 2011. [Google Scholar]
  18. Bousdira, K.; Nouri, L.H.; Legrand, J. Chemical characterization of phoenicicole biomass fuel in algerian oasis: Deglet Nour and Ghars cultivars case. Energy Fuels 2014, 28, 7483–7493. [Google Scholar] [CrossRef]
  19. Prost, G.L. Remote Sensing for Geoscientists: Image Analysis and Integration, 3rd ed.; CRC Press: London, UK, 2019. [Google Scholar]
  20. Ge, G.; Zhang, J.; Chen, X.; Liu, X.; Hao, Y.; Yang, X.; Kwon, S.M. Effects of Land Use and Land Cover Change on Ecosystem Services in an Arid Desert-Oasis Ecotone along the Yellow River of China. Ecol. Eng. 2022, 176, 106512. [Google Scholar] [CrossRef]
  21. Salih, A.; Hassaballa, A.A.; Ganawa, E. Mapping Desertification Degree and Assessing Its Severity in Al-Ahsa Oasis, Saudi Arabia, Using Remote Sensing-Based Indicators. Arab. J. Geosci. 2021, 14, 192. [Google Scholar] [CrossRef]
  22. Ullah, S.; Shi, Y.; Dasti, M.Y.S.; Wajid, M.; Saqib, Z.A. Estimating Advance of Built-Up Area in Desert-Oasis Ecotone of Cholistan Desert Using Landsat. Land 2023, 12, 1009. [Google Scholar] [CrossRef]
  23. Maimaitiaili, A.; Aji, X.; Matniyaz, A.; Kondoh, A. Monitoring and analysing land use/cover changes in an arid region based on multi-satellite data: The Kashgar Region, Northwest China. Land 2018, 7, 6. [Google Scholar] [CrossRef] [Green Version]
  24. Moumane, A.; Al Karkouri, J.; Benmansour, A.; El Ghazali, F.E.; Fico, J.; Karmaoui, A.; Batchi, M. Monitoring long-term land use, land cover change, and desertification in the Ternata oasis, Middle Draa Valley, Morocco. Remote Sens. Appl. Soc. Environ. 2022, 26, 100745. [Google Scholar] [CrossRef]
  25. Zhang, Q.; Luo, G.; Li, L.; Zhang, M.; Lv, N.; Wang, X. An analysis of oasis evolution based on land use and land cover change: A case study in the Sangong River Basin on the northern slope of the Tianshan Mountains. J. Geogr. Sci. 2017, 27, 223–239. [Google Scholar] [CrossRef] [Green Version]
  26. UNESCO World Heritage Convention. State of Conservation Information System (SOC): Conserve and Transmit to Future Generations. 2022. Available online: https://whc.unesco.org/en/soc/ (accessed on 10 September 2022).
  27. Statistics Centre. Statistical Yearbook of Abu Dhabi 2020; Statistics Center Publication: Abu Dhabi, United Arab Emirates, 2020. [Google Scholar]
  28. Yildirim, E.; El-Masri, S. Master Planning for Conservation in Al Ain Oasis. In Proceedings of the 46th ISOCARP Congress, Nairobi, Kenya, 19–23 September 2010. [Google Scholar]
  29. Power, T.; Sheehan, P.; Al Dhaheri, S.M.; Al Hammadi, M.A.A.A.; Al Hammadi, K.I.; Al Noaimi, A.A.; Al Subaihi, A.M.; Al Omar, H.H.; Al-Romeithi, F.T.; Al Mansoori, M.K.; et al. Al Ain Oases Mapping Project: Qattarah Oasis, past and present (poster). Proc. Semin. Arab. Stud. 2016, 46, 227–236. Available online: https://www.jstor.org/stable/45163429 (accessed on 11 March 2023).
  30. Khalifa, A. Khalifa International Award for Date Palm and Agricultural Innovation. 2023. Available online: https://www.kiaai.ae/en (accessed on 5 November 2022).
  31. Saaty, T.L. How to make a decision: The Analytic Hierarchy Process. Eur. J. Oper. Res. 1990, 48, 9–26. [Google Scholar] [CrossRef]
  32. Passage Technology. What is the Analytic Hierarchy Process (AHP)?|Passage Technology. Passage Technology. 2023. Available online: https://www.passagetechnology.com/what-is-the-analytic-hierarchy-process (accessed on 10 March 2023).
  33. Agapiou, A.; Lysandrou, V.; Alexakis, D.D.; Themistocleous, K.; Cuca, B.; Argyriou, A.; Hadjimitsis, D.G. Cultural heritage management and monitoring using remote sensing data and GIS: The case study of Paphos area, Cyprus. Comput. Environ. Urban Syst 2015, 54, 230–239. [Google Scholar] [CrossRef]
  34. Kittipongvises, S.; Phetrak, A.; Rattanapun, P.; Brundiers, K.; Buizer, J.L.; Melnick, R. AHP-GIS analysis for flood hazard assessment of the communities nearby the world heritage site on Ayutthaya Island, Thailand. Int. J. Disaster Risk Reduct. 2020, 48, 101612. [Google Scholar] [CrossRef]
  35. Kutut, V.; Zavadskas, E.K.; Lazauskas, M. Assessment of priority alternatives for preservation of historic buildings using model based on ARAS and AHP methods. Arch. Civ. Mech. Eng. 2014, 14, 287–294. [Google Scholar] [CrossRef]
  36. Daim, T.U.; Udbye, A.; Balasubramanian, A. Use of analytic hierarchy process (AHP) for selection of 3PL providers. J. Manuf. Technol. Manag. 2013, 24, 28–51. [Google Scholar] [CrossRef]
  37. Saaty, T.L. The Analytic Hierarchy Process: Planning, Priority Setting, Resource Allocation; McGraw-Hill International Book Co.: New York, NY, USA, 1980. [Google Scholar]
  38. Sheykhmousa, M.; Mahdianpari, M.; Ghanbari, H.; Mohammadimanesh, F.; Ghamisi, P.; Homayouni, S. Support Vector Machine Versus Random Forest for Remote Sensing Image Classification: A Meta-Analysis and Systematic Review. IEEE J. Sel. Top. Appl. Earth Obs. Remote Sens. 2020, 13, 6308–6325. [Google Scholar] [CrossRef]
  39. Shi, T.; Huang, Y.; Wang, H.; Shi, C.-E.; Yang, Y.-J. Influence of urbanization on the thermal environment of meteorological station: Satellite-observed evidence. Adv. Clim. Chang. Res. 2015, 6, 7–15. [Google Scholar] [CrossRef]
  40. EOS. Soil Salinization Causes & How to Prevent and Manage It. 2023. Available online: https://eos.com/blog/soil-salinization/ (accessed on 12 June 2022).
  41. Gu, Y.; Hunt, E.; Wardlow, B.; Basara, J.B.; Brown, J.F.; Verdin, J.P. Evaluation of MODIS NDVI and NDWI for vegetation drought monitoring using Oklahoma Mesonet soil moisture data. Geophys. Res. Lett. 2008, 35. [Google Scholar] [CrossRef] [Green Version]
  42. EDO. NDWI: Normalized Difference Water Index; EDO Home—European Drought Observatory—JRC European Commission: 2011. Available online: www.europa.eu (accessed on 15 January 2023).
  43. Huang, S.; Tang, L.; Hupy, J.P.; Wang, Y.; Shao, G.F. A commentary review on the use of normalized difference vegetation index (NDVI) in the era of popular remote sensing. J. For. Res. 2021, 32, 2719. [Google Scholar] [CrossRef]
  44. Gao, B.-C. NDWI—A normalized difference water index for remote sensing of vegetation liquid water from space. Remote Sens. Environ. 1996, 58, 257–266. [Google Scholar] [CrossRef]
  45. Zhang, T.; Su, J.; Liu, C.; Chen, W.H.; Liu, H.; Liu, G. Band selection in sentinel-2 satellite for agriculture applications. In Proceedings of the 23rd International Conference on Automation and Computing (ICAC), Huddersfield, UK, 7–8 September 2017; IEEE: Piscataway, NJ, USA, 2017; pp. 1–6. [Google Scholar] [CrossRef] [Green Version]
  46. Cabrera, J.S.; Lee, H.S. Flood risk assessment for Davao Oriental in the Philippines using Geographic Information system-based multi-criteria analysis and the maximum entropy model. J. Flood Risk Manag. 2020, 13, e12607. [Google Scholar] [CrossRef] [Green Version]
  47. Santoro, A. Traditional oases in Northern Africa as multifunctional agroforestry systems: A systematic literature review of the provided Ecosystem Services and of the main vulnerabilities. Agroforest Syst. 2022, 97, 81–96. [Google Scholar] [CrossRef]
  48. Wright, G.C. The Date Industry in the United States and Mexico. The Blessed Tree, 14 (01)–March 2022. Available online: https://www.kiaai.ae/sites/default/files/magazine_pdf_files/books_BlessedTreeIssueMarch2022_2022-03-01_7626733.pdf (accessed on 20 April 2023).
  49. Foody, G.M. Status of land cover classification accuracy assessment. Remote Sens. Environ. 2002, 80, 185–201. [Google Scholar] [CrossRef]
  50. Thomlinson, J.R.; Bolstad, P.V.; Cohen, W.B. Coordinating Methodologies for Scaling Landcover Classifications from Site-Specific to Global. Remote Sens. Environ. 1999, 70, 16–28. [Google Scholar] [CrossRef]
  51. Salloum, H. How Sheikh Zayid Turned the Desert Green. Christian Science Monitor, 27 May 1997. Available online: https://www.csmonitor.com/1997/0527/052797.opin.opin.1.html (accessed on 12 April 2023).
  52. NCM. Annual Climate Assessment 2021. United Arab Emirates. 2021. Available online: https://www.ncm.ae/resources/climate-reports/ncm-annual-climate-assessment-2021-s.pdf (accessed on 8 October 2022).
  53. Lamqadem, A.A.; Saber, H.; Pradhan, B. Quantitative assessment of desertification in an arid oasis using remote sensing data and spectral index techniques. Remote Sens. 2018, 10, 1862. [Google Scholar] [CrossRef] [Green Version]
  54. Liu, Y.; Song, W.; Deng, X. Understanding the spatiotemporal variation of urban land expansion in oasis cities by integrating remote sensing and multi-dimensional DPSIR-based indicators. Ecol. Indic. 2019, 96, 23–37. [Google Scholar] [CrossRef]
  55. Murad, A. An overview of conventional and non-conventional water resources in arid region: Assessment and constrains of the United Arab Emirates (UAE). J. Water Resour. Prot. 2010, 2010, 1327. [Google Scholar] [CrossRef] [Green Version]
  56. Al-Rashed, M.F.; Sherif, M.M. Water Resources in the GCC Countries: An Overview. Water Resour. Manag. 2000, 14, 59–75. [Google Scholar] [CrossRef]
  57. AbdelRahman, M.A.; Metwaly, M.M.; Shalaby, A. Quantitative assessment of soil saline degradation using remote sensing indices in Siwa Oasis. Remote Sens. Appl. Soc. Environ. 2019, 13, 53–60. [Google Scholar] [CrossRef]
  58. Al Ain Distribution Company. Water and electricity tariffs 2017. Al Ain Distribution Company. 2017. Available online: https://www.aadc.ae/pdfs/Tariff/Tariff2017Englishwebsite.pdf (accessed on 5 March 2023).
  59. Edwin, G.A.; Gopalsamy, P.; Muthu, N. Characterization of domestic gray water from point source to determine the potential for urban residential reuse: A short review. Appl. Water Sci. 2014, 4, 39–49. [Google Scholar] [CrossRef] [Green Version]
  60. Mattar, M.A.; Soliman, S.S.; Al-Obeed, R.S. Effects of various quantities of three irrigation water types on yield and fruit quality of ‘succary’date palm. Agronomy 2021, 11, 796. [Google Scholar] [CrossRef]
  61. Mohammed, M.; Riad, K.; Alqahtani, N. Efficient IOT-based control for a smart subsurface irrigation system to enhance irrigation management of date palm. Sensors 2021, 21, 3942. [Google Scholar] [CrossRef]
  62. Berbache, H.; Hadjab, M. Oasian cities: A tourist heritage threatened by the invasion of urban expansion, case of the oasis of boussaada, Algeria. Geo J. Tour. Geosites 2020, 31, 1119–1125. [Google Scholar] [CrossRef]
  63. Almadini, A.M.; Hassaballa, A.A. Depicting changes in land surface cover at Al-Hassa oasis of Saudi Arabia using remote sensing and GIS techniques. PLoS ONE 2019, 14, e0221115. [Google Scholar] [CrossRef]
  64. Gong, B.; Liu, Z. Assessing impacts of land use policies on environmental sustainability of oasis landscapes with scenario analysis: The case of northern China. Landsc. Ecol. 2021, 36, 1913–1932. [Google Scholar] [CrossRef]
  65. Alhammadi, M.S.; Kurup, S.S. Impact of salinity stress on date palm (Phoenix dactylifera L.)—A review. Crop Prod. Technol. 2012, 169–178. [Google Scholar] [CrossRef] [Green Version]
  66. Al-Abdoulhadi, I.A.; Dinar, H.A.; Ebert, G.; Büttner, C. Effect of salinity on leaf growth, leaf injury and biomass production in date palm (Phoenix dactylifera L.) cultivars. Indian J. Sci. Technol. 2011, 4, 1542–1546. [Google Scholar] [CrossRef]
  67. Lashari, M.S.; Liu, Y.; Li, L.; Pan, W.; Fu, J.; Pan, G.; Zheng, J.; Zheng, J.; Zhang, X.; Yu, X. Effects of amendment of biochar-manure compost in conjunction with pyroligneous solution on soil quality and wheat yield of a salt-stressed cropland from Central China Great Plain. Field Crop. Res. 2013, 144, 113–118. [Google Scholar] [CrossRef]
  68. El-Sabea, A.M.; Faleiro, J.R.; Abo-El-Saad, M.M. The threat of red palm weevil Rhynchophorus ferrugineus to date plantations of the Gulf region in the Middle-East: An economic perspective. Outlooks Pest Manag. 2009, 20, 131–134. [Google Scholar] [CrossRef]
  69. Rasool, K.G.; Husain, M.; Salman, S.; Tufail, M.; Sukirno, S.; Mehmood, K.; Farooq, W.A.; Aldawood, A.S. Evaluation of some non-invasive approaches for the detection of red palm weevil infestation. Saudi J. Biol. Sci. 2020, 27, 401–406. [Google Scholar] [CrossRef]
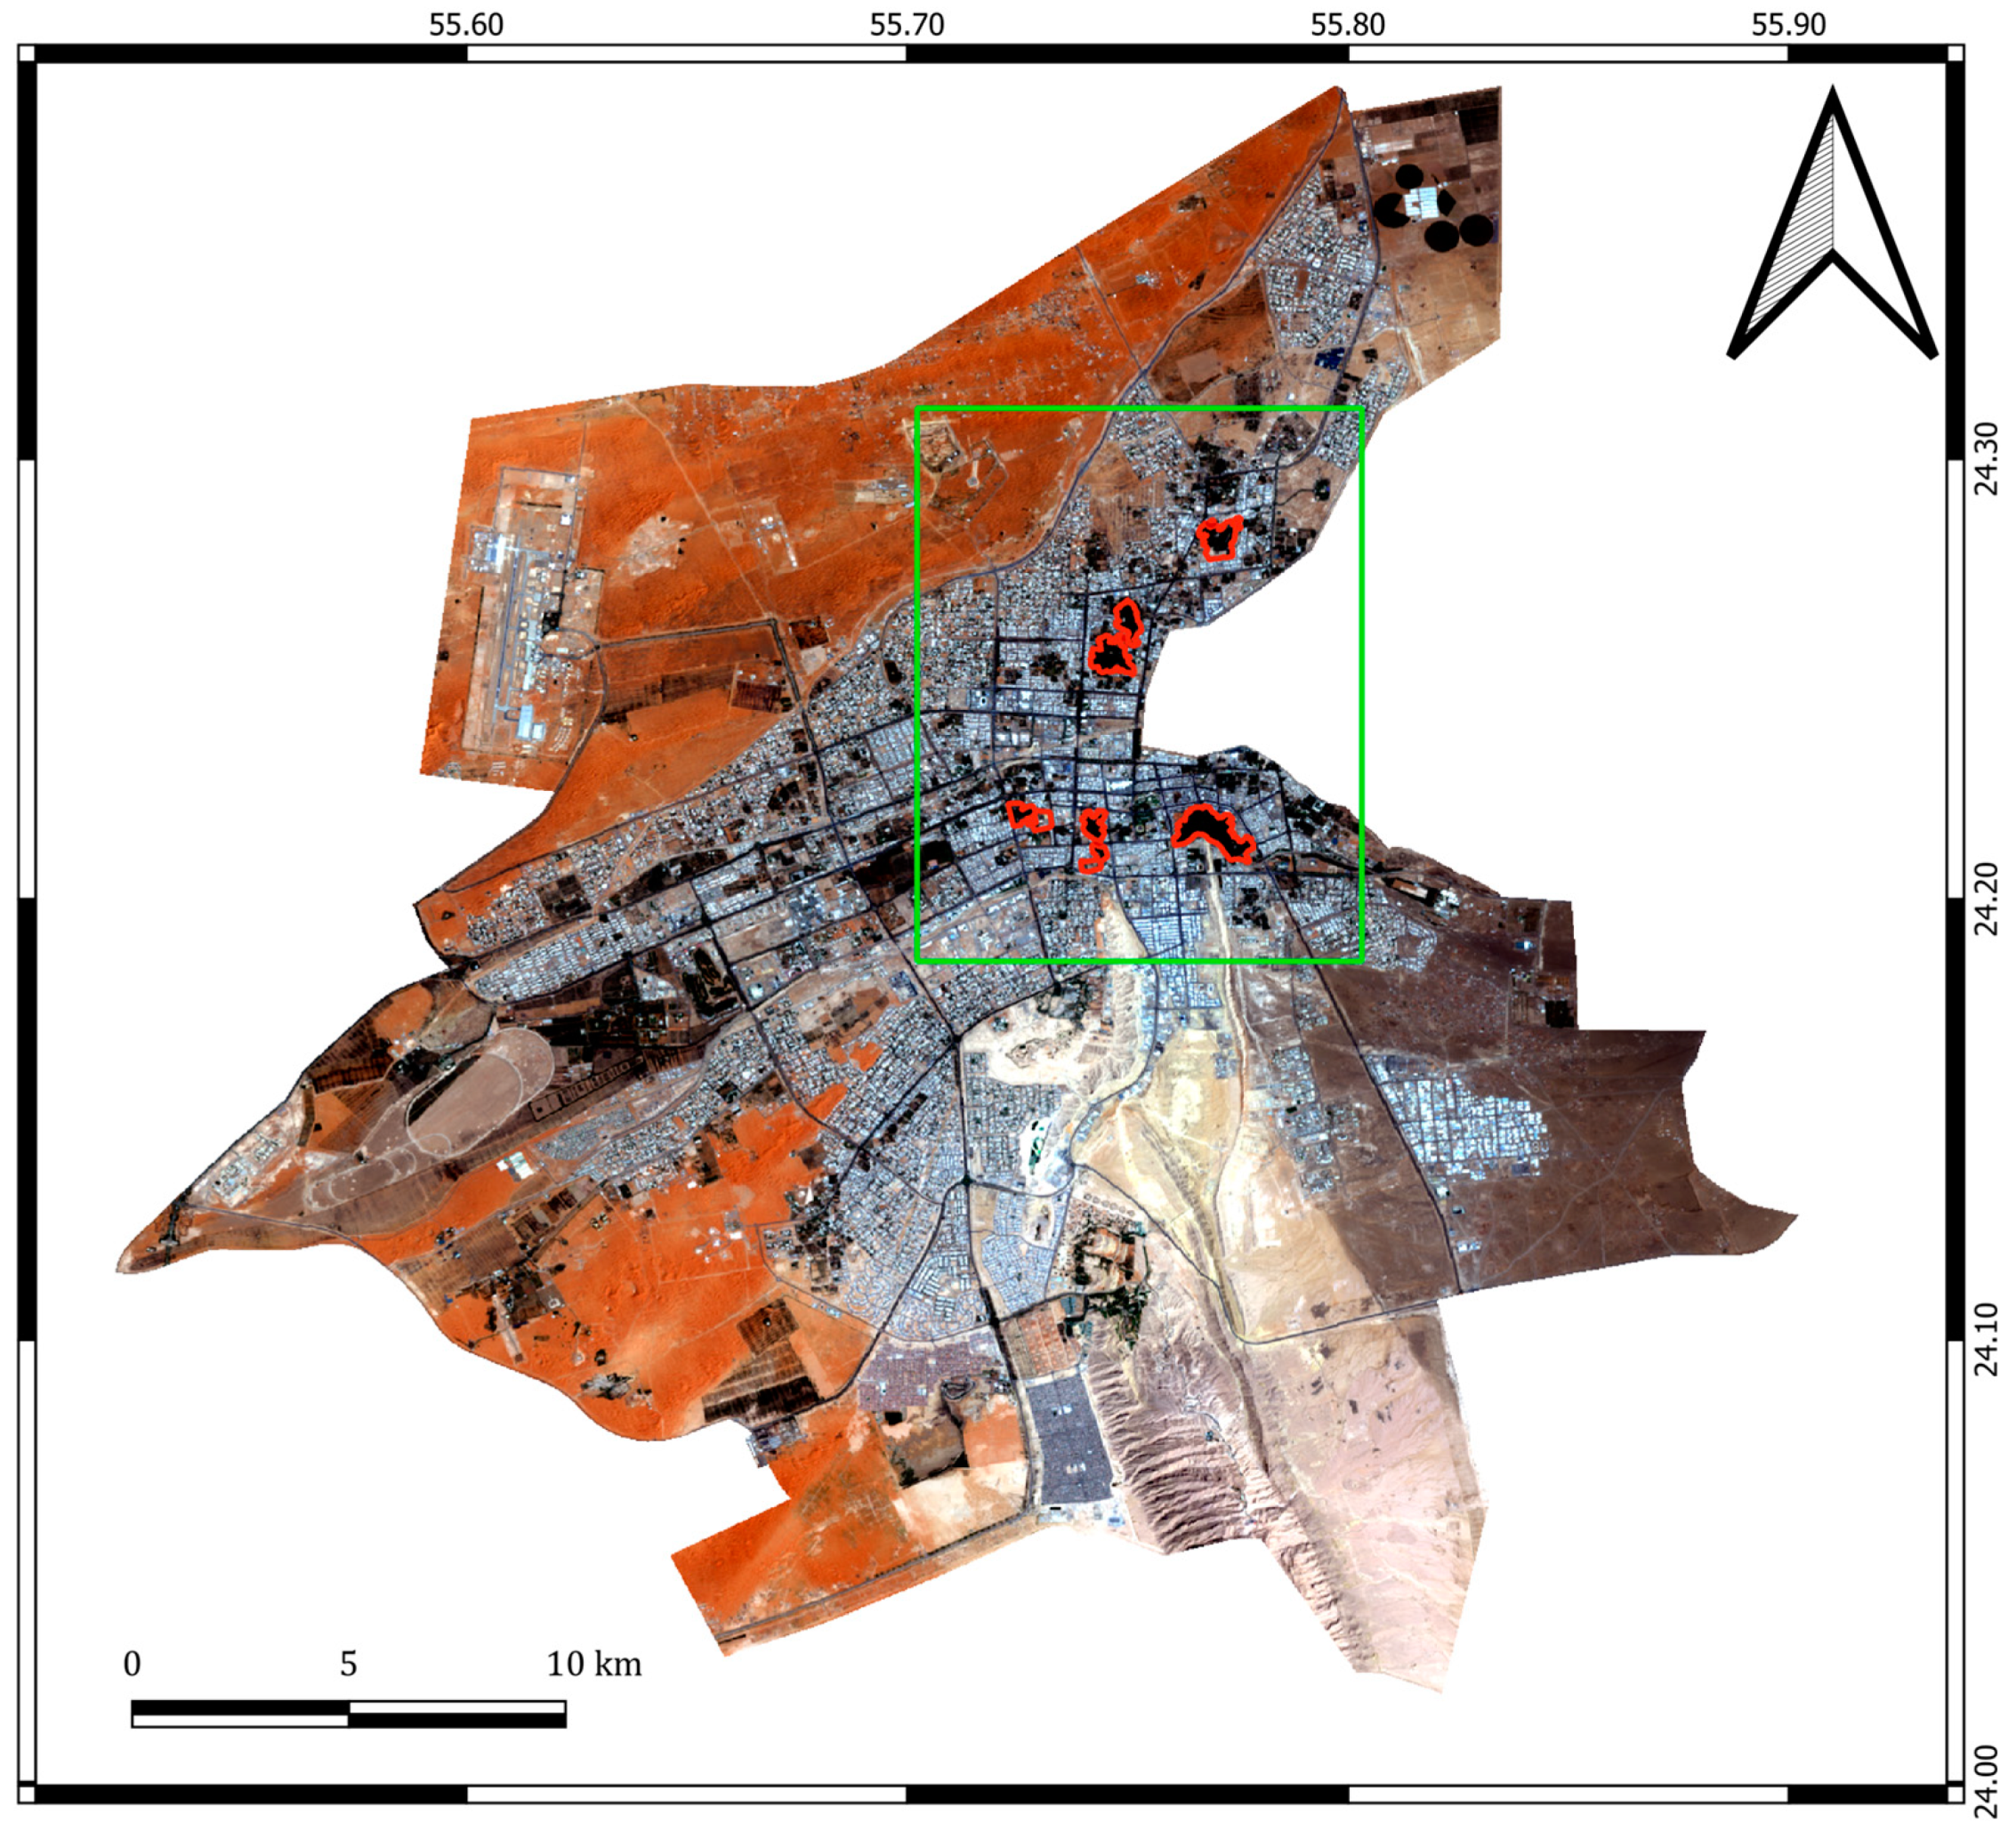
Figure 1. Locations of Al Ain oases (red polygons).
Land 12 01269 g001
Figure 2. Oases threatened by built-up areas [17].
Land 12 01269 g002
Figure 3. Methodology flow chart.
Land 12 01269 g003
Figure 4. LULC classification (1972) of the 1.5-kilometer buffer zone around the Al Ain oases.
Land 12 01269 g004
Figure 5. LULC classification (2022) of the 1.5-kilometer buffer zone around the Al Ain oases.
Land 12 01269 g005
Figure 6. LULC change from 1972 to 2022 in km2. (a) LULC change of Al Ain and (b) LULC change within the 1.5-kilometer buffer zone around the oases.
Land 12 01269 g006
Figure 7. Preservation of the oases (1972–2022).
Land 12 01269 g007
Figure 8. Time-series graph showing NDVI and NDWI variation over the Al Ain oases and desert (2019–2022).
Land 12 01269 g008
Figure 9. Time-series graph showing average NDVI and NDWI variation over a year.
Land 12 01269 g009
Figure 10. Average monthly rainfall (2013–2020) from four stations in Al Ain.
Land 12 01269 g010
Table 1. Keyword occurrence related to the use of remote sensing for oases preservation.
KeywordOccurrencesTotal Link Strength
Land use1232
Oases1639
Remote sensing3560
Water supply1333
Table 2. Datasets used in this study and their sources.
DataDateSourceFormat
Landsat images1972–2022USGS—Earth Explorer
https://earthexplorer.usgs.gov/
accessed on 10 January 2023.
Raster
DEM-USGS—Earth Explorer
https://earthexplorer.usgs.gov/
accessed on 15 January 2023
Raster
Sentinel 2A (NDVI & NDWI)2019–2022Google Earth EngineCSV
Historical Aerial photos1976Al Ain Town Planning DepartmentRaster
Rainfall data (2013–2020) National Centre of MetrologyExcel
Table 3. Pairwise comparison of the decision matrix.
Water Urban
Expansion
SoilPalm
Diseases
Legal
Framework
Total
Water 1876527
Urban expansion0.125187622.13
Soil0.1430.12518716.27
Palm diseases0.1670.1430.125189.44
Legal framework0.20.1670.1430.12511.64
Rank12345
Table 4. Priorities (weights) of factors/criteria.
FactorExpert 1Expert 2Expert 3Expert 4Expert 5Expert 6Expert 7Expert 8Expert 9Expert 10Geometric Mean
Priority
Water0.560.410.5840.6060.5680.4890.5440.410.5780.4450.51
Urban expansion0.120.250.2310.1930.2120.3470.2410.390.1940.1410.22
Soil0.230.220.090.1240.1360.0360.1340.0750.1370.3340.13
Palm diseases 0.050.090.0560.0470.0510.0830.0540.0850.0570.0480.06
Legal framework0.030.040.0380.030.0320.0450.0270.0340.0340.0320.03
CR (%)9.21.705.79.28.769.68.38.19.1
Table 5. Number of palm trees and water consumption by oases.
Oasis NameNº Palm TreesWater Consumption
(Gallon/Month)
Cycle of Irrigation
Al Ain76,16388,610,400Every 22 days
Al Mutaredh and Al Jahili15,00914,904,800Every 18 days
Al Muwaiji53514,627,680Every 15 days
Al Jimi24,18738,283,760Every 19 days
Al Qattara14,45726,702,160Every 18 days
Hili35,50013,502,980Every 20 days
Total170,667186,631,780
Source: Aflaj and Oases Section of Al Ain Municipality.
Table 6. Sample confusion matrix of LULC classification (2022) with Producer Accuracy (PA) and User Accuracy (UA).
2022Built-UpVegetationDate PalmBare SoilHighlandTotal
Built-up55010359
Vegetation34600049
Date Palm00490049
Bare Soil11251156
Highland00004949
Total5947525153262
PA0.920.920.980.940.98
UA0.90.880.940.931
OverallPA = 0.94 and Kappa = 0.91
Table 7. LULC changes around 1.5-kilometer oases buffer zone (areas in km2).
Class1972% 19722022% 2022% Change (1972–2022)
Palm2.85.056.5811.8857.45
Built-up2.44.3333.1359.8092.76
Desert46.583.944.598.29−914
Grass3.76.6811.120.0466.67
Total55.4 55.4
Disclaimer/Publisher’s Note: The statements, opinions and data contained in all publications are solely those of the individual author(s) and contributor(s) and not of MDPI and/or the editor(s). MDPI and/or the editor(s) disclaim responsibility for any injury to people or property resulting from any ideas, methods, instructions or products referred to in the content.