


Measures of Greenspace Exposure and Their Association to Health-Related Outcomes for the Periods before and during the 2020 Lockdown: A Cross-Sectional Study in the West of England
 , ,
, ,  ,
,
Abstract
1. Introduction
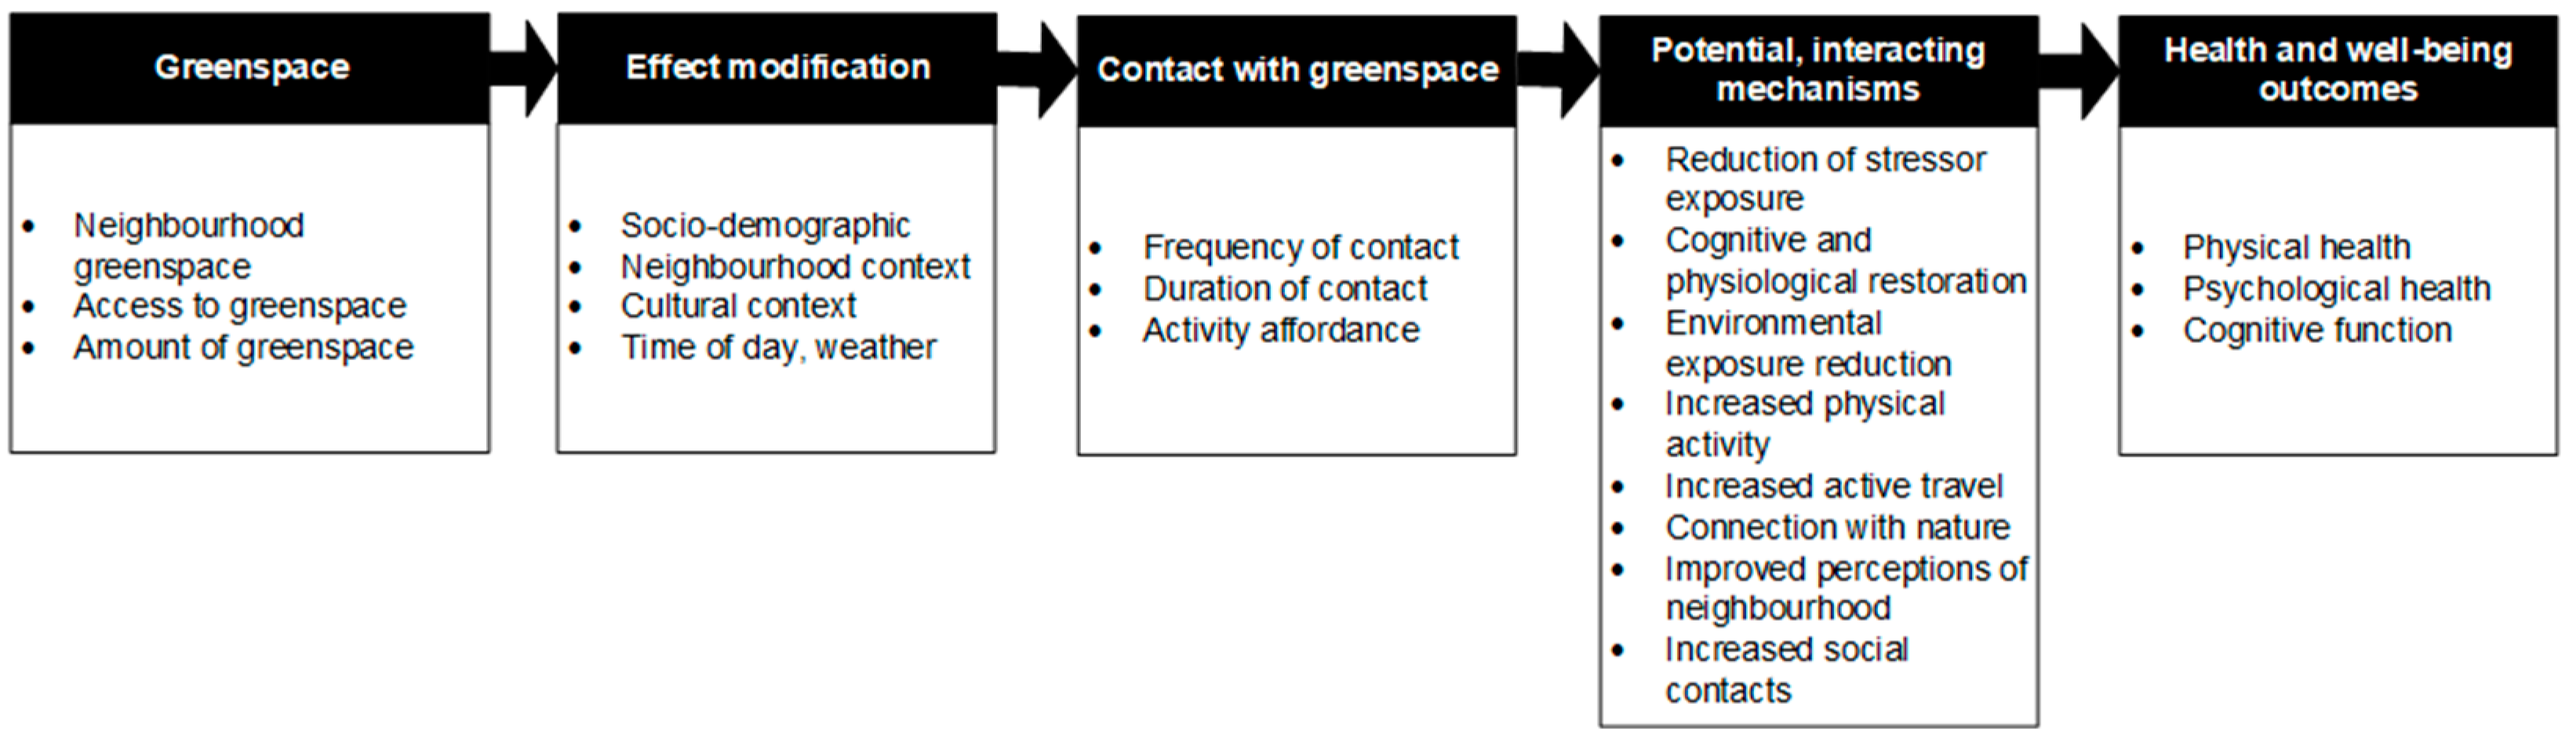
2. Measures of Greenspace Exposure
3. Materials and Methods
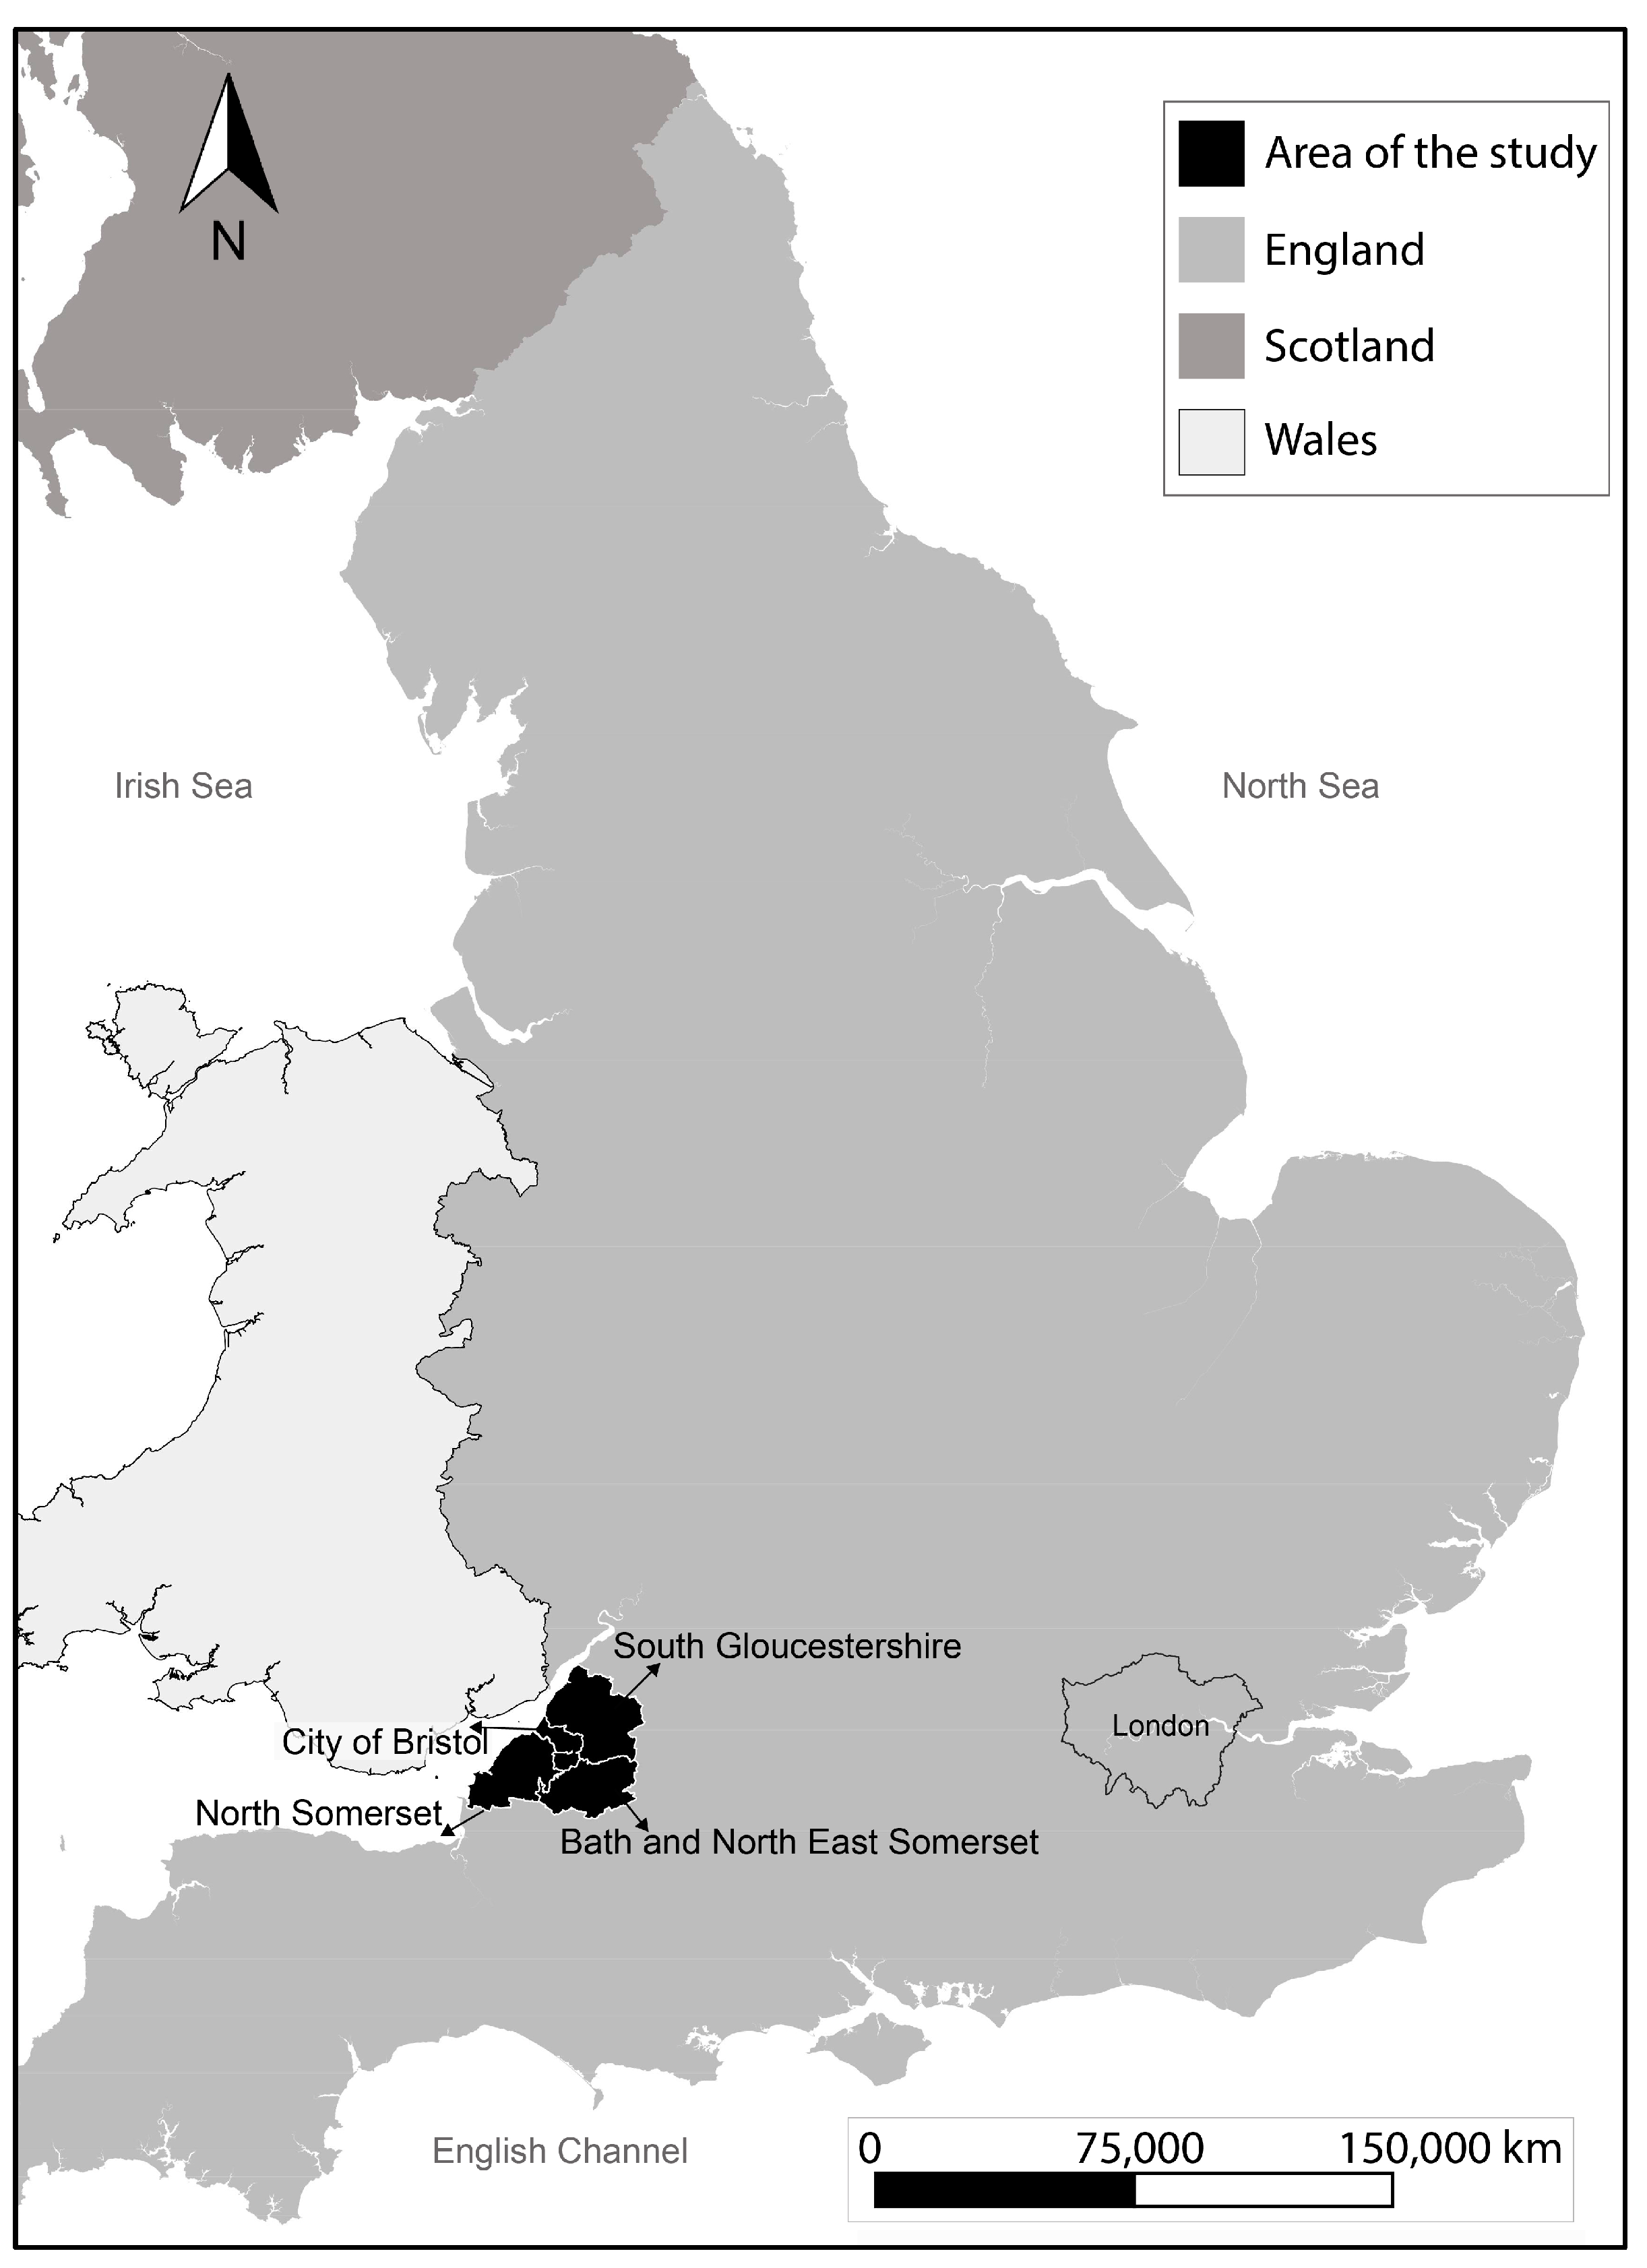
3.1. Study Design and Participants
3.2. Measures of Health-Related Behaviour and Wellbeing
3.3. Spatial Measures of Greenspace Exposure
- Network distance to nearest greenspace: Distance to the greenspace access point closest to the postcode centroid using the street network. This is calculated using network analysis in ArcGIS Pro 2.9.5 (shortest path—point-to-point), from Ordnance Survey Open Greenspace data [31] and street network data [32]. OS Open Greenspace includes polygons of greenspaces, including parks, playing fields, play areas, cemeteries, sport facilities, and allotments, and point data of access points to each space.
- Euclidean distance to nearest greenspace. Euclidean (i.e., straight line) distance to the greenspace access point closest to the postcode centroid.
- Euclidean distance to nearest greenspace of 0.5 ha, 2 ha, 10 ha, and 20 ha. As above, but focusing on the sizes of greenspace specific in Natural England’s Accessible Greenspace Standards (AGS) [33] which recommends that residents should be no more than 200 m away from a doorstep greenspace (0.5 ha), 300 m away from a local greenspace (2 ha), 1000 m away from a neighbourhood greenspace (10 ha), and 2000 m away from a wider neighbourhood greenspace (20 ha), all measured as straight-line Euclidean distances [33].
- Normalised Difference Vegetation Index (NDVI) within 500 m network distance: NDVI quantifies vegetation by computing the difference between near-infrared (NIR) which is reflected by vegetation and red light (RED) which is absorbed by vegetation, then dividing the outcome by their summation [34]. It results in a value between −1 and 1 for a defined area; the higher the value, the greener the space is. NDVI was calculated using ArcGIS Pro 2.9.5 using satellite images of Sentinel-2 [35]. NDVI within a network distance of 500 m from the postcode centroid was calculated as the NDVI of the polygon covering a service area of 500 m in the street network [32].
- NDVI within 200 m, 300 m, 1000 m, and 2000 m radius: NDVI of the catchment areas of different radial distances from the postcode centroid chosen to align with AGS.
3.4. Statistical Analysis
4. Results
Multivariate Analysis
5. Discussion
5.1. Measures of Greenspace Exposure
5.2. Efficacy of Different Measures of Greenspace Exposure
5.3. Limitations
6. Conclusions
Author Contributions
Funding
Data Availability Statement
Acknowledgments
Conflicts of Interest
References
- United Nations. Department of Economic and Social Affairs. 2018. Available online: http://www.un.org/disabilities%0Ahttps://sdgs.un.org/topics/forests%0Ahttps://esa.un.org/unpd/wup/publications/files/wup2014-highlights.Pdf (accessed on 27 February 2023).
- World Health Organisation. Environment and Health for European Cities in the 21st Century: Making a Difference; World Health Organization: Bristol, UK, 2017.
- Bray, I.; Reece, R.; Sinnett, D.; Martin, F.; Hayward, R. Exploring the role of exposure to green and blue spaces in preventing anxiety and depression among young people aged 14–24 years living in urban settings: A systematic review and conceptual framework. Environ. Res. 2022, 214, 114081. [Google Scholar] [CrossRef] [PubMed]
- Hunter, M.C.R.; Gillespie, B.W.; Chen, S.Y.P. Urban nature experiences reduce stress in the context of daily life based on salivary biomarkers. Front. Psychol. 2019, 10, 722. [Google Scholar] [CrossRef] [PubMed]
- Vanaken, G.J.; Danckaerts, M. Impact of green space exposure on children’s and adolescents’ mental health: A systematic review. Int. J. Environ. Res. Public Health 2018, 15, 2668. [Google Scholar] [CrossRef] [PubMed]
- Sillman, D.; Rigolon, A.; Browning, M.H.E.M.; Yoon, H.; McAnirlin, O. Do sex and gender modify the association between green space and physical health? A systematic review. Environ. Res. 2022, 209, 112869. [Google Scholar] [CrossRef]
- Liu, X.-X.; Ma, X.-L.; Huang, W.-Z.; Luo, Y.-N.; He, C.-J.; Zhong, X.-M.; Dadvand, P.; Browning, M.H.; Li, L.; Zou, X.-G.; et al. Green space and cardiovascular disease: A systematic review with meta-analysis. Environ. Pollut. 2022, 301, 118990. [Google Scholar] [CrossRef]
- Taylor, L.; Hochuli, D.F. Defining greenspace: Multiple uses across multiple disciplines. Landsc. Urban Plan. 2017, 158, 25–38. [Google Scholar] [CrossRef]
- Twohig-Bennett, C.; Jones, A. The health benefits of the great outdoors: A systematic review and meta-analysis of greenspace exposure and health outcomes. Environ. Res. 2018, 166, 628–637. [Google Scholar] [CrossRef]
- Public Health England. Improving Access to Greenspace: A New Review for 2020. London. 2020. Available online: https://assets.publishing.service.gov.uk/government/uploads/system/uploads/attachment_data/file/904439/Improving_access_to_greenspace_2020_review.pdf (accessed on 27 February 2023).
- Kondo, M.C.; Fluehr, J.M.; McKeon, T.; Branas, C.C. Urban green space and its impact on human health. Int. J. Environ. Res. Public Health 2018, 15, 445. [Google Scholar] [CrossRef]
- Bashir, M.F.; Ma, B.; Bilal Komal, B.; Bashir, M.A.; Tan, D.; Bashir, M. Correlation between climate indicators and COVID-19 pandemic in New York, USA. Sci. Total Environ. 2020, 728, 138835. [Google Scholar] [CrossRef]
- Cheval, S.; Adamescu, C.M.; Georgiadis, T.; Herrnegger, M.; Piticar, A.; Legates, D.R. Observed and potential impacts of the COVID-19 pandemic on the environment. Int. J. Environ. Res. Public Health 2020, 17, 4140. [Google Scholar] [CrossRef]
- Hidalgo-Triana, N.; Picornell, A.; Reyes, S.; Circella, G.; Ribeiro, H.; Bates, A.; Rojo, J.; Pearman, P.; Vivancos, J.A.; Nautiyal, S.; et al. Perceptions of change in the environment caused by the COVID-19 pandemic: Implications for environmental policy. Environ. Impact Assess. Rev. 2023, 99, 107013. [Google Scholar] [CrossRef] [PubMed]
- Schüle, S.A.; Nanninga, S.; Dreger, S.; Bolte, G. Relations between objective and perceived built environments and the modifying role of individual socioeconomic position. A cross-sectional study on traffic noise and urban green space in a Large German city. Int. J. Environ. Res. Public Health 2018, 15, 1562. [Google Scholar] [CrossRef] [PubMed]
- James, P.; Banay, R.F.; Hart, J.E.; Laden, F. A Review of the Health Benefits of Greenness. Curr. Epidemiol. Rep. 2015, 2, 218. [Google Scholar] [CrossRef]
- Markevych, I.; Tiesler, C.M.; Fuertes, E.; Romanos, M.; Dadvand, P.; Nieuwenhuijsen, M.J.; Berdel, D.; Koletzko, S.; Heinrich, J. Access to urban green spaces and behavioural problems in children: Results from the GINIplus and LISAplus studies. Environ. Int. 2014, 71, 29–35. [Google Scholar] [CrossRef]
- Klompmaker, J.O.; Hoek, G.; Bloemsma, L.D.; Gehring, U.; Strak, M.; Wijga, A.H.; van den Brink, C.; Brunekreef, B.; Lebret, E.; Janssen, N.A.H. Green space definition affects associations of green space with overweight and physical activity. Environ. Res. 2018, 160, 531–540. [Google Scholar] [CrossRef] [PubMed]
- McMorris, O.; Villeneuve, P.J.; Su, J.; Jerrett, M. Urban greenness and physical activity in a national survey of Canadians. Environ. Res. 2015, 137, 94–100. [Google Scholar] [CrossRef] [PubMed]
- Maas, J.; Verheij, R.A.; Spreeuwenberg, P.; Groenewegen, P.P. Physical activity as a possible mechanism behind the relationship between green space and health: A multilevel analysis. BMC Public Health 2008, 8, 206. [Google Scholar] [CrossRef]
- Callaghan, A.; McCombe, G.; Harrold, A.; McMeel, C.; Mills, G.; Moore-Cherry, N.; Cullen, W. The impact of green spaces on mental health in urban settings: A scoping review. J. Ment. Health 2021, 30, 179–193. [Google Scholar] [CrossRef]
- Office for National Statistics (ONS). Open Geography Portal [GeoPackage], Open Government Licence v.3.0. 2022. Available online: https://geoportal.statistics.gov.uk/datasets/a8af85749dc641ff9457d1e8bc58f83b_0/explore?location=52.749569%2C-1.560181%2C6.51 (accessed on 13 March 2023).
- Nieuwenhuijsen, M.J.; Khreis, H.; Triguero-Mas, M.; Gascon, M.; Dadvand, P. Fifty shades of green. Epidemiology 2017, 28, 63–71. [Google Scholar] [CrossRef]
- Chu, A.H.Y.; Ng, S.H.X.; Koh, D.; Müller-Riemenschneider, F.; Brucki, S. Reliability and validity of the self- and interviewer-administered versions of the Global Physical Activity Questionnaire (GPAQ). PLoS ONE 2015, 10, e0136944. [Google Scholar] [CrossRef]
- Hunt, A.; Stewart, D.; Richardson, M.; Hinds, J.; Bragg, R.; White, M.; Burt, J. Monitor of Engagement with the Natural Environment: Developing a Method to Measure Nature Connection across the English Population (Adults and Children). 2017. Available online: http://publications.naturalengland.org.uk/publication/5337609808642048 (accessed on 27 February 2023).
- Richardson, M.; Hunt, A.; Hinds, J.; Bragg, R.; Fido, D.; Petronzi, D.; Barbett, L.; Clitherow, T.; White, M. A measure of nature connectedness for children and adults: Validation, performance, and insights. Sustainability 2019, 11, 3250. [Google Scholar] [CrossRef]
- Fleury-Bahi, G.; Galharret, J.; Lemée, C.; Wittenberg, I.; Olivos, P.; Loureiro, A.; Jeuken, Y.; Laïlle, P.; Navarro, O. Nature and well-being in seven European cities: The moderating effect of connectedness to nature. Appl. Psychol. Health Well-Being, 2022; Early View. [Google Scholar] [CrossRef] [PubMed]
- Al-Janabi, H.; Flynn, T.N.; Coast, J. Development of a self-report measure of capability wellbeing for adults: The ICECAP-A. Qual. Life Res. 2012, 21, 167–176. [Google Scholar] [CrossRef] [PubMed]
- Flynn, T.N.; Huynh, E.; Peters, T.J.; Al-Janabi, H.; Clemens, S.; Moody, A.; Coast, J. Scoring the Icecap-a capability instrument. Estimation of a UK general population tariff. Health Economics. Health Econ. 2015, 23, 258–269. [Google Scholar] [CrossRef] [PubMed]
- Ordnance Survey. Code-Point Open [GeoPackage], 1:1250 to 1:10,000. 2022. Available online: https://beta.ordnancesurvey.co.uk/products/code-point-open#overview (accessed on 27 February 2023).
- Ordnance Survey. OS Open Greenspace [ESRI Shapefile], 1:1250 to 1:10,000. 2021a. Available online: https://beta.ordnancesurvey.co.uk/products/os-open-greenspace#get (accessed on 27 February 2023).
- Ordnance Survey. OS Open Roads [GeoPackage], 1:1250 to 1:10,000. 2021b. Available online: https://osdatahub.os.uk/downloads/open/OpenRoads (accessed on 27 February 2023).
- Natural England. Green Infrastructure Standards for England. 2023. Available online: https://designatedsites.naturalengland.org.uk/GreenInfrastructure/downloads/Green Infrastructure Standards for England Summary v1.1.pdf (accessed on 27 February 2023).
- Gandhi, G.M.; Parthiban, S.; Thummalu, N.; Christy, A. Ndvi: Vegetation Change Detection Using Remote Sensing and Gis—A Case Study of Vellore District. Procedia Comput. Sci. 2015, 57, 1199–1210. [Google Scholar] [CrossRef]
- Copernicus Sentinel 2 Colour Infrared (Bands 843) [TIFF Geospatial Data], Scale 1:20000, Tiles: Sr,ss,st,su,sv,sw,sx,sy,sz. Updated: 11 February 2020, to Be Added, Using: EDINA Pilot Digimap Service. Available online: https://digimap.edina.ac.uk (accessed on 24 February 2023).
- Coombes, E.; Jones, A.P.; Hillsdon, M. The relationship of physical activity and overweight to objectively measured green space accessibility and use. Soc. Sci. Med. 2010, 70, 816–822. [Google Scholar] [CrossRef]
- Nutsford, D.; Pearson, A.L.; Kingham, S. An ecological study investigating the association between access to urban green space and mental health. Public Health 2013, 127, 1005–1011. [Google Scholar] [CrossRef]
- Robinson, J.M.; Brindley, P.; Cameron, R.; Maccarthy, D.; Jorgensen, A. Nature’s role in supporting health during the COVID-19 pandemic: A geospatial and socioecological study. Int. J. Environ. Res. Public Health 2021, 18, 2227. [Google Scholar] [CrossRef]
- Reid, C.E.; Rieves, E.S.; Carlson, K. Perceptions of green space usage, abundance, and quality of green space were associated with better mental health during the COVID-19 pandemic among residents of Denver. PLoS ONE 2022, 17, e0263779. [Google Scholar] [CrossRef]
- Li, H.; Browning, M.H.E.M.; Dzhambov, A.M.; Zhang, G.; Cao, Y. Green Space for Mental Health in the COVID-19 Era: A Pathway Analysis in Residential Green Space Users. Land 2022, 11, 1128. [Google Scholar] [CrossRef]
- Institute for Government Analysis. Timeline of UK Lockdowns, March 2020 to March 2021. Institute for Government Analysis. 2021. Available online: https://www.instituteforgovernment.org.uk/sites/default/files/timeline-lockdown-web.pdf (accessed on 13 March 2023).
- Büssing, A.; Rodrigues Recchia, D.; Hein, R.; Dienberg, T. Perceived changes of specific attitudes, perceptions and behaviors during the Corona pandemic and their relation to wellbeing. Health Qual. Life Outcomes 2020, 18, 374. [Google Scholar] [CrossRef] [PubMed]
- Houlden, V.; Weich, S.; de Albuquerque, J.P.; Jarvis, S.; Rees, K. The relationship between greenspace and the mental wellbeing of adults: A systematic review. PLoS ONE 2018, 13, e0203000. [Google Scholar] [CrossRef] [PubMed]
- Colombo, D.; Suso-Ribera, C.; Fernández-Álvarez, J.; Cipresso, P.; Garcia-Palacios, A.; Riva, G.; Botella, C. Affect Recall Bias: Being Resilient by Distorting Reality. Cogn. Ther. Res. 2020, 44, 906–918. [Google Scholar] [CrossRef]
- Sember, V.; Meh, K.; Sorić, M.; Jurak, G.; Starc, G.; Rocha, P. Validity and reliability of international physical activity questionnaires for adults across eu countries: Systematic review and meta analysis. Int. J. Environ. Res. Public Health 2020, 17, 7161. [Google Scholar] [CrossRef] [PubMed]
- Roe, J.; Aspinall, P.A.; Thompson, C.W. Understanding relationships between health, ethnicity, place and the role of urban green space in deprived urban communities. Int. J. Environ. Res. Public Health 2016, 13, 681. [Google Scholar] [CrossRef]


| Characteristics | Category | N (%) |
|---|---|---|
| Sex | Female | 383 (62) |
| Male | 224 (36) | |
| Prefer not to say | 10 (2) | |
| Age in years | 18–24 | 16 (3) |
| 25–34 | 64 (10) | |
| 35–44 | 109 (18) | |
| 45–54 | 103 (17) | |
| 55–64 | 141 (23) | |
| 65–74 | 142 (23) | |
| 75–84 | 33 (5) | |
| Prefer not to say | 9 (1) | |
| Ethnicity | White | 578 (94) |
| Mixed | 13 (2) | |
| Other | 12 (2) | |
| Black/African/Caribbean | 10 (2) | |
| Asian | 4 (0) | |
| Education | Degree or Higher | 450 (73) |
| GCSE only | 85 (14) | |
| A-levels or equivalent | 68 (11) | |
| No qualifications | 14 (2) | |
| Housing tenure | Owner-occupied | 522 (85) |
| Rented | 63 (10) | |
| Socially Rented | 30 (5) | |
| Other | 2 (0) | |
| Car ownership | No | 90 (15) |
| Yes | 524 (85) | |
| Dog ownership | No | 490 (79) |
| Yes | 127 (21) | |
| Private/shared outdoor space | No | 33 (5) |
| Yes | 584 (95) | |
| Having children | No | 452 (73) |
| Yes | 165 (27) | |
| Having limiting long-term illness | No | 489 (79) |
| Yes | 127 (21) | |
| Employment | Employed | 376 (61) |
| Retired | 142 (23) | |
| Other | 68 (11) | |
| Unemployed | 19 (3) | |
| Student | 11 (2) |
| Greenspace Exposure Measure | Mean (SD) |
|---|---|
| NDVI within 200 M Radius | 0.46 (0.11) |
| NDVI within 300 M Radius | 0.47 (0.11) |
| NDVI within 1000 M Radius | 0.49 (0.10) |
| NDVI within 2000 M Radius | 0.51 (0.09) |
| NDVI within 500 M Network | 0.45 (0.1) |
| Network distance (m) to nearest greenspace access | 333 (213) |
| Euclidean distance (m) to nearest greenspace access | 190 (125) |
| Euclidean distance (m) to nearest 0.5 ha doorstep greenspace access | 275 (195) |
| Euclidean distance (m) to nearest 2 ha local greenspace access | 374 (270) |
| Euclidean distance (m) to nearest 10 ha neighbourhood greenspace access | 774 (659) |
| Euclidean distance (m) to nearest 20 ha wider neighbourhood greenspace access | 1100 (870) |
| Health Outcome | Mean (SD) | |
|---|---|---|
| Before Lockdown | During Lockdown | |
| Visits to greenspaces (month) | 21 (17) | 29 (19) |
| Physical activity (minutes/week) | 794 (862) | 885 (1165) |
| Icecap score | 0.87 (0.12) | 0.73 (0.19) |
| Connectedness to nature score | 74 (22) | 2.52 (2.34) 1 |
| Measure of Exposure to Greenspace | Health-Related Outcome | |||||||
|---|---|---|---|---|---|---|---|---|
| Visits to Greenspaces/Month | Physical Activity in Minutes | ICECAP Score | Connectedness to Nature 1 | |||||
| Before Lockdown | During Lockdown | Before Lockdown | During Lockdown | Before Lockdown | During Lockdown | Before Lockdown | During Lockdown | |
| Overall Fit | Overall Fit | Overall Fit | Overall Fit | Overall Fit | Overall Fit | Overall Fit | Overall Fit | |
| R2 | R2 | R2 | R2 | R2 | R2 | R2 | R2 | |
| Adjust R2 | Adjust R2 | Adjust R2 | Adjust R2 | Adjust R2 | Adjust R2 | Adjust R2 | Adjust R2 | |
| NDVI radius 200 m (Euclidean) | <0.001 *** | <0.001 *** | 0.071 | 0.592 | <0.001 *** | <0.001 *** | 0.002 ** | 0.056 |
| 0.168 | 0.125 | 0.071 | 0.047 | 0.137 | 0.154 | 0.091 | 0.071 | |
| 0.122 | 0.074 | 0.021 | −0.004 | 0.092 | 0.110 | 0.044 | 0.022 | |
| NDVI radius 300 m (Euclidean) | <0.001 *** | <0.001 *** | 0.071 | 0.592 | <0.001 *** | <0.001 *** | 0.002 ** | 0.072 |
| 0.168 | 0.129 | 0.071 | 0.047 | 0.136 | 0.154 | 0.092 | 0.069 | |
| 0.122 | 0.079 | 0.021 | −0.004 | 0.091 | 0.109 | 0.045 | 0.020 | |
| NDVI radius 1000 m (Euclidean) | <0.001 *** | <0.001 *** | 0.048 * | 0.587 | <0.001 *** | <0.001 *** | 0.003 ** | 0.098 |
| 0.169 | 0.117 | 0.074 | 0.047 | 0.136 | 0.154 | 0.09 | 0.066 | |
| 0.123 | 0.066 | 0.024 | −0.004 | 0.090 | 0.109 | 0.043 | 0.018 | |
| NDVI radius 2000 m (Euclidean) | <0.001 *** | <0.001 *** | 0.041 * | 0.577 | <0.001 | <0.001 *** | 0.003 ** | 0.090 |
| 0.17 | 0.116 | 0.075 | 0.048 | 0.136 | 0.154 | 0.089 | 0.067 | |
| 0.124 | 0.065 | 0.026 | −0.004 | 0.090 | 0.109 | 0.042 | 0.018 | |
| NDVI radius 500 m (Network) | <0.001 *** | <0.001 *** | 0.074 | 0.592 | <0.001 *** | <0.001 *** | 0.002 ** | 0.078 |
| 0.168 | 0.12 | 0.070 | 0.047 | 0.138 | 0.156 | 0.091 | 0.068 | |
| 0.122 | 0.069 | 0.021 | −0.004 | 0.092 | 0.111 | 0.044 | 0.020 | |
| Network Distance (m) to nearest greenspace access 2 | <0.001 *** | <0.001 *** | 0.286 | 0.770 | <0.001 *** | <0.001 *** | 0.003 ** | 0.100 |
| 0.208 | 0.157 | 0.074 | 0.055 | 0.145 | 0.167 | 0.111 | 0.085 | |
| 0.149 | 0.091 | 0.008 | −0.012 | 0.084 | 0.107 | 0.049 | 0.020 | |
| Euclidean Distance (m) to nearest greenspace access 2 | <0.001 *** | <0.001 *** | 0.276 | 0.777 | <0.001 *** | <0.001 *** | 0.002 ** | 0.099 |
| 0.207 | 0.153 | 0.074 | 0.055 | 0.146 | 0.166 | 0.112 | 0.085 | |
| 0.148 | 0.087 | 0.008 | −0.012 | 0.085 | 0.106 | 0.049 | 0.020 | |
| Euclidean Distance (m) to nearest 0.5 ha doorstep greenspace access 2 | <0.001 *** | <0.001 *** | 0.281 | 0.734 | <0.001 *** | <0.001 *** | 0.002 ** | 0.099 |
| 0.207 | 0.160 | 0.074 | 0.057 | 0.146 | 0.164 | 0.114 | 0.085 | |
| 0.148 | 0.094 | 0.008 | −0.010 | 0.084 | 0.104 | 0.051 | 0.020 | |
| Euclidean Distance (m) to nearest 2 ha local greenspace access 2 | <0.001 *** | <0.001 *** | 0.291 | 0.697 | <0.001 *** | <0.001 *** | <0.001 *** | 0.100 |
| 0.198 | 0.153 | 0.073 | 0.058 | 0.145 | 0.163 | 0.163 | 0.085 | |
| 0.138 | 0.087 | 0.008 | −0.009 | 0.084 | 0.103 | 0.103 | 0.020 | |
| Euclidean Distance (m) to nearest 10 ha neighbourhood greenspace access 2 | <0.001 *** | <0.001 *** | 0.272 | 0.393 | <0.001 *** | <0.001 *** | 0.003 ** | 0.079 |
| 0.197 | 0.153 | 0.074 | 0.069 | 0.145 | 0.164 | 0.089 | 0.087 | |
| 0.137 | 0.087 | 0.009 | 0.003 | 0.084 | 0.104 | 0.042 | 0.022 | |
| Euclidean Distance (m) to nearest 20 ha wider neighbourhood greenspace access 2 | <0.001 *** | <0.001 *** | 0.291 | 0.653 | <0.001 *** | <0.001 *** | <0.001 *** | 0.086 |
| 0.197 | 0.153 | 0.077 | 0.060 | 0.145 | 0.165 | 0.065 | 0.086 | |
| 0.137 | 0.087 | 0.012 | −0.007 | 0.084 | 0.105 | 0.017 | 0.022 | |
| Measure of Exposure to Greenspace | Health-Related Outcome | |||||||
|---|---|---|---|---|---|---|---|---|
| Visits to Greenspaces/Month | Physical Activity in Minutes | ICECAP Score | Connectedness to Nature 1 | |||||
| Before Lockdown | During Lockdown | Before Lockdown | During Lockdown | Before Lockdown | During Lockdown | Before Lockdown | During Lockdown | |
| Β | Β | Β | Β | Β | Β | Β | Β | |
| (SE), | (SE), | (SE), | (SE), | (SE), | (SE), | (SE), | (SE), | |
| p-Value | p-Value | p-Value | p-Value | p-Value | p-Value | p-Value | p-Value | |
| NDVI radius 200 m (Euclidean) | 5.5 | 18 | −231 | 13 | 0.046 | 0.05 | 13.5 | 1.57 |
| (6.07) | (6.83) | (328) | (433) | (0.043) | (0.065) | (7.9) | (0.84) | |
| 0.37 | 0.009 *** | 0.48 | 0.98 | 0.284 | 0.442 | 0.088 * | 0.063 * | |
| NDVI radius 300 m (Euclidean) | 4.75 | 21.5 | −238 | 38.5 | 0.033 | 0.038 | 14.2 | 1.28 |
| (6.20) | (6.95) | (335) | (442) | (0.044) | (0.066) | (8.06) | (0.86) | |
| 0.44 | 0.002 *** | 0.48 | 0.931 | 0.45 | 0.57 | 0.079 * | 0.14 | |
| NDVI radius 1000 m (Euclidean) | 11.6 | 0.006 | −570 | −155 | −7.91 | 0.028 | 12.4 | 0.79 |
| (7.74) | (0.048) | (369) | (487) | (6.80) | (0.073) | (8.92) | (0.95) | |
| 0.134 | 0.909 | 0.12 | 0.75 | 0.25 | 0.70 | 0.17 | 0.41 | |
| NDVI radius 2000 m (Euclidean) | −11.2 | 11.9 | −751 | 290 | −0.002 | 0.033 | 13.1 | 1.14 |
| (7.78) | (8.87) | (423) | (558) | (0.055) | (0.083) | (10.2) | (1.08) | |
| 0.15 | 0.18 | 0.076 | 0.60 | 0.97 | 0.70 | 0.20 | 0.30 | |
| NDVI radius 500 m (Network) | 5.03 | 16.13 | −204 | −14.6 | 0.060 | 0.096 | 15.5 | 1.36 |
| (7.16) | (8.06) | (387) | (511) | (0.051) | (0.076) | (9.31) | (0.990) | |
| 0.48 | 0.046 ** | 0.60 | 0.977 | 0.233 | 0.21 | 0.097 | 0.17 | |
| Network Distance (m) to nearest greenspace access 2 | −6.857 | −5.813 | −49.7 | 124 | 0.005 | 0.041 | 3.422 | −0.047 |
| (2.508) | (2.873) | (139.5) | (182.411) | (0.018) | (0.027) | (3.302) | (0.354) | |
| 0.006 ** | 0.044 | 0.72 | 0.497 | 0.781 | 0.132 | 0.301 | 0.895 | |
| Euclidean Distance (m) to nearest greenspace access 2 | −6.538 | −3.647 | −88.4 | 98.68 | −0.016 | 0.035 | 3.945 | 0.101 |
| (2.471) | (2.843) | (138.2) | (181.65) | (0.018) | (0.027) | (0.007) | (0.352) | |
| 0.008 ** | 0.200 | 0.525 | 0.587 | 0.387 | 0.200 | 0.230 | 0.774 | |
| Euclidean Distance (m) to nearest 0.5 ha doorstep greenspace access 2 | −2.591 | −7.732 | 27.42 | 82.568 | −0.005 | 0.007 | 2.095 | 0.00 |
| (0.974) | (1.122) | (54.6) | (71.75) | (0.007) | (0.011) | (1.294) | (0.00) | |
| 0.008 ** | 0.015 ** | 0.616 | 0.250 | 0.462 | 0.530 | 0.100 * | 0.81 | |
| Euclidean Distance (m) to nearest 2 ha local greenspace access 2 | −4.896 | −4.138 | −3.199 | 229 | −0.005 | 0.001 | 0.001 | −0.039 |
| (2.136) | (2.440) | (118.53) | (155.182) | (0.015) | (0.023) | (0.023) | (0.302) | |
| 0.022 * | 0.091 | 0.978 | 0.140 | 0.75 | 0.954 | 0.954 | 0.897 | |
| Euclidean Distance (m) to nearest 10 ha neighbourhood greenspace access 2 | −1.714 | −2.643 | −74.53 | 402.58 | 0.007 | 0.017 | 0.017 | −0.313 |
| (1.911) | (2.147) | (104.095) | (135.82) | (0.014) | (0.020) | (0.020) | (0.265) | |
| 0.370 | 0.219 | 0.474 | 0.003 | 0.600 | 0.414 | 0.414 | 0.238 | |
| Euclidean Distance (m) to nearest 20 ha wider neighbourhood greenspace access 2 | −0.059 | −3.171 | −170.915 | 275.24 | 0.009 | 0.027 | 0.027 | −0.288 |
| (2.163) | (2.430) | (117.911) | (155.295) | (0.015) | (0.023) | (0.231) | (0.302) | |
| 0.978 | 0.192 | 0.148 | 0.077 | 0.551 | 0.242 | 0.242 | 0.340 | |
| Physical Activity in Minutes | ICECAP Score | Connectedness to Nature 1 | ||||
|---|---|---|---|---|---|---|
| Before Lockdown | During Lockdown | Before Lockdown | During Lockdown | Before Lockdown | During Lockdown | |
| Β | Β | Β | Β | Β | Β | |
| (SE), | (SE), | (SE), | (SE), | (SE), | (SE), | |
| p-Value | p-Value | p-Value | p-Value | p-Value | p-Value | |
| Visits to greenspace | 5.41 | 14.6 | 0.0 | 0.0 | 0.155 | 0.12 |
| 2.26 | 2.76 | 0.0 | 0.0 | 0.057 | 0.005 | |
| 0.017 * | <0.001 *** | 0.164 | 0.78 | 0.007 ** | 0.026 * | |
Disclaimer/Publisher’s Note: The statements, opinions and data contained in all publications are solely those of the individual author(s) and contributor(s) and not of MDPI and/or the editor(s). MDPI and/or the editor(s) disclaim responsibility for any injury to people or property resulting from any ideas, methods, instructions or products referred to in the content. |
© 2023 by the authors. Licensee MDPI, Basel, Switzerland. This article is an open access article distributed under the terms and conditions of the Creative Commons Attribution (CC BY) license (https://creativecommons.org/licenses/by/4.0/).
Share and Cite
Fouad, A.T.Z.; Sinnett, D.; Bray, I.; McClatchey, R.; Reece, R. Measures of Greenspace Exposure and Their Association to Health-Related Outcomes for the Periods before and during the 2020 Lockdown: A Cross-Sectional Study in the West of England. Land 2023, 12, 728. https://doi.org/10.3390/land12040728
Fouad ATZ, Sinnett D, Bray I, McClatchey R, Reece R. Measures of Greenspace Exposure and Their Association to Health-Related Outcomes for the Periods before and during the 2020 Lockdown: A Cross-Sectional Study in the West of England. Land. 2023; 12(4):728. https://doi.org/10.3390/land12040728
Chicago/Turabian StyleFouad, Ahmed Tarek Zaky, Danielle Sinnett, Isabelle Bray, Rachael McClatchey, and Rebecca Reece. 2023. "Measures of Greenspace Exposure and Their Association to Health-Related Outcomes for the Periods before and during the 2020 Lockdown: A Cross-Sectional Study in the West of England" Land 12, no. 4: 728. https://doi.org/10.3390/land12040728
APA StyleFouad, A. T. Z., Sinnett, D., Bray, I., McClatchey, R., & Reece, R. (2023). Measures of Greenspace Exposure and Their Association to Health-Related Outcomes for the Periods before and during the 2020 Lockdown: A Cross-Sectional Study in the West of England. Land, 12(4), 728. https://doi.org/10.3390/land12040728