Article

Exploring the Form of a Smart City District: A Morphometric Comparison with Examples of Previous Design Models

by
Alessandro Venerandi
1,2,*,
Giovanni Fusco
1 and
Matteo Caglioni
1
1
Université Côte d’Azur, CNRS, AMU, AU, ESPACE, 06200 Nice, France
2
Urban Design Studies Unit (UDSU), Department of Architecture, University of Strathclyde, Glasgow G1 1XJ, UK
*
Author to whom correspondence should be addressed.
Land 2023, 12(12), 2159; https://doi.org/10.3390/land12122159
Submission received: 31 October 2023 / Revised: 8 December 2023 / Accepted: 11 December 2023 / Published: 13 December 2023
(This article belongs to the Special Issue Urban Morphology: A Perspective from Space)

Abstract

:
In key moments of urban history, urban design is confronted with the emergence of new paradigmatic design models, such as the garden city and the radiant city. Recently, the Smart City seems to have gained centre stage in the public debate. However, despite its emblazoned technological features, the Smart City remains a hazy concept in the urban design domain to such an extent that almost any form can be built under the Smart City label. While this may sound libertarian and progressist, it is also concerning since different urban forms are associated with different societal outcomes. This paper aims to investigate the forms of Smart City districts through morphometric comparison. More specifically, it proposes a replicable methodology based on 18 metrics of urban form and statistical analysis to compare a Smart City district with other city areas with known design models of reference. Such a methodology is applied to three case studies on the French Riviera: Méridia, a Smart City district, Hôtel-des-Postes, a 19th-century traditional district, and Sophia Antipolis, a sprawling technopark. The results show that Méridia has a hybrid form that partly resembles Hôtel-des-Postes (higher densities, gridiron plan, and functional mix) and partly Sophia Antipolis (bulky buildings with large setbacks). However, the top–down approach used in the production of the physical space ultimately renders Méridia more similar to Sophia Antipolis than Hôtel-des-Postes. This study provides one of the first morphometric characterisations of a Smart City district, but also a replicable methodology that can further the morphological understanding of the Smart City phenomenon worldwide.

1. Introduction

Urban design has been encouraged to propose new design models at critical moments in history; its very origin as a profession and academic discipline stems from the accelerated growth of European cities as a result of the industrial revolution of the 19th century. Previous concepts (e.g., Renaissance and classical arts) were rationalised and proposed at a new scale, producing iconic urban models like the Cerdà plan of regular blocks for Barcelona, integrating the new technologies of the streetcar and railway [1]. This first paradigmatic model was soon rivalled by more radical alternatives, such as the Garden City [2], which was based on a polycentric system of self-sufficient towns developed around a civic centre featuring concentric public spaces, winding streets with trees, detached homes of vernacular types with back gardens, an outer ring of factories and farms served by railway lines and a green belt. In the turmoil between the two World Wars, Le Corbusier [3] proposed the Radiant City, an urban model featuring a loose grid of major motorways, superblocks interspersed with public greenery, linear buildings made of prefabricated structures of reinforced concrete, freestanding towers on pilotis and functional segregation. One decade later, Wright [4] proposed Broadacre City, a car-oriented suburban model largely made of individual homes freely positioned in lots of one acre. Like the Radiant City, a network of motorways connected this low-density urban fabric, but in this model, most open space was private, and high-rise buildings were rare exceptions. Radiant City and Broadacre-like neighbourhoods became predominant in the urbanisation of the second half of the 20th century, correlative to intense economic growth and mass car ownership. The late 20th century opened a new debate on the socio-environmental sustainability of these urban forms [5], including the new challenges of the Anthropocene [6]. For example, more compact, vernacular urban forms were advocated by American New Urbanism [7].

Is the Smart City a New Design Model?

One of the latest urban phenomena is the Smart City, whose definition, however, has been ambiguous for the past 30 years and is still a matter of discussion today [8]. Ramaprasad et al. [9] carried out an extensive literature review and provided an ontological definition by identifying the main topics and subtopics related to ‘smart’ and ‘city’. Although these topics touch upon many aspects of a city, such as society, politics, government, and information technology, they never take a stance on built form. Indeed, the subtopic ‘architecture’ does not have anything to do with building size, dimensions, composition, or materials. It is a periodical data transfer between citizens and local administration on perceived levels of quality of life inside existing buildings. Indeed, the literature on the Smart City largely focuses on technological, management, and governance aspects rather than features of the built environment [8,10,11,12]. As Min et al. [13] pointed out, words like urban form, urban development, urban sprawl, and smart growth were important keywords in the research on smart cities until 2015. Afterwards, they were overshadowed by more technologically oriented terms, such as data analytics, machine learning, and innovation. In a recent attempt, Lee [14] investigated the Smart City construct from an urban design perspective and found that the focus of the literature produced so far is on surveying and monitoring an already existing Smart City, for example, through computer vision, web-based surveys, sensors, but by no means proposes forms of the Smart City-to-be. Indeed, the author identifies the need for a more thorough understanding of the physical “quality of place” of the Smart City as opposed to its abstract and quantitative one as a fundamental research gap.
Currently, Smart City districts are being built or are in the process of being built around the globe. Masdar City (United Arab Emirates) (Figure 1, left) is one of them and features a compact form in line with the climate requirements of Middle Eastern cities. It is conceived in a top–down manner, thus leaving little room for piecemeal development and social sustainability issues [15]. As a result, although claiming to be inspired by local vernacular architecture, it is characterised by large blocks and buildings of modernist inspiration that hardly resemble the model of reference [16]. The Songdo International Business District in Incheon (South Korea) (Figure 1, centre) is a smart city example that follows the Radiant City model more explicitly [17]. It features a few blocks with active frontages in the core, but several others characterised by isolated large buildings and “towers in the park” layout. The Smart Kalasatama district in Helsinki (Finland) (Figure 1, right) is a further example. It features perimeter blocks of mid-rise buildings and a cluster of towers lying on a mixed-use podium. However, top–down control and the prevalence of large plots and buildings remain the hallmarks of Kalasatama.
As these examples show, the main issue of not having a formal reference model is that anything can be built under the Smart City label so long as the project is overlaid with the corresponding technological, organisational, and managerial superstructures. From a socio-morphological perspective, this is extremely concerning since previous studies have shown that different urban forms correlate differently with a variety of societal outcomes. For example, the features of modernist developments (e.g., tall, freestanding buildings in poorly connected street layouts) were found to be positively associated with deprivation [18] and inversely associated with perceived well-being [19,20]. In a nutshell, not all urban forms are equal, and the abovementioned superstructures alone cannot guarantee the societal success of the Smart City-to-be. This point is shared by several researchers who noted their stance on the issue. Marcus and Koch [21] argued that specific spatial configurations of the physical city already have an inherent smartness that can make up for many of the functions that are instead entrusted to smart apps or sensors, for example, Information and Communications Technologies (ICTs) for water management, air ventilation, and human navigation. They thus proposed an extended Space Syntax analysis, which in its basic form only measures centrality in street networks [22] to include parameters of density (i.e., accessible floor space through the street network) and diversity (i.e., accessible plots through the street network) to support Smart City planning and advance knowledge in the field. In a similar vein, Al Sayed et al. [23] suggested incorporating Space Syntax analysis among existing Building Information Modelling (BIM) parameters to aid Smart City planning. In line with these works, our study intends to advance knowledge in the morphological understanding of smart cities through a comparative approach that (i) affords a more comprehensive description of urban form by focusing not only on centrality and accessibility but also on street orientation, public space, and commerce and services; and (ii) introduces statistical techniques to compare a Smart City district with examples of previous design models to ultimately understand where the Smart City sits in the urban design theory.
More specifically, this study focuses on Méridia, a Smart City district located on the right bank of the Var River in the western part of Nice (France). Méridia integrates elements of sustainability, climate resilience, and smart technology. More specifically, a significant area of the district is allocated to permeable surfaces, aiding the drainage of stormwater. Various public structures are outfitted with photovoltaic panels, aiming to decrease energy usage, alongside sensors for monitoring pollution levels. Additionally, a computerized system oversees the utilization of geothermal power for heating and cooling the residential units [24]. In terms of research contributions, this paper presents (i) a replicable methodology to compare the forms of any Smart City district in relation to examples of previous design models; and (ii) an application of such a methodology to three districts of similar size located in the same geographical context: the Smart City Méridia, Hôtel-des-Postes, a 19th-century district, characterised by perimeter blocks (i.e., an urban form that concentrates the development primarily along its public-facing edges [25]), and Sophia Antipolis, a technopark (i.e., a relatively dispersed type of development mainly tech-focused [26]) built in the 1970s and 1980s. The goal of this comparison is to measure the morphological features of Méridia to understand to what degree it resembles the design models taken as references and whether it represents a renewal in the conception of the physical city. The outcomes of this study are one of the first attempts to establish a morphological understanding of an example of a Smart City. Furthermore, the replicability of the methodology allows further case studies to be tested in different contexts to extend knowledge related to Smart City morphology and potentially inform design choices affecting existing and future Smart City districts.

2. Methodology of Morphometric Comparison

The proposed comparison is rooted in the discipline of urban morphology and focuses on obtaining a comprehensive description of urban form through the measurement of its basic components (i.e., plots, buildings, and streets) and their relationships [27]. In a hypothetical best-case scenario, these aspects can be measured at a very fine level of spatial granularity. However, data availability puts some restraints on the scale of the analysis. Openly accessible data hardly offer more than footprints and heights, making it impossible, for instance, to account for façade composition. For this reason and for replicability purposes, the methodology reaches a compromise between an unattainable fine-grained description and a too-coarse one. A selection of morphometrics is derived from the existing literature to provide the most exhaustive description of the built environment possible within the limits stated above.

2.1. Input Data

The input data consists of four geospatial vector files: building footprints (with heights), cadastral parcels (i.e., plots), street networks, commerce and services. Currently, this information can be extracted from several sources, such as data repositories managed by public/semi-public bodies, for example, the Ordnance Survey (OS) OpenData in the UK1 or the BD TOPO, issued by the French National Institute of Geographic and Forest Information (IGN),2 but also from crowd-sourced projects, such as OpenStreetMap.3 The former two, being publicly administered, tend to provide even coverage across different geographic areas. The latter, being mapped by single individuals, might not offer the same level of spatial coverage. If the plots are unavailable, morphological tessellation [28] can be applied to buildings and streets to obtain geometric proxies of this spatial unit. Similarly, if building heights are missing, they can be predicted from features of buildings and streets through machine learning techniques, such as the one proposed by Milojevic-Dupont et al. [29].

2.2. Metrics of Urban Form

The rationale behind the selection of metrics is combined with exploring existing literature, such as studies by Porta et al. [30], Araldi and Fusco [31], and Oliveria and Madeiros [32], to name a few, and meeting the following requirements: robustness (i.e., they are used consistently across studies), replicability (i.e., their computation does not require too detailed data), comprehensiveness (i.e., they describe the urban environment in the most comprehensive manner within the limits of the previous condition), and interpretability (i.e., they are easy to understand by the wider public, including local administrators and planners). The set of 18 morphometrics chosen through this rationale measures aspects of the street network, buildings, plots, blocks, commerce, and services. They are computed for different spatial units to retain the largest amount of spatial information at the local level, with the goal of having a set of metrics rich enough to discriminate among urban forms produced by different design models. More specifically, two complementary aspects of urban form are considered: the configuration of the street network and the urban fabric. The former are:
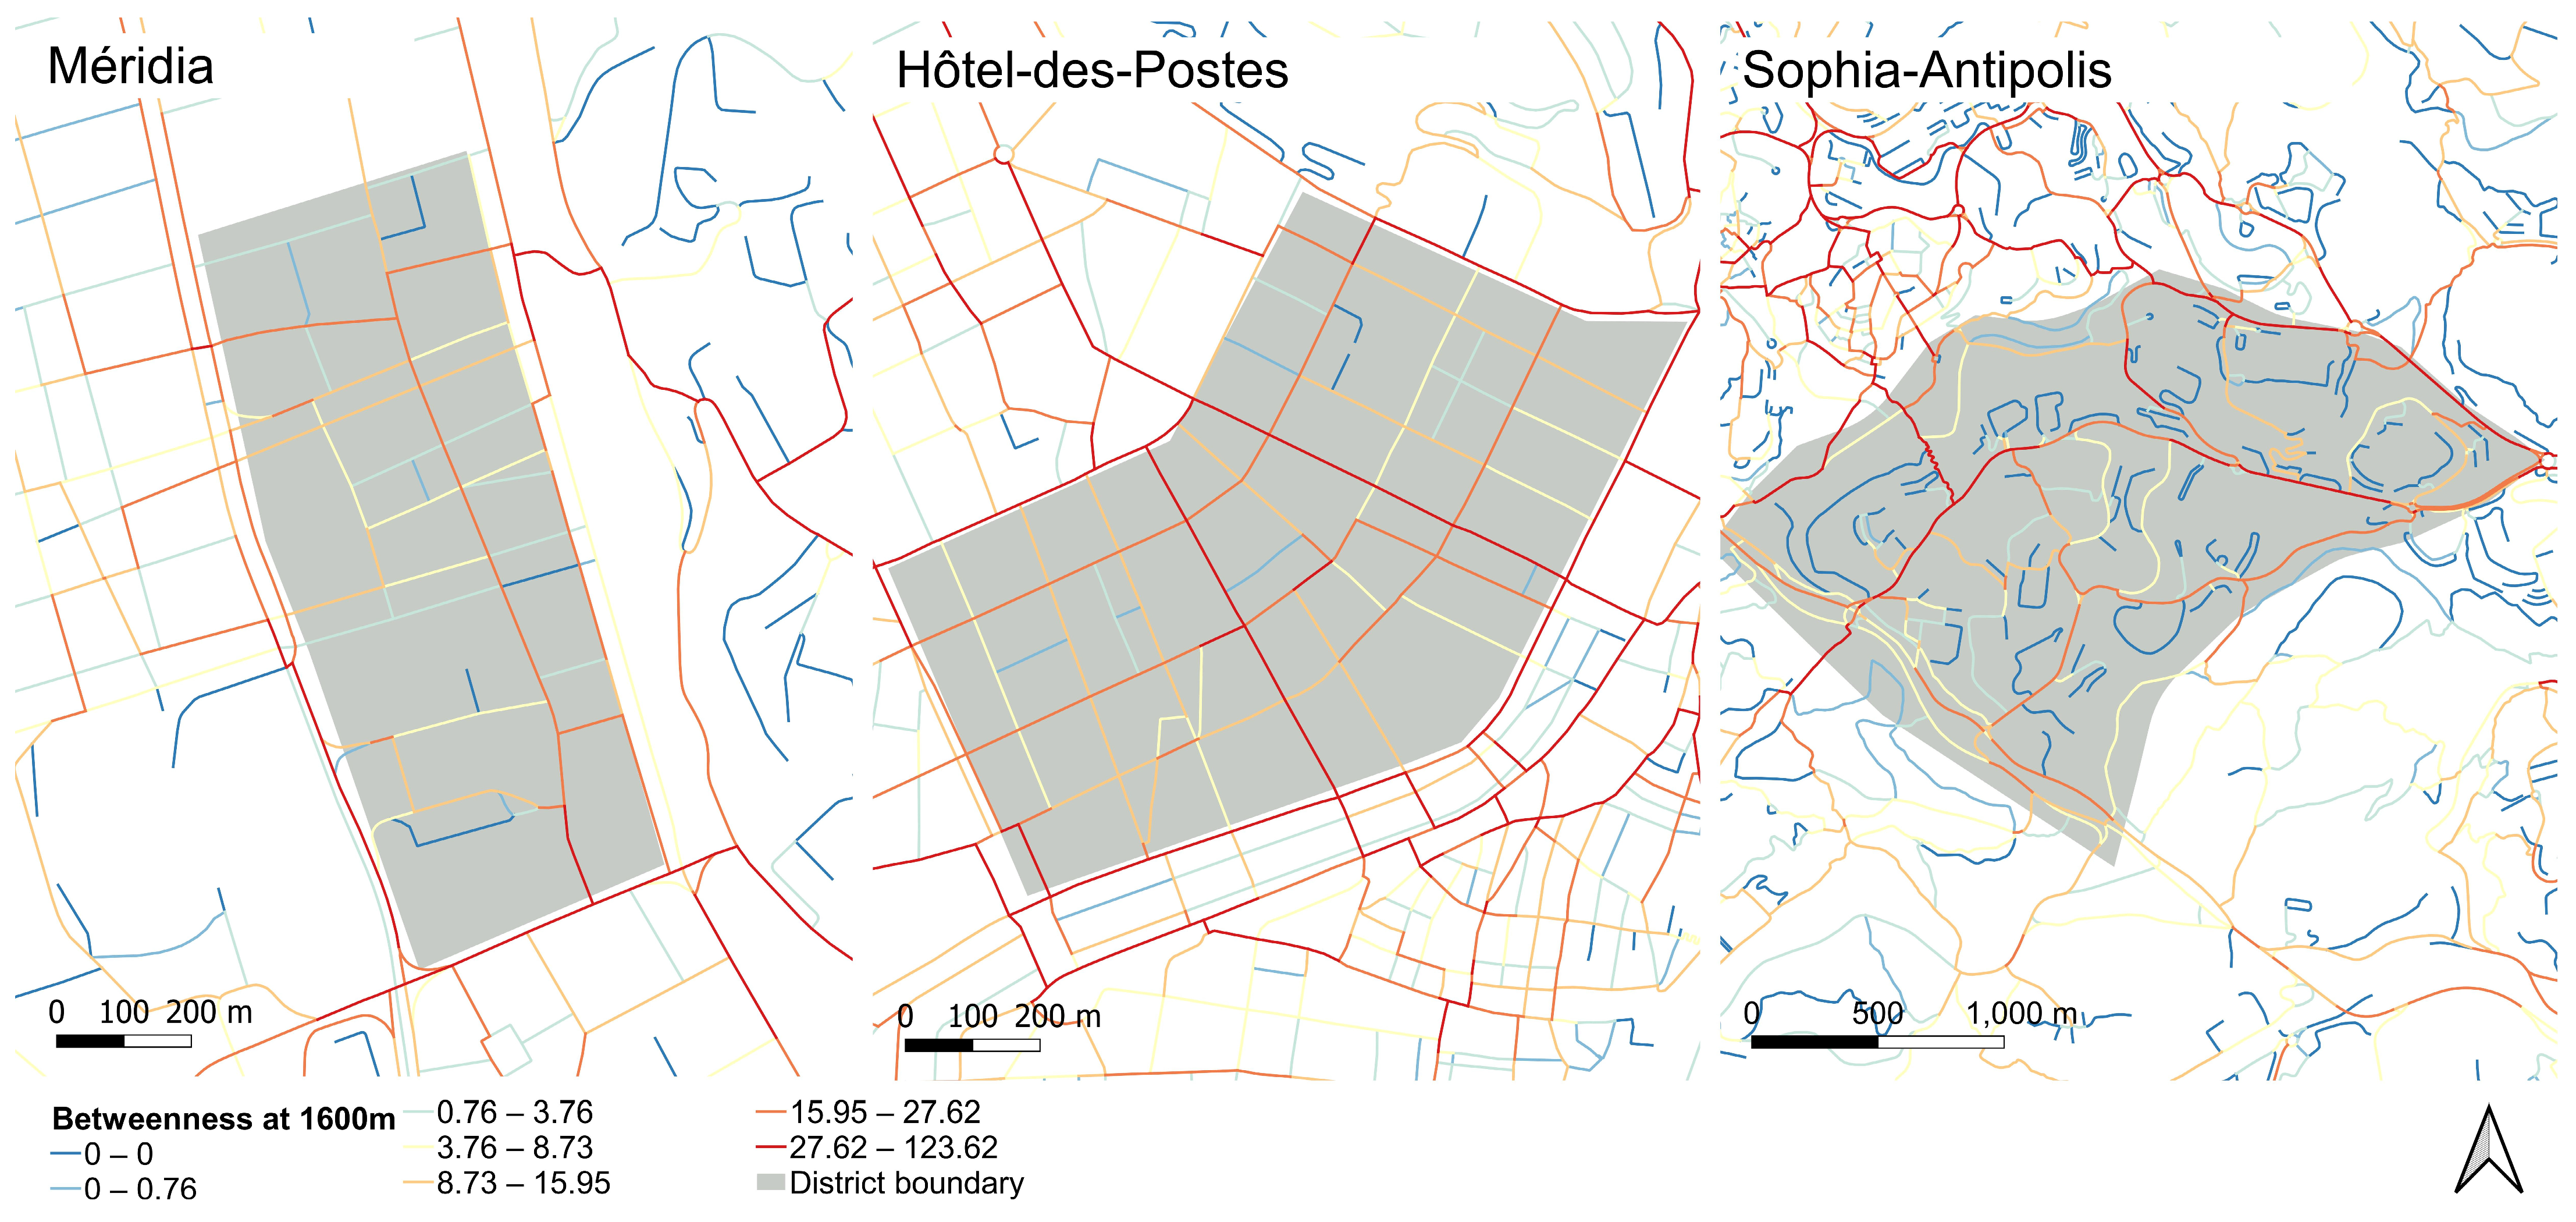
  • Betweenness centrality, which is based on the concept that a street intersection is central if it lies on many of the shortest paths connecting couples of nodes in a street network [30]. In practice, betweenness centrality quantifies the level of potential through-movement in urban space. The methodology requires the computation of betweenness centrality at four different radii, that of the nucleus of the neighbourhood (400 m) [33] and its geometric doublings, i.e., 800 m (neighbourhood), 1600 m (district), and 3200 m (urban agglomeration);
  • Closeness centrality, which is quantified into the extent to which a street intersection is near all the other street intersections along the shortest paths [30]. It simultaneously assesses the level of connectivity and proximity of street segments. The methodology requires the computation of this metric for the four radii mentioned above.
The metrics of the urban fabric assess simple geometric properties of buildings, plots, street segments, blocks, the main components of urban form [27], and a single functional index:
  • Street segment length, which measures the length (in metres) of each street segment (i.e., the line connecting two street intersections);
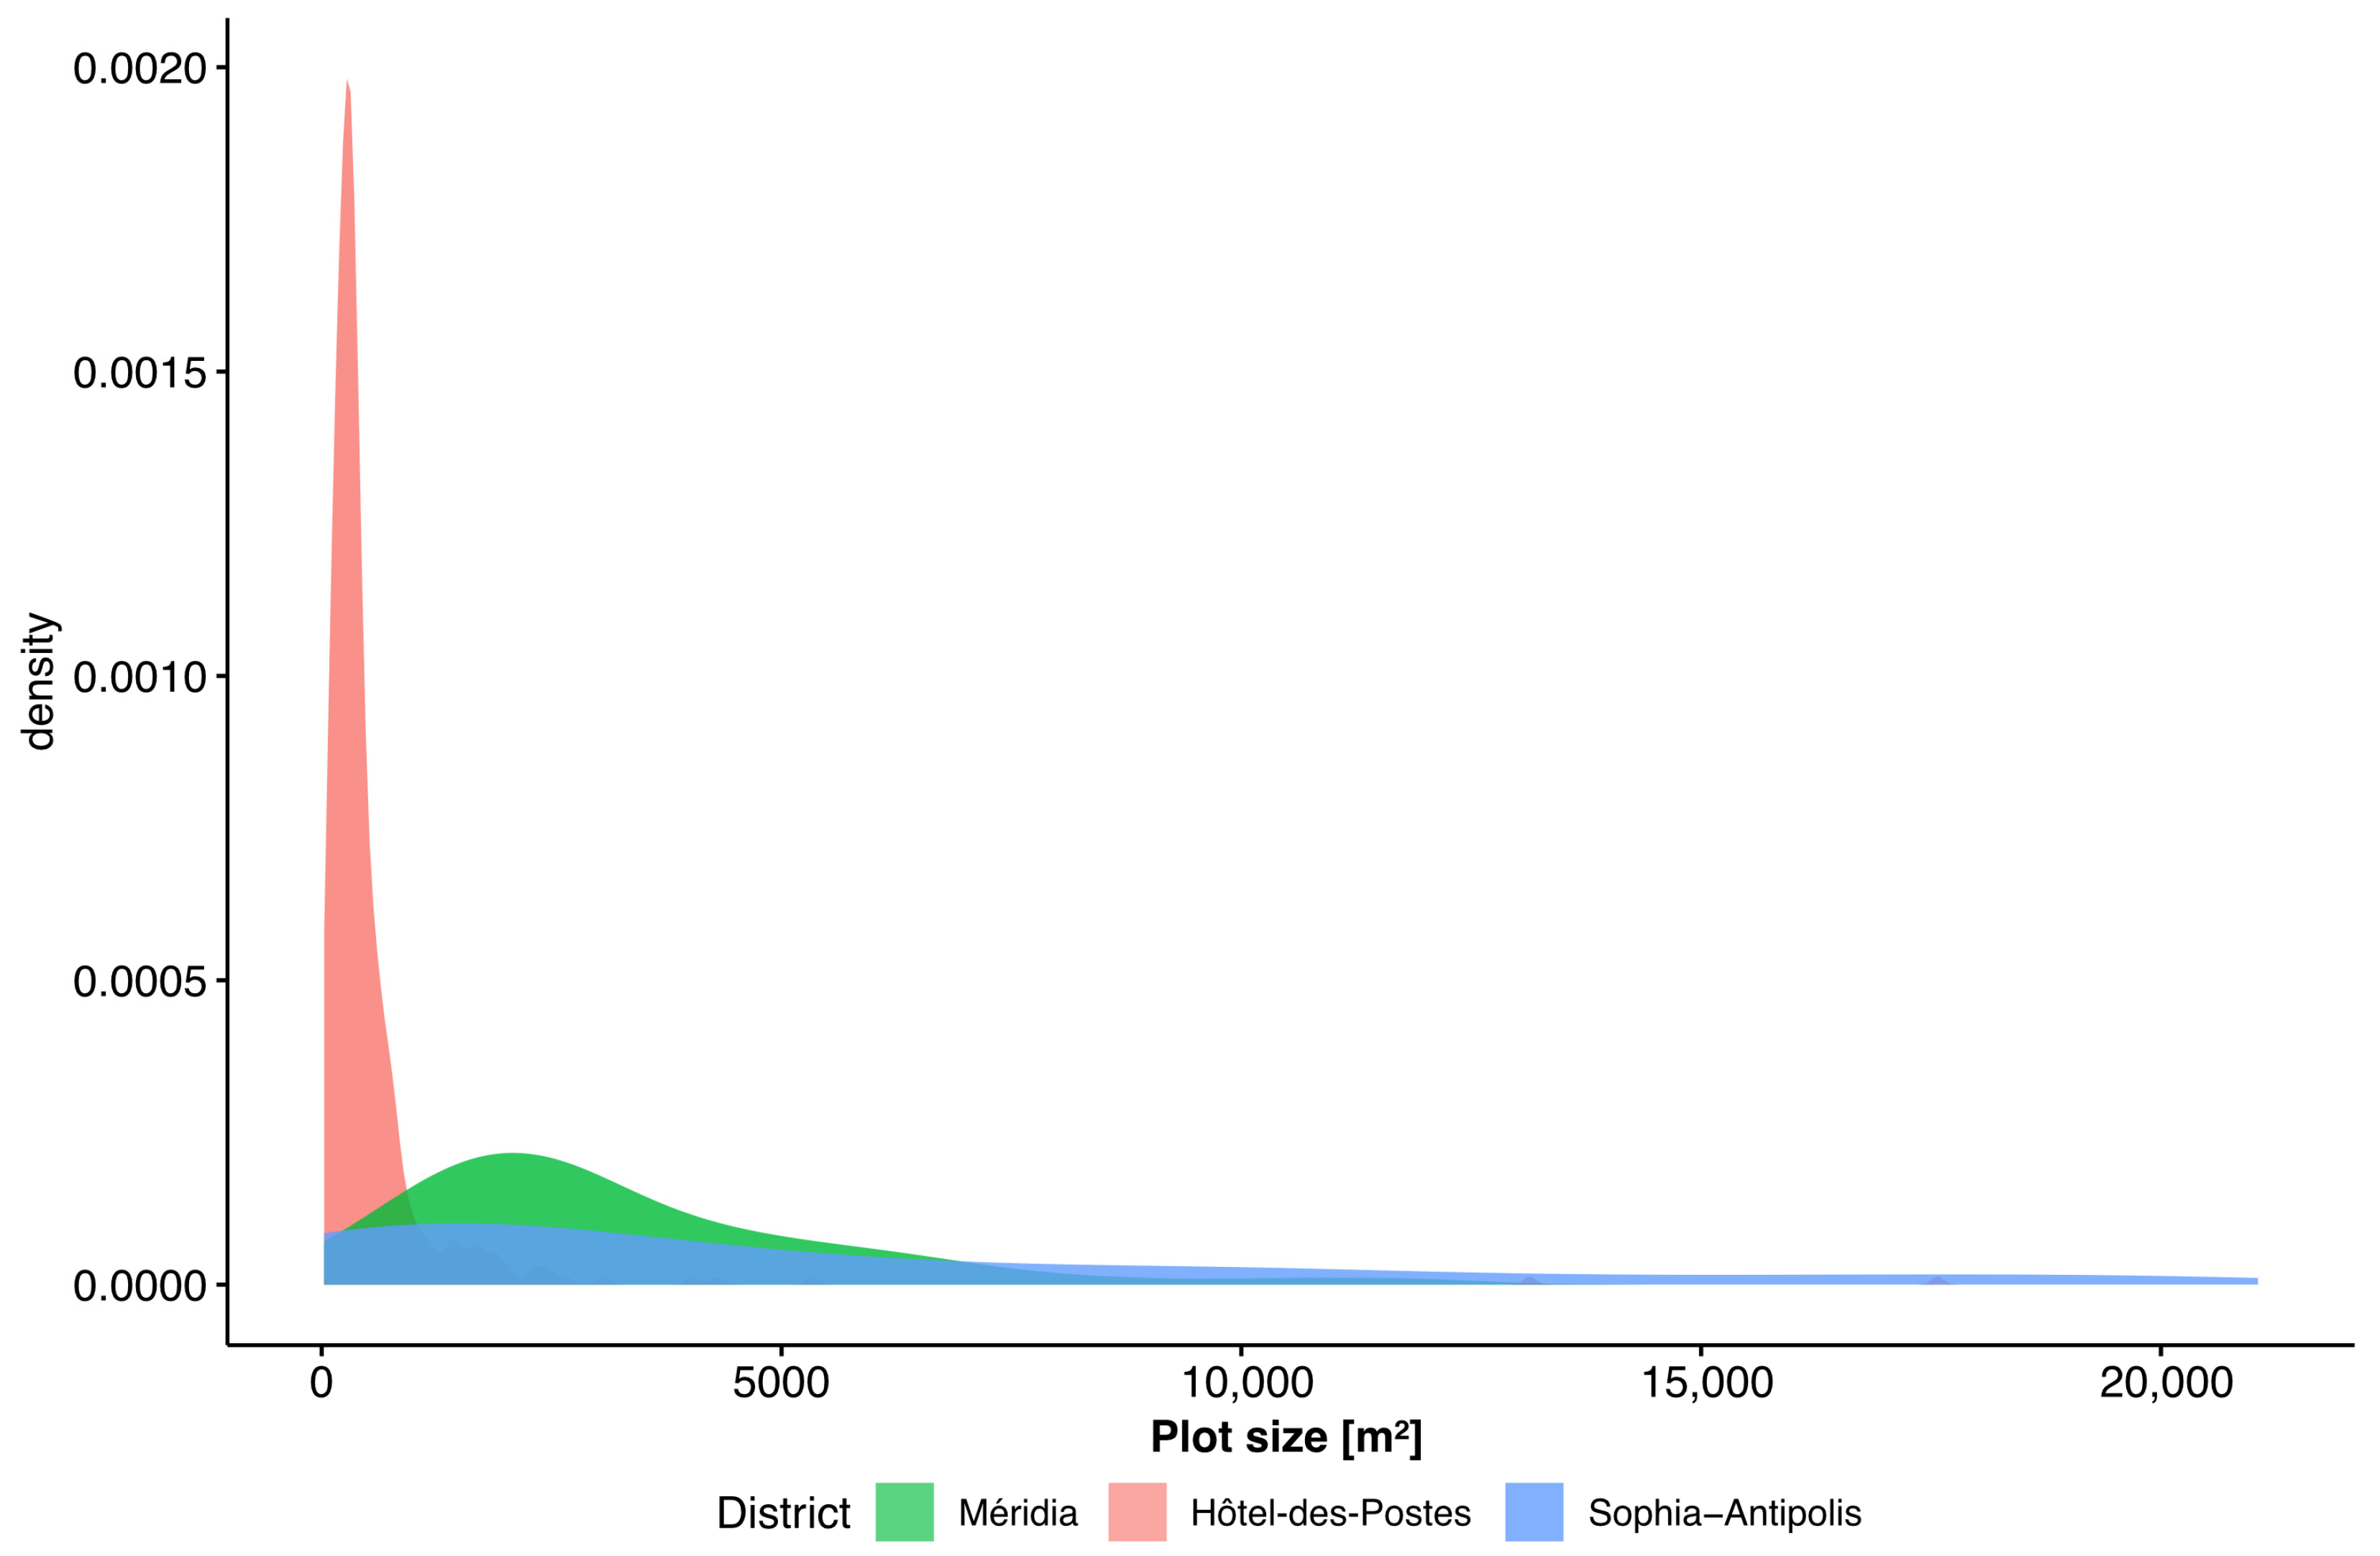
  • Plot size, which is the area (in m2) of each cadastral parcel;
  • Building footprints, which represent the area (in m2) occupied by each building;
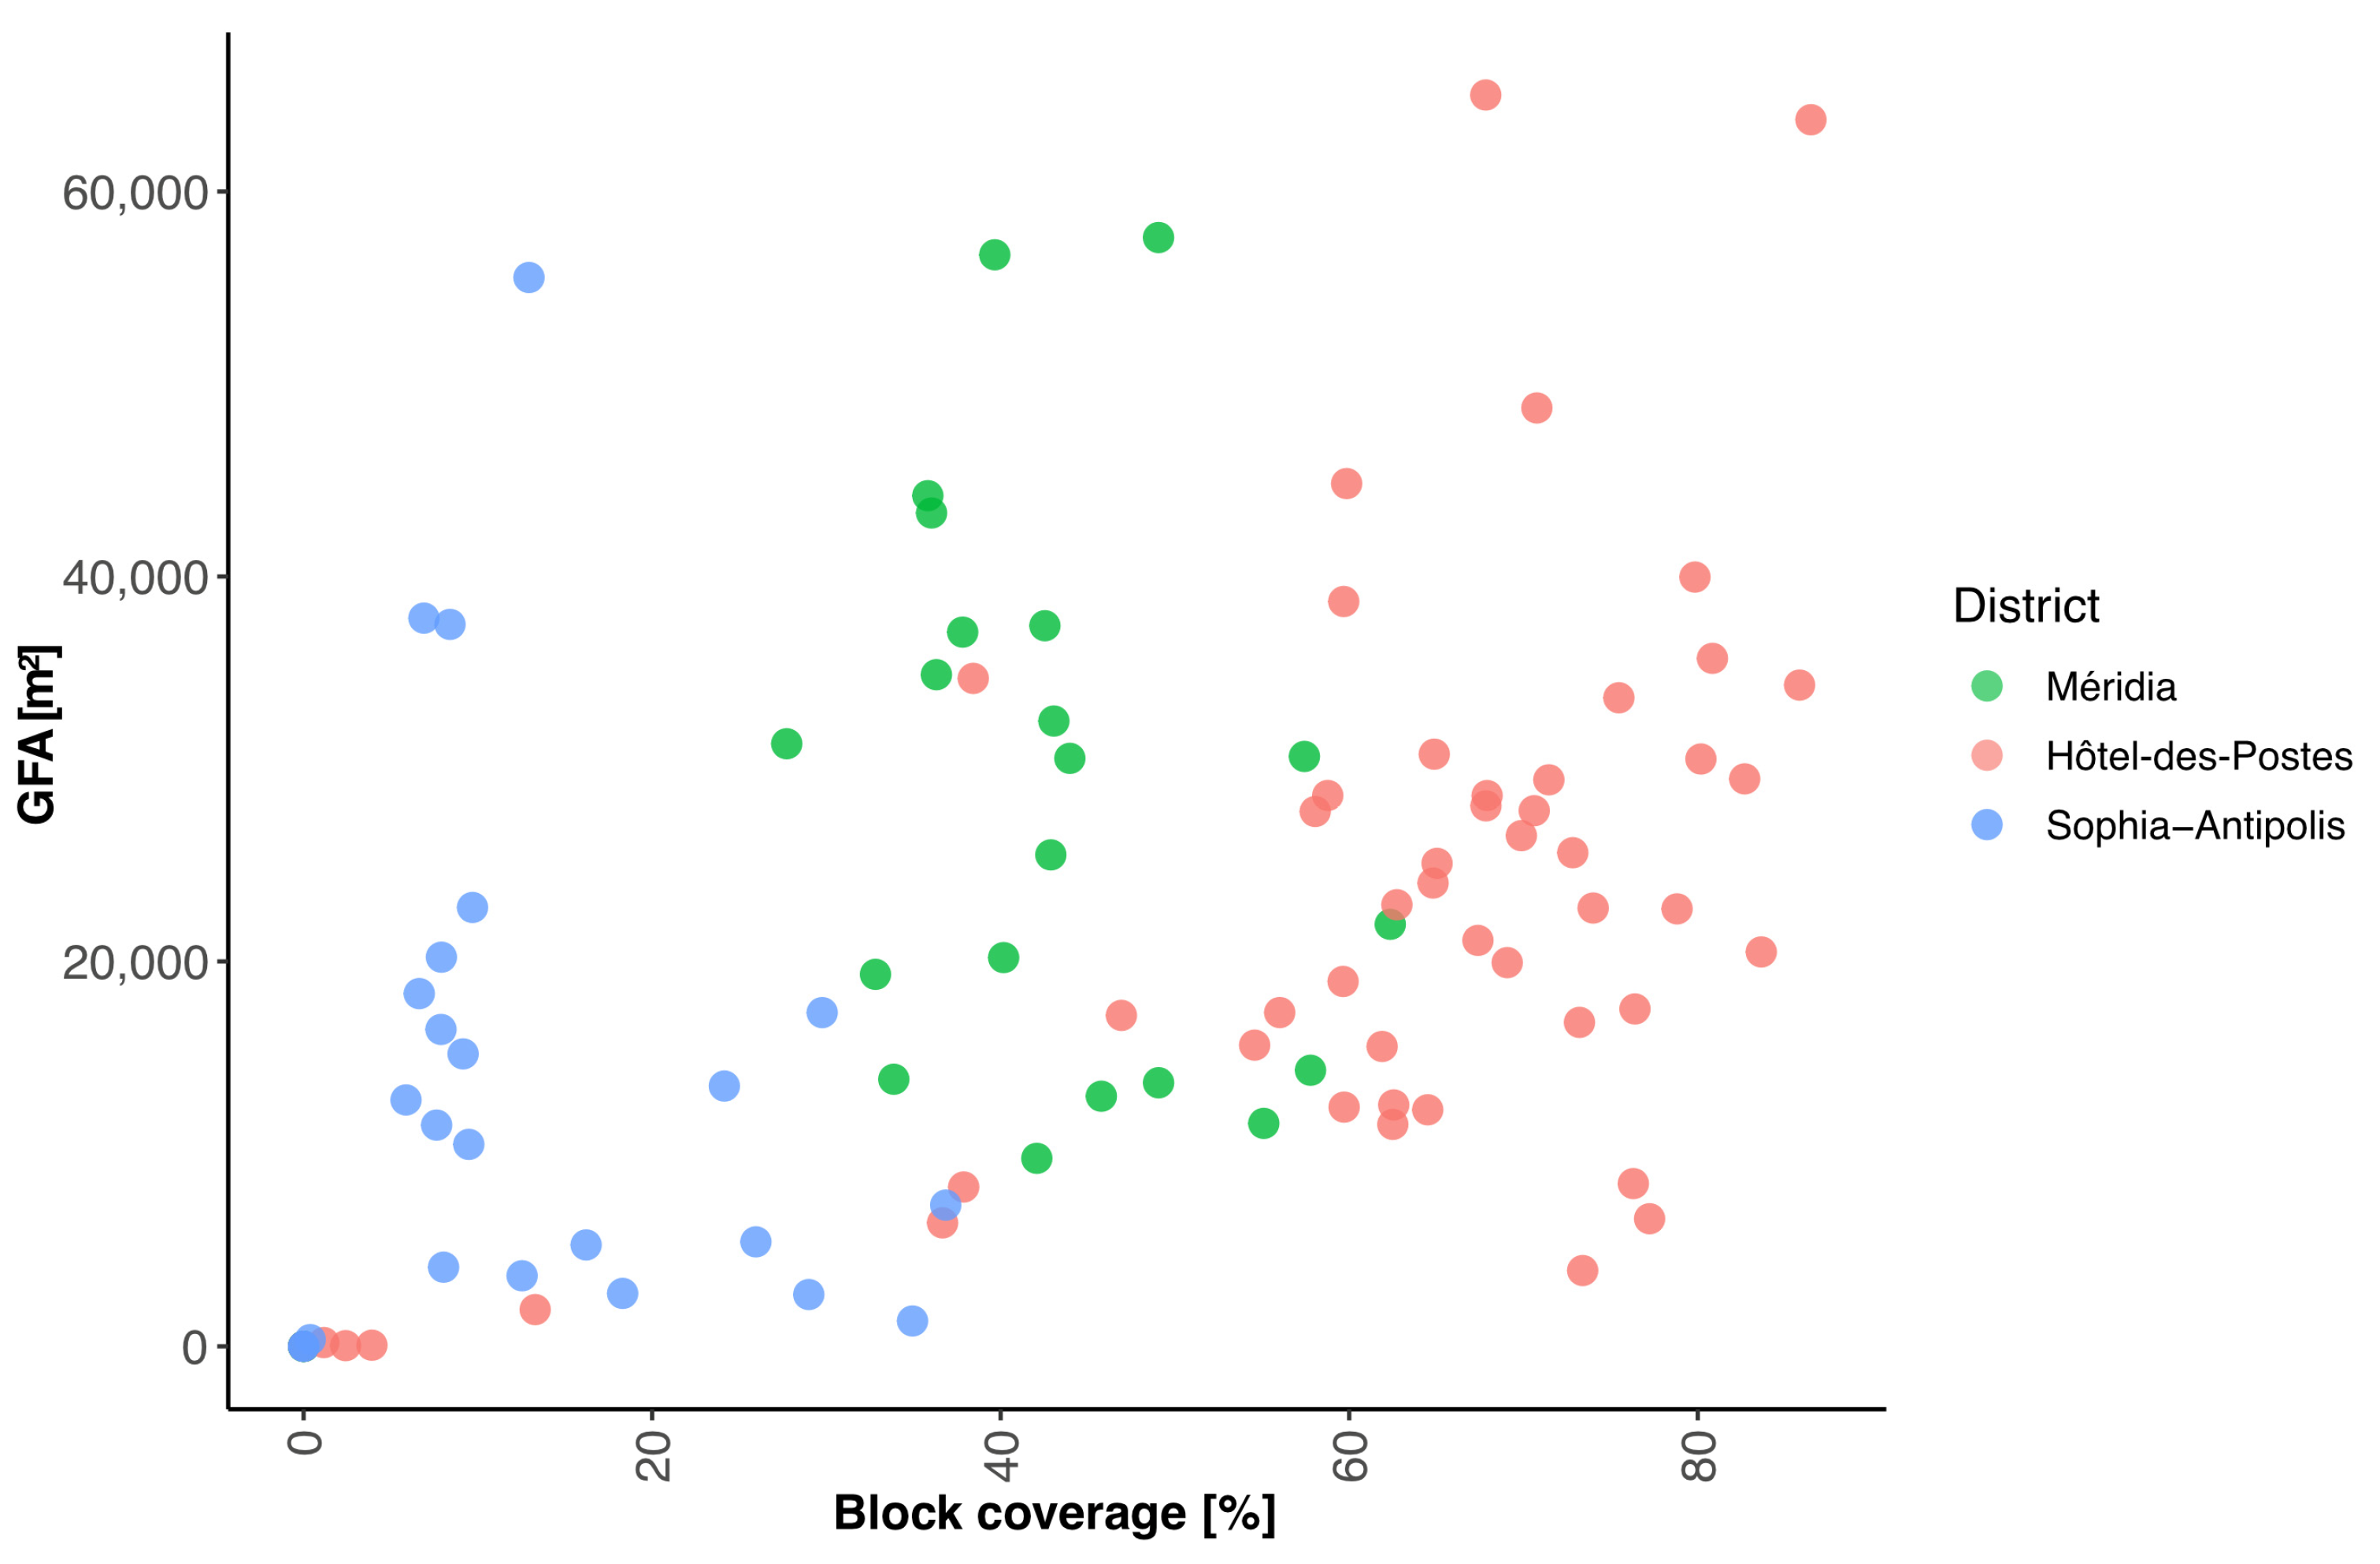
  • Block coverage, which is the percentage of land covered by buildings in each block;
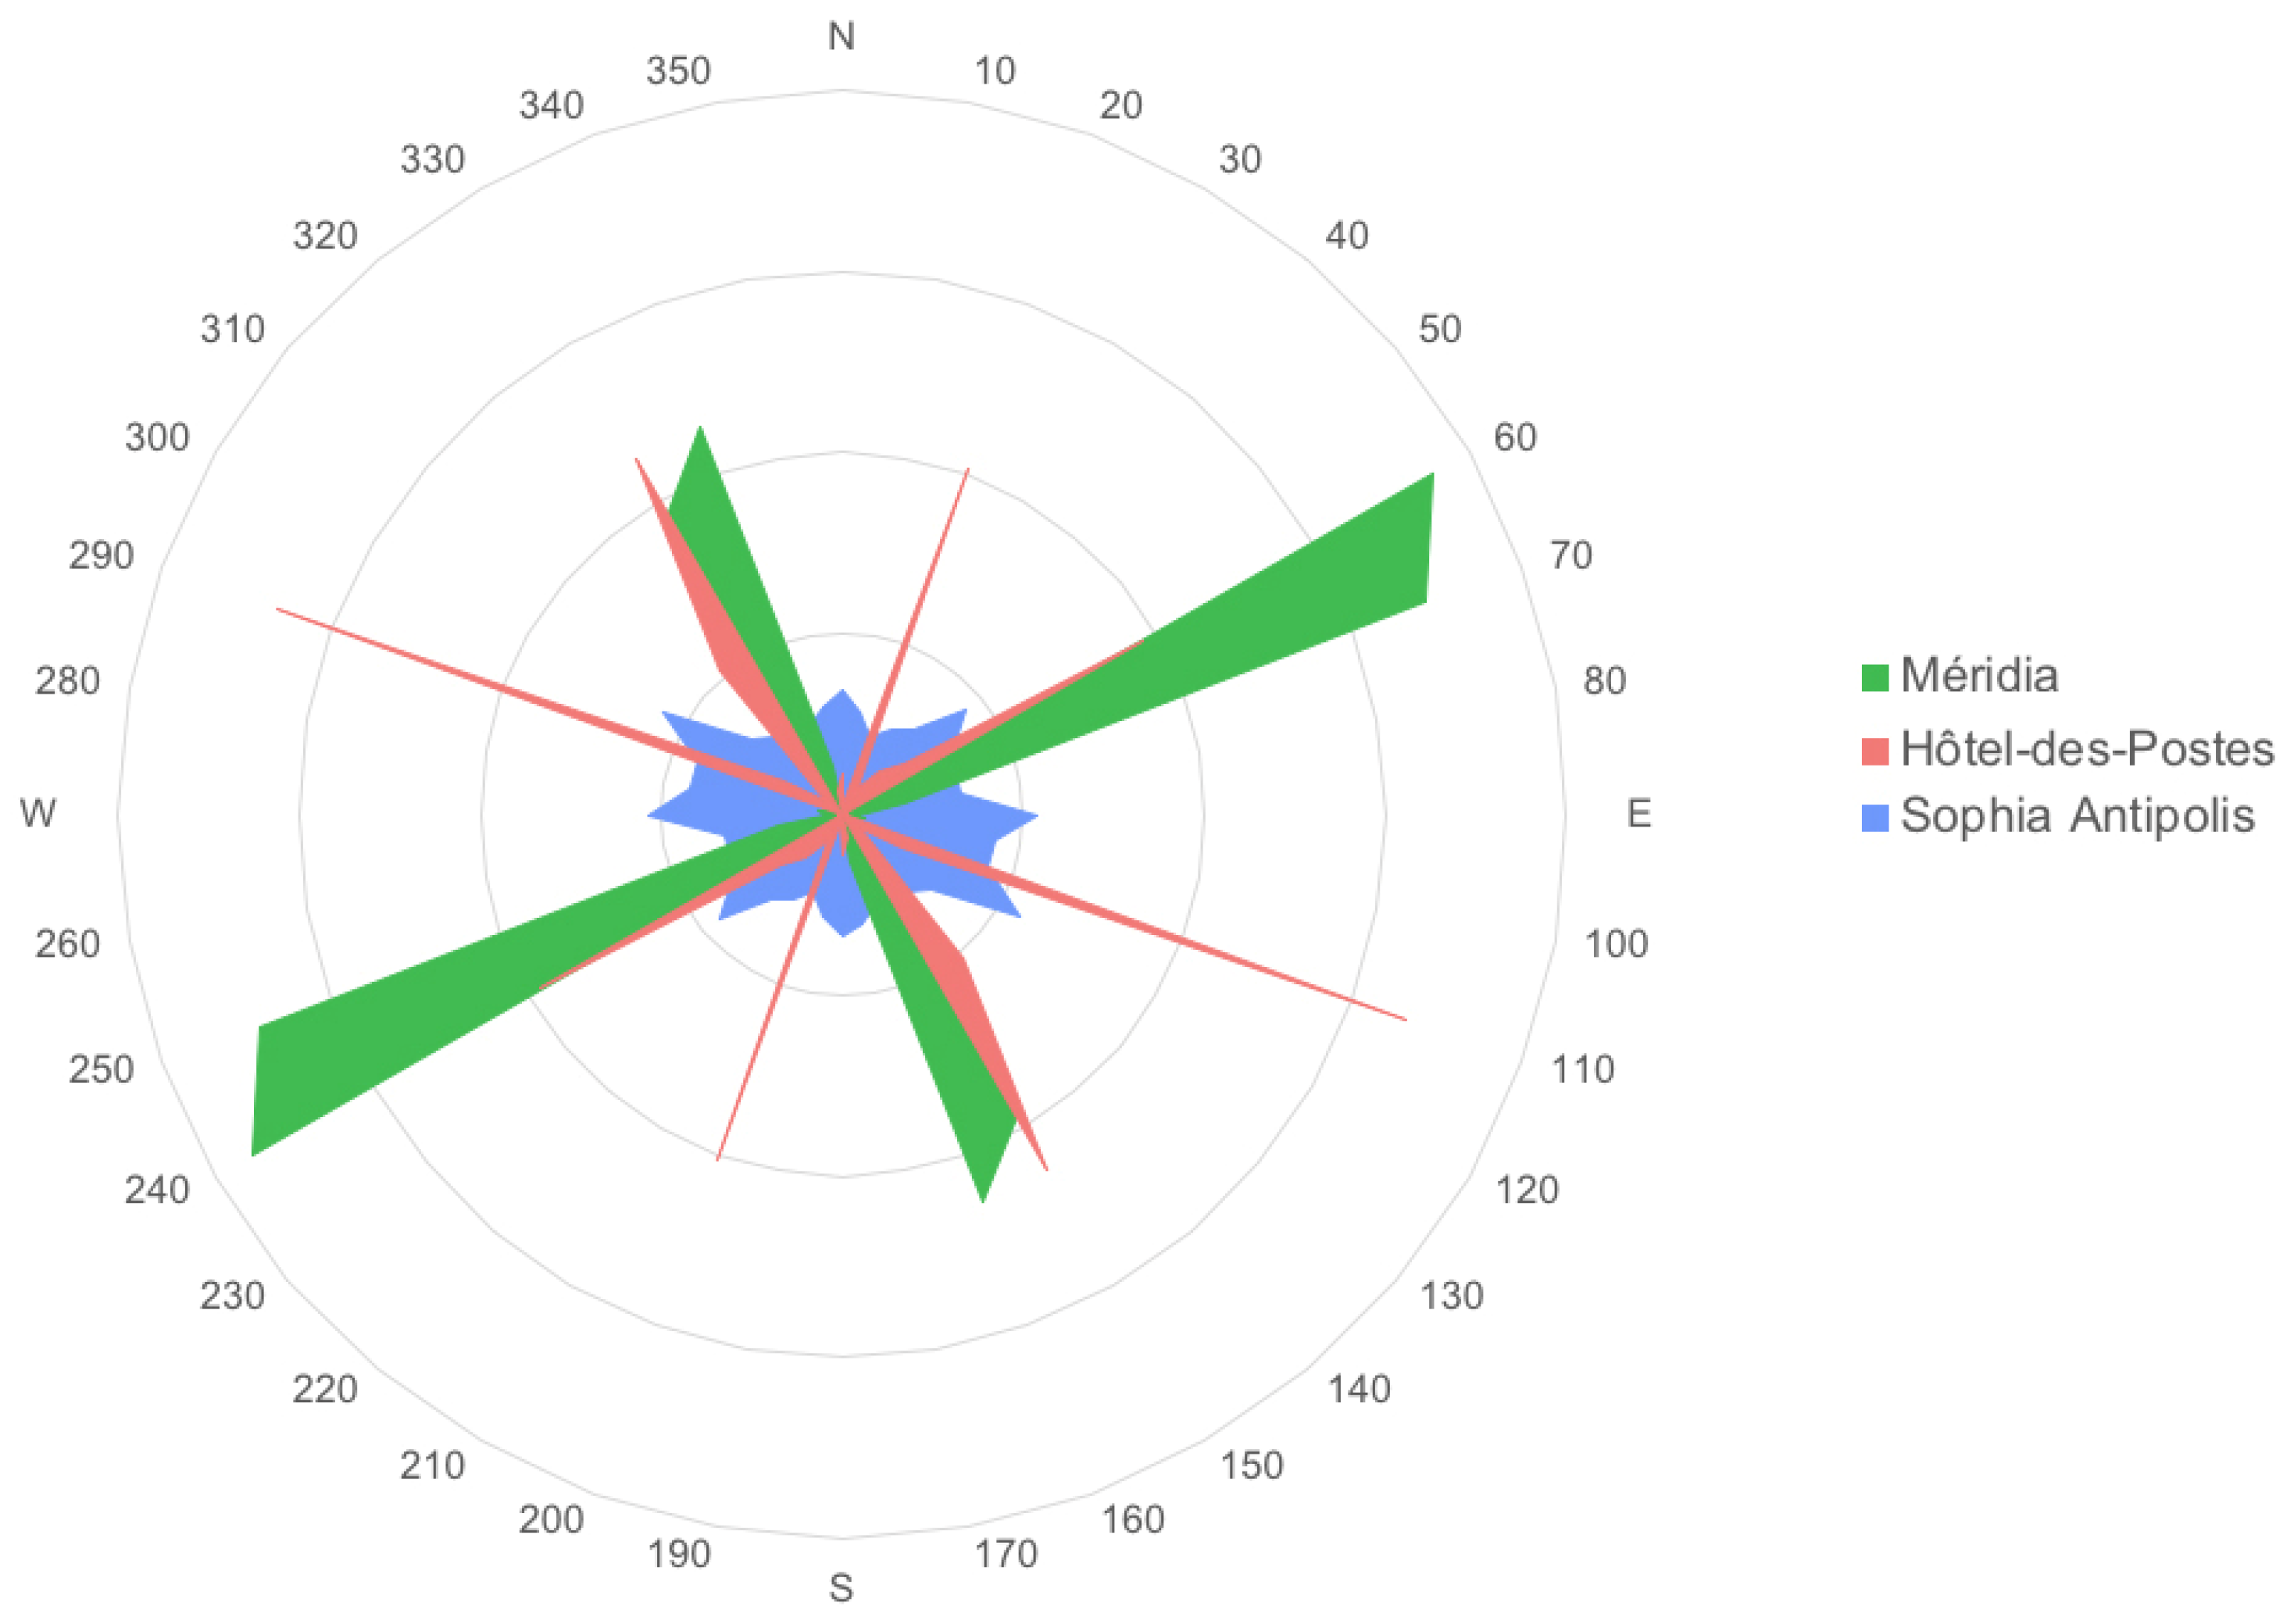
  • Street segment orientation, which quantifies the angle (in degrees) between each street and the North direction (0°) [31];
  • Gross Floor Area (GFA), which measures the built-up volume at the block level and is computed by first multiplying each building footprint by the number of floors in each block and then summing up these values [31];
  • Floor Area Ratio (FAR), which represents the intensity of the built-up volume on the block. It is calculated by dividing the GFA by the area (in m2) of the block [31];
  • Public Space Index (PSI), which represents the intensity of the built-up volume in the public space, that is, the area that is not occupied by buildings and private areas in the block. This includes, for example, squares, footpaths, and public gardens. PSI is calculated by dividing the GFA by the portion of the block area (in m2) dedicated to public space. This index is a variant of the Open Space measure proposed by Berghauser Pont and Haupt [34]. While the latter considers all unbuilt space to be equal in the block, PSI specifically focuses on the portion of unbuilt space that is public;
  • Percentage of Built-up Perimeter (PBP), which quantifies the proportion of block perimeter occupied by buildings within five metres from the block edge. Such a distance was reported to be the maximum setback threshold for having an active street edge and, thus, interactions between public and private realms at the street level [35];
  • Network kernel density estimation (NKDE) of commerce and services, which is a KDE applied to the street network rather than to a surface. It estimates the probability density distribution of a variable (in our case, data points of commerce and services) along the street network [36]. A 200 m bandwidth (half the size of a typical pedestrian nucleus [33]) should be used in the calculation. The output is a density at the street level, which better reflects the way citizens experience access to commerce and services in the real world [37].
These metrics can be computed in Python through dedicated functions contained in the momepy4 and osmnx5 packages. The calculation of NKDE of commerce and services requires free ad-hoc software, i.e., SANET Standalone 1.0 Beta.6

2.3. Statistical Comparison

To summarise the information provided by the metrics and facilitate the comparison, the methodology requires the computation of quartiles, a way of simplifying the statistical dispersion of a variable in four continuous intervals with equal frequencies through three cut points (i.e., 1st quartile, median, and 3rd quartile), with each containing 25% of the total observations. Given the multimodal nature of street segment orientation, values of such a metric must be visualised via a polar histogram, where the direction of each bar represents the compass bearings of the streets, and its length corresponds to the relative frequency of streets with those bearings.
The two-sample Kolmogorov–Smirnov (KS) test is required to check the similarities found through visual inspection of graphs. The KS test measures the similarity between the distribution functions of two variables via a distance metric (D) under the null hypothesis that these are taken from the same distribution [38]. If that is the case, D is usually close to 0, and the p-value is greater than 0.05 (i.e., a commonly accepted significance threshold).
Specific metrics can also be investigated further to understand whether their empirical distributions follow a fat-tail power law, signalling processes of spontaneous growth, typical of more adaptable systems, or a normal one, usually associated with top–down approaches, imposing standard sizes to plots and buildings, and are more fragile in the long term [39,40].
Finally, to better read how built-up volumes are distributed across space, our methodology requires producing a scatterplot with block coverage on the x-axis and GFA on the y-axis, which is colour-coded according to each case study.
The statistical outputs required by the methodology can be achieved in Python through the statistical and plotting functions contained in the SciPy7 and Seaborn8 packages, respectively.

3. The Morphometric Comparison of Méridia, Hôtel-des-Postes, and Sophia Antipolis

3.1. The Three Districts under Examination
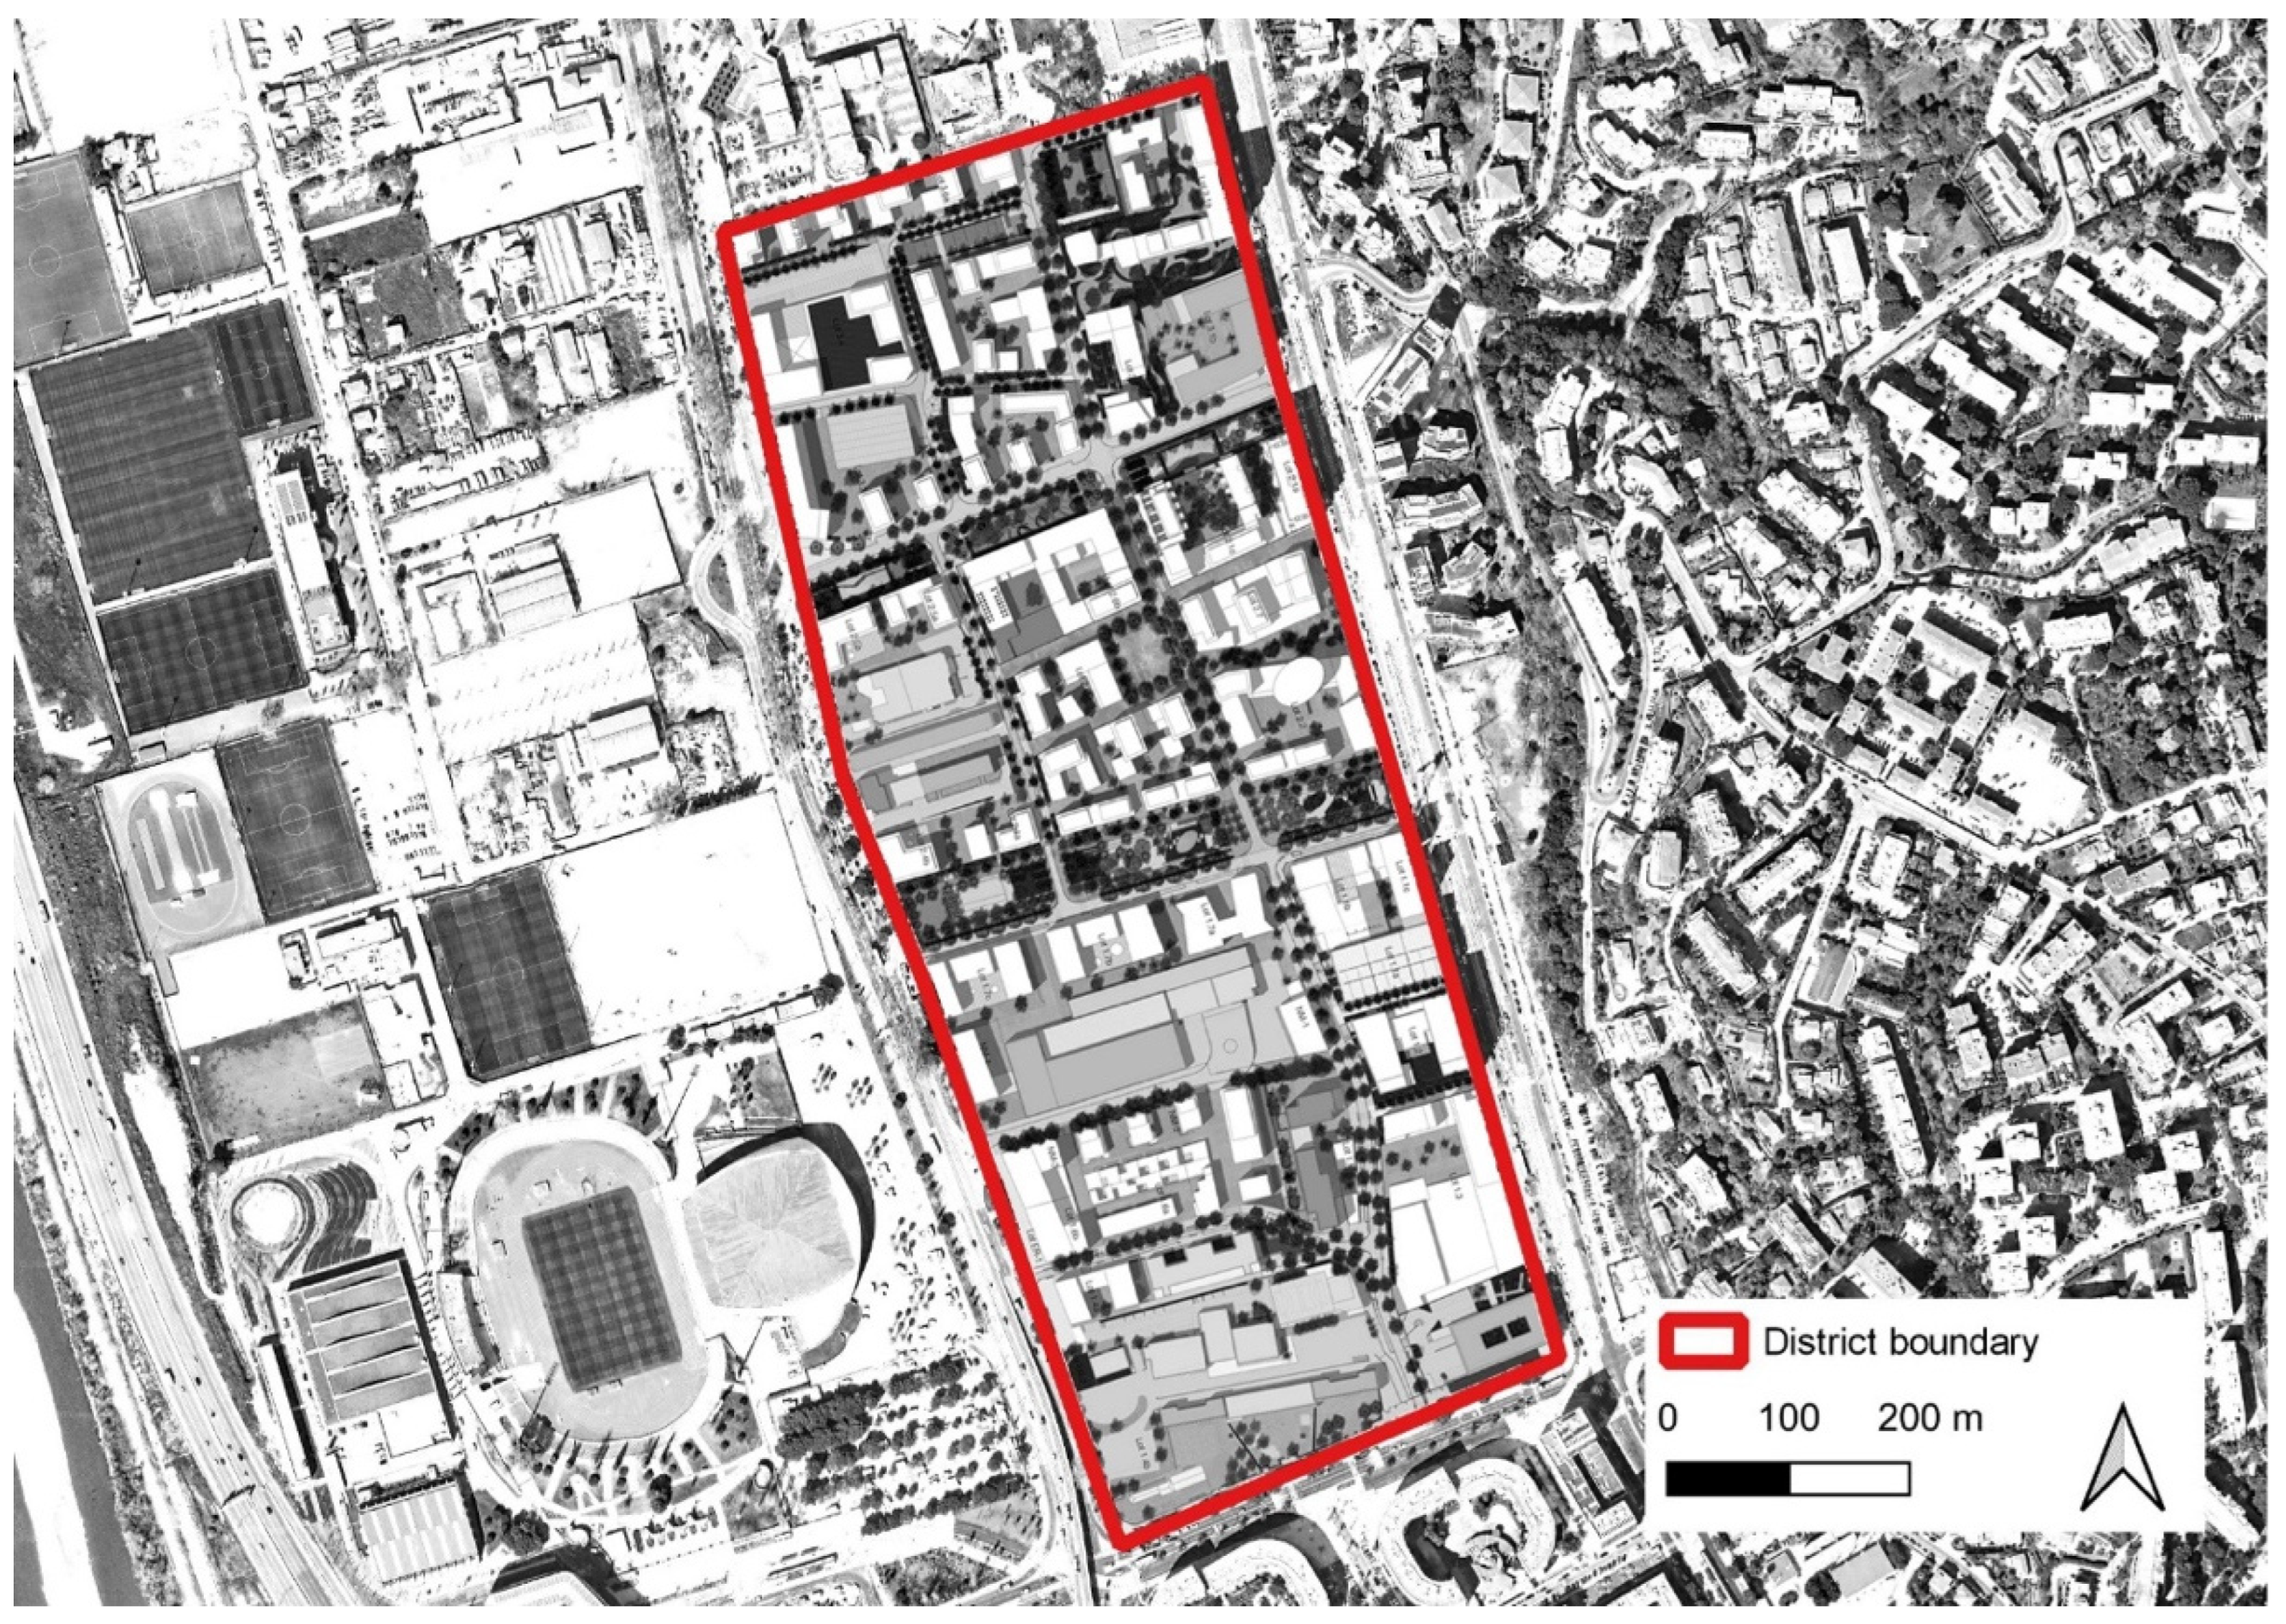
3.1.1. Méridia

Méridia is located west of Nice and roughly measures 800 by 350 m. It is part of a wider development plan, i.e., Opération d’Intérêt National Eco-Vallée (Operation of National Interest Eco-Valley), focusing on the Var Valley, a 23 km strip of land going from the Nice Côte d’Azur International Airport to the pre-alpine hinterland. In the French planning community, Méridia is heralded as a paradigmatic Smart City development, making the link between previous high-quality urban projects (e.g., Rive Gauche in Paris and Confluence in Lyon) and high-tech developments. The masterplan of Méridia was developed by Devillers [24] on behalf of the public development agency, EPA Plaine du Var. The development of each plot was assigned to private developers, who previously won public tenders. The new district is designed to incorporate sustainability, climate resilience, and smartness. For example, a relevant portion of the district is dedicated to permeable surfaces to facilitate the drainage of stormwater. Several public buildings are equipped with photovoltaic panels to reduce energy consumption and sensors to monitor pollution levels. A computerised system manages the geothermal power used to heat and cool the housing units [24]. In terms of urban form, the masterplan (Figure 2) advocates for a compact neighbourhood inspired by the traditional forms of 19th-century Nice (e.g., a regular urban grid, few but well-designed public spaces, and a dense urban fabric). In terms of building style, the absence of a design code led to the design of a motley urban landscape, seemingly missing an overall formal coherency. As of now, Méridia is less than 50% completed. However, for comparison purposes, its completed version, as presented in the official master plan (Figure 2), is considered in this paper.

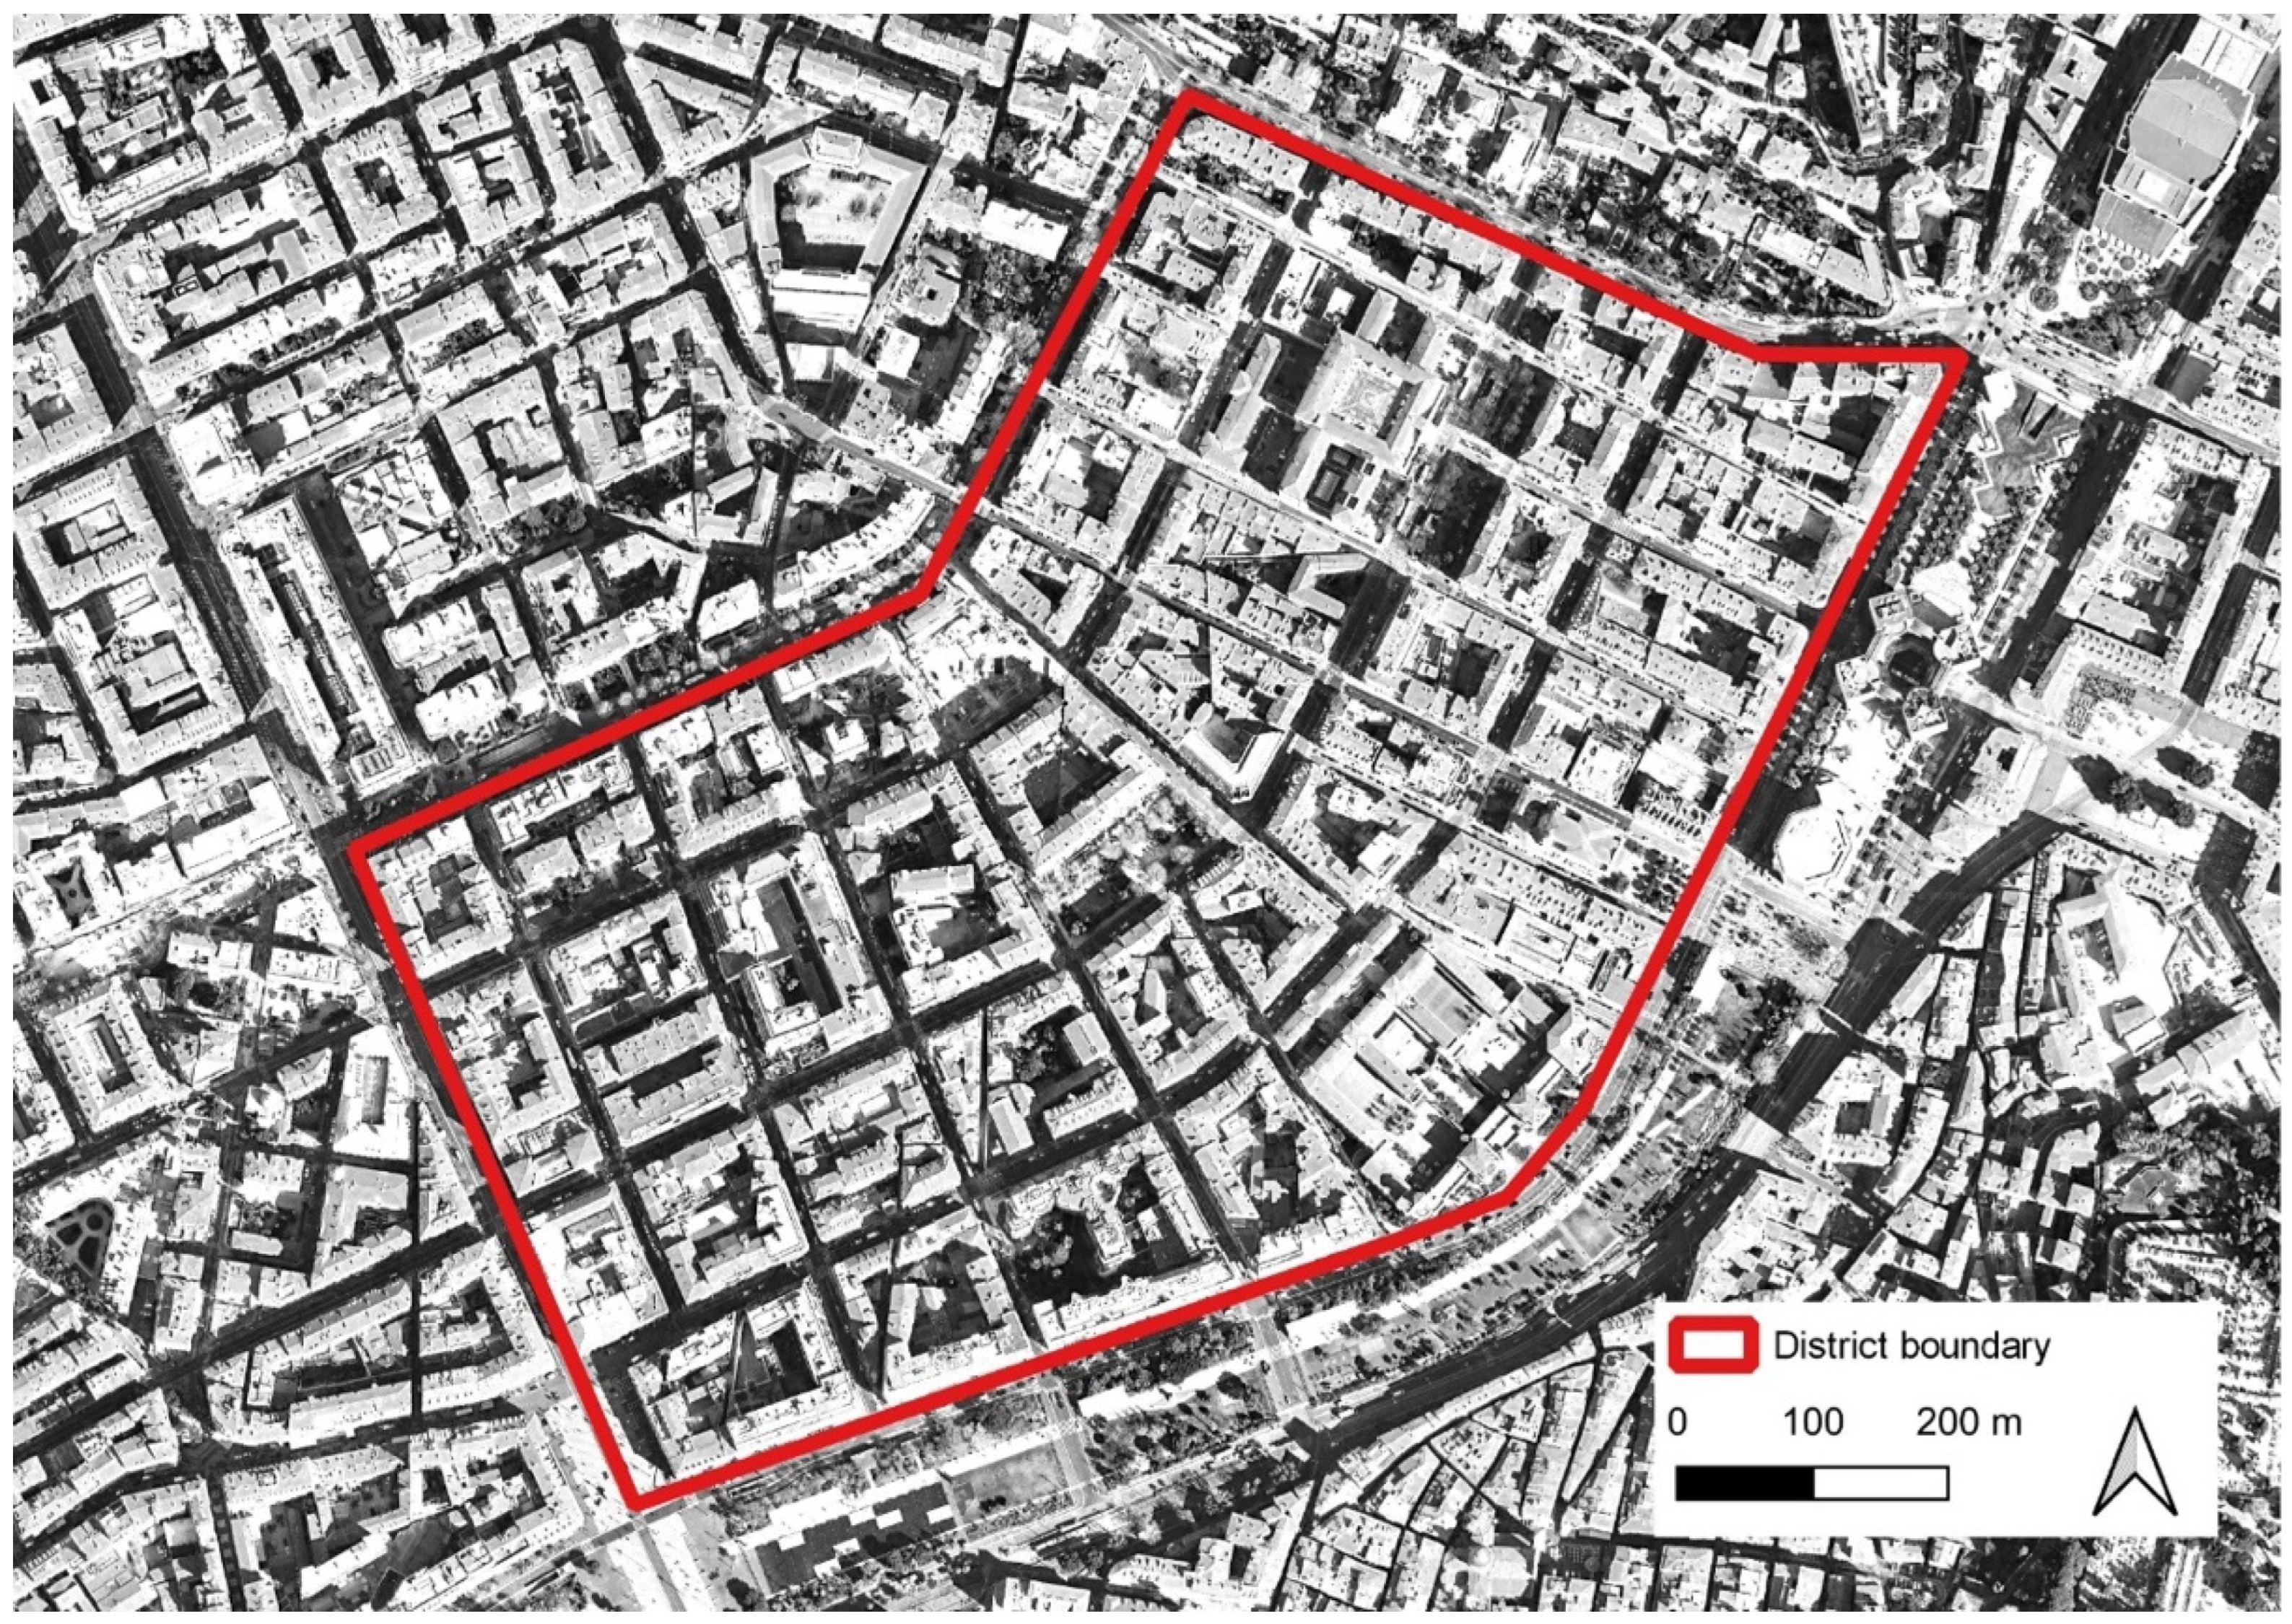
3.1.2. Hôtel-des-Postes

Hôtel-des-Postes is in central Nice, northwest of the old town, and roughly measures 800 m by 450 m. It dates to the mid-19th century when Nice was part of the Kingdom of Piedmont-Sardinia and experienced intense urban development due to demographic boom and tourism growth. Between 1854 and 1858, the city’s local planning authority, the Consiglio d’Ornato, produced several local plans for its western expansion, which, in 1860, were included in an overall masterplan [41]. The goal was to structure urban development following the example of the Kingdom’s capital, Turin, combining Baroque and Enlightenment principles. Hôtel-des-Postes was thus designed with a grid layout, medium-to-high densities, perimeter blocks and an interconnected network of public spaces.
Furthermore, the gridiron system was adapted to the surrounding context by creating public squares at the interface with the old town and bending the mesh according to the nearby Paillon River. The hierarchy of public squares and streets was also a structural principle of the plan. The emblematic Place (square) Massena was designed to be the interface between the old city and two new districts, including Hôtel-des-Postes. A north–south axis (Avenue Jean Médecin) marked the boundary between such two districts, while secondary boulevards intersected it perpendicularly. In 150 years, Hôtel-des-Postes underwent several modifications but maintained the founding principles of its original plan. In Figure 3, we present a recent aerial view of Hôtel-des-Postes.

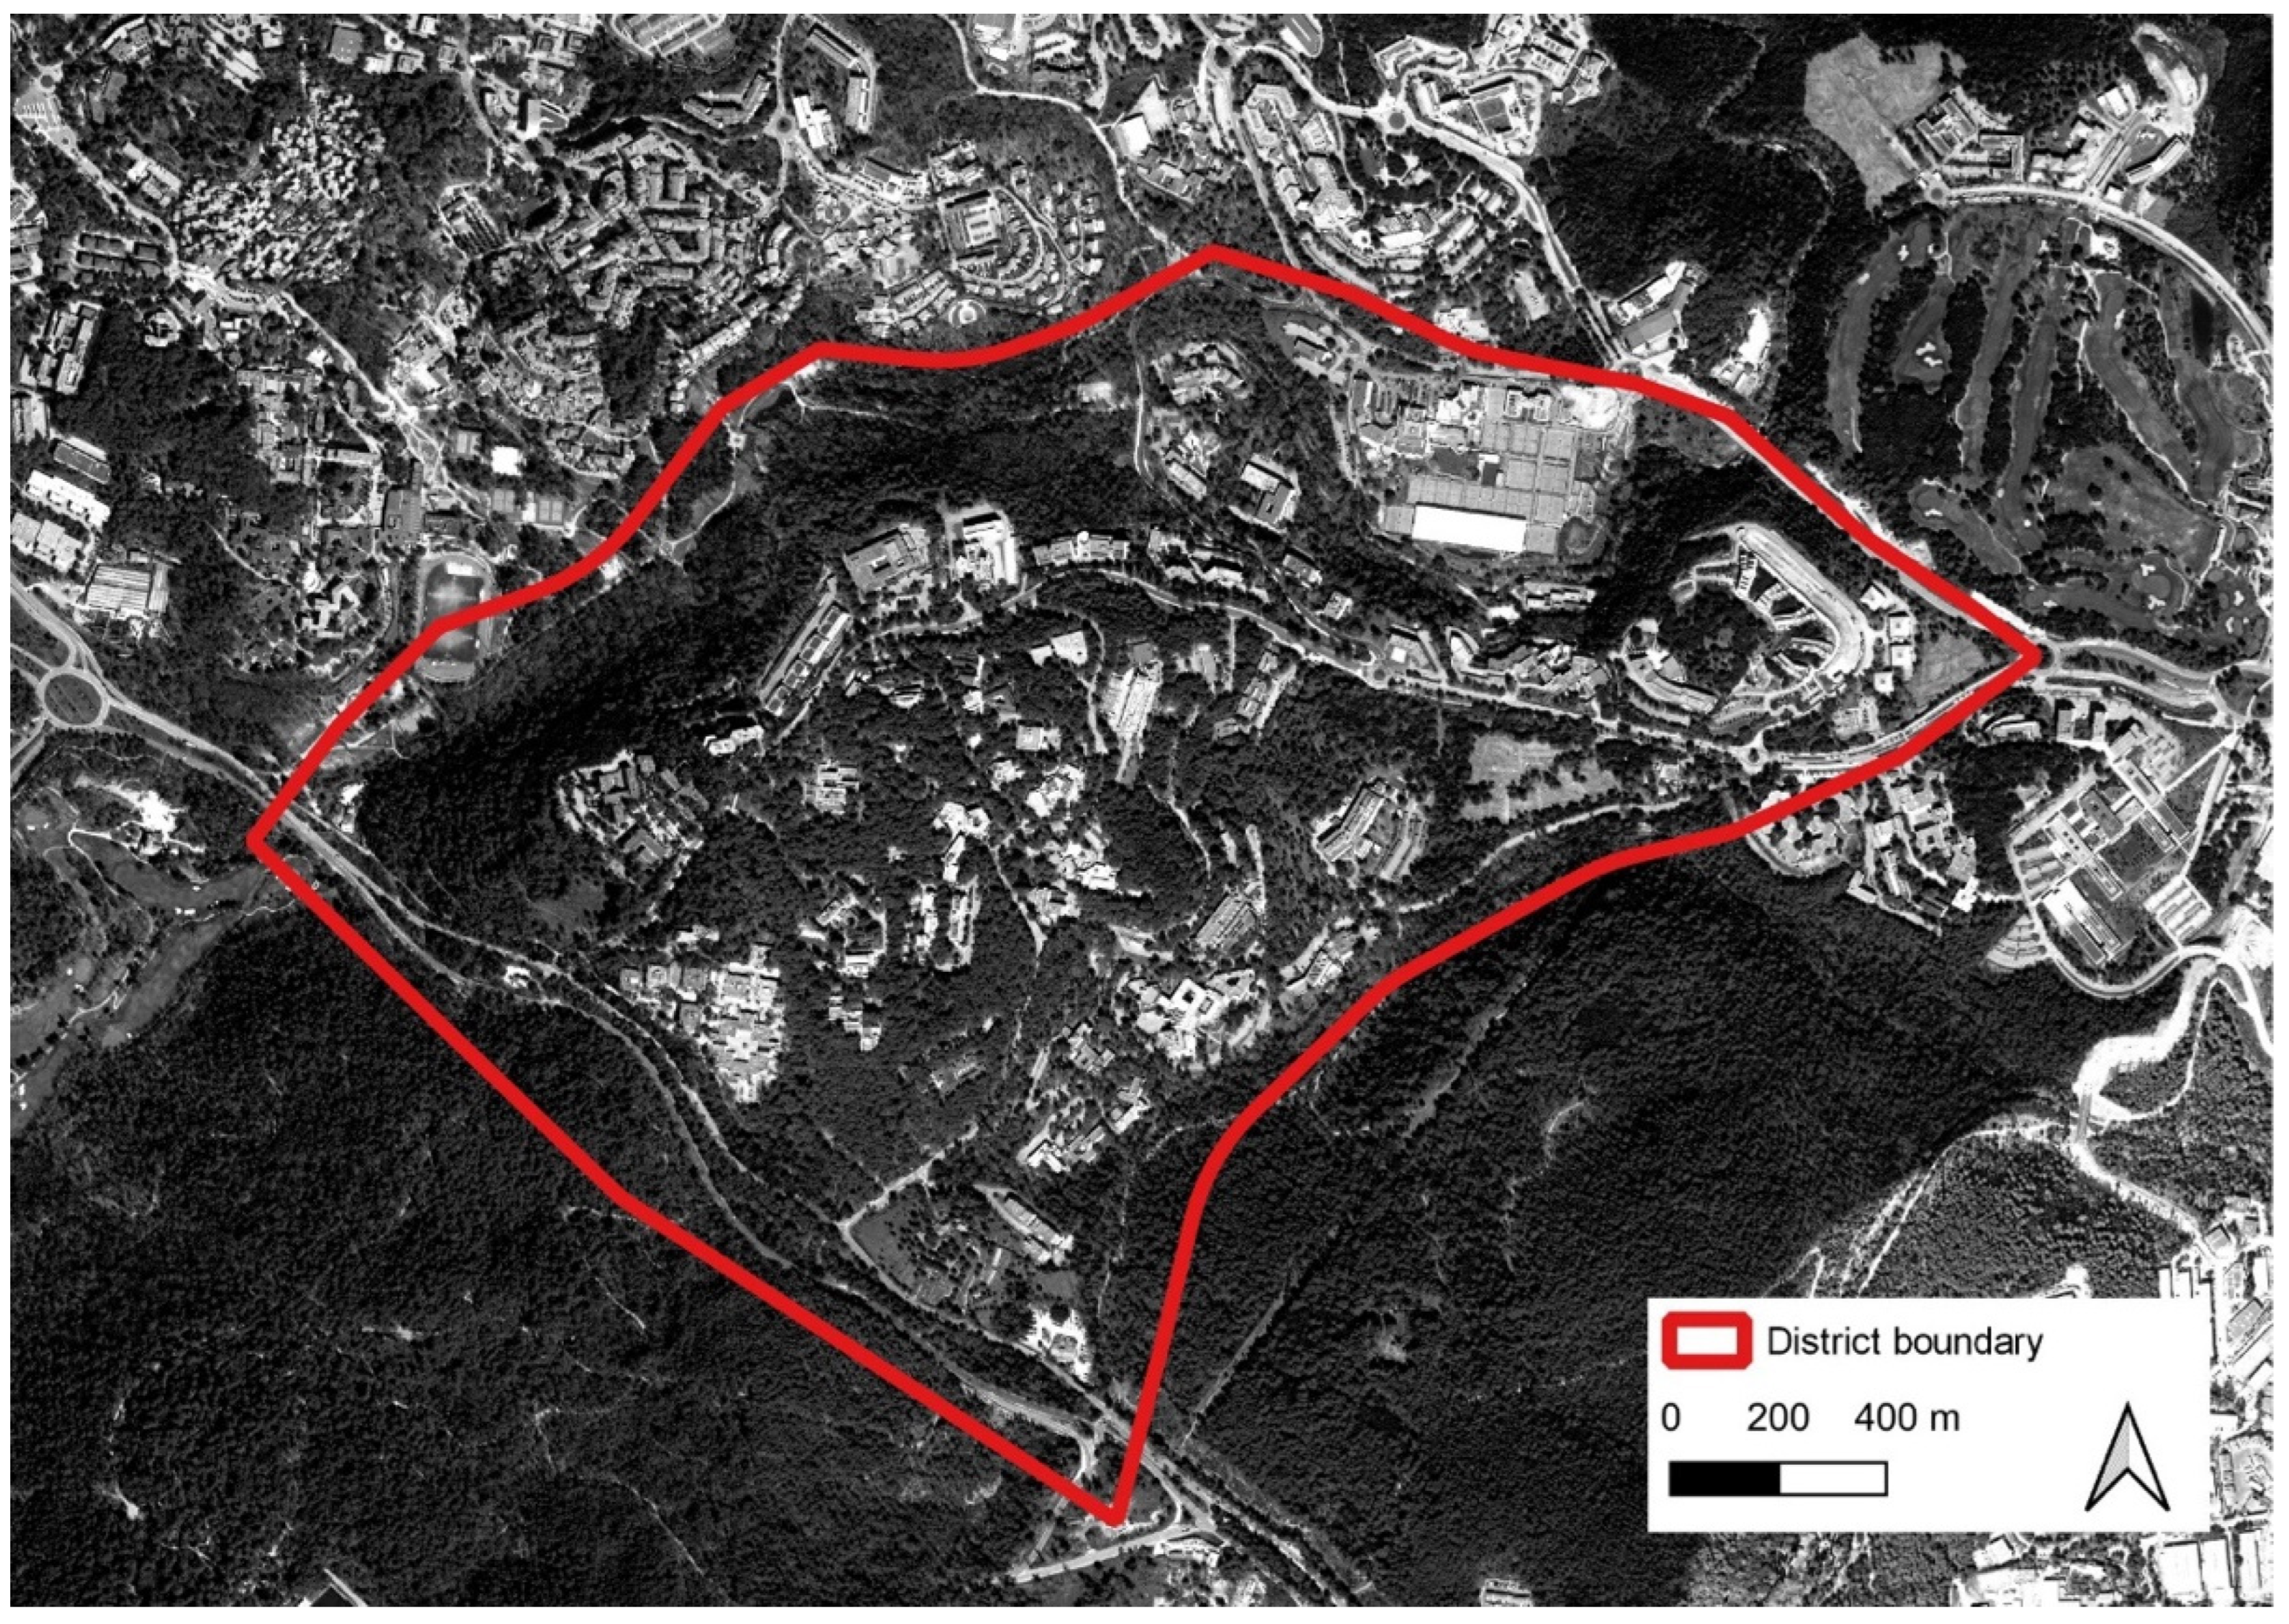
3.1.3. Sophia Antipolis

Sophia Antipolis is a sprawling technopark located in the metropolitan region of Nice, covering 2400 hectares of former Mediterranean forest. Its construction began in the 1970s, but its development is still in progress. Sophia Antipolis hosts a small, mainly residential town centre (i.e., Garbejaire) and the offices of several companies and universities, mainly focusing on information technology. At the time of its conception, Sophia Antipolis was a new model of creative urban life in a natural setting, a sort of innovative Broadacre technopark [42], dissolving the city in the natural landscape. Shared facilities (e.g., golf courses, tennis courts, hiking trails) are supposed to catalyse social interactions in leisure time. However, the absence of a structured system of public spaces, functional zoning, buildings retracted from the footpaths and a car-oriented layout jeopardise this aim. Not surprisingly, Grondeau [43] remarks that, despite its economic success, Sophia Antipolis lacks the intense social interactions and urban vibrancy sought after by its creators. The study presented in this paper focuses on the central part of Sophia Antipolis, which includes most of its original premises, the main arteries of Route des Lucioles, Rue Albert Einstein, and Place (square) Sophie Lafitte (the central core). An aerial view of Sophia Antipolis is presented in Figure 4.

3.2. Datasets

Two official datasets were accessed: BD TOPO,9 which contains geographic data in vector format, including streets, buildings, blocks, and plots, for the entire French territory, and SIRENE,10 which features a geocoded list of French commerce and services currently open for business. Spatial data for Méridia were extracted from the 2018 masterplan [24]. Table 1 presents the surface, number of streets, buildings, plots, blocks, and number of commerce and services in each case study. To avoid edge effects in the computation of the configurational metrics, the street network covering the central part of the French Riviera (29,414 street segments) from Villefranche-sur-Mer to Antibes was considered.

3.3. Statistical Comparison of the Three Districts

Quartiles for each metric and case study were computed and summarised through boxplots (Figure 5) and in tabular version (Table 2), and statistical similarities were assessed through the KS test (Table 3). A polar histogram was produced to visualise street segment orientations (Figure 6). To facilitate reading, the results are illustrated and interpreted by splitting them according to the main categories of metrics (i.e., configuration of the street network and form of the urban fabric). All metrics for the districts under examination are provided in tabular format in the Supplementary Files.

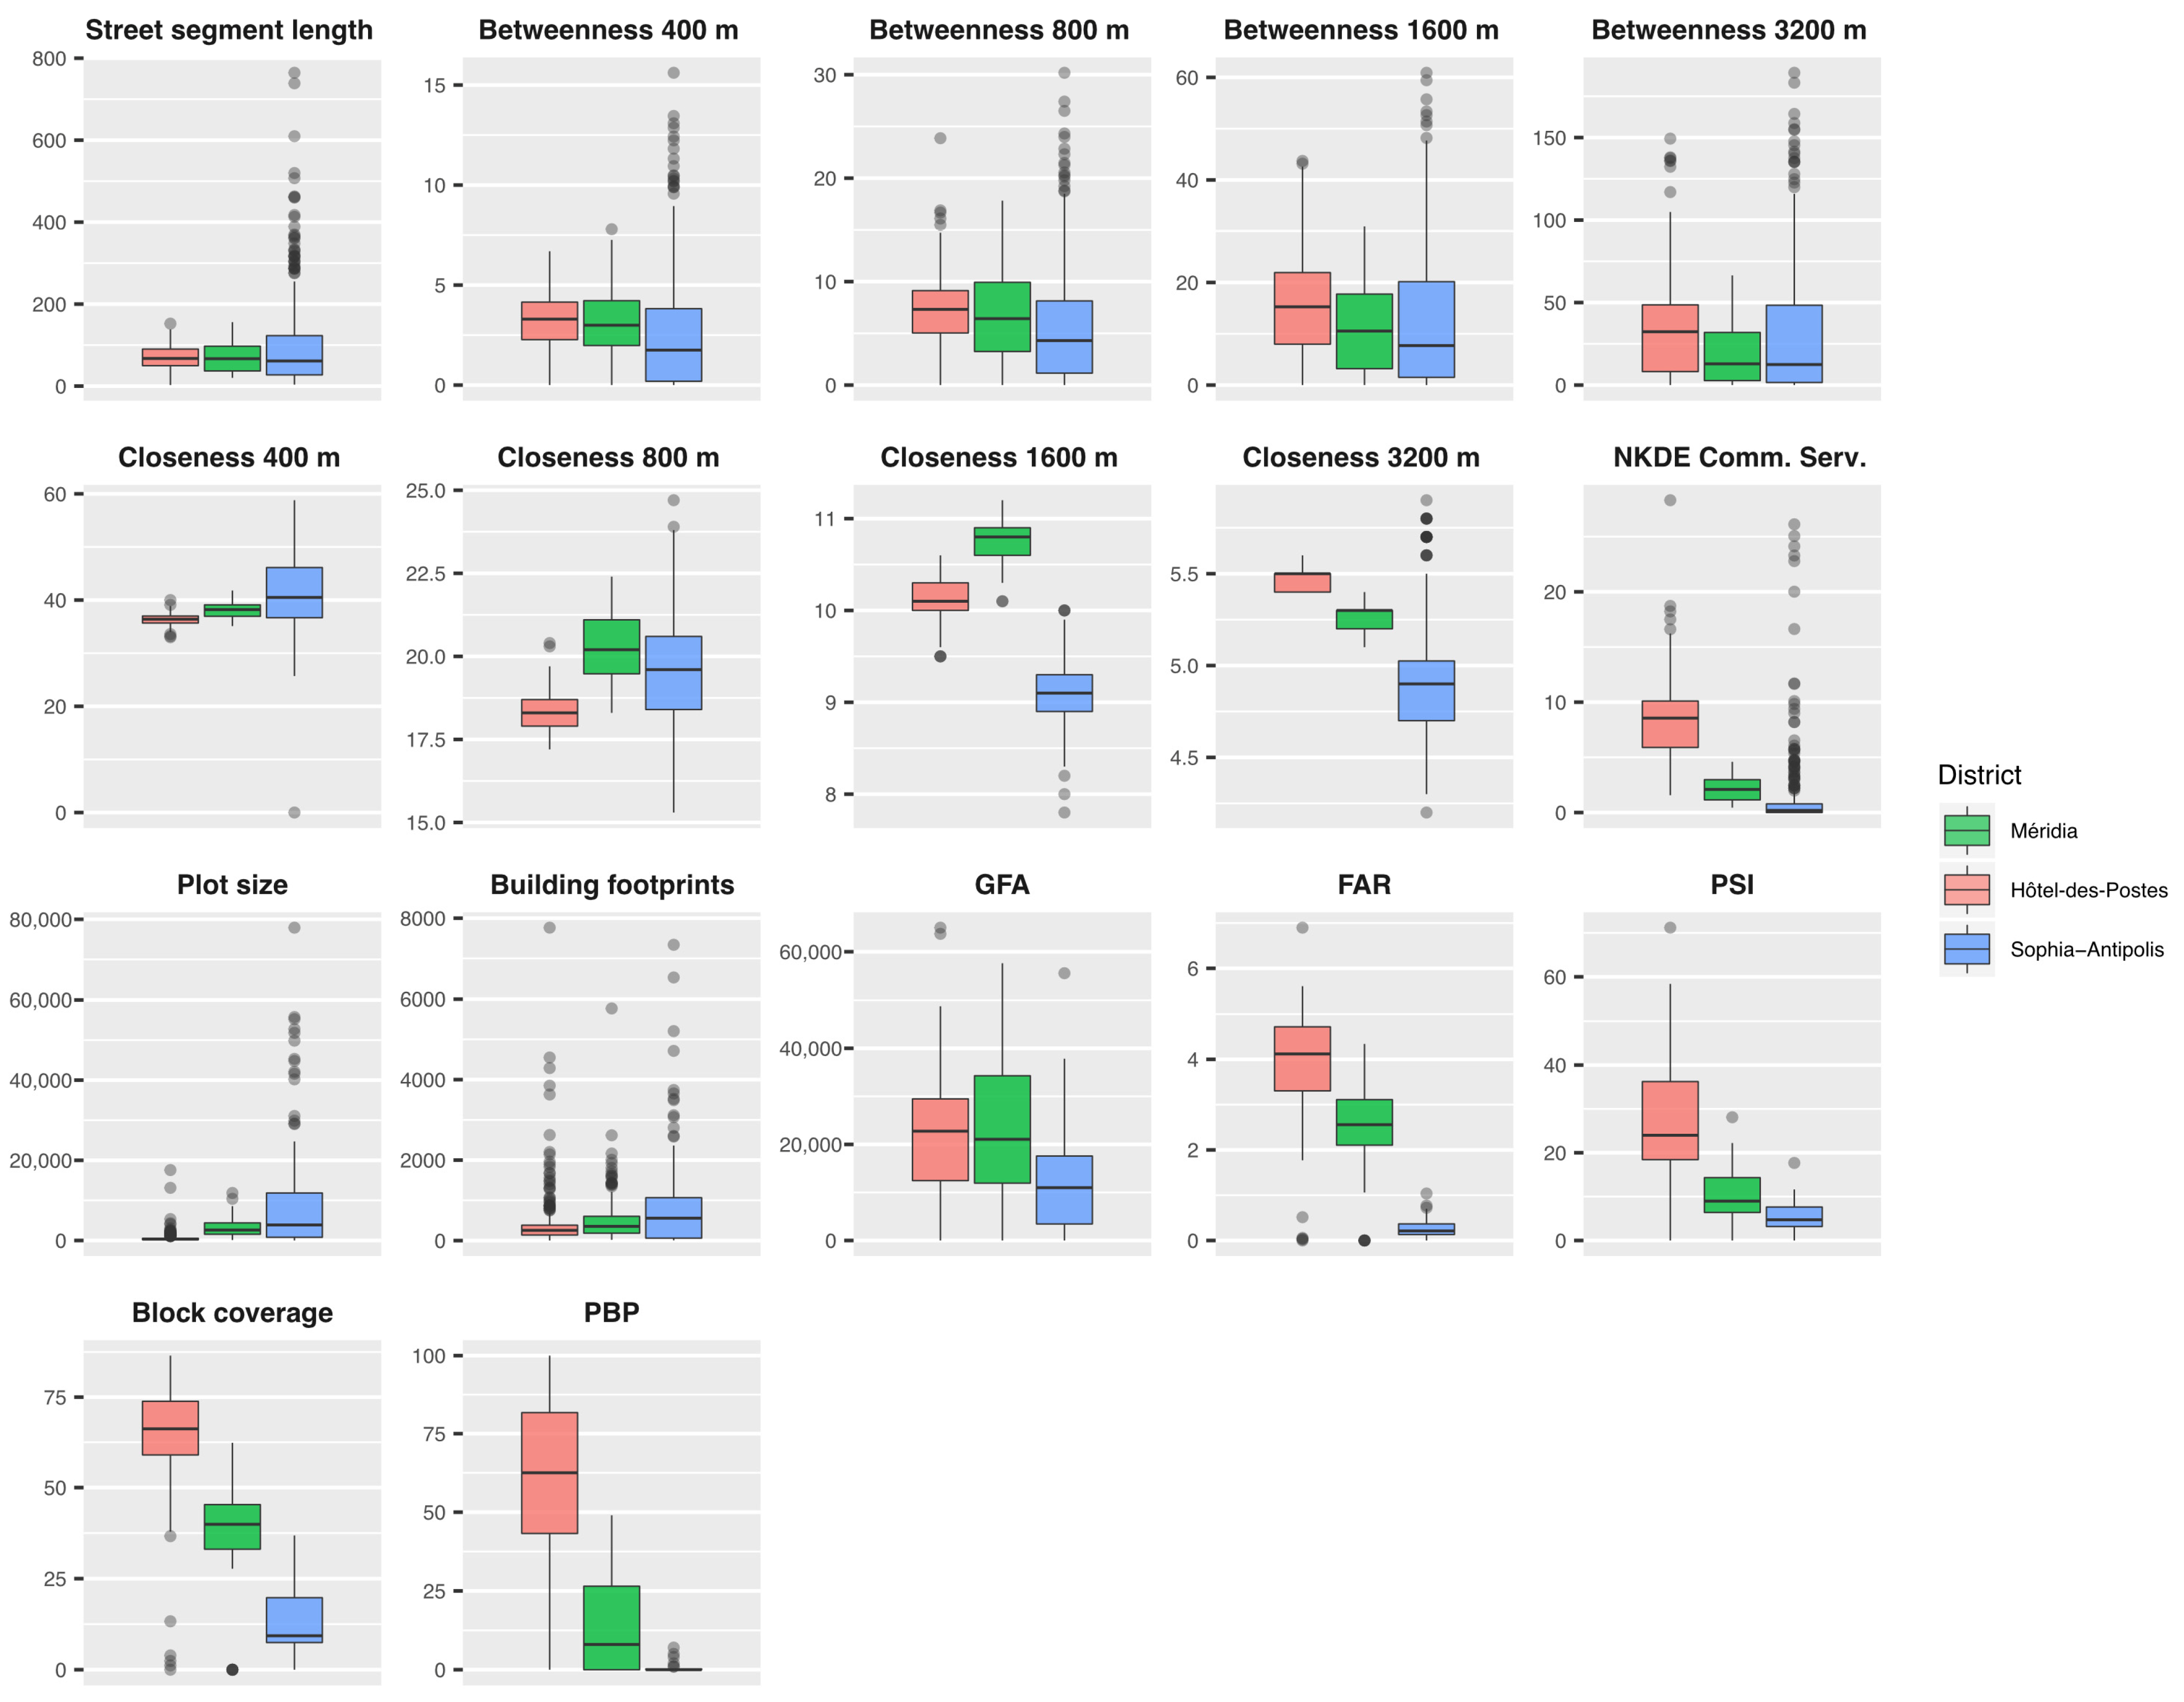
3.3.1. Configuration of the Street Network

Méridia shows both similarities and differences with respect to Hôtel-des-Postes and Sophia Antipolis (Figure 5). In terms of betweenness centrality, at the local-meso scales (i.e., 400, 800, and 1600 m), Méridia is more aligned with Hôtel-des-Postes than Sophia Antipolis as the quartiles in the former two show few differences; for example, medians for betweenness at 400 m equal 3.00 in Méridia and 3.30 in Hôtel-des-Postes. In Sophia Antipolis, the median for the same metric is 1.75, with higher values concentrating on a few axes. Conversely, in Méridia and Hôtel-des-Postes, the values of betweenness centrality are more evenly distributed. Both districts present a system of local backbones (i.e., streets with greater values of local betweenness centrality), which are potential attractors of street activity. Méridia, however, presents the downside of having the highest values of betweenness centrality on its edges, with only moderate values in its central backbone. The KS test (Table 3) confirms these results as the KS statistic for the Méridia–Hôtel-des-Postes is smaller, indicating a shorter statistical distance among distributions than the KS statistic for Méridia–Sophia Antipolis. In Figure 7, we present maps of betweenness centrality at 1600 m for the three case studies under examination. At 3200 m, Méridia is aligned more with the modernist district than the traditional one. The medians in Méridia and Sophia Antipolis equal 12.86 and 12.44, respectively; in Hôtel-des-Postes, the median equals 32.32, meaning that the Smart City district is likely to be less integrated in the overall system of through-movement of the larger urban area. The KS statistic for Méridia–Sophia Antipolis is smaller (0.20) than that for Méridia–Hôtel-des-Postes (0.33). In terms of closeness centrality, statistical distances are considerable across all case studies, with an average KS statistic of 0.67. Méridia stands out more starkly at the district scale (i.e., 1600 m), with quartiles always greater than those in the two other case studies. However, at 3200 m, the levels of closeness centrality are lower than in Hôtel-des-Postes, suggesting that Méridia shows a system of well-connected streets only up to the district scale. This might result in a lively and vibrant core that may not integrate well with the surrounding districts. The maps showing the closeness centrality at 1600 m and 3200 m computed in Méridia are provided in Figure 8.

3.3.2. Form of the Urban Fabric

Street segment lengths in Méridia align more with those of Hôtel-des-Postes than those of Sophia Antipolis, with KS statistics of 0.16 and 0.24, respectively. In fact, while the medians align across districts (i.e., 66.78 in Méridia, 67.33 in Hôtel-des-Postes, and 61.30 in Sophia Antipolis), the third quartiles and maximum values are only similar in the former two case studies. For example, the maximum street segment length in Sophia Antipolis is 764.44 m, but it is 156.03 m in Méridia and 152.39 m in Hôtel-des-Postes. Distances in Méridia thus seem to be those typical of a more walkable urban form. Street segment orientation shows stark differences across the three districts both in the polar histogram (Figure 6) and in terms of KS statistics (Table 3). In Méridia, the street layout is mostly orthogonal and roughly oriented northwest and southeast. Hôtel-des-Postes is characterised by two adaptive orthogonal grids following the bend of the nearby Paillon River. The street layout of Sophia Antipolis follows the natural orography of the hills, which explains the nearly uniform distribution of angles. Street segment orientations in Méridia are more similar to those of Hôtel-des-Postes than those of Sophia Antipolis. However, the visual channels framing relevant landscape and architectural elements (i.e., the hills surrounding Nice, public buildings), a relevant design feature of the 19th-century district supposedly taken as an example, seems to be missing in Méridia. In Hôtel-des-Postes, the deformation of the orthogonal grid produces visual axes towards relevant natural or built-up elements, increasing the scenographic effect and space navigability. Two main visual channels start from Place (square) Arson (the core of Hôtel-des-Postes). One (Figure 9, top box, left) points northwest towards the hill of Cimiez, while the other (Figure 9, top box, right) points southeast towards a linear park and the old city. Given the proximity of Méridia to a ridge on the east and the Prealps in the north, visual channels towards these elements were expected. However, synthetic street views from its central square (Place Méridia) reveal that elements of the urban and natural landscape are hardly distinguishable. The ridge to the east is almost completely hidden by buildings (Figure 9, bottom-right box, top), whereas only a small part of the mountain range in the north can be seen on top of a group of buildings (Figure 9, bottom-right box, bottom). In Sophia Antipolis, street views starting from its central square (Place Sophie Laffitte) (Figure 9, bottom-left box) do not facilitate space navigability as they only point to nearby buildings or trees.
In terms of plot size, Méridia is more similar to Sophia Antipolis than Hôtel-des-Postes, with KS statistics of 0.31 for the former group and 0.81 for the latter. Medians in Méridia (i.e., 2608.70 m2) align more to Sophia Antipolis (i.e., 3870.55 m2, roughly the acre of land proposed in Broadacre) than Hôtel-des-Postes (i.e., 324.59 m2). The relatively large plot sizes measured in Méridia and in Sophia Antipolis are likely due to a top–down planning approach that favoured big investors over smaller developers or private initiatives. Building footprints follow the same logic, as they are related to the size of plots on which they stand. However, the KS test reveals that Méridia is slightly more similar to Hôtel-des-Postes (KS statistic = 0.23) than Sophia Antipolis (KS statistic = 0.26). Building footprints in Hôtel-des-Postes tend to be smaller than those in Méridia, which, in turn, tend to be smaller than those in Sophia Antipolis. Medians equal 254.25 m2, 353.81 m2, and 557.70 m2, respectively. In terms of block coverage, Méridia is more similar to Sophia Antipolis (KS statistic = 0.69) than Hôtel-des-Postes (KS statistic = 0.74), presenting smaller values (i.e., median equals 39.92%) than Hôtel-des-Postes (i.e., median of 66.21%), but greater values compared to Sophia Antipolis (i.e., median of 9.32%). In terms of built-up volume (i.e., GFA), Méridia aligns more with Hôtel-des-Postes (KS statistic = 0.20) than Sophia Antipolis (KS statistic = 0.37). More specifically, the first quartiles (i.e., 12,457, 11,938), medians (i.e., 22,751, 21,062) and third quartiles (i.e., 29,471, 34,294) show very similar values. Instead, Sophia Antipolis tends to show lower GFA values: the first quartile, median, and third quartile are 3439, 10,994, and 17,587, respectively. The FAR values differ quite substantially across the three districts, but the KS test reveals a stronger similarity between Méridia and Hôtel-des-Postes (KS statistic = 0.63) than Méridia and Sophia Antipolis (KS statistic = 0.81). Méridia is again the case study between Hôtel-des-Postes and Sophia Antipolis. The median FAR in the former is 2.56, while medians in the latter are 4.12 and 0.21, respectively. Although Méridia and Hôtel-des-Postes present similar built-up volumes, their FAR values are very different, pointing to the fact that density in the former is concentrated on smaller surfaces than in the latter. In terms of PSI, Méridia resembles more Sophia Antipolis (KS statistic = 0.49) than Hôtel-des-Postes (KS statistic = 0.64). Medians for this metric are as follows: 8.97 in Méridia, 4.72 in Sophia Antipolis, and 23.99 in Hôtel-des-Postes, meaning that in the former two, the built-up volume is less imposing on the public space than in the latter. However, this might not necessarily be a positive feature since having less built-up volume abutting the public space might result in a loss of informal control over it, which, in turn, might bring safety issues [44]. Further considerations can be formulated on squares, the most symbolic elements of the public space. Following the Turin model, Hôtel-des-Postes has five main public squares, one of which (Place Massena) is the main square of Nice, which acts as an interface between the old city and the surrounding districts. The main square is thus located on one of its edges rather than in its core. Méridia and Sophia Antipolis have only one public square each, which is located in their cores in both cases and, in the latter, seems to be poorly connected to the surrounding streets.
In terms of PBP, Méridia is more similar to Sophia Antipolis (KS statistic = 0.54) than Hôtel-des-Postes (KS statistic = 0.70), presenting values closer to the former (i.e., medians equal 8.00% and 0%) than the latter (i.e., median equals 62.50%), meaning that its average configuration is characterised by buildings retracted from the footpaths rather than perimeter blocks. Finally, in terms of commerce and services, the distribution of values in Méridia is again more similar to that of Sophia Antipolis (KS statistic = 0.63) than that of Hôtel-des-Postes (KS statistic = 0.87). Indeed, Méridia offers lower densities compared to Hôtel-des-Postes (i.e., medians equal to 2.10 and 8.56, respectively),11 but greater values compared to Sophia Antipolis (i.e., 0.19). This is somehow surprising as one would expect that, since Méridia and Hôtel-des-Postes have similar built-up volumes, the former could potentially sustain similar densities of commerce and services.
Distributions of plot size in each district were also investigated to assess whether they aligned more to a power law or normal distribution, signals of spontaneous growth or top–down planning, respectively [39,40]. Figure 10 shows the density distributions of plot size for the three districts. The one computed for Méridia is more similar to that measured for Sophia Antipolis (and to a normal distribution) than the function computed for the traditional district (resembling a power law). Indeed, most values in Méridia concentrate around the median (i.e., 2608.70 m2), while the values in Hôtel-des-Postes tend to cluster left of the distribution. The large presence of relatively medium to large blocks in Méridia and Sophia Antipolis hints at an underlying top–down design process, favouring the initiatives of big developers. Hôtel-des-Postes, on the contrary, although having a few exceptionally large plots, is made up of an extremely large number of small plots, allowing a more fine-grained, piecemeal development.
Finally, a scatterplot with block coverage and GFA (Figure 11) was produced to better understand how the built-up volume is distributed across space. Outcomes show that the three districts create almost three separate families of data points. Hôtel-des-Postes (red dots in Figure 11) tends to be characterized by moderate-to-high densities and percentages of block coverage, a combination usually associated with perimeter blocks. At the same time, it benefits from the presence of several public squares in unbuilt or partially built blocks (the red points in the bottom left corner of Figure 11). Méridia (green dots in Figure 11) presents similar GFA values compared to Hôtel-des-Postes; however, block coverage tends to be smaller. While in a few cases, this corresponds to public gardens integrated into the blocks, in most cases, this corresponds to layouts featuring tall buildings retracted from the footpaths. Sophia Antipolis (blue dots in Figure 11) shows the smallest values of GFA and block coverage, suggesting a preponderance of pavilion-like buildings surrounded by pervasive greenery.

4. Discussion

The outcomes of the morphological comparison show that Méridia is undoubtedly more urban than Sophia Antipolis, showing higher densities, a gridiron plan, a functional mix, and a more pedestrian-friendly environment. However, several important features are different from the 19th-century case study. Hôtel-des-Postes has less public space overall but a larger number of squares and gardens located in different parts of the district and at the interface with neighbouring districts. Conversely, Méridia resembles Perry’s Neighbourhood Unit concept [45], offering more but less varied public spaces mostly located in its core, creating a small interface with the neighbouring districts. Like Sophia Antipolis, Méridia is largely made up of single bulky buildings, with large setbacks that separate them from the public footpaths.
Furthermore, although plots are smaller and buildings are generally taller than in the technopark, both districts lack the many small and medium-sized plots and buildings typical of piecemeal urbanism. In this respect, Nice’s 19th-century plan only imposed a system of streets and public spaces [41], letting self-organization occur at the plot scale. Méridia, like Sophia Antipolis, is instead the result of top–down planning processes that produced a fairly rigid urban structure. In terms of the configuration of the street network, it can be considered a hybrid between the 19th-century district and the sprawling technopark. The gridiron layout is preferred to tree-like street layouts, but betweenness centrality is more concentrated than in the traditional city. While this might grant an active core, it might render connections with the surrounding districts very difficult.
In terms of urban form, Méridia and the Smart City examples mentioned in the Introduction present a high degree of heterogeneity (compact, spread out as “towers in the park”, in-between the two), which is arguably due to the absence of a reference model in the current definition of Smart City. As anticipated in the Introduction, this is of concern as not all forms are associated with positive societal outcomes, as evidenced by several studies [18,20]. Further commonalities seem to be loose adherence to local character and top–down control in the production of the physical space.
We argue that the proposed methodology can shed more light on a fundamental and unsolved question concerning smart cities: what their design models of reference are. While the outcomes of this paper provide some first insights on a specific case study, the replication of the methodology grants a more thorough understanding of the forms of smart cities worldwide and position them in the urban design theory, a field that is strongly related to the subject, since it focuses on the construction of the physical space, but that hardly enters the public discourse on smart cities and the literature published so far. The proposed methodology can also prove useful to often fact-check unsubstantiated claims of vernacularity or adherence to compact city models before the construction phase and, ultimately, inform design decisions on the forms of new Smart City districts or the physical upgrading of existing districts that show observed deficits from a societal standpoint.

5. Limitations and Future Work

The morphometric comparison presented in this work illustrates one of the first attempts to investigate the form of a Smart City district in a systematic manner and position it with respect to known design models. While findings hold locally, they are not generalisable. However, the replicability of the methodology grants the possibility of future work in this direction to understand similarities and differences between other Smart City districts and local paradigmatic design models.
PSI, while providing novel insights on the impacts of built-up density on the public space, may be harder to replicate as it requires the private spaces in each block. Nonetheless, simplified versions of PSI can be calculated, for example, by considering internal spaces of buildings (e.g., courtyards) as private areas and the remaining spaces in the block as public.
Although the case studies under examination have been measured through a large set of metrics, reaching a compromise between an unachievable, very fine-grained measurement and a too-coarse-grained measurement—these descriptions are not exhaustive. Future work may focus on integrating further metrics at a finer level of spatial granularity, such as the presence of representative public spaces and interfaces between the private and public realms, granted that spatial data at this level of granularity is available. Further qualitative assessments focusing on perceived morphology and spatial distribution of urban elements (e.g., buildings’ shapes, plot occupancy, location of public spaces), ambience, aesthetics, and perceived comfort can also be integrated to enrich the descriptions of the case studies under examination. However, these assessments go beyond the scope of this work and ought to be addressed in future work.

6. Conclusions

Urban design history is characterised by the continuous emergence of new design models aimed at the physical concretization of ideological positions and societal aspirations. Comparing examples of design models brings new evidence on what direction urban development is taking, especially when new design models are only loosely defined, as in the case of the Smart City. Objective morphometric assessment of the physical forms produced by different design models can inform the design process and help to demystify communication strategies, overstating specific design aspects (e.g., compacity, adherence to local character), put forward as a guarantee of urban sustainability.
In this work, a morphometric approach, relying on 18 metrics and statistical comparison, was proposed and applied to three districts in the French Riviera, i.e., Méridia, Sophia Antipolis, and Hôtel-des-Postes. At the time, each example represented a desired new form of urban expansion: the Smart City of the 21st century, the technopark of the 1970s and 1980s, supposedly reconciling humans and nature, and the 19th-century perimeter-block neighbourhood. Findings show that Méridia rejects the layout of the dispersed technopark and proposes a more compact urban form (i.e., medium to high densities, mixed-use, pedestrian environment), achieving a fragile compromise between adherence to more traditional and modernist features. However, its top–down design and production processes are clearly at odds with the higher level of self-organisation granted by traditional approaches to city design. The methodology presented in this paper is replicable, and thus, further comparative analyses of this kind can be carried out to better evaluate the forms of Smart City districts with respect to local representative design models, advance the morphological understanding of the Smart City model, and eventually inform planning decisions on future and existing smart cities.

Supplementary Materials

The following supporting information can be downloaded at: https://www.mdpi.com/article/10.3390/land12122159/s1.

Author Contributions

Conceptualization, A.V. and G.F.; Methodology, A.V., G.F. and M.C.; Software, A.V. and M.C.; Validation, A.V.; Formal analysis, A.V. and G.F.; Investigation, A.V. and G.F.; Resources, A.V. and M.C.; Data curation, A.V. and M.C.; Writing—original draft, A.V. and G.F.; Writing—review & editing, A.V., G.F. and M.C.; Visualization, A.V.; Supervision, A.V. and G.F.; Project administration, G.F.; Funding acquisition, G.F. All authors have read and agreed to the published version of the manuscript.

Funding

This work is part of the Trans-Metro-Med research project and has been funded by the French government, through the UCA JEDI Investments in the Future program managed by the National Research Agency (ANR), grant number ANR-15-IDEX-0. The APC was funded by Université Côte d’Azur, UMR ESPACE.

Data Availability Statement

Data is contained within the Supplementary Files.

Conflicts of Interest

The authors declare no conflict of interest.

Notes

1
https://osdatahub.os.uk/downloads/open (accessed on 30 October 2023).
2
3
https://www.openstreetmap.org (accessed on 30 October 2023).
4
http://docs.momepy.org/en/stable/# (accessed on 30 October 2023).
5
https://osmnx.readthedocs.io/en/stable/ (accessed on 30 October 2023).
6
http://sanet.csis.u-tokyo.ac.jp/ (accessed on 30 October 2023).
7
https://scipy.org/ (accessed on 30 October 2023).
8
https://seaborn.pydata.org/index.html (accessed on 30 October 2023).
9
https://www.professionnels.ign.fr/bdtopo (accessed on 30 October 2023).
10
https://www.sirene.fr/sirene/public/accueil (accessed on 30 October 2023).
11
In the case of Méridia, these are projected values since the commerce and services used in the computation reflect the masterplan and not the progress of the construction site.

References

  1. Cerdá, I. Teoría General de La Urbanización, y Aplicación de Sus Principios y Doctrinas a La Reforma y Ensanche de Barcelona; Imprenta Española: Madrid, Spain, 1867; Volume 1. [Google Scholar]
  2. Howard, E. To-Morrow: A Peaceful Path to Real Reform; William Swan Sonnenschein: London, UK, 1898. [Google Scholar]
  3. Corbusier, L. Urbanisme; L’Esprit Nouveau: Paris, France, 1924. [Google Scholar]
  4. Wright, F.L. The Disappearing City; W.F. Payson: New York, NY, USA, 1932. [Google Scholar]
  5. Newman, P.; Kenworthy, J. Sustainability and Cities: Overcoming Automobile Dependence; Island Press: Washington, DC, USA, 1998. [Google Scholar]
  6. Castree, N. The Anthropocene: A Primer for Geographers. Geography 2015, 100, 66–75. [Google Scholar] [CrossRef]
  7. Grant, J. Planning the Good Community: New Urbanism in Theory and Practice; Routledge: Abingdon-on-Thames, UK, 2005. [Google Scholar]
  8. Caragliu, A.; Del Bo, C.; Nijkamp, P. Smart Cities in Europe. In Creating Smarter Cities; Deakin, M., Ed.; Routledge: London, UK, 2013. [Google Scholar]
  9. Ramaprasad, A.; Sánchez-Ortiz, A.; Syn, T. A Unified Definition of a Smart City. In Electronic Government, Proceedings of the 16th IFIP WG 8.5 International Conference, EGOV 2017, St. Petersburg, Russia, 4–7 September 2017; Springer: Berlin/Heidelberg, Germany, 2017; pp. 13–24. [Google Scholar]
  10. Allwinkle, S.; Cruickshank, P. Creating Smart-Er Cities: An Overview. In Creating Smarter Cities; Deakin, M., Ed.; Routledge: London, UK, 2013. [Google Scholar]
  11. McLaren, D.; Agyeman, J. Sharing Cities: A Case for Truly Smart and Sustainable Cities; MIT Press: Cambridge, MA, USA, 2015. [Google Scholar]
  12. Mora, L.; Deakin, M. Untangling Smart Cities: From Utopian Dreams to Innovation Systems for a Technology-Enabled Urban Sustainability; Elsevier: London, UK, 2019. [Google Scholar]
  13. Min, K.; Yoon, M.; Furuya, K. A Comparison of a Smart City’s Trends in Urban Planning before and after 2016 through Keyword Network Analysis. Sustainability 2019, 11, 3155. [Google Scholar] [CrossRef]
  14. Lee, J. Smart City in Urban Design. Int. J. Sustain. Build. Technol. Urban Dev. 2021, 12, 380–393. [Google Scholar]
  15. Cugurullo, F. How to Build a Sandcastle: An Analysis of the Genesis and Development of Masdar City. J. Urban Technol. 2013, 20, 23–37. [Google Scholar] [CrossRef]
  16. Kherdeen, R. Masdar City: Oriental City of the Twenty-First Century. Master’s Thesis, New York University, New York, NY, USA, 2016. [Google Scholar]
  17. Yoo, S. Songdo: The Hype and Decline of World’s First Smart City. In Sustainable Cities in Asia; Caprotti, F., Yu, L., Eds.; Routledge: London, UK, 2017; pp. 146–160. [Google Scholar]
  18. Venerandi, A.; Quattrone, G.; Capra, L. A Scalable Method to Quantify the Relationship between Urban Form and Socio-Economic Indexes. EPJ Data Sci. 2018, 7, 4. [Google Scholar] [CrossRef]
  19. Venerandi, A.; Quattrone, G.; Capra, L. City Form and Well-Being. In Proceedings of the 24th ACM SIGSPATIAL International Conference on Advances in Geographic Information Systems, ACM, New York, NY, USA, 31 October 2016; pp. 1–4. [Google Scholar]
  20. Mouratidis, K. Built Environment and Social Well-Being: How Does Urban Form Affect Social Life and Personal Relationships? Cities 2018, 74, 7–20. [Google Scholar] [CrossRef]
  21. Marcus, L.; Koch, D. Cities as Implements or Facilities—The Need for a Spatial Morphology in Smart City Systems. Environ. Plan B Urban Anal. City Sci. 2017, 44, 204–226. [Google Scholar] [CrossRef]
  22. Hillier, B. Space Is the Machine: A Configurational Theory of Architecture; Space Syntax: London, UK, 2007. [Google Scholar]
  23. Al Sayed, K.; Bew, M.; Penn, A.; Palmer, D.; Broyd, T. Modelling Dependency Networks to Inform Data Structures in BIM and Smart Cities. In Proceedings of the 10th Space Syntax Symposium (SSS10), London, UK, 13–17 July 2015; Karimi, K., Vaughan, L., Sailer, K., Palaiologou, G., Bolton, T., Eds.; Space Syntax Laboratory, The Bartlett School of Architecture, University College London: London, UK, 2015. [Google Scholar]
  24. EPA Plaine du Var. Nice Méridia. Une Technopole Urbaine Pour Une Ville Intense; EPA: Nice, France, 2013.
  25. Panerai, P.; Castex, J.; Depaule, J.C.; Samuels, I. Urban Forms: The Death and Life of the Urban Block; Routledge: Abingdon-on-Thames, UK, 2004. [Google Scholar]
  26. Wdowiarz-Bilska, M. Technopolis—Beyond Technology Park. IOP Conf. Ser. Mater. Sci. Eng. 2019, 471, 112028. [Google Scholar] [CrossRef]
  27. Moudon, A.V. Urban Morphology as an Emerging Interdisciplinary Field. Urban Morphol. 1997, 1, 3–10. [Google Scholar] [CrossRef]
  28. Fleischmann, M.; Feliciotti, A.; Romice, O.; Porta, S. Morphological Tessellation as a Way of Partitioning Space: Improving Consistency in Urban Morphology at the Plot Scale. Comput. Environ. Urban Syst. 2020, 80, 101441. [Google Scholar] [CrossRef]
  29. Milojevic-Dupont, N.; Hans, N.; Kaack, L.H.; Zumwald, M.; Andrieux, F.; de Barros Soares, D.; Lohrey, S.; Pichler, P.-P.; Creutzig, F. Learning from Urban Form to Predict Building Heights. PLoS ONE 2020, 15, e0242010. [Google Scholar] [CrossRef] [PubMed]
  30. Porta, S.; Latora, V.; Wang, F.; Rueda, S.; Strano, E.; Scellato, S.; Cardillo, A.; Belli, E.; Càrdenas, F.; Cormenzana, B.; et al. Street Centrality and the Location of Economic Activities in Barcelona. Urban Stud. 2012, 49, 1471–1488. [Google Scholar] [CrossRef]
  31. Araldi, A.; Fusco, G. From the street to the metropolitan region: Pedestrian perspective in urban fabric analysis. Environ. Plann. B Urb. Anal. City Sc. 2019, 46, 1243–1263. [Google Scholar] [CrossRef]
  32. Oliveira, V.; Medeiros, V. Morpho: Combining Morphological Measures. Environ. Plann. B Plann. Des. 2016, 43, 805–825. [Google Scholar] [CrossRef]
  33. Mehaffy, M.; Porta, S.; Rofè, Y.; Salingaros, N. Urban Nuclei and the Geometry of Streets: The ‘Emergent Neighborhoods’ Model. Urban Des. Int. 2010, 15, 22–46. [Google Scholar] [CrossRef]
  34. Berghauser Pont, M.Y.; Haupt, P.A. Space, Density and Urban Form. Ph.D. Thesis, TU Delft, Delft, The Netherlands, 2009. [Google Scholar]
  35. Gehl, J. Life between Buildings: Using Public Space; Island Press: Washington, DC, USA, 1987. [Google Scholar]
  36. Okabe, A.; Sugihara, K. Spatial Analysis along Networks; Wiley: Hoboken, NJ, USA, 2012; ISBN 9780470770818. [Google Scholar]
  37. Han, Z.; Cui, C.; Miao, C.; Wang, H.; Chen, X. Identifying Spatial Patterns of Retail Stores in Road Network Structure. Sustainability 2019, 11, 4539. [Google Scholar] [CrossRef]
  38. Conover, W.J. Practical Nonparametric Statistics; Wiley: Hoboken, NJ, USA, 1999. [Google Scholar]
  39. Salingaros, N.A.; van Bilsen, A. Principles of Urban Structure; Technepress: Amsterdam, The Netherlands, 2005. [Google Scholar]
  40. Jiang, B. Living Structure Down to Earth and Up to Heaven: Christopher Alexander. Urban Sci. 2019, 3, 96. [Google Scholar] [CrossRef]
  41. Graff, P. L’exception Urbaine: Nice, de La Renaissance Au Consiglio d’Ornato; Éditions Parenthèses: Marseille, France, 2000. [Google Scholar]
  42. Araszkiewiez, J. L’héritage d’une Utopie: Essai Sur La Communication et l’organisation de Sophia Antipolis; Édisud: Aix En Provence, France, 2003. [Google Scholar]
  43. Grondeau, A. La Compétitivité Des Territoires de l’innovation Confrontés Aux Crises et à La Démondialisation: Le Cas de Sophia-Antipolis. Ann. Georgr. 2018, 723–724, 463–491. [Google Scholar] [CrossRef]
  44. Jacobs, J. The Life and Death of Great American Cities; Random House: New York, NY, USA, 1961. [Google Scholar]
  45. Perry, C. The Neighborhood Unit; Routledge Press: London, UK, 1929. [Google Scholar]
Figure 1. Satellite pictures of Masdar City (left), Songdo (centre) and Kalasatama (right). Source: Google, Maxar Technologies.
Land 12 02159 g001
Figure 2. Plan of Méridia. Source of base map: [24], Google, CNES/Airbus, Maxar Technologies.
Land 12 02159 g002
Figure 3. Satellite picture of Hôtel-des-Postes. Source of base map: Google, CNES/Airbus, Maxar Technologies.
Land 12 02159 g003
Figure 4. Satellite picture of Sophia Antipolis. Source of base map: Google, CNES/Airbus, Maxar Technologies.
Land 12 02159 g004
Figure 5. Boxplots of the metrics of urban form (except street segment orientation) in the three districts under examination.
Land 12 02159 g005
Figure 6. Polar histogram of street segment orientation in the three districts under examination.
Land 12 02159 g006
Figure 7. Betweenness centrality at 1600 m in the three case studies under examination.
Land 12 02159 g007
Figure 8. Closeness centrality at 1600 m and 3200 m in Méridia.
Land 12 02159 g008
Figure 9. Street views towards relevant landscape/built-up elements from the main squares of the districts under examination. Source of street views: Google Street View.
Land 12 02159 g009
Figure 10. Density distribution of plot size in the three districts under examination.
Land 12 02159 g010
Figure 11. Scatter plot of block coverageGFA for the three districts under examination.
Land 12 02159 g011
Table 1. Total surface, number of streets, buildings, plots, blocks, and commerce and services in the districts under examination.
Case StudySurface (ha)Number of Streets SegmentsNumber of BlocksNumber of BuildingsNumber of PlotsNumber of Commerce and Services
Méridia2484261905771
Hôtel-des-Postes3611250504439406
Sophia Antipolis20039224167146171
Table 2. Quartiles of the metrics of urban form (except street segment orientation) in the three districts under examination.
MetricNeighbourhoodMinQ1MedianQ3Max
Betweenness 400 mMéridia01.983.004.227.79
Hôtel-des-Postes02.273.304.156.70
Sophia Antipolis00.191.753.8215.61
Betweenness 800 mMéridia03.256.429.9417.82
Hôtel-des-Postes05.047.329.1323.86
Sophia Antipolis01.154.308.1330.19
Betweenness 1600 mMéridia03.2010.5317.7430.94
Hôtel-des-Postes07.9815.2621.9443.71
Sophia Antipolis01.517.7120.1660.90
Betweenness 3200 mMéridia02.7112.8631.8966.46
Hôtel-des-Postes08.1932.3248.61149.36
Sophia Antipolis01.5812.4448.38189.27
Closeness 400 mMéridia35.1036.9538.2039.1041.80
Hôtel-des-Postes33.0035.6736.4037.0040.00
Sophia Antipolis036.6740.5046.1258.80
Closeness 800 mMéridia18.3019.4820.2021.1022.40
Hôtel-des-Postes17.2017.9018.3018.7020.40
Sophia Antipolis15.3018.4019.6020.6024.70
Closeness 1600 mMéridia10.1010.6010.8010.9011.20
Hôtel-des-Postes9.5010.0010.0010.3010.60
Sophia Antipolis7.808.909.109.3010.00
Closeness 3200 mMéridia5.105.205.305.305.40
Hôtel-des-Postes5.405.405.505.505.60
Sophia Antipolis4.204.704.905.035.90
Street segment length (m)Méridia20.0836.8866.7897.42156.03
Hôtel-des-Postes2.4649.8267.3390.28152.39
Sophia Antipolis3.5227.3161.30123.06764.44
Plot size (m2)Méridia109.701555.52608.704375.5011,858.20
Hôtel-des-Postes0.14197.69324.59531.3917,569.81
Sophia Antipolis3.01805.703870.5511,848.877,919.09
Building footprints (m2)Méridia17.64184.34353.81602.415768.77
Hôtel-des-Postes2.84139.28254.25382.467764.45
Sophia Antipolis6.5761.70557.701066.207338.80
Block coverage (%)Méridia033.0839.9245.3262.35
Hôtel-des-Postes058.9966.2173.8586.50
Sophia Antipolis07.459.3219.7736.85
GFA (m2)Méridia011,938.0021,062.0034,294.0057,609.00
Hôtel-des-Postes012,457.0022,751.0029,471.0065,015.00
Sophia Antipolis03439.0010,994.0017,587.0055,532.00
FAR (m2/m2)Méridia02.112.563.114.34
Hôtel-des-Postes03.304.124.726.90
Sophia Antipolis00.130.210.371.04
PSI (m2/m2)Méridia06.398.9714.3228.10
Hôtel-des-Postes018.4323.9936.2371.21
Sophia Antipolis03.184.727.6317.68
PBP (%)Méridia008.0026.5049.00
Hôtel-des-Postes043.2562.5081.75100.00
Sophia Antipolis0000.257.00
NKDE comm. ser.Méridia0.441.152.102.974.60
Hôtel-des-Postes1.575.908.5610.1028.30
Sophia Antipolis000.190.7826.12
Table 3. KS test assessing similarities of distribution functions in the three districts under examination.
MetricsMéridia—Sophia AntipolisMéridia—Hôtel-des-Postes
KS Statisticp-ValueKS Statisticp-Value
Betweenness 400 m0.330.0000.120.506
Betweenness 800 m0.200.0070.210.024
Betweenness 1600 m0.160.0480.240.006
Betweenness 3200 m0.200.0070.330.000
Closeness 400 m0.440.0000.490.000
Closeness 800 m0.290.0000.780.000
Closeness 1600 m1.000.0000.790.000
Closeness 3200 m0.750.0000.790.000
Street segment length0.240.0010.160.168
Street segment orientation0.720.0000.500.000
Plot size0.310.0010.810.000
Building footprints0.260.0000.230.000
Block coverage0.690.0000.740.000
GFA0.370.0480.200.419
FAR0.810.0000.630.000
PSI0.490.0030.640.000
PBP0.540.0010.700.000
NKDE comm. serv.0.630.0000.870.000
Disclaimer/Publisher’s Note: The statements, opinions and data contained in all publications are solely those of the individual author(s) and contributor(s) and not of MDPI and/or the editor(s). MDPI and/or the editor(s) disclaim responsibility for any injury to people or property resulting from any ideas, methods, instructions or products referred to in the content.

